structural and defensive roles of angiosperm leaf venation ... · dominant angiosperm tree species...
TRANSCRIPT
Journal of Ecology. 2018;1–17. wileyonlinelibrary.com/journal/jec | 1© 2018 The Authors. Journal of Ecology © 2018 British Ecological Society
Received:20March2017 | Accepted:30January2018DOI:10.1111/1365-2745.12945
R E S E A R C H A R T I C L E
Structural and defensive roles of angiosperm leaf venation network reticulation across an Andes–Amazon elevation gradient
Benjamin Blonder1,2 | Norma Salinas1,3 | Lisa Patrick Bentley1,4 | Alexander Shenkin1 | Percy Orlando Chambi Porroa5 | Yolvi Valdez Tejeira5 | Tatiana Erika Boza Espinoza6 | Gregory R. Goldsmith7 | Lucas Enrico8 | Roberta Martin9 | Gregory P. Asner9 | Sandra Díaz1,8 | Brian J. Enquist10 | Yadvinder Malhi1
1EnvironmentalChangeInstitute,SchoolofGeographyandtheEnvironment,UniversityofOxford,Oxford,UK;2SchoolofLifeSciences,ArizonaStateUniversity,Tempe,AZ,USA;3SecciónQuímica,PontificiaUniversidadCatólicadelPerú,SanMiguel,Lima,Perú;4DepartmentofBiology,SonomaStateUniversity,RohnertPark,CA,USA;5UniversidadNacionaldeSanAntonioAbaddelCusco,Cusco,Perú;6DepartmentofSystematicandEvolutionaryBotany,UniversityofZurich,Zürich,Switzerland;7SchmidCollegeofScienceandTechnology,ChapmanUniversity,Orange,CA,USA;8InstitutoMultidisciplinariodeBiologíaVegetal(IMBIV,CONICET-UNC),andFCEFyN,UniversidadNacionaldeCórdoba,Córdoba,Argentina;9DepartmentofGlobalEcology,CarnegieInstitutionforScience,Stanford,CA,USAand10DepartmentofEcologyandEvolutionaryBiology,UniversityofArizona,Tucson,AZ,USA
CorrespondenceBenjaminBlonderEmail:[email protected]
Funding informationJacksonFoundation;LeverhulmeTrust;NationalScienceFoundation;JohnD.andCatherineT.MacArthurFoundation;NaturalEnvironmentResearchCouncil;EuropeanResearchCouncil
HandlingEditor:AmyAustin
Abstract1. Thenetworkofminorveinsofangiospermleavesmayincludeloops(reticulation).Variation innetworkarchitecturehasbeenhypothesizedtohavehydraulicandalsostructuralanddefensivefunctions.
2. Wemeasuredvenationnetworktraitspaceineightdimensionsfor136biomass-dominantangiospermtreespeciesalonga3,300melevationgradientinsouth-easternPeru.Wethenexaminedtherelative importanceofmultipleecologicalandevolutionarypredictorsofreticulation.
3. Variationinminorvenationnetworkreticulationwasconstrainedtothreeaxes.These axesdescribed reconnecting vs. branching veins, elongated vs. compactareolescompactvs.elongatedandlowvs.high-densityveins.Variationinthefirsttwoaxeswaspredictedbytraitsrelatedtomechanicalstrengthandsecondarycompounds,andinthethirdaxisbysitetemperature.
4. Synthesis.Defensiveandstructuralfactorsprimarilyexplainvariationinmultipleaxesofreticulation,withasmallerroleforclimate-linkedfactors.Theseresultssuggestthatvenationnetworkreticulationmaybedeterminedmorebyspeciesinteractionsthanbyhydraulicfunctions.
K E Y W O R D S
damageresilience,damageresistance,leafperformance,loop,redundancy,reticulation,traitspace,tropicalforest,venationnetwork
2 | Journal of Ecology BLONDER Et aL.
1 | INTRODUC TION
Leaf function is important for determining plants’ fitness acrossbiotic and abiotic contexts. Venation mediates water and carbonfluxes (Brodribb, Feild, & Jordan, 2007; Brodribb, Feild, & Sack,2010),mayprovidestructuralordefensivefunctions(Givnish,1979;Méndez-Alonzo, Ewers, & Sack, 2013) and may influence whole-plant carbonconstruction cost (Sack&Scoffoni, 2013).The costsand thebenefitsof a leafmaybeconstrainedby thearchitectureofthevenationnetwork(Blonder,Violle,Bentley,&Enquist,2011;Brodribb etal., 2007;Buckley, John, Scoffoni,& Sack, 2015; Sack&Scoffoni,2013;Sack,Streeter,&Holbrook,2004),whichinturnmaybeconstrainedbytheevolutionofnovelvenationphenotypesacrossclades(Brodribbetal.,2010;Trivett&Pigg,1996).Asmultiplefunctionsmapdifferentlyontothesamestructure,notallfunction/costaxescansimultaneouslybeoptimizedbyanetworkconstrainedtoaplanargeometry.Forexample,anetworkcannotsimultaneouslymaximizeefficiencyandredundancy(Katifori,Szöllősi,&Magnasco,2010).Asaresult,trade-offsmaybenecessary(Blonderetal.,2011;Katiforietal.,2010).
1.1 | Describing reticulation in minor venation networks
Venationnetworksvarywidelyintheirgeometry,withsomethatformextensive loops (closed interconnections of veins Roth-Nebelsick,Uhl,Mosbrugger,&Kerp,2001)thatencloseareolesandothersthatdonot.Thisvariationisreflectedinthegeneralterm,“reticulation”(Roth-Nebelsick etal., 2001; Trivett & Pigg, 1996). As vein ordersoften smoothly transition into each other,we use “minor” to refertothepatterns’characteristicoftheultimateveins,althoughthesepatternsmay include featurescreatedbyhigherorderveins.Someleaves have areoles in their minor veins that are simple polygons,whileothershavefreelyendingveinlets(Ellis,Daly,&Hickey,2009;vonEttingshausen,1861).Reticulationpatternsmaybedescribedbyscale-dependent (with units) or scale-independent (dimensionless)statistics.
Scale-dependent reticulation patterns have been described byveindensity,thelengthofveinsperunitleafareaandbyloopiness,thenumberofareolesperunitleafarea.Scale-independentreticu-lationpatternsdescribetheshapeofloopsandotherstructuresinthenetwork (e.g. freelyendingveinlets).Rapidevolutionofminorvenationacrosscladesisalsothoughttobepossible,consistentwithfunctionalrolesofreticulationpatterns(Blonder,Baldwin,Enquist,&Robichaux,2016;Boyceetal.,2009;Givnishetal.,2005;Horn,Fisher,Tomlinson,Lewis,&Laubengayer,2009).
Scale-dependentpatternsinveindensityhavebeenshowntobepredictiveoftranspirationandphotosynthesisrates(Brodribbetal.,2007),environmentalchange(deBoer,Eppinga,Wassen,&Dekker,2012)andclimateniches(Blonder&Enquist,2014;Manze,1967; Uhl & Mosbrugger, 1999). However, much less is knownabouttheecologicalsignificanceofvariationinscale-independentpatterns of reticulation, about the drivers of this variation, or
about the evolutionary patterns and constraints underlying thisvariation. This is surprising, given the differences in reticulationreadilyobservedacrosstaxa,e.g.betweenGinkgo biloba [maiden-hairtree],withnolooping,andMalus pumila[orchardapple]withextensivelooping.
1.2 | Functional hypotheses for reticulation
Empirical studieshaveshownthatminorvenationpatterns reflecthydraulic functioning across environments (Blonder & Enquist,2014;Blonderetal.,2017;Sack&Scoffoni,2013).Higherveinden-sitymayoccurinwithwarmeranddrierabioticconditions(Sack&Scoffoni, 2013). Sites with higher potential evapotranspiration ortemperaturesshouldselectforspeciesthatachievehighcarbonas-similationratesbytranspiringeitherahighamountofwaterwhenwater is temporarily abundant or that use the same amount ofwatermoreefficientlywhenwater isnot (Blonder,Violle,Bentley,&Enquist,2014).Thus,higherveindensityorwateruseefficiencyshould be associated with warmer environments (Blonder etal.,2014,2016,2017;Sack&Scoffoni,2013;Uhl&Mosbrugger,1999).Asmanyscale-dependentreticulationmetricsarenecessarilycorre-latedbasedongeometricalscalingconsiderations(Blonder,Violle,&Enquist,2013;CarinsMurphy,Jordan,&Brodribb,2016;Sacketal.,2012),warmerandlesswetenvironmentsareexpectedtoalsohavehigherreticulationduetotheirdirectimpactsonveindensity.
Reticulationmayalsomediateefficiencyvs.redundancytrade-offs for leafhydraulics.Theoreticalmodels suggest thatnetworksthat only branch (no loops) provide the most efficient transportof such resources from a central point under constant conditions(Dodds, 2010; McKown, Cochard, & Sack, 2010; Price, Gilooly,Allen,Weitz,&Niklas,2010;West,Brown,&Enquist,1997),whilenetworks that branch and also have loops provide alternate flowpathwaysthatprovidemoreresiliencetofluctuatingresourceloads(Corson,2010;Katiforietal.,2010;Nardini,Tyree,&Salleo,2001;Price &Weitz, 2014; Sack, Dietrich, Streeter, Sanchez-Gomez, &Holbrook,2008).Suchfluctuatingloadsanddamagecouldarisefromthe occurrence of sunflecks in shaded conditions (Givnish, 1979;Givnishetal.,2005;Zwieniecki,Melcher,Boyce,Sack,&Holbrook,2002),droughtstressandxylemcavitation (Brodribb,Bienaimé,&Marmottant,2016).Thus,reticulationcouldbeassociatedwithtraitsrelatedtophotosyntheticcapacityandlightenvironment.
Reticulation may also have multiple structural and defensivefunctions beyond these direct and indirect hydraulic functions(Sack & Scoffoni, 2013). Reticulation could increase damage re-sistance by offsetting other leaf anti-herbivore defence strate-gies (Roth-Nebelsick etal., 2001).More reticulation couldprovidehigher damage resilience to herbivory or environmental stressors(e.g.wind-driventearing)byprovidingalternateflowpathwaysthatmaintainhydraulicfunctioning(Sacketal.,2008).Morereticulationcouldalsoprovidemoredeterrenceagainst chewing/cuttingdam-agethroughincreasedmechanicalstrengthandresistancetotearing(Choongetal.,1992;Wagner,1979).Reticulationcouldalsoprovideadditional redundant pathways for latex flow, enabling successful
| 3Journal of EcologyBLONDER Et aL.
deployment of defence compounds after wounding (Agrawal &Konno, 2009). All of these strategies would provide an alternatesolutionoffsetting investment indefencecompounds.Thus, retic-ulation could be associatedwith traits related to secondary com-poundfractions(polyphenols,tannins,lignins)andtoughness(forcetopunchorforcetotear).
Reticulationcouldalsodirectlyprovidemechanical strength toaleaf(Givnish,1979;Givnishetal.,2005;Niinemets,Portsmuth,&Tobias,2007;Sack&Frole,2006),withloopsprovidingreinforcingcross-linkages that increase stiffness and strength (Niklas, 1999;Read&Stokes,2006)aswellas reducingthepotential for tearingandcrackpropagation(Vincent,1982).Moreover,becauseitismorecarbonefficienttohaveasingleprimaryveinsupportingathinlayerof lamina reinforced by reticulate veins than to havemultiple pri-maryveinssupportingathickerlayeroflaminawithoutminorveinreinforcements,thinnerleavesshouldbemechanicallysupportedbyasingle-largemidveinandreticulate-veinedlamina(Givnish,1979).Suchthinleavesarealsofoundintheshadeduetotheirhigherlightinterception(Givnish,1988).Asaresult,reticulationcouldbeasso-ciatedwithvariablesrelatedtoleafthickness,mechanicalstrength(forcetopunchandforcetotear)andshadedlightenvironment.
Venation networks also have constructions costs, particularlydue to this lignification of the veins (Mooney & Gulmon, 1982).Lignin-richveinshaveahighercarboncostforconstructionrelativetoother tissues (Lambers&Poorter,1992)andalsodisplacepho-tosynthetic tissue,potentially reducingbenefitsperunitcost.Thelignification of veins (or the presence of costly bundle sheath ex-tensions)isvariableacrossspeciesandlightlevels(Ohtsuka,Sack,&Taneda,2018),butingeneral,veinshavehigherconstructioncoststhanotherleaftissues.Thecontributionofminorveinstoleafcon-structioncostremainscontroversial,butispotentiallylarge(Blonderetal.,2011;CarinsMurphyetal.,2016;Johnetal.,2017;Sacketal.,2013).Thus, reticulationcouldbeassociatedwith traits related tostructural investment, including thickness, leafmass per area, drymattercontentandligninconcentration.
Finally, reticulationmay also not have functional benefits duetothedevelopmentalconstraints.Veinscancompletedevelopmentbefore leaf expansionends (Sack&Scoffoni,2013), such that cellexpansioncoordinatesvenationpatterns(CarinsMurphy,Jordan,&Brodribb,2012;Jordan,Brodribb,Blackman,&Weston,2013)andpotentiallyalsoleafarea(CarinsMurphyetal.,2016).Thus,variationinleafformwillalsodriverelationshipsbetweenleafshape,sizeandreticulationtraits.Forexample,largerleavesmayhavefewerveinsperunitareaandpotentiallyfewerloopsaswell(Blonderetal.,2013;Sacketal.,2012),whilemoreelongatedleavesmayalsocausemoreelongatedareoles(Blonderetal.,2016).Thus,reticulationcouldbeassociatedwithleafareaandleafaspectratio.
1.3 | Evolutionary patterns of reticulation in angiosperms
Therehavebeenfewstudiespairingreticulationmeasurementswiththesepotentialpredictors,limitingtestsofthesedifferentfunctional
hypotheses. Previous studies using qualitativemetrics of reticula-tionhavefocusedonitsoriginacrossextantbasalorextinctplantclades (Alvin&Chaloner, 1970;Hickey&Wolfe, 1975; Takhtajan,1980;Trivett&Pigg,1996).Quantitativedataexistforafewhun-dredangiospermspecies(Price&Weitz,2014),whileotherquanti-tativedataexistforfocalsubsetsofmonocots(Givnishetal.,2005;Horn etal., 2009). Similarly, there have been studies focusing onfreelyendingveinlets,butonlyforsmallnumbersofspecies(Fiorin,Brodribb,&Anfodillo,2016).Otherintensivestudiesoflooptopol-ogyhaveprimarilyexaminedmathematicalquestions,forexample,Ronellenfitsch,Lasser,Daly,andKatifori(2015).
There alsomaybe constraints on the evolutionof reticulation.Qualitative reticulation traits like “open” and “closed” venation areoften used to assign taxonomic position in plant systematics (Ellisetal., 2009), suggesting strong phylogenetic niche conservatism innetworkarchitecture.However,acontrastingviewpointisprovidedbyintraspecificdatafromArabidopsis thaliana,wheresmallchangesindevelopmentalprocessesormutationsinsinglegenescanyieldwidevariationinnetworkarchitecture(Carland,Defries,Cutler,&Nelson,2015;Kang&Dengler,2004;Steynen&Schultz,2003).Asaresult,thereremainsakeyopportunitytobetterquantifythetaxonomiclev-elsandcladesinwhichreticulationshowsthemostvariation.
1.4 | Present work
Theaimsofthisstudyareto(1)quantitativelydescribevariationinreticulation,(2)testmultipleecologicalhypothesesforfunctionsofreticulation and (3) examine evolutionary patterns and processesin reticulation. We explore several scale-dependent and scale-independent metrics for characterizing reticulation (Table1) andthendeterminewhethertheabovehypothesesarerelatedtodiffer-entfunctionaltraitsorabioticvariables.Empiricaldatacomefromthedominant treespeciesoccurringalonga3,300mhumid tropi-cal forest elevation gradient inwestern Amazonia and the Andes(Blonderetal.,2017).
2 | MATERIAL S AND METHODS
2.1 | Research site and sampling strategy
Thisstudyincluded10permanent1-haplotsintheDepartmentsofCuscoandMadredeDiosinsoutheasternPeru(Malhietal.,2010;Table2).SixoftheplotsaremontaneplotsintheKosñipataValleyof theAndes (elevation range 1,500–3,500m a.s.l.), two are sub-montaneplots located in thePantiacolla front rangeof theAndes(range600–900ma.s.l.)andtwoarefoundintheAmazonlowlandsinTambopataNationalPark(range200–225ma.s.l.).Seasonalcloudimmersioniscommonabove1,500maslelevation(Halladay,Malhi,&New,2012).Plotswereestablished inareas thathaverelativelyhomogeneous soil substrates and stand structure aswell asmini-malevidenceofhumandisturbance(Girardin,Malhi,etal.,2014).Allstems≥10cmdiameteratbreastheightweretagged,sizedandiden-tifiedtospecieslevel.
4 | Journal of Ecology BLONDER Et aL.
From April to November 2013, we measured plant traitsof biomass-dominant tree species in these plots as part of theCHAMBASA (challenging attempt to measure biotic attributesalong the slopes of the Andes) project. Sampling began at the
highest plots in April and moved to the lowest by November.Thisdesignmayleadtosomephenologybiasesintraitmeasure-ments butwas necessary for logistical reasons. Based on dataforthemostrecentcensusineachplot,wesampledspeciesthat
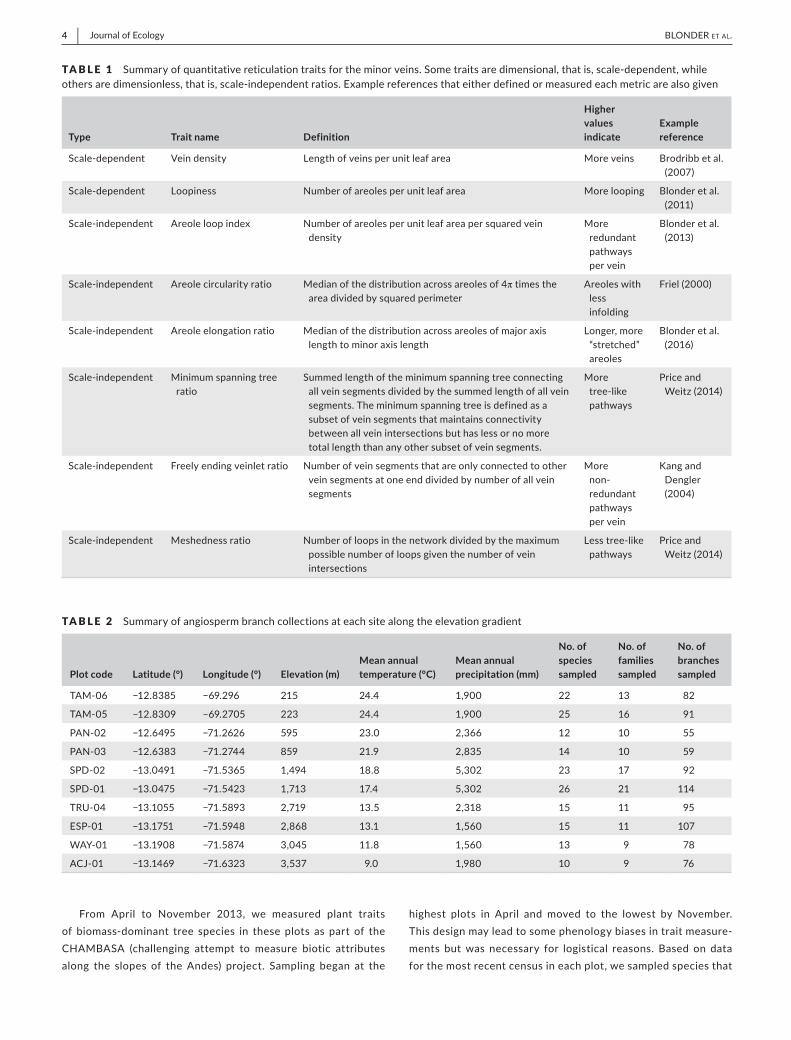
TABLE 1 Summaryofquantitativereticulationtraitsfortheminorveins.Sometraitsaredimensional,thatis,scale-dependent,whileothersaredimensionless,thatis,scale-independentratios.Examplereferencesthateitherdefinedormeasuredeachmetricarealsogiven
Type Trait name Definition
Higher values indicate
Example reference
Scale-dependent Veindensity Lengthofveinsperunitleafarea Moreveins Brodribbetal.(2007)
Scale-dependent Loopiness Numberofareolesperunitleafarea Morelooping Blonderetal.(2011)
Scale-independent Areoleloopindex Numberofareolesperunitleafareapersquaredveindensity
More redundantpathwayspervein
Blonderetal.(2013)
Scale-independent Areolecircularityratio Medianofthedistributionacrossareolesof4πtimestheareadividedbysquaredperimeter
Areoleswithlessinfolding
Friel(2000)
Scale-independent Areoleelongationratio Medianofthedistributionacrossareolesofmajoraxislengthtominoraxislength
Longer,more“stretched”areoles
Blonderetal.(2016)
Scale-independent Minimumspanningtreeratio
Summedlengthoftheminimumspanningtreeconnectingallveinsegmentsdividedbythesummedlengthofallveinsegments.Theminimumspanningtreeisdefinedasasubsetofveinsegmentsthatmaintainsconnectivitybetweenallveinintersectionsbuthaslessornomoretotallengththananyothersubsetofveinsegments.
More tree-likepathways
PriceandWeitz(2014)
Scale-independent Freelyendingveinletratio Numberofveinsegmentsthatareonlyconnectedtootherveinsegmentsatoneenddividedbynumberofallveinsegments
More non-redundantpathwayspervein
KangandDengler(2004)
Scale-independent Meshednessratio Numberofloopsinthenetworkdividedbythemaximumpossiblenumberofloopsgiventhenumberofveinintersections
Lesstree-likepathways
PriceandWeitz(2014)
TABLE 2 Summaryofangiospermbranchcollectionsateachsitealongtheelevationgradient
Plot code Latitude (°) Longitude (°) Elevation (m)Mean annual temperature (°C)
Mean annual precipitation (mm)
No. of species sampled
No. of families sampled
No. of branches sampled
TAM-06 −12.8385 −69.296 215 24.4 1,900 22 13 82
TAM-05 −12.8309 −69.2705 223 24.4 1,900 25 16 91
PAN-02 −12.6495 −71.2626 595 23.0 2,366 12 10 55
PAN-03 −12.6383 −71.2744 859 21.9 2,835 14 10 59
SPD-02 −13.0491 −71.5365 1,494 18.8 5,302 23 17 92
SPD-01 −13.0475 −71.5423 1,713 17.4 5,302 26 21 114
TRU-04 −13.1055 −71.5893 2,719 13.5 2,318 15 11 95
ESP-01 −13.1751 −71.5948 2,868 13.1 1,560 15 11 107
WAY-01 −13.1908 −71.5874 3,045 11.8 1,560 13 9 78
ACJ-01 −13.1469 −71.6323 3,537 9.0 1,980 10 9 76
| 5Journal of EcologyBLONDER Et aL.
most contributed to plot basal area as a proxy for abundance.Weaimedtosample theminimumnumberofspecies thatcon-tributed to80%ofbasalarea,although, in thediverse lowlandforest plots, we only were able to sample species comprising60%–70%ofplotbasalarea.Withineachspecies,3–5individualtrees were chosen for climbing (five in upland sites and threeinlowlandsites).Ifthreetreeswerenotavailableinthechosenplot,wesampledadditionalindividualsofthesamespeciesfromanareaimmediatelysurroundingtheplot.Wesampledonesunlitcanopy branch and one shaded (defined as occurring beneathothercanopy layers)branchwherepossible,eachat least1cmdiameter, fromeach tree.Fromeachbranch,wemeasured fiveleavesfromsimple-leavedspeciesorfiveindividualleafletsfromcompound-leavedspecies (both referred toas “leaf”below) fortraitmeasurements.
Allanalyseswereconductedonthesameleaf(includingreticu-lationmeasurements)exceptwhenotheranalysesweredestructive,inwhichcase,areplicateleaffromthesamebranchwasused.DatafromthecampaignwereaccessedfromtheGEMTraitsdatabaseandrpackage(Shenkinetal.,2017)andarearchivedonDryad(Blonderetal.,2018).
2.2 | Predictor variables (traits)
Wemeasuredawide rangeof functional traits todetermine theirpredictive capacity forminor vein reticulation. The following fourtraits were measured on the same leaf for which reticulation re-sponsevariableswerelatermeasured.
Leafdrymattercontent (LDMC;g/g)wasapproximatedasdrymassdividedbyfreshmass.Laminathickness (mm)wasmeasuredatmidpointoflaminaavoidingprimaryandsecondaryveinswithamicrometer (Tresna). Laminaarea (cm2)wascalculatedas thepro-jected surfaceareaof thewhole leaf, includingall leaflets if com-pound,measuredat300pixelsperinchresolutionviadigitalscanner(CanonLiDE110)andcalculatedfromthresholdedimagesinImageJ.Leafmassperarearatio(LMA;g/m2)wascalculatedasleafdrymassdividedbyfreshleaflaminaarea,notincludingthepetioleorrachis.Light saturatedmaximumphotosynthetic rate per unit area (Amax; μmol m−2s−1)wasobtainedwithaportablephotosynthesissystem(6400XT;LiCor)duringmorningtimesunderconditionsofambienthumidity, saturating light (1,200–1,500μmol m−2s−1), saturating[CO2](1,000–1,200ppm)andambientsitetemperature(16–26°in-terquantilerange).
Wealsomeasuredsometraitsonadifferentleaffromabranchof the same tree experiencing a similar light environment be-causeofthedestructivenatureofsomeofthesemeasurements.Force to punch (kN/m) was measured as the normalized forcerequired topuncture the lamina,measuredon fresh leaveswitha penetrometer built according to the specifications of Onoda,Schieving, andAnten (2008), following themeasurement guide-lines of Pérez-Harguindeguy etal. (2013). Force to tear (kN/m)wasmeasuredasthenormalizedforcerequiredtotearthelamina,measuredonfreshleaveswithanapparatusdesignedbyHendry
andGrime(1993),followingthemeasurementguidelinesofPérez-Harguindeguyetal.(2013).
Carbon isotope ratio (δ13C—the ratio of 13C to 12C relative toViennaPeeDeeBelemnite[VPDB]permil[‰],usedasaproxyforwater use efficiency; Farquhar, Ehleringer, & Hubick, 1989) wasmeasuredbycontinuousflowgasratiomassspectrometry.Sampleswerecombustedusinganelementalanalyser (Costech)coupledtothe mass spectrometer (Finnigan Delta PlusXL). Standardizationis based on acetanilide for elemental concentration, NBS-22 andUSGS-24forδ13C.
Phenol andcondensed tannin concentrations (mg)weredeter-minedastheper-drymassconcentrationofphenol-containingcom-poundsofmolecularweight<500and>500respectively.Branchesofmature leaveswere sealed in polyethylene bags in the field tomaintainmoisture,storedoniceincoolersandtransportedtoalocalsiteforprocessingwithin3hr.Smallleafdiscs(atleast30perleaf)wereimmediatelytakenfromc.6–12randomlyselectedandcleanedleaves and transferred to −80°C cryogenic shipping containers.Frozenleafdisksweregroundin95%methanolonahighthroughputtissue homogenizer. A portion of the solutionwas further dilutedandincubatedonanorbitalshakeratroomtemperature(15–18°C)inthedarkfor48hrtoensureproperphenolextraction.Asecondportionofthesolutionwasfurtherdilutedina2mlcentrifugetubecontaining10mgpolyvinylpyrrolidone (PVP) and incubatedon icefor30minaftervortexing.Followingcentrifugation,75%ofthesu-pernatantwasplaced inanewcentrifugetubecontaininganother10mgPVP for a secondprecipitation step. The total phenol con-centration in solution was determined colorimetrically using theFolin–Ciocalteumethod.Phenol concentrationsweremeasured ingallicacidequivalentsrelativetoaneight-pointgallicacidstandardcurve.ThetanninconcentrationwasdeterminedasthedifferencebetweentotalphenolsandphenolsinsolutionafterPVPprecipita-tion.MethodsaredescribedfullybyMakkar,Blümmel,Borowy,andBecker(1993);AinsworthandGillespie(2007).
Ligninconcentration(100xg/g)wasdeterminedastheper-drymassconcentrationof fibres resistant to strongacids,determinedin0.5gdrygroundleaftissuethroughusingsequentialdigestionofincreasingacidityinafibreanalyser(AnkomTechnology,Macedon,NY,USA).MethodsfollowVanSoest(1994).
Leaf aspect ratio (dimensionless)was calculated as leaf laminalength (not including petiole or rachis) divided by maximum leafwidth,measuredfromadigitalphotographinImageJ.Inthecaseofcompoundleaves,leafletswereused;inthecaseofpalmatesimpleleaves,widthwasmeasuredaslobewidth.
2.3 | Predictor variables (climate)
Climatedatawereobtainedusingquality-controlledandgap-filleddatafromweatherstationscolocatedwithplots.Datawereobtainedfromsite-specificpapersonTAM05andTAM06(Malhietal.,2010),SPD01andSPD02(HuaracaHuascoetal.,2014),TRU04(Girardinetal.,2013),ESP01andWAY01(Girardin,Silva-Espejo,etal.,2014)andACJ01 (Oliveras etal., 2014),while climate data fromPAN02
6 | Journal of Ecology BLONDER Et aL.
andPAN03werecollectedin2013–2014andwereprocessedusingthesametechniquesdescribedfortheothersites.DatafromACJ01,PAN02,PAN03andTRU04wereavailablesince2012or2013andsince2009forallothers.Meanannualtemperature(MAT;°C)wascalculatedasthemeanofdailyaveragetemperatures.Annualpre-cipitation(mm/year)wasmeasuredbyaweatherstation.ValuesarereportedinTable2.
2.4 | Response variables (vein traits)
We chemically cleared, imaged and hand-traced a leaf venationnetworkforoneleaffromasampledbranchofasunlitand(wherepossible) shaded light microenvironment from each tree, follow-ing standard protocol for dried leaves (Pérez-Harguindeguy etal.,2013). Imagesweremadeataspatial resolutionof179pixels/mmandavoidedmajorveinswheneverpossible.Wetracedanaverageof36±23mm2of leafarea inorder tocapturea largenumberofareolesineachimage(n=306±305SD).TheseimagesandtracingmethodsarefullydescribedinBlonderetal.(2017).Thislargeimageextentwas necessary to robustly estimate reticulation traits, andtherefore,necessarilyincludedasmallnumberofnon-minorveins.We treated these equivalently to minor veins in tracing, as theyoftenconstitutedintegralboundariesofminorveinareoles,whosepropertieswereofinterestinthisstudy.
Wethencalculatedvenationreticulationtraits (Table1)fromthese tracings, using MATLAB code available at https://github.com/bblonder/venation_programs/. Areoles that did not appearclosed(i.e.partiallylyingoutsidetheimage)werenotincludedintheanalysis.Wealsoadded1.0tovaluesofmeshednesstomakeall values positive to permit log transformation in analyses.Wecorrected the two-dimensional reticulation traits (vein density,vein loopiness) for bias due to shrinkage of dried leaf samples.Shrinkagecorrectionswerenotrequiredfordimensionlesstraits.Weestimatedthefractionofleafareathatwaslostupondrying(S;dimensionless).Wecalibratedaregressionmodelforshrinkageusing existing data for temperate and tropical species providedby Blonder etal. (2012) using both LMA andmean annual tem-perature (MAT)aspredictorsavailable in thisdataset.ThefittedmodelhadcoefficientsS=0.3496−0.0005162LMA−0.008316MAT (R2=.36,df=258,RMSE=0.12).Weapplied thismodel toeachleafinthecurrentdatasettoestimateS,whichvariedaroundameanof0.15±0.04SD.Weused thesevalues to rescale veindensityand loopinessvalues (withunitspermmorpermm2 re-spectively)byafactorof√(1−S)or(1−S),followingBlonderetal.(2017).
2.5 | Phylogenetic analysis
Toexamineevolutionarypatternsofreticulation,webuiltaphyloge-netictreeforallspeciesforwhichreticulationmeasurementswereavailable, using the phylomatic function in phylocom 4.2 (Blonderetal., 2017). Clades were assigned using the “R20120829” plantmegatree. Approximate crown ageswere assigned via phylocom’s
bladj function, with constraints for internal nodes provided byGastauerandMeira-Neto(2013).
2.6 | Statistical analysis
Weconductedallanalyses in ther statisticalenvironment (http://www.r-project.org).Weconductedanalysesforallangiospermsandalsoforallangiospermsexcludingpalms(Arecaceae)becauseofthedivergentmorphologyofthisfamily.
Todetermine theoverall reticulation trait space,we log trans-formedandscaledallreticulationtraits,thenmadeaprincipalcom-ponentsanalysis.Basedonthevarianceexplainedbyeachprincipalcomponent,wethenusedthescoresalongtheleadingcomponentsas orthogonal reticulation axes (PC1, PC2 and PC3). These trans-formed variables and scores also were used for all subsequentanalyses.
To examine evidence for phylogenetic niche conservatism,wefirst performed a variance partitioning analysis across taxonomicscalesusingstandardmixedmodellingmethods(Messier,McGill,&Lechowicz,2010).WealsocarriedoutananalysisofBlomberg’sK,ametricofphylogeneticsignal (Blomberg,Garland, Ives,&Crespi,2003),withinthephytools rpackage.Allotherphylogeneticanalysesweremadewith theape package. To examine evidence for direc-tionalshiftsinreticulationtraitsoverevolutionarytime,wealsoper-formedaregressionanalysisoffamilyageandfamilymeanvaluesofreticulationprincipalcomponents.Toexaminevariationinretic-ulationduetolightmicroenvironment,wedeterminedwhetherthedifferencebetweenmeansunandshadeleafvalues,calculatedforeachspecies-sitecombination,wassignificantlydifferentfromzeroaccordingtoattest.
Toseparatethe independenteffectsofenvironmentandtraitsonthereticulationtraitspace,weanalysedaseriesofGaussianfam-ily generalized linear mixed models within a Bayesian frameworkfor each reticulation principal component. This approach allowsfor hierarchical grouping of predictor data and phylogenetic non-independenceofdata.
Beforecarryingoutthisanalysis,wegapfilledthepredictordata.Only2.3%ofthedataweremissingacrossallvariables(FigureS1),but32.3%ofcaseshadatleastonemissingobservationofatleastonepredictor.Asdeletingall incompleteobservationswouldhavevastlyreducedthesamplesizeandalsohavebiasedtheanalysis,wegapfilledmissingvaluesinthematrixofpredictorvariables.Weusedmultiple imputations via chained equations with predictive meanmatchingusingthe“mice”rpackage,whichusesthedistributionofobserveddatatopredictthevaluesofunobserveddata.Whendataaremissing at random, as is truehere, this approach is asymptot-ically unbiased and asymptotically efficient (Buuren & Groothuis-Oudshoorn, 2011).We generated 10 independent imputations ofthefulldatasettoaccountforuncertaintyintheobserveddata.Wethenlogtransformedasubsetofhighlyskewedpredictorvariables:(LMA, laminaarea, thickness, force topuncture, force to tear, leafaspectratio)andthenrecentredandrescaledallpredictorvariablestoputthemoncommonscales.
| 7Journal of EcologyBLONDER Et aL.
Mixedmodelswereconstructedtreatingallofthetraitandcli-mate predictors as independent fixed effects because collinearityamongpredictorswaslow(meanPearson’srhoamongallpredictorvariables,0.04±0.24SD).Thesemodelsincorporatedarandomef-fectofsite(capturingnestingofclimatemeasurementswithinsites)asadiagonalvariancematrixandarandomeffectofspecies(captur-ingthenestingofmultiplebranchesforeachspecies).Wealso in-corporatedarandomeffectofevolutionarydistance(capturingtherelatedness of species) using an inverted phylogenetic covariancematrix. Prior distributions for each effectwere chosen as inversegamma with location and scale parameters set to 0.01 (Gelman,2006).ModelswereimplementedusingaMarkovchainMonteCarloalgorithmintheMCMCglmm rpackage(Hadfield,2010).Eachmodelwasrunforaburn-inperiodof100,000iterations,afterwhichpos-terior distributions were characterized by taking 1,000 samples,each100iterationsapart inthechain.Chainmixingwassufficientinallcases.Wethenrepeatedthemodellingexerciseforeachimpu-tationofthedatasetandgeneratedfinalposteriordistributionsbyconcatenatingposteriorsamplesacrossallmodels.Tofacilitate in-terpretation,approximatep-valuesforeachfixedeffecta were cal-culatedasp=2×min[P(a>0),P(a<0)],withstatisticalsignificanceinferredatp<.05.
Becausepredictorvariableswere rescaledbeforeanalysis, thedistributionofthesefixedeffectscanbeinterpretedaseffectsizes
(SD/SD).Thatis,acoefficientwithvalue+1indicatesthata1stan-darddeviationincreaseinthepredictorvariabledirectlycausesa1standarddeviationincreaseintheresponsevariable,afteraccount-ing foranyotherpredictorvariable, and foranyeffectsof sharedevolutionaryhistoryamongspecies,orofhierarchical structure inthedata.
3 | RESULTS
We obtained reticulation traits and paired predictor variables for849branches from136angiospermspecies (Table2),ofwhich12were frompalm taxa.Most specieswere sampledonlyat a singlesite,withonlyeightspeciessampledinmorethantwoplots(Blonderetal.,2017).
3.1 | Reticulation trait space
We foundwide variation in every reticulation trait,with variationspanninguptotwoordersofmagnitudeacrossalltaxa(Table3).Twoofthemostvariabletraitswereveinloopiness(90%quantilerange,0.8–54.1 per mm2) and freely ending veinlet ratio (90% quantilerange,0.086–0.43).Removingpalmsfromthisanalysishadanegligi-bleeffectontraitranges(TableS1).
TABLE 3 Rangesofvariationforallunscaledreticulationtraitsandecologicalpredictors
Type Variable Units 5% quantile 50% quantile 95% quantile
Predictor(climate) Lightenvironment — Shade Sun Sun
Predictor(climate) Meanannualprecipitation mm 1,560 1,980 5,302
Predictor(climate) Meanannualtemperature °C 9.0 17.4 24.4
Predictor(trait) Amax nmolgs 0.849 7.607 18.94
Predictor(trait) δ13C permil −33.4 −30.3 −26.83
Predictor(trait) Forcetopunch kN/m 0.295 0.875 2.51
Predictor(trait) Forcetotear kN/m 0.379 0.722 4.88
Predictor(trait) Laminaarea cm2 9.354 58.224 632.01
Predictor(trait) Laminathickness mm 0.141 0.264 0.61
Predictor(trait) LDMC — 0.24 0.425 0.69
Predictor(trait) Leafaspectratio — 1.626 2.456 4.21
Predictor(trait) Lignin mg/g 9.064 23.76 39.55
Predictor(trait) LMA g/m2 64.39 106.9 189.11
Predictor(trait) Phenols mg/g 0 88.145 166.01
Predictor(trait) Tannins 100g/g 0 38.52 83.55
Response(trait) Areolecircularityratio — 0.623 0.754 0.86
Response(trait) Areoleelongationratio — 1.373 1.502 1.77
Response(trait) Areoleloopindex — 0.023 0.074 0.15
Response(trait) Freelyendingveinletratio — 0.086 0.212 0.43
Response(trait) Meshednessratio — −0.019 0.051 0.11
Response(trait) Minimumspanningtreeratio — 0.603 0.68 0.86
Response(trait) Veindensity permm 5.342 11.221 18.69
Response(trait) Veinloopiness permm2 0.882 9.154 54.06
8 | Journal of Ecology BLONDER Et aL.
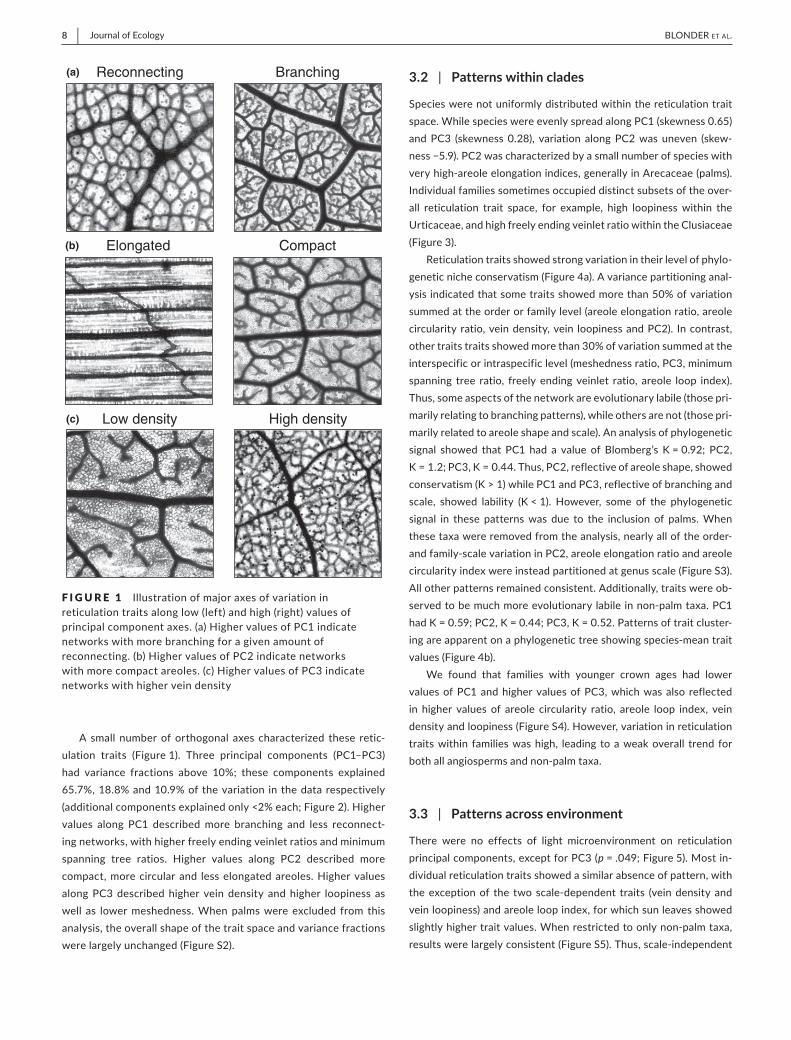
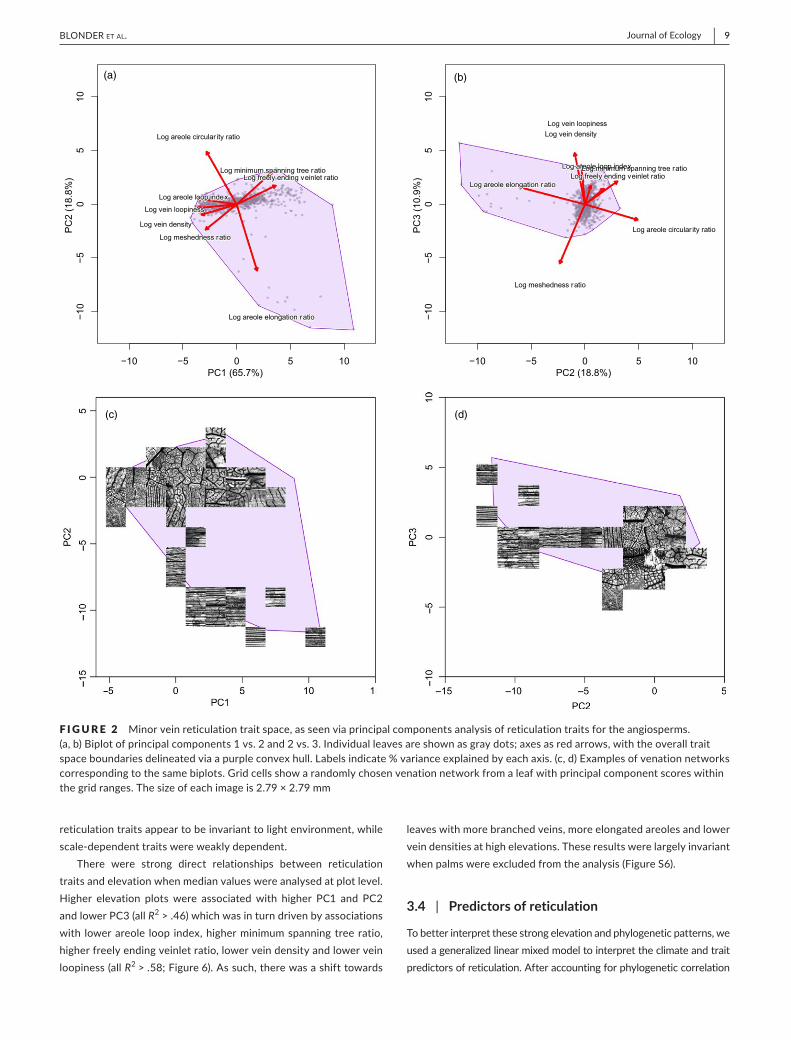
Asmall numberoforthogonal axes characterized these retic-ulation traits (Figure1). Three principal components (PC1–PC3)had variance fractions above 10%; these components explained65.7%,18.8%and10.9%ofthevariation inthedatarespectively(additionalcomponentsexplainedonly<2%each;Figure2).Highervalues along PC1 describedmore branching and less reconnect-ingnetworks,withhigherfreelyendingveinletratiosandminimumspanning tree ratios. Higher values along PC2 described morecompact,morecircularand lesselongatedareoles.HighervaluesalongPC3describedhigher veindensity andhigher loopiness aswell as lowermeshedness.Whenpalmswereexcluded from thisanalysis,theoverallshapeofthetraitspaceandvariancefractionswerelargelyunchanged(FigureS2).
3.2 | Patterns within clades
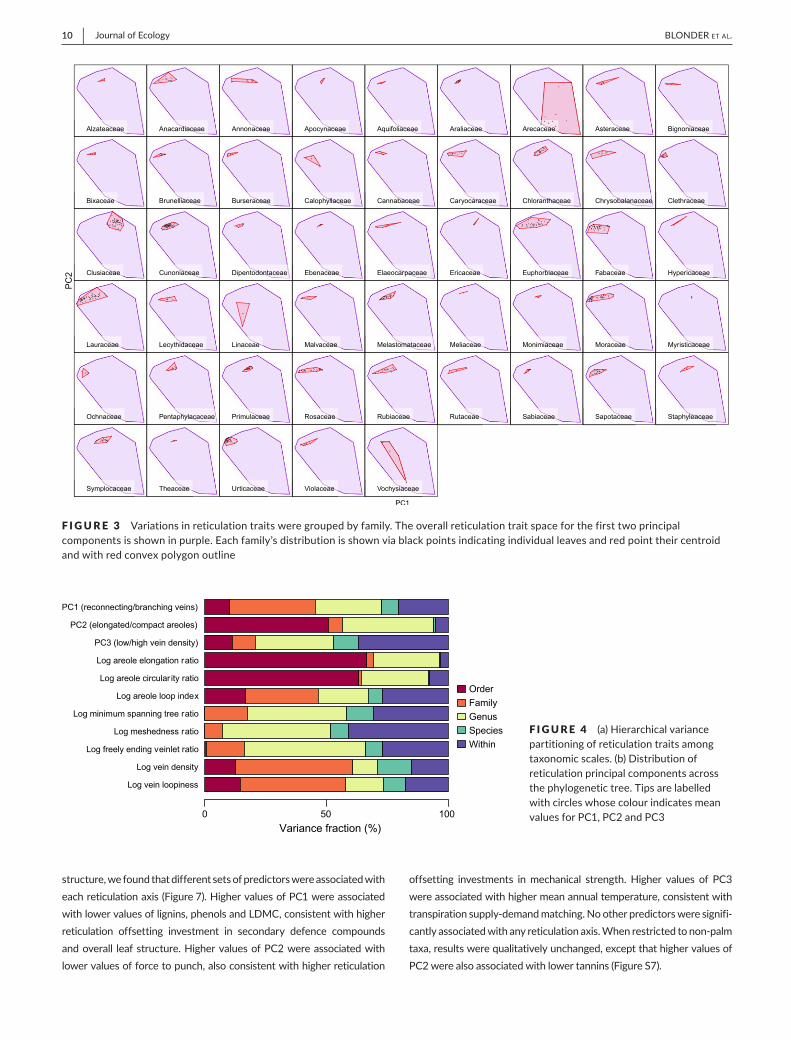
Specieswerenotuniformlydistributedwithinthereticulationtraitspace.WhilespecieswereevenlyspreadalongPC1(skewness0.65)andPC3 (skewness0.28), variation alongPC2wasuneven (skew-ness−5.9).PC2wascharacterizedbyasmallnumberofspecieswithveryhigh-areoleelongationindices,generallyinArecaceae(palms).Individualfamiliessometimesoccupieddistinctsubsetsoftheover-all reticulation trait space, for example, high loopiness within theUrticaceae,andhighfreelyendingveinletratiowithintheClusiaceae(Figure3).
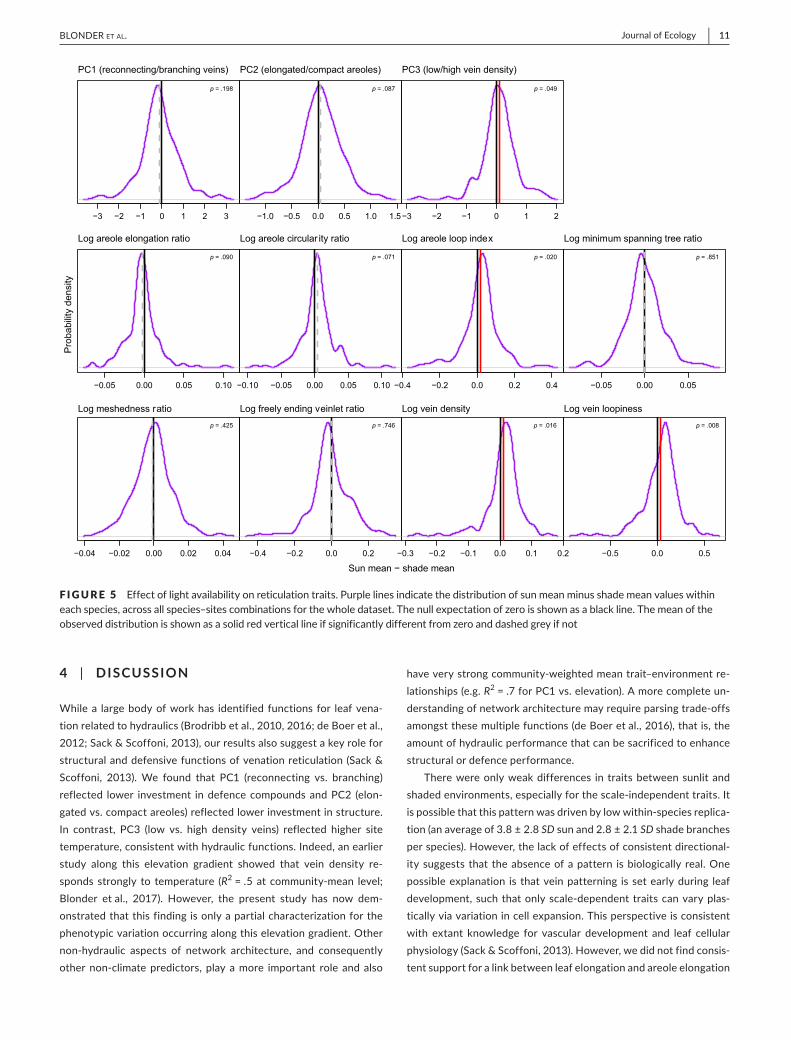
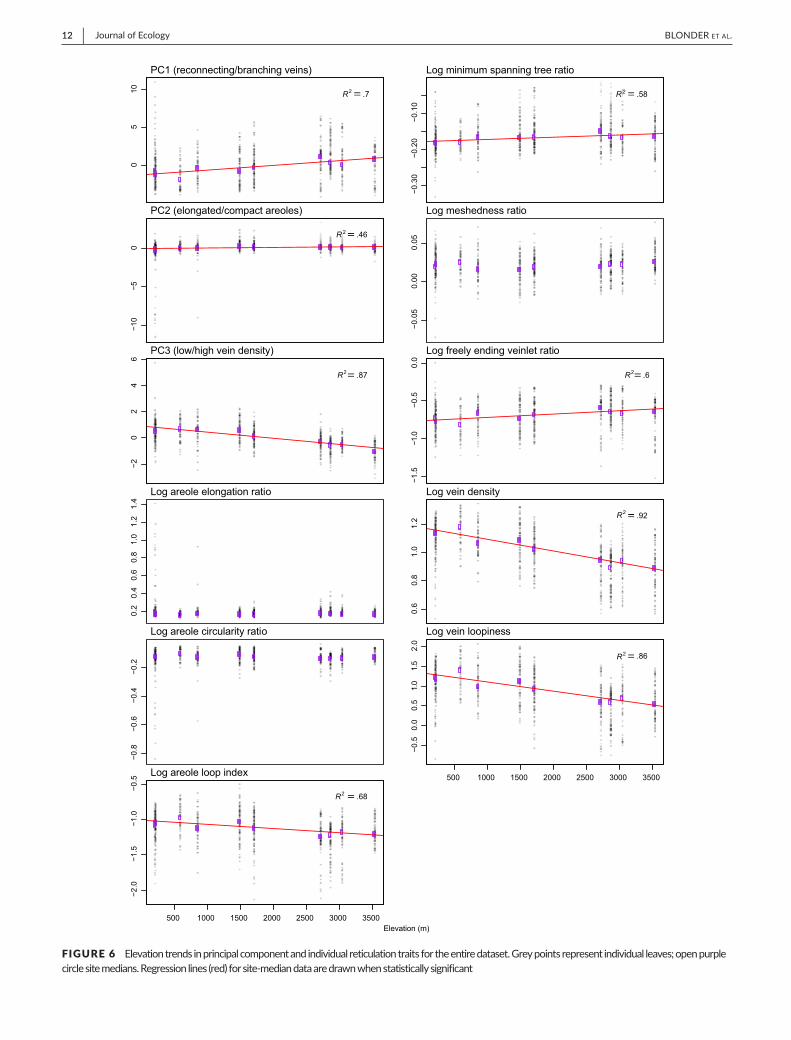
Reticulationtraitsshowedstrongvariationintheirlevelofphylo-geneticnicheconservatism(Figure4a).Avariancepartitioninganal-ysisindicatedthatsometraitsshowedmorethan50%ofvariationsummedattheorderorfamilylevel(areoleelongationratio,areolecircularityratio,veindensity,vein loopinessandPC2). Incontrast,othertraitstraitsshowedmorethan30%ofvariationsummedattheinterspecificorintraspecificlevel(meshednessratio,PC3,minimumspanning tree ratio, freelyendingveinlet ratio, areole loop index).Thus,someaspectsofthenetworkareevolutionarylabile(thosepri-marilyrelatingtobranchingpatterns),whileothersarenot(thosepri-marilyrelatedtoareoleshapeandscale).Ananalysisofphylogeneticsignal showed that PC1 had a value of Blomberg’s K=0.92; PC2,K=1.2;PC3,K=0.44.Thus,PC2,reflectiveofareoleshape,showedconservatism(K>1)whilePC1andPC3,reflectiveofbranchingandscale, showed lability (K<1). However, some of the phylogeneticsignal in these patternswas due to the inclusion of palms.Whenthesetaxawereremovedfromtheanalysis,nearlyalloftheorder-andfamily-scalevariationinPC2,areoleelongationratioandareolecircularityindexwereinsteadpartitionedatgenusscale(FigureS3).Allotherpatternsremainedconsistent.Additionally,traitswereob-servedtobemuchmoreevolutionarylabileinnon-palmtaxa.PC1hadK=0.59;PC2,K=0.44;PC3,K=0.52.Patternsoftraitcluster-ingareapparentonaphylogenetictreeshowingspecies-meantraitvalues(Figure4b).
We found that families with younger crown ages had lowervaluesofPC1andhighervaluesofPC3,whichwasalso reflectedin higher values of areole circularity ratio, areole loop index, veindensityandloopiness(FigureS4).However,variationinreticulationtraitswithin familieswashigh, leading toaweakoverall trend forbothallangiospermsandnon-palmtaxa.
3.3 | Patterns across environment
There were no effects of light microenvironment on reticulationprincipalcomponents,exceptforPC3(p=.049;Figure5).Mostin-dividualreticulationtraitsshowedasimilarabsenceofpattern,withtheexceptionof the twoscale-dependent traits (veindensityandveinloopiness)andareoleloopindex,forwhichsunleavesshowedslightlyhighertraitvalues.Whenrestrictedtoonlynon-palmtaxa,resultswerelargelyconsistent(FigureS5).Thus,scale-independent
F I GURE 1 Illustrationofmajoraxesofvariationinreticulationtraitsalonglow(left)andhigh(right)valuesofprincipalcomponentaxes.(a)HighervaluesofPC1indicatenetworkswithmorebranchingforagivenamountofreconnecting.(b)HighervaluesofPC2indicatenetworkswithmorecompactareoles.(c)HighervaluesofPC3indicatenetworkswithhigherveindensity
Reconnecting Branching
Low density High density
CompactElongated
(a)
(b)
(c)
| 9Journal of EcologyBLONDER Et aL.
reticulationtraitsappeartobeinvarianttolightenvironment,whilescale-dependenttraitswereweaklydependent.
There were strong direct relationships between reticulationtraitsandelevationwhenmedianvalueswereanalysedatplotlevel.Higher elevation plots were associatedwith higher PC1 and PC2andlowerPC3(allR2>.46)whichwasinturndrivenbyassociationswith lowerareole loop index,higherminimumspanningtreeratio,higherfreelyendingveinletratio,lowerveindensityandlowerveinloopiness(allR2>.58;Figure6).Assuch,therewasashifttowards
leaveswithmorebranchedveins,moreelongatedareolesandlowerveindensitiesathighelevations.Theseresultswerelargelyinvariantwhenpalmswereexcludedfromtheanalysis(FigureS6).
3.4 | Predictors of reticulation
Tobetterinterpretthesestrongelevationandphylogeneticpatterns,weusedageneralizedlinearmixedmodeltointerprettheclimateandtraitpredictorsofreticulation.Afteraccountingforphylogeneticcorrelation
F IGURE 2 Minorveinreticulationtraitspace,asseenviaprincipalcomponentsanalysisofreticulationtraitsfortheangiosperms. (a,b)Biplotofprincipalcomponents1vs.2and2vs.3.Individualleavesareshownasgraydots;axesasredarrows,withtheoveralltraitspaceboundariesdelineatedviaapurpleconvexhull.Labelsindicate%varianceexplainedbyeachaxis.(c,d)Examplesofvenationnetworkscorrespondingtothesamebiplots.Gridcellsshowarandomlychosenvenationnetworkfromaleafwithprincipalcomponentscoreswithinthegridranges.Thesizeofeachimageis2.79×2.79mm[Colourfigurecanbeviewedatwileyonlinelibrary.com]
(c) (d)
(a) (b)
−10 −5 0 5 10
−10
−50
510
PC1 (65.7%)
PC
2(1
8.8%
)
Log areole elongation ratio
Log areole circular ity ratio
Log areole loop index
Log minimum spanning tree ratio
Log meshedness ratio
Log freely ending veinlet ratio
Log vein density
Log vein loopiness
−10 −5 0 5 10
−10
−50
510
PC2 (18.8%)
PC
3(1
0.9%
)
Log areole elongation ratio
Log areole circular ity ratio
Log areole loop indexLog minimum spanning tree ratio
Log meshedness ratio
Log freely ending veinlet ratio
Log vein densityLog vein loopiness
10 | Journal of Ecology BLONDER Et aL.
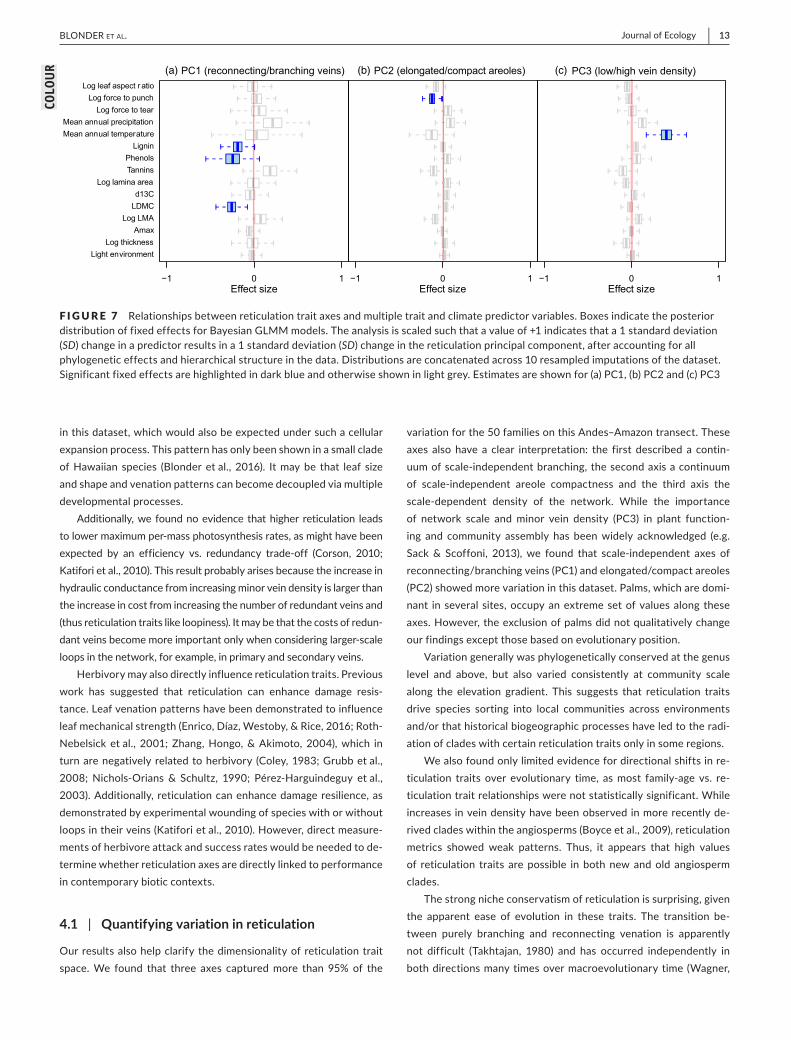
structure,wefoundthatdifferentsetsofpredictorswereassociatedwitheachreticulationaxis(Figure7).HighervaluesofPC1wereassociatedwithlowervaluesoflignins,phenolsandLDMC,consistentwithhigherreticulation offsetting investment in secondary defence compoundsandoverall leafstructure.HighervaluesofPC2wereassociatedwithlowervaluesofforcetopunch,alsoconsistentwithhigherreticulation
offsetting investments inmechanical strength. Higher values of PC3wereassociatedwithhighermeanannualtemperature,consistentwithtranspirationsupply-demandmatching.Nootherpredictorsweresignifi-cantlyassociatedwithanyreticulationaxis.Whenrestrictedtonon-palmtaxa,resultswerequalitativelyunchanged,exceptthathighervaluesofPC2werealsoassociatedwithlowertannins(FigureS7).
F IGURE 3 Variationsinreticulationtraitsweregroupedbyfamily.Theoverallreticulationtraitspaceforthefirsttwoprincipalcomponentsisshowninpurple.Eachfamily’sdistributionisshownviablackpointsindicatingindividualleavesandredpointtheircentroidandwithredconvexpolygonoutline[Colourfigurecanbeviewedatwileyonlinelibrary.com]
F IGURE 4 (a)Hierarchicalvariancepartitioningofreticulationtraitsamongtaxonomicscales.(b)Distributionofreticulationprincipalcomponentsacrossthephylogenetictree.TipsarelabelledwithcircleswhosecolourindicatesmeanvaluesforPC1,PC2andPC3[Colourfigurecanbeviewedatwileyonlinelibrary.com]
Log vein loopiness
Log vein density
Log freely ending veinlet ratio
Log meshedness ratio
Log minimum spanning tree ratio
Log areole loop index
Log areole circular ity ratio
Log areole elongation ratio
PC3 (low/high vein density)
PC2 (elongated/compact areoles)
PC1 (reconnecting/branching veins)
Variance fraction (%)0 50 100
OrderFamilyGenusSpeciesWithin
| 11Journal of EcologyBLONDER Et aL.
4 | DISCUSSION
Whilea largebodyofworkhas identified functions for leafvena-tionrelatedtohydraulics(Brodribbetal.,2010,2016;deBoeretal.,2012;Sack&Scoffoni,2013),ourresultsalsosuggestakeyroleforstructuralanddefensivefunctionsofvenationreticulation(Sack&Scoffoni, 2013).We found that PC1 (reconnecting vs. branching) reflected lower investment indefencecompoundsandPC2 (elon-gatedvs.compactareoles)reflectedlowerinvestmentinstructure.In contrast, PC3 (low vs. high density veins) reflected higher sitetemperature,consistentwithhydraulicfunctions.Indeed,anearlierstudy along this elevation gradient showed that vein density re-sponds strongly to temperature (R2=.5 at community-mean level;Blonder etal., 2017). However, the present study has now dem-onstratedthatthisfindingisonlyapartialcharacterizationforthephenotypicvariationoccurringalongthiselevationgradient.Othernon-hydraulic aspects of network architecture, and consequentlyothernon-climatepredictors, play amore important role andalso
haveverystrongcommunity-weightedmeantrait–environmentre-lationships(e.g.R2=.7forPC1vs.elevation).Amorecompleteun-derstandingofnetworkarchitecturemayrequireparsingtrade-offsamongstthesemultiplefunctions(deBoeretal.,2016),thatis,theamountofhydraulicperformancethatcanbesacrificedtoenhancestructuralordefenceperformance.
Therewereonlyweakdifferences in traitsbetweensunlitandshadedenvironments,especiallyforthescale-independenttraits.Itispossiblethatthispatternwasdrivenbylowwithin-speciesreplica-tion(anaverageof3.8±2.8SDsunand2.8±2.1SDshadebranchesperspecies).However,thelackofeffectsofconsistentdirectional-itysuggests that theabsenceofapattern isbiologically real.Onepossibleexplanation is thatveinpatterning is setearlyduring leafdevelopment,suchthatonlyscale-dependent traitscanvaryplas-ticallyviavariationincellexpansion.Thisperspectiveisconsistentwith extant knowledge for vascular development and leaf cellularphysiology(Sack&Scoffoni,2013).However,wedidnotfindconsis-tentsupportforalinkbetweenleafelongationandareoleelongation
FIGURE 5 Effectoflightavailabilityonreticulationtraits.Purplelinesindicatethedistributionofsunmeanminusshademeanvalueswithineachspecies,acrossallspecies–sitescombinationsforthewholedataset.Thenullexpectationofzeroisshownasablackline.Themeanoftheobserveddistributionisshownasasolidredverticallineifsignificantlydifferentfromzeroanddashedgreyifnot[Colourfigurecanbeviewedatwileyonlinelibrary.com]
−3 −2 −1 0 1 2 3
PC1 (reconnecting/branching veins)
p = .198
−1.0 −0.5 0.0 0.5 1.0 1.5
PC2 (elongated/compact areoles)
p = .087
−3 −2 −1 0 1 2
PC3 (low/high vein density)
p = .049
−0.05 0.00 0.05 0.10
Log areole elongation ratio
p = .090
−0.10 −0.05 0.00 0.05 0.10
Log areole circular ity ratio
p = .071
−0.4 −0.2 0.0 0.2 0.4
Log areole loop index
p = .020
−0.05 0.00 0.05
Log minimum spanning tree ratio
p = .851
−0.04 −0.02 0.00 0.02 0.04
Log meshedness ratiop = .425
−0.4 −0.2 0.0 0.2
Log freely ending veinlet ratiop = .746
−0.3 −0.2 −0.1 0.0 0.1 0.2
Log vein densityp = .016
−0.5 0.0 0.5
Log vein loopinessp = .008
Sun mean − shade mean
Pro
babi
lity
dens
ity
12 | Journal of Ecology BLONDER Et aL.
FIGURE 6 Elevationtrendsinprincipalcomponentandindividualreticulationtraitsfortheentiredataset.Greypointsrepresentindividualleaves;openpurplecirclesitemedians.Regressionlines(red)forsite-mediandataaredrawnwhenstatisticallysignificant[Colourfigurecanbeviewedatwileyonlinelibrary.com]
R2 .7
PC1 (reconnecting/branching veins)
05
10
R 2 .46
PC2 (elongated/compact areoles)
−10
−50
R2 R2
R2
R2
.87
PC3 (low/high vein density)
−20
24
6
Log areole elongation ratio
0.2
0.4
0.6
0.8
1.0
1.2
1.4
Log areole circularity ratio
−0.8
−0.6
−0.4
−0.2
.68
Log areole loop index
−2.0
−1.5
−1.0
−0.5
500 1000 1500 2000 2500 3000 3500
R 2 .58
Log minimum spanning tree ratio
−0.3
0−0
.20
−0.1
0
Log meshedness ratio
−0.0
50.
000.
05
.6
Log freely ending veinlet ratio
−1.5
−1.0
−0.5
0.0
.92
Log vein density
0.6
0.8
1.0
1.2
.86
Log vein loopiness
−0.5
0.0
0.5
1.0
1.5
2.0
500 1000 1500 2000 2500 3000 3500
Elevation (m)
R2
| 13Journal of EcologyBLONDER Et aL.
inthisdataset,whichwouldalsobeexpectedundersuchacellularexpansionprocess.ThispatternhasonlybeenshowninasmallcladeofHawaiian species (Blonderetal., 2016). Itmaybe that leaf sizeandshapeandvenationpatternscanbecomedecoupledviamultipledevelopmentalprocesses.
Additionally,we foundnoevidence thathigher reticulation leadstolowermaximumper-massphotosynthesisrates,asmighthavebeenexpected by an efficiency vs. redundancy trade-off (Corson, 2010;Katiforietal.,2010).Thisresultprobablyarisesbecausetheincreaseinhydraulicconductancefromincreasingminorveindensityislargerthantheincreaseincostfromincreasingthenumberofredundantveinsand(thusreticulationtraitslikeloopiness).Itmaybethatthecostsofredun-dantveinsbecomemoreimportantonlywhenconsideringlarger-scaleloopsinthenetwork,forexample,inprimaryandsecondaryveins.
Herbivorymayalsodirectlyinfluencereticulationtraits.Previouswork has suggested that reticulation can enhance damage resis-tance.Leafvenationpatternshavebeendemonstratedtoinfluenceleafmechanicalstrength(Enrico,Díaz,Westoby,&Rice,2016;Roth-Nebelsick etal., 2001;Zhang,Hongo,&Akimoto, 2004),which inturnarenegativelyrelatedtoherbivory (Coley,1983;Grubbetal.,2008;Nichols-Orians & Schultz, 1990; Pérez-Harguindeguy etal.,2003).Additionally, reticulationcanenhancedamageresilience,asdemonstratedbyexperimentalwoundingofspecieswithorwithoutloopsintheirveins(Katiforietal.,2010).However,directmeasure-mentsofherbivoreattackandsuccessrateswouldbeneededtode-terminewhetherreticulationaxesaredirectlylinkedtoperformanceincontemporarybioticcontexts.
4.1 | Quantifying variation in reticulation
Ourresultsalsohelpclarifythedimensionalityofreticulationtraitspace.We found that three axes capturedmore than 95%of the
variationforthe50familiesonthisAndes–Amazontransect.Theseaxes alsohave a clear interpretation: the first described a contin-uumofscale-independentbranching,thesecondaxisacontinuumof scale-independent areole compactness and the third axis thescale-dependent density of the network. While the importanceof network scale andminor vein density (PC3) in plant function-ing and community assembly has beenwidely acknowledged (e.g.Sack& Scoffoni, 2013), we found that scale-independent axes of reconnecting/branchingveins(PC1)andelongated/compactareoles(PC2)showedmorevariationinthisdataset.Palms,whicharedomi-nant inseveral sites,occupyanextremesetofvaluesalong theseaxes.However,theexclusionofpalmsdidnotqualitativelychangeourfindingsexceptthosebasedonevolutionaryposition.
Variationgenerallywasphylogeneticallyconservedatthegenuslevel and above, but also varied consistently at community scalealong the elevation gradient. This suggests that reticulation traitsdrive species sorting into local communities across environmentsand/orthathistoricalbiogeographicprocesseshaveledtotheradi-ationofcladeswithcertainreticulationtraitsonlyinsomeregions.
Wealsofoundonlylimitedevidencefordirectionalshiftsinre-ticulation traits over evolutionary time, asmost family-age vs. re-ticulationtraitrelationshipswerenotstatisticallysignificant.Whileincreasesinveindensityhavebeenobservedinmorerecentlyde-rivedcladeswithintheangiosperms(Boyceetal.,2009),reticulationmetrics showed weak patterns. Thus, it appears that high valuesof reticulation traits arepossible inbothnewandold angiospermclades.
Thestrongnicheconservatismofreticulationissurprising,giventhe apparent ease of evolution in these traits. The transition be-tween purely branching and reconnecting venation is apparentlynot difficult (Takhtajan, 1980) and has occurred independently inbothdirectionsmanytimesovermacroevolutionarytime(Wagner,
F IGURE 7 Relationshipsbetweenreticulationtraitaxesandmultipletraitandclimatepredictorvariables.BoxesindicatetheposteriordistributionoffixedeffectsforBayesianGLMMmodels.Theanalysisisscaledsuchthatavalueof+1indicatesthata1standarddeviation(SD)changeinapredictorresultsina1standarddeviation(SD)changeinthereticulationprincipalcomponent,afteraccountingforallphylogeneticeffectsandhierarchicalstructureinthedata.Distributionsareconcatenatedacross10resampledimputationsofthedataset.Significantfixedeffectsarehighlightedindarkblueandotherwiseshowninlightgrey.Estimatesareshownfor(a)PC1,(b)PC2and(c)PC3 [Colourfigurecanbeviewedatwileyonlinelibrary.com]
−1 0 1
Light environmentLog thickness
AmaxLog LMA
LDMCd13C
Log lamina areaTanninsPhenols
LigninMean annual temperatureMean annual precipitation
Log force to tearLog force to punch
Log leaf aspect r atio
(a) PC1 (reconnecting/branching veins)
Effect size−1 0 1
(b) PC2 (elongated/compact areoles)
Effect size−1 0 1
(c)
Effect size
PC3 (low/high vein density)
COLO
UR
14 | Journal of Ecology BLONDER Et aL.
1979). Rapid transitions in reticulation are seen via qualitativemetricswithin themonocots (Givnishetal.,2005)andwithquan-titativetraitswithintheHawaiiansilverswordalliance(Asteraceae;Carlquist,1959;Blonderetal.,2016).Transitionsmayoccurquicklybecausereticulationcanbeundersimplegeneticcontrol.InA. thali-ana, knockoutsof single genes are sufficient to shift fromawild-typereticulatepatterntoanopenpattern(Carland&Nelson,2004;Steynen&Schultz,2003).Similarly,studiesofvascularnetworkfor-mationinthesamespeciesshowthatsmalldevelopmentalchangesinauxingradientsandcanalizationcanleadtodramaticallydifferentreticulation trait values (Berleth,Mattsson,&Hardtke,2000).Wedonotyetunderstandhowtoreconciletheseobservationswiththisstudy.
Therearelikelytobeadditionalaxesrequiredtofullycharac-terizereticulationtraitspace.Thetraitswesurveyedarefocusedonlyontheminorveinsanddonotcontaininformationrelatedtobranchinganglesanddiameters,ortothenestingofloopsacrossveinorders,whicharealsoimportantcomponentsoftransporta-tion network architecture. Loops in secondary or tertiary veinsmayshowdifferentpatternsthantheminorveins.Potentialben-efits include reinforcementof leaf edges against tearing (Niklas,1999) or tolerance of large-scale hydraulic failure (Sack etal.,2008).Potentialcarboncostsarisebecauseofthelargemassin-vestmentinmajorveins(Johnetal.,2017).Suchvariationcouldbemeasuredviarecentlyproposedhierarchicalmetricsthatquantifyhowareolesarenestedwithinotherareoles(Katifori&Magnasco,2012;Mileyko,Edelsbrunner,Price,&Weitz,2012;Ronellenfitschetal.,2015).
Therehavebeenmanyhypothesesforthefunctionsofleafve-nation (Sack&Scoffoni,2013).This studynowdemonstrates thatmultiplehypothesesaresupported:ourdatashowthatvenationcanhave structural anddefensive functions aswell as hydraulic func-tions.Thus,patternsofreticulationmayindicatetheoutcomeofse-lectionformultiplefunctions.However,patternsofreticulationstillremainunmeasuredforthevastmajorityofplanttaxa,despitetheimportanceofvenationnetworksinmediatingplantcarbonuptakeandwaterlossworldwide.Systematicstudiesofreticulationacrossthe evolutionary tree will further unravel the drivers and conse-quencesofleafvenationnetworkarchitecture.
ACKNOWLEDG EMENTS
ThisworkisaproductoftheGlobalEcosystemsMonitoring(GEM)network (gem.tropicalforests.ox.ac.uk) the Andes BiodiversityandEcosystemsResearchGroupABERG(andesresearch.org),theAmazon Forest Inventory Network RAINFOR (www.rainfor.org)andtheCarnegieSpectranomicsProject (spectranomics.carnegi-escience.edu)researchconsortia.WethanktheServicioNacionaldeÁreasNaturalesProtegidasporelEstado(SERNANP)andper-sonnel ofManu and TambopataNational Parks for logistical as-sistanceandpermissiontowork intheprotectedareas.WealsothanktheExplorers’InnandthePontificalCatholicUniversityofPeruaswellasACCAfortheuseoftheTambopataandWayqecha
ResearchStationsrespectively.WeareindebtedtoProfessorEricCosio (PontificalCatholicUniversityofPeru) forassistancewithresearchpermissionsandsampleanalysisandstorage.Taxonomicwork at Carnegie Institution was facilitated by Raul Tupayachi,Felipe Sinca and Nestor Jaramillo. Frida Piper and several re-viewers improved previous drafts of this manuscript. The fieldcampaign was funded by a grant to Y.M. from the UK NaturalEnvironment Research Council (Grant NE/J023418/1), with ad-ditional support from European Research Council advanced in-vestigator grants GEM-TRAITS (321131), T-FORCES (291585)and a JohnD. andCatherine T.MacArthur Foundation grant toG.P.A. B.B. was supported by a United States National ScienceFoundation graduate research fellowship and doctoral disserta-tion improvement grant DEB-1209287 as well as a UK NaturalEnvironment Research Council independent research fellowshipNE/M019160/1. G.P.A. and the Spectranomics team were sup-portedbytheendowmentoftheCarnegieInstitutionforScienceandagrantfromtheNationalScienceFoundation(DEB-1146206).Y.M.wasalsosupportedbytheJacksonFoundation.S.D.andL.E.weresupportedbytheLeverhulmeTrust(UK)theInter-AmericanInstituteforGlobalChangeResearchandFONCyTandCONICET(Argentina).
AUTHORS’ CONTRIBUTIONS
Y.M. conceivedand received funding for the field campaign;N.S.,L.P.B., A.S. and T.E.B.E. led the implementation of the field cam-paign;G.P.A.,S.D.,B.J.E.andY.M.designedthefieldcampaign;B.B.,N.S.,Y.V.T.andP.O.C.P.contributedvenationanalyses;B.B.ledthestatisticalanalysisandwriting.Allauthorscontributedtogeneratingotherdatasets,towritingandtofieldwork.
DATA ACCE SSIBILIT Y
Data are deposited in the Dryad Digital Repository: https://doi.org/10.5061/dryad.33bf108 (Blonder etal., 2018). Venation net-work images are archived at http://www.clearedleavesdb.org/ (collection“KosñipataValley(CHAMBASAelevationtransect)”)andcanbesearchedusingthebranchandtreecodesinthedatafile.
ORCID
Benjamin Blonder http://orcid.org/0000-0002-5061-2385
Alexander Shenkin http://orcid.org/0000-0003-2358-9367
Brian J. Enquist http://orcid.org/0000-0002-6124-7096
R E FE R E N C E S
Agrawal,A.A.,&Konno,K. (2009). Latex:Amodel forunderstandingmechanisms,ecology,andevolutionofplantdefenseagainstherbiv-ory. Annual Review of Ecology Evolution and Systematics,40,311–331.https://doi.org/10.1146/annurev.ecolsys.110308.120307
Ainsworth,E.A.,&Gillespie,K.M. (2007).Estimationof totalpheno-lic content and other oxidation substrates in plant tissues using
| 15Journal of EcologyBLONDER Et aL.
Folin-Ciocalteu reagent. Nature Protocols, 2, 875–877. https://doi.org/10.1038/nprot.2007.102
Alvin,K.,&Chaloner,W.(1970).Parallelevolutioninleafvenation:Anal-ternativeviewofangiospermorigins.Nature,226,662–663.https://doi.org/10.1038/226662b0
Berleth, T.,Mattsson, J., & Hardtke, C. S. (2000). Vascular continuityand auxin signals. Trends in Plant Science, 5, 387–393. https://doi.org/10.1016/S1360-1385(00)01725-8
Blomberg,S.P.,Garland,T.,Ives,A.R.,&Crespi,B.(2003).Testingforphy-logeneticsignalincomparativedata:Behavioraltraitsaremorelabile.Evolution, 57, 717–745. https://doi.org/10.1111/j.0014-3820.2003.tb00285.x
Blonder, B., Baldwin, B. G., Enquist, B. J., & Robichaux, R. H. (2016).VariationandmacroevolutioninleaffunctionaltraitsintheHawaiiansilverswordalliance (Asteraceae). Journal of Ecology,104,219–228.https://doi.org/10.1111/1365-2745.12497
Blonder, B., Buzzard, V., Simova, I., Sloat, L., Boyle, B., Lipson, R., …Enquist,B.J. (2012).Theleaf-areashrinkageeffectcanbiaspaleo-climateandecologyresearch.American Journal of Botany,99,1756–1763.https://doi.org/10.3732/ajb.1200062
Blonder,B.,&Enquist,B.J.(2014).Inferringclimatefromangiospermleafvenationnetworks.The New Phytologist,204,116–126.https://doi.org/10.1111/nph.12780
Blonder, B., Salinas, N., Patrick Bentley, L., Shenkin, A., Chambi Porroa,P.,ValdezTejeira,Y.,…Malhi,Y. (2018).Data from:Structural anddefensive roles of angiosperm leaf venation network reticulationacrossanAndes-Amazonelevationgradient. Dryad Digital Repository,https://doi.org/10.5061/dryad.33bf108
Blonder,B.,Salinas,N.,PatrickBentley,L.,Shenkin,A.,OrlandChambiPorroa, P., Valdez Tejeira, Y., … Malhi, Y. (2017). Predicting trait-environment relationships for venation networks along an Andes-Amazon elevation gradient. Ecology, 98, 1239–1255. https://doi.org/10.1002/ecy.1747
Blonder,B.,Violle,C.,Bentley,L.P.,&Enquist,B.J.(2011).Venationnet-worksandtheoriginoftheleafeconomicsspectrum.Ecology Letters,14,91–100.https://doi.org/10.1111/j.1461-0248.2010.01554.x
Blonder,B.,Violle,C.,Bentley,L.P.,&Enquist,B.J.(2014).Inclusionofvein traits improves predictive power for the leaf economic spec-trum:AresponsetoSacketal.(2013).Journal of Experimental Botany,65,5109–5114.https://doi.org/10.1093/jxb/eru143
Blonder,B.,Violle,C.,&Enquist,B.J.(2013).Assessingthecausesandscalesof the leaf economics spectrumusingvenationnetworks inPopulus tremuloides. Journal of Ecology, 101, 981–989. https://doi.org/10.1111/1365-2745.12102
Boyce, C. K., Brodribb, T., Feild, T. S., & Zwieniecki, M. A. (2009).Angiosperm leaf vein evolution was physiologically and environ-mentally transformative.Proceedings of the Royal Society of London B: Biological Sciences, 276, 1771–1776. https://doi.org/10.1098/rspb.2008.1919
Brodribb,T. J.,Bienaimé,D.,&Marmottant,P. (2016).Revealing cata-strophic failure of leaf networks under stress. Proceedings of the National Academy of Sciences of the United States of America, 113,4865–4869.https://doi.org/10.1073/pnas.1522569113
Brodribb,T.,Feild,T.,&Jordan,G.(2007).Leafmaximumphotosyntheticrate and venation are linked by hydraulics. Plant Physiology, 144,1890.https://doi.org/10.1104/pp.107.101352
Brodribb, T., Feild, T. S.,& Sack, L. (2010).Viewing leaf structure andevolutionfromahydraulicperspective.Functional Plant Biology,37,488–498.https://doi.org/10.1071/FP10010
Buckley, T. N., John, G. P., Scoffoni, C., & Sack, L. (2015). How doesleaf anatomy influence water transport outside the xylem? Plant Physiology,168,1616–1635.https://doi.org/10.1104/pp.15.00731
Buuren,S.,&Groothuis-Oudshoorn,K. (2011).MICE:Multivariate im-putationbychainedequationsinR.Journal of Statistical Software,45,1–67.
CarinsMurphy,M.R.,Jordan,G.J.,&Brodribb,T.J.(2012).Differentialleaf expansion can enable hydraulic acclimation to sun andshade. Plant, Cell & Environment, 35, 1407–1418. https://doi.org/10.1111/j.1365-3040.2012.02498.x
CarinsMurphy,M.R.,Jordan,G.J.,&Brodribb,T.J.(2016).Cellexpan-sion not cell differentiation predominantly co-ordinates veins andstomata within and among herbs and woody angiosperms grownundersunandshade.Annals of Botany,118,1127–1138.https://doi.org/10.1093/aob/mcw167
Carland,F.M.,Defries,A.,Cutler,S.R.,&Nelson,T.(2015).NovelveinpatternsinArabidopsisinducedbysmallmolecules.Plant Physiology,170,338–353.
Carland, F. M., & Nelson, T. (2004). COTYLEDON VASCULARPATTERN2–mediatedinositol(1,4,5)triphosphatesignaltransduc-tionisessentialforclosedvenationpatternsofArabidopsisfoliaror-gans.Plant Cell,16,1263–1275.https://doi.org/10.1105/tpc.021030
Carlquist,S.(1959).VegetativeanatomyofDubautia,ArgyroxiphiumandWilkesia(Compositae).Pacific Science,13,195–210.
Choong,M., Lucas,P.,Ong, J., Pereira,B., Tan,H.,&Turner, I. (1992).Leaffracturetoughnessandsclerophylly:Theircorrelationsandeco-logical implications.The New Phytologist,121,597–610.https://doi.org/10.1111/j.1469-8137.1992.tb01131.x
Coley,P.D.(1983).Herbivoryanddefensivecharacteristicsoftreespe-ciesinalowlandtropicalforest.Ecological Monographs,53,209–234.https://doi.org/10.2307/1942495
Corson,F.(2010).Fluctuationsandredundancyinoptimaltransportnet-works.Physical Review Letters,104,048703.https://doi.org/10.1103/PhysRevLett.104.048703
deBoer,H.J.,Drake,P.L.,Wendt,E.,Price,C.,Schulze,E.-D.,Turner,N.C.,…Veneklaas,E.J.(2016).Over-investmentinleafvenationrelaxesmorphological constraints on photosynthesis in eucalypts. Plant Physiology,172, 2286–2299.https://doi.org/10.1104/pp.16.01313
deBoer,H.J.,Eppinga,M.B.,Wassen,M.J.,&Dekker,S.C. (2012).Acritical transition in leaf evolution facilitated the Cretaceous an-giosperm revolution.Nature Communications, 3, 1221. https://doi.org/10.1038/ncomms2217
Dodds,P.S.(2010).Optimalformofbranchingsupplyandcollectionnet-works.Physical Review Letters,104,048702.https://doi.org/10.1103/PhysRevLett.104.048702
Ellis,B.,Daly,D.,&Hickey,L.(2009).Manual of leaf architecture.Bronx,NY:NewYorkBotanicalGarden.
Enrico,L.,Díaz,S.,Westoby,M.,&Rice,B.L.(2016).Leafmechanicalre-sistanceinplanttraitdatabases:Comparingtheresultsoftwocom-monmeasurementmethods.Annals of Botany,117,209–214.https://doi.org/10.1093/aob/mcv149
Farquhar,G.D.,Ehleringer,J.R.,&Hubick,K.T.(1989).Carbonisotopediscriminationandphotosynthesis.Annual Review of Plant Physiology and Plant Molecular Biology, 40, 503–537. https://doi.org/10.1146/annurev.pp.40.060189.002443
Fiorin, L., Brodribb, T. J., & Anfodillo, T. (2016). Transport efficiencythroughuniformity:Organizationofveinsandstomatainangiospermleaves.The New Phytologist,209,216–227.https://doi.org/10.1111/nph.13577
Friel,J.J. (2000).Practical guide to image analysis.GeaugaCounty,OH:ASMInternational.
Gastauer,M.,&Meira-Neto,J.A.A.(2013).Avoidinginaccuraciesintreecalibration and phylogenetic community analysis using Phylocom4.2. Ecological Informatics, 15, 85–90. https://doi.org/10.1016/ j.ecoinf.2013.03.005
Gelman,A.(2006).Priordistributionsforvarianceparametersinhierar-chicalmodels(commentonarticlebyBrowneandDraper).Bayesian Analysis,1,515–534.https://doi.org/10.1214/06-BA117A
Girardin, C., Aragão, L., Malhi, Y., Huaraca Huasco, W., Metcalfe,D., Durand, L., …Whittaker, R. (2013). Fine root dynamics alongan elevational gradient in tropical Amazonian and Andean
16 | Journal of Ecology BLONDER Et aL.
forests. Global Biogeochemical Cycles, 27, 252–264. https://doi.org/10.1029/2011GB004082
Girardin,C.,Malhi,Y.,Feeley,K.,Rapp,J.,Silman,M.,Meir,P.,…Silva-Espejo,J. (2014).Seasonalityofabove-groundnetprimaryproduc-tivityalonganAndeanaltitudinaltransectinPeru.Journal of Tropical Ecology,30,503–519.https://doi.org/10.1017/S0266467414000443
Girardin,C.A.J.,Silva-Espejo,J.E.,Doughty,C.E.,HuaracaHuasco,W.,Metcalfe,D.B.,Durand-Baca,L.,…Malhi,Y.(2014).ProductivityandcarbonallocationinatropicalmontanecloudforestinthePeruvianAndes.Plant Ecology & Diversity,7,107–123.https://doi.org/10.1080/17550874.2013.820222
Givnish,T.(1979).Ontheadaptivesignificanceofleafform.InO.Solbrig,S.Jain,G.Johnson,&P.Raven(Eds.),Topics in plant population biology (pp.375–407).NewYork,NY:ColumbiaUniversityPress.https://doi.org/10.1007/978-1-349-04627-0
Givnish,T. J. (1988).Adaptation to sunand shade:Awhole-plantper-spective.Functional Plant Biology,15,63–92.
Givnish,T.J.,Pires,J.C.,Graham,S.W.,McPherson,M.A.,Prince,L.M.,Patterson,T.B.,…Sytsma,K.J.(2005).Repeatedevolutionofnetve-nationandfleshyfruitsamongmonocotsinshadedhabitatsconfirmsaprioripredictions:EvidencefromanndhFphylogeny.Proceedings of the Royal Society B, 272, 1481–1490. https://doi.org/10.1098/rspb.2005.3067
Grubb, P. J., Jackson, R. V., Barberis, I.M., Bee, J.N., Coomes,D. A.,Dominy,N. J.,…Vargas,O. (2008).Monocot leavesareeaten lessthandicot leaves intropical lowlandrainforests:Correlationswithtoughnessandleafpresentation.Annals of Botany,101,1379–1389.https://doi.org/10.1093/aob/mcn047
Hadfield, J.D. (2010).MCMCmethods formulti-responsegeneralizedlinearmixedmodels:TheMCMCglmmRpackage.Journal of Statistical Software,33,1–22.
Halladay,K.,Malhi,Y.,&New,M.(2012).CloudfrequencyclimatologyattheAndes/Amazontransition:1.Seasonalanddiurnalcycles.Journal of Geophysical Research: Atmospheres,117,D23.
Hendry,G.A.,&Grime,J.P.(1993).Methods in comparative plant ecology: A laboratory manual.Berlin,Germany:SpringerScience&BusinessMedia.https://doi.org/10.1007/978-94-011-1494-3
Hickey,L.J.,&Wolfe,J.A.(1975).Thebasesofangiospermphylogeny:Vegetativemorphology.Annals of the Missouri Botanical Garden,62,538–589.https://doi.org/10.2307/2395267
Horn,J.W.,Fisher,J.B.,Tomlinson,P.B.,Lewis,C.E.,&Laubengayer,K.(2009).Evolutionoflaminaanatomyinthepalmfamily(Arecaceae).American Journal of Botany,96,1462–1486.https://doi.org/10.3732/ajb.0800396
HuaracaHuasco,W., Girardin, C.,Doughty, C.,Metcalfe,D., Baca, L.,Silva-Espejo, J.,…Malhi,Y. (2014).Seasonalproduction,allocationandcyclingofcarbonintwomid-elevationtropicalmontaneforestplots in thePeruvianAndes.Plant Ecology & Diversity,7, 125–142.https://doi.org/10.1080/17550874.2013.819042
John,G.P.,Scoffoni,C.,Buckley,T.N.,Villar,R.,Poorter,H.,&Sack,L.(2017).Theanatomicalandcompositionalbasisofleafmassperarea.Ecology Letters,20,412–425.https://doi.org/10.1111/ele.12739
Jordan,G.J.,Brodribb,T.,Blackman,C.J.,&Weston,P.H.(2013).ClimatedrivesveinanatomyinProteaceae.American Journal of Botany,100,1483–1493.https://doi.org/10.3732/ajb.1200471
Kang,J.,&Dengler,N.(2004).Veinpatterndevelopmentinadultleavesof Arabidopsis thaliana. International Journal of Plant Sciences, 165,231–242.https://doi.org/10.1086/382794
Katifori, E.,&Magnasco,M.O. (2012).Quantifying loopynetwork ar-chitectures.PLoS ONE,7, e37994. https://doi.org/10.1371/journal.pone.0037994
Katifori, E., Szöllősi, G. J., & Magnasco, M. O. (2010). Damageand fluctuations induce loops in optimal transport networks.Physical Review Letters, 104, 048704. https://doi.org/10.1103/PhysRevLett.104.048704
Lambers,H.,&Poorter,H.(1992).Inherentvariationingrowthratebe-tweenhigherplants:Asearchforphysiologicalcausesandecologicalconsequences.Advances in Ecological Research,23,187–261.https://doi.org/10.1016/S0065-2504(08)60148-8
Makkar,H.P.,Blümmel,M.,Borowy,N.K.,&Becker,K.(1993).Gravimetricdetermination of tannins and their correlationswith chemical andprotein precipitation methods. Journal of the Science of Food and Agriculture,61,161–165.https://doi.org/10.1002/(ISSN)1097-0010
Malhi,Y.,Silman,M.,Salinas,N.,Bush,M.,Meir,P.,&Saatchi,S.(2010).Introduction:Elevationgradientsinthetropics:Laboratoriesforeco-systemecologyandglobalchange research.Global Change Biology,16,3171–3175.https://doi.org/10.1111/j.1365-2486.2010.02323.x
Manze, U. (1967). Die Nervaturdichte der Blätter als Hilfsmittel der Paläoklimatologie.Köln:GeologischesInstitutderUniversitätzuKöln.
McKown,A.D.,Cochard,H.,&Sack,L. (2010).Decoding leafhydrau-licswith a spatially explicitmodel: Principles of venation architec-tureandimplicationsforitsevolution.The American Naturalist,175,447–460.https://doi.org/10.1086/650721
Méndez-Alonzo,R.,Ewers,F.W.,&Sack,L.(2013).Ecologicalvariationinleafbiomechanicsanditsscalingwithtissuestructureacrossthreemediterranean-climate plant communities. Functional Ecology, 27,544–554.https://doi.org/10.1111/1365-2435.12059
Messier,J.,McGill,B.J.,&Lechowicz,M.J. (2010).Howdotraitsvaryacrossecologicalscales?Acasefortrait-basedecology.Ecology Letters,13,838–848.https://doi.org/10.1111/j.1461-0248.2010.01476.x
Mileyko, Y., Edelsbrunner, H., Price, C. A., & Weitz, J. S. (2012).Hierarchical ordering of reticular networks. PLoS ONE, 7, e36715.https://doi.org/10.1371/journal.pone.0036715
Mooney,H.,&Gulmon,S.(1982).Constraintsonleafstructureandfunc-tioninreferencetoherbivory.BioScience,32,198–206.https://doi.org/10.2307/1308943
Nardini,A.,Tyree,M.T.,&Salleo,S.(2001).XylemcavitationintheleafofPrunus laurocerasusanditsimpactonleafhydraulics.Plant Physiology,125,1700–1709.https://doi.org/10.1104/pp.125.4.1700
Nichols-Orians,C.M.,&Schultz,J.C.(1990).Interactionsamongleaftough-ness,chemistry,andharvestingbyattineants.Ecological Entomology,15,311–320.https://doi.org/10.1111/j.1365-2311.1990.tb00813.x
Niinemets,Ü.,Portsmuth,A.,&Tobias,M. (2007). Leaf shapeandve-nation pattern alter the support investmentswithin leaf lamina intemperatespecies:Aneglectedsourceofleafphysiologicaldifferen-tiation?Functional Ecology,21,28–40.
Niklas, K. J. (1999). A mechanical perspective on foliage leaf formand function. The New Phytologist, 143, 19–31. https://doi.org/10.1046/j.1469-8137.1999.00441.x
Ohtsuka,A., Sack, L.,&Taneda,H. (2018).Bundle sheath lignificationmediates the linkage of leaf hydraulics and venation. Plant, Cell & Environment,41,342–353.https://doi.org/10.1111/pce.13087
Oliveras,I.,Malhi,Y.,Salinas,N.,Huaman,V.,Urquiaga-Flores,E.,Kala-Mamani,J.,…Román-Cuesta,R.-M.(2014).Changesinforeststruc-tureandcompositionafterfireintropicalmontanecloudforestsneartheAndean treeline.Plant Ecology & Diversity,7,329–340.https://doi.org/10.1080/17550874.2013.816800
Onoda,Y., Schieving, F.,&Anten,N. P. R. (2008). Effects of light andnutrientavailabilityonleafmechanicalpropertiesofPlantago major: Aconceptualapproach.Annals of Botany,101,727–736.https://doi.org/10.1093/aob/mcn013
Pérez-Harguindeguy, N., Díaz, S., Garnier, E., Lavorel, S., Poorter,H., Jaureguiberry, P., … Steege, H.T. (2013). New handbook forstandardised measurement of plant functional traits worldwide.Australian Journal of Botany, 61, 167–234. https://doi.org/10.1071/BT12225
Pérez-Harguindeguy,N.,Díaz, S.,Vendramini, F., Cornelissen, J.H.C.,Gurvich,D. E., & Cabido,M. (2003). Leaf traits and herbivore se-lectioninthefieldandincafeteriaexperiments.Austral Ecology,28,642–650.https://doi.org/10.1046/j.1442-9993.2003.01321.x
| 17Journal of EcologyBLONDER Et aL.
Price,C.A.,Gilooly,J.F.,Allen,A.P.,Weitz,J.S.,&Niklas,K.J.(2010).The metabolic theory of ecology: Prospects and challenges forplant biology. The New Phytologist, 188, 696–710. https://doi.org/10.1111/j.1469-8137.2010.03442.x
Price,C.A.,&Weitz, J.S. (2014).Costsandbenefitsof reticulate leafvenation. BMC Plant Biology, 14, 234. https://doi.org/10.1186/s12870-014-0234-2
Read,J.,&Stokes,A.(2006).Plantbiomechanicsinanecologicalcontext.American Journal of Botany,93,1546–1565.https://doi.org/10.3732/ajb.93.10.1546
Ronellenfitsch,H.,Lasser,J.,Daly,D.C.,&Katifori,E.(2015).Topologicalphenotypesconstituteanewdimensioninthephenotypicspaceofleafvenationnetworks.PLoS Computational Biology,11,e1004680.https://doi.org/10.1371/journal.pcbi.1004680
Roth-Nebelsick,A.,Uhl,D.,Mosbrugger,V.,&Kerp,H.(2001).Evolutionandfunctionofleafvenationarchitecture:Areview.Annals of Botany,87,553–566.https://doi.org/10.1006/anbo.2001.1391
Sack,L.,Dietrich,E.M.,Streeter,C.M.,Sanchez-Gomez,D.,&Holbrook,N.M.(2008).Leafpalmatevenationandvascularredundancycon-fer tolerance of hydraulic disruption. Proceedings of the National Academy of Sciences of the United States of America,105,1567–1572.https://doi.org/10.1073/pnas.0709333105
Sack,L.,&Frole,K.(2006).Leafstructuraldiversityisrelatedtohydrauliccapacity intropicalrainforesttrees.Ecology,87,483–491.https://doi.org/10.1890/05-0710
Sack,L.,&Scoffoni,C.(2013).Leafvenation:Structure,function,devel-opment,evolution,ecologyandapplicationsinthepast,presentandfuture.The New Phytologist,198,983–1000.https://doi.org/10.1111/nph.12253
Sack, L., Scoffoni, C., John,G. P., Poorter,H.,Mason,C.M.,Mendez-Alonzo,R.,&Donovan,L.A.(2013).Howdoleafveinsinfluencetheworldwide leafeconomic spectrum?Reviewand synthesis. Journal of Experimental Botany,64,4053–4080.https://doi.org/10.1093/jxb/ert316
Sack,L.,Scoffoni,C.,Mckown,A.D.,Frole,K.,Rawls,M.,Havran,J.C.,…Tran,T.(2012).Developmentallybasedscalingofleafvenationarchi-tectureexplainsglobalecologicalpatterns.Nature Communications,3,837.https://doi.org/10.1038/ncomms1835
Sack, L., Streeter, C.M., & Holbrook, N.M. (2004). Hydraulic anal-ysis of water flow through leaves of sugar maple and red oak.Plant Physiology, 134, 1824–1833. https://doi.org/10.1104/pp.103.031203
Shenkin,A.,Bentley,L.P.,Girardin,C.,Blonder,B.,Boyle,B.,Doughty,C. E., … Malhi, Y. (2017). GEMTraits: A database and R packagefor accessingandanalyzingplant functional traits from theGlobalEcosystemsMonitoringNetwork.Oxford University Research Archive,https://doi.org/10.5287/bodleian:v0BD04N7o
Steynen,Q.J.,&Schultz,E.A.(2003).TheFORKEDgenesareessentialfordistalveinmeetinginArabidopsis.Development,130,4695–4708.https://doi.org/10.1242/dev.00689
Takhtajan, A. L. (1980). Outline of the classification of floweringplants (Magnoliophyta).Botanical Review,46, 225–359. https://doi.org/10.1007/BF02861558
Trivett,M.L.,&Pigg,K.B.(1996).Asurveyofreticulatevenationamongfossilandlivinglandplants.InD.W.Taylor&L.J.Hickey(Eds.),Flowering plant origin, evolution & phylogeny(pp.8–31).NewYork,NY:Chapman&Hall.
Uhl, D., & Mosbrugger, V. (1999). Leaf venation density as a cli-mate and environmental proxy: A critical review and new data.Palaeogeography, Palaeoclimatology, Palaeoecology, 149, 15–26.https://doi.org/10.1016/S0031-0182(98)00189-8
VanSoest,P. (1994).Nutritional ecology of the ruminant.NewYork,NY:CornellUniversityPress.
Vincent,J.F.(1982).Themechanicaldesignofgrass.Journal of Materials Science,17,856–860.https://doi.org/10.1007/BF00540384
vonEttingshausen,C.(1861).Die blatt-skelete der dikotyledonen.Wien:K.K.Hof-undstaatsdruckerei.
Wagner,W. H. (1979). Reticulate veins in the systematics of modernferns.Taxon,28,87–95.https://doi.org/10.2307/1219563
West,G.B.,Brown, J.H.,&Enquist,B. J. (1997).Ageneralmodel fortheoriginofallometricscalinglawsinbiology.Science,276,122–126.https://doi.org/10.1126/science.276.5309.122
Zhang,J.M.,Hongo,A.,&Akimoto,M. (2004).Physical strengthand itsrelation to leaf anatomical characteristics of nine forage grasses.Australian Journal of Botany, 52, 799–804. https://doi.org/10.1071/BT03049
Zwieniecki, M. A., Melcher, P. J., Boyce, C. K., Sack, L., & Holbrook,N. M. (2002). Hydraulic architecture of leaf venation in Laurus nobilis L. Plant, Cell & Environment, 25, 1445–1450. https://doi.org/10.1046/j.1365-3040.2002.00922.x
SUPPORTING INFORMATION
Additional Supporting Information may be found online in the supportinginformationtabforthisarticle.
How to cite this article:BlonderB,SalinasN,BentleyLP,etal.StructuralanddefensiverolesofangiospermleafvenationnetworkreticulationacrossanAndes–Amazonelevationgradient.J Ecol. 2018;00:1–17. https://doi.org/10.1111/1365-2745.12945