strub satellite oceanography
TRANSCRIPT

Ocean Remote Sensing from Satellites Ted Strub, Burt 406
http://cioss.coas.oregonstate.edu/CIOSS/
• General Background
• Examples, Measuring
– Surface Temperature
– Ocean Color/Optics
– Sea Surface Height
& Currents
– Surface Wind Stress
• New technology

http://response.restoration.noaa.gov/
Gulf Coast oil spill: Satellite “images” may “track” surface features: IR surface
temperatures, visible features, …??? What can we really see?

Early Days 1888 Remote Sensing Pioneers

Why Satellites? • Oceans are vast, sparsely occupied – satellites provide uniform
sampling, daily-to-monthly fields.
• Ship time is expensive
• Satellites can acquire measurements quickly over large areas
BUT…
• Space: a harsh environment for acquiring measurements
• Cost – Satellites are also expensive, but “global” (international)
• Risk – If satellites fail, service calls are even more expensive
• Must measure through intervening atmosphere
• Can‟t acquire sub-surface measurements
• Can only measure a half-dozen variables, at the “surface” –
• But: We can measure wind forcing and response


Ships take time to “map out” an area. The blue ship tracks take ~ 1-2 weeks in the case below. Patterns of cold water
(whiter shades) and currents change in 4 days between images.

The temperature field constructed from ship observations (circles, below
right) over a 1-week period shows some of the features evident in the
instantaneous satellite image (below left), without the detailed filaments and
swirls caused by jets and eddies in the currents, which the satellite field
captures in a “snapshot” (clouds allowing?) (August, 2000).


Components of a passive “SST” remote sensing system
Using IR or Microwave Wavelengths
signal raw data
processing /
dissemination calibration/
validation
sensor
IR or μ-wave
Emission
Two types of
remote sensing:
Passive

Components of an active radar “altimeter” system
For sea level: Transmit at nadir (directly beneath satellite)
source and sensor
signal raw data
processing /
dissemination calibration/
validation
Two types of
remote sensing:
Active
μ-wave radar
Reflection

Geostationary Orbit - GEO
36,000km altitude (wide view)
Stays over same location
Can document evolving systems
High temporal resolution
Lower spatial resolution?
Not necessarily – can “stare”
for longer exposures.
No polar coverage
“Polar” Orbit (Low Earth Orbit LEO)
850-1000 km altitude
Travels nearly over poles
Sees almost whole globe
Lower temporal resolution
Higher spatial resolution?
Not necessarily – limited time over
each point.
Orbits Determine Sampling

Examples of several types of orbits.
The Earth’s center of mass must be in the orbital plane – so Geostationary orbits
must be in the Equatorial plane. Low Earth Orbits are inclined from the
equatorial plane. Specialized orbits are used for different purposes.
• Sun-synchronous orbits cross the equator at the same time each solar day.
• Low inclination orbits are used to look more closely at tropical processes.
• Exact-repeat orbits fill in a grid of orbit tracks over X days, then repeat exactly.

A Global System of Geosynchronous Satellites
Geostationary Sampling: Easy to picture – a sequence of
images/fields from a fixed viewing geometry. Five satellites cover
the globe, maintained by nations that need the data. The first
“weather satellites” were essentially TV cameras in space. For the
first time, we could see distant storms developing and
approaching. The very first satellites carried film cameras and
were not looking at weather. How did the film get to earth?

Low Earth Orbits (“Polar Orbiting”): The orbital plane of the
satellite remains fairly constant while the earth rotates toward the east.
Subsurface tracks migrate to the west, ~ 25º longitude (2750 km).
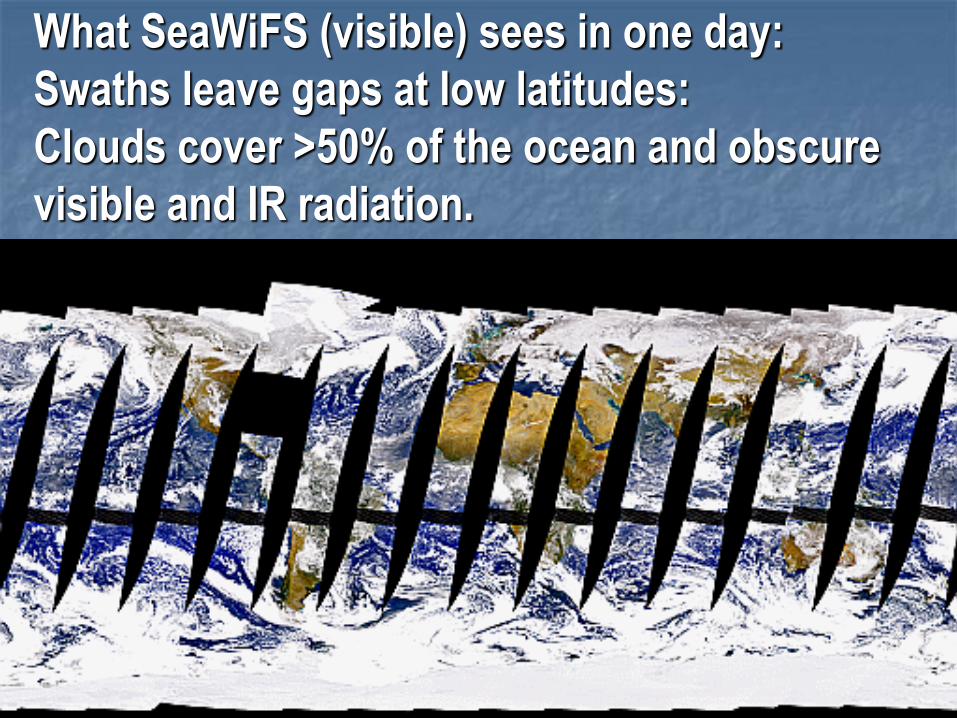
What SeaWiFS (visible) sees in one day:
Swaths leave gaps at low latitudes:
Clouds cover >50% of the ocean and obscure
visible and IR radiation.

“Space Junk”
1958-2008
50 Years of Orbital Trash
“Who you gonna call?”
WALL-E

Space Debris

Space Debris

Space Debris

Space Debris
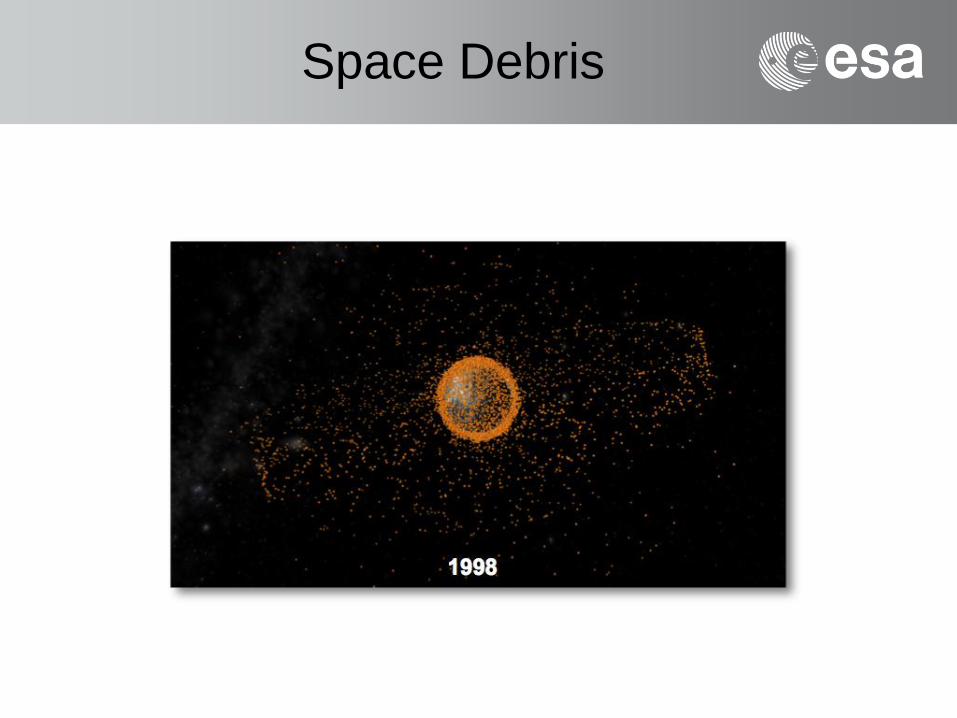
Space Debris

Space Debris

50

Specific Examples
Sea Surface Temperature (SST) Perhaps the most „standard‟ measurement from satellites
Passive meaurement. Traditionally used infrared (IR) emission
- strong signal, obscured by clouds
More recently using Microwave
- can see through clouds, but the signal is weak
- microwave also provides other data such as wind speed,
water vapor, rain, ice
Temperature is important because of its relationship to the heat
budget (global warming) and because it‟s diagnostic of
currents, upwelling etc…

Components of a passive “SST” remote sensing system
Using IR or Microwave Wavelengths
IR or μ-wave
Emission
signal raw data
processing /
dissemination calibration/
validation
sensor


Why Use Microwave?
Clouds!
Two-days of Infrared
Two-days of Microwave

IR SST: 26 Sept. 1998 Bathymetry
Surface Temperature: 1 km

Specific Examples
Ocean color (chlorophyll)
Passive measurement
Measures light scattered and transmitted upward through the
ocean surface - its „color‟ (careful to distinguish between
„transmission‟ and „reflection‟)
PROBLEM: Most of the signal (>90%) at the satellite is NOT
ocean color – It is atmospheric interference: sunlight that has
been scattered or reflected by molecules or aerosols in the
atmosphere back into the satellite‟s field-of-view.

Components of a passive “ocean color” remote sensing system
Using Visible wavelengths
source
signal raw data
processing /
dissemination calibration/
validation
sensor
Absorption and scattering
of visible light – depends
on pigments in the water
The “color” is the
wavelength that is
not absorbed!

SST: 26 Sept. 1998 Bathymetry Chl-a Pigment:
26-27 Sept. 1998
Surface Temperature and Chlorophyll: 1 km

Specific Examples
Sea Surface Height (SSH)
Active measurement using microwave radar
Pulse sent from satellite to earth, measure return time
With appropriate processing and averaging, it is possible
to calculate:
Ocean currents, eddies (scales > 60-100 km)
Deviations in ocean surface due to bathymetry
Gradual sea level rise due to global warming
Deviations in ocean surface due to internal physical
variability (heat, salinity)

Components of an active radar “altimeter” system
For sea level: Transmit at nadir (directly beneath satellite)
source and sensor
signal raw data
processing /
dissemination
calibration/
validation

Active Radar – Altimeter: Measures SSH ?what is that?
=SSHd
SSH=

SST: 26 Sept. 1998
Chl-a Pigment:
26-27 Sept. 1998
Surface Height, Temperature and Chlorophyll: 1 km SSH: 2 Altimeters
Sept. 1998

Specific Examples
Wind & Wind Stress (“tau” - τ)
Active measurement, using microwave radar to get “vector
winds” – speed and direction.
Pulse sent from satellite to ocean surface, then scattered
depending on surface roughness
Surface roughness (capillary waves) depends on wind
stress
Strength of return to satellite gives wind stress and
direction

Components of an active radar “scatterometer” system
For wind: Transmit at an angle
source and sensor
signal raw data
processing /
dissemination calibration/
validation


QuikSCAT Science: Ocean Circulation
QuikSCAT’s high resolution, extensive, and
frequent wind velocity measurements are
used to understand upper ocean circulation
from regional to global scales
• Wind stress is the largest momentum
input to the upper ocean
• Wind stress curl drives large-scale
surface currents
• Small-scale wind variability modifies
large-scale ocean circulation
• Coastal regions exhibit amplified
physical/biological response
• Wind forcing complements dynamic
and thermodynamic response
measurements


Altimeter and Scatterometer

Ocean Eddies as Habitat for Marine Mammals, Turtles, …
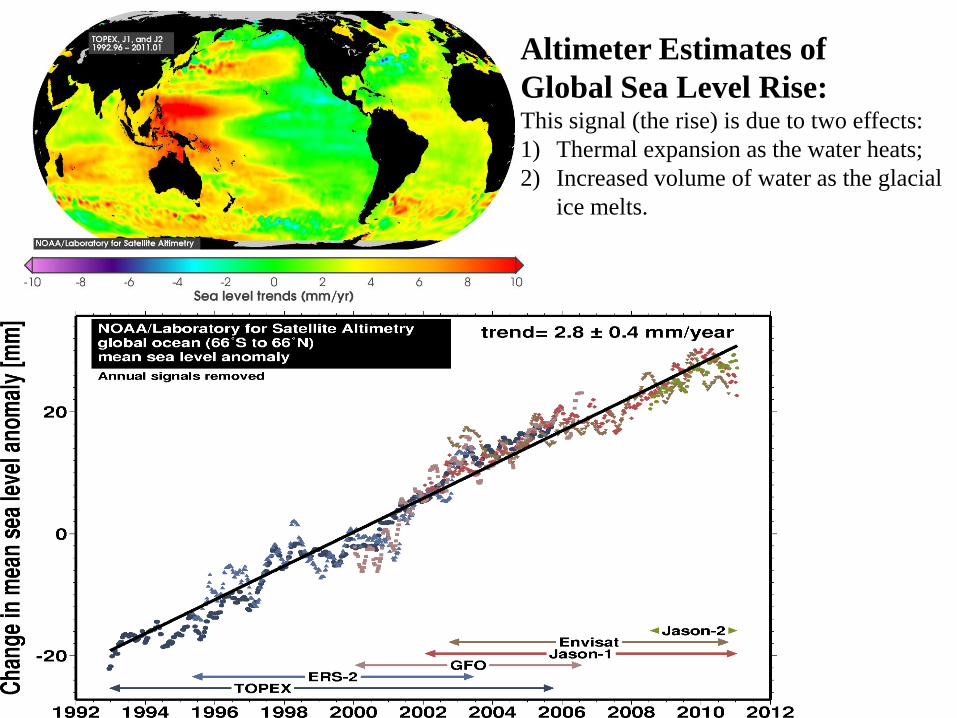
Altimeter Estimates of
Global Sea Level Rise: This signal (the rise) is due to two effects:
1) Thermal expansion as the water heats;
2) Increased volume of water as the glacial
ice melts.

Animations of Ocean Sea Surface Heights:
• “3-Pacific_SSH_1993-2011.mpg” This animation from NASA of sea
surface height (SSH) in the Pacific from 1993-2010 shows the
eastward movement of high SSH along the equator during the onset
of El Niño conditions (1997-98, 2006, 2009) and the westward
movement of eddies nearly everywhere else.
The animations described below may be available from Dudley Chelton
• An eddy next to California traps a subsurface float and carries it with
the eddy as it moves to the west. Passive plankton ecosystems are
also carried in this same fashion.
• Eddies in the global ocean are everywhere, mostly moving from east
to west, unless they are caught in a current moving more quickly to
the east.

8-day composites of GOES SST (right) and MODIS chlorophyll (left) over radar surface velocities during the period leading up to the forecast. (Middle) 2-day forecast SST and surface velocity (without data assimilation).
Computer Models of 3-D Currents and Temperature: Fishermen at Coos Bay use these fields to direct cruises

48
Computer Models of 3-D Currents and Temperature
Alongtrack altimeter SSH data (dots) are used to “correct” the
model. GOES satellite SST is used to verify the improvement of the
model SST fields.
prior (free-run) model SST
model SST after SSH assimilation
GOES daily SST (7/20/08), independent of model.

Future Technologies “Next generation” satellite sensors are being developed by NASA and NOAA.
• “Swath altimeters” will provide higher resolution SSH fields, closer to the
coast.
• “Interferometer” scatterometers will provide higher resolution wind fields,
closer to the coast.
• “Hyper-spectral” ocean color sensors will sample the full visible radiation
spectrum, allowing the identification of different types of phytoplankton,
including those responsible for “harmful algal blooms” that close regions to
the harvest of shellfish. These will also have higher resolution to retrieve
data farther up into rivers and estuaries.
• SST sensors will combine the IR and Microwave channels to provide all-
weather SST fields with higher resolution.
• These satellite data and in-water data from subsurface “observatories” will
be “assimilated” into 3-D models of the ocean‟s circulation to provide
predictions of currents, temperatures, oxygen (to warn of “dead zones”).
Need more skilled people to analyze data from these systems!!

Summary
Oceanography has traditionally faced a sampling limitation.
Satellites allow us to observe large areas quickly, but:
Only see the ocean surface;
Careful data calibration required for long term data sets.
Parameters include: SST, Surface Height, Winds, Ice, Chlorophyll,
Fluorescence (Productivity).
In the Atmosphere: Profiles: Temperature, Water Vapor, Rain, Ozone, CO2.
Recent Advances: Salinity (this year), Wind and Height data closer to the
coast and higher resolution; All-Weather SST; Hyperspectral data
New technologies collect subsurface data in the water – gliders, AUV.
Smaller and more power efficient sensors, more chemistry, more biology.
Computer models use all of these to predict accurate currents and
temperatures
Need skilled people to analyze data and advance the science!!

Web Sites
OSU/COAS: Cooperative Institute for Oceanographic Satellite Studies
http://cioss.coas.oregonstate.edu/CIOSS/
OSU/COAS/Ocean Optics/Color:
http://picasso.coas.oregonstate.edu/ORSOO/
NOAA Global Sea Level Rise: http://ibis.grdl.noaa.gov/SAT/slr/
U. Wisconsin Madison: Coop. Institute for Meteorological Satellite Studies
http://cimss.ssec.wisc.edu/
Jet Propulsion Laboratory (JPL/NASA) Physical Oceanography Data Center
http://podaac.jpl.nasa.gov/
NOAA Satellite Research & West Coast Satellite Data: “CoastWatch”
http://www.star.nesdis.noaa.gov/star/ & http://coastwatch.pfel.noaa.gov/
NASA Goddard Science Center – Satellite Data and Info & Ocean Color
http://disc.sci.gsfc.nasa.gov/ & http://oceancolor.gsfc.nasa.gov/
NASA Tutorial: http://rst.gsfc.nasa.gov/Front/overview.html

The End