stressdegradationbehaviorofpaliperidone ...downloads.hindawi.com/archive/2011/256812.pdfduring the...
TRANSCRIPT

SAGE-Hindawi Access to ResearchChromatography Research InternationalVolume 2011, Article ID 256812, 10 pagesdoi:10.4061/2011/256812
Research Article
Stress Degradation Behavior of Paliperidone,an Antipsychotic Drug, and Development of SuitableStability-Indicating RP-LC Method
Sanjay A. Jadhav,1, 2 Shashikant B. Landge,1 Pramod M. Choudhari,1
Pavankumar V. Solanki,1 Saroj R. Bembalkar,2 and Vijayavitthal T. Mathad1
1 Department of Research and Development, Megafine Pharma (P) Ltd., Nashik 422 202, India2 Department of Chemistry, Deogiri College, Aurangabad 431 004, India
Correspondence should be addressed to Vijayavitthal T. Mathad, [email protected]
Received 9 February 2011; Accepted 5 April 2011
Academic Editor: Wenkui Li
Copyright © 2011 Sanjay A. Jadhav et al. This is an open access article distributed under the Creative Commons AttributionLicense, which permits unrestricted use, distribution, and reproduction in any medium, provided the original work is properlycited.
A new, simple, rapid, and stability-indicating reversed phase liquid chromatographic (RP-LC) method for the determination ofboth assay and related substances in paliperidone has been developed and validated. During the forced degradation at hydrolysis,oxidative, photolytic, and thermal stressed conditions, the degradation was observed in the oxidative and acid stress conditions.Five process-related impurities (Imp-A to Imp-E) in test sample of paliperidone have been detected using newly developed RP-LCmethod. Among the five, Imp-C and Imp-D were found to be degrdants. Good resolution between the peaks corresponding todegradation and process-related impurities from the analyte was achieved on a Hypersil BDS C18 (250× 4.6 mm, 5 μm) column.The stress samples were assayed against a qualified reference standard, and the mass balance was found to be close to 99.0%. Themethod was validated as per ICH guideline and was found to be robust. The proposed RP-LC method was successfully applied tothe analysis of commercial formulation and was found to be specific and selective.
1. Introduction
Paliperidone, a major metabolite of risperidone (9-hydroxy-risperidone), has been approved by the FDA for the treat-ment of schizophrenia since 2006. Paliperidone is a centrallyactive dopamine D2 and serotinergic 5-HT2A antagonist. It isalso active as an antagonist at α1 and α2 adrenergic receptorsand H1-histaminergic receptors. Paliperidone has one chiralcentre but as the pharmacological profiles of the racemateand the two enantiomers are similar with respect to in vitrobinding assays, in vitro receptor occupancy studies and invivo functional interaction studies, hence, it is marketed inits racemic mixture [1–8]. Paliperidone is chemically de-signated as (±)-3-[2-[4-(6-fluoro-1,2-benzisoxazol-3-yl)-1-piperidinyl]ethyl]-6,7,8,9-tetrahydro-9-hydroxy-2-methyl-4Hpyrido[1,2-a]pyrimidin-4-one (Figure 1). It cor- re-sponds to the molecular formula, C23H27FN4O3, and its re-lative molecular mass is 426.49. The development of an accu-rate and efficient analytical method to determine the quality
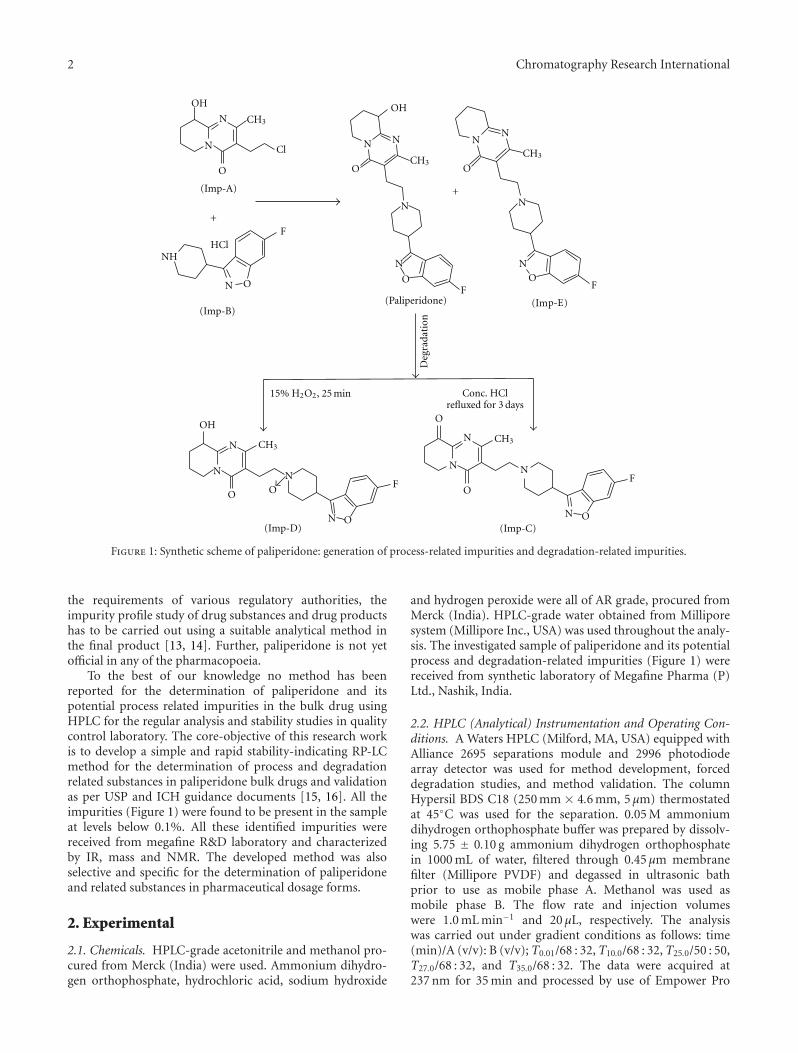
of the product is a critical activity during the processdevelopment of the product in generic companies asprocess is either improved continuously with the use of newreagents, intermediates, and so forth, or route of synthesisitself changes some time. During the study of syntheticprocess in our laboratory, we discovered five process-relatedimpurities, namely, Imp-A, Imp-B, Imp-C, Imp-D, andImp-E among them two impurities (Imp C and Imp D) werefound to be degradation-related as shown in Figure 1. TheImp-C was identified as metabolite (M-12) of paliperidone[9]. A literature survey revealed an HPTLC method forthe determination of paliperidone in formulations andfor in vitro release study [10]. Few other methods forthe quantitative determination of risperidone and 9-hydroxyrisperidone in biological samples have also beenreported [11, 12]. However, these papers were restricted tothe determination of paliperidone and the details of process-related impurities and degradation impurities formed underthe stress conditions employed were not discussed. As per
2 Chromatography Research International
(Imp-B)
(Imp-A)
(Imp-C)(Imp-D)
(Im )p-E
OH OH
OH
N
N
N
N
N
NN
N
N
N
N
N
N
N
NN
N
N
NCl
CH3
CH3CH3
CH3CH3
O
O
O
O
O
O
OO
O
O
O
O
FF
F
F F
+
+
(Paliperidone)
Deg
rada
tion
15% H2O2, 25 min
HClNH
Conc. HClrefluxed for 3 days
Figure 1: Synthetic scheme of paliperidone: generation of process-related impurities and degradation-related impurities.
the requirements of various regulatory authorities, theimpurity profile study of drug substances and drug productshas to be carried out using a suitable analytical method inthe final product [13, 14]. Further, paliperidone is not yetofficial in any of the pharmacopoeia.
To the best of our knowledge no method has beenreported for the determination of paliperidone and itspotential process related impurities in the bulk drug usingHPLC for the regular analysis and stability studies in qualitycontrol laboratory. The core-objective of this research workis to develop a simple and rapid stability-indicating RP-LCmethod for the determination of process and degradationrelated substances in paliperidone bulk drugs and validationas per USP and ICH guidance documents [15, 16]. All theimpurities (Figure 1) were found to be present in the sampleat levels below 0.1%. All these identified impurities werereceived from megafine R&D laboratory and characterizedby IR, mass and NMR. The developed method was alsoselective and specific for the determination of paliperidoneand related substances in pharmaceutical dosage forms.
2. Experimental
2.1. Chemicals. HPLC-grade acetonitrile and methanol pro-cured from Merck (India) were used. Ammonium dihydro-gen orthophosphate, hydrochloric acid, sodium hydroxide
and hydrogen peroxide were all of AR grade, procured fromMerck (India). HPLC-grade water obtained from Milliporesystem (Millipore Inc., USA) was used throughout the analy-sis. The investigated sample of paliperidone and its potentialprocess and degradation-related impurities (Figure 1) werereceived from synthetic laboratory of Megafine Pharma (P)Ltd., Nashik, India.
2.2. HPLC (Analytical) Instrumentation and Operating Con-ditions. A Waters HPLC (Milford, MA, USA) equipped withAlliance 2695 separations module and 2996 photodiodearray detector was used for method development, forceddegradation studies, and method validation. The columnHypersil BDS C18 (250 mm × 4.6 mm, 5 μm) thermostatedat 45◦C was used for the separation. 0.05 M ammoniumdihydrogen orthophosphate buffer was prepared by dissolv-ing 5.75 ± 0.10 g ammonium dihydrogen orthophosphatein 1000 mL of water, filtered through 0.45 μm membranefilter (Millipore PVDF) and degassed in ultrasonic bathprior to use as mobile phase A. Methanol was used asmobile phase B. The flow rate and injection volumeswere 1.0 mL min−1 and 20 μL, respectively. The analysiswas carried out under gradient conditions as follows: time(min)/A (v/v): B (v/v); T0.01/68 : 32, T10.0/68 : 32, T25.0/50 : 50,T27.0/68 : 32, and T35.0/68 : 32. The data were acquired at237 nm for 35 min and processed by use of Empower Pro
Chromatography Research International 3
data handling system. For the analysis of forced degradationsamples, the photodiode array detector was used in the scanmode from 200 nm to 400 nm. The peak homogeneity wasexpressed in terms of peak purity values.
2.3. Preparation of Solutions. A mixture of water and acetoni-trile in the ratio of 50 : 50 (v/v) was used as diluent in thepreparation of analytical solutions. A solution of paliperi-done was prepared at a concentration of 1000 μg mL−1
and 100 μg mL−1 in the diluent for related substancesdetermination and assay determination, respectively. Theindividual stock solutions of each impurity at concentrationabout 150 μg mL−1 (for impurities Imp-A, Imp-B, Imp-D,and Imp-E) and 500 μg mL−1 (for impurity Imp-C) werealso prepared in diluents, and those solutions were dilutedfurther adequately to study the validation attributes. Thespecification limits used for validation studies were 0.5% forthe related substance Imp-C and 0.15% for the remainingrelated substances, namely, Imp-A, Imp-B, Imp-D, and Imp-E. Hence the system suitability solution of all impuritieswas prepared at specification level by diluting above stocksolutions.
Formulation drug sample prepared as; ten weighedtablets of paliperidone (equivalent to 5 mg each of paliperi-done) were ground to powder and an equivalent of 25 mg ofactive ingredient dissolved in diluent in a 25 mL volumetricflask, ultra sonicated for about 10 min. and its volumemade up to the mark with the diluent, filtered throughMerck Nylon syringe filter having pore size 0.45 μm. Theclear liquid was collected and used for the determination ofrelated substances in the pharmaceutical dosage forms. Thissolution was ten-times diluted for the assay determination inpharmaceutical dosage forms.
2.4. Analytical Procedure. Paliperidone working referencestandard solution (1000 μg mL−1) spiked with all impuritiesat a speification level (w/w) was used as resolution mix-ture solution (RMS). 10.0 μL of blank, RMS, six replicateinjections of system suitability solution, and test samplesolution were separately chromatographed. A resolution ofnot less than 1.5 between paliperidone, and Imp-C was setas a system suitability requirement in RMS. The relativestandard deviation (RSD) of not more than 5.0% for Imp-A, Imp-B, Imp-C, Imp-D, and Imp-E peak areas obtainedfrom six replicate injections of system suitability solution isused to verify the system precision. All the known relatedsubstances Imp-A, Imp-B, Imp-C, Imp-D and Imp-E in testsample were determined against mean area of respectiveimpurities obtained from replicate injections of systemsuitability solution.
2.5. Procedure for Forced Degradation Study. The forceddegradation studies were conducted on bulk drug substancein order to prove the stability-indicating property andselectivity of the established method [17]. Forced degrada-tion of paliperidone drug substance was carried out underacid/base hydrolytic, oxidative, thermolytic, and photolyticstress conditions. Solutions were prepared by dissolving drug
substance in diluent and then treating with concentratedhydrochloric acid (refluxed for 3-days), aqueous 1 M sodiumhydroxide (refluxed for 12 h), and aqueous 15% hydrogenperoxide (kept for 25 min at RT). After the degradation,these solutions were diluted with diluent and analyzed in theproposed method. For thermal stress, sample of drug sub-stance was placed in a controlled temperature oven at 105◦Cfor 8-days. For photolytic stress, the sample was exposedin photolytic conditions for 10 days as per ICH guideline.After the exposure to the above stress conditions, solutions ofthese samples were prepared by dissolving respective samplesin diluent and diluted to the desired concentration andsubjected for analysis using the proposed method. All thestressed samples were quantified for paliperidone and theimpurities. Photodiode array detector was employed to checkand ensure the homogeneity and purity of paliperidone peakin all the stressed sample solutions. Assessment of mass bal-ance in the degraded samples was carried out to confirm theamount of impurities detected in stressed samples matcheswith the amount present before the stress was applied [18].
2.6. LC-MS Analysis. LC-MS analysis was carried out usingtriple quadrupole mass spectrometer (API 2000, PE SCIEX)coupled with a Shimadzu HPLC equipped with SPD 10A VPUV—vis detector and LC AT VP pumps (Foster city, CA,USA). Analyst software was used for data acquisition anddata processing. The turbo ion spray voltage was maintainedat 5.5 kV, and temperature was set at 375◦C. High purenitrogen gas was used as auxiliary gas and curtain gas. Zeroair was used as nebulizer gas. LC-MS spectra were acquiredfrom m/z 50 to 800 in 0.1 amu steps with 2.0 s dwell time.Paliperidone crude sample was subjected to LC-MS analysis.The analysis was carried out using a reversed phase columnKromasil C18, 250 mm × 4.6 mm, 5 μm. Mobile Phase Awas containing the mixture of buffer (0.05 M ammoniumacetate) and methanol in the ratio of 85 : 15 v/v. The MobilePhase B was containing buffer and methanol in the ratioof 35 : 65 v/v. Detection was carried out at 237 nm, andflow rate was kept at 1.0 mL min−1. Water and acetonitrilemixture in the ratio of 50 : 50 (v/v) was used as diluent. Dataacquisition time was 60 min. The gradient program was asfollows: time (min)/A (v/v): B (v/v); T0.0/100 : 0, T5.0/100 : 0,T35.0/0 : 100, T50.0/0 : 100, T51.0/100 : 0, and T60. 0/100 : 0. Fourrelated substances were detected in the laboratory crudepaliperidone batch sample. The masses of detected peakswere 243.1[(MH)+], 411.2[(MH)+], 443.1[(MH)+], and425.1[(MH)+]. Based on these mass values and syntheticscheme, the structures given in Figure 1 were suggested.
2.7. Characterization of Impurities
2.7.1. 1H NMR Spectroscopy. The 1H NMR spectra wererecorded on Bruker 300 MHz spectrometer using deuteratedchloroform as solvent and tetramethylsilane (TMS) as inter-nal standard.
2.7.2. Mass Spectrometry (MS). Mass spectra were recordedon Waters Micro mass-Quattro micro API mass spectrom-eter equipped with a quadrupole mass analyzer. Detection

4 Chromatography Research International
Table 1: Mass, FTIR spectral data, and 1H NMR chemical shift values.
Name of impurityMass value (m/z)
(MH)+FT-IR (KBr) absorptionbands (cm−1)
1H NMR chemical shift values, δ in ppm,(multiplicity, integration)
(1) Imp-A 210.63145.80, 2965.68, 1664.21,1531.82, 1486.08,1326.72, 1183.89
3.64–3.72 (t, 4H), 1.792–2.07 (m, 4H)4.43–4.45 (bs, 1H), 5.73 (s, 1H),2.28 (s, 3H), 2.87–2.91(t, 2H),
(2) Imp-B 221.53057.86, 2934.75, 2500.67,1612.45, 1417.35, 822.24
7.69–7.73 (dd, 1H), 8.12–8.17 (dd, 1H),7.29–7.36 (td, 1H), 3.50–3.55 (m, 1H),2.13–2.19 (dd, 4H), 3.02–3.11 (dd, 2H),3.35 (m, 1H), 9.30 (s, 1H)
(3) Imp-C 425.21721.52, 1655.23, 1608.81,1519.39, 1276.03, 959.64
2.20–2.27 (m, 2H), 2.32–2.38 (m, 4H),2.41 (s, 3H), 2.74–2.76 (t, 2H),3.02–3.07 (dd, 2H), 3.14–3.23 (m, 4H),3.48 (s, 1H), 3.73–3.76 (t, 2H),4.02–4.06 (t, 2H), 7.31–7.38 (td, 1H),7.72–7.75 (dd, 1H), 8.18–8.23 (dd, 1H)
(4) Imp-D 443.003399.9, 3054.70, 1638.38,1528.97, 1474.56, 1268.70,1117.65, 959.45
7.30–7.36 (td, 1H), 8.01–8.04 (dd, 1H),7.71–7.74 (dd, 1H), 1.78–2.03 (m, 6H),3.15–3.23 (m, 4H), 3.33–3.41 (m, 3H),3.00–3.04 (t, 2H), 3.60–3.71 (m, 1H),3.89–3.95 (td, 1H), 2.60–2.70 (d, 2H),4.45 (s, 1H), 2.29 (s, 3H), 5.98 (s, 1H)
(5) Imp-E 411.003059.07, 2942.22, 2757.28,1651.47, 1610.70, 1591.93,1536.55, 1270.52, 958.74
7.00–7.05 (td, 1H), 7.67–7.70 (dd, 1H),7.20–7.23 (dd, 1H), 3.01–3.08 (q, 1H),2.04–2.10 (m, 4H), 2.23–2.27 (td, 2H),2.50–2.54 (dd, 2H), 2.73-2.77 (dd, 2H),3.14–3.17 (t, 2H), 2.83–2.86 (t, 2H),3.89–3.92 (s, 2H), 1.84–1.89 (m, 2H),1.91–1.96 (m, 2H)
s, singlet; m, multiplet; t, triplet; d, doublet; td, triplet of doublet; q, quartet; bs, broad singlet.
of the ions was performed in electron spray ionization withpositive ion mode. Spectra were acquired from m/z 60 to 800in 0.1 amu steps with 10 numbers of scans.
2.7.3. Fourier Transform Infrared Spectroscopy (FT-IR). FT-IR spectra were recorded for all the five degradation andprocess-related impurities (Table 1) on Perkin Elmer model-spectrum one instrument using KBr pellet method.
2.8. Synthesis of Paliperidone. The reaction scheme for thesynthesis of paliperidone is shown in Figure 1 [19].
3. Results and Discussion
3.1. Detection of Impurities. Laboratory batches of crudepaliperidone were analyzed for their related substancesidentification using the developed RP-HPLC method. Thesesamples were subjected to LC-MS analysis. Based on theobserved mass, starting material and reactants used in thesynthetic scheme (Figure 1) the possible structures for relatedsubstances were assigned. The impurities (Imp-A, Imp-B,Imp-C, Imp-D, and Imp-E) were synthesized and coinjectedwith paliperidone to confirm the retention times. All the
related substances were well resolved from each other andthe representative chromatogram of spiked test preparationis shown in Figure 2. Among the identified impurities, Imp-A and Imp-B, the key starting materials in the process; Imp-C and Imp-D are the process as well as degradation relatedimpurity, Imp-E is a process related impurities (Figure 1).
3.2. Structural Elucidation. All impurities (Imp-A, Imp-B,Imp-C, Imp-D, and Imp-E) were characterized with the helpof MS, FT-IR, and NMR spectroscopic techniques. The mass,FT-IR spectral data, and 1H NMR chemical shift values ofthese impurities are presented in Table 1.
3.3. Development of Chromatographic Conditions. Thepresent study aims to develop the chromatographic systemcapable of eluting and resolving paliperidone, its processrelated and degradation related impurities (Imp-A, Imp-B,Imp-C, Imp-D, and Imp-E) within the short run timeand that complies with the general requirement of systemsuitability. The Imp-C and Imp-D were the degradationimpurities as well as process related impurities present inbulk samples produced in the process of paliperidone. Thecore objective of the chromatographic method is to get
Chromatography Research International 5
0
0.02
0.04
0.06
0.08
0.1
0.12
0 5 10 15 20 25 30 35(minutes)
AU
Palip
erid
one-
12.9
55
(a) Unspiked test sample
0
0.02
0.04
0.06
0.08
0.1
0.12
0 5 10 15 20 25 30 35(minutes)
AU
Palip
erid
one-
12.9
52
Imp-
B-8
.178
Im9.
873
Imp-
C-1
1.20
7
Imp-
D-1
7.56
8Im
p-E
-18.
489
p-A
-
(b) Spiked test sample
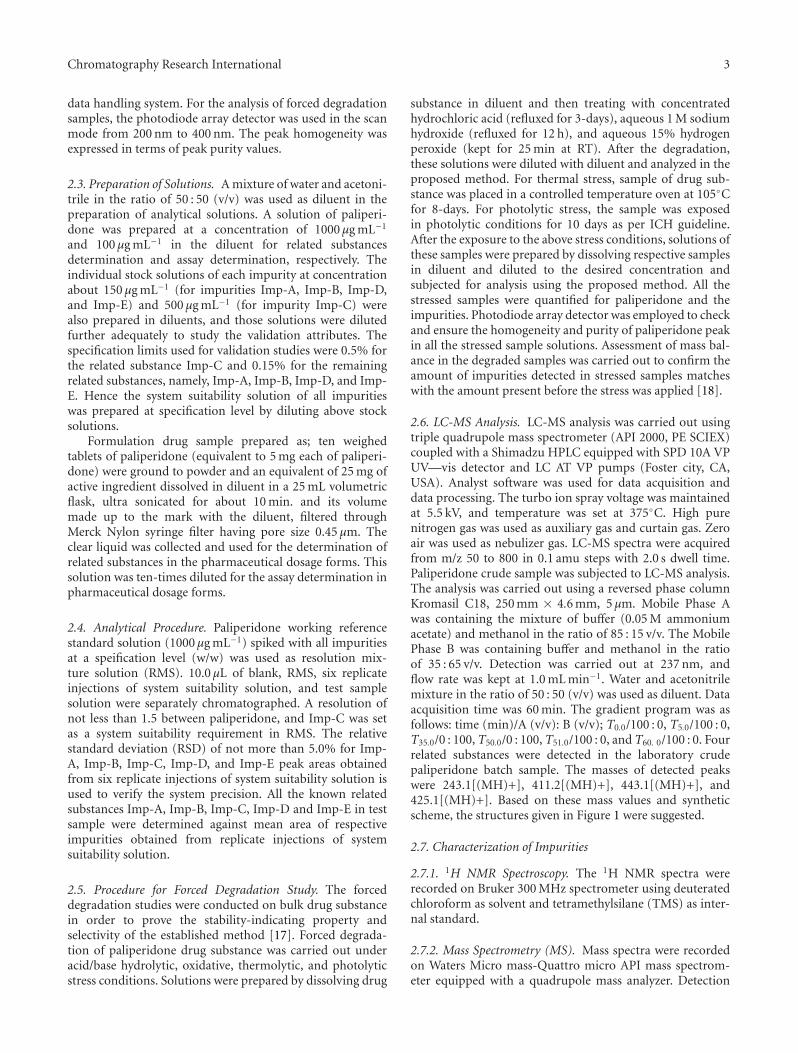
Figure 2: Typical RP-HPLC chromatograms of (a) paliperidone unspiked test preparation and (b) paliperidone spiked test preparation withknown impurities (Imp-A, Imp-B, Imp-C, Imp-D, and Imp-E).
the better peak shape of the paliperidone and its impuritiesalong with the separation of closely eluting peak pairs ofpaliperidone and Imp-C.
The preliminary investigations were conducted for theeffect of various parameters on system suitability of themethod. The parameters assessed include the detectionwavelength, the type and quantity of organic modifier, thecolumn, the salt concentration, the pH of mobile phase andcolumn temperature. Paliperidone has UV-absorption max-ima at about 237 nm wavelengths. Hence detection at 237 nmwas selected for method development purpose. Consideringthe fact that the dissociation constants of paliperidone arepKa1 = 8.2 (piperidine moiety) and pKa2 = 2.6 (pyrimidinemoiety) [8], the method development attempts were madein acidic mobile phase [20, 21]. The blend of the degradationproduct and potential impurities were used to optimizethe method. The first trial was carried out on an isocraticcondition by using reversed phase C18 column (Kromasil,5 μm, 250 × 4.6 mm) and a mixture of acetonitrile-buffer(0.05 M NH4H2PO4, pH 5.5 ) in the ratio of 60 : 40 v/v. Thesystem was found not suitable to separate the paliperidoneand its impurities, where the peak of paliperidone was elutedvery rapidly. As a means to increase the retention time,
the percentage of acetonitrile in the mobile phase decreasedfrom 60 to 20%. The result of this change showed that theretention time of paliperidone was not increased more buttailing factor was too high, and the paliperidone and Imp-C was coeluted. However, the increase of the modifier ratiowas associated by a decrease in the retention times of all thecompounds. By replacing the acetonitrile organic modifier,with methanol associated by a high tailing factor and longerretention times. Therefore, further method developmenttrials were performed on gradient mode. All the impuritiesand paliperidone were subjected to separation using gradientRP-LC on different columns (Kromasil C18, SB-Phenyl,Inertsil ODS, and Hypersil BDS C18) using different buffer(phosphate, acetate and formate) and organic modifier(acetonirile and methanol). Finally, satisfactory peak shapeand the resolution of closely eluting potential impurity wereachieved on a Hypersil BDS C18 column (250 × 4.6 mmand 5.0μm particle size), by using 0.05 M NH4H2PO4 as amobile phase-A and methanol as a mobile phase-B. The flowrate of the mobile phase was 1.0 mL min−1. The gradientprogram also played a vital role in the separation of all theanalyte peaks (Imp-A, Imp-B, Imp-C, Imp-D, Imp-E andpaliperidone) within the short time. The HPLC gradient
6 Chromatography Research International
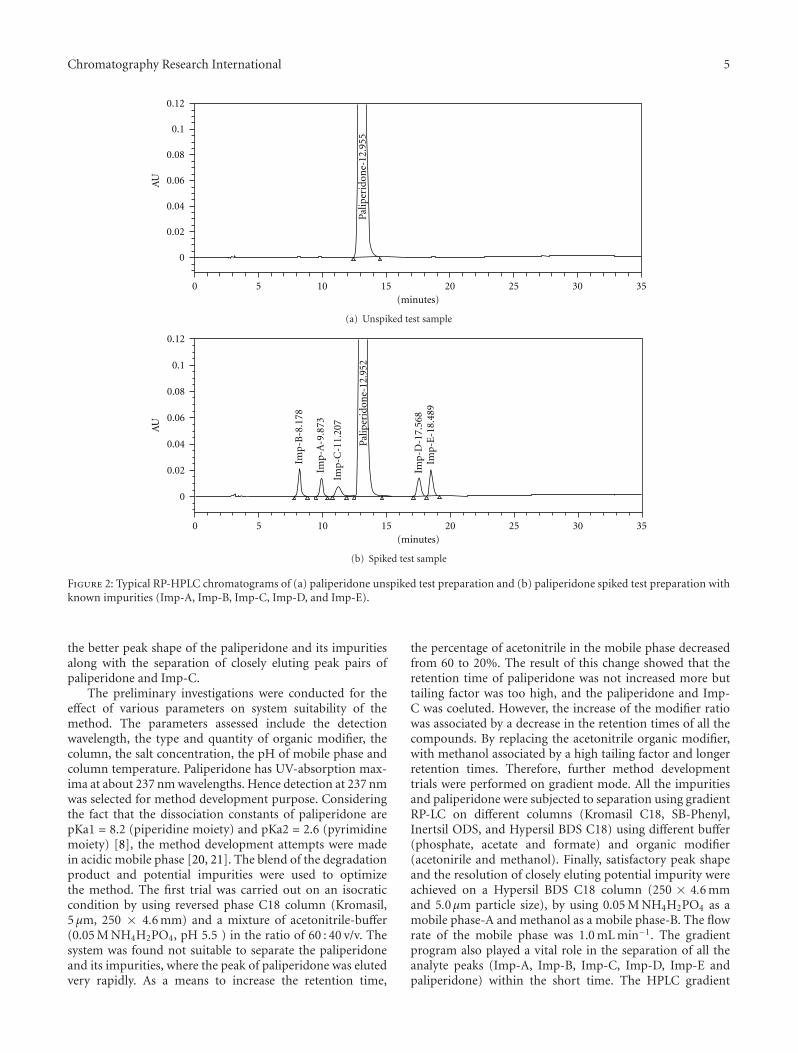
Table 2: System suitability test results.
Compound Resolution (Rs) USP tailing factor (T) RRT RF
Imp-B — 1.13 0.63 0.96
Imp-A 4.04 1.06 0.76 1.50
Imp-C 2.39 1.11 0.87 1.76
Paliperidone 2.06 1.17 1.00 1.00
Imp-D 7.19 1.06 1.37 1.12
Imp-E 2.15 1.17 1.43 0.96
RRT, relative retention time; RF, response factor.
Table 3: Forced degradation results.
Stress condition % assay of paliperidone % of degradant Observation and Mass balancePeak purity
PA PT
Undegraded 99.70 — 0.080 0.258
Acid hydrolysis (conc. HCl,4 h refluxed)
74.83 25.13
Increase in levels of Imp-A (1.25%)and Imp-C (13.01%) and other10.88 % of unknown degradationproduct formed (mass balance:99.96%)
0.226 0.251
Base hydrolysis(5 M NaOH, 48 h refluxed)
88.59 11.05
Increase in levels of Imp-A (0.31%),Imp-B (1.69%) and other 7.82 % ofunknown degradation productformed (mass balance: 99.00%)
0.195 0.248
Oxidation (6% H2O2 atRT)
72.11 27.77
Increase in levels of Imp-A (0.14%)and major degradation product,that is, Imp-D (24.51%) and other3.12 % of unknown degradationproduct formed (mass balance:99.64%)
0.079 0.250
Thermal (60◦C, 8-days) 99.85 NilNo any known and unknowndegradation product formed (massbalance: 100.3%)
0.078 0.258
Photolytic as per ICH 99.63 NilNo any known and unknowndegradation product formed (massbalance: 99.2%)
0.080 0.258
Mass balance = % assay + % sum of all impurities + % sum of all degradants. PA, purity angle; PT, purity threshold.
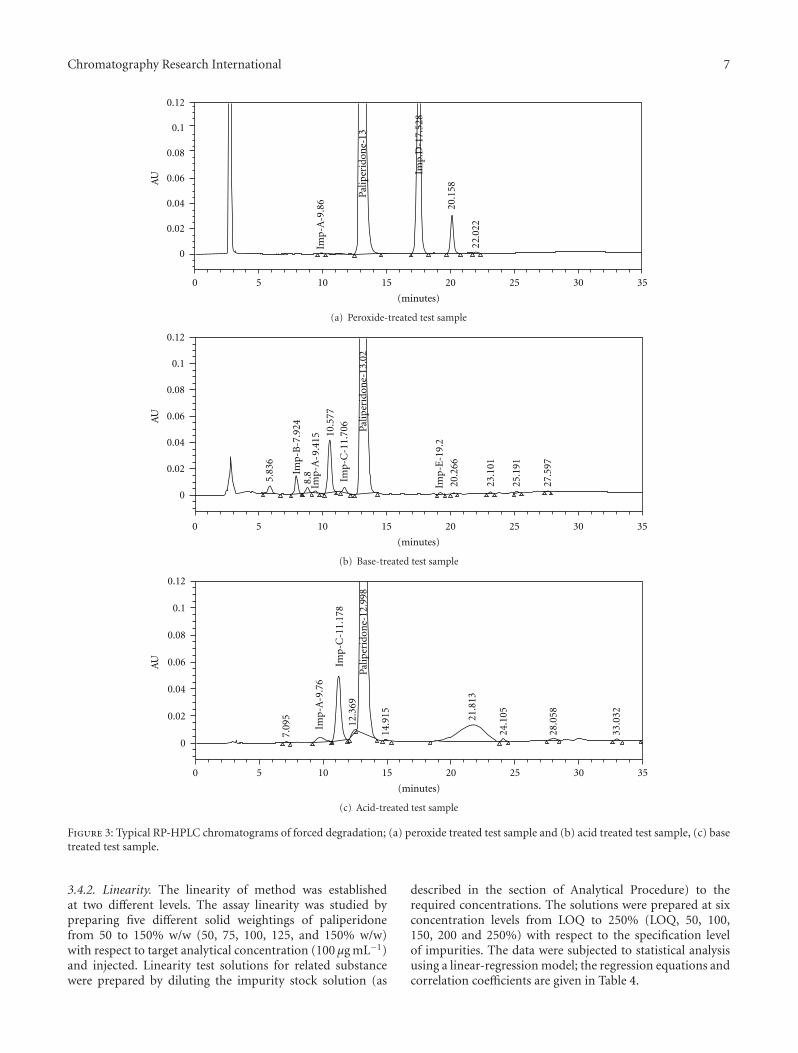
program was optimized as follows: time (min)/A (v/v): B(v/v); T0.01/68 : 32, T10.0/68 : 32, T25.0/50 : 50, T27.0/68 : 32 andT35.0/68 : 32. The column oven temperature was maintainedat 45◦C with PDA detector set at 237 nm. The highercolumn temperature in the procedure evidenced the relatedsubstances and paliperidone were stable throughout thecolumn separation process. In the optimized conditions itwas observed that paliperidone, Imp-A, Imp-B, Imp-C, Imp-D and Imp-E were well separated with a resolution greaterthan 2.0. A typical retention time of Imp-B, Imp-A, Imp-C, paliperidone, Imp-D and Imp-E were about 8.18, 9.87,11.21, 12.95, 17.57, 18.49, and 18.49 min, respectively shownin Figure 2(b). The system suitability results are shown inTable 2 and the developed HPLC method was found tobe specific for paliperidone, its process related impurities,and its degradation impurities (Figure 3). The optimized
method was validated as per ICH guidelines. The developedmethod was also applied to pharmaceutical formulations forthe determination of paliperidone and its related substances.
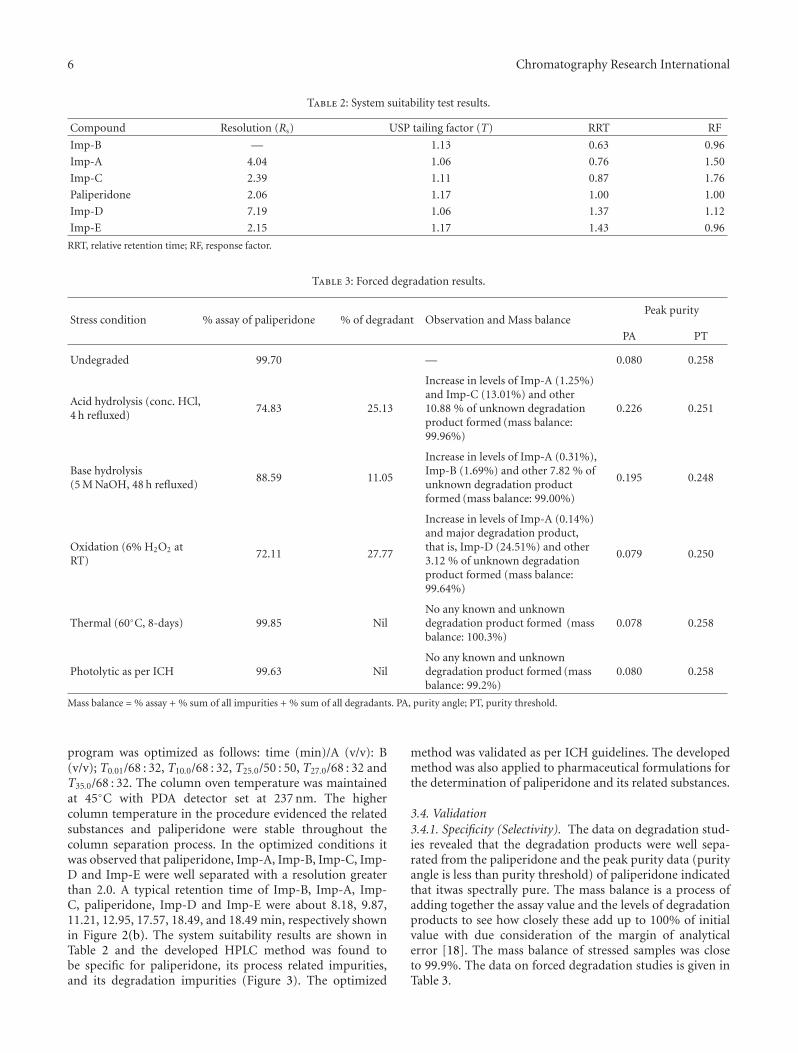
3.4. Validation3.4.1. Specificity (Selectivity). The data on degradation stud-ies revealed that the degradation products were well sepa-rated from the paliperidone and the peak purity data (purityangle is less than purity threshold) of paliperidone indicatedthat itwas spectrally pure. The mass balance is a process ofadding together the assay value and the levels of degradationproducts to see how closely these add up to 100% of initialvalue with due consideration of the margin of analyticalerror [18]. The mass balance of stressed samples was closeto 99.9%. The data on forced degradation studies is given inTable 3.
Chromatography Research International 7
0
0.02
0.04
0.06
0.08
0.1
0.12
0 5 10 15 20 25 30 35
(minutes)
AU
Palip
erid
one-
13
Imp.
D-1
7.52
8
20.1
58
2.0
222
Imp-
A-9
.86
(a) Peroxide-treated test sample
0
0.02
0.04
0.06
0.08
0.1
0.12
0 5 10 15 20 25 30 35
(minutes)
AU
5.83
6
8.8
-
10.5
77
Palip
erid
one-
13.0
2
20.2
66
23.1
01
25.1
91
27.5
97
9.41
5
Imp-
B-7
.924
Imp-
C-1
1.70
6
Imp-
E-1
9.2
Imp-
A
(b) Base-treated test sample
0
0.02
0.04
0.06
0.08
0.1
0.12
0 5 10 15 20 25 30 35
(minutes)
AU
7.09
5
12.3
69Pa
liper
idon
e-12
.998
14.9
15 21.8
13
24.1
05
28.0
58
33.0
32
Imp-
A-9
.76
Imp-
C-1
1.17
8
(c) Acid-treated test sample
Figure 3: Typical RP-HPLC chromatograms of forced degradation; (a) peroxide treated test sample and (b) acid treated test sample, (c) basetreated test sample.
3.4.2. Linearity. The linearity of method was establishedat two different levels. The assay linearity was studied bypreparing five different solid weightings of paliperidonefrom 50 to 150% w/w (50, 75, 100, 125, and 150% w/w)with respect to target analytical concentration (100 μg mL−1)and injected. Linearity test solutions for related substancewere prepared by diluting the impurity stock solution (as
described in the section of Analytical Procedure) to therequired concentrations. The solutions were prepared at sixconcentration levels from LOQ to 250% (LOQ, 50, 100,150, 200 and 250%) with respect to the specification levelof impurities. The data were subjected to statistical analysisusing a linear-regression model; the regression equations andcorrelation coefficients are given in Table 4.

8 Chromatography Research International
Table 4: Validation data results of related substances and assay of paliperidone.
CompoundRelated substances results Assay results
IMP-A IMP-B IMP-C IMP-D IMP-E paliperidone
Precision (mean results ±%RSD)
Method precision (n = 6)0.164±
1.240.163±
0.610.546±
3.850.149±
0.670.059±
1.6999.0± 0.21
Intermediate Precision (n = 6)0.158±
0.630.159±
0.000.526±
0.570.151±
0.660.062±
0.00100.3± 0.35
Overall results (n = 12)0.160±
1.250.161±
1.240.536±
3.390.150±
1.330.061±
3.2899.7± 0.75
Limit of detection (LOD)
LOD (μg mL−1) 0.030 0.039 0.155 0.071 0.046 0.065
LOD (% w.r.t. test) 0.003 0.004 0.016 0.007 0.005 0.007
Limit of quntitations (LOQ)
LOQ (μg mL−1) 0.090 0.119 0.470 0.214 0.141 0.197
LOQ (% w.r.t. test) 0.009 0.012 0.047 0.021 0.014 0.020
Linearity: for related substances LOQ to 250% of specification level and for assay 50 to 150% of TAC
Correlation coefficient (r) 0.99966 0.99978 0.99973 0.99936 0.99925 0.99996
Slope 22910.49 35819.23 19598.94 30803.29 36086.78 31580.49
Intercept −100.38 −653.37 1214.32 −172.37 −631.62 −1131.83
Accuracy (mean recovery ±%RSD): LOQ to 150 % of specification level
LOQ92.59±
6.9386.11±
5.59106.51±
7.3690.48±
5.2792.31±
8.33—
50%93.86±
2.1495.22±
0.75114.93±
1.04100.00±
1.3591.11±
1.69—
100%104.17±
1.9397.60±
0.77107.54±
0.6899.55±
1.4294.67±
0.70—
150%103.36±
0.6597.68±
0.51104.37±
0.4499.85±
1.4494.81±
0.54—
% w.r.t. test LOD LOQ values are in % with respect to test concentration of 1000 μg mL−1.TAC, Target analytical concentration that is, 100 μg mL−1.
The RF of each impurity was determined using the slopeof the paliperidone plot against each impurity plot. The Y-intercept of each plot was within the 2.5% of the response at0.15% w/w level of each impurity, describing that the plot isgoing almost through the origin.
3.4.3. Limits of Detection and Quantitation (LOD and LOQ).The limit of detection and limit of quantitation were deter-mined for paliperidone and for each of the related substancesas per ICH Q2R1 guideline from the standard deviationof the peak areas and slope of linearity data. The valuesof LOD and LOQ for paliperidone were 0.065 μg mL−1,0.197 μg mL−1 and they were for related substances, inthe ranges, 0.030–0.155 μg mL−1 and 0.090–0.470 μg mL−1
respectively. The calculated LOQ concentrations of all thecomponents were verified for precision by injecting sixindividual preparations of Imp-A, Imp-B, Imp-C, Imp-D,Imp-E, and paliperidone.The RSD of LOQ precision was inthe range of 1.22–9.78%. These limits of quantification levelsof the impurities were helpful for the process research workto control the impurities at the accepted level during the opti-mization of the process. The results were depicted in Table 4.
3.4.4. Precision. System precision for assay method wasverified by injecting the six replicate injections of standardconcentration (50 μg mL−1), and RSD of paliperidone peakarea was evaluated and found to be 0.20%. System precisionfor related substances determination was verified by systemsuitability solution, which was analyzed for six times, andRSD of paliperidone and all impurities peak areas wasevaluated and found to be 2.04%.
Precision of the method was studied for method preci-sion and intermediate precision. The assay method preci-sion was examined by analysing six determinations of thesample solution at working concentration versus a standardconcentration, and RSD of obtained results was evaluatedand found to be 0.21%. Related substances method precisionwas demonstrated by analyzing six separate paliperidonesample solutions that were prepared by spiking the relatedsubstances namely, Imp-A, Imp-B, Imp-C, and Imp-D atspecification level. The RSD (0.61–3.85%, n = 6) foreach related substance was evaluated. In the intermediateprecision study, the similar procedure of method precisionwas carried out by a different analyst, using different mobilephase and diluent preparations and instrument on a different
Chromatography Research International 9
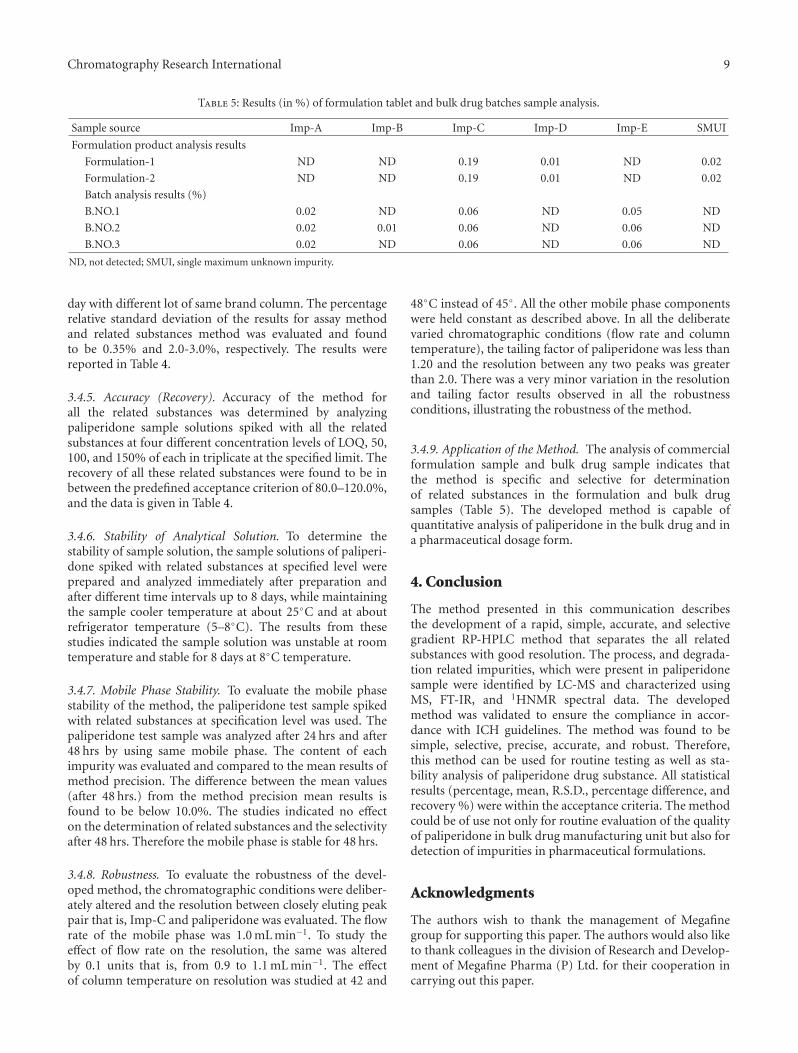
Table 5: Results (in %) of formulation tablet and bulk drug batches sample analysis.
Sample source Imp-A Imp-B Imp-C Imp-D Imp-E SMUI
Formulation product analysis results
Formulation-1 ND ND 0.19 0.01 ND 0.02
Formulation-2 ND ND 0.19 0.01 ND 0.02
Batch analysis results (%)
B.NO.1 0.02 ND 0.06 ND 0.05 ND
B.NO.2 0.02 0.01 0.06 ND 0.06 ND
B.NO.3 0.02 ND 0.06 ND 0.06 ND
ND, not detected; SMUI, single maximum unknown impurity.
day with different lot of same brand column. The percentagerelative standard deviation of the results for assay methodand related substances method was evaluated and foundto be 0.35% and 2.0-3.0%, respectively. The results werereported in Table 4.
3.4.5. Accuracy (Recovery). Accuracy of the method forall the related substances was determined by analyzingpaliperidone sample solutions spiked with all the relatedsubstances at four different concentration levels of LOQ, 50,100, and 150% of each in triplicate at the specified limit. Therecovery of all these related substances were found to be inbetween the predefined acceptance criterion of 80.0–120.0%,and the data is given in Table 4.
3.4.6. Stability of Analytical Solution. To determine thestability of sample solution, the sample solutions of paliperi-done spiked with related substances at specified level wereprepared and analyzed immediately after preparation andafter different time intervals up to 8 days, while maintainingthe sample cooler temperature at about 25◦C and at aboutrefrigerator temperature (5–8◦C). The results from thesestudies indicated the sample solution was unstable at roomtemperature and stable for 8 days at 8◦C temperature.
3.4.7. Mobile Phase Stability. To evaluate the mobile phasestability of the method, the paliperidone test sample spikedwith related substances at specification level was used. Thepaliperidone test sample was analyzed after 24 hrs and after48 hrs by using same mobile phase. The content of eachimpurity was evaluated and compared to the mean results ofmethod precision. The difference between the mean values(after 48 hrs.) from the method precision mean results isfound to be below 10.0%. The studies indicated no effecton the determination of related substances and the selectivityafter 48 hrs. Therefore the mobile phase is stable for 48 hrs.
3.4.8. Robustness. To evaluate the robustness of the devel-oped method, the chromatographic conditions were deliber-ately altered and the resolution between closely eluting peakpair that is, Imp-C and paliperidone was evaluated. The flowrate of the mobile phase was 1.0 mL min−1. To study theeffect of flow rate on the resolution, the same was alteredby 0.1 units that is, from 0.9 to 1.1 mL min−1. The effectof column temperature on resolution was studied at 42 and
48◦C instead of 45◦. All the other mobile phase componentswere held constant as described above. In all the deliberatevaried chromatographic conditions (flow rate and columntemperature), the tailing factor of paliperidone was less than1.20 and the resolution between any two peaks was greaterthan 2.0. There was a very minor variation in the resolutionand tailing factor results observed in all the robustnessconditions, illustrating the robustness of the method.
3.4.9. Application of the Method. The analysis of commercialformulation sample and bulk drug sample indicates thatthe method is specific and selective for determinationof related substances in the formulation and bulk drugsamples (Table 5). The developed method is capable ofquantitative analysis of paliperidone in the bulk drug and ina pharmaceutical dosage form.
4. Conclusion
The method presented in this communication describesthe development of a rapid, simple, accurate, and selectivegradient RP-HPLC method that separates the all relatedsubstances with good resolution. The process, and degrada-tion related impurities, which were present in paliperidonesample were identified by LC-MS and characterized usingMS, FT-IR, and 1HNMR spectral data. The developedmethod was validated to ensure the compliance in accor-dance with ICH guidelines. The method was found to besimple, selective, precise, accurate, and robust. Therefore,this method can be used for routine testing as well as sta-bility analysis of paliperidone drug substance. All statisticalresults (percentage, mean, R.S.D., percentage difference, andrecovery %) were within the acceptance criteria. The methodcould be of use not only for routine evaluation of the qualityof paliperidone in bulk drug manufacturing unit but also fordetection of impurities in pharmaceutical formulations.
Acknowledgments
The authors wish to thank the management of Megafinegroup for supporting this paper. The authors would also liketo thank colleagues in the division of Research and Develop-ment of Megafine Pharma (P) Ltd. for their cooperation incarrying out this paper.
10 Chromatography Research International
References
[1] A. Schotte, P. F. M. Janssen, W. Gommeren et al., “Risperidonecompared with new and reference antipsychotic drugs: in vitroand in vivo receptor binding,” Psychopharmacology, vol. 124,no. 1-2, pp. 57–73, 1996.
[2] A. A. H. P. Megens and F. H. L. Awouters, “In vivo pharmaco-logical profile of 9-hydroxyrisperidone, the major metaboliteof the novel antipsychotic risperidone,” Drug DevelopmentResearch, vol. 33, no. 4, pp. 399–412, 1994.
[3] N. Yasui-Furukori, M. Hidestrand, E. Spina, G. Facciola, M.G. Scordo, and G. Tybring, “Different enantioselective 9-hydroxylation of risperidone by the two human CYP2D6 andCYP3A4 enzymes,” The American Society for Pharmacologyand Experimental Therapeutics, vol. 29, no. 10, pp. 1263–1268,2001.
[4] S. Tianmei, S. Liang, L. Yi, S. Yun’Ai, G. Chunmei, and Z.Hongyan, “Single-dose pharmacokinetics of paliperidoneextended release tablets in healthy Chinese subjects,” HumanPsychopharmacology: Clinical and Experimental, vol. 25, no. 5,pp. 404–409, 2010.
[5] M. P. Corena-McLeod, A. Oliveros, C. Charlesworth et al.,“Paliperidone as a mood stabilizer: a pre-frontal cortex syn-aptoneurosomal proteomics comparison with lithium andvalproic acid after chronic treatment reveals similaritiesin protein expression,” Brain Research, vol. 1233, pp. 8–9,2008.
[6] G. Marchese, B. Pittau, G. Casu et al., “A comparison ofcontinuous subcutaneous paliperidone infusion and repeatedsubcutaneous injection of risperidone free-base in rats,”European Psychiatry, vol. 25, no. 2, pp. 92–100, 2010.
[7] R. Arakawa, H. Ito, A. Takano et al., “Dose-finding study ofpaliperidone ER based on striatal and extrastriatal dopamineD2 receptor occupancy in patients with schizophrenia,”Psychopharmacology, vol. 197, no. 2, pp. 229–235, 2008.
[8] Product Monograph, “Paliperidone, Extended release tablets3 mg, 6 mg and 9 mg, http://www.janssen-ortho.com/JOI/pdffiles/Invega E.pdf.
[9] M. Vermeir, I. Naessens, B. Remmerie et al., “Absorption,metabolism, and excretion of paliperidone, a new mono-aminergic antagonist, in humans,” The American Society forPharmacology and Experimental Therapeutics, vol. 36, no. 4,pp. 769–779, 2008.
[10] R. B. Patel, M. R. Patel, K. K. Bhatt, and B. G. Patel, “HPTLCmethod development and validation: quantification ofpaliperidone in formulations and in vitro release study,”Analytical Methods, vol. 2, pp. 525–531, 2010.
[11] B. Cabovska, S. L. Cox, and A. A. Vinks, “Determinationof risperidone and enantiomers of 9-hydroxyrisperidone inplasma by LC-MS/MS,” Journal of Chromatography B, vol.832, no. 1-2, pp. 497–504, 2007.
[12] R. Woestenborghs, W. Lorreyne, F. Van Rompaey, and J.Heykants, “Determination of risperidone and 9-hydroxyris-peridone in plasma, urine and animal tissues by high-performance liquid chromatography,” Journal of Chromato-graphy, vol. 583, no. 2, pp. 223–230, 1992.
[13] “Impurities in new drug substances,” in Proceedings of theInternational Federation of Pharmaceutical Manufactures& Associations (IFPMA ’06), International Conference onHarmonization (ICH), Geneva, Switzerland, October 2006,Methodology Q3A(R2).
[14] “Good manufacturing practice guide for active pharmaceuti-cal ingredients,” in Proceedings of the International Federationof Pharmaceutical Manufactures & Associations (IFPMA ’05),International Conference on Harmonization (ICH), Geneva,Switzerland, November 2005, Methodology Q7A.
[15] The United States Pharmacopeia, Validation of CompendialMethods, section 1225, The United States Pharmacopeia(USP), Rockville, Md, USA, 32nd edition, 2009.
[16] “Validation of analytical procedure,” in Proceedings of theInternational Federation of Pharmaceutical Manufactures& Associations (IFPMA ’96), International Conference onHarmonization (ICH), Geneva, Switzerland, November 1996,Methodology Q2(R1).
[17] J. Ruan, P. Tattersall, R. Lozano, and P. Shah, “The roleof forced degradation studies in stability indicating HPLCmethod development,” American Pharmaceutical Review, vol.9, no. 1, pp. 46–53, 2006.
[18] M. Bakshi and S. Singh, “Development of validatedstability-indicating assay methods-critical review,” Journal ofPharmaceutical and Biomedical Analysis, vol. 28, no. 6, pp.1011–1040, 2002.
[19] H. C. Juan and C. M. Noelia, “Process to prepare paliperidoneand intermediates thereof,” PCT Pat., WO 2009/144288 A1,2009.
[20] R. L. Snyder, J. Kirkland, and L. Glajch, Practical LC MethodDevelopment, Jonh Wiley & Sons, Hoboken, NY, USA, 1997.
[21] R. LoBrutto, A. Jones, Y. V. Kazakevich, and H. M. McNair,“Effect of the eluent pH and acidic modifiers in high-performance liquid chromatography retention of basicanalytes,” Journal of Chromatography A, vol. 913, no. 1-2, pp.173–187, 2001.

Submit your manuscripts athttp://www.hindawi.com
Hindawi Publishing Corporationhttp://www.hindawi.com Volume 2014
Inorganic ChemistryInternational Journal of
Hindawi Publishing Corporation http://www.hindawi.com Volume 2014
International Journal ofPhotoenergy
Hindawi Publishing Corporationhttp://www.hindawi.com Volume 2014
Carbohydrate Chemistry
International Journal of
Hindawi Publishing Corporationhttp://www.hindawi.com Volume 2014
Journal of
Chemistry
Hindawi Publishing Corporationhttp://www.hindawi.com Volume 2014
Advances in
Physical Chemistry
Hindawi Publishing Corporationhttp://www.hindawi.com
Analytical Methods in Chemistry
Journal of
Volume 2014
Bioinorganic Chemistry and ApplicationsHindawi Publishing Corporationhttp://www.hindawi.com Volume 2014
SpectroscopyInternational Journal of
Hindawi Publishing Corporationhttp://www.hindawi.com Volume 2014
The Scientific World JournalHindawi Publishing Corporation http://www.hindawi.com Volume 2014
Medicinal ChemistryInternational Journal of
Hindawi Publishing Corporationhttp://www.hindawi.com Volume 2014
Chromatography Research International
Hindawi Publishing Corporationhttp://www.hindawi.com Volume 2014
Applied ChemistryJournal of
Hindawi Publishing Corporationhttp://www.hindawi.com Volume 2014
Hindawi Publishing Corporationhttp://www.hindawi.com Volume 2014
Theoretical ChemistryJournal of
Hindawi Publishing Corporationhttp://www.hindawi.com Volume 2014
Journal of
Spectroscopy
Analytical ChemistryInternational Journal of
Hindawi Publishing Corporationhttp://www.hindawi.com Volume 2014
Journal of
Hindawi Publishing Corporationhttp://www.hindawi.com Volume 2014
Quantum Chemistry
Hindawi Publishing Corporationhttp://www.hindawi.com Volume 2014
Organic Chemistry International
ElectrochemistryInternational Journal of
Hindawi Publishing Corporation http://www.hindawi.com Volume 2014
Hindawi Publishing Corporationhttp://www.hindawi.com Volume 2014
CatalystsJournal of