strategy 150
TRANSCRIPT

0
Deutsche Bank
Strategy 2020: Delivering Value Analyst Call
Frankfurt, 27 April 2015
Anshu Jain
Co-Chief Executive Officer

Anshu Jain
27 April 2015
Deutsche Bank
1
Deutsche Bank
Strategy 2020: Focusing Deutsche Bank to deliver value
Client-centricity: placing our clients
at the centre of what we do
Keeping a global footprint
Maintaining a universal banking
product offering
Refocusing on clients who offer
mutually beneficial partnerships
Moving toward a more focused
geographic reach
Tightening our product perimeter –
not all things to all people
What’s constant What changes
A leading global bank based in Germany
Proactive stance on future regulatory direction and robust controls

Anshu Jain
27 April 2015
Deutsche Bank
2
Deutsche Bank
Deutsche Bank’s unique positioning is a long-term competitive advantage
Market position of Deutsche Bank
Global model anchored in one of the world’s
strongest economies
Leading domestic retail franchise
positioned for multi-channel delivery
CB&S
GTB
Deutsche
AWM
PBC
Positioning of Deutsche Bank
Top 5
International reach with
strong home base in
Europe
Top 5-10
Top 1-3
Top 1-3
Top 5-10 Top 1-3
No. 1
No. 1
No. 1
No. 1(1)
(1) Among private sector banks Source: Dealogic, BVI, Coalition, Lipper, BCG, Scorpio, company data
Europe Global Germany
Capital markets expertise and global cash /
trade platform
Global asset and wealth proposition

Anshu Jain
27 April 2015
Deutsche Bank
3
Deutsche Bank
Agenda
1 Taking stock
2 Strategy 2020

Anshu Jain
27 April 2015
Deutsche Bank
4
Deutsche Bank
Taking stock: Strategy 2015+ has delivered significant achievements…
Capital
position
Cultural
change
Resilience
Balance and
performance
Stronger capital position, with strong deleveraging, de-
risking and near-doubling of CET 1 ratio
Embedding deep-rooted cultural change
More resilient: Substantially invested in infrastructure and
regulatory compliance
Core business balance and performance: All core
businesses exceeding EUR 1 billion IBIT for the first time(1)
(1) In FY 2014

Anshu Jain
27 April 2015
Deutsche Bank
5
Deutsche Bank
Taking stock: …but we have also faced significant setbacks
Environment
Regulatory bar raised:
‒ FBO / CCAR(1) rules in the US
‒ TLAC(2)
‒ Leverage ratios in Europe / US
‒ Bank levies
‒ CRD4 compensation rules
‒ Bank structure reforms /
German bank separation
Regulation
Costs of resolving legacy
issues and litigation soared,
particularly in the US
Costs of
legacy /
litigation
Record low interest rates taking
a toll on deposit gathering
business Macro
Cost of regulatory compliance
and new controls materially
higher than originally
foreseen Costs of
regulatory
compliance
Execution of efficiency drive
negatively impacted by high
operational and structural
complexity
Costs of
complexity
High level of optionality
maintained – at a cost Business
model
(1) Foreign Banking Organizations (FBO) / Comprehensive Capital Analysis and Review (CCAR) (2) Total Loss Absorbing Capacity (TLAC)
Execution

Anshu Jain
27 April 2015
Deutsche Bank
6
Deutsche Bank
Macro
US and Asia: recovery / sustainable growth
Europe: historically low interest rates persist
Rising geopolitical tensions create uncertainties
Our outlook
Key themes Outlook 2015 to 2020
Recovering
markets
Improving global outlook anchored to US and EM growth
Primary markets benefit from buoyant valuations
Return of volatility supports tentative recovery in fixed
income and currency markets
Tighter
regulation
Requirements for capital, leverage, liquidity and funding
continue to increase
Additional challenges arise from resolution, TLAC, bank
levies, RWA harmonization and continued subsidiarization
Improving
competitive
dynamics
Global universal leaders consolidate further
Business model choices: a transatlantic divide
Positive outlook
Negative outlook

Anshu Jain
27 April 2015
Deutsche Bank
7
Deutsche Bank
Agenda
1 Taking stock
2 Strategy 2020

Anshu Jain
27 April 2015
Deutsche Bank
8
Deutsche Bank
Strategy 2020: Six key decisions
Deliver sustainable client-driven franchise by:
‒ Reducing transactional business and focus product suite
‒ Invest in client solutions, advisory and equities
Re-focus through deconsolidation of Postbank
Transform DB into a leading digitally-enabled advisory bank for
private and commercial clients
Invest with focus on a) customer experience, b) revenue
opportunities, c) enable our platform, and d) new clients
Invest in scaling-up GTB
Aggressively invest in future growth of Deutsche AWM
Rationalize our geographic footprint
Invest in high growth hubs (e.g., China, India)
Redesign our operating and governance model to achieve
higher efficiency, reduced complexity, even stronger controls
and easier resolvability
Leverage reduction:
gross ~EUR 200bn,
net ~EUR 130-150bn
Net leverage reduction of
~EUR 140bn
Closure of up to 200
branches
Group-wide net
investment of up to
EUR 1bn by 2020
Increase in leverage
exposure by 30-40%
P&L investment of
>EUR 1.5bn
Exit / reduction of
presence in 7-10
countries
Changes to governance
and structure
Additional ~EUR 3.5bn
gross savings
Aspirations
Note: Gross cost savings are countered by increasing cost from inflation, FX changes, cost of growth, cost of regulatory compliance and other cost increases
Reposition
CB&S
Reshape
retail
Rationalize
our footprint
Transform
our operating
model
Digitalize DB
Grow
GTB and
Deutsche AWM
1
2
5
6
3
4
Anshu Jain
27 April 2015
Deutsche Bank
9
Deutsche Bank
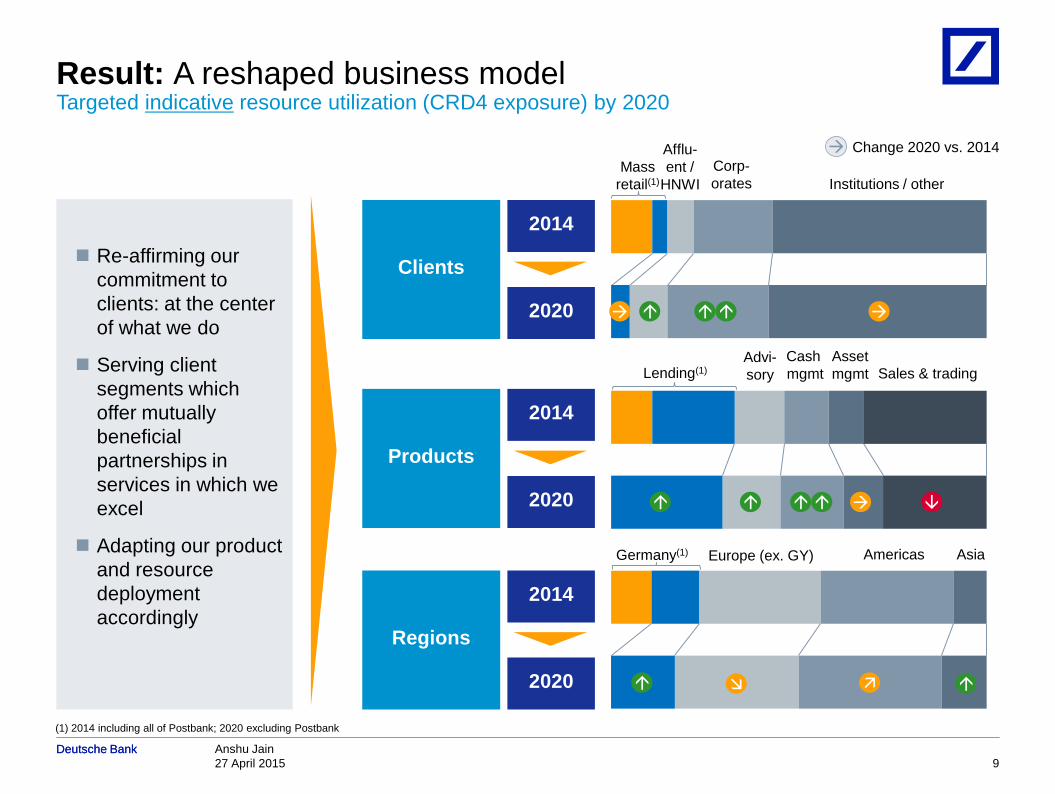
Result: A reshaped business model Targeted indicative resource utilization (CRD4 exposure) by 2020
Clients
2014
2020
Mass
retail(1)
Afflu-
ent /
HNWI
Corp-
orates
Institutions / other
Products
2014
2020
Lending(1)
Advi-
sory
Cash
mgmt
Asset
mgmt Sales & trading
Regions
2014
2020
Germany(1) Europe (ex. GY) Americas Asia
Re-affirming our
commitment to
clients: at the center
of what we do
Serving client
segments which
offer mutually
beneficial
partnerships in
services in which we
excel
Adapting our product
and resource
deployment
accordingly
(1) 2014 including all of Postbank; 2020 excluding Postbank
Change 2020 vs. 2014

Anshu Jain
27 April 2015
Deutsche Bank
10
Deutsche Bank
Leverage
ratio ≥5%
CET1
ratio ~11%
RoTE(1) >10%
Organic gross
savings ~EUR 3.5bn
Payout ratio(2) Aspiration to deliver 50%+ dividend payout ratio
Note: Gross cost savings are countered by increasing cost from inflation, FX changes, cost of growth, cost of regulatory compliance and other cost increases
(1) RoTE: Post-tax Return on Tangible Equity is calculated as net income (loss) attributable to shareholders as a percentage of average tangible shareholders' equity. Net income (loss) attributable
to shareholders is defined as Net income (loss) excluding post-tax income (loss) attributable to non-controlling interests. Tangible shareholders' equity is the shareholders’ equity per balance sheet
excluding goodwill and other intangible assets (2) Through dividends and/or share buybacks
Strategy 2020: Medium term ambitions
Our targets
Our aspiration
CIR ~65%

Anshu Jain
27 April 2015
Deutsche Bank
11
Deutsche Bank
Reposition CB&S: Delivering a sustainable, resilient and well-controlled investment bank
2012-
2014
Aspiration
2020
CRD4
usage
H / M / L= high / medium / low
CRD4 leverage consumption
Top 3 global Debt S&T business
Top 5 global Corporate Finance house
Top 5 Equities S&T franchise
Invest
Top 5 global commodities business
Leading provider uncleared CDS
Leading global repo franchise
Long dated uncleared derivatives
Adjust
perimeter
Optimize country presence
Emphasize client solutions versus flow
Multi- vs. single-product relationships
Refocus
H
L
M
M
H
H
H
M
M
M
Emphasis
De-emphasis

Anshu Jain
27 April 2015
Deutsche Bank
12
Deutsche Bank
(30-40)
Reduced
client
perimeter
(40-50)
Reduced
product
perimeter
(50-60)
Disposal of
low-yielding
assets
(80-90)
1Q
2015
>900
Redeploy
ment and
growth(1)
FY18
target
gross
Derivati
ves roll-
off
FY18
target
net
Reposition CB&S: Shrinking and re-deploying balance sheet CRD4 leverage exposure, in EUR bn
Expected impact of
exposure reduction
~EUR 0.8bn
deleveraging exit costs
~EUR 0.6bn negative
run-rate revenue
impact…
…more than offset by:
‒ Revenues from re-
deployment; and
‒ Market growth
(1) FX outlook assumed constant vs. April 2015
Targeted leverage exposure
reduction: gross ~EUR 200bn;
net ~EUR 130-150bn
50-70
~700

Anshu Jain
27 April 2015
Deutsche Bank
13
Deutsche Bank
Single name
CDS(2)
FX Credit Solutions
Reposition CB&S: Trimming while investing
2014 Aspiration 2020
Exit (2013-2014)
Optimize
Grow
Maintain
Optimizing our client franchise
Low High RoA(4)
Rates and
GLM(1) EM Debt
Flow Credit
Equity
Derivatives CB
&S
reve
nu
e r
an
k(3
)
#1-2
#3-5
#6-9
Note: Rates & GLM includes RMBS, Credit Solutions includes Distressed Product Group
(1) Reduction mainly in long-dated uncleared derivatives and repo (2) Excluding single name CDS in Asia, CEEMEA and LatAm (3) Based on Coalition index (DB internal structure) (4) Revenue
return on CRD4 exposure (5) as at FY2013
Invest in
Corporate
Finance
and
Cash
Equities
Prime Finance
Reduce
Commodities
Single Name CDS(2)
Rates and GLM
Prime Finance
Flow Credit
Corporate Finance
Cash Equities
Equity Derivatives
EM Debt
FX
Credit Solutions
Repo
Long-dated uncl. derivatives
Commodities(5)
Size of bubble relates to CRD4
leverage exposure

Anshu Jain
27 April 2015
Deutsche Bank
14
Deutsche Bank
Postbank today(1) Substantial investments Postbank in 2010
Reshape retail: Substantial investments in Postbank since 2010
Disposed / wound down
non-core assets
EUR 42.3bn:
‒ EUR 3.7bn structured
credit portfolio
‒ EUR 13.1bn commercial
real estate portfolio
‒ EUR 25.5bn
deleveraging financial
markets business
Invested in platform and
efficiency EUR 1.2bn:
‒ Service quality, sales
and process efficiency:
~EUR 0.5bn
‒ IT platform upgrades:
~EUR 0.7bn
Balance sheet (total assets,
in EUR bn)
Non-customer
assets (in EUR bn)
Shareholder
equity (average, in EUR bn)
Return on assets (IBIT / total assets,
in bps)
(1) FY2014 Source: Postbank Annual Report 2010 / 2014
Leverage ratio (in %)
215
103
5.6
15
2.5
155
57
6.6
29
3.1

Anshu Jain
27 April 2015
Deutsche Bank
15
Deutsche Bank
Key factors Implications
DB’s ability to fully realize value of Postbank’s acquisition eroded
in the face of changed regulatory environment and our strategy
Funding
Postbank’s contribution to group-wide
funding and liquidity limited by regulatory
constraints
Group-wide limits constrain
Postbank’s ability to efficiently deploy
its funding overhang
Leverage
Postbank’s mortgage and home loans
products drive high returns at high balance
sheet usage
Resulting 3.1% leverage ratio especially
onerous given DB’s G-SIB status
DB's proactive focus on ≥5%
medium-term leverage ratio would
negatively impact Postbank’s product
portfolio and growth prospects
Cross-sell
Cross-selling between DB and Postbank :
‒ Made more costly and onerous by
evolving regulation
‒ Limited by differing client needs
Substantially less scope for revenue
synergies between Postbank and DB
Reshape retail: A number of factors has led us to reconsider Postbank’s strategic fit with DB

Anshu Jain
27 April 2015
Deutsche Bank
16
Deutsche Bank
Reshape retail: Postbank deconsolidation process and timeline
Imme-
diately
2Q-4Q
2015
By end
2016
Cease integration efforts especially in IT
and middle/back-office operations
Revert to stand-alone business and
operating models
Yet maintain the efficiency and service
quality improvements
Launch re-IPO
Next steps
To prepare the execution of our strategy,
we acquired additional 2.7% of Postbank
shares
Our ownership moved from 94.1% to
96.8%
Intention to launch squeeze-out at a
Postbank shareholders’ meeting by
August 2015
Completion of squeeze-out expected at
the latest by year-end 2015
Squeeze-out provides us with flexibility
with regard to domination agreement
Pursue squeeze-out of Postbank minorities
at Postbank shareholders’ meeting
Prepare subsequent re-IPO process
Intention to launch squeeze-out

Anshu Jain
27 April 2015
Deutsche Bank
17
Deutsche Bank
Reshape retail: A leading advisory bank
2016-2020
Substantial actions planned… …to deliver our new PBC
Sharpen distribution model
‒ Up to 200 branches closed by 2017
‒ Strengthen omni-channel
capabilities
Continue to invest in efficiency and
service quality
Invest in digital capabilities
‒ ~EUR 100m invested so far
‒ Targeting EUR 400-500m further
investments by 2020
Optimize infrastructure and front-to-
back cost reduction
Leading digitally-enabled advisory bank for >13m
clients with strong home base in Europe
‒ No. 1 advisory bank in Germany(1) for >8m
private, business and MidCap clients
‒ Strongholds in five other attractive European
markets with in total ~5m clients
Uplift of asset productivity through emphasis on
investment and insurance products
Fully digitized omni-channel distribution model
with ~500 specialized advisory centers in
Germany and premium service
Competitive cost efficiency
(1) Based on revenues Source: Company data
Anshu Jain
27 April 2015
Deutsche Bank
18
Deutsche Bank
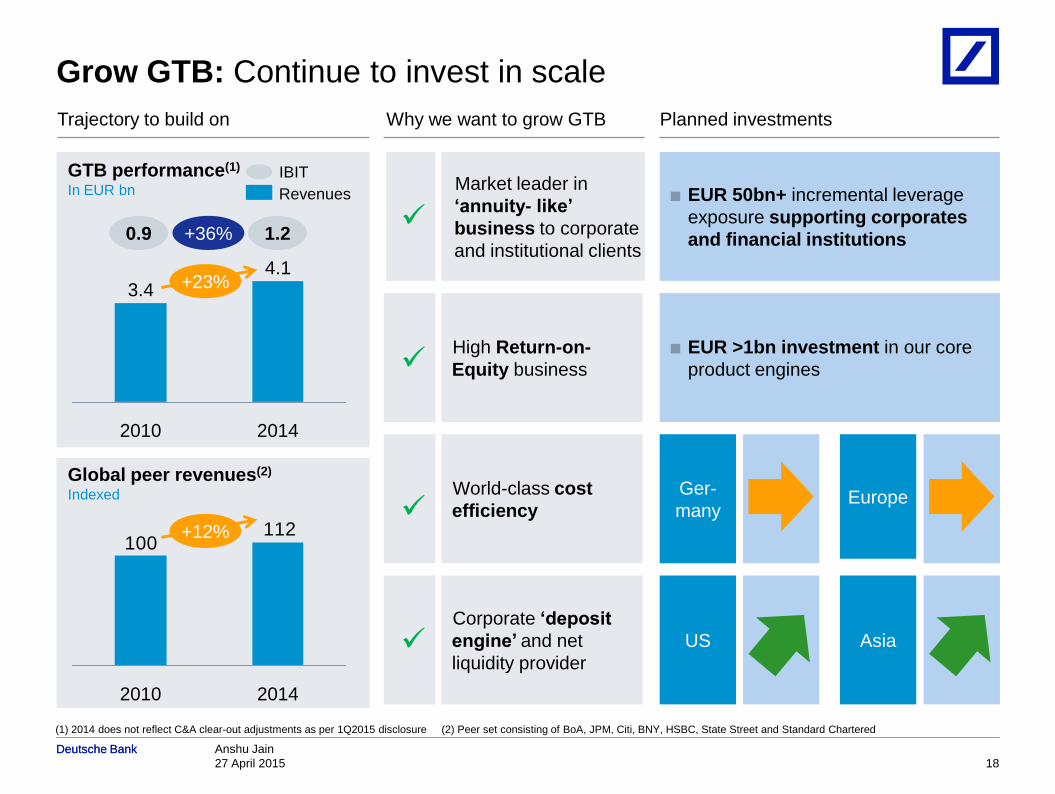
Grow GTB: Continue to invest in scale
Market leader in
‘annuity- like’
business to corporate
and institutional clients
Corporate ‘deposit
engine’ and net
liquidity provider
High Return-on-
Equity business
World-class cost
efficiency
Why we want to grow GTB Planned investments
■ EUR 50bn+ incremental leverage
exposure supporting corporates
and financial institutions
■ EUR >1bn investment in our core
product engines
Trajectory to build on
GTB performance(1)
In EUR bn
2014
4.1
2010
3.4
0.9 1.2
112100
2014 2010
Global peer revenues(2)
Indexed
(1) 2014 does not reflect C&A clear-out adjustments as per 1Q2015 disclosure (2) Peer set consisting of BoA, JPM, Citi, BNY, HSBC, State Street and Standard Chartered
IBIT
Revenues
+23%
+36%
+12%
Ger-
many Europe
US Asia

Anshu Jain
27 April 2015
Deutsche Bank
19
Deutsche Bank
5-6% p.a.
Wealth
Management
Asset
Management
Significant global growth opportunities for
the industry Planned investments to capture growth
Grow Deutsche AWM: Invest to capture future growth
152
2020E
220
2013
2013
69
2020E
102
Sources: Credit Suisse Global Wealth Report 2014; PwC Asset Management 2020: A brave new world 2014; BCG Global WM Industry Survey 2014
AuM, in USD trn
AuM, in USD trn
Ageing
population
Emerging
market growth
Alternatives
and Passive
Custom
solutions
U/HNWI growth
Balance Sheet:
Prudently grow lending balance sheet
5-10% p.a. to support client needs
Client coverage:
Increase U/HNWI relationship managers in
key markets by 15% in the next two years
Increase product specialists
Operating model:
Continue to streamline footprint to further
improve CIR
Invest in technology and digital
capabilities to better serve clients
Investment performance and solutions:
Develop innovative Retirement and
Strategic Beta offerings
Further enhance Alternatives and Multi-
Asset investment capabilities 5-6% p.a.
Anshu Jain
27 April 2015
Deutsche Bank
20
Deutsche Bank
CAGR 2014-
2019, in %
Growth 2011-
2014, in %
CAGR 2014-
2020, in %
DB
revenues
~57
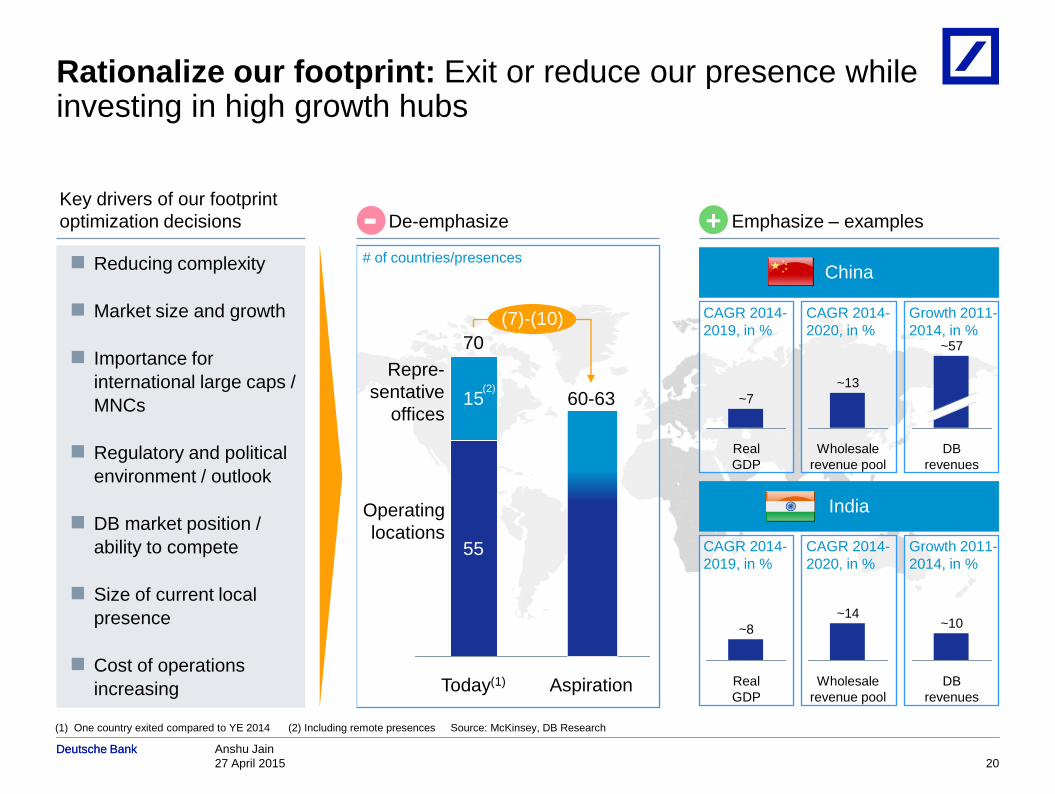
Rationalize our footprint: Exit or reduce our presence while investing in high growth hubs
Today(1)
70
55
15
Aspiration
60-63
(7)-(10)
Key drivers of our footprint
optimization decisions De-emphasize
# of countries/presences
-
Operating
locations
Emphasize – examples +
India
China
Real
GDP
~7
Wholesale
revenue pool
~13
CAGR 2014-
2019, in %
Growth 2011-
2014, in %
CAGR 2014-
2020, in %
DB
revenues
~10
Real
GDP
~8
~14
Wholesale
revenue pool
(2)
Repre-
sentative
offices
(1) One country exited compared to YE 2014 (2) Including remote presences Source: McKinsey, DB Research
Reducing complexity
Market size and growth
Importance for
international large caps /
MNCs
Regulatory and political
environment / outlook
DB market position /
ability to compete
Size of current local
presence
Cost of operations
increasing

Anshu Jain
27 April 2015
Deutsche Bank
21
Deutsche Bank
Gross cost
savings p.a.
Note: Gross savings are countered by increasing cost from inflation, FX changes, cost of growth, cost of regulatory compliance and other cost increases
(1) Reflects overall FY2015 OpEx savings already included in separately disclosed OpEx numbers; no adjustments from incremental savings (2) Already included in separately
disclosed OpEx numbers
Cum. CtA
Transform our operating model: Top-down savings targets In EUR bn
Remaining
2015 OpEx
savings (Examples)
Modernize DB's non-retail IT infrastructure/ application
footprint jointly with a strategic partner
Complete roll-out of our strategic global investment
management platform for Deutsche AWM
1.2(1) 1.0(2)
Disposals
Deconsolidate Postbank
Completed NCOU exits
Other portfolio measures
3.3 0.3
Additional
gross savings
Narrow perimeter (e.g., de-emphasizing of
product/client segments, locations)
Increase efficiency (e.g., process streamlining, IT/Ops
platform optimization)
~3.5 ~3.7
Details on next page
Target
Additional cost
reductions p.a. Cum. CtA

Anshu Jain
27 April 2015
Deutsche Bank
22
Deutsche Bank
Gross cost
savings p.a.
Unlock additional efficiency potential through
– Automation of manual processes
– IT/Ops footprint optimization and insourcing
– Further non-compensation costs (e.g., procurement)
optimization
– Infrastructure functions re-alignment
Increase
efficiency
Total savings
Narrow
perimeter
Rightsizing of FTE and platform in alignment with:
– Exit of structurally unprofitable businesses
– Country exits / non-presence
– Branch closures
~1.3
~2.2
~3.5
~1.4
~2.3
~3.7
Cum. CtA Structural efficiency levers
Transform our operating model: Contributing ~EUR 3.5bn additional organic gross savings In EUR bn
Target
Targeting ~15% reduction of adjusted costs by 2020
Note: Gross cost savings are countered by increasing cost from inflation, FX changes, cost of growth, cost of regulatory compliance and other cost increase

Anshu Jain
27 April 2015
Deutsche Bank
23
Deutsche Bank
Journey to 5% leverage ratio target coming from balance sheet reduction and capital accretion CRD4 leverage ratio, fully loaded
0.4%
Postbank de-
consolidation
0.4%
4Q14
3.5%
Target
≥5%
Cumulative
capital
accretion net
of dividends
Redeployment
for growth
Pro-forma
ambition after
measures
4.6%
NCOU
derisking
0.2%
CB&S
deleveraging
Impact from change in leverage exposure
Impact from capital accretion

Anshu Jain
27 April 2015
Deutsche Bank
24
Deutsche Bank
■ Postbank is a self-funding entity with
no material funding contribution to DB
Group
■ Substantial majority of funding
continues to come from most stable
sources
■ DB had a pro-forma LCR ratio of 119%
in Dec-14; deconsolidation of
Postbank expected to have no
material impact on LCR ratio
■ DB intends to fully comply with NSFR
requirements
■ Further positive contribution from
CB&S deleveraging and GTB /
Deutsche AWM growth
23% 24%
26% 18%
6% 7%
20% 23%
24% 28%
919 781
Reported
Funding profile (pre-CB&S deleveraging)
31 Dec 2014, external funding sources, in EUR bn
Pro-forma
excl. Postbank
76%
most
stable
funding
sources
72%
Capital
Markets
and Equity
Retail
AWM
Transaction
Banking
Other
Our pro-forma funding profile remains robust

Anshu Jain
27 April 2015
Deutsche Bank
25
Deutsche Bank
What comes next
Today
Up to 90 days
Operating
model review
Refine key levers
Design detailed transformation roadmap
Refine governance and operating model
Footprint
decisions
Finalize outcomes of global country review
Engage stakeholders and initiate implementation
Divisional and
functional strategies
Breakdown strategic roadmap into detailed
divisional and functional plans
Sequence change management
Strategy 2020 announcement
Follow-up announcement

Anshu Jain
27 April 2015
Deutsche Bank
26
Deutsche Bank
This presentation contains forward-looking statements. Forward-looking statements are statements that are not
historical facts; they include statements about our beliefs and expectations and the assumptions underlying them.
These statements are based on plans, estimates and projections as they are currently available to the
management of Deutsche Bank. Forward-looking statements therefore speak only as of the date they are made,
and we undertake no obligation to update publicly any of them in light of new information or future events.
By their very nature, forward-looking statements involve risks and uncertainties. A number of important factors
could therefore cause actual results to differ materially from those contained in any forward-looking statement.
Such factors include the conditions in the financial markets in Germany, in Europe, in the United States and
elsewhere from which we derive a substantial portion of our revenues and in which we hold a substantial portion of
our assets, the development of asset prices and market volatility, potential defaults of borrowers or trading
counterparties, the implementation of our strategic initiatives, the reliability of our risk management policies,
procedures and methods, and other risks referenced in our filings with the U.S. Securities and Exchange
Commission. Such factors are described in detail in our SEC Form
20-F of 20 March 2015 under the heading “Risk Factors.” Copies of this document are readily available upon
request or can be downloaded from www.db.com/ir.
This presentation may contain non-IFRS financial measures. For a reconciliation to directly comparable figures
reported under IFRS, to the extent such reconciliation is not provided in this presentation, refer to the 1Q2015
Financial Data Supplement, which is accompanying this presentation and available at www.db.com/ir.
Cautionary statements