strategic intellectual property portfolio management ... · pdf filestrategic intellectual...
TRANSCRIPT
Strategic Intellectual PropertyPortfolio Management:
Technology Appraisal by Using the“Technology Heat Map”
No. 83 December 1, 2004
Masayuki MIYAKE, Yuji MUNE, and Keiichi HIMENO
Copyright 2004 by Nomura Research Institute, Ltd. 1
NRI Papers No. 83December 1, 2004
Strategic Intellectual PropertyPortfolio Management:
Technology Appraisal by Using the“Technology Heat Map”
Masayuki MIYAKE, Yuji MUNE, and Keiichi HIMENO
I Company’s R&D: Current Status and Required Improvements1 High-Level R&D Investment and Improvements Required of Management2 Sluggish Ranking in World Competitiveness3 Difficulty in Introducing an Intellectual Property Management Cycle4 Start of Activities to Publish Intellectual Property Reports
II Proposing Strategic Intellectual Property Portfolio Management1 Process of Intellectual Property Management2 PPM Analysis3 Technology Heat Map Analysis
III Examples of Analyses Using the Technology Heat Map1 Intellectual Property Portfolio and Efficiency in R&D2 Intellectual Property Portfolio Related to Mobile Communications
IV Toward the Formulation of Future R&D Strategy1 R&D Strategy in Industry, Academia and Government2 Expanded Use of Technology Heat Maps3 Formulating Strategy Including the Perspective of M&A4 Vitalizing the Operation of Intellectual Properties
The research and development (R&D) investment of major manufacturers has reached an
annual level of several hundred billion yen. Questions are being raised as to whether this invest-
ment amount is efficient from the perspective of its effectiveness. Company executives now face a
variety of opportunities that require sophisticated analyses and decisions. These include the re-
evaluation of intellectual property portfolios centered on patents held by a company, and evalua-
tion of the business values of candidate companies in considering M&A (merger and acquisition).
To help support the intellectual property portfolio management of these companies, Nomura
Research Institute (NRI) has developed a new analysis solution called the “Technology Heat
Map.” This method analyzes the status of patent applications filed in specific technology fields and
provides visualizations of the technology fields that each company is focusing on as well as highly
competitive fields. Accordingly, this map can be applied as an analytical method to support the for-
mulation of R&D strategies, the search for target companies for M&A and the evaluation of intel-
lectual property portfolios.
This solution is expected to offer a common-language-like role for people in industry, academia
and government who recognize the importance of information sharing in the operation of intellec-
tual properties.
Copyright 2004 by Nomura Research Institute, Ltd. 2
I Company’s R&D: Current Status and Required Improvements
1 High-Level R&D Investment andImprovements Required of Management
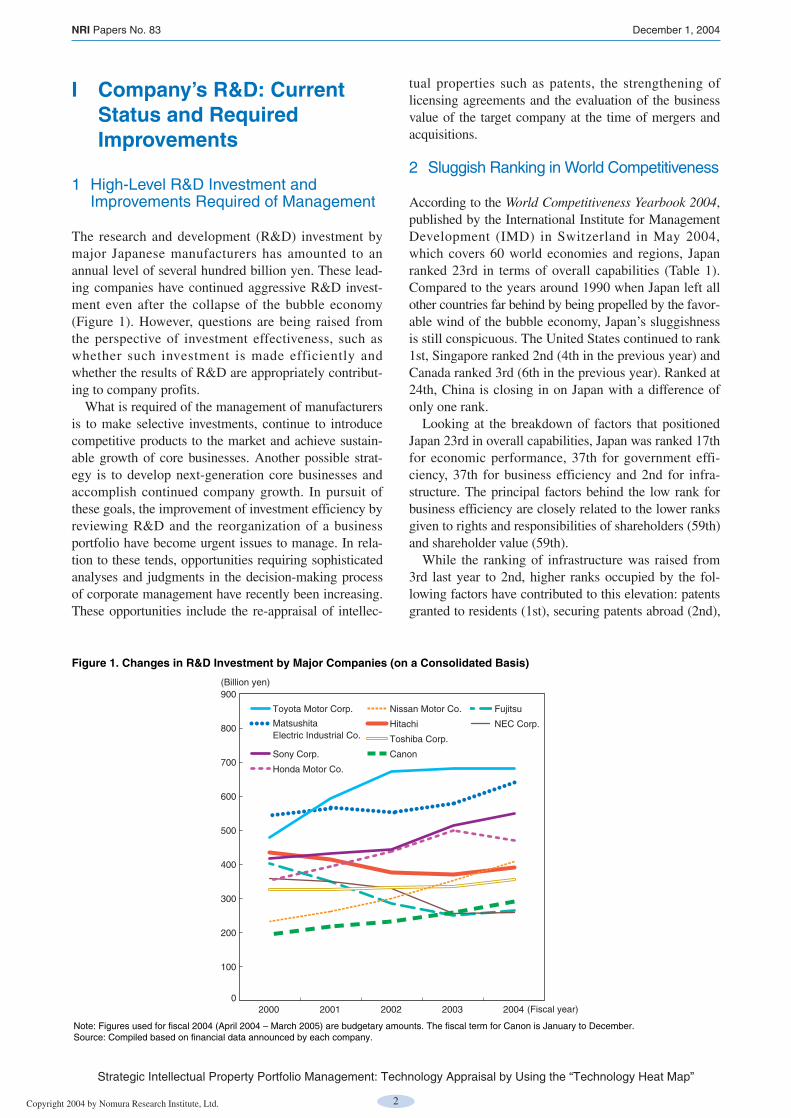
The research and development (R&D) investment bymajor Japanese manufacturers has amounted to anannual level of several hundred billion yen. These lead-ing companies have continued aggressive R&D invest-ment even after the collapse of the bubble economy(Figure 1). However, questions are being raised fromthe perspective of investment effectiveness, such aswhether such investment is made efficiently andwhether the results of R&D are appropriately contribut-ing to company profits.
What is required of the management of manufacturersis to make selective investments, continue to introducecompetitive products to the market and achieve sustain-able growth of core businesses. Another possible strat-egy is to develop next-generation core businesses andaccomplish continued company growth. In pursuit ofthese goals, the improvement of investment efficiency byreviewing R&D and the reorganization of a businessportfolio have become urgent issues to manage. In rela-tion to these tends, opportunities requiring sophisticatedanalyses and judgments in the decision-making processof corporate management have recently been increasing.These opportunities include the re-appraisal of intellec-
tual properties such as patents, the strengthening oflicensing agreements and the evaluation of the businessvalue of the target company at the time of mergers andacquisitions.
2 Sluggish Ranking in World Competitiveness
According to the World Competitiveness Yearbook 2004,published by the International Institute for ManagementDevelopment (IMD) in Switzerland in May 2004,which covers 60 world economies and regions, Japanranked 23rd in terms of overall capabilities (Table 1).Compared to the years around 1990 when Japan left allother countries far behind by being propelled by the favor-able wind of the bubble economy, Japan’s sluggishnessis still conspicuous. The United States continued to rank1st, Singapore ranked 2nd (4th in the previous year) andCanada ranked 3rd (6th in the previous year). Ranked at24th, China is closing in on Japan with a difference ofonly one rank.
Looking at the breakdown of factors that positionedJapan 23rd in overall capabilities, Japan was ranked 17thfor economic performance, 37th for government effi-ciency, 37th for business efficiency and 2nd for infra-structure. The principal factors behind the low rank forbusiness efficiency are closely related to the lower ranksgiven to rights and responsibilities of shareholders (59th)and shareholder value (59th).
While the ranking of infrastructure was raised from3rd last year to 2nd, higher ranks occupied by the fol-lowing factors have contributed to this elevation: patentsgranted to residents (1st), securing patents abroad (2nd),
NRI Papers No. 83 December 1, 2004
Strategic Intellectual Property Portfolio Management: Technology Appraisal by Using the “Technology Heat Map”
Note: Figures used for fiscal 2004 (April 2004 – March 2005) are budgetary amounts. The fiscal term for Canon is January to December.Source: Compiled based on financial data announced by each company.
Figure 1. Changes in R&D Investment by Major Companies (on a Consolidated Basis)
0
100
200
300
400
500
600
700
800
900
Toyota Motor Corp.
Sony Corp.
Honda Motor Co.
MatsushitaElectric Industrial Co.
2000 2001 2002 2003 2004
(Billion yen)
Nissan Motor Co.
Hitachi
Toshiba Corp.
Canon
Fujitsu
NEC Corp.
(Fiscal year)

Copyright 2004 by Nomura Research Institute, Ltd. 3
total expenditure on R&D (2nd) and total R&D person-nel nationwide (3rd).
These findings suggest that although the factors ofinvestment in R&D and the number of patents acquiredoccupy higher ranks, these higher rankings do not neces-sarily contribute to the improvement of Japan’s worldcompetitiveness in its overall capabilities.
3 Difficulty in Introducing an IntellectualProperty Management Cycle
Recently, the disclosure of information in a variety offields has been facilitated in the format of electronicdata such as a company’s financial data, market-relateddata and information and official reports on applicationsfor patents resulting from R&D. Accordingly, an envi-ronment is being established where information is easierto acquire. However, because the volume of such infor-mation is enormous, it has conversely become difficultto analyze such information and extract key informationthat is essential for making management decisions.
Ordinary manufacturers conduct R&D activities to fur-ther strengthen their strong technological fields, andincrease their competitiveness by manufacturing attractiveproducts with greater added value. To cope with theirweak areas, they usually adopt the strategies of combatingtheir weaknesses by introducing technologies from out-side companies and/or establishing alliances with them.
However, with respect to patents that are the directresults of R&D, manufacturers face a variety of prob-lems. (1) The expressions used for patent specificationsare difficult to understand. (2) It is difficult to envisionfinal products because element technologies cover exten-sive fields. (3) Because large companies apply for a largenumber of patents, it is difficult to make comparisonswith other companies. Therefore, there are only a limitednumber of cases in which patents are considered indetermining R&D strategies.
Essentially, activities for R&D and intellectual proper-ties must be dealt with in the management cycle shownin Figure 2. In addition to their excellence in R&Dcapabilities, the following point can be considered
NRI Papers No. 83 December 1, 2004
Strategic Intellectual Property Portfolio Management: Technology Appraisal by Using the “Technology Heat Map”
Note: One of the factors that determine the ranking for infrastructure in the overall capabilities is the capability of science and technology.Source: IMD, the IMD World Competitiveness Yearbook 2004.
Table 1. World Competitiveness Ranking
Japan US China
Overall Capabilities 23 1 24Economic performance 17 1 2Government efficiency 37 10 21Business efficiency 37 1 35Infrastructure 2 1 41
Capability of Science and Technology 2 1 23Total expenditure on R&D 2 1 6Total R&D personnel nationwide 3 – 1Basic research 9 1 11Science in schools 33 31 19Patents granted to residents 1 2 9Securing patents abroad 2 1 32Patent and copyright protection 26 6 41
Figure 2. Ideal Management Cycle for Activities for R&D and Intellectual Properties
Rightsprotection
Businessstrategy
Intellectualproperty strategy,
R&D strategy
Developingstructure
andhuman resources
R&D activities
Patent use,licensing,transfers
Patent application,registration
Intellectualproperty
management
• Utilizing intellectual property rights• Limiting rights for internal use• Licensing other companies• Transferring rights to other companies
• Long-term strategy for R&D activities• Setting major themes, analyzing funds,
research, alliances, etc.
• Creating an environment facilitating inventions and new ideas
• Researcher evaluation• Education regarding technology management
and intellectual properties• Role and structure of an intellectual property
department
• Link between intellectual property strategy and R&D strategy
• Determining research subjects, what will be regarded as research results, what to do with research results and where best to obtain patents
• Selecting targets for which rights are obtained, creating strong patents
• Implementing efficient R&D while considering commercialization through the link between the R&D and intellectual property departments
• Protecting rights of joint research results
• Building a strong patent portfolio by extensively covering peripheral patents
• Restructuring rights already obtained
Copyright 2004 by Nomura Research Institute, Ltd. 4
characteristic of companies that properly implementR&D and manage their intellectual properties. The exec-utives of such companies make strong public announce-ments concerning the strengthening of their R&Dactivities and their intellectual properties as an importantpart of their company’s business strategies.
However, there are only a few companies in whichthis management cycle is functioning properly, such asIBM and DuPont. Many other companies continue toface the need to strengthen these activities.
4 Start of Activities to Publish IntellectualProperty Reports
In 2004, some companies that have taken innovativeapproaches to intellectual properties began to publishintellectual property reports. The expectations behindthese moves are to promote investment by outlining thecompany’s R&D strategy to investors. Included are towhat extent rights are created based on the patentsresulting from such R&D activities, as well as to whatextent revenues are generated by licensing.
The disclosure items suggested in the “Guidelines forDisclosure of Information on Intellectual Properties,”which were announced in January 2004 by the Ministryof Economy, Trade and Industry (METI), are describedbelow. The items disclosed by the companies that issuedintellectual property reports this spring generally con-form to those announced by METI.
(1) Core technologies and business models(2) R&D segments and the direction of business
strategy(3) R&D segments and the outline of intellectual
properties(4) Analyses of technology marketability and market
predominance(5) Organizations of R&D and intellectual properties,
R&D cooperation and alliances(6) Policy concerning the acquisition and manage-
ment of intellectual properties, the management ofbusiness secrets, and the prevention of technologyoutflow
(7) Contribution by licensing-related activities tobusiness operations
(8) Contribution by a group of patents to businessoperations
(9) Policy for intellectual property portfolio(10) Information on risk management
While manufacturers have started to deal with variousIR (investor relations) activities, including the publishingof these intellectual property reports, it is not easy toproperly show the efficiency of the company’s R&Dinvestment and the effectiveness of the procurement oftechnology from outside such as through M&A. It is truethat concerns about a fluctuation of technological pre-
dominance over competitors that might result from thedisclosure of information related to intellectual proper-ties are also involved because the R&D strategy and theintellectual property strategy exactly represent the busi-ness operation strategy of a company. However, a majorreason behind this difficulty is that it is extremely diffi-cult to demonstrate explicitly the efficiency and theeffectiveness of a company because a large number ofpatent applications are involved. In addition, individualR&D fields are extensive and wide-ranging.
The ideal method would be to consider a group ofpatents that are the results of the company’s R&D as atechnology portfolio, analyze the portfolio and publiclyannounce the company’s innovative and competitivetechnological fields.
At the same time, in response to the announcements ofsuch new information from companies, corporateresearch analysts are required to seriously analyze andevaluate such information. There are many manufacturersthat spend amounts for R&D that exceed their amounts ofcapital investment. In response to these moves, institu-tional investors have started to show an interest in thecontent of R&D investment and the effectiveness and effi-ciency of such investment without being limited to exam-ining the content of capital investment as in the past.
Thus far, corporate research analysts have closelyexamined the content of a company’s capital invest-ment. However, in actuality, they could not be so atten-tive as to evaluate the content of R&D investment thatexceeds capital investment. Recently, however, theyhave started to shape their research activities by under-standing the importance of analyzing the content ofR&D investment and the technology portfolio. In thefuture, through such efforts by corporate research ana-lysts, a totally new type of research report is expected toemerge that visualizes an outline of R&D investment bycombining the analysis of financial data with that ofintellectual property data.
II Proposing Strategic Intellectual Property Portfolio Management
1 Process of Intellectual PropertyManagement
To support a company’s “intellectual property portfoliomanagement” based on the factors described above,Nomura Research Institute (NRI) has developed newsolutions. The following section outlines the new solu-tions and the applications of such solutions in formulat-ing a company’s future management strategy (R&Dstrategy, M&A strategy, etc.).
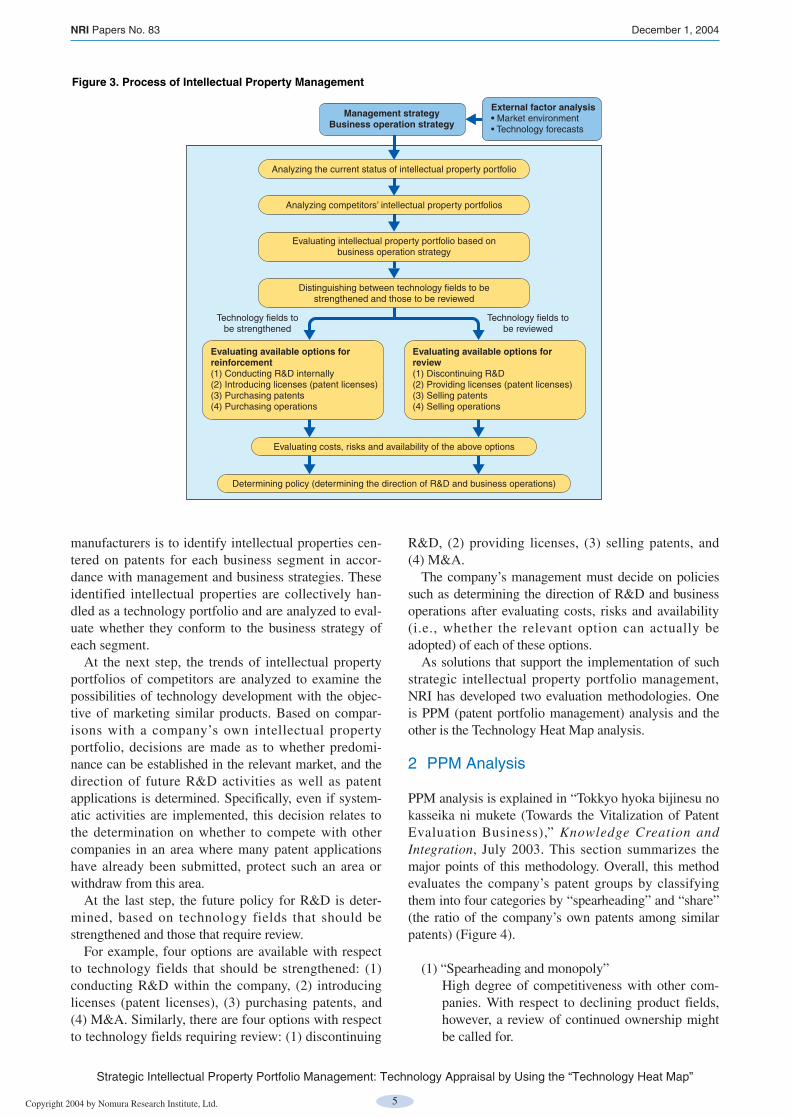
As shown in Figure 3, the first step in the processof intellectual property management by general
NRI Papers No. 83 December 1, 2004
Strategic Intellectual Property Portfolio Management: Technology Appraisal by Using the “Technology Heat Map”
Copyright 2004 by Nomura Research Institute, Ltd. 5
manufacturers is to identify intellectual properties cen-tered on patents for each business segment in accor-dance with management and business strategies. Theseidentified intellectual properties are collectively han-dled as a technology portfolio and are analyzed to eval-uate whether they conform to the business strategy ofeach segment.
At the next step, the trends of intellectual propertyportfolios of competitors are analyzed to examine thepossibilities of technology development with the objec-tive of marketing similar products. Based on compar-isons with a company’s own intellectual propertyportfolio, decisions are made as to whether predomi-nance can be established in the relevant market, and thedirection of future R&D activities as well as patentapplications is determined. Specifically, even if system-atic activities are implemented, this decision relates tothe determination on whether to compete with othercompanies in an area where many patent applicationshave already been submitted, protect such an area orwithdraw from this area.
At the last step, the future policy for R&D is deter-mined, based on technology fields that should bestrengthened and those that require review.
For example, four options are available with respectto technology fields that should be strengthened: (1)conducting R&D within the company, (2) introducinglicenses (patent licenses), (3) purchasing patents, and(4) M&A. Similarly, there are four options with respectto technology fields requiring review: (1) discontinuing
R&D, (2) providing licenses, (3) selling patents, and(4) M&A.
The company’s management must decide on policiessuch as determining the direction of R&D and businessoperations after evaluating costs, risks and availability(i.e., whether the relevant option can actually beadopted) of each of these options.
As solutions that support the implementation of suchstrategic intellectual property portfolio management,NRI has developed two evaluation methodologies. Oneis PPM (patent portfolio management) analysis and theother is the Technology Heat Map analysis.
2 PPM Analysis
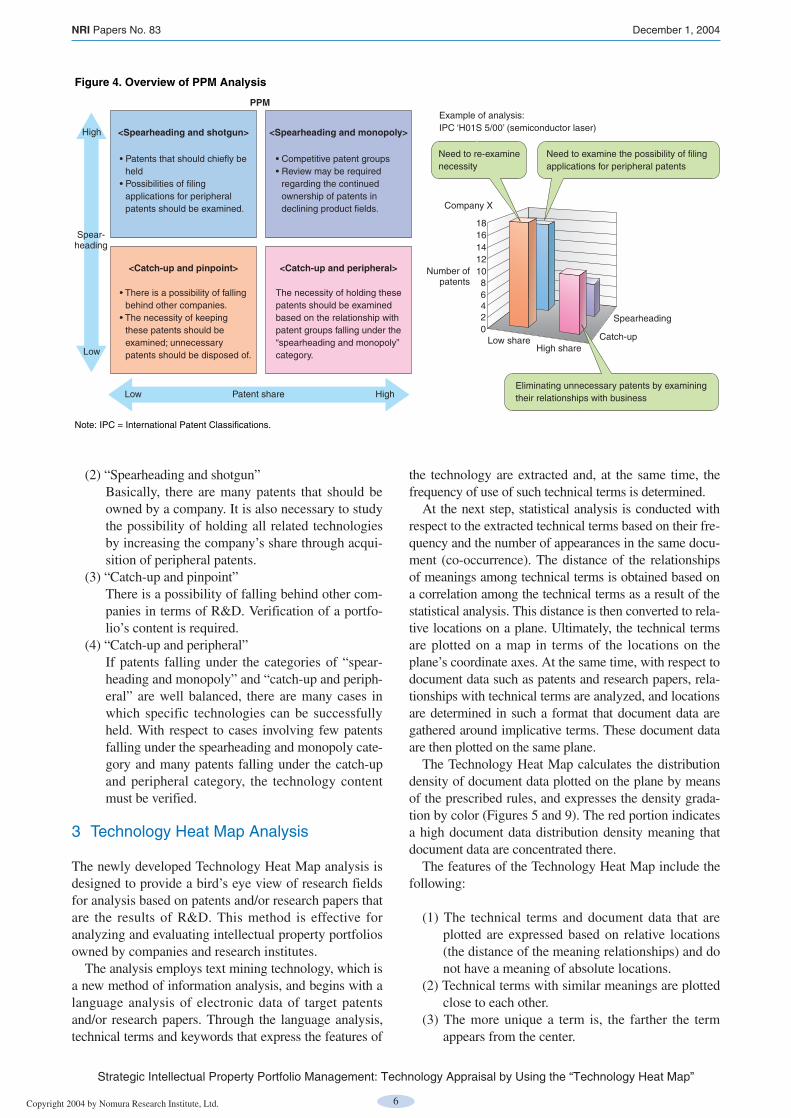
PPM analysis is explained in “Tokkyo hyoka bijinesu nokasseika ni mukete (Towards the Vitalization of PatentEvaluation Business),” Knowledge Creation andIntegration, July 2003. This section summarizes themajor points of this methodology. Overall, this methodevaluates the company’s patent groups by classifyingthem into four categories by “spearheading” and “share”(the ratio of the company’s own patents among similarpatents) (Figure 4).
(1) “Spearheading and monopoly”High degree of competitiveness with other com-panies. With respect to declining product fields,however, a review of continued ownership mightbe called for.
NRI Papers No. 83 December 1, 2004
Strategic Intellectual Property Portfolio Management: Technology Appraisal by Using the “Technology Heat Map”
Figure 3. Process of Intellectual Property Management
Management strategyBusiness operation strategy
Analyzing the current status of intellectual property portfolio
Analyzing competitors’ intellectual property portfolios
Evaluating intellectual property portfolio based onbusiness operation strategy
Distinguishing between technology fields to bestrengthened and those to be reviewed
Evaluating costs, risks and availability of the above options
Determining policy (determining the direction of R&D and business operations)
Technology fields tobe strengthened
Evaluating available options for reinforcement(1) Conducting R&D internally(2) Introducing licenses (patent licenses)(3) Purchasing patents(4) Purchasing operations
Evaluating available options for review(1) Discontinuing R&D(2) Providing licenses (patent licenses)(3) Selling patents(4) Selling operations
Technology fields tobe reviewed
External factor analysis• Market environment• Technology forecasts
Copyright 2004 by Nomura Research Institute, Ltd. 6
(2) “Spearheading and shotgun”Basically, there are many patents that should beowned by a company. It is also necessary to studythe possibility of holding all related technologiesby increasing the company’s share through acqui-sition of peripheral patents.
(3) “Catch-up and pinpoint”There is a possibility of falling behind other com-panies in terms of R&D. Verification of a portfo-lio’s content is required.
(4) “Catch-up and peripheral”If patents falling under the categories of “spear-heading and monopoly” and “catch-up and periph-eral” are well balanced, there are many cases inwhich specific technologies can be successfullyheld. With respect to cases involving few patentsfalling under the spearheading and monopoly cate-gory and many patents falling under the catch-upand peripheral category, the technology contentmust be verified.
3 Technology Heat Map Analysis
The newly developed Technology Heat Map analysis isdesigned to provide a bird’s eye view of research fieldsfor analysis based on patents and/or research papers thatare the results of R&D. This method is effective foranalyzing and evaluating intellectual property portfoliosowned by companies and research institutes.
The analysis employs text mining technology, which isa new method of information analysis, and begins with alanguage analysis of electronic data of target patentsand/or research papers. Through the language analysis,technical terms and keywords that express the features of
the technology are extracted and, at the same time, thefrequency of use of such technical terms is determined.
At the next step, statistical analysis is conducted withrespect to the extracted technical terms based on their fre-quency and the number of appearances in the same docu-ment (co-occurrence). The distance of the relationshipsof meanings among technical terms is obtained based ona correlation among the technical terms as a result of thestatistical analysis. This distance is then converted to rela-tive locations on a plane. Ultimately, the technical termsare plotted on a map in terms of the locations on theplane’s coordinate axes. At the same time, with respect todocument data such as patents and research papers, rela-tionships with technical terms are analyzed, and locationsare determined in such a format that document data aregathered around implicative terms. These document dataare then plotted on the same plane.
The Technology Heat Map calculates the distributiondensity of document data plotted on the plane by meansof the prescribed rules, and expresses the density grada-tion by color (Figures 5 and 9). The red portion indicatesa high document data distribution density meaning thatdocument data are concentrated there.
The features of the Technology Heat Map include thefollowing:
(1) The technical terms and document data that areplotted are expressed based on relative locations(the distance of the meaning relationships) and donot have a meaning of absolute locations.
(2) Technical terms with similar meanings are plottedclose to each other.
(3) The more unique a term is, the farther the termappears from the center.
NRI Papers No. 83 December 1, 2004
Strategic Intellectual Property Portfolio Management: Technology Appraisal by Using the “Technology Heat Map”
Figure 4. Overview of PPM Analysis
Example of analysis:IPC ‘H01S 5/00’ (semiconductor laser)
HighPatent shareLow
Low shareHigh share
Spearheading
Catch-up02468
1012141618
Company X
PPM
<Spearheading and shotgun>
<Catch-up and pinpoint>
<Spearheading and monopoly>
<Catch-up and peripheral>
Eliminating unnecessary patents by examining their relationships with business
Need to re-examine necessity
Need to examine the possibility of filing applications for peripheral patents
Note: IPC = International Patent Classifications.
• Patents that should chiefly be held
• Possibilities of filing applications for peripheral patents should be examined.
• Competitive patent groups• Review may be required
regarding the continued ownership of patents in declining product fields.
• There is a possibility of falling behind other companies.
• The necessity of keeping these patents should be examined; unnecessary patents should be disposed of.
The necessity of holding these patents should be examined based on the relationship with patent groups falling under the “spearheading and monopoly” category.
High
Low
Spear-heading
Number ofpatents
Copyright 2004 by Nomura Research Institute, Ltd. 7
(4) Because the analyses are based on language, thismethod can be applied to all technology fieldswithout limiting the technology sectors.
(5) Since the analytical results can be compared andexpressed by resolving them into various cate-gories that are included in the population of theanalyses, they are effective for comparisons withcompetitors and in time-series comparisons.
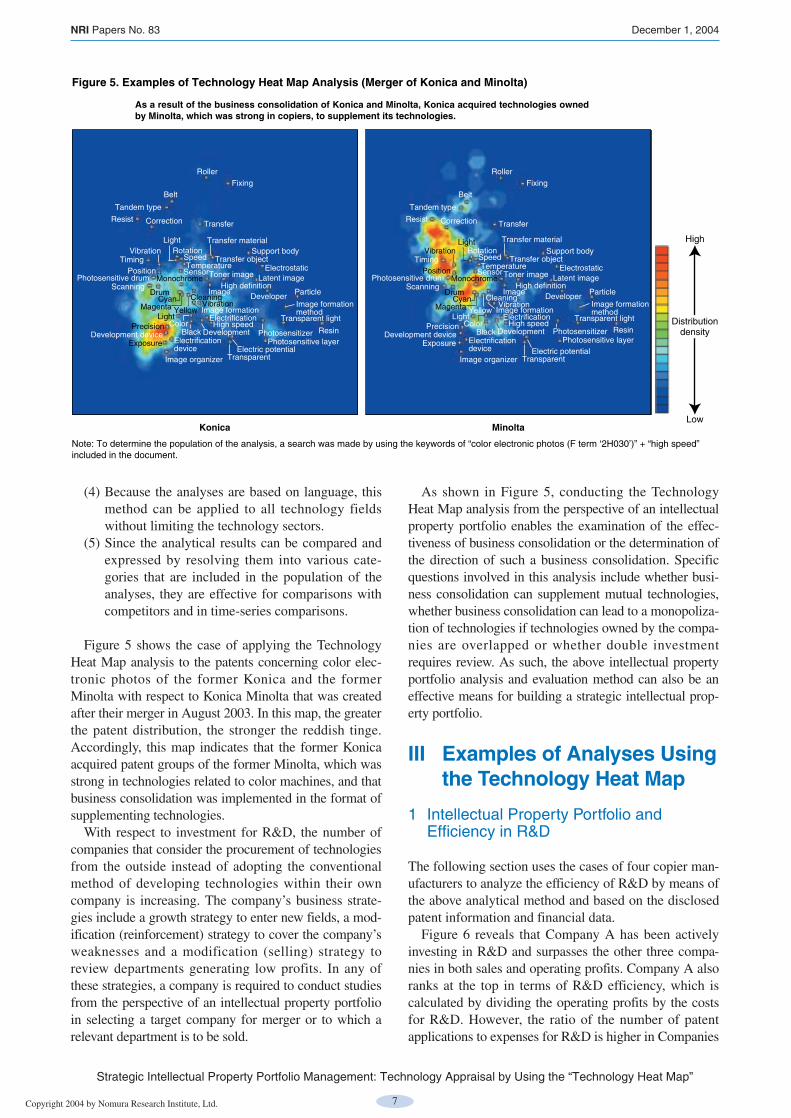
Figure 5 shows the case of applying the TechnologyHeat Map analysis to the patents concerning color elec-tronic photos of the former Konica and the formerMinolta with respect to Konica Minolta that was createdafter their merger in August 2003. In this map, the greaterthe patent distribution, the stronger the reddish tinge.Accordingly, this map indicates that the former Konicaacquired patent groups of the former Minolta, which wasstrong in technologies related to color machines, and thatbusiness consolidation was implemented in the format ofsupplementing technologies.
With respect to investment for R&D, the number ofcompanies that consider the procurement of technologiesfrom the outside instead of adopting the conventionalmethod of developing technologies within their owncompany is increasing. The company’s business strate-gies include a growth strategy to enter new fields, a mod-ification (reinforcement) strategy to cover the company’sweaknesses and a modification (selling) strategy toreview departments generating low profits. In any ofthese strategies, a company is required to conduct studiesfrom the perspective of an intellectual property portfolioin selecting a target company for merger or to which arelevant department is to be sold.
As shown in Figure 5, conducting the TechnologyHeat Map analysis from the perspective of an intellectualproperty portfolio enables the examination of the effec-tiveness of business consolidation or the determination ofthe direction of such a business consolidation. Specificquestions involved in this analysis include whether busi-ness consolidation can supplement mutual technologies,whether business consolidation can lead to a monopoliza-tion of technologies if technologies owned by the compa-nies are overlapped or whether double investmentrequires review. As such, the above intellectual propertyportfolio analysis and evaluation method can also be aneffective means for building a strategic intellectual prop-erty portfolio.
III Examples of Analyses Using the Technology Heat Map
1 Intellectual Property Portfolio andEfficiency in R&D
The following section uses the cases of four copier man-ufacturers to analyze the efficiency of R&D by means ofthe above analytical method and based on the disclosedpatent information and financial data.
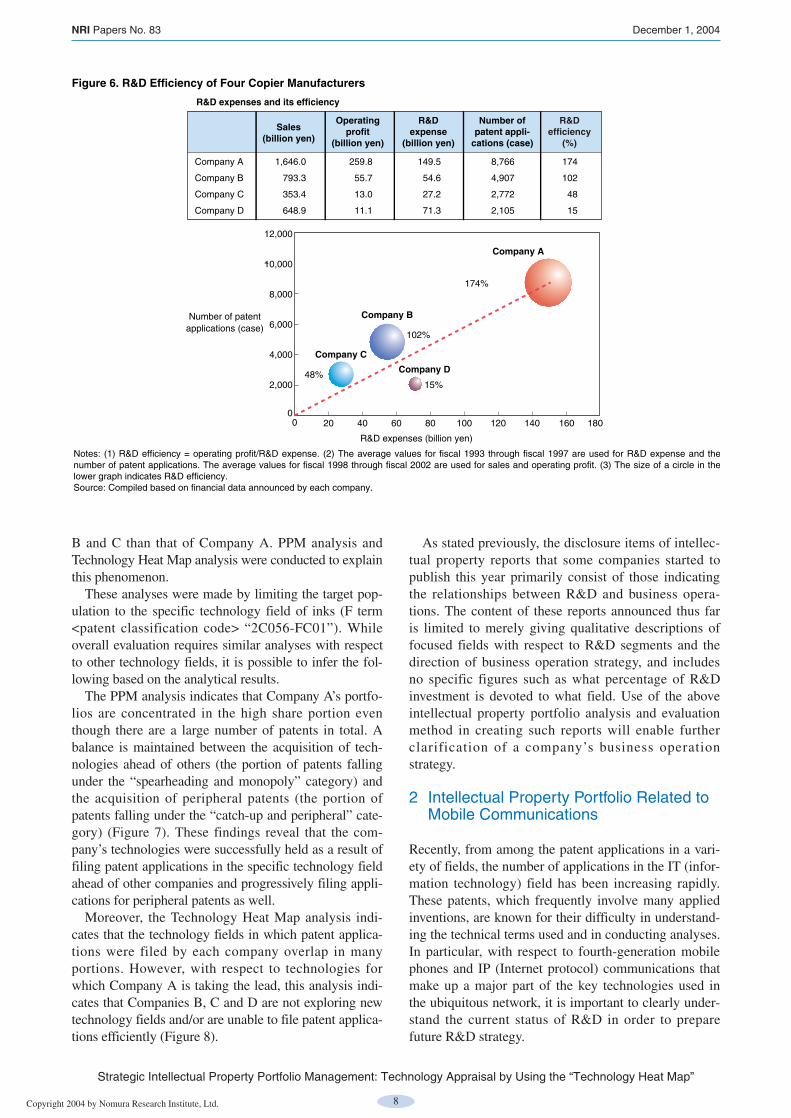
Figure 6 reveals that Company A has been activelyinvesting in R&D and surpasses the other three compa-nies in both sales and operating profits. Company A alsoranks at the top in terms of R&D efficiency, which iscalculated by dividing the operating profits by the costsfor R&D. However, the ratio of the number of patentapplications to expenses for R&D is higher in Companies
NRI Papers No. 83 December 1, 2004
Strategic Intellectual Property Portfolio Management: Technology Appraisal by Using the “Technology Heat Map”
RollerFixing
Belt
Tandem type
Resist Correction Transfer
TimingVibration
Vibration
LightRotation
SpeedTemperature
Transfer material
Transfer objectSupport body
ElectrostaticPositionPhotosensitive drum
ScanningDrum
SensorMonochrome Toner image
High definitionImage
CyanMagenta Yellow
Cleaning
Color
Image formation
PrecisionLight
Development deviceExposure Electrification
deviceImage organizer
Electrification
BlackHigh speed
Development
Electric potentialTransparent
Latent image
Developer Particle
Image formationmethod
Photosensitizer
Transparent light
ResinPhotosensitive layer
Figure 5. Examples of Technology Heat Map Analysis (Merger of Konica and Minolta)
Note: To determine the population of the analysis, a search was made by using the keywords of “color electronic photos (F term ‘2H030’)” + “high speed” included in the document.
High
Low
As a result of the business consolidation of Konica and Minolta, Konica acquired technologies owned by Minolta, which was strong in copiers, to supplement its technologies.
MinoltaKonica
Distributiondensity
Copyright 2004 by Nomura Research Institute, Ltd. 8
B and C than that of Company A. PPM analysis andTechnology Heat Map analysis were conducted to explainthis phenomenon.
These analyses were made by limiting the target pop-ulation to the specific technology field of inks (F term<patent classification code> “2C056-FC01”). Whileoverall evaluation requires similar analyses with respectto other technology fields, it is possible to infer the fol-lowing based on the analytical results.
The PPM analysis indicates that Company A’s portfo-lios are concentrated in the high share portion eventhough there are a large number of patents in total. Abalance is maintained between the acquisition of tech-nologies ahead of others (the portion of patents fallingunder the “spearheading and monopoly” category) andthe acquisition of peripheral patents (the portion ofpatents falling under the “catch-up and peripheral” cate-gory) (Figure 7). These findings reveal that the com-pany’s technologies were successfully held as a result offiling patent applications in the specific technology fieldahead of other companies and progressively filing appli-cations for peripheral patents as well.
Moreover, the Technology Heat Map analysis indi-cates that the technology fields in which patent applica-tions were filed by each company overlap in manyportions. However, with respect to technologies forwhich Company A is taking the lead, this analysis indi-cates that Companies B, C and D are not exploring newtechnology fields and/or are unable to file patent applica-tions efficiently (Figure 8).
As stated previously, the disclosure items of intellec-tual property reports that some companies started topublish this year primarily consist of those indicatingthe relationships between R&D and business opera-tions. The content of these reports announced thus faris limited to merely giving qualitative descriptions offocused fields with respect to R&D segments and thedirection of business operation strategy, and includesno specific figures such as what percentage of R&Dinvestment is devoted to what field. Use of the aboveintellectual property portfolio analysis and evaluationmethod in creating such reports will enable furtherclarification of a company’s business operation strategy.
2 Intellectual Property Portfolio Related toMobile Communications
Recently, from among the patent applications in a vari-ety of fields, the number of applications in the IT (infor-mation technology) field has been increasing rapidly.These patents, which frequently involve many appliedinventions, are known for their difficulty in understand-ing the technical terms used and in conducting analyses.In particular, with respect to fourth-generation mobilephones and IP (Internet protocol) communications thatmake up a major part of the key technologies used inthe ubiquitous network, it is important to clearly under-stand the current status of R&D in order to preparefuture R&D strategy.
NRI Papers No. 83 December 1, 2004
Strategic Intellectual Property Portfolio Management: Technology Appraisal by Using the “Technology Heat Map”
0
Notes: (1) R&D efficiency = operating profit/R&D expense. (2) The average values for fiscal 1993 through fiscal 1997 are used for R&D expense and thenumber of patent applications. The average values for fiscal 1998 through fiscal 2002 are used for sales and operating profit. (3) The size of a circle in thelower graph indicates R&D efficiency.Source: Compiled based on financial data announced by each company.
Figure 6. R&D Efficiency of Four Copier Manufacturers
R&D expenses and its efficiency
160 180
12,000
10,000
8,000
6,000
4,000
2,000
020 40 60 80 100 120 140
R&D expenses (billion yen)
Company A
Company B
Company C
Company D
174%
102%
48%15%
Company A
Company B
Company C
Company D
Sales(billion yen)
1,646.0
793.3
353.4
648.9
Operatingprofit
(billion yen)
259.8
55.7
13.0
11.1
R&Dexpense
(billion yen)
149.5
54.6
27.2
71.3
8,766
4,907
2,772
2,105
R&Defficiency
(%)
174
102
48
15
Number ofpatent appli-
cations (case)
Number of patentapplications (case)

Copyright 2004 by Nomura Research Institute, Ltd. 9
NRI Papers No. 83 December 1, 2004
Strategic Intellectual Property Portfolio Management: Technology Appraisal by Using the “Technology Heat Map”
Low shareHigh share
Spearheading
Company A
Company C
Case
Case
Case
Case
0
50
100
150
200
0
50
100
150
200
Company B
Company D
0
50
100
150
200
0
50
100
150
200
Low shareHigh share
Spearheading
Low shareHigh share
Spearheading
Low shareHigh share
Spearheading
Figure 7. PPM Analysis of Four Copier Manufacturers
Note: Search was conducted by using the keyword “ink” (F term “2C056-FC01”) to determine the population of the analysis.
Catch-up
Catch-up
Catch-up
Catch-up
Note: Search was conducted by using the keyword “ink” (F term “2C056-FC01”) to determine the population of the analysis.
Figure 8. Technology Heat Map Analysis of Four Copier Manufacturers
Company A Company B
Company C Company D

Copyright 2004 by Nomura Research Institute, Ltd. 10
The following section describes the results of theTechnology Heat Map analysis applied to patent applica-tions (about 3,500 cases) in the fields of domesticmobile communications and IP communications.
First, Figure 9 shows the 3,500 patents plotted on theheat map. According to the technical terms used, it isapparent that these patents can be broadly divided into“technologies concerning basic networks that form thebase of mobile communications” and “technologies toprovide value-added services by applying network tech-nologies.”
In the next step, the direction of R&D of individualcompanies is analyzed. Because of the limited spaceavailable, the following section introduces the results ofthe Technology Heat Map analysis for Company E as anexample case of the R&D analysis of a mobile phonecompany and for Company F as an example case of theR&D analysis of a manufacturer of electric appliances.
Figure 10 reveals that Company E has been filingpatent applications mostly involving “technologies toincrease communication speed and improve quality ofmobile communications networks” and “applied tech-nologies combining IT such as programs, memory media,servers and databases, with communications networks.”This map indicates Company E’s efforts devoted to R&D
with the aim of increasing the transmission speed ofmobile communications devices including third-genera-tion mobile phones, which represent the core business ofCompany E, and improving speech quality.
In contrast, the map indicates that Company F has awider R&D scope involving related fields as comparedto that of Company E (Figure 11). Additionally, many ofits patent applications involve “technologies to increasecommunication speed and improve quality of mobilecommunications networks” and “applied technologiescombining IT such as programs, memory media, serversand databases, with communications networks.” In addi-tion, there are also many patent applications involving“technologies concerning the supply of electric powersources and speech path control” and “technologiesrelating to applied services for camera-equipped mobilephones.”
In the case of Company F, the manufacturing ofmobile phone terminals constitutes a major businesssegment. In support of this core business, efforts arebeing made on the improvement of terminal batterytechnology and the development of high-value-addedproducts such as camera-equipped mobile phones. It isconsidered that these focused fields are reflected in thepatent applications.
NRI Papers No. 83 December 1, 2004
Strategic Intellectual Property Portfolio Management: Technology Appraisal by Using the “Technology Heat Map”
Notes: (1) IPC ‘H04B7’ (wireless transmission systems) and terms in which “IP” and/or “Internet” are included in the keyword; (2) CDMA = code division multiple access, GPS = global positioning system, ID = user identification, LAN = local area network, PHS = personal handyphone system.
Figure 9. Technology Heat Map Analysis for Mobile Communications and IP Communications
Analysis of patent applications (about 3,500) concerning “mobile communications + IP communications”
Electric power
Access point
PHS
Infrared rays Telephone set
Voice
Wireless
Digital dataModule
Call
Short distanceCall termination
ReplayText data
Vehicle-mounted terminal
Phase
Modulation
Processor Subscriber
AntennaFrequency
ControllerData communications
DownlinkChannel
CDMATraffic
Synchronization
Directivity
TimingSignal strength
Packet dataTransmission powerQuality
Base station
SatelliteMobile station Communications speed
CommandLAN
ProtocolMessage
ModeBroadcast
Radio line
InteractiveGateway
Repeater
Wireless LAN
Communications networkIP address
NoticeTime
AddressGPSArea
Identification code
Advertising
Storage mediaProgramInternet
Encryption
Download
ID
Authentication
Location
Data storage
Charging
Telephone numberVehicle Electronic mail
File ProductEmail address
Server
DatabaseMonitoring
SearchPersonal information
Identification informationLocation detection
Location informationNavigation
DestinationMap information
Route
Radio base station
DeliveryInformation delivery
Road
CameraImage pick-up
Image information
Technologies to provide value-added services by applying network technology
Technologies concerning basic networks that form the base of mobile communications

Copyright 2004 by Nomura Research Institute, Ltd. 11
NRI Papers No. 83 December 1, 2004
Strategic Intellectual Property Portfolio Management: Technology Appraisal by Using the “Technology Heat Map”
Note: IPC ‘H04B7’ (wireless transmission systems) and terms in which “IP” and/or “Internet” are included in the keyword.
Figure 10. Technology Heat Map Analysis for Mobile Phone Company E
Portfolio of patents concerning “mobile communications + IP communications” (147 patents)
Electric power
Access point
PHS
Infrared rays Telephone set
Voice
Wireless
Digital dataModule
Call
Short distanceCall termination
ReplayText data
Vehicle-mounted terminal
Phase
Modulation
Processor Subscriber
Antenna FrequencyController
Data communications
DownlinkChannel
CDMATraffic
Synchronization
Directivity
TimingSignal strength
Packet dataTransmission powerQuality
Base station
SatelliteMobile station
Communications speed
CommandLAN
ProtocolMessage
ModeBroadcast
Radio line
InteractiveGateway
Repeater
Wireless LAN
Communications networkIP address
NoticeTime
AddressGPSArea
Identification code
Advertising
Storage mediaProgramInternet
Encryption
Download
ID
Authentication
Location
Data storage
Charging
Telephone numberVehicle Electronic mail
File ProductEmail address
Server
DatabaseMonitoring
SearchPersonal information
Identification informationLocation detection
Location informationNavigation
DestinationMap information
Route
Radio base station
DeliveryInformation delivery
Road
Camera
Image pick-upImage information
Technologies to increase communication speed and improve quality of mobile communications networks
Applied technologies that combine communications networks with IT such as programs, memory media, servers and databases
Note: IPC ‘H04B7’ (wireless transmission systems) and terms in which “IP” and/or “Internet” are included in the keyword.
Figure 11. Technology Heat Map Analysis for Electric Appliance Manufacturer F
Portfolio of patents concerning “mobile communications + IP communications” (226 patents)
Electric power
Access point
PHS
Infrared rays Telephone set
Voice
Wireless
Digital dataModule
Call
Short distanceCall termination
ReplayText data
Vehicle-mounted terminal
Phase
Modulation
Processor Subscriber
AntennaFrequency
ControllerData communications
DownlinkChannel
CDMATraffic
Synchronization
Directivity
TimingSignal strength
Packet dataTransmission powerQuality
Base station
SatelliteMobile station Communications speed
CommandLAN
ProtocolMessage
ModeBroadcast
Radio line
InteractiveGateway
Repeater
Wireless LAN
Communications networkIP address
NoticeTime
AddressGPSArea
Identification code
Advertising
Storage mediaProgramInternet
Encryption
Download
ID
Authentication
Location
Data storage
Charging
Telephone numberVehicle Electronic mailFile Product
Email addressServer
DatabaseMonitoring
SearchPersonal information
Identification informationLocation detection
Location informationNavigation
DestinationMap information
Route
Radio base station
DeliveryInformation delivery
Road
CameraImage pick-up
Image information
Technologies to increase communication speed and improve quality of mobile communications networks
Technologies concerning the supply of electric power and speech path control
Applied technologies that combine communications networks with IT such as programs, memory media, servers and databases
Technologies concerning applications of camera-equipped mobile phones
Copyright 2004 by Nomura Research Institute, Ltd. 12
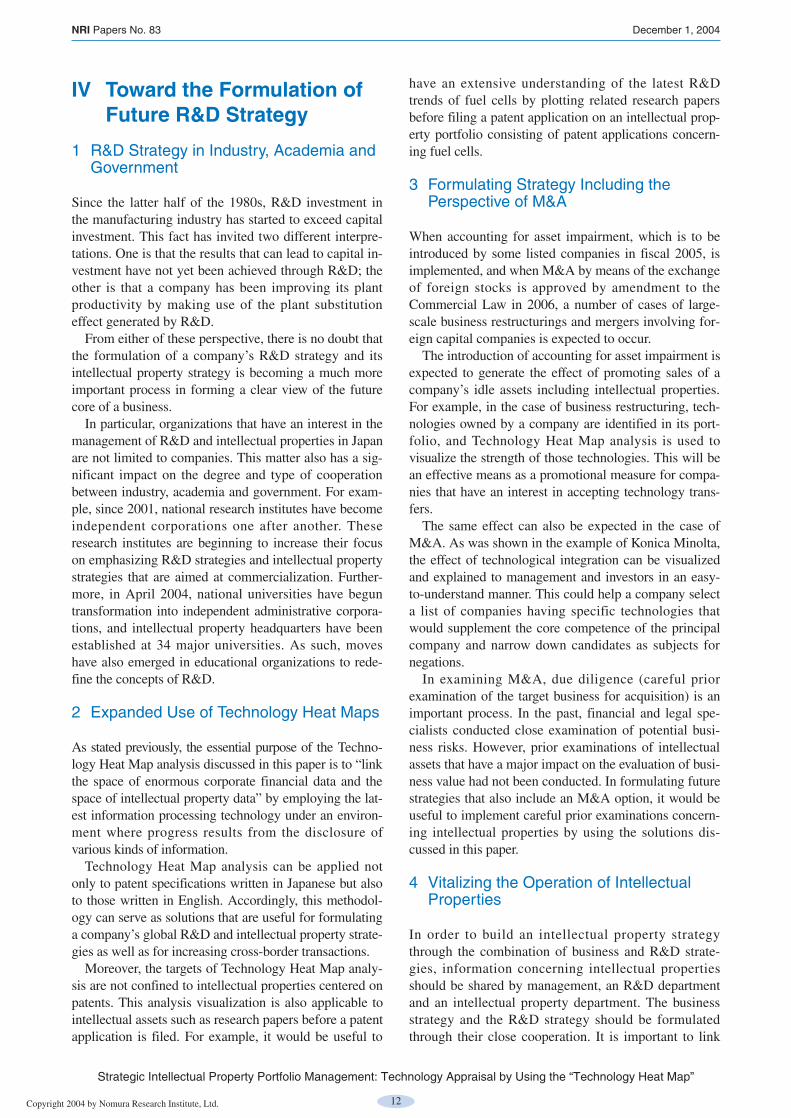
IV Toward the Formulation of Future R&D Strategy
1 R&D Strategy in Industry, Academia andGovernment
Since the latter half of the 1980s, R&D investment inthe manufacturing industry has started to exceed capitalinvestment. This fact has invited two different interpre-tations. One is that the results that can lead to capital in-vestment have not yet been achieved through R&D; theother is that a company has been improving its plantproductivity by making use of the plant substitutioneffect generated by R&D.
From either of these perspective, there is no doubt thatthe formulation of a company’s R&D strategy and itsintellectual property strategy is becoming a much moreimportant process in forming a clear view of the futurecore of a business.
In particular, organizations that have an interest in themanagement of R&D and intellectual properties in Japanare not limited to companies. This matter also has a sig-nificant impact on the degree and type of cooperationbetween industry, academia and government. For exam-ple, since 2001, national research institutes have becomeindependent corporations one after another. Theseresearch institutes are beginning to increase their focuson emphasizing R&D strategies and intellectual propertystrategies that are aimed at commercialization. Further-more, in April 2004, national universities have beguntransformation into independent administrative corpora-tions, and intellectual property headquarters have beenestablished at 34 major universities. As such, moveshave also emerged in educational organizations to rede-fine the concepts of R&D.
2 Expanded Use of Technology Heat Maps
As stated previously, the essential purpose of the Techno-logy Heat Map analysis discussed in this paper is to “linkthe space of enormous corporate financial data and thespace of intellectual property data” by employing the lat-est information processing technology under an environ-ment where progress results from the disclosure ofvarious kinds of information.
Technology Heat Map analysis can be applied notonly to patent specifications written in Japanese but alsoto those written in English. Accordingly, this methodol-ogy can serve as solutions that are useful for formulatinga company’s global R&D and intellectual property strate-gies as well as for increasing cross-border transactions.
Moreover, the targets of Technology Heat Map analy-sis are not confined to intellectual properties centered onpatents. This analysis visualization is also applicable tointellectual assets such as research papers before a patentapplication is filed. For example, it would be useful to
have an extensive understanding of the latest R&Dtrends of fuel cells by plotting related research papersbefore filing a patent application on an intellectual prop-erty portfolio consisting of patent applications concern-ing fuel cells.
3 Formulating Strategy Including thePerspective of M&A
When accounting for asset impairment, which is to beintroduced by some listed companies in fiscal 2005, isimplemented, and when M&A by means of the exchangeof foreign stocks is approved by amendment to theCommercial Law in 2006, a number of cases of large-scale business restructurings and mergers involving for-eign capital companies is expected to occur.
The introduction of accounting for asset impairment isexpected to generate the effect of promoting sales of acompany’s idle assets including intellectual properties.For example, in the case of business restructuring, tech-nologies owned by a company are identified in its port-folio, and Technology Heat Map analysis is used tovisualize the strength of those technologies. This will bean effective means as a promotional measure for compa-nies that have an interest in accepting technology trans-fers.
The same effect can also be expected in the case ofM&A. As was shown in the example of Konica Minolta,the effect of technological integration can be visualizedand explained to management and investors in an easy-to-understand manner. This could help a company selecta list of companies having specific technologies thatwould supplement the core competence of the principalcompany and narrow down candidates as subjects fornegations.
In examining M&A, due diligence (careful priorexamination of the target business for acquisition) is animportant process. In the past, financial and legal spe-cialists conducted close examination of potential busi-ness risks. However, prior examinations of intellectualassets that have a major impact on the evaluation of busi-ness value had not been conducted. In formulating futurestrategies that also include an M&A option, it would beuseful to implement careful prior examinations concern-ing intellectual properties by using the solutions dis-cussed in this paper.
4 Vitalizing the Operation of IntellectualProperties
In order to build an intellectual property strategythrough the combination of business and R&D strate-gies, information concerning intellectual propertiesshould be shared by management, an R&D departmentand an intellectual property department. The businessstrategy and the R&D strategy should be formulatedthrough their close cooperation. It is important to link
NRI Papers No. 83 December 1, 2004
Strategic Intellectual Property Portfolio Management: Technology Appraisal by Using the “Technology Heat Map”
Copyright 2004 by Nomura Research Institute, Ltd. 13
these measures to corporate management focusing onintellectual properties as the core. However, as notedpreviously, while the demand for R&D is increasing inthe face of global competition, many Japanese compa-nies do not yet have sufficient in-house financing capa-bility or profit-earning ability necessary to meet such ademand.
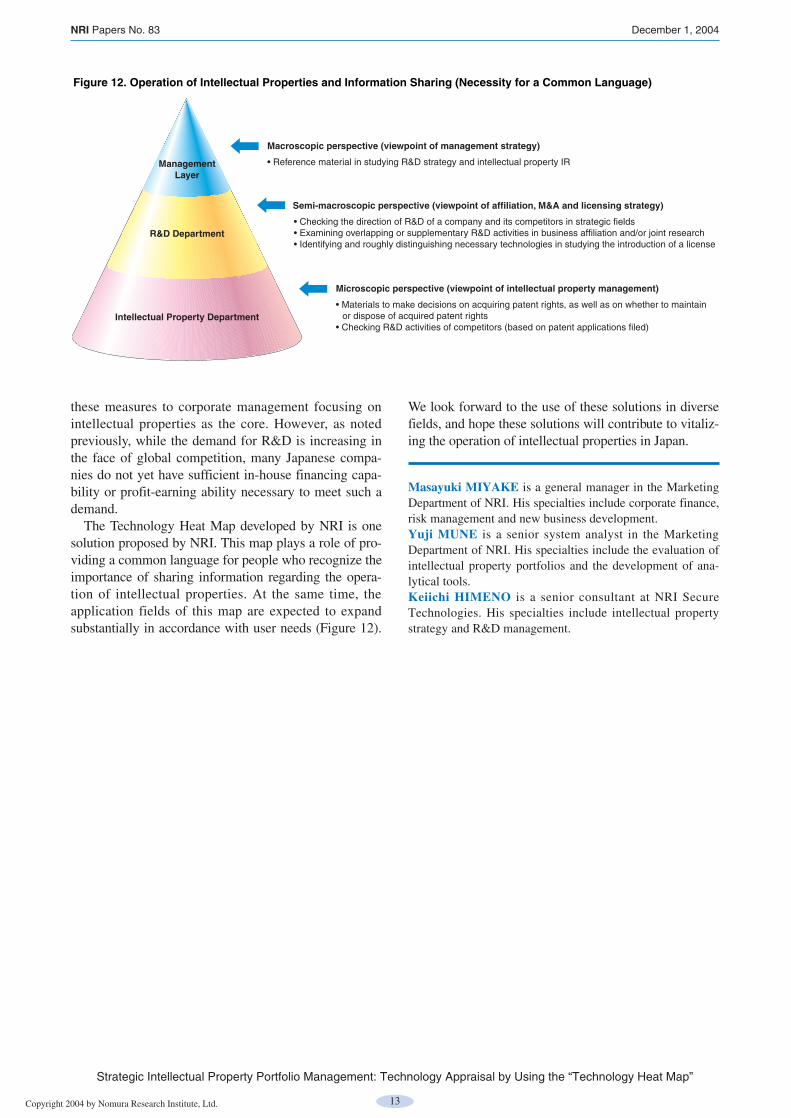
The Technology Heat Map developed by NRI is onesolution proposed by NRI. This map plays a role of pro-viding a common language for people who recognize theimportance of sharing information regarding the opera-tion of intellectual properties. At the same time, theapplication fields of this map are expected to expandsubstantially in accordance with user needs (Figure 12).
We look forward to the use of these solutions in diversefields, and hope these solutions will contribute to vitaliz-ing the operation of intellectual properties in Japan.
Masayuki MIYAKE is a general manager in the MarketingDepartment of NRI. His specialties include corporate finance,risk management and new business development.Yuji MUNE is a senior system analyst in the MarketingDepartment of NRI. His specialties include the evaluation ofintellectual property portfolios and the development of ana-lytical tools.Keiichi HIMENO is a senior consultant at NRI SecureTechnologies. His specialties include intellectual propertystrategy and R&D management.
NRI Papers No. 83 December 1, 2004
Strategic Intellectual Property Portfolio Management: Technology Appraisal by Using the “Technology Heat Map”
Figure 12. Operation of Intellectual Properties and Information Sharing (Necessity for a Common Language)
ManagementLayer
R&D Department
Intellectual Property Department
Macroscopic perspective (viewpoint of management strategy)
• Reference material in studying R&D strategy and intellectual property IR
Microscopic perspective (viewpoint of intellectual property management)
• Materials to make decisions on acquiring patent rights, as well as on whether to maintain or dispose of acquired patent rights
• Checking R&D activities of competitors (based on patent applications filed)
Semi-macroscopic perspective (viewpoint of affiliation, M&A and licensing strategy)
• Checking the direction of R&D of a company and its competitors in strategic fields• Examining overlapping or supplementary R&D activities in business affiliation and/or joint research• Identifying and roughly distinguishing necessary technologies in studying the introduction of a license

As a leading think tank and system integrator in Japan, Nomura Research Institute is openingnew perspectives for the social paradigm by creating intellectual property for the benefit of allindustries. NRI’s services cover both public and private sectors around the world throughknowledge creation and integration in the three creative spheres: “Research and Consulting,”“Knowledge Solutions” and “Systems Solutions.”
The world economy is facing thorough structural changes led by the dramatic growth of ITindustries and the rapid expansion of worldwide Internet usage—the challenges of whichrequire new concepts and improvement of current systems. NRI devotes all its efforts toequipping its clients with business strategies for success by providing the best in knowledgeresources and solutions.
NRI Papers present selected works of NRI’s 3,000 professionals through its worldwide researchnetwork. The mission of NRI Papers is to contribute new ideas and insights into businessmanagement and future policy planning, which are indispensable for overcoming obstaclesto the structural changes in our society.
All copyrights to NRI Papers are reserved by NRI. No part of this publication may bereproduced in any form without the prior written consent of NRI.
Inquiries to: Corporate Communications DepartmentNomura Research Institute, Ltd.E-mail: [email protected]: +81-3-5533-3230