strategic flood risk assessment - geosmart...
TRANSCRIPT

Devon Minerals Plan
Strategic Flood Risk Assessment
River Exe 2012
March 2013
Devon County Council Minerals and Waste Development Framework

Devon Minerals Plan: Strategic Flood Risk Assessment March 2013
2
Devon Minerals Plan: Strategic Flood Risk Assessment March 2013
3
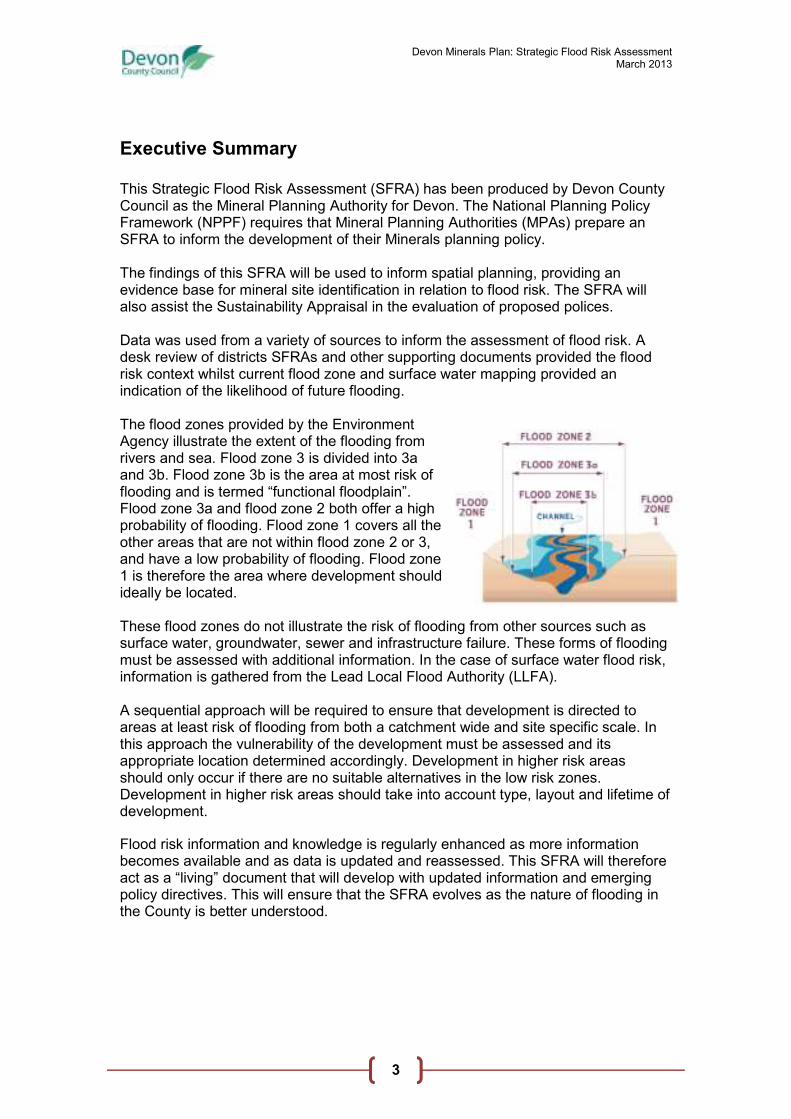
Executive Summary This Strategic Flood Risk Assessment (SFRA) has been produced by Devon County Council as the Mineral Planning Authority for Devon. The National Planning Policy Framework (NPPF) requires that Mineral Planning Authorities (MPAs) prepare an SFRA to inform the development of their Minerals planning policy. The findings of this SFRA will be used to inform spatial planning, providing an evidence base for mineral site identification in relation to flood risk. The SFRA will also assist the Sustainability Appraisal in the evaluation of proposed polices. Data was used from a variety of sources to inform the assessment of flood risk. A desk review of districts SFRAs and other supporting documents provided the flood risk context whilst current flood zone and surface water mapping provided an indication of the likelihood of future flooding. The flood zones provided by the Environment Agency illustrate the extent of the flooding from rivers and sea. Flood zone 3 is divided into 3a and 3b. Flood zone 3b is the area at most risk of flooding and is termed “functional floodplain”. Flood zone 3a and flood zone 2 both offer a high probability of flooding. Flood zone 1 covers all the other areas that are not within flood zone 2 or 3, and have a low probability of flooding. Flood zone 1 is therefore the area where development should ideally be located. These flood zones do not illustrate the risk of flooding from other sources such as surface water, groundwater, sewer and infrastructure failure. These forms of flooding must be assessed with additional information. In the case of surface water flood risk, information is gathered from the Lead Local Flood Authority (LLFA). A sequential approach will be required to ensure that development is directed to areas at least risk of flooding from both a catchment wide and site specific scale. In this approach the vulnerability of the development must be assessed and its appropriate location determined accordingly. Development in higher risk areas should only occur if there are no suitable alternatives in the low risk zones. Development in higher risk areas should take into account type, layout and lifetime of development.
Flood risk information and knowledge is regularly enhanced as more information becomes available and as data is updated and reassessed. This SFRA will therefore act as a “living” document that will develop with updated information and emerging policy directives. This will ensure that the SFRA evolves as the nature of flooding in the County is better understood.
Devon Minerals Plan: Strategic Flood Risk Assessment March 2013
4
Table of Contents
Executive Summary&&&&&&&&&&&&&&&&&&&&&&&.3 List of Figures&&&&&&&&&&&&&&&&&&&&&&&&&....5
1. Introduction&&&&&&&&&&&&&&&&&&&&&&&6 2. Planning Policy Context&&&&&&&&&&&&&&&&11 3. Profile of the Plan Area&&&&&&&&&&&&&&&.&..17 4. Mineral Development and Flood Risk&&&&&&&&&26 5. Assessment of Flood Risk&&&&&&&&&&&..&.&&.30 6. Catchment Area Flood Risk Characteristics&&&&.&.38 7. Sequential Approach to Flood Risk in the&&&&..&&.62 Planning Process 8. Sustainable Management of Flood Risk&&&&&..&&.68 Through Development 9. Mitigation of Residual Flood Risk&&&&&&&&&&&73 10. Conclusions and Recommendations&&&&&&&...&..76 References&&&&&&&&&&&&&&&&&&&&&&&&&&&78 Appendix A: Glossary&&&&&&&&&&&&&&&&&&&&&&79 Appendix B: Sequential Test Template for Planning Authorities&..&.83 Appendix C: Environment Agency Comments on Draft SFRA&&.&..86

Devon Minerals Plan: Strategic Flood Risk Assessment March 2013
5
List of Figures Figure 1.1: The of Mineral and Waste Development Framework 6
Figure 1.2: The Flood Risk Management Hierarchy 7
Figure 1.3: Section breakdown in accordance with the Flood Risk Hierarchy 8
Figure 1.4: Devon County Council Plan Area 9
Figure 2.1: District Council SFRAs within the Plan Area 14
Figure 2.2: Table of adjacent Councils SFRAs adjoining the Plan Area 15
Figure 3.1: The key environmental designations within Devon 17
Figure 3.2: The Topography of Devon 18
Figure 3.3: The Watercourse Network within Devon 19
Figure 3.4: The Road Network within Devon 20
Figure 3.5: Recommended contingency allowances for the net sea level rises 21
Figure 3.6: Recommended national precautionary sensitivity ranges 22
Figure 3.7: Indication of the mineral concentrations within the Plan Area 25
Figure 4.1: Minerals spatial strategy within the Plan Area 27
Figure 5.1: Flood Risk Hierarchy 30
Figure 5.2: Source-Pathway-Receptor approach 30
Figure 5.3: Flood Zone Classification 31
Figure 5.4: Example of flood zone mapping 32
Figure 5.5: Example of flood zone mapping in a tidal area 33
Figure 5.6: Example of FMfSW and AStSWF surface water flood mapping 34
Figure 5.7: Map of areas at possible risk of groundwater flooding 36
Figure 5.8: Table of South West Water reservoirs 37
Figure 6.1: The catchment area breakdown 38
Figure 6.2: North Devon Catchment Area 39
Figure 6.3: North Devon Catchment historic sources of flooding 40
Figure 6.4: North Devon Catchment flood zones 41
Figure 6.5: North Devon Inset Map A 41
Figure 6.6: North Devon Inset Map B 41
Figure 6.7: North Devon Inset Map C 42
Figure 6.8: North Devon Inset Map D 42
Figure 6.9: North Devon Inset Map E 42
Figure 6.10: River Tamar Catchment area 44
Figure 6.11: River Tamar historic sources of flooding 45
Figure 6.12: River Tamar catchment flood zones 46
Figure 6.13: Tamar Inset Map A 47
Figure 6.14: Tamar Inset Map B 47
Figure 6.15: Tamar Inset Map C 47
Figure 6.16: Tamar Inset Map D 47
Figure 6.17: South Devon Catchment Area. 49
Figure 6.18: South Devon Catchment historic sources of flooding 50
Figure 6.19: South Devon Catchment flood zones 51
Figure 6.20: South Devon Inset Map A 51
Figure 6.21: South Devon Inset Map B 51
Figure 6.22: South Devon Inset Map C 52
Figure 6.23: South Devon Inset Map D 52
Figure 6.24: River Exe Catchment area 53
Figure 6.25: River Exe Catchment historic sources of flooding 54
Figure 6.26: River Exe Catchment flood zones 55
Figure 6.27: River Exe Inset Map A 56
Figure 6.28: River Exe Inset Map B 56
Figure 6.29: River Exe Inset Map C 56
Figure 6.30: River Exe Inset Map D 56
Figure 6.31: East Devon Catchment Area 57
Figure 6.32: East Devon Catchment historic sources of flooding 58
Figure 6.33: East Devon Catchment flood zones 59
Figure 6.34: East Devon Inset Map A 60
Figure 6.35: East Devon Inset Map B 60
Figure 6.36: East Devon Inset Map C 60
Figure 7.1: Flood Risk Hierarchy 62
Figure 7.2: Flood Risk Vulnerability Classification 63
Figure 7.3: Flood Risk Vulnerability and Flood Zone Compatibility 63
Figure 7.4: Guidance for developers when making planning applications 67
Figure 8.1: Flood Risk Hierarchy 68
Figure 8.2: Table of SuDS components 70
Figure 8.3: Diagram of how SuDS can be used at a local scale 72
Figure 9.1 Flood Risk Hierarchy 73

Devon Minerals Plan: Strategic Flood Risk Assessment March 2013
6
1. Introduction 1.1 Devon County Council adopted its Minerals Local Plan in June 2004, and its
policies are “saved” until the adoption of a replacement plan. The County Council began the preparation of the Minerals and Waste Development Framework in 2006, and this will contain a new plan - the Devon Minerals Plan - for the period until 2031 that will replace the existing plan.
1.2 The Devon Minerals Plan will provide the long term, strategic planning policy
direction for mineral development in Devon, informing decisions on mineral planning applications. It will include the spatial approach for delivering an appropriate supply of mineral resources over the plan period in the context of promoting environmental, economic and social benefits.
1.3 The Devon Minerals Plan is required to undergo Sustainability Appraisal (SA).
This evaluates the possible environmental, social and economic effects of proposed polices, fulfilling the requirements of the European Union Strategic Environmental Assessment (SEA) Directive. Figure 1.1 demonstrates the documents that will deliver the Minerals & Waste Development Framework, and the SA process that sits within this framework.
Figure 1.1 The Minerals and Waste Development Framework
Minerals and Waste
Development
Framework
Sustainability Appraisal (SA)
Development Plan Documents
Annual Monitoring
Report
Minerals and Waste
Development Scheme
Statement of Community
Involvement
Supplementary Planning
Documents
Devon
Waste Plan
Devon
Minerals Plan

Devon Minerals Plan: Strategic Flood Risk Assessment March 2013
7
1.4 This SA process identifies any significant effect resulting from elements of the Devon Minerals Plan according to sustainability objectives. Reducing the risk of flooding (including coastal flooding) is one of these objectives. Indicators are analysed against draft policy and proposals to provide a level of potential impact, thereby evaluating how the plan contributes to flood risk impact. These indicators include for example, whether the plan will maintain or enhance floodplain capacity.
1.5 National planning policy highlights the primacy of sustainability and, in
particular, protection from climate change. This stresses that authorities need to mitigate and adapt to projected impacts, including the likelihood of increased flood risk.
1.6 Policy provided in National Planning Policy Framework (NPPF) emphasises
this requirement by stating:
“Inappropriate development in areas at risk of flooding should be avoided by directing development away from areas at highest risk, but where development is necessary, making it safe without increasing flood risk elsewhere”1
1.7 This policy guidance understands that the most sustainable solution to the
threat of flood risk is a planning led one, where development is strategically directed away from the areas at the highest risk of flooding from inception, requiring that Mineral Planning Authorities (MPA) take a risk-based approach to flooding.
1.8 This can be achieved through a hierarchy of 5 steps. To assess, to avoid, to
substitute, to control and finally to mitigate against flood risk. Taking this approach ensures that consideration is given to potential flood risk impact at all levels of the planning system.
The Flood Risk Hierarchy
Figure 1.2: The Flood Risk Management Hierarchy
1 Para 100, NPPF can be accessed at
http://www.communities.gov.uk/documents/planningandbuilding/pdf/2116950.pdf
Step 1
Assess
Appropriate flood risk
assessment
Step 2
Avoid
Apply the sequential approach
Step 3
Substitute
Apply the Sequential Test at site
level
Step 4
Control
e.g. SUDS, design, flood
defences
Step 5
Mitigate
e.g. Flood resilient
construction

Devon Minerals Plan: Strategic Flood Risk Assessment March 2013
8
Purpose of this Document 1.9 This SFRA performs a crucial role in the first step of the flood risk hierarchy,
to “assess” flood risk appropriately. The assessment of various forms of flooding will be presented in section 5 and the assessment of flood risk characteristics for the MPA area will be presented in section 6.
1.10 The subsequent steps to “avoid” and “substitute” ensure that development is
located according to its vulnerability to flooding. This SFRA will provide the information required to apply this sequential approach in section 7.
1.11 The final steps to “control” and “mitigate” provide that development includes
measures to reduce the impact of flooding. This is achieved through flood related management plans and design measures such as sustainable drainage. The appropriate approaches to control flood risk will be considered in section 8.
1.12 It is important to understand that risk of flooding cannot be entirely eradicated.
Therefore management and mitigation of this residual flood risk will therefore be considered in section 9.
Figure 1.3: Section breakdown in accordance with the Flood Risk Hierarchy
1.13 This assessment of flood risk will consider the area for which Devon County
Council is the Mineral Planning Authority and will be referred to from here as the Plan Area. This does not include the areas under the administration of Torbay Council, Plymouth City Council, and the National Parks of Dartmoor and Exmoor, as they act as Mineral Planning Authorities in their own right. Figure 1.4 outlines the area for which Devon County Council is the Mineral Planning Authority.
1.14 It is intended that the information provided within this SFRA will inform the site
assessment process in preparing the Devon Minerals Plan, and will be an important source of information in the evaluation of future mineral development. The document will provide guidance for decision making in minerals development management, the mineral industry and interested stakeholders.
Step 2
Avoid
Step 3
Substitute
Step 4
Control
Step 5
Mitigate
Section 5 & Section 6
Section 9
Step 1
Assess
Section 8
Section 7

Devon Minerals Plan: Strategic Flood Risk Assessment March 2013
9
© Crown Copyright and database right 2013. Ordnance Survey 100019783.
Figure 1.4 Devon County Council Plan Area
1.15 The objectives of this SFRA are to:
♦ provide an assessment of the impact of all potential sources of flooding, including assessment of any implications associated with climate change and flood risk;
♦ provide the information needed to apply the sequential approach and exception test in site identification and assessment in mineral development;
♦ ensure that mineral planning policies are developed to minimise and manage flood risks;
♦ provide an additional source of data that can be used to inform the Sustainability Appraisal of future minerals strategy; and
♦ provide guidance on the applicability of sustainable drainage systems (SuDS) techniques for managing surface water run-off.
1.16 If during site identification for policy development work there are not sufficient
areas appropriate for site allocation within appropriate flood zones, it may be necessary to commission a further document which provides a wider
Devon Minerals Plan: Strategic Flood Risk Assessment March 2013
10
investigation into areas at risk of flooding. This would increase the scope of the SFRA for sites where an Exception Test is required.
1.17 Principally a desk based review, this SFRA will draw upon information found
within appropriate policy and current flood risk data. The information will be derived from a variety of sources to ensure that the final document is as accurate as possible. The sources of information that will be used to inform this assessment include:
♦ District Strategic Flood Risk Assessments (SFRAs)
♦ Catchment Flood Management Plans (CFMPs)
♦ Regional Flood Risk Appraisal (RFRA)
♦ Environment Agency Flood Map (covering river and tidal flooding)
♦ locally agreed surface water and groundwater maps derived from a number of sources
1.18 Consultation formed a key part of the validation process for this SFRA.
Stakeholders consulted in the production of this document included the Environment Agency and Devon County Council acting as the Highways Authority and the Lead Local Flood Authority within the Plan area.
1.19 The comments that were provided by the Environment Agency on the draft
SFRA are included as Appendix C, and these have been addressed through additional text to cover the issues raised.

Devon Minerals Plan: Strategic Flood Risk Assessment March 2013
11
2. Planning Policy Context 2.1 This section provides an outline of the planning policy framework informing
flood risk and mineral planning. Providing the context for the SFRA, the policy framework offers appropriate guidance to Mineral Planning Authorities complemented by policies and objectives from the Environment Agency.
National Planning and Flood Risk Policy National Planning Policy Framework (NPPF)
2.2 The National Planning Policy Framework2 advises that sustainability should
be at the heart of planning and identifies the need to make land available for development in line with economic, social and environmental objectives, with a presumption in favour of facilitating sustainable development. Meeting the challenge of climate change, flooding and coastal change is one of the thirteen key principals in achieving sustainable development.
Technical Guidance to the National Planning Policy Framework
2.3 The technical guidance that supports the contents of the NPPF3 outlines
Government’s national policy on development, flood risk and certain aspects of minerals policy.
2.4 The guidance aims to ensure that flood risk is taken into account at all stages
in the planning process to avoid inappropriate development in areas at risk of flooding, directing development away from areas at highest risk. This is delivered through a sequential based approach where development and risk is considered together through a vulnerability classification system. This requires that the most vulnerable development is located in areas of least risk.
2.5 The process is managed through flood risk assessments and the application
of Sequential Tests and Exception Tests. These flood risk assessments range from the high level strategic assessment covering administrative boundaries to the site-specific.
2.6 The document also provides technical guidance in relation minerals policy
and key issues in the working of minerals. Issues covered include: the proximity of mineral workings to communities, dust emissions, noise emissions, stability in surface mine workings and policy in relation to the restoration and aftercare of minerals sites.
DEFRA - Making Space for Water
2.7 Department for Environment Food and Rural Affairs (DEFRA) published the
“Making Space for Water”4 strategy in 2005 as the coastal erosion and flood
2 NPPF can be viewed at
http://www.communities.gov.uk/documents/planningandbuilding/pdf/2116950.pdf 3 NPPF Technical Guidance can be viewed at
www.communities.gov.uk/publications/.../nppftechnicalguidance.pdf 4 Making Space for Water, Government Response to Consultation can be viewed at
http://www.defra.gov.uk/environment/flooding/documents/policy/strategy/strategy-response1.pdf

Devon Minerals Plan: Strategic Flood Risk Assessment March 2013
12
risk management strategy for England. It advised that flood risk management solutions should be viewed holistically through a continuing commitment to Catchment Flood Management Plans and Shoreline Management Plans. It also promotes a general “greening” of flood risk mitigation methods, moving away from hard infrastructure solutions.
2.8 This guidance states that the management of flood risk should be achieved by
employing an integrated portfolio of approaches, reflecting national and local priorities to reduce the threat to people and property.
2.9 It underlines that planning policy should be designed to minimise flood risk,
stating that its preparation should provide a broad management matrix and be informed by the preparation of flood risk assessments at all stages of the planning process.
Regional Planning and Flood Risk Policy
Draft Regional Spatial Strategy for the South West 2006-2026 2.10 The draft RSS5 was published, and revised in 2008. The RSS would have
superseded RPG10, had it been adopted. Since then, the Government has revoked the requirement to produce a RSS through the Localism Act. At the time of writing, the evidence which informed the development of the revised RSS can still be used as a consideration to inform the production of the Devon Minerals Plan.
2.11 The draft RSS sets out the priorities for managing flood risk, and policy F1
confirms that a sequential approach to development should be adopted.
South West Regional Flood Risk Appraisal (RFRA) 2.12 In February 2007 the South West Regional Assembly published the RFRA6.
This document provided a broad understanding of the risks associated with flooding in the South West, acting as evidence used to inform the RSS.
2.13 The RFRA considers nine sub regions, three of which are directly relevant to
the development of mineral policy in Devon. These sub regions are Exeter, Torbay and Plymouth, South East Cornwall and West Devon.
Sub Regional Planning and Flood Risk Policy
Devon Structure Plan 2001 to 2016 2.14 The Structure Plan7 was adopted in 2004. Although the Planning and
Compulsory Purchase Act removed the statutory duty for upper-tier authorities to produce a Structure Plan, its policies have been saved for an extended period under transitional arrangements. The Structure Plan identifies the strategic planning policies for Devon, Plymouth and Torbay and
5 The draft RSS can be viewed at http://www.southwestra.gov.uk/nqcontent.cfm?a_id=836
6 The RFRA is available at http://www.southwest-ra.gov.uk/nqcontent.cfm?a_id=2684
7 Available at http://www.devon.gov.uk/structureplan

Devon Minerals Plan: Strategic Flood Risk Assessment March 2013
13
the broad locations for sub-regional development. Policy CO13 seeks to ensure that development should not be located where there would be a direct risk from flooding, or where development would increase the flood risk elsewhere.
2.15 At the time of writing, the Structure Plan is still part of the Development Plan
for Devon. Government has, however, announced its intention to abolish the Structure Plan through provisions made in the Localism Act.
Minerals Local Plan
2.16 Devon County Council adopted its Minerals Local Plan8 in 2004, however, the
Planning and Compulsory Purchase Act introduced a duty to replace this with a development framework. Devon County Council is fulfilling this requirement by producing the Minerals and Waste Development Framework. The policies within the Minerals Local Plan are saved for an extended period, and provide the current mineral planning framework for Devon until the new plan is formally adopted.
2.17 Within its policies the water environment receives special consideration. In
policy MP 47, it advises that “proposals for mineral development that would reduce storage capacity in areas functioning as floodplain or increase the risk of flooding of sensitive areas will not be permitted”.
2.18 The current document includes inset plans of those quarries and mineral
transportation facilities that are currently in use or likely to be used in the future. Each of these identifies the extent of the floodplain as it was defined at the time of adoption of the plan (it should be noted that floodplain maps are regularly reviewed, and the inset plans may therefore now be inaccurate in their depiction of the floodplains).
2.19 This SFRA will influence the allocation of sites in the development of the
latest Devon Minerals Plan which will supersede this document.
Bovey Basin Strategy 2.20 This Strategy9 was published in 2000 by the County Council and is a non-
statutory document that informed the Minerals Local Plan on ball clay working in the Basin. One of the issues considered in the strategy was flooding. It was recognised that mineral working had contributed to the progressive reduction of the area’s historic floodplain.
2.21 It was suggested that some of the currently inactive mineral working areas
within the floodplain could be candidates for ‘trading’, whereby their planning permissions are revoked when new permissions are given elsewhere in the Basin to minimise the potential impact of flooding, and maintain the Basins overall floodplain capacity.
8 Available at http://www.devon.gov.uk/index/environmentplanning/planning-system/planning_minerals_and_waste/minerals_planning/minerals_local_plan.htm 9 Available at http://www.devon.gov.uk/index/environmentplanning/planning-
system/planning_minerals_and_waste/minerals_planning/minerals_development_framework/boveybasinactionplan.htm

Devon Minerals Plan: Strategic Flood Risk Assessment March 2013
14
Local Planning and Flood Risk Policy 2.22 The Planning and Compulsory Purchase Act introduced a duty for each Local
Planning Authority to produce a Local Development Framework (LDF). LDFs include local level plans that set out a spatial vision for the area, key strategic objectives, planning policies and development allocations.
District Council Strategic Flood Risk Assessments (SFRA)
2.23 Part of the preparation of the LDF requires each of the eight district councils
within the framework boundary to prepare an SFRA. The district council SFRAs provide a localised, refined source of information in relation to the probability of flooding, and specifically review areas with emerging housing and employment land use requirements.
2.24 The district SFRAs provide the basis by which to assess flood risk and apply
sequential test, steering development away from the areas at most risk. Figure 2.1 shows the status of District Councils SFRAs. The content, detail and coverage vary between the documents as each authority is responsible for producing their own SFRA.
Council Prepared by Comments
East Devon District Council Halcrow Completed Sep 08
Exeter City Council Pell Frishmann Consultants Completed Feb 08
Mid Devon District Council Hyder Consulting Completed Jun 08
North Devon Council Jointly - Torridge Completed Feb 09
South Hams District Council Scott Wilson Consultants Completed Jun 07
Teignbridge District Council Royal Haskoning Updated Mar 11
Torridge District Council Jointly - North Devon Completed Feb 09
West Devon Borough Council JE Jacobs Completed Oct 07
Figure 2.1: District Council SFRAs within the Plan Area
Adjacent Strategic Flood Risk Assessments
2.25 The Plan Area excludes the Unitary Authority areas of Plymouth and Torbay,
together with Dartmoor and Exmoor National Parks. Hydrological processes do not adhere to administrative boundaries, and so processes occurring in these areas can affect the flood risk conditions within the Plan Area, subsequently it is important that when assessing flood risk, documents produced in neighbouring areas are also considered. Figure 2.2 demonstrates the available SFRAs for the adjacent councils.

Devon Minerals Plan: Strategic Flood Risk Assessment March 2013
15
Council Prepared by Comments
Exmoor National Park Scott Wilson Completed Mar 09
Dartmoor National Park Scott Wilson Completed Nov 10
Torbay Council Torbay Council Updated Aug 10
Plymouth City Council Pell Frischmann Completed Jul 06
Cornwall Council Cornwall Council Completed Nov 09
Dorset County Council Halcrow Group Ltd Completed Dec 10
Somerset County Council Scott Wilson Updated Apr 10
Figure 2.2: Adjacent Councils’ SFRAs adjoining the Plan Area
Environment Agency Policy
River Basin Management Plans 2.26 River Basin Management Plans (RBMPs) are prepared to fulfil the objectives
of the European Union’s Water Framework Directive. They provide a broad context for CFMPs and SMPs, together with comprehensive plans for river basin management. The South West River Basin Management Plan prepared by the EA outlines the characteristics, processes and pressures of the regions river basins.
Catchment Flood Management Plans
2.27 A series of Catchment Flood Management Plans (CFMPs) have been
prepared by the Environment Agency (EA). These are designed to act as high level strategic documents that provide an overview of the main sources of flood risk for the specific catchment. This catchment based approach defines the assessment boundary by river pattern, allowing for consideration of all the flood risk conditions.
2.28 There are five CFMPs that are relevant to the framework boundary and relate
to the following catchments: The Tamar Catchment, The East Devon Catchment, The North Devon Catchment, The River Exe Catchment; and The South Devon Catchment.
Shoreline Management Plans
2.29 Shoreline Management Plans (SMPs) offer strategic guidance designed to
assist in coastal defence decision making. They aim to identify sustainable, strategic coastal defence options as part of an overall framework for dealing with flood risk, whilst taking into account the influence and needs of both the natural and the built environment.
Devon Minerals Plan: Strategic Flood Risk Assessment March 2013
16
2.30 There are two SMPs that are relevant to the framework area. The Hartland Point to Anchor Head SMP, which presents the strategy for the north coast, and The Durlston Head to Rame Head SMP, which provides the strategy for the south coast.
Summary 2.31 Planning policy provided on a national, regional, sub-regional and local level
provides an essential foundation an on which to consider future mineral development, ensuring that decisions and conditions are applied consistently at all stages in the planning system. Planning policy, complimented by European Directives and Environment Agency guidance, is essential in achieving future sustainability with respect to flood risk management.

Devon Minerals Plan: Strategic Flood Risk Assessment March 2013
17
3. Profile of the Plan Area 3.1 This section provides a profile of the framework area and considers the
relevant characteristics it presents. Descriptions of the spatial profile of the area will be made, including the topography of the land, and the river and road networks. Details of the current climate will be presented, as well as expected future climate change characteristics. Finally Devon’s current mineral profile will be considered, together with how this many change to remain in line with future strategic considerations.
Spatial Profile 3.2 Devon sits to the east of Cornwall and to the west of Somerset and Dorset on
the south west England peninsular. It is bordered to the north and the south by sea. Devon is predominantly rural, with rural areas covering 90% of the land area. The county includes many areas of exceptional countryside including Dartmoor National Park and the western portion of Exmoor National Park, and includes five Areas of Outstanding Natural Beauty (AONB) and parts of two World Heritage Sites, as can be seen in figure 3.1.
© Crown Copyright and database right 2013. Ordnance Survey 100019783.
Figure 3.1: The key environmental designations within Devon
3.3 There are over 30 different landscape character zones in Devon and over
50% of Devon’s land area is recognised as being of high cultural and heritage

Devon Minerals Plan: Strategic Flood Risk Assessment March 2013
18
value10. There are a host of conservation areas and listed buildings together with extensive archaeological remains of national and local importance.
3.4 The variety of Devon’s landscape is partly dependent on its topography which
can be seen in Figure 3.2. The areas of highest land sit at over 350 metres above sea level. Many of the rivers in Devon rise on Dartmoor in the centre of the county and flow north or south to the coasts. North Devon has two large river catchments, the River Taw and the River Torridge which reach the sea at Barnstaple and Bideford respectively. South Devon holds more major watercourses, the principal rivers being the Exe, Teign, Plym, Tamar, and Dart.
© Crown Copyright and database right 2013. Ordnance Survey 100019783.
Figure 3.2: The topography of Devon
3.5 The County’s settlement pattern is a vital consideration in terms of flood risk
assessment. The topography and watercourses of Devon have gone some way to produce the settlement pattern seen in the county, with the greater areas of low lying land in South Devon, together with the large number of navigable rivers, producing larger numbers of settlements here than in North Devon. The major settlements of Exeter, Plymouth and Torbay are all in the
10 Devon Strategic Partnership (2004) ‘A Community Strategy for Devon’

Devon Minerals Plan: Strategic Flood Risk Assessment March 2013
19
south of the county, as are larger towns such as Newton Abbot and Exmouth together with a series of market towns such as Totnes and Honiton. North Devon contains one large town, Barnstaple, and other market towns such as Bideford and Torrington, as can be seen in figure 3.3. This settlement pattern has a significant impact on flood risk and surface water runoff, as flood risk is gauged according to impacts on people and property, and development is a major factor in increasing surface water runoff.
© Crown Copyright and database right 2013. Ordnance Survey 100019783.
Figure 3.3: The Watercourse Network within Devon
3.6 According to the recently published Preliminary Flood Risk Assessment11
(PFRA), there are nearly 44, 000 properties at risk of surface water flooding within the framework area. As a result, Devon County Council, ranks 8th nationally for the number of properties at risk of surface water flooding.
3.7 The county’s extensive highway network is another important consideration.
There are over 12,800km of country roads in Devon, more than any other highway authority in England. The county also relies heavily on a few critical
11 A copy can be accessed at http://www.devon.gov.uk/devonpfra.pdf

Devon Minerals Plan: Strategic Flood Risk Assessment March 2013
20
transport routes, such as the M5, the A30 and the A38. Figure 3.4 shows the road network in Devon.
© Crown Copyright and database right 2013. Ordnance Survey 100019783.
Figure 3.4: The Road Network Within Devon
3.8 Roads are a significant contributor to surface water runoff, not only providing
an impermeable surface, limiting infiltration, but also by creating an artificial watercourse, increasing the velocity of runoff into the ordinary water courses. Inundation of all or any of these routes would cause significant disruption in the county.
3.9 As the Highways Authority within the framework area. Devon County Council
has responsibility for the drainage of these roads. Surface water runoff is therefore a significant concern for the County Council.

Devon Minerals Plan: Strategic Flood Risk Assessment March 2013
21
Climate Profile 3.10 The South West Peninsula is the warmest area in Britain extending forward
into the mild rain-bearing winds of the Atlantic. This maritime location produces a warm, temperate, humid climate with occasional frost that is tempered throughout the year by the influence of the sea.
3.11 The highest rainfall is in December and January when the sea is still warm
enough to ensure high levels of air humidity and the Atlantic depressions are most active. April to July is the driest period when the sea is relatively cool. Coastal areas can receive 900-1,000mm of rainfall annually, but up to double this amount falls on Dartmoor and Exmoor due to the topography. Areas sheltering in the lee of high ground receive less rainfall, as is the case in Exeter, which can receive in the region of 800mm annually. The south west peninsula is subject to rare, but very heavy rainfall events.
3.12 It is assumed that we are already committed to the level of climate change
projected for the 2020s as a result of historic and present global emissions. It is therefore important to consider climate change impacts on flood risk and its interaction with development today, to build resilience for the future.
3.13 The potential influence of climate change (the increase in rainfall and sea
level rise) could significantly affect risk of flooding, and as such contingency allowances must be made for these changes when assessing planning decisions. The NPPF provides technical guidance into how this contingency allowance should be applied.
Net sea level rise (mm per year) relative to 1990 in South-west England
1990 to 2025 2025 to 2055 2055 to 2085 2085 to 2115
3.5mm
8.0mm
11.5mm
14.5mm
Figure 3.5: Recommended contingency allowances for the net sea level rises
(amended from NPPF Technical Guidance - table 4)12
3.14 Global sea level will continue to rise depending on greenhouse gas emissions, and the sensitivity of the climate system. The relative sea level rise in England also depends on the local vertical movement of the land (generally falling in the south-east and rising in the north and west). The allowances that should be applied for the rates of relative sea level rise are shown in Figure 3.5 and should be used as a starting point for considering flooding from the sea, along with the sensitivity ranges for wave height and wind speed in Figure 3.6.
12 NPPF Technical Guidance can be viewed at
www.communities.gov.uk/publications/.../nppftechnicalguidance.pdf
Devon Minerals Plan: Strategic Flood Risk Assessment March 2013
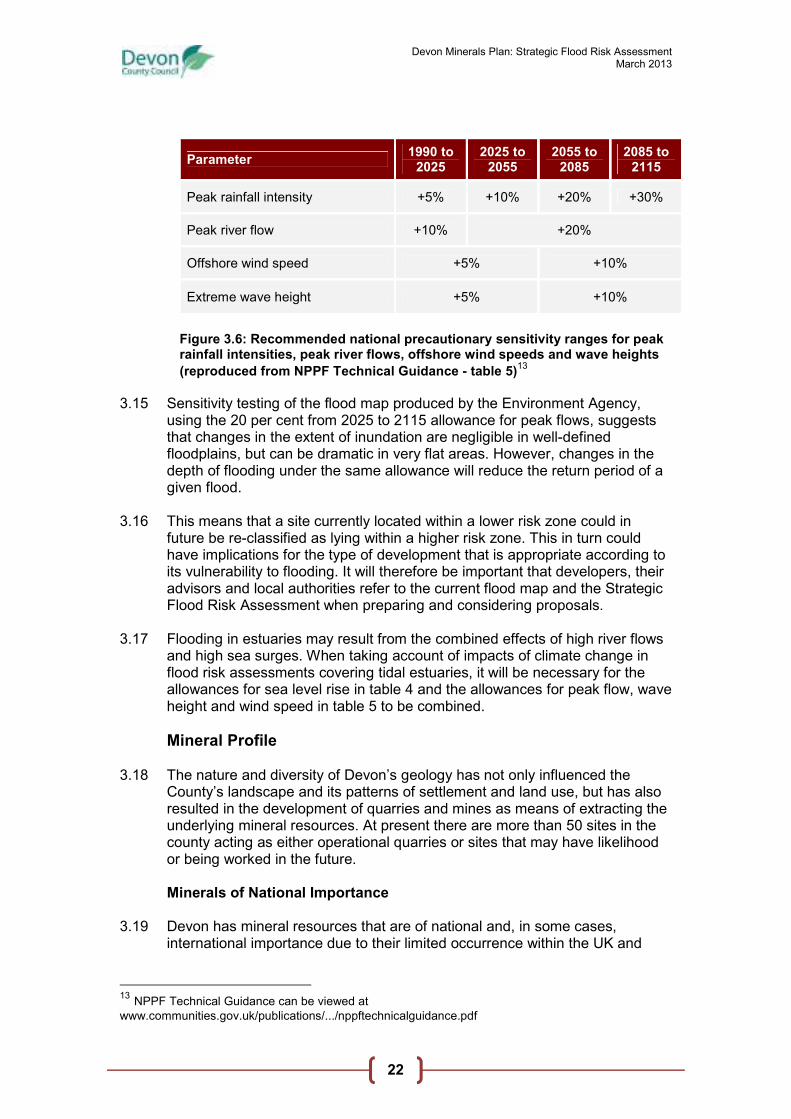
22
Parameter 1990 to
2025 2025 to
2055 2055 to
2085 2085 to
2115
Peak rainfall intensity +5% +10% +20% +30%
Peak river flow +10% +20%
Offshore wind speed +5% +10%
Extreme wave height +5% +10%
Figure 3.6: Recommended national precautionary sensitivity ranges for peak rainfall intensities, peak river flows, offshore wind speeds and wave heights
(reproduced from NPPF Technical Guidance - table 5)13
3.15 Sensitivity testing of the flood map produced by the Environment Agency, using the 20 per cent from 2025 to 2115 allowance for peak flows, suggests that changes in the extent of inundation are negligible in well-defined floodplains, but can be dramatic in very flat areas. However, changes in the depth of flooding under the same allowance will reduce the return period of a given flood.
3.16 This means that a site currently located within a lower risk zone could in
future be re-classified as lying within a higher risk zone. This in turn could have implications for the type of development that is appropriate according to its vulnerability to flooding. It will therefore be important that developers, their advisors and local authorities refer to the current flood map and the Strategic Flood Risk Assessment when preparing and considering proposals.
3.17 Flooding in estuaries may result from the combined effects of high river flows
and high sea surges. When taking account of impacts of climate change in flood risk assessments covering tidal estuaries, it will be necessary for the allowances for sea level rise in table 4 and the allowances for peak flow, wave height and wind speed in table 5 to be combined.
Mineral Profile 3.18 The nature and diversity of Devon’s geology has not only influenced the
County’s landscape and its patterns of settlement and land use, but has also resulted in the development of quarries and mines as means of extracting the underlying mineral resources. At present there are more than 50 sites in the county acting as either operational quarries or sites that may have likelihood or being worked in the future.
Minerals of National Importance
3.19 Devon has mineral resources that are of national and, in some cases,
international importance due to their limited occurrence within the UK and
13 NPPF Technical Guidance can be viewed at
www.communities.gov.uk/publications/.../nppftechnicalguidance.pdf

Devon Minerals Plan: Strategic Flood Risk Assessment March 2013
23
globally. Working of these minerals is predominantly to serve overseas markets, and in Devon they include, ball clay, china clay and tungsten.
3.20 Ball clay is a result of the deposition of sediment from Dartmoor within the
Bovey and Petrockstowe Basins, and the working areas are generally in valley-bottom locations. In contrast, china clay is the result of the in situ alteration of granite on the south western edge of Dartmoor. Both ball clay and china clay working are characterised by the volume of mineral waste that results, with tipping of this waste taking place either through backfilling of voids or by surface-level tipping.
3.21 Ball clay only occurs within Devon and Dorset. The quality and properties of
UK ball clay mean that there is relatively little competition from deposits elsewhere, and the sector remains buoyant. China clay produced in Devon accounts for around 12% of the total national output of this resource, ensuring that Devon is an important contributor to the national supply.
3.22 Developing global economies have increased the worldwide demand for
tungsten in recent years. In response there are proposals to re-open a tungsten mine near Plymouth, a large scale operation which will supply UK and world markets.
3.23 The working of minerals of national importance takes place on a larger scale
than is the case with aggregates and more commonly found minerals. These operations therefore produce large quantities of waste materials.
Aggregates
3.24 Aggregates of regional and local significance are produced from sandstone,
igneous rock, limestone and sand and gravel. These are collectively known as primary aggregates. The processing of waste materials arising from ball clay and china clay extraction provides secondary aggregates. The waste material from construction and demolition work provides recycled aggregates.
3.25 Crushed rock aggregates are quarried from limestone, sandstone and
igneous rocks, predominantly in south and north-west Devon, with the scale of operations ranging from large quarries producing around 500,000 tonnes each year to very small scale sites that are only worked intermittently and produce only a few hundred tonnes.
3.26 Sand and gravel are worked in the south east of the County, with the larger
operations (accounting for around 85% of Devon’s production) being located on the Budleigh Salterton Pebble Beds in East and Mid Devon and smaller scale working occurring at two sites in the Newton Abbot area. In contrast to other parts of the country, sand and gravel working in Devon takes place within bedrock deposits rather than in the superficial deposits occurring in river valleys.
3.27 Secondary aggregates, in the form of sand and crushed rock, largely arise
from china clay and ball clay extraction. Devon has an extensive network of facilities for the production of recycled aggregates from construction and demolition waste.
Devon Minerals Plan: Strategic Flood Risk Assessment March 2013
24
Other Minerals 3.28 There is a range of smaller-scale quarries in Devon producing a variety of
materials predominantly for local use. Building stone and slate are mainly produced at a number of small quarries in northern and western Devon, with stone also being produced at some aggregate quarries. Although brick manufacture has occurred in a number of areas within Devon, production of brick clay in the county has been limited in recent years. Boulder clay has been worked on a very small scale at a site near Barnstaple to provide material for a local pottery.
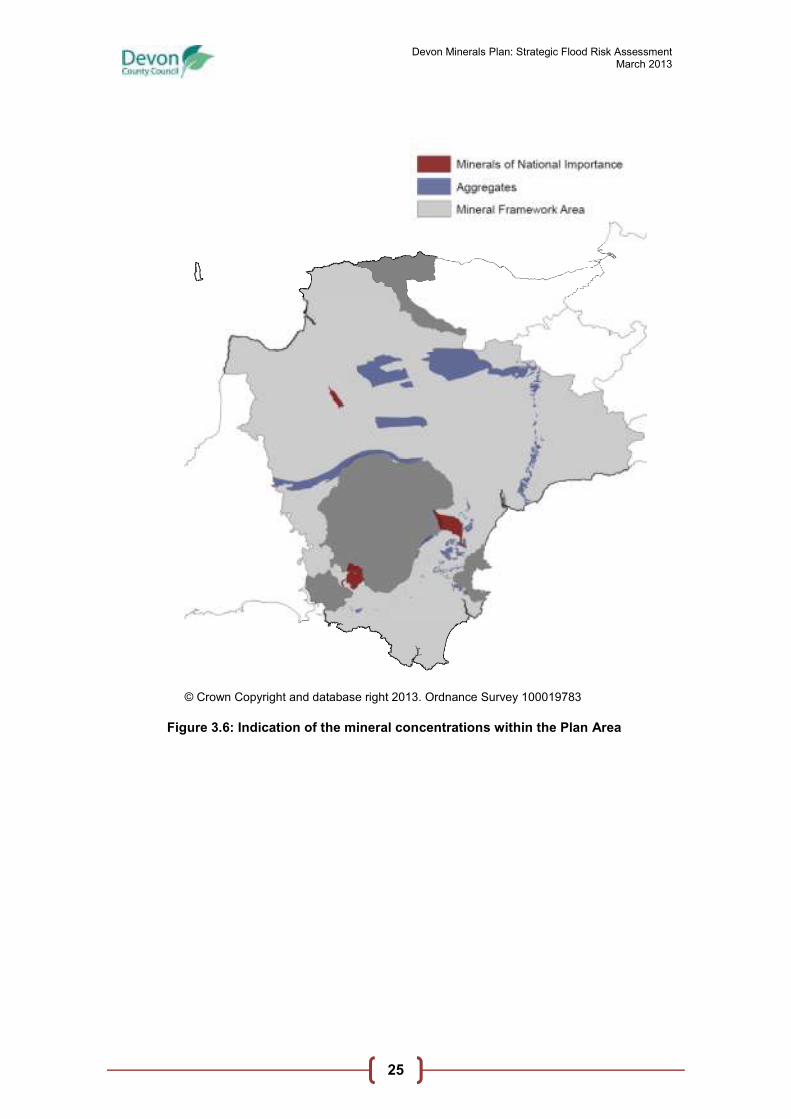
3.29 The distribution of various forms of mineral resources is dependent on the
underlying geology. Figure 3.6 shows an indication of where the concentrations of “minerals of national importance” and “aggregates” are located. Development associated with “other minerals” is generally on a smaller scale and is located across the county.
3.30 For aggregates, Figure 3.6 indicates the key geological formations where
extraction will continue on a strategic level (i.e. limestone formations, Budleigh Salterton Pebble Beds) or formations that may see new working in the future. In the case of the sandstone formations shown in northern and western Devon, these should be regarded as 'areas of search' within which a small area may be developed if further investigation demonstrates the presence of an economically viable resource. These areas were indicated as potential Mineral Safeguarding Areas in the Council's Options Consultation Paper (February 2011), but may not be included in future iterations of the Minerals Plan.
Devon Minerals Plan: Strategic Flood Risk Assessment March 2013
25
© Crown Copyright and database right 2013. Ordnance Survey 100019783
Figure 3.6: Indication of the mineral concentrations within the Plan Area
Devon Minerals Plan: Strategic Flood Risk Assessment March 2013
26
4. Mineral Development and Flood Risk 4.1 This section provides a consideration of mineral development and its
interaction with flood risk within the Plan area. The strategic considerations that influence the industry are an important factor in the future development of minerals, this coupled with the threat of increased flood risk due to climate change demonstrates the importance in having a strong sound flood risk policy in place.
4.2 Mineral development has several factors that makes make it distinctive from
other forms of development management. These factors make for important consideration when assessing flood risk and its interaction with mineral development, as well as the opportunities that mineral development can offer in the mitigation of flood risk.
Minerals Strategy Considerations 4.3 Devon County Council acting as the Mineral Planning Authority has a duty
according to the NPPF to plan for a steady and adequate supply of industrial minerals and aggregates. It states that:
“Minerals are essential to support sustainable economic growth and our quality of life. It is therefore important that there is a sufficient supply of material to provide the infrastructure, buildings, energy and goods that the country needsQ Since minerals are a finite natural resource, and can only be worked where they are found, it is important to make best use of them to secure their long-term conservation”14
4.4 The NPPF requires that the authority identifies areas where mineral resources
are available, and protect it from alternative development which would result in their future working being unfeasible. These are Mineral Safeguarding Areas (MSAs) and are protected to ensure that resources are not needlessly sterilised by non-mineral development.
4.5 A spatial strategy for Devon and its future mineral working was proposed in
the Options Consultation Paper (March 2011)15. This allows for the concentration of strategic mineral development within the M5/A38 corridor, utilising the strategic road network to minimise the negative impact of transportation.
4.6 The spatial strategy is represented in figure 4.1, indicating where strategic
mineral development is located, the M5/A38 corridor where mineral development should be focused, and the designations that show where mineral development must be avoided.
14 Para 142, NPPF can be viewed at
http://www.communities.gov.uk/documents/planningandbuilding/pdf/2116950.pdf 15 http://www.devon.gov.uk/mcs-options-consultation-paper.pdf

Devon Minerals Plan: Strategic Flood Risk Assessment March 2013
27
© Crown Copyright and database right 2013. Ordnance Survey 100019783
Figure 4.1: Minerals Spatial Strategy Within the Plan Area
4.7 The demand for resources in mineral development is influenced by both
global and local markets. The buoyancy of these markets can be influenced not only by economic factors but by political, social and technological factors, as the stability of the future supply of resources is an important concern.
4.8 Meeting the future demand for mineral resources, whilst complying with
requirements in relation to the location of development can have implications for flood risk and the limited availability of a resource can result in it requiring development in areas at risk of flooding.
4.9 Limitations in site location, coupled with a likely increase in flood risk due to
climate change, highlight the necessity to have a strong coherent flood risk policy in place.
Minerals Development Considerations 4.10 Minerals development and the associated planning processes have a number
of characteristics that set them apart from planning for other forms of development, and these have implications for the management of flood risk arising from mineral working:
Devon Minerals Plan: Strategic Flood Risk Assessment March 2013
28
♦ planning permissions for mineral working in Devon are often very long term (typically up to 2042, although sites may have economic reserves for an even longer period);
♦ although generally a long-term activity, mineral working is a temporary use of the land and, following its cessation, restoration to another after-use will occur, albeit with an altered landform that may include voids from extraction together with above-ground tipping;
♦ once planning has been granted (in many cases, as long ago as the 1940s and 1950s) the mineral planning authority has limited ability to influence the rate of extraction or tipping of waste or other aspects of working that would adversely affect the economic viability or asset value of a site;
♦ there is legislative provision for the periodic, every 15 years, review of mineral permissions (ROMP) in order to strengthen environmental and other controls over working;
♦ minerals can only be exploited where they occur, with some resources such as ball clay and china clay having very limited distribution nationally, and this has implications for the ability to consider reasonable alternatives;
♦ the scale of many mineral sites and their predominantly rural location set them apart from other forms of development; and
♦ while a mineral site (i.e. the area that has planning permission) may be large, areas within that site will be at different stages of working and/or restoration, and some parts may not be required for working at all.
4.11 The key implications of these characteristics in considering flood risk are that
mineral development includes the alteration of the local landform that may include voids as well as surface features, and that mineral working is a temporary (albeit often long term) activity that entails the subsequent restoration of the site to a beneficial after-use.
Minerals Flood Risk Considerations16
4.12 Mineral operations within or close to floodplains are at risk of inundation
during a flood event, with potential impacts including the deposit of sediment within a quarry void and the erosion of stockpiles and waste tips. However, mineral extraction and related activities can also have significant impacts (including benefits) on flood risk over a wider area, and these are identified below. While fluvial flooding is the most likely source, quarries can also be affected by surface water (pluvial) flooding and by groundwater flooding.
16 Information obtained from ‘The Influence of Aggregate Quarrying in River Floodplains on Flood Risk
and Biodiversity’ (undated), available at http://www.sustainableaggregates.com/library/docs/mist/l0094_ma_1_2_007.pdf

Devon Minerals Plan: Strategic Flood Risk Assessment March 2013
29
4.13 Flooding can also result from tidal sources in coastal areas and estuaries, but this is of limited relevance for mineral working in Devon. The only quarry recently operating in close proximity to an estuary was at Steer Point in South Devon (now closed), while no quarrying takes place in a coastal location. Wharves used for the transportation of minerals are inevitably located within coastal areas and estuaries, and the operation of these may include the stockpiling of minerals prior to or following transhipment.
Flood Storage Capacity
4.14 The void created during mineral extraction is capable of providing flood
storage capacity unless protected by embankments and, depending on the extent of backfilling, can be retained following closure and restoration of the quarry if the final surface level is below that of the original floodplain. An example of a quarry restoration scheme providing for enhanced flood storage capacity is that approved for Newbridge Quarry in the Bovey Basin.
4.15 Other features associated with mineral working that rise above the level of the
floodplain, including stockpiles, waste tips, screening bunds, buildings and plant, can reduce potential flood storage, with the most significant impacts arising from linear features such as bunds. In some cases, these features will be temporary for the duration of the mineral working and removed in the restoration phase (thereby reinstating floodplain capacity), while some features such as waste tips will become permanent elements of the landscape. While the location of a quarry will be constrained by geological considerations, the location of surface tips and other ancillary features can be more ‘footloose’.
Flood Conveyance
4.16 ‘Conveyance’ is the ability of a floodplain to transfer water, and this is
influenced by several factors including hydraulic roughness or surface irregularity. Roughness caused by mineral extraction is likely to reduce conveyance and thereby increase local flood risk, although some activities associated with mineral development, such as removing surface vegetation and hedges, could have the converse effect by reducing surface roughness.
Effects on Surface and Groundwater Flows
4.17 Quarrying activity can increase surface water run-off and therefore flood risk if
the area of hard surface is increased, by the compaction of soil, or through the breaching of water and silt storage lagoons. The potential for groundwater flooding may be influenced where mineral extraction impact on local hydro geological characteristics and the interface with the hydrogeological regime, for example through increased transmissivity.

Devon Minerals Plan: Strategic Flood Risk Assessment March 2013
30
5. Assessment of Flood Risk 5.1 This section provides an outline of the planning policy framework informing
flood risk. The purpose of this section is to provide guidance on flood risk types and their assessment. Accurate assessment and understanding of the likely forms of flooding and their potential impact is essential to applying a risk based approach to flooding.
5.2 This represents step 1 in the flood risk hierarchy, as can be seen in figure 5.1.
It is through assessment that the suitability of land for the development of mineral operations will be determined.
The Flood Risk Hierarchy
Figure 5.1: Flood Risk Hierarchy
5.3 Crucial to the accurate assessment of flood risk is appreciating that flood risk
conditions must be considered holistically, taking account of all the factors that contribute to potential increased risk.
5.4 The source-pathway-receptor model is a useful tool in demonstrating this,
particularly in the assessment of instances of surface water flooding. The model, as seen in figure 5.2, demonstrates the transient nature of water. The source, the cause of the flood, can be a great distance from where the most impact is felt, the receptor. If , a pathway’s capacity is exceeded, or a blockage occurs, flooding can occur when the water adopts a new pathway.
Figure 5.2: Source-Pathway-Receptor approach17
5.5 There are a number of forms of flooding that can occur, these include:
17 (CIRIA) (2004) Development and flood risk – Guidance for the construction industry (C624)
Step 1
Assess
Appropriate flood risk
assessment
Step 2
Avoid
Apply the sequential approach
Step 3
Substitute
Apply the Sequential Test at site
level
Step 4
Control
e.g. SUDS, design, flood
defences
Step 5
Mitigate
e.g. Flood resilient
construction

Devon Minerals Plan: Strategic Flood Risk Assessment March 2013
31
♦ river (fluvial) flooding
♦ tidal/coastal flooding
♦ surface water (pluvial) flooding
♦ sewer flooding
♦ groundwater flooding
♦ flooding from infrastructure failure (reservoir flooding) 5.6 These different types of flooding can happen on their own or in combination.
For example, an intense storm could cause a river to breach its banks; this could in turn exceed the capacity of the drainage system downstream. The resultant flooding is therefore a combination of both fluvial and sewer flooding.
Fluvial Flooding 5.7 Fluvial or river flooding is most commonly caused by intense rainfall causing
flash flooding, or following prolonged rainfall upon saturated ground, resulting in floodplain inundation. Various situations can exacerbate fluvial flood risk, such as blockages at culverts, overtopping of defences or breaching of defences.
5.8 The precise extent of fluvial flooding is difficult to measure, and therefore
reliance has been placed upon Environment Agency flood zone maps. This mapping should be used to prompt a more detailed assessment, should future development be under consideration in or adjacent to these areas. Flood zones are defined by likelihood and measured by Annual Exceedance Probability (AEP). This is a numerical representation of the probability of a flood occurring in any one year. The higher the percentage, the more likely it is that the area will flood. Figure 5.3 demonstrates how the flood zones are classified.
Figure 5.3: Flood Zone Classification
5.9 Importantly, it should be noted Flood Zones have not been determined
for minor watercourse that drain catchment areas less than 3sq km or areas that may be susceptible to surface water flooding.
5.10 Flood Zone 1 is classified as land where the risk of flooding is less than 1 in
1000 years (i.e. less than 0.1% AEP). It is classed as an area of ‘low probability’ risk of fluvial flooding.

Devon Minerals Plan: Strategic Flood Risk Assessment March 2013
32
5.11 Flood Zone 2 is classified as land having between 1 in 100 and 1 in 1000 year annual probability of fluvial flooding (i.e. 1%-0.1% AEP). It is classed as an area of ‘medium probability’ risk of fluvial flooding.
5.12 Flood Zone 3a is classified as land having a potential to flood for storm
events greater than 1 in 20 year return period and up to 1 in 100 year annual probability (i.e. greater than 1% AEP). It is classed as an area of ‘high probability’ risk of fluvial flooding.
5.13 Flood Zone 3b is classified as land having the potential to flood for storm
events up to 1 in 20 year return period (i.e. 5% AEP). It is classed as ‘functional floodplain’, including land where water must flow to or be stored during times of flood up to 1 in 20 year return period, or greater, or at another probability to be agreed between the LPA and the Environment Agency.
5.14 All areas within Zone 3 should be considered as Zone 3b (functional
floodplain) unless, or until, an appropriate site specific assessment shows to the satisfaction of the Environment Agency and the Authority that it can be considered as falling within Zone 3a (High Probability).
5.15 A flood zone map example is provided in Figure 5.4. The area in blue with
hatching overlay is the area with highest probability of flooding; a site assessment defines whether this area is to be considered flood zone 3a or flood zone 3b. The area without the hatching is considered flood zone 2.
© Crown Copyright and database right 2013. Ordnance Survey 100019783
Figure 5.4 Example of flood zone mapping
5.16 There is very little certainty about the effect climate change will have on future
flood zones, however the following approach18 is considered the best estimate:
18 Approach provided in the NPPF Technical Guidance page 12. Can be accessed at
http://www.communities.gov.uk/documents/planningandbuilding/pdf/2115548.pdf

Devon Minerals Plan: Strategic Flood Risk Assessment March 2013
33
♦ current Flood Zone 2 becomes Climate Change Flood Zone 3a; and
♦ current Flood Zone 3 becomes Climate Change Flood Zone 3b (Functional Floodplain).
5.17 This shift in flood zone should be used when assessing the potential impacts
of climate change. This will be important if a proposed site is at high risk of flooding and is requiring development because of exceptional circumstances.
5.18 It is essential to recognise that flood risk within the County is not limited to
flooding of rivers. There is a significant risk to people and property from tidal and groundwater flooding, exacerbated by high river levels, and from surface water and sewer flooding as a result of localised heavy rainfall.
Tidal Flooding 5.19 Tidal flooding occurs when sea level rises above the normal tidal range, which
can affect the open coast and estuarine areas. Tidal flooding can also become exacerbated by storm or tidal surges and wave action. High sea levels can cause tide locking, which may reduce the drainage of water from rivers and sewers causing an additional source of risk. The onset of flooding from the sea can be very rapid (once a defence has failed or been overtopped) and deep fast flowing water can create an extreme hazard.
5.20 The area at the highest risk of flooding often follows a complex path, as sea
defences and dunes offer varied protection. A tidal flood zone map example is provided in Figure 5.5.
© Crown Copyright and database right 2013. Ordnance Survey 100019783
Figure 5.5: Example of flood zone mapping in a tidal area
5.21 Tidal flood risk is also assessed in the Shoreline Management Plans, which
includes information such as the risk of overtopping of coastal defences. 5.22 In the future Marine Plans could also provide a valuable resource for
assessing tidal flood risk, recent government legislation in the form the Marine and Coastal Access Act 2009 has required that these are produced for each coastal region. Once produced, these plans will consider off-shore planning

Devon Minerals Plan: Strategic Flood Risk Assessment March 2013
34
issues (and some on-shore planning issues in estuarine areas) including flood risk.
Surface Water Flooding 5.23 Sources of surface water flooding can either take the form of runoff originating
from agricultural/undeveloped land, or run off from developed urban land. Surface water flooding from agricultural and undeveloped land is associated with the inability of the ground to absorb rain water (or snow melt). This is affected by land use, land management, ground conditions, geology and time of year. Surface water flooding associated with flooding in urban areas, occurs when the ground is unable to absorb rain water due to development causing as increase in sealed surfaces, reducing permeability.
5.24 Surface water flooding often occurs when there is short duration, intense
rainfall events where precipitation is unable to infiltrate the ground or enter drainage systems at the elevated rate. In tidal areas surface water flooding can also occur during high tides, where the surface water cannot freely discharge to coastal waters or an estuary.
5.25 The Environment Agency has assessed surface water flood risk and
produced a data called Areas Susceptible to Surface Water Flooding (AStSWF). This surface water mapping information was recently been updated with the addition of the Flood Maps for Surface Water (FMfSW) data which contains flood extents for a 1 in 30 year rainfall event and a 1 in 200 year event. These two approaches, as can be seen in figure 5.6, at times provide different representations of surface water flood mapping. It is therefore important to consider surface water flooding in line with the appropriate dataset.
© Crown Copyright and database right 2013. Ordnance Survey 100019783
Figure 5.6: Example of FMfSW and AStSWF surface water flood mapping
5.26 The Flood Risk Regulations 2009 required that Lead Local Flood Authorities (LLFA) provide flood risk assessments, management plans and hazard maps. These investigate flooding within their boundary from surface water, groundwater and ordinary watercourses. Devon County Council acting as the Lead Local Flood Authority has completed the initial assessment for the

Devon Minerals Plan: Strategic Flood Risk Assessment March 2013
35
county, the Preliminary Flood Risk Assessment (PFRA)19. This assessment has produced “locally agreed surface water mapping” (a combination of the AStSWF and FMfSW) which best reflects the surface water flooding conditions in Devon.
Sewer Flooding 5.27 Sewer systems are typical to all the urban locations in Devon, and also
service a large rural population. Sewers are commonly laid within highway structures. Modern systems are designed to accommodate storm events with a 30 year return period which are normally separated into foul and surface water sewers. Older sewer systems however, which are common in Devon, are often constructed to a standard of less than 30 years and are designed to convey foul and surface water flows in combination.
5.28 As towns and villages have expanded to accommodate growth, the older
sewer networks often cannot provide sufficient capacity, consequently flooding some parts of the sewer system. This form of flooding has been further exacerbated over the last decade as the number of consented overflows into water courses has reduced, putting greater reliance on the sewer system. Increased urban development, specifically “infill development” has increased pressure on the sewer system.
5.29 The maintenance, construction and performance of the sewer system are the
responsibility of the Water Company, in this case South West Water. South West Water should be consulted if there is any concern in relation to the capacity of the sewer network.
Groundwater Flooding 5.30 Groundwater flooding occurs when water levels in the ground rise above
surface elevations and cause spring resurgence. This type of flooding is dependent on the underlying geological strata and is most likely to occur in low-lying areas underlain by permeable rocks (aquifers) after prolonged rainfall. The effect of groundwater flooding is often presented as seepage direct into properties.
5.31 There is limited detailed information available on flood risk from groundwater
sources. The Environment Agency has, however, developed a dataset, Areas Susceptible to Groundwater Flooding (AStGWF)20, which highlights 1 km grid areas with differing levels of risk. An indication of the areas at risk of groundwater flooding within the framework area is provided in figure 5.7. Due to the geology of the county, however, this form of flooding is considered relatively rare within the Plan Area.
19 The Preliminary Flood Risk Assessment (PFRA) Final Version 2011 can be obtained from
http://www.devon.gov.uk/devonpfra.pdf 20 AStGWF - Area classification (proportion of each 1 km square that is susceptible to groundwater
flood emergence)
Devon Minerals Plan: Strategic Flood Risk Assessment March 2013
36
© Crown Copyright and database right 2013. Ordnance Survey 100019783
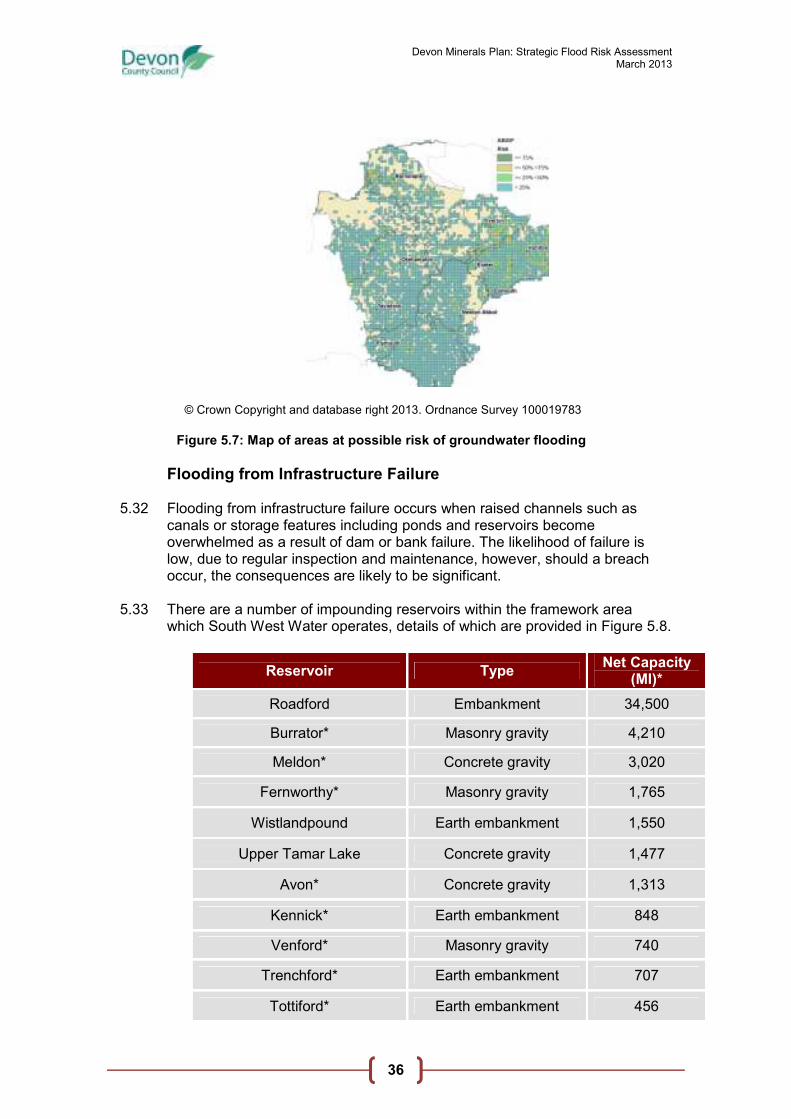
Figure 5.7: Map of areas at possible risk of groundwater flooding
Flooding from Infrastructure Failure 5.32 Flooding from infrastructure failure occurs when raised channels such as
canals or storage features including ponds and reservoirs become overwhelmed as a result of dam or bank failure. The likelihood of failure is low, due to regular inspection and maintenance, however, should a breach occur, the consequences are likely to be significant.
5.33 There are a number of impounding reservoirs within the framework area
which South West Water operates, details of which are provided in Figure 5.8.
Reservoir Type Net Capacity
(MI)*
Roadford Embankment 34,500
Burrator* Masonry gravity 4,210
Meldon* Concrete gravity 3,020
Fernworthy* Masonry gravity 1,765
Wistlandpound Earth embankment 1,550
Upper Tamar Lake Concrete gravity 1,477
Avon* Concrete gravity 1,313
Kennick* Earth embankment 848
Venford* Masonry gravity 740
Trenchford* Earth embankment 707
Tottiford* Earth embankment 456

Devon Minerals Plan: Strategic Flood Risk Assessment March 2013
37
Figure 5.8: Table of South West Water reservoirs relevant to the Plan Area21
* Outside Plan Area but feed into rivers flowing into the Plan Area
5.34 Legislation has amended the Reservoirs Act, introducing a requirement for
reservoir undertakers to prepare reservoir flood plans. These plans analyse the extent and severity of flooding that could occur as a result of failure of the structure. They are required on reservoirs where failure could have a major impact on risk to property and lives.
5.35 The Environment Agency holds further details regarding reservoir flood plans
and flood maps. This information should be consulted to determine whether sites are within the breach range of these structures22.
21 Full details of South West Water operated reservoirs can be found at
http://www.southwestwater.co.uk/index.cfm?articleid=1529 22 Details can be found at http://www.environment-agency.gov.uk/homeandleisure/floods/124783.aspx
Devon Minerals Plan: Strategic Flood Risk Assessment March 2013
38
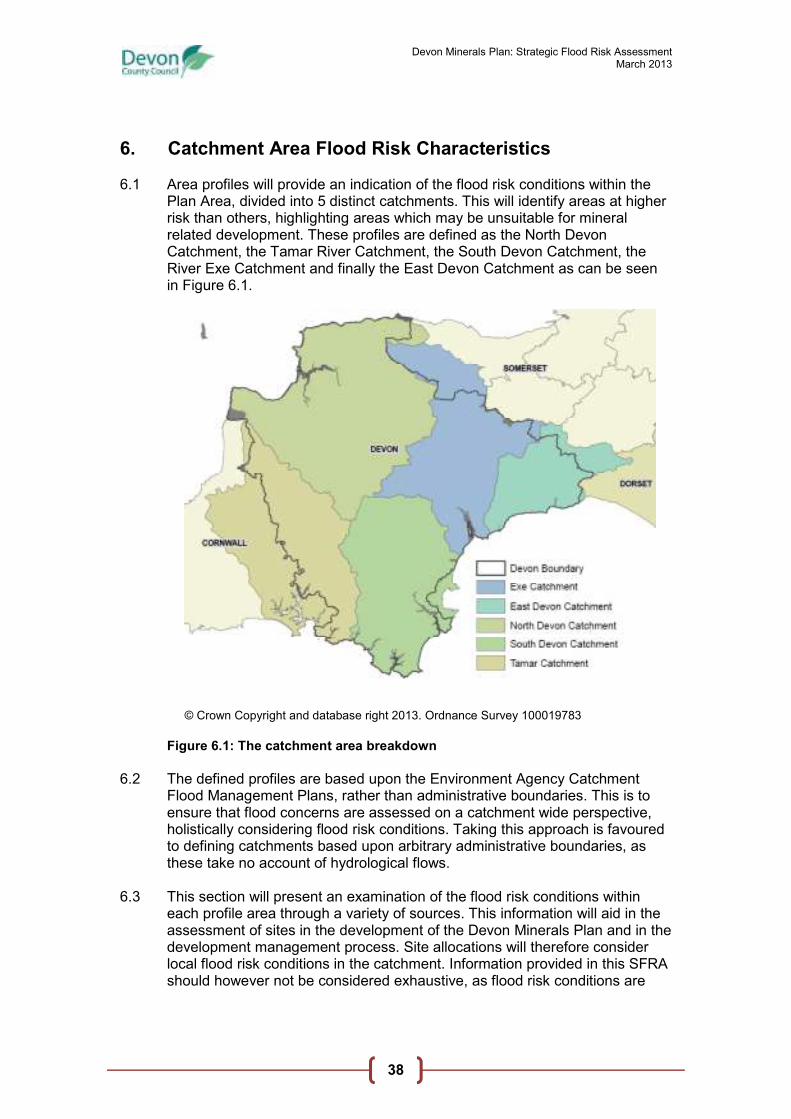
6. Catchment Area Flood Risk Characteristics 6.1 Area profiles will provide an indication of the flood risk conditions within the
Plan Area, divided into 5 distinct catchments. This will identify areas at higher risk than others, highlighting areas which may be unsuitable for mineral related development. These profiles are defined as the North Devon Catchment, the Tamar River Catchment, the South Devon Catchment, the River Exe Catchment and finally the East Devon Catchment as can be seen in Figure 6.1.
© Crown Copyright and database right 2013. Ordnance Survey 100019783
Figure 6.1: The catchment area breakdown
6.2 The defined profiles are based upon the Environment Agency Catchment
Flood Management Plans, rather than administrative boundaries. This is to ensure that flood concerns are assessed on a catchment wide perspective, holistically considering flood risk conditions. Taking this approach is favoured to defining catchments based upon arbitrary administrative boundaries, as these take no account of hydrological flows.
6.3 This section will present an examination of the flood risk conditions within
each profile area through a variety of sources. This information will aid in the assessment of sites in the development of the Devon Minerals Plan and in the development management process. Site allocations will therefore consider local flood risk conditions in the catchment. Information provided in this SFRA should however not be considered exhaustive, as flood risk conditions are
Devon Minerals Plan: Strategic Flood Risk Assessment March 2013
39
liable to alter rapidly and unpredictably. It is important that this information is treated as indicative.
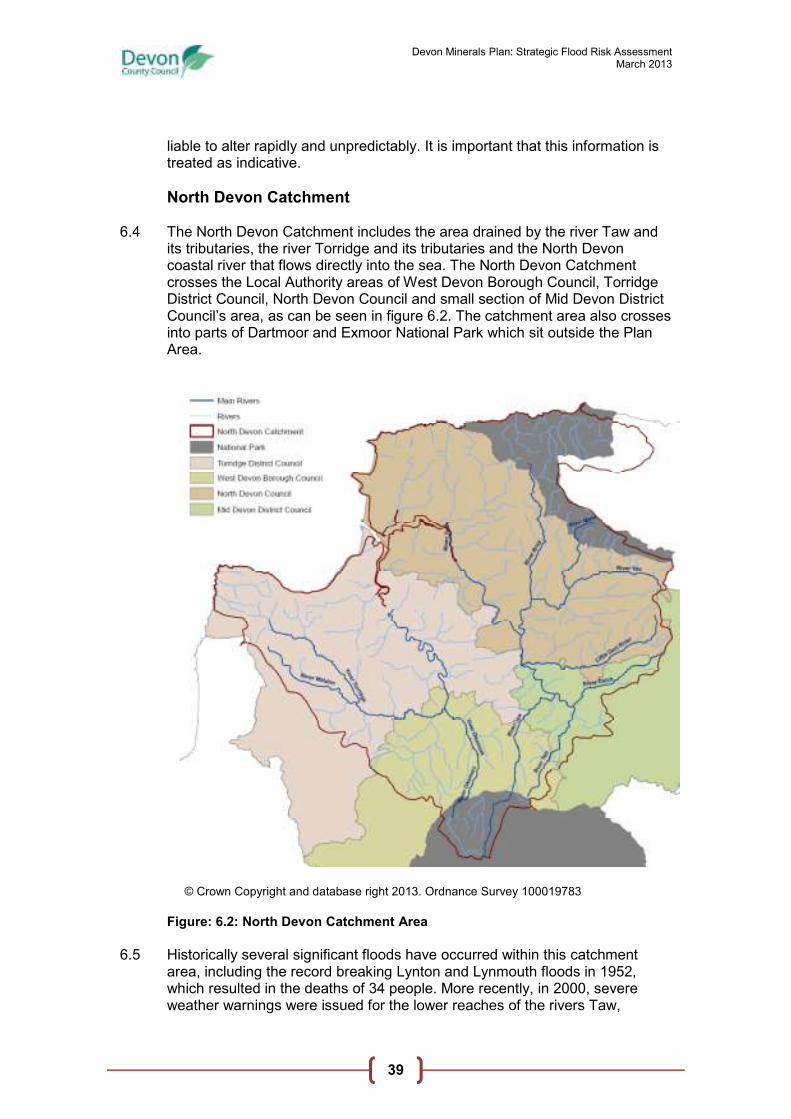
North Devon Catchment 6.4 The North Devon Catchment includes the area drained by the river Taw and
its tributaries, the river Torridge and its tributaries and the North Devon coastal river that flows directly into the sea. The North Devon Catchment crosses the Local Authority areas of West Devon Borough Council, Torridge District Council, North Devon Council and small section of Mid Devon District Council’s area, as can be seen in figure 6.2. The catchment area also crosses into parts of Dartmoor and Exmoor National Park which sit outside the Plan Area.
© Crown Copyright and database right 2013. Ordnance Survey 100019783
Figure: 6.2: North Devon Catchment Area
6.5 Historically several significant floods have occurred within this catchment
area, including the record breaking Lynton and Lynmouth floods in 1952, which resulted in the deaths of 34 people. More recently, in 2000, severe weather warnings were issued for the lower reaches of the rivers Taw,

Devon Minerals Plan: Strategic Flood Risk Assessment March 2013
40
Torridge and East Lyn. Information provided by the Environment Agency in December 2008 (Figure 6.3) indicated that the most common source of flooding in the past is from fluvial flooding, accounting for 59% of the recorded flood events. The Environment Agency also confirmed a significant risk of tidal flooding in the catchment, especially in Barnstaple, Bideford and Ilfracombe.
Figure 6.3: North Devon Catchment historic sources of flooding23
6.6 The North Devon Council SFRA advises that Barnstaple has complicated
flood risk conditions due to the necessary tidal defences and issues relating to sewer capacity. The Regional Flood Risk Assessment (RFRA) also identified Barnstaple with an increased risk of flooding with specific concerns to the possible effects of climate change and sea level rise for the town.
6.7 The flood zone area in the catchment broadly follows the routing of the main
rivers and their tributaries; there is a wide margin of risk attributed to the River Taw, and a concentrated area of risk where the river Taw reaches Barnstaple Bay at the coast, as can be seen in figure 6.4. The map identifies areas where there maybe potential mineral resources (see 3.30) that may interact with areas at risk of flooding.
6.8 Figure 6.4 highlights the areas where there is a potential interaction. In the
case of the North Devon catchment, this has indicated 5 areas that require greater focus. These are shown in inset maps figure 6.5, figure 6.6, figure 6.7, figure 6.8 and figure 6.9. If an area is not mapped that is be being considered for future development, the MPA must be contacted for detailed flood risk mapping.
23 Environment Agency - North Devon Catchment Flood Management Plan (2008) – Note: The
information only reflects the frequency of the flood event, rather than its severity. Small scale unreported flood events will not be included. Therefore incidences of groundwater or sewer flooding may be higher than the statistics suggest.
Sources of flooding: North Devon
Tidal 9%
Sewers 3%
Groundwater 1%
Surface water 18% River 59%
Unknown 10%

Devon Minerals Plan: Strategic Flood Risk Assessment March 2013
41
© Crown Copyright and database right 2013. Ordnance Survey 100019783
Figure 6.4: North Devon Catchment flood zones
© Crown Copyright and database right 2013. Ordnance Survey 100019783
Figure 6.5: North Devon Inset Map A Figure 6.6: North Devon Inset Map B

Devon Minerals Plan: Strategic Flood Risk Assessment March 2013
42
© Crown Copyright and database right 2013. Ordnance Survey 100019783
Figure 6.7: North Devon Inset Map C Figure 6.8: North Devon Inset Map D
© Crown Copyright and database right 2013. Ordnance Survey 100019783
Figure 6.9: North Devon Inset Map E
6.9 The Hartland Point to Anchor Head Shoreline Management Plan24 provides greater information in relation to flooding from tidal sources within the catchment area. This plan should be consulted if a proposed development is located close to the coast.
6.10 Following a desk based review of assessments it is apparent that the areas
most affected by surface water flooding are located in the coastal areas of the North Devon catchment, specifically in the main urban areas of Bideford, Barnstaple and Ilfracombe. Surface water flooding caused by the limited
24 More information in relation to this SMP can be found at http://www.ndascag.org/
Devon Minerals Plan: Strategic Flood Risk Assessment March 2013
43
capacity of drainage and sewer systems is also made worse by high tide levels, specifically along the lower reaches of the rivers Taw and Torridge. Great Torrington is further from the coast and is also highlighted in the district council SFRA as having surface water flooding issues. Barnstaple was also recently highlighted in the Preliminary Flood Risk Assessment (PFRA) as an area requiring greater assessment in regard to surface water flooding. The settlement ranks 138th against a national assessment of urban areas at risk of surface water flooding, with the estimation that 2,403 people are at risk in the Barnstaple cluster area. Ilfracombe also featured as an area requiring assessment. The settlement ranks 155th against a national ranking with an estimated 2,139 people at risk of surface water flooding.
6.11 According to the North Devon CFMP the general risk associated with
groundwater flooding is “insignificant”, however, in the upper parts of the catchment the risk is increased to “moderate” due to the specific geology of the area. There has been a reported groundwater event at Weare Gifford.
6.12 There are a number of reservoirs in the catchment area, including Meldon
Reservoir and Wistlandpound Reservoir. Modern inspection regimes on reservoirs makes a breach extremely unlikely, however it must be noted that the consequences of flooding could be significant to the area.
6.13 To analyse the impact of possible climate change, the Environment Agency in
2008 developed a future ‘scenario’ for the catchment area by combining the three main factors: climate change, changes in land use and urbanisation. The results suggest that in the future (2100) estimated economic damages could be as high as £950 million within the catchment area and the main urban areas of Barnstaple and Bideford would be the worst affected.
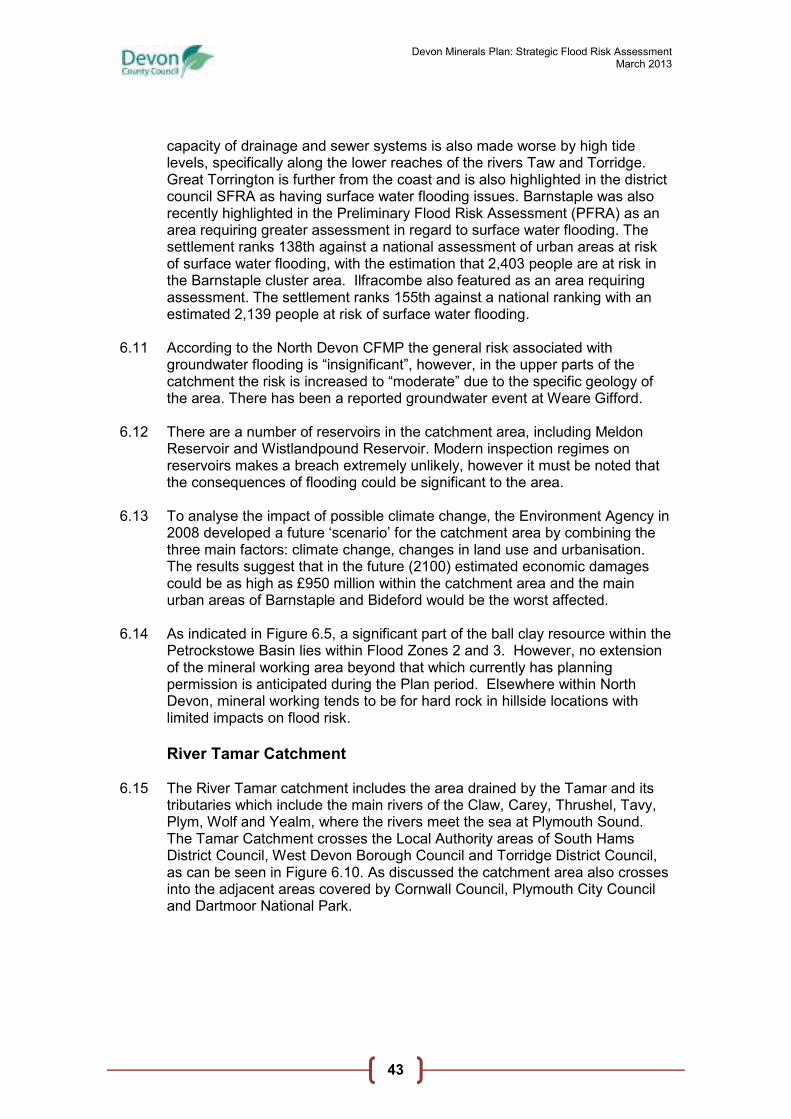
6.14 As indicated in Figure 6.5, a significant part of the ball clay resource within the
Petrockstowe Basin lies within Flood Zones 2 and 3. However, no extension of the mineral working area beyond that which currently has planning permission is anticipated during the Plan period. Elsewhere within North Devon, mineral working tends to be for hard rock in hillside locations with limited impacts on flood risk.
River Tamar Catchment
6.15 The River Tamar catchment includes the area drained by the Tamar and its
tributaries which include the main rivers of the Claw, Carey, Thrushel, Tavy, Plym, Wolf and Yealm, where the rivers meet the sea at Plymouth Sound. The Tamar Catchment crosses the Local Authority areas of South Hams District Council, West Devon Borough Council and Torridge District Council, as can be seen in Figure 6.10. As discussed the catchment area also crosses into the adjacent areas covered by Cornwall Council, Plymouth City Council and Dartmoor National Park.

Devon Minerals Plan: Strategic Flood Risk Assessment March 2013
44
© Crown Copyright and database right 2013. Ordnance Survey 100019783
Figure 6.10: River Tamar Catchment area
6.16 Historically several significant floods have occurred in the Tamar catchment
area. One of the most dramatic being in 2004 at Canworthy Water where flood water swept away livestock and vehicles. Information provided by the Environment Agency in December 2008, as can be seen in Figure 6.11, indicated that the most common source of flooding in the past has been from fluvial (or river) flooding which accounts for 41%.
6.17 The presence of the estuaries in the Tamar catchment has contributed to
flood risk, often making flooding worse when high tides coincide with high rainfall. The largely rural nature of the Tamar catchment results in 6% of the recorded sources of flooding being attributed to field run off. Sewer flooding accounts for a significant 26% of reported flood events in the catchment area. These were however largely attributed to the urban settlement of Plymouth, located outside the framework area.
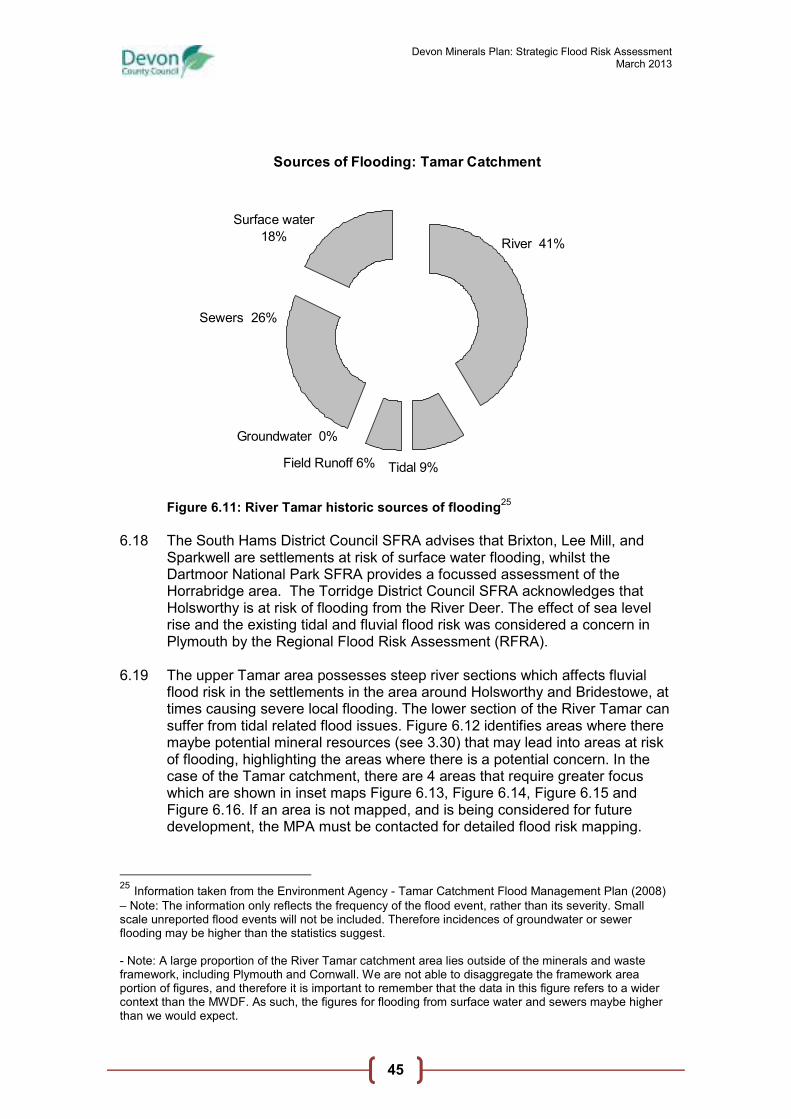
Devon Minerals Plan: Strategic Flood Risk Assessment March 2013
45
Figure 6.11: River Tamar historic sources of flooding25
6.18 The South Hams District Council SFRA advises that Brixton, Lee Mill, and
Sparkwell are settlements at risk of surface water flooding, whilst the Dartmoor National Park SFRA provides a focussed assessment of the Horrabridge area. The Torridge District Council SFRA acknowledges that Holsworthy is at risk of flooding from the River Deer. The effect of sea level rise and the existing tidal and fluvial flood risk was considered a concern in Plymouth by the Regional Flood Risk Assessment (RFRA).
6.19 The upper Tamar area possesses steep river sections which affects fluvial
flood risk in the settlements in the area around Holsworthy and Bridestowe, at times causing severe local flooding. The lower section of the River Tamar can suffer from tidal related flood issues. Figure 6.12 identifies areas where there maybe potential mineral resources (see 3.30) that may lead into areas at risk of flooding, highlighting the areas where there is a potential concern. In the case of the Tamar catchment, there are 4 areas that require greater focus which are shown in inset maps Figure 6.13, Figure 6.14, Figure 6.15 and Figure 6.16. If an area is not mapped, and is being considered for future development, the MPA must be contacted for detailed flood risk mapping.
25 Information taken from the Environment Agency - Tamar Catchment Flood Management Plan (2008)
– Note: The information only reflects the frequency of the flood event, rather than its severity. Small scale unreported flood events will not be included. Therefore incidences of groundwater or sewer flooding may be higher than the statistics suggest. - Note: A large proportion of the River Tamar catchment area lies outside of the minerals and waste framework, including Plymouth and Cornwall. We are not able to disaggregate the framework area portion of figures, and therefore it is important to remember that the data in this figure refers to a wider context than the MWDF. As such, the figures for flooding from surface water and sewers maybe higher than we would expect.
Sources of Flooding: Tamar Catchment
Tidal 9%Field Runoff 6%
Sewers 26%
Groundwater 0%
Surface water
18%River 41%

Devon Minerals Plan: Strategic Flood Risk Assessment March 2013
46
© Crown Copyright and database right 2013. Ordnance Survey 100019783
Figure 6.12: Tamar Catchment flood zones
6.120 Saturation levels of bogs and wetlands towards the western edge of Dartmoor allow for large amounts of surface runoff as does the steeply sloping topography to the north of Tavistock. Surface water flooding is understood to affect the communities of Bridgerule and Yealmpton. Sewer flooding has also been a reported issue in Tavistock.
6.21 The proposed development of Sherford will see substantial growth over the next decade which will affect surface water flows and future flood risk management. It is important that the flood risk conditions in this area are regularly reviewed to take account of increased development.
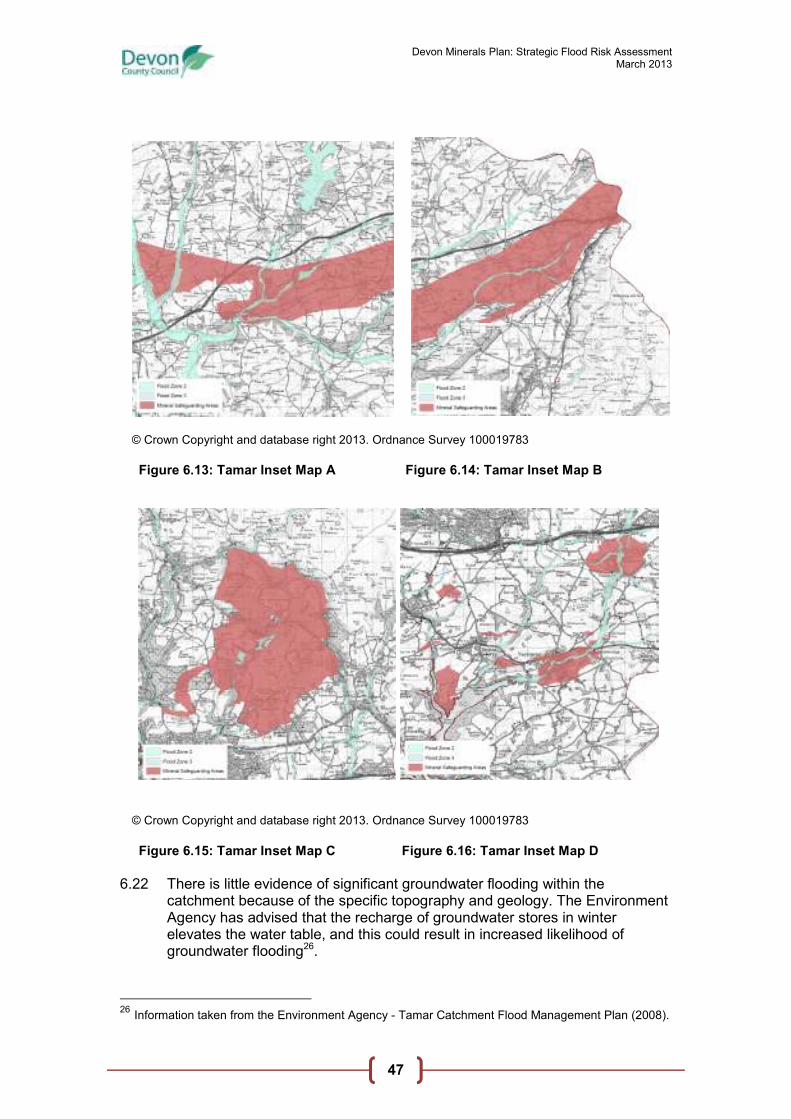
Devon Minerals Plan: Strategic Flood Risk Assessment March 2013
47
© Crown Copyright and database right 2013. Ordnance Survey 100019783
Figure 6.13: Tamar Inset Map A Figure 6.14: Tamar Inset Map B
© Crown Copyright and database right 2013. Ordnance Survey 100019783
Figure 6.15: Tamar Inset Map C Figure 6.16: Tamar Inset Map D
6.22 There is little evidence of significant groundwater flooding within the
catchment because of the specific topography and geology. The Environment Agency has advised that the recharge of groundwater stores in winter elevates the water table, and this could result in increased likelihood of groundwater flooding26.
26 Information taken from the Environment Agency - Tamar Catchment Flood Management Plan (2008).

Devon Minerals Plan: Strategic Flood Risk Assessment March 2013
48
6.23 There are several reservoirs in the catchment area, including Roadford Reservoir, Upper Tamar Lake, Burrator and Lopwell Dam. Modern inspection regimes on reservoirs makes a breach extremely unlikely, however the consequences of flooding could be significant to the area if a breach did occur.
6.24 The areas that could be most affected by flood risk include Tavistock,
Bridestowe, Holsworthy and Yealmpton, due to the vulnerability of properties to flooding. Tavistock was also recently highlighted in the Preliminary Flood Risk Assessment (PFRA) as an area requiring greater assessment into surface water flooding, as the settlement ranks 121st against a national assessment of urban areas at risk of surface water flooding.
6.25 Climate change has the greatest influence on future flood risk, increasing
flood risk from both rivers and the tide. The largest estimated lateral increase in flood risk area by 2050 is in the Bridestowe area. In analysis of the impact of changes in future, the Environment Agency estimated that by 2100 estimated economic damages could be as high as £17 million. This increase however is largely influenced by population density in the city of Plymouth, outside the Plan Area.
South Devon Catchment 6.26 The South Devon catchment includes the area drained by the rivers Teign,
Dart, Erme, Avon and their associated tributaries. The catchment spans both east and south from Dartmoor and follows the flow of water to the sea through estuaries. The South Devon Catchment crosses the Local Authority areas of Teignbridge District Council, South Hams District Council and a small corner of the Mid Devon District Council. The catchment area also crosses into Torbay Council and Dartmoor National Park, as can seen in Figure 6.17.
6.27 Historically the catchment area experienced its worse flood event in 1979
which affected approximately 800 properties; however, this was prior to construction of defences in Newton Abbot and Kingsteignton. In the very wet summer of 2007 there were significant reported flood events across the catchment.
6.28 Information provided by the Environment Agency in March 2009 (Figure 6.18)
indicates that the most common source of flooding in the past is from river, or fluvial flooding, which accounts for 38% of recorded flood events. Whilst a combination of river and surface water accounts for a further 24%.
6.29 The South Hams SFRA provides a focused investigation into areas outlined
for future development such as Dartmouth, Ivybridge, Kingsbridge and Totnes. The Teignbridge SFRA highlights Teignmouth and Newton Abbot as particular areas at risk of flooding.

Devon Minerals Plan: Strategic Flood Risk Assessment March 2013
49
© Crown Copyright and database right 2013. Ordnance Survey 100019783
Figure 6.17: South Devon Catchment Area
6.30 The flood zone area in the catchment broadly follows the routing of the main
rivers. There exists an area of particular risk just north of Newton Abbot in the Bovey Basin where the River Teign and River Bovey meet, as can be seen in Figure 6.19. The map identifies areas where there maybe potential mineral resources (see 3.30) that may lead into areas at risk of flooding. The maps highlights four areas that require greater focus, these are shown in Figures 6.20, 6.21, 6.22 and 6.23. If an area is not mapped that is be being considered for future development, the MPA must be contacted for detailed flood risk mapping.
6.31 Within the Bovey Basin, mineral working and tipping have taken place partly
within the historic floodplain, thereby significantly reducing flood capacity and increasing downstream flood risk. Consideration of future working should seek to protect the remaining undeveloped floodplain unless compensatory capacity can be achieved and, where feasible, identify opportunities for reinstatement of flood capacity where lost to current mineral working.
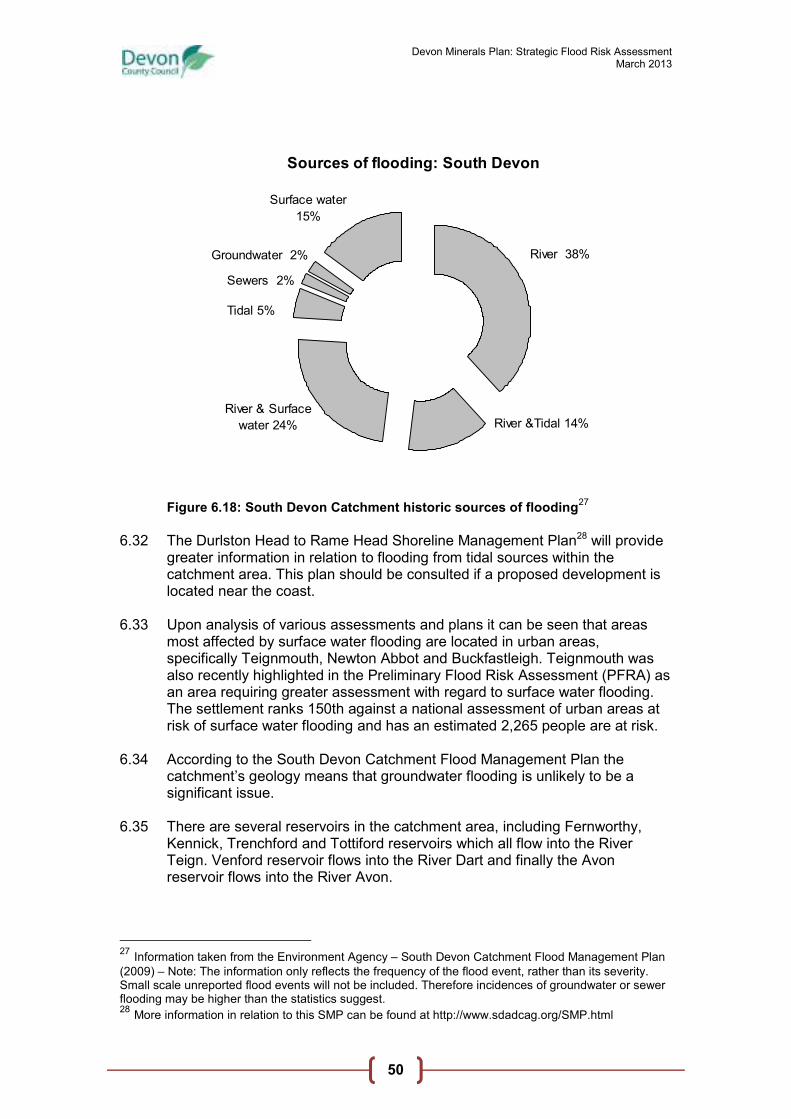
Devon Minerals Plan: Strategic Flood Risk Assessment March 2013
50
Figure 6.18: South Devon Catchment historic sources of flooding27
6.32 The Durlston Head to Rame Head Shoreline Management Plan28 will provide
greater information in relation to flooding from tidal sources within the catchment area. This plan should be consulted if a proposed development is located near the coast.
6.33 Upon analysis of various assessments and plans it can be seen that areas
most affected by surface water flooding are located in urban areas, specifically Teignmouth, Newton Abbot and Buckfastleigh. Teignmouth was also recently highlighted in the Preliminary Flood Risk Assessment (PFRA) as an area requiring greater assessment with regard to surface water flooding. The settlement ranks 150th against a national assessment of urban areas at risk of surface water flooding and has an estimated 2,265 people are at risk.
6.34 According to the South Devon Catchment Flood Management Plan the
catchment’s geology means that groundwater flooding is unlikely to be a significant issue.
6.35 There are several reservoirs in the catchment area, including Fernworthy,
Kennick, Trenchford and Tottiford reservoirs which all flow into the River Teign. Venford reservoir flows into the River Dart and finally the Avon reservoir flows into the River Avon.
27 Information taken from the Environment Agency – South Devon Catchment Flood Management Plan
(2009) – Note: The information only reflects the frequency of the flood event, rather than its severity. Small scale unreported flood events will not be included. Therefore incidences of groundwater or sewer flooding may be higher than the statistics suggest. 28 More information in relation to this SMP can be found at http://www.sdadcag.org/SMP.html
Sources of flooding: South Devon
Surface water
15%
Sewers 2%
Groundwater 2%
Tidal 5%
River & Surface
water 24% River &Tidal 14%
River 38%
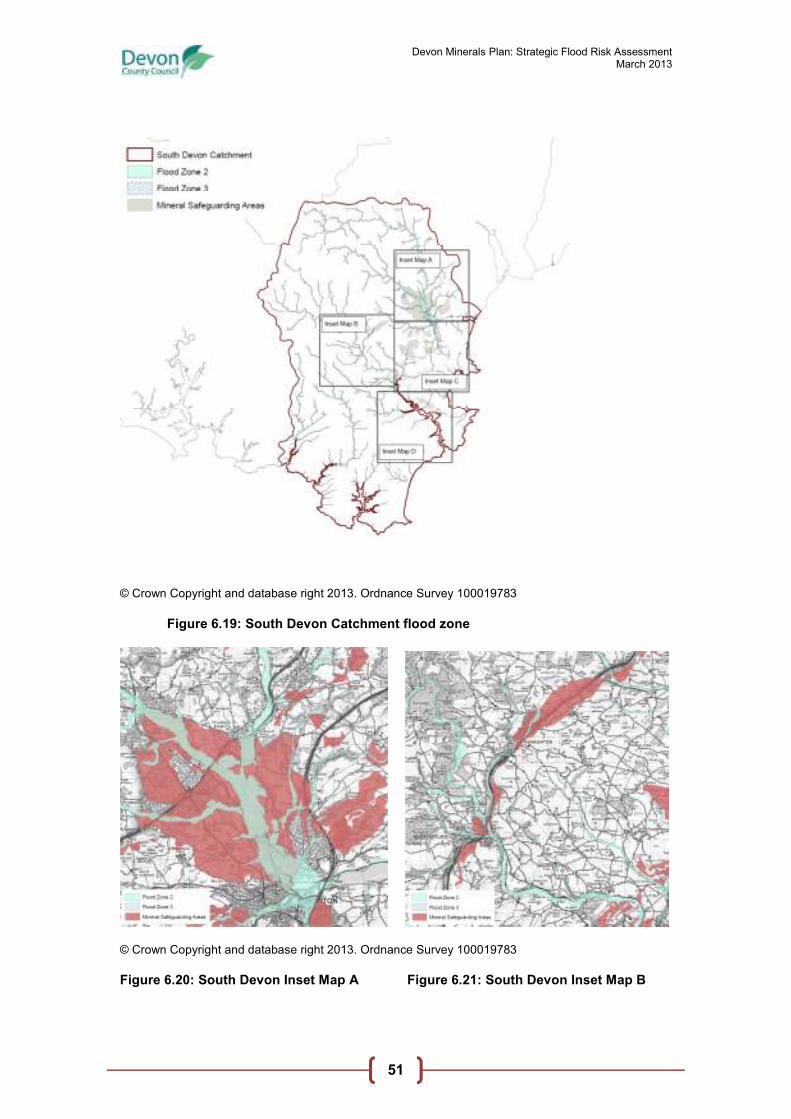
Devon Minerals Plan: Strategic Flood Risk Assessment March 2013
51
© Crown Copyright and database right 2013. Ordnance Survey 100019783
Figure 6.19: South Devon Catchment flood zone
© Crown Copyright and database right 2013. Ordnance Survey 100019783
Figure 6.20: South Devon Inset Map A Figure 6.21: South Devon Inset Map B

Devon Minerals Plan: Strategic Flood Risk Assessment March 2013
52
© Crown Copyright and database right 2013. Ordnance Survey 100019783
Figure 6.22: South Devon Inset Map C Figure 6.23: South Devon Inset Map D
6.36 The effect of climate change and sea level rise are regarded as being of
particular concern in Newton Abbot, with severe tidal flooding events becoming six times more likely by 2060. Information provided by the Environment Agency in March 2009 suggested that economic damage due to flooding in the catchment area (including Torbay) could increase to £26 million by 2100.
River Exe Catchment 6.37 The River Exe catchment includes the River Exe and its tributaries, spanning
from Exmoor in the North to the wide floodplains and river valleys on the outskirts of Exeter, and its smaller streams to the south. The waters and foreshore of the Exe Estuary at the lower part of the catchment are internationally important for ecology, providing an important wetland habitat throughout the year. The Exe Catchment crosses the Local Authority areas of Exeter City Council, East Devon District Council, Teignbridge District Council, Mid Devon District Council and North Devon District Council. The catchment area also crosses into Exmoor National Park, and West Somerset as can be seen in Figure 6.24.
6.38 Historically significant floods have occurred in the Exe Catchment area. In
1960 severe flooding in Exeter saw more than 1000 properties being flooded twice in the same year. This prompted a flood alleviation scheme in Exeter. In addition to the larger urban areas such as Exeter, Tiverton and Exmouth, flood events in the past have affected a number of properties in smaller settlements such as Stoke Canon, Bampton, Cullompton, Clyst St Mary and Dulverton. Information provided by the Environment Agency in 2008, as can be seen in Figure 6.25, found that the primary source of flooding is fluvial, with river flooding responsible for 55% of the flood events recorded in the

Devon Minerals Plan: Strategic Flood Risk Assessment March 2013
53
catchment, with the next most significant source of flooding being from surface water.
© Crown Copyright and database right 2013. Ordnance Survey 100019783
Figure 6.24: River Exe Catchment area
6.39 The Exeter City Council SFRA confirms that flood risk is mostly attributed to
river flooding in the lower reaches of the catchment and from the sea in the tidal influenced areas. The Mid Devon SFRA acknowledges that Tiverton is a settlement at particular risk of flooding. The RFRA identifies Exeter as suffering from significant flood risk, and highlights the river Clyst floodplain, which covers a large area between Broadclyst and Topsham, as being particularly problematic.
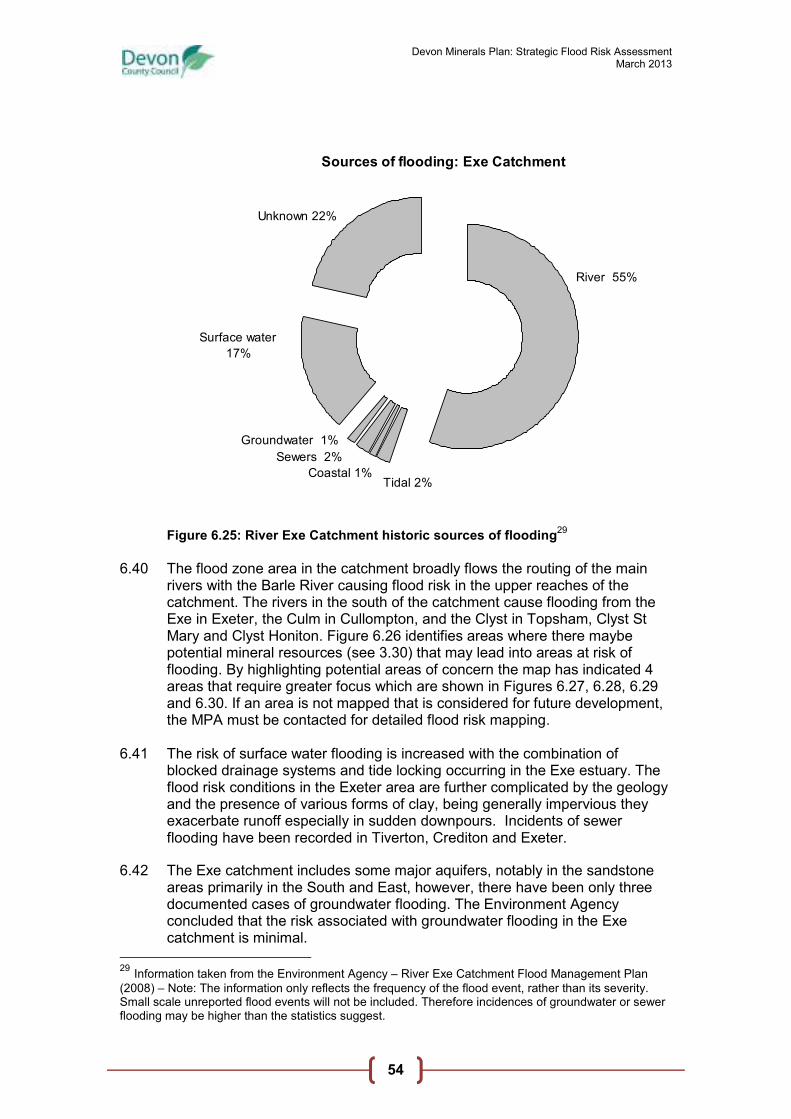
Devon Minerals Plan: Strategic Flood Risk Assessment March 2013
54
Figure 6.25: River Exe Catchment historic sources of flooding29
6.40 The flood zone area in the catchment broadly flows the routing of the main
rivers with the Barle River causing flood risk in the upper reaches of the catchment. The rivers in the south of the catchment cause flooding from the Exe in Exeter, the Culm in Cullompton, and the Clyst in Topsham, Clyst St Mary and Clyst Honiton. Figure 6.26 identifies areas where there maybe potential mineral resources (see 3.30) that may lead into areas at risk of flooding. By highlighting potential areas of concern the map has indicated 4 areas that require greater focus which are shown in Figures 6.27, 6.28, 6.29 and 6.30. If an area is not mapped that is considered for future development, the MPA must be contacted for detailed flood risk mapping.
6.41 The risk of surface water flooding is increased with the combination of
blocked drainage systems and tide locking occurring in the Exe estuary. The flood risk conditions in the Exeter area are further complicated by the geology and the presence of various forms of clay, being generally impervious they exacerbate runoff especially in sudden downpours. Incidents of sewer flooding have been recorded in Tiverton, Crediton and Exeter.
6.42 The Exe catchment includes some major aquifers, notably in the sandstone areas primarily in the South and East, however, there have been only three documented cases of groundwater flooding. The Environment Agency concluded that the risk associated with groundwater flooding in the Exe catchment is minimal.
29 Information taken from the Environment Agency – River Exe Catchment Flood Management Plan
(2008) – Note: The information only reflects the frequency of the flood event, rather than its severity. Small scale unreported flood events will not be included. Therefore incidences of groundwater or sewer flooding may be higher than the statistics suggest.
Sources of flooding: Exe Catchment
River 55%
Unknown 22%
Surface water
17%
Groundwater 1%
Sewers 2%
Coastal 1%Tidal 2%

Devon Minerals Plan: Strategic Flood Risk Assessment March 2013
55
© Crown Copyright and database right 2013. Ordnance Survey 100019783
Figure 6.26: River Exe Catchment flood zones
6.43 There are no reservoirs that sit within the framework area of the Exe catchment, however, the Wimbleball reservoir which is located in South Exmoor is a significant impounding structure. The consequences of this structure failing could have a considerable impact to the Exe catchment.
6.44 Within this catchment sits the growth point area to the east of Exeter. This
area will see substantial growth over the next decade as the new community, “Cranbrook” is developed. Further employment development is also planned in the form of the Exeter Science Park and Skypark Business Park. This substantial growth could have a significant effect on flood risk in the catchment area, specifically surface water flooding from increased urbanisation. It is important that the flood risk conditions in this area are regularly reviewed to take account of this increased development.
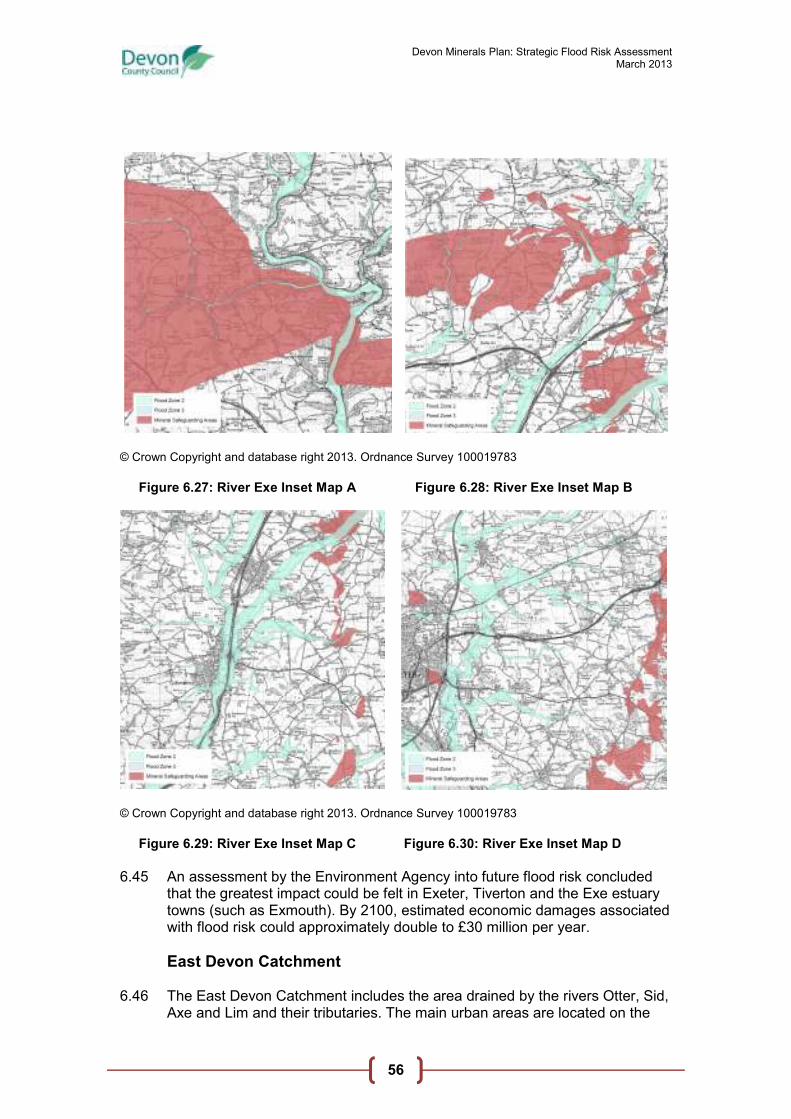
Devon Minerals Plan: Strategic Flood Risk Assessment March 2013
56
© Crown Copyright and database right 2013. Ordnance Survey 100019783
Figure 6.27: River Exe Inset Map A Figure 6.28: River Exe Inset Map B
© Crown Copyright and database right 2013. Ordnance Survey 100019783
Figure 6.29: River Exe Inset Map C Figure 6.30: River Exe Inset Map D
6.45 An assessment by the Environment Agency into future flood risk concluded
that the greatest impact could be felt in Exeter, Tiverton and the Exe estuary towns (such as Exmouth). By 2100, estimated economic damages associated with flood risk could approximately double to £30 million per year.
East Devon Catchment 6.46 The East Devon Catchment includes the area drained by the rivers Otter, Sid,
Axe and Lim and their tributaries. The main urban areas are located on the
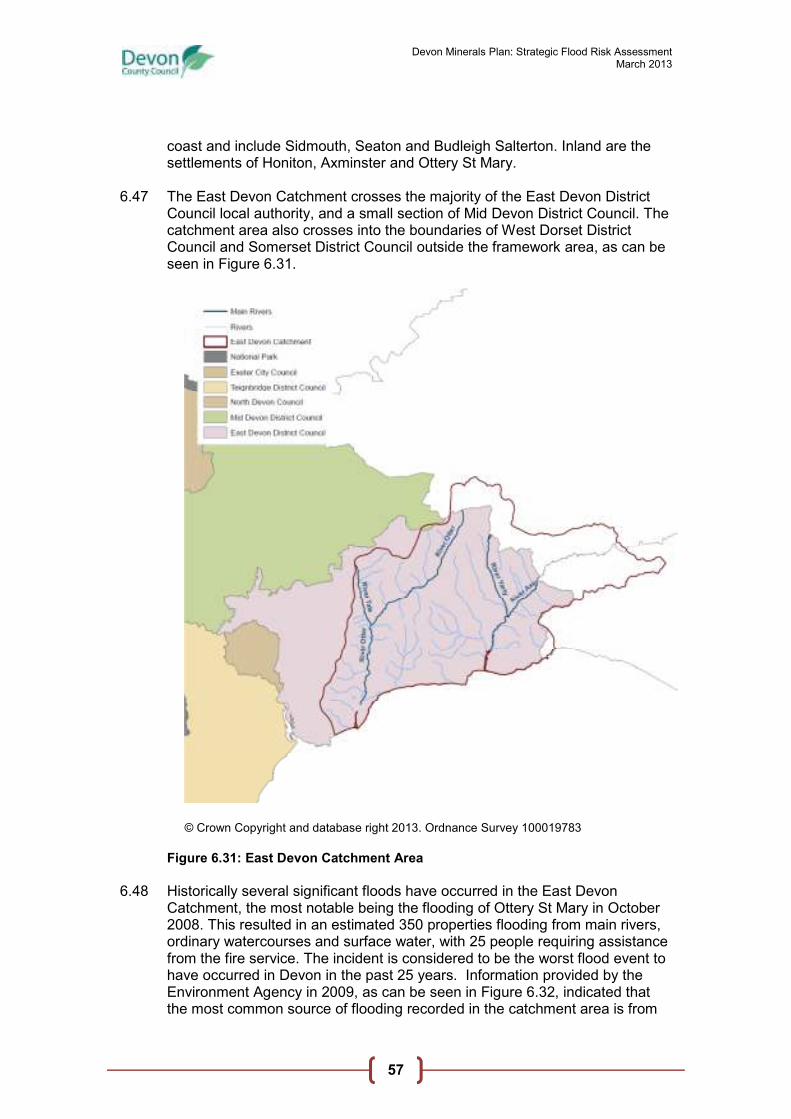
Devon Minerals Plan: Strategic Flood Risk Assessment March 2013
57
coast and include Sidmouth, Seaton and Budleigh Salterton. Inland are the settlements of Honiton, Axminster and Ottery St Mary.
6.47 The East Devon Catchment crosses the majority of the East Devon District
Council local authority, and a small section of Mid Devon District Council. The catchment area also crosses into the boundaries of West Dorset District Council and Somerset District Council outside the framework area, as can be seen in Figure 6.31.
© Crown Copyright and database right 2013. Ordnance Survey 100019783
Figure 6.31: East Devon Catchment Area
6.48 Historically several significant floods have occurred in the East Devon
Catchment, the most notable being the flooding of Ottery St Mary in October 2008. This resulted in an estimated 350 properties flooding from main rivers, ordinary watercourses and surface water, with 25 people requiring assistance from the fire service. The incident is considered to be the worst flood event to have occurred in Devon in the past 25 years. Information provided by the Environment Agency in 2009, as can be seen in Figure 6.32, indicated that the most common source of flooding recorded in the catchment area is from
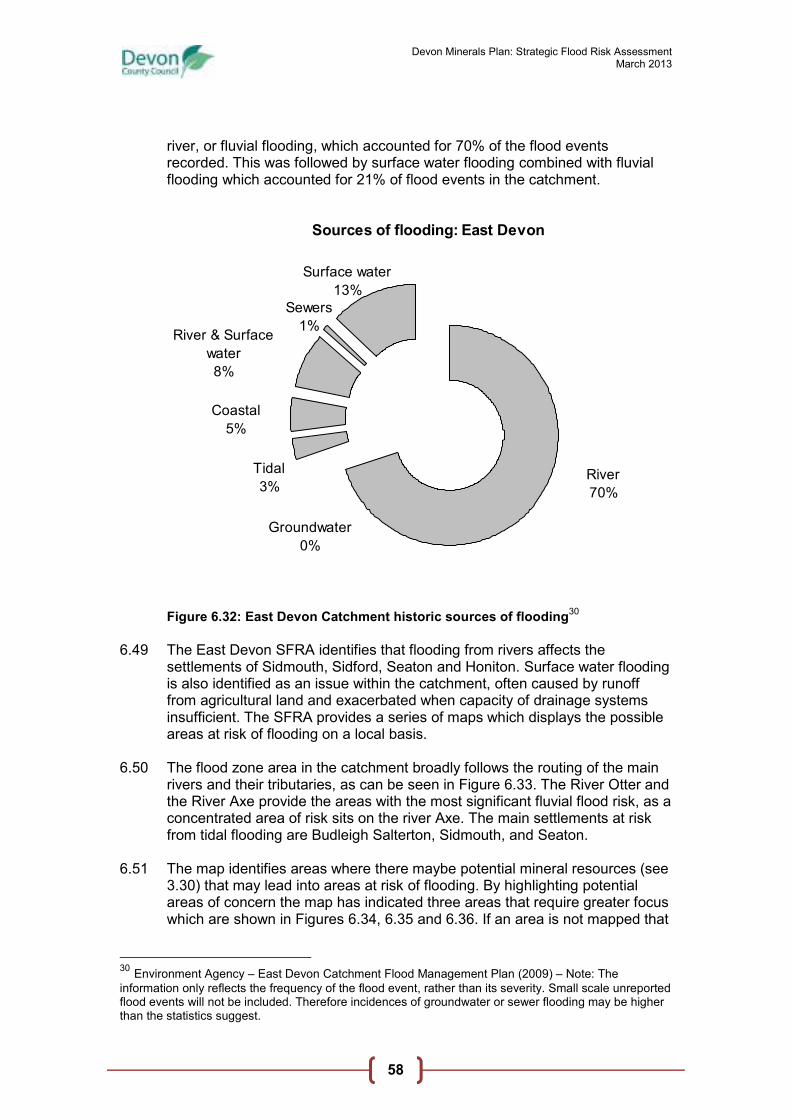
Devon Minerals Plan: Strategic Flood Risk Assessment March 2013
58
river, or fluvial flooding, which accounted for 70% of the flood events recorded. This was followed by surface water flooding combined with fluvial flooding which accounted for 21% of flood events in the catchment.
Figure 6.32: East Devon Catchment historic sources of flooding30
6.49 The East Devon SFRA identifies that flooding from rivers affects the
settlements of Sidmouth, Sidford, Seaton and Honiton. Surface water flooding is also identified as an issue within the catchment, often caused by runoff from agricultural land and exacerbated when capacity of drainage systems insufficient. The SFRA provides a series of maps which displays the possible areas at risk of flooding on a local basis.
6.50 The flood zone area in the catchment broadly follows the routing of the main
rivers and their tributaries, as can be seen in Figure 6.33. The River Otter and the River Axe provide the areas with the most significant fluvial flood risk, as a concentrated area of risk sits on the river Axe. The main settlements at risk from tidal flooding are Budleigh Salterton, Sidmouth, and Seaton.
6.51 The map identifies areas where there maybe potential mineral resources (see
3.30) that may lead into areas at risk of flooding. By highlighting potential areas of concern the map has indicated three areas that require greater focus which are shown in Figures 6.34, 6.35 and 6.36. If an area is not mapped that
30 Environment Agency – East Devon Catchment Flood Management Plan (2009) – Note: The
information only reflects the frequency of the flood event, rather than its severity. Small scale unreported flood events will not be included. Therefore incidences of groundwater or sewer flooding may be higher than the statistics suggest.
Sources of flooding: East Devon
River
70%
Surface water
13%
Groundwater
0%
River & Surface
water
8%
Sewers
1%
Coastal
5%
Tidal
3%

Devon Minerals Plan: Strategic Flood Risk Assessment March 2013
59
is considered for future development, the MPA must be contacted for detailed flood risk mapping.
© Crown Copyright and database right 2013. Ordnance Survey 100019783
Figure 6.33: East Devon Catchment flood zones
6.52 The Durlston Head to Rame Head Shoreline Management Plan31 provides greater information in relation to flooding from tidal sources. This plan should be consulted if proposed development is located on the coast.
31 More information in relation to this SMP can be found at http://www.sdadcag.org/
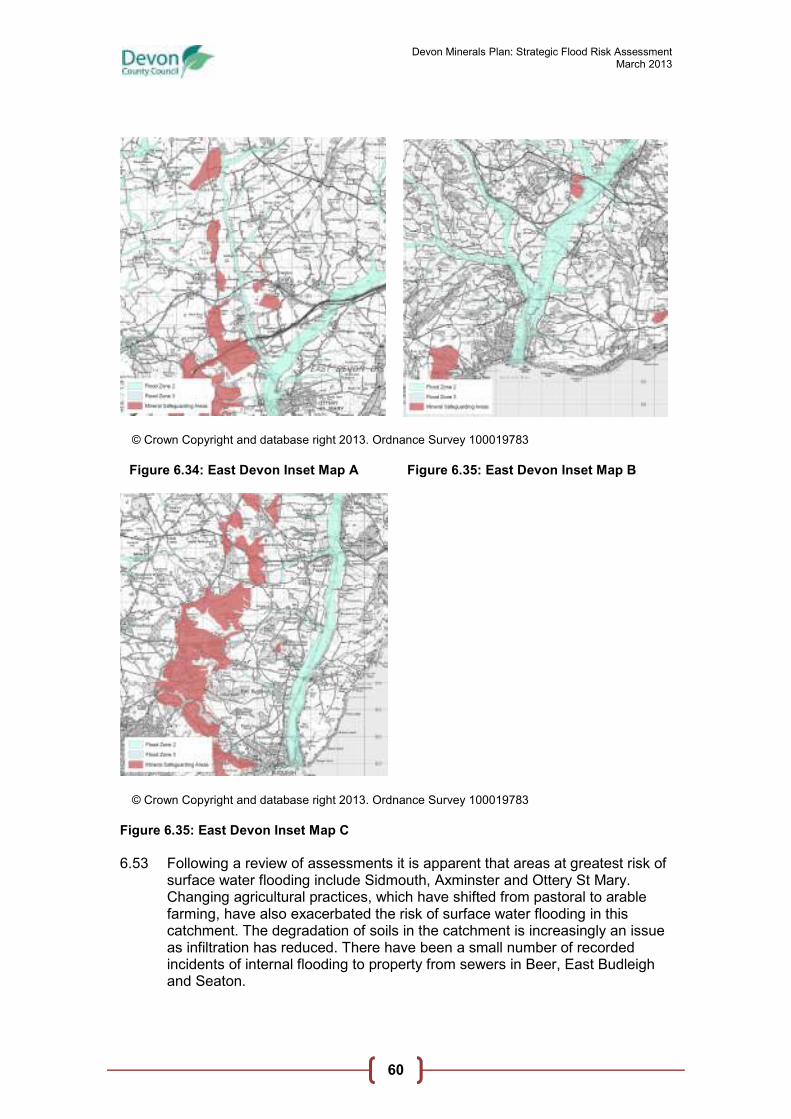
Devon Minerals Plan: Strategic Flood Risk Assessment March 2013
60
© Crown Copyright and database right 2013. Ordnance Survey 100019783
Figure 6.34: East Devon Inset Map A Figure 6.35: East Devon Inset Map B
© Crown Copyright and database right 2013. Ordnance Survey 100019783
Figure 6.35: East Devon Inset Map C
6.53 Following a review of assessments it is apparent that areas at greatest risk of
surface water flooding include Sidmouth, Axminster and Ottery St Mary. Changing agricultural practices, which have shifted from pastoral to arable farming, have also exacerbated the risk of surface water flooding in this catchment. The degradation of soils in the catchment is increasingly an issue as infiltration has reduced. There have been a small number of recorded incidents of internal flooding to property from sewers in Beer, East Budleigh and Seaton.

Devon Minerals Plan: Strategic Flood Risk Assessment March 2013
61
6.54 Due to the geology in the catchment, flooding from groundwater is considered to be unlikely; however there has been a recorded groundwater related incident in combination with tidal flooding in Budleigh Salterton.
6.55 There are no reservoirs that sit within area of the East Devon Catchment so
the risk of flooding from infrastructure failure is negligible. The risks to people, property and infrastructure are concentrated mainly in Seaton, with significant numbers also at risk in Ottery St Mary, Honiton, Budleigh Salterton, Newton Poppleford and Sidmouth.
6.56 In an Environment Agency assessment of future flood risk it was found that
land management changes in the catchment are expected to affect the frequency and magnitude of flooding. This could result in greater flood flows and depths, putting more people and properties at risk. By 2100 estimated economic damages associated with flood risk could reach £15 million per year.

Devon Minerals Plan: Strategic Flood Risk Assessment March 2013
62
7. Sequential Approach to Flood Risk in the Planning Process
7.1 All development affects flood risk conditions, be it mineral extraction, waste
management, or housing. Development can alter the natural hydrological flows, increase impermeable surface area and change natural drainage patterns, all of which affect the flow and velocity of run off into rivers and streams.
7.2 It is the duty of the planning process to ensure that flood risk conditions are
not adversely affected when development occurs. This is achieved through a sequential approach to flood risk, delivered strategically in the planning policy stages and through development management in the determination of planning applications.
7.3 This section explains this sequential approach in the planning process,
encompassing steps 2 and 3 in the context of the Flood Risk Hierarchy. This approach will help to avoid and manage flood risk by adopting the sequential approach at a strategic level, and to substitute potential flood risk by applying the sequential test at site level.
The Flood Risk Hierarchy
Figure 7.1: Flood Risk Hierarchy
Sequential Approach to Managing Flood Risk 7.4 The risk-based sequential approach is a means by which to steer new
development to areas that have the lowest likelihood of flooding. This provides the most sustainable approach to dealing with flood risk, avoidance.
7.5 This SFRA provides the evidence base for steering development, specifically mineral sites, to the areas at least risk of flooding. This assessment of flood risk should be consulted when development is considered, and be used to sequentially locate future facilities in the areas of least risk. The sequential approach must be applied at all stages of planning, from policy direction, development management to site design.
7.6 In the formulation of minerals policy and the production of the Devon Minerals Plan, this SFRA will be consulted and used to allocate sites that may be considered appropriate for future mineral development.
Step 1
Assess
Appropriate flood risk
assessment
Step 2
Avoid
Apply the sequential approach
Step 3
Substitute
Apply the Sequential Test at site
level
Step 4
Control
e.g. SUDS, design, flood
defences
Step 5
Mitigate
e.g. Flood resilient
construction

Devon Minerals Plan: Strategic Flood Risk Assessment March 2013
63
7.7 Once the Devon Mineral Plan has been adopted the SFRA will be used as a tool to apply the sequential approach to inform decisions on the determination of future mineral planning applications.
Sequential Test 7.8 The sequential test is the means by which the sequential approach is
delivered and assessed. The test categorises different forms of development according to its vulnerability. There are five different vulnerability classes:
♦ essential infrastructure
♦ highly vulnerable
♦ more vulnerable
♦ less vulnerable
♦ water compatible development 7.9 All mineral operations are classified as “less vulnerable”, unless it is sand and
gravel working which is defined as “water-compatible”.
Less Vulnerable o Minerals working and processing (except for sand
and gravel working).
Water-Compatible o Sand and gravel workings.
Figure 7.2: Flood Risk Vulnerability Classification amended from NPPF
Technical Guidance32
7.10 The nature of development should be considered in the context of the
vulnerability classification matrix as outlined in Figure 7.3. This matrix determines which form of development is suitably located within the defined areas at risk of flooding. These defined areas are categorised by the fluvial flood zones.
Less Vulnerable Water Compatible
Zone 1
Development Appropriate Development Appropriate
Zone 2
Development Appropriate Development Appropriate
Zone 3a
Development Appropriate
Development Appropriate
Zone 3b
Development should not be Permitted
Development Appropriate
Figure 7.3: Flood Risk Vulnerability and Flood Zone Compatibility amended
from NPPF Technical Guidance33
32 NPPF Technical Guidance can be viewed at
www.communities.gov.uk/publications/.../nppftechnicalguidance.pdf 33 NPPF Technical Guidance can be viewed at
www.communities.gov.uk/publications/.../nppftechnicalguidance.pdf

Devon Minerals Plan: Strategic Flood Risk Assessment March 2013
64
7.11 ‘Less vulnerable’ development, which includes all mineral development (except sand and gravel working), can be located in flood zone 3a and flood zone 2 but only when a sequential test has been satisfied. Development in flood zone 1 is only restricted by the management of surface water.
7.12 The inclusion of sand and gravel working within the ‘water compatible’
category is considered to be a reflection of the general pattern of quarrying over much of the country. Sand and gravel extraction elsewhere in England is typically undertaken in river valleys, and therefore floodplains.
7.13 In contrast, sand and gravel working in the Devon Mineral Plan area takes
place within ‘bedrock’ deposits, of which only a small proportion lies within Flood Zones 2 or 3. It is therefore feasible to locate future sand and gravel workings outside of the high risk zones.
7.14 If mineral development is proposed to be located in flood zone 2 or 3a then
the process of a sequential test must be completed to show that there is no other practicable site within flood zone 1. This will require assessment and definition of the geographical area over which the Sequential Test is to be applied. This defined geographical area will largely depend upon the functional requirements of the development, dictated by the development type and the identified need. This area of search can be the whole MPA area or the specific area of need.
7.15 Assessment must then be made of the reasonably available alternative sites
that are located in a lower flood risk zone. If a reasonable alternative is found within a zone of lower risk, then the development must be directed to this area. In some cases, there may be constraints that require that development be located in flood zone 2 or flood zone 3a. These constraints can include policy restrictions, physical limitations, geological characteristics and potential impacts on the development. In considering proposals for mineral working within flood zones 2 and 3, it may be appropriate to take account of the scope for creation of compensatory flood capacity through the remodelling of nearby land (e.g. through the removal of a waste tip, or enabling a worked out quarry to accommodate flood water).
7.16 In terms of the site identification work for the Devon Minerals Plan the
sequential approach will be used systematically in the assessment of potential sites. Subsequent sites proposed through planning applications will follow the same assessment criteria.
7.17 Following the adoption of the Devon Minerals Plan, if a site has already been
allocated as an appropriate location for proposed mineral development, the likelihood is that it will be considered suitable in regard to flood risk concerns. This is due to the MPA having assessed its flood risk conditions in the allocation process. More detail may however be required to assess the individual proposal in the development management process, even if the site is allocated.
7.18 A template has been produced that guides how the sequential test should
approached in considering development before and after the adoption of the Devon Minerals Plan. This is available in Appendix B.

Devon Minerals Plan: Strategic Flood Risk Assessment March 2013
65
Exception Test
7.19 The Exception Test is applied in certain circumstances where the Sequential Test has shown there to be no suitable alternative development sites in areas of lower risk. In exceptional circumstances, there may be valid reasons for a development type to be approved when it is not compatible within the level of flood risk at a particular site.
7.20 For the Exception Test to be passed, a full sequential test must have taken
place beforehand, and both of the following criteria be satisfied:
♦ it must be demonstrated that the development provides wider sustainability benefits to the community that outweigh flood risk, informed by this Strategic Flood Risk Assessment; and
♦ a site-specific flood risk assessment must demonstrate that the development will be safe for its lifetime taking account of the vulnerability of its users, without increasing flood risk elsewhere, and, where possible, will reduce flood risk overall.34
7.21 In occasions when the exception test is required, the scope of the Strategic
Flood Risk Assessment must be widened to consider impact of the flood risk management infrastructure on the frequency, impact, speed of onset, depth and velocity of flooding within the flood zones considering a range of flood risk management maintenance scenarios. These scenarios should include climate change projections based on the assumptions provided in Figure 3.5 and 3.6.
Guidance for Developers 7.22 This section will provide information on how the sequential approach should
be applied in the preparation of flood risk assessments (FRA) for specific proposals. In applying the sequential approach a sequential test must be conducted. This is to ensure that the vulnerability of the development is compatible with the flood risk conditions in its given location.
7.23 The first step is to identify the vulnerability of the development. The next step
is to consult current mineral planning policy to discover if there are any sites allocated for this type of mineral operation. If a site is proposed and it is not allocated in mineral planning policy, then its flood risk conditions must be assessed. This SFRA and the District Council SFRA should be consulted as guidance in assessing the variety of conditions, including the possible flood zone designation of the site. Once the flood zone designation has been decided, it can then in applied to the vulnerability classification matrix, as presented in figure 6.2. This will demonstrate whether development is permitted or if a sequential or exception test needs to be satisfied. Following this compatibility assessment it may be necessary to then request a site specific flood risk assessment as explained in the following section.
34 NPPF can be viewed at
http://www.communities.gov.uk/documents/planningandbuilding/pdf/2116950.pdf

Devon Minerals Plan: Strategic Flood Risk Assessment March 2013
66
Site Specific Flood Risk Assessment (FRA) 7.24 These assessments are generally requested from the prospective developer
for specific sites at the planning application stage. They are used to demonstrate that development is not likely to increase flood risk elsewhere, now or in the future.
7.25 The conditions35 where a site specific FRA may be required are:
♦ proposals for new development located in flood zones 2 or 3;
♦ proposals for major development in flood zone 1 (e.g. development site being 1 hectare or greater);
♦ proposals that change the land use to a more vulnerable class;
♦ Proposals that present specific surface water concerns; and
♦ in the case of planning application renewal, where a site is subject to altered flood risk conditions.
7.26 A site specific flood risk assessment should:
♦ identify and assess the risks of all forms of flooding to and from the development. It should demonstrate how these flood risks will be managed, taking climate change into account;
♦ demonstrate that most vulnerable development is located in areas of lowest flood risk unless there are overriding reasons to prefer a different location;
♦ address the potential impacts of the development on flood storage capacity within the site (including any scope for the creation of additional capacity in mineral voids following restoration); and
♦ show that development is appropriately flood resilient and resistant, including safe access and escape routes where required, and that any residual risk can be safely managed, including by emergency planning; and that it gives priority to the use of sustainable drainage systems.
7.27 The FRA may require consultation with flood risk consultees such as
Environment Agency, Lead Local Flood Authority, sewerage undertakers, District and emergency planning authorities, the Highway Authority, reservoir undertakers, navigation authorities and emergency services.
7.28 A flowchart is presented in Figure 7.4 which demonstrates how the sequential
approach works in practice. This model takes direction from national policy36 and demonstrates to developers the processes involved and the possible requirements.
35
Conditions presented in the NPPF
http://www.communities.gov.uk/documents/planningandbuilding/pdf/2115548.pdf 36 provided in the NPPF and its accompanying Technical Guidance
http://www.communities.gov.uk/documents/planningandbuilding/pdf/2115548.pdf

Devon Minerals Plan: Strategic Flood Risk Assessment March 2013
67
Figure 7.4: Guidance for developers on floor risk consideration processes required when making mineral planning applications
Identify vulnerability of proposed mineral development
Confirm with MPA whether a Flood Risk Assessment (FRA) is required and if consultation is necessary with flood risk consultees.
Consult Mineral Planning Authority (MPA). Does the MPA confirm that the proposed development may be acceptable?
Consider alternative development/site
Has the site been allocated in the minerals planning policy?
Does the proposed development have the potential to pass the Sequential Test?
Where applicable, undertake pre-application consultation with the flood risk consultees. Is there any known flooding-related site constraints which make the development proposed inappropriate?
Agree the scope of an appropriate FRA with the MPA and EA based on the pre-application discussions. Undertake FRA. Is the proposal safe and doesn’t increase flood risk elsewhere?
Submit application and FRA to MPA using standard Planning Application Form.
Do the proposals fulfil the requirements of the Sequential Test? Have all contentious issues been discussed and agreed with the MPA and flood risk consultees?
No
Yes
No
Yes
Yes
No
Yes
No
Yes
Yes
No
No
Consider revising the proposal. Do the proposed changes now meet the expected requirements?
No
Yes

Devon Minerals Plan: Strategic Flood Risk Assessment March 2013
68
8. Sustainable Management of Flood Risk Through Development
8.1 It is also the role of planning to implement “control” measures through
development with the aim of minimising, managing and mitigating the potential impact of flooding. This encompasses step 4 of the flood risk hierarchy as can be seen in Figure 8.1 to control the effects of possible flood risk.
Figure 8.1: Flood Risk Hierarchy 8.2 In this section guidance is provided on the likely control of flood risk. Mineral
development management policy plays a vital role in this as it guides development in ways to lessen flood risk. The use of sustainable drainage systems will also considered, as surface water drainage and its impact on surrounding areas must be considered on all development.
8.3 In addition to development management and the application of SuDS, other
flood resilient design measures should be considered at inception to offer greater resilience to flood impact, such as the construction of flood banks. Site layout should ensure that the development is orientated in a manner that will have the least flood impact, for example, the most vulnerable ancillary buildings being located in the site area of least risk.
8.4 Further guidance is provided by CIRIA (Construction Industry Research and
Information Association) in relation to flood risk avoidance, resistance and resilience in site and building design37.
Mineral Development Management Policy 8.5 Mineral Planning Authorities should use their planning powers to manage
development which could increase the risk of flooding. Mineral development management policy plays a vital role in the control of this flood risk, this is especially important because mineral development has specific characteristics that can affect its interaction with flood risk.
8.6 The size and scale of the sites that are worked in mineral extraction are often
larger than other development. This can influence flood risk through changes to flood storage capacity, floodplain conveyance and by affecting flows of surface water and groundwater.
37 Development and Flood Risk – Guidance for the Construction Industry Report C624, CIRIA, 2004).
Step 1
Assess
Appropriate flood risk
assessment
Step 2
Avoid
Apply the sequential approach
Step 3
Substitute
Apply the Sequential Test at site
level
Step 4
Control
e.g. SUDS, design, flood
defences
Step 5
Mitigate
e.g. Flood resilient
construction
Devon Minerals Plan: Strategic Flood Risk Assessment March 2013
69
8.7 Mineral working is a temporary activity, albeit often a long-term one and the restoration of sites following their closure may offer an opportunity to positively influence flood storage capacity within the site. Conditions can be built into the process to ensure that this opportunity is delivered.
8.8 These conditions can be reassessed, as all active mineral sites are subject to
periodic review on a 15 year cycle. This will allow consideration of flood risk and mitigation at individual sites.
8.9 Specific to Devon, a large proportion of the land within the Bovey Basin ball
clay working area mineral planning permission is within Flood Zones 2 and 3. As a mineral of national importance, it is expected that this resource will require future development for the foreseeable future. This means that careful consideration and effective delivery of the sequential approach, taking account of the scope for reinstatement of the historic floodplain, is needed to ensure that flood risk is not increased with future site allocations.
8.10 Mineral development plan documents will include policy which will consider
the potential impact of proposed mineral development on flood risk. Flood risk will be considered alongside other environmental constraints to ensure that proposed development will have acceptable impact on flooding and flood risk and will be addressed through the exercise of its development management function.
Sustainable Drainage 8.11 Sustainable Drainage Systems (SuDS) is a term used to describe various
approaches to managing surface water in a sustainable manner. The management of rainfall, a major contributor to surface water flooding, is considered an essential element of reducing future flood risk to both the site and its surroundings.
8.12 The principle of SuDS is to ensure that the drainage features and systems
installed with development reflect those of the natural drainage pattern prior to the onset of development. SuDS should therefore ensure that the developed site demonstrates the same run off volume as greenfield rates.
8.13 SuDS improve the sustainable management of water by reducing peak flows
to watercourses, potentially reducing the risk of flooding downstream. They also have the following supplementary benefits:
♦ improve water quality by removing pollutants from diffuse pollutant sources;
♦ replicate natural drainage patterns, including the recharge of groundwater so that base flows are maintained;
♦ deliver amenity through the provision of public open space and wildlife habitat; and
♦ reduce water demand through rainwater harvesting.

Devon Minerals Plan: Strategic Flood Risk Assessment March 2013
70
8.14 There are various ways in which SuDS can be incorporated into mineral operations. Quarries install ponds and lagoons to capture run off, and at times the water is re-used in the associated mineral works. Ancillary buildings can install green roofs, and associated concreted areas can consider permeable paving. A list of the commonly found SuDS systems and possible application issues is described in Figure 8.2.
SuDS Description Issues for Application
Permeable paving
Surfaces that allow inflow of rainwater into the underlying construction or soil.
Using the right material for the surface. Visual appearance. Traffic loading.
Green roofs
Vegetated roofs that reduce the volume and rate of runoff and remove pollution.
Visual appearance. Ongoing management requirements.
Filter drain
Linear drains consisting of trenches filled with a permeable material, often with a perforated pipe in the base of the trench to assist drainage, to store and conduct water; they may also permit infiltration.
Land take. Visual integration into development.
Filter strips
Vegetated areas of gently sloping ground designed to drain water evenly off impermeable areas and to filter out silt and other particulates.
Land take. Visual integration into development. Multi-functionality. Adequate for predicted run-off.
Swales
Shallow vegetated channels that conduct and retain water, and may also permit infiltration; the vegetation filters particulate matter.
Land take. Visual integration into development. Multi-functionality. Adequate for predicted run-off.
Basins, ponds and wetlands
Areas that may be utilised for surface runoff storage.
Land take. Multi-functionality. Health and Safety. Strategic planning for biodiversity. Improve amenity value, including restoration of habitat and/or environmental enforcement.
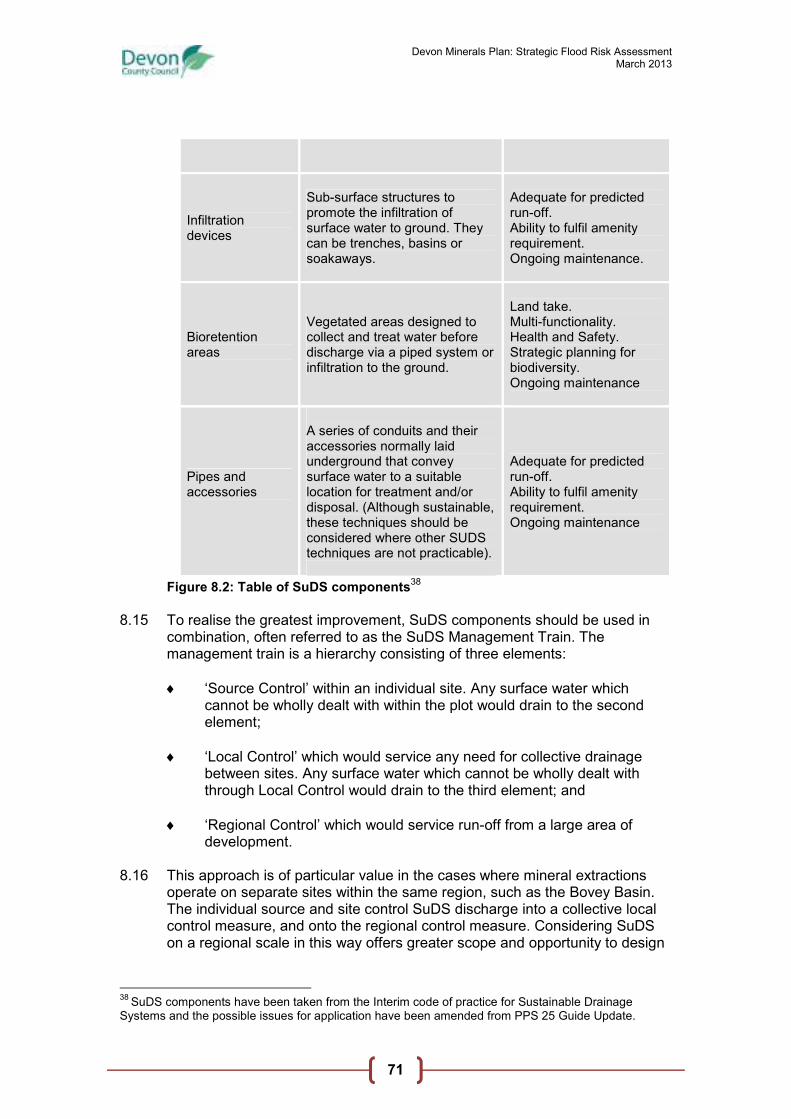
Devon Minerals Plan: Strategic Flood Risk Assessment March 2013
71
Infiltration devices
Sub-surface structures to promote the infiltration of surface water to ground. They can be trenches, basins or soakaways.
Adequate for predicted run-off. Ability to fulfil amenity requirement. Ongoing maintenance.
Bioretention areas
Vegetated areas designed to collect and treat water before discharge via a piped system or infiltration to the ground.
Land take. Multi-functionality. Health and Safety. Strategic planning for biodiversity. Ongoing maintenance
Pipes and accessories
A series of conduits and their accessories normally laid underground that convey surface water to a suitable location for treatment and/or disposal. (Although sustainable, these techniques should be considered where other SUDS techniques are not practicable).
Adequate for predicted run-off. Ability to fulfil amenity requirement. Ongoing maintenance
Figure 8.2: Table of SuDS components38
8.15 To realise the greatest improvement, SuDS components should be used in
combination, often referred to as the SuDS Management Train. The management train is a hierarchy consisting of three elements:
♦ ‘Source Control’ within an individual site. Any surface water which cannot be wholly dealt with within the plot would drain to the second element;
♦ ‘Local Control’ which would service any need for collective drainage between sites. Any surface water which cannot be wholly dealt with through Local Control would drain to the third element; and
♦ ‘Regional Control’ which would service run-off from a large area of development.
8.16 This approach is of particular value in the cases where mineral extractions
operate on separate sites within the same region, such as the Bovey Basin. The individual source and site control SuDS discharge into a collective local control measure, and onto the regional control measure. Considering SuDS on a regional scale in this way offers greater scope and opportunity to design
38
SuDS components have been taken from the Interim code of practice for Sustainable Drainage Systems and the possible issues for application have been amended from PPS 25 Guide Update.

Devon Minerals Plan: Strategic Flood Risk Assessment March 2013
72
measures that will most successfully mimic the natural/greenfield drainage pattern.
Figure 8.3: Diagram of how SuDS can be used in combination
8.17 The appropriate application of a SuDS scheme to a specific development is
heavily dependent upon the topography and geology of the site (and its surrounds). Careful assessment of the site characteristics must be considered to ensure the future sustainability of the adopted system. Further guidance in relation to an appropriate system is provided by CIRIA39
8.18 When considering the use of SuDS in the management of surface water at
mineral sites, regard should be had to the scope for both positive and negative impacts on other interests. While SuDS may achieve an enhancement of a site's biodiversity by providing a wetland habitat, care should be taken in the vicinity of an airport or associated flightpaths not to create an increased risk of birdstrike arising from water features that may attract birds.
8.19 Legislation40 in the form of the Flood and Water Management Act 2010 has
formalised the responsibilities regarding the installation of SuDS. The legislation requires that any development that involves “construction with drainage implications” must have the application “approved” by the SuDS Approval Body (SAB), prior to any work commencing. At the time of writing the commencement order of this part of the Act is yet to be given, as consultation is still underway. Once the commencement has been ordered, the responsibility for the SAB will sit with Devon County Council acting as the Lead Local Flood Authority (LLFA).
39 Construction Industry Research and Information Association (CIRIA) The SuDS Manual (C697) 40
A copy of the Act can be accessed at http://www.legislation.gov.uk/ukpga/2010/29/contents
Source Control Local Control Regional Control
Green Permeable Filter Pond Swale Local Roof Car park Strip Watercourse
100 % infiltration through the systems

Devon Minerals Plan: Strategic Flood Risk Assessment March 2013
73
9. Mitigation of Residual Flood Risk 9.1 The risk from flooding can never be completely removed. Even after
assessment, avoidance, substitution and control. Failure can always occur in the flood management infrastructure such as flood defences, or an extreme weather event may exceed the imposed design standards in development.
9.2 Where residual risks remain, appropriate assessment of these risks and
possible mitigation measures should be considered. This encompasses step 5 of the Flood Risk Hierarchy to “mitigate” or lessen any residual impact of flood risk.
Figure 9.1: Flood Risk Hierarchy
9.3 In this section of the SFRA the responsibility structure for flood risk is outlined,
followed by consideration of the residual risk associated with flood defence or infrastructure failure. Flood risk management measures, such as warning systems and flood plans provide information to the public on protection from flood risk, an important tool in mitigating the effect flooding.
Responsibility for Flood Risk Management 9.4 A number of organisations have responsibility for different aspects of flood
risk within the Plan Area. 9.5 The Environment Agency has overall responsibility for managing coastal
flooding and for fluvial flood risk from watercourses designated as main rivers, and also has responsibility for the construction of flood defences.
9.6 The responsibility of Local Councils has changed since the introduction of the
Flood and Water Management Act (2010). This legislation introduced the Lead Local Flood Authority which sits with either the Unitary Council or County Council. In the case of the Plan Area, Devon County Council operates as the LLFA.
9.7 LLFAs are tasked with producing flood risk management strategies for their
local areas, taking into consideration surface water runoff, groundwater and ordinary watercourses (including lakes and ponds). The lead local flood authority must also develop, maintain, apply and monitor a strategy for local flood risk management.
Step 1
Assess
Appropriate flood risk
assessment
Step 2
Avoid
Apply the sequential approach
Step 3
Substitute
Apply the Sequential Test at site
level
Step 4
Control
e.g. SUDS, design, flood
defences
Step 5
Mitigate
e.g. Flood resilient
construction
Devon Minerals Plan: Strategic Flood Risk Assessment March 2013
74
9.8 The responsibility for the highway drainage network is also the responsibility of Devon County Council acting as the Highway Authority for the Plan Area, with the exception of major trunk roads which are the responsibility of the Highways Agency.
Flood Defence and Infrastructure Failure 9.9 Existing within the framework area is a complex network of flood defences
that protect settlements across the county, including Exeter, Barnstaple, Tiverton and Newton Abbot. The county also has numerous impounding structures such as reservoirs.
9.10 The flood defences established across the framework area vary considerably
in protection standard, and the standard of protection is heavily dependent on when the defence was constructed. In the past flood defences had been built to a standard to protect against a 1 in 30 year flood event. By comparison, today’s design standards often endeavour for considerably greater protection, often against a 1 in 100 year event.
9.11 The dispersed nature of the network of flood defences, coupled with the
variety of resilience standards mean that listing all flood defence structures in the Plan Area is impractical. Assessment of the severity of the remaining risk from breach of systems should be investigated on a site by site basis.
9.12 If a site is considered at particular risk of flooding from infrastructure failure
then an assessment into the “residual risk” may be requested as part of the site specific FRA.
9.13 Measures to manage residual flood risk include:
♦ flood alleviation schemes (potentially funded through a combination of public and developer contributions);
♦ flood resilience and resistance measures;
♦ flood warning and evacuation plans; and
♦ designing new sustainable drainage systems taking account of storm events which exceed the design standard.
Flood Warning Systems
9.14 Within the framework area as elsewhere in England, the responsibility for flood warning rests primarily with the Environment Agency. By monitoring rainfall, river levels and sea conditions the information is used to forecast the possibility of flooding. The following 3 warnings are used41:
41 More details on the flood warning system can be accessed at http://www.environment-
agency.gov.ukhomeandleisure/floods/31618.aspx

Devon Minerals Plan: Strategic Flood Risk Assessment March 2013
75
o Flood Alert - A flood alert means that flooding is possible and that you need to be prepared.
o Flood Warning - Means that flooding is expected and that you should take immediate action.
o Severe Flood Warning - Means that there is severe flooding and danger to life. These are issued when flooding is posing significant risk to life or disruption to communities.
9.15 The warning system is communicated by a variety of measures. The website
holds current information at http://www.environment-agency.gov.uk and there is a phone floodline on 0845 988 1188. The Environment Agency also provides a service where members of the public can sign up for flood risk notifications to be sent directly to them.
Flood Event Management 9.16 Devon County Council is required to prepare and maintain emergency plans
that prevent emergencies, mitigate their effect and to take action in the event of an emergency. As part of this responsibility the council is a member of the Local Resilience Forum (LRF), a multi-agency organisation covering Devon, Cornwall and the Isles of Scilly. The LRF is a partnership made up of representatives from local public services, the emergency services, the NHS, the Environment Agency and other organisations.
9.18 The LRF Multi Agency Flood Plan42 provides a strategic overview of actions,
roles and responsibilities specific to flood risk and tactical information. It includes a communication plan to be used in the event of flood, command and control guidance, and an evacuation plan.
9.19 To accompany the LRF Multi Agency Flood Plan, Devon County Council has
produced 32 plans for its high risk communities43 that outline the emergency response points, services and the areas thought to be at risk of flooding. These include: Ashburton, Barnstaple, Bideford, Braunton, Buckfastleigh, Cullompton, Dartmouth, Exeter , Exmouth, Harbertonford, Illfracombe, Instow, Kingsbridge, Kingskerswell, Kingsteignton, Lympstone, Newton Abbot, Okehampton, Ottery St Mary, Paignton, Salcombe, Seaton, Sidmouth, South Molton, Starcross, Stoke Canon, Teignmouth, Shaldon, Tiverton, Topsham and Totnes.
42 A copy of the LRF Multi Agency Flood Plan can be accessed at
http://www.devon.gov.uk/lrf_multi_agency_flood_plan_v1.6__01.03.11_.pdf 43 The flood plans can be accessed at http://www.devon.gov.uk /emergency_planning_flooding.htm

Devon Minerals Plan: Strategic Flood Risk Assessment March 2013
76
10. Conclusions and Recommendations 10.1 This Strategic Flood Risk Assessment (SFRA) is prepared in accordance with
the National Planning Policy Framework (NPPF), its accompanying technical guidance and Environment Agency guidance. It provides an evidence base to assist in the assessment of various options and proposals for mineral development sites as part of the development of the mineral planning policy. It should also be used to inform the preparation of the specific mineral development proposals.
10.2 The SFRA presents an overview of flood risk within Devon (excluding Torbay
and Plymouth), providing guidance to planning authorities, developers and other interested parties, including the general public, about locations of where flood risk is a concern. The SFRA should be consulted to inform strategy, development proposals and planning requirements. Preparation of this SFRA has followed policy guidance and has included direction and consultation with the Environment Agency, the Lead Local Flood Authority, and other relevant authorities.
10.3 This SFRA will be used by Devon County Council as the Mineral Planning
Authority to inform decisions regarding mineral site allocations and policies. The key recommendations for mineral site allocation are:
♦ the SFRA should be used as an evidence base from which to direct new development where possible to areas of low flood risk;
♦ where development cannot be located in Flood Zone 1, the SFRA flood maps should be used to apply the sequential approach to the remaining land use allocations; and
♦ if there are an insufficient number of suitable sites for development within zones of lower flood risk, the scope of the SFRA must be widened.
10.4 Minerals development documents with respect to flood risk management
should be prepared with reference to this SFRA and the NPPF. The process for assessing potential sites for allocation should be informed by the information contained within this SFRA.
10.5 The SFRA also provides significant guidance as to site specific flood control
measures such as sustainable drainage techniques. Mitigation of the residual risk of flooding can be achieved through understanding where infrastructure can fail and where flood defences are inadequate. On the occasion of an extreme flood event, the impact can often be lessened with adequate plans and preparation.
10.6 A specific issue in considering Minerals Plan allocations and planning
applications within the Bovey Basin ball clay working is the significant past loss of historic floodplain (albeit sometimes on a temporary basis) and consequent increased risk of flooding for downstream communities. Regard should be had to the scope for reinstatement of ‘lost’ areas of floodplain

Devon Minerals Plan: Strategic Flood Risk Assessment March 2013
77
through the restoration of mineral sites following cessation of their working, together with provision of compensatory flood capacity.
10.7 The key message for future development is that flooding is a vital
consideration in the assessment and determination of mineral planning development through applications and allocations. Ensuring that flood risk is managed appropriately will be critical to the sustainability of any site or development.
Living Document 10.8 This SFRA is a supporting document for the Mineral & Waste Development
Framework, which will cover a long term period up to 2031. It is therefore important that this document is updated as new information becomes available, flood risk conditions change, are better understood and as responsibilities evolve.
10.9 It is therefore essential that the SFRA is adopted as a ‘living’ document and is
reviewed regularly in light of these emerging policy directives and an improving understanding of flood risk. This should specifically include a review of new Flood Zone Maps, and detailed modelling outputs produced by the Environment Agency.

Devon Minerals Plan: Strategic Flood Risk Assessment March 2013
78
References Strategic Flood Risk Assessments East Devon District Council (2008); East Devon District Strategic Flood Risk Assessment Level 1 Exeter City Council (2008); Exeter Strategic Flood Risk Assessment Level 1 Mid Devon District Council (2008); Mid Devon District Strategic Flood Risk Assessment Level 1 North Devon Council/Torridge District Council (2009); North Devon /Torridge District Strategic Flood Risk Assessment Level 1 North Devon Council/Torridge District Council (2010); North Devon /Torridge District Strategic Flood Risk Assessment Level 2 South Hams District Council (2007); South Hams District Strategic Flood Risk Assessment Level 1 Teignbridge District Council (2007); Teignbridge District Strategic Flood Risk Assessment Level 1 West Devon Borough Council (2007); West Devon Borough Strategic Flood Risk Assessment Level 1 Exmoor National Park (2009); Exmoor Strategic Flood Risk Assessment Level 1 Dartmoor National Park (2010); Dartmoor Strategic Flood Risk Assessment Level 1 Torbay Council (2010); Torbay Strategic Flood Risk Assessment Level 1 Plymouth City Council (2006); Plymouth Strategic Flood Risk Assessment Level 1 Cornwall Council (2009); Cornwall Strategic Flood Risk Assessment Level 1 West Somerset Council (2009); West Somerset Strategic Flood Risk Assessment Level 1
Catchment Flood Management Plans Environment Agency (2008); Tamar Catchment Flood Management Plan Summary Report Environment Agency (2009); East Devon Catchment Flood Management Plan Summary Report Environment Agency (2008); North Devon Catchment Flood Management Plan Summary Report Environment Agency (2008); River Exe Catchment Flood Management Plan Summary Report Environment Agency (2008); South Devon Catchment Flood Management Plan Summary Report
Shoreline Management Plans
North Devon and Somerset Coastal Advisory Group (2010); Hartland Point to Anchor Head Shoreline Management Plan 2 South Devon and Dorset Coastal Advisory Group (2010); Durlston Head to Rame Head Shoreline Management Plan 2
Regional Plans South West Regional Assembly (2006); Draft Regional Spatial Strategy South West Regional Assembly (2007); South West Regional Flood Risk Appraisal
General Devon County Council (2004); Devon Structure Plan Devon County Council (2011); Preliminary Flood Risk Assessment Devon County Council (2004); Minerals Local Plan Cabinet Office (2007); The Pitt Review, 2007: Learning Lessons from the 2007 Floods Construction Industry Research and Information Association (CIRIA) The SuDS Manual (C697) Construction Industry Research and Information Association (CIRIA) Development and flood risk – Guidance for the construction industry (C624) European Union (2000) Water Framework Directive (2000/60/EU) National SuDS Working Group (2004); Interim Code of Practice for Sustainable Drainage Systems DEFRA (2005); Making Space for Water Main Summary Report DCLG (2012); National Planning Policy Framework DCLG (2012); Technical Guidance to the National Planning Policy Framework Planning and Compulsory Purchase Act 2004: Queen's Printer of Acts of Parliament. HMS Flood and Water Management Act 2010: Queen's Printer of Acts of Parliament. HMS
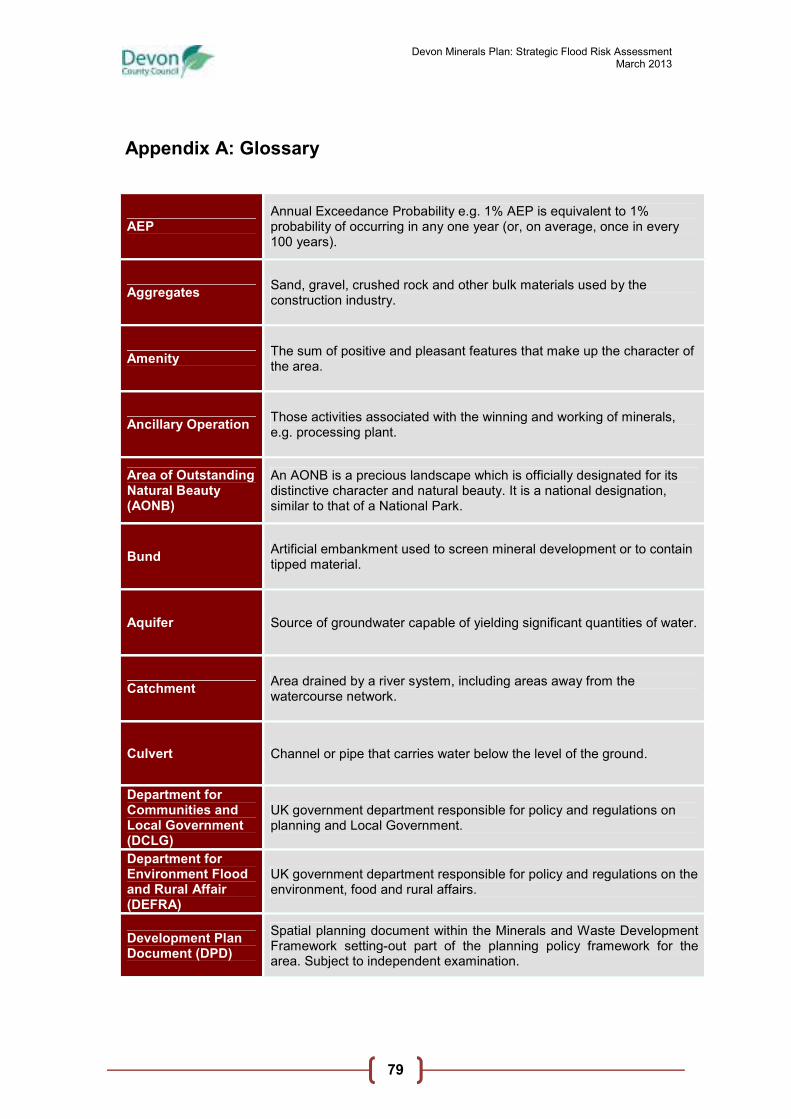
Devon Minerals Plan: Strategic Flood Risk Assessment March 2013
79
Appendix A: Glossary
AEP Annual Exceedance Probability e.g. 1% AEP is equivalent to 1% probability of occurring in any one year (or, on average, once in every 100 years).
Aggregates Sand, gravel, crushed rock and other bulk materials used by the construction industry.
Amenity The sum of positive and pleasant features that make up the character of the area.
Ancillary Operation Those activities associated with the winning and working of minerals, e.g. processing plant.
Area of Outstanding Natural Beauty (AONB)
An AONB is a precious landscape which is officially designated for its distinctive character and natural beauty. It is a national designation, similar to that of a National Park.
Bund Artificial embankment used to screen mineral development or to contain tipped material.
Aquifer Source of groundwater capable of yielding significant quantities of water.
Catchment Area drained by a river system, including areas away from the watercourse network.
Culvert Channel or pipe that carries water below the level of the ground.
Department for Communities and Local Government (DCLG)
UK government department responsible for policy and regulations on planning and Local Government.
Department for Environment Flood and Rural Affair (DEFRA)
UK government department responsible for policy and regulations on the environment, food and rural affairs.
Development Plan Document (DPD)
Spatial planning document within the Minerals and Waste Development Framework setting-out part of the planning policy framework for the area. Subject to independent examination.
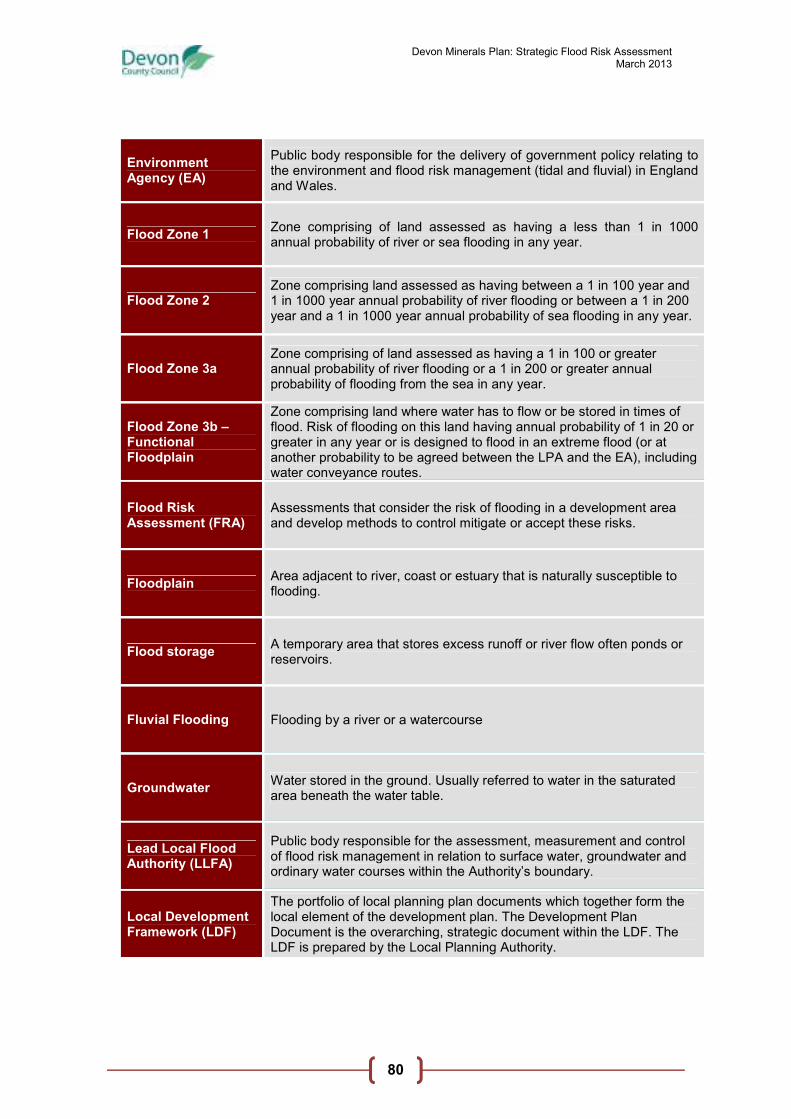
Devon Minerals Plan: Strategic Flood Risk Assessment March 2013
80
Environment Agency (EA)
Public body responsible for the delivery of government policy relating to the environment and flood risk management (tidal and fluvial) in England and Wales.
Flood Zone 1 Zone comprising of land assessed as having a less than 1 in 1000 annual probability of river or sea flooding in any year.
Flood Zone 2 Zone comprising land assessed as having between a 1 in 100 year and 1 in 1000 year annual probability of river flooding or between a 1 in 200 year and a 1 in 1000 year annual probability of sea flooding in any year.
Flood Zone 3a Zone comprising of land assessed as having a 1 in 100 or greater annual probability of river flooding or a 1 in 200 or greater annual probability of flooding from the sea in any year.
Flood Zone 3b – Functional Floodplain
Zone comprising land where water has to flow or be stored in times of flood. Risk of flooding on this land having annual probability of 1 in 20 or greater in any year or is designed to flood in an extreme flood (or at another probability to be agreed between the LPA and the EA), including water conveyance routes.
Flood Risk Assessment (FRA)
Assessments that consider the risk of flooding in a development area and develop methods to control mitigate or accept these risks.
Floodplain Area adjacent to river, coast or estuary that is naturally susceptible to flooding.
Flood storage A temporary area that stores excess runoff or river flow often ponds or reservoirs.
Fluvial Flooding Flooding by a river or a watercourse
Groundwater Water stored in the ground. Usually referred to water in the saturated area beneath the water table.
Lead Local Flood Authority (LLFA)
Public body responsible for the assessment, measurement and control of flood risk management in relation to surface water, groundwater and ordinary water courses within the Authority’s boundary.
Local Development Framework (LDF)
The portfolio of local planning plan documents which together form the local element of the development plan. The Development Plan Document is the overarching, strategic document within the LDF. The LDF is prepared by the Local Planning Authority.

Devon Minerals Plan: Strategic Flood Risk Assessment March 2013
81
Main River Watercourse where the EA has permissive powers to carry out operational, maintenance and flood defence works. Defined on the “Main River Map” by DEFRA.
Minerals Core Strategy
Development Plan Document within the Minerals and Waste Development Framework setting the long-term mineral-related vision and objectives for the area, containing a set of strategic policies that deliver this vision.
Mineral Planning Authority (MPA)
Authority responsible for providing the mineral planning policy framework and determining mineral related planning applications.
Minerals and Waste Development Framework (MWDF)
Set of Minerals and Waste Development Plan Documents that provide the minerals and waste planning framework. The MWDF is the set of documents replacing the Minerals and Waste Local Plans.
Mitigation A process of systems used to manage flood risk or to avoid an increase of flood risk elsewhere.
Recycled Aggregates
Aggregates produced from recycled construction waste such as crushed concrete, planings from tarmac roads etc.
Sequential Approach
Risk based approach used in assessing flood risk, prioritising development to the areas at the least risk of flooding.
Sewer Flooding Flooding caused by a blockage in a sewer or urban drainage system.
Secondary Aggregates
By-product waste, synthetic materials and soft rock used with or without processing e.g. China Clay sand.
Strategic Flood Risk Assessment (SFRA)
Assessment tool used by Planning Authorities to identify and evaluate flood risk within specific areas. SFRAs form part of the evidence base used to inform the production of development plan documents.
Sterilisation When a change of use or the development of land prevents possible mineral exploitation in the foreseeable future.
Surface Water Runoff
Water flowing over the ground surface to the drainage system. Occurs when that ground surface is impermeable, saturated or rainfall is particularly intense.

Devon Minerals Plan: Strategic Flood Risk Assessment March 2013
82
Sustainability Appraisal (SA)
Form of assessment that considers the social, economic, and environment effects of planning policy documents. Incorporates the requirements of the European Directive of the Sustainable Environmental Assessment (SEA).
Sustainable Drainage System (SuDS)
Management practices and control structures designed to drain surface water in a sustainable manner.
Sustainable development
Development that meets the needs of the present population without compromising the ability of future generations meeting their own needs.
Topography The shape and form of the land, in terms of hills, steepness of slopes, or flat land.
Winning and Working
The preparation of the ground and the extraction of minerals.
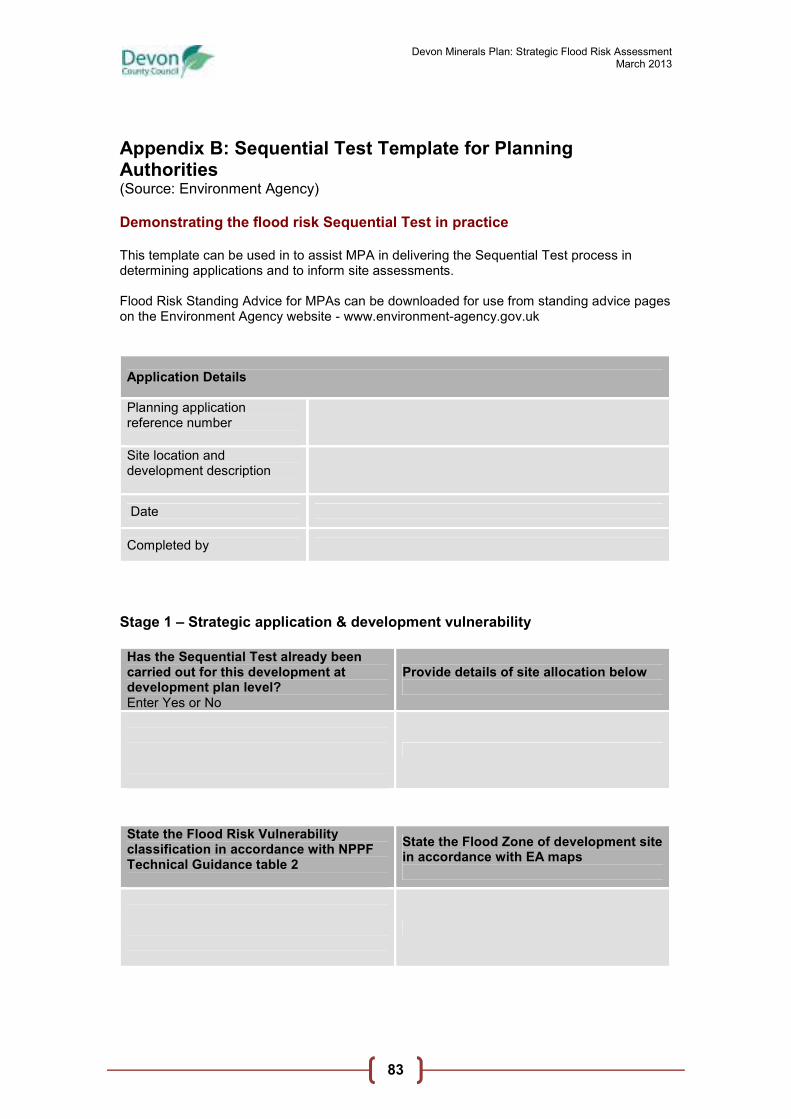
Devon Minerals Plan: Strategic Flood Risk Assessment March 2013
83
Appendix B: Sequential Test Template for Planning Authorities (Source: Environment Agency) Demonstrating the flood risk Sequential Test in practice This template can be used in to assist MPA in delivering the Sequential Test process in determining applications and to inform site assessments. Flood Risk Standing Advice for MPAs can be downloaded for use from standing advice pages on the Environment Agency website - www.environment-agency.gov.uk
Application Details
Planning application reference number
Site location and development description
Date
Completed by
Stage 1 – Strategic application & development vulnerability
Has the Sequential Test already been carried out for this development at development plan level? Enter Yes or No
Provide details of site allocation below
State the Flood Risk Vulnerability classification in accordance with NPPF Technical Guidance table 2
State the Flood Zone of development site in accordance with EA maps

Devon Minerals Plan: Strategic Flood Risk Assessment March 2013
84
Stage 2 – Defining the evidence base
State the defining parameters for the geographical area over which the Sequential Test is to be applied e.g. functional requirements of the development; regeneration need identified in the MWDF; serves a national market. Indicate if no parameters exist for example, windfall development.
State the area of search in view of identified parameters e.g. whole MPA area, specific market area, specific area of need/regeneration area or on a sub-regional or national level.
Additional justification (if needed):
Evidence base to be used as source for ‘reasonably available’ sites
Provide details below e.g. date, title of document and where this can be viewed
Allocated site within Minerals Local Plan/Devon Minerals Plan
Other sites known to the MPA e.g. sites of other planning applications
Other sources not stated
Method used for comparing flood risk between sites
Provide details below e.g. date, title of document and where this can be viewed
Environment Agency Flood Map
Strategic Flood Risk Assessment (if comparing flood risk within the same Flood Zone)
Site specific Flood Risk Assessments where they are suitable for this purpose.
Other mapping / source of flooding information not stated

Devon Minerals Plan: Strategic Flood Risk Assessment March 2013
85
Stage 3 – Applying the Sequential Test
Name and location of the reasonably available sites
Flood Zone: (Higher (H) Lower (L), Same(=)
Allocated in plan with flood risk sequential test? (Indicate the status of the plan)
Approx. Capacity of site
(Based on MWDF density policies and past performance)
Constraints to delivery (See note below)
Conclusion: Are there any reasonably available sites in a lower flood risk zone or at a lower risk of flooding than the application site?
Constraints to delivery include: availability, policy restrictions, physical problems or limitations, potential impacts of the development, and future environmental conditions that would be experienced by the development.
Devon Minerals Plan: Strategic Flood Risk Assessment March 2013
86
Appendix C: Environment Agency Comments on Draft SFRA
Mr. Andy Hill Devon County Council Structure Plan Steering Officer Group County Hall Topsham Road Exeter Devon EX2 4QW
Our ref: DC/2006/000409/SF-01/IS1-L01 Your ref: Date: 15 February 2013
Dear Mr. Hill DEVON MINERALS PLAN – DRAFT STRATEGIC FLOOD RISK ASSESSMENT Thank you for your consultation of 03 December 2012 providing us with the opportunity to comment on the Devon Minerals Plan Draft Strategic Flood Risk Assessment (SFRA). We apologise for our long delay in responding to you, this has been due to a backlog in workload following the flood incidents in Devon and Cornwall in November and December 2012. We consider that the draft SFRA is broadly acceptable. However, we also consider that it has one important omission that we would like it to address. The document should set out clearly that in the past the winning and working of minerals in Devon has resulted in the loss of significant areas of floodplain. This is particularly the case where the minerals being worked are alluvial in nature or are in close proximity to alluvial deposits such as within the Bovey Basis. This loss of floodplain has resulted in a corresponding loss of flood water storage capacity that in times of flood has had a serious adverse effect upon third parties flooding risks. As such we consider that the SFRA should advocate, where possible and reasonable, the restoration of lost floodplain or the creation of new floodplain elsewhere. This approach aligns itself with the Government’s guidance contained within the National Planning Policy Framework (NPPF), in particular paragraph 100, to use opportunities offered by new development to reduce the causes and impacts of flooding. Such an approach will not only conform with the guidance in the NPPF but will help both to correct some historic wrongs and to address the concerns often expressed by the public that development increases flood risk overall.
Devon Minerals Plan: Strategic Flood Risk Assessment March 2013
87
Given satisfaction on this point we would consider that the report is acceptable from the flood risk perspective. Yours sincerely MARCUS SALMON Planning Liaison Technical Specialist Direct dial 01208 265046 Direct fax 01208 78321 Direct e-mail [email protected]