strategic direction better, bigger, greener - norsk … · strategic direction better, bigger,...
TRANSCRIPT
Strategic direction Better, Bigger, Greener
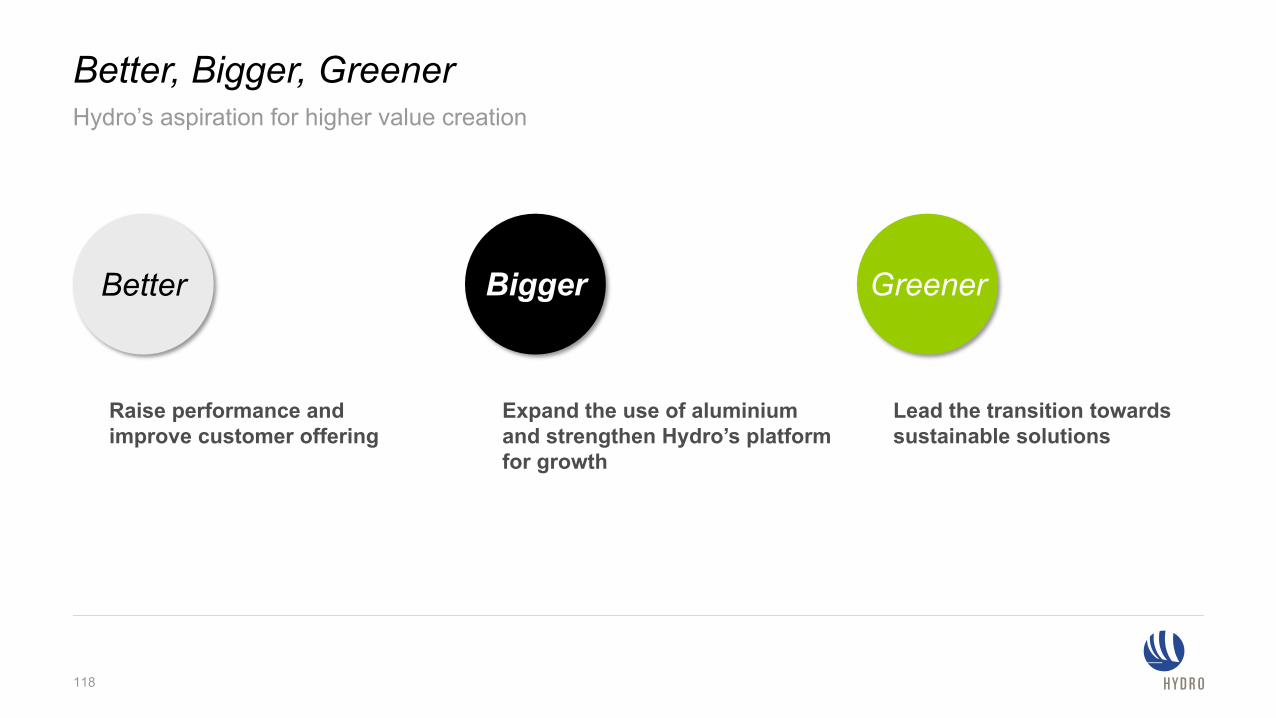
Better, Bigger, Greener
118
Raise performance andimprove customer offering
Expand the use of aluminium and strengthen Hydro’s platform for growth
Lead the transition towards sustainable solutions
Better Bigger Greener
Hydro’s aspiration for higher value creation
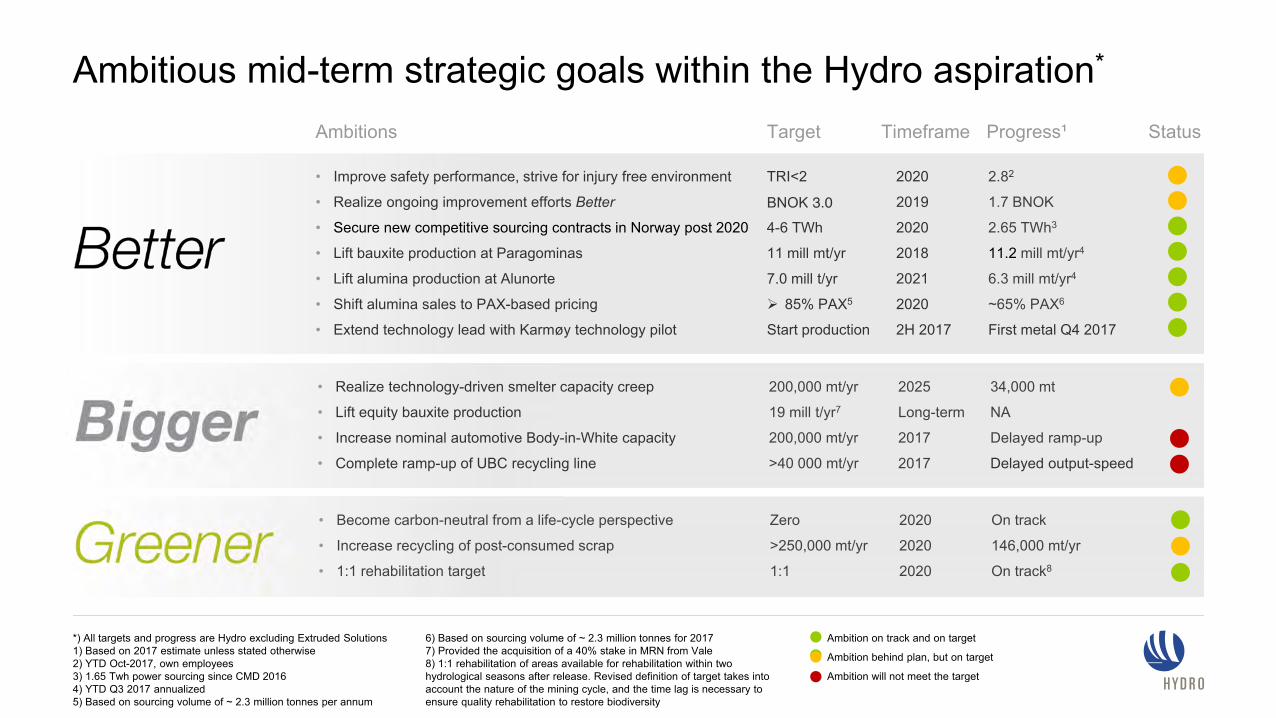
Ambitious mid-term strategic goals within the Hydro aspiration*
*) All targets and progress are Hydro excluding Extruded Solutions 1) Based on 2017 estimate unless stated otherwise2) YTD Oct-2017, own employees3) 1.65 Twh power sourcing since CMD 20164) YTD Q3 2017 annualized5) Based on sourcing volume of ~ 2.3 million tonnes per annum
6) Based on sourcing volume of ~ 2.3 million tonnes for 20177) Provided the acquisition of a 40% stake in MRN from Vale8) 1:1 rehabilitation of areas available for rehabilitation within twohydrological seasons after release. Revised definition of target takes intoaccount the nature of the mining cycle, and the time lag is necessary toensure quality rehabilitation to restore biodiversity
Ambition on track and on target
Ambition behind plan, but on target
Ambition will not meet the target
Ambitions TimeframeTarget
• Improve safety performance, strive for injury free environment
• Realize ongoing improvement efforts Better
• Secure new competitive sourcing contracts in Norway post 2020
• Lift bauxite production at Paragominas
• Lift alumina production at Alunorte
• Shift alumina sales to PAX-based pricing
• Extend technology lead with Karmøy technology pilot
TRI<2
BNOK 3.04-6 TWh
11 mill mt/yr
7.0 mill t/yr
85% PAX5
Start production
2020
2019
2020
2018
2021
2020
2H 2017
• Realize technology-driven smelter capacity creep
• Lift equity bauxite production
• Increase nominal automotive Body-in-White capacity
• Complete ramp-up of UBC recycling line
200,000 mt/yr
19 mill t/yr7
200,000 mt/yr
>40 000 mt/yr
2025
Long-term
2017
2017
• Become carbon-neutral from a life-cycle perspective
• Increase recycling of post-consumed scrap
• 1:1 rehabilitation target
Zero
>250,000 mt/yr
1:1
2020
2020
2020
Progress¹ Status
2.82
1.7 BNOK
2.65 TWh3
11.2 mill mt/yr4
6.3 mill mt/yr4
~65% PAX6
First metal Q4 2017
On track
146,000 mt/yr
On track8
34,000 mt
NA
Delayed ramp-up
Delayed output-speed
Silvio Porto, EVP Bauxite & Alumina
Bauxite & AluminaBetter than ever through operational excellence
8 000
9 000
10 000
11 000
12 000
2014 2015 2016 LTM Q3 2017
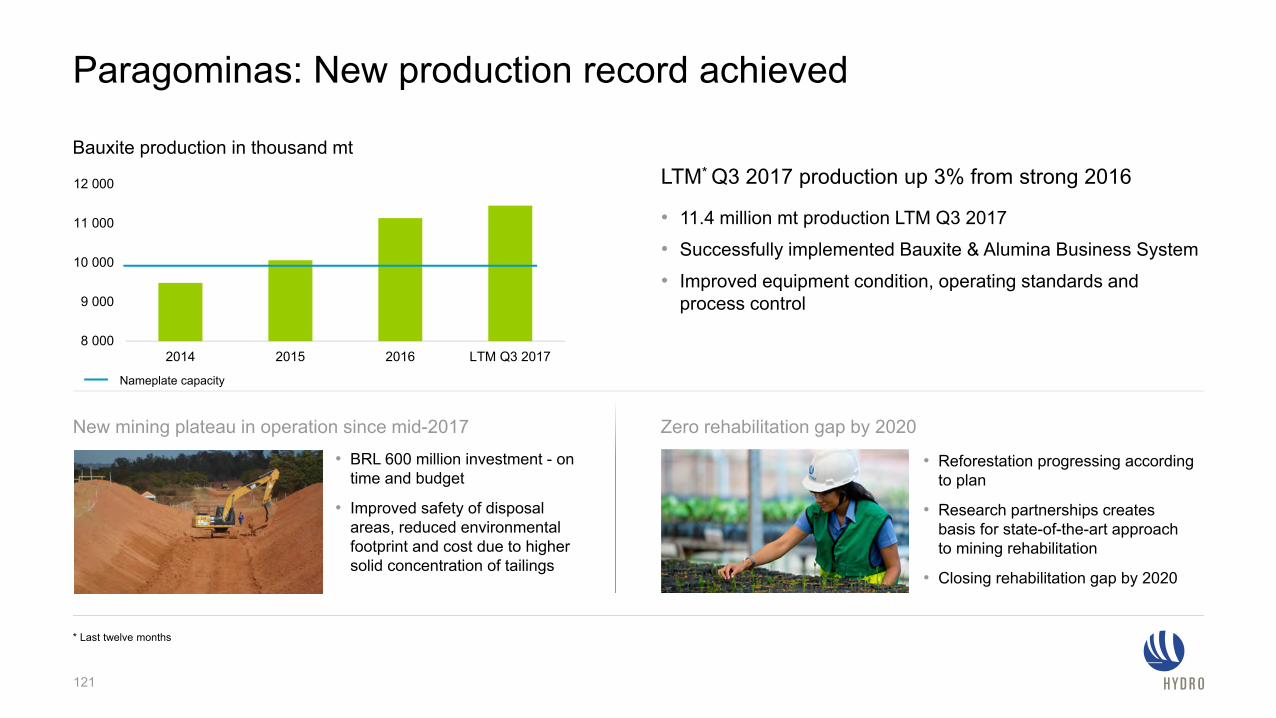
Paragominas: New production record achieved
LTM* Q3 2017 production up 3% from strong 2016
• 11.4 million mt production LTM Q3 2017
• Successfully implemented Bauxite & Alumina Business System
• Improved equipment condition, operating standards and process control
New mining plateau in operation since mid-2017 Zero rehabilitation gap by 2020
• Reforestation progressing according to plan
• Research partnerships creates basis for state-of-the-art approach to mining rehabilitation
• Closing rehabilitation gap by 2020
• BRL 600 million investment - on time and budget
• Improved safety of disposal areas, reduced environmental footprint and cost due to higher solid concentration of tailings
121
Bauxite production in thousand mt
* Last twelve months
Nameplate capacity
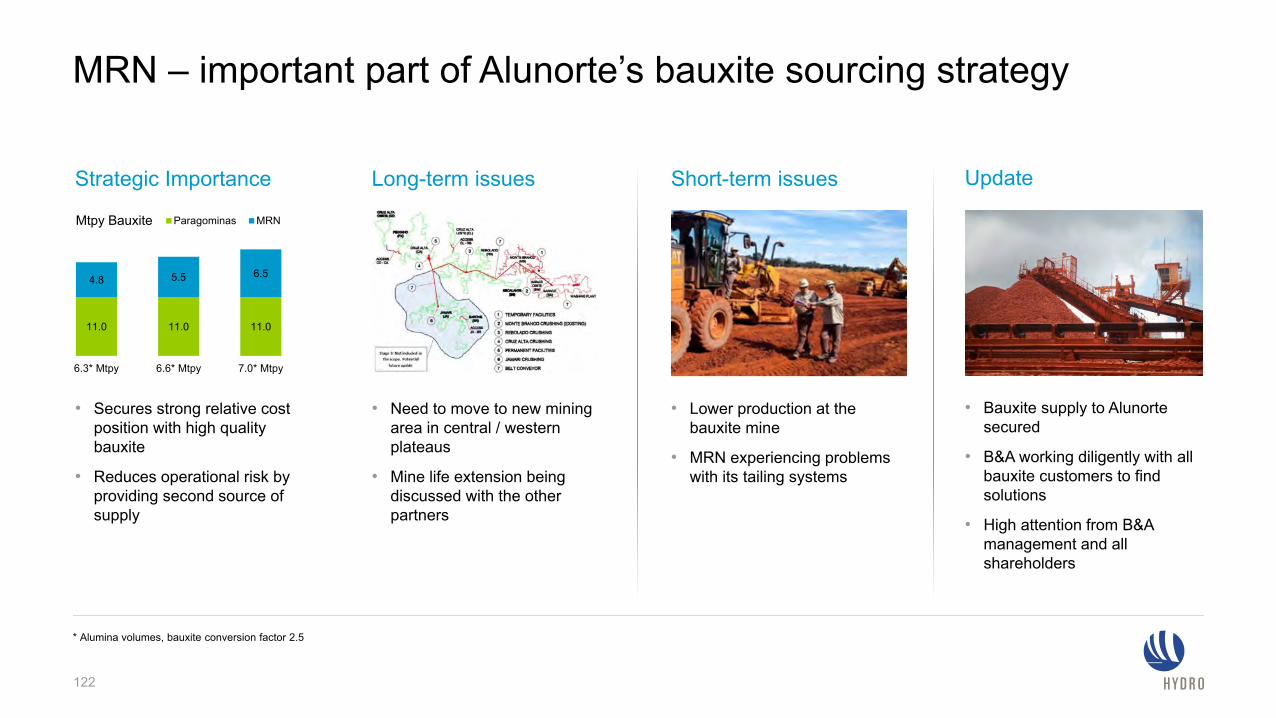
MRN – important part of Alunorte’s bauxite sourcing strategy
Strategic Importance Long-term issues Short-term issues Update
• Secures strong relative cost position with high quality bauxite
• Reduces operational risk by providing second source of supply
• Need to move to new mining area in central / western plateaus
• Mine life extension being discussed with the other partners
• Lower production at the bauxite mine
• MRN experiencing problems with its tailing systems
• Bauxite supply to Alunortesecured
• B&A working diligently with all bauxite customers to find solutions
• High attention from B&A management and all shareholders
122
* Alumina volumes, bauxite conversion factor 2.5
11.0 11.0 11.0
4.8 5.5 6.5
6.3* Mtpy 6.6* Mtpy 7.0* Mtpy
Paragominas MRNMtpy Bauxite
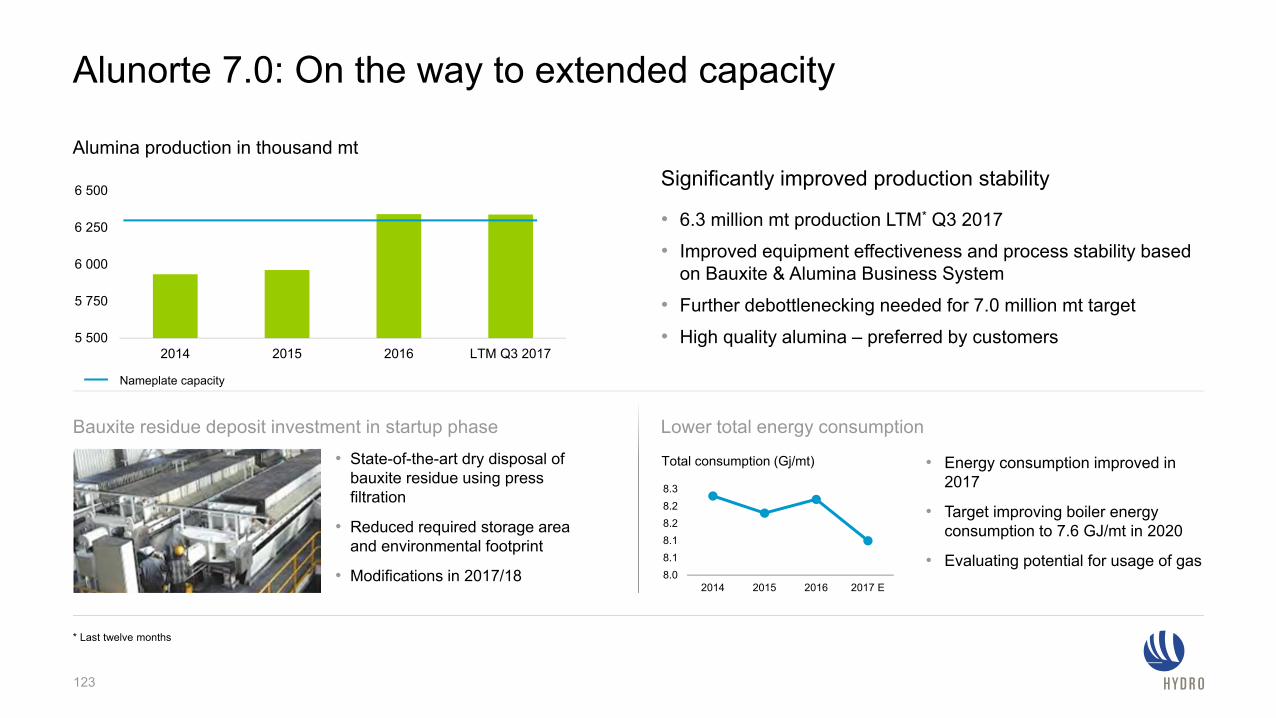
5 500
5 750
6 000
6 250
6 500
2014 2015 2016 LTM Q3 2017
Significantly improved production stability
• 6.3 million mt production LTM* Q3 2017
• Improved equipment effectiveness and process stability based on Bauxite & Alumina Business System
• Further debottlenecking needed for 7.0 million mt target
• High quality alumina – preferred by customers
123
• State-of-the-art dry disposal of bauxite residue using press filtration
• Reduced required storage area and environmental footprint
• Modifications in 2017/18
• Energy consumption improved in 2017
• Target improving boiler energy consumption to 7.6 GJ/mt in 2020
• Evaluating potential for usage of gas8.08.18.18.28.28.3
2014 2015 2016 2017 E
Total consumption (Gj/mt)
Alunorte 7.0: On the way to extended capacity
Bauxite residue deposit investment in startup phase Lower total energy consumption
* Last twelve months
Alumina production in thousand mt
Nameplate capacity
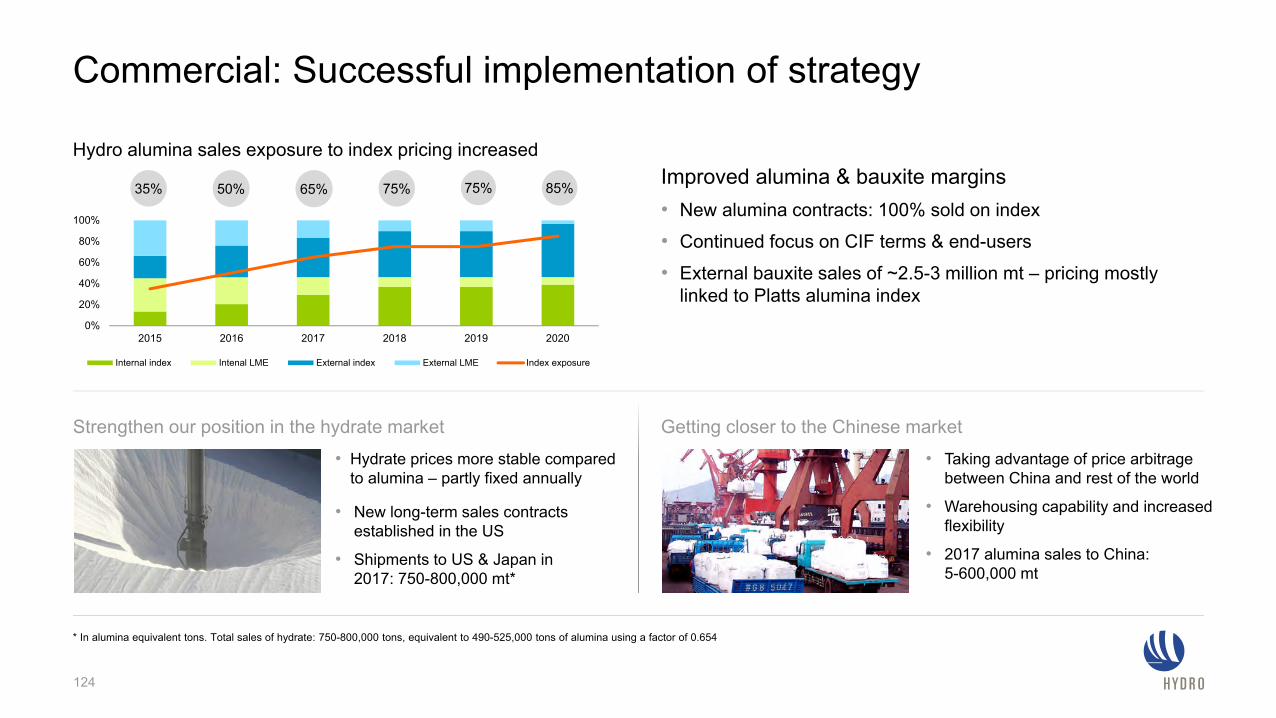
0%
20%
40%
60%
80%
100%
2015 2016 2017 2018 2019 2020
Internal index Intenal LME External index External LME Index exposure
Improved alumina & bauxite margins • New alumina contracts: 100% sold on index
• Continued focus on CIF terms & end-users
• External bauxite sales of ~2.5-3 million mt – pricing mostly linked to Platts alumina index
Commercial: Successful implementation of strategy
124
• Hydrate prices more stable compared to alumina – partly fixed annually
• New long-term sales contracts established in the US
• Shipments to US & Japan in 2017: 750-800,000 mt*
• Taking advantage of price arbitrage between China and rest of the world
• Warehousing capability and increased flexibility
• 2017 alumina sales to China: 5-600,000 mt
..
* In alumina equivalent tons. Total sales of hydrate: 750-800,000 tons, equivalent to 490-525,000 tons of alumina using a factor of 0.654
Hydro alumina sales exposure to index pricing increased
Strengthen our position in the hydrate market Getting closer to the Chinese market
35% 50% 65% 75% 75% 85%
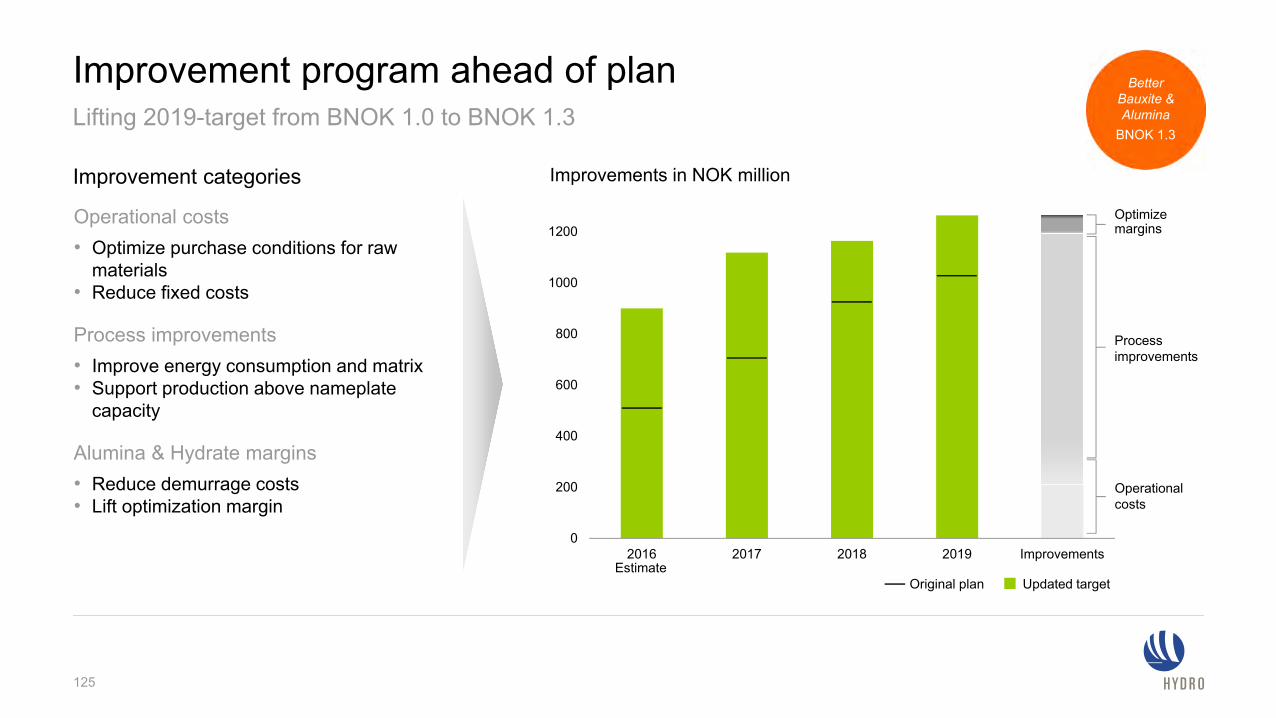
Improvements in NOK million Improvement categories
0
200
400
600
800
1000
1200
2016 2017 2018 2019 ImprovementsEstimate
Original plan Updated target
Lifting 2019-target from BNOK 1.0 to BNOK 1.3
Operational costs• Optimize purchase conditions for raw
materials • Reduce fixed costs
Process improvements• Improve energy consumption and matrix• Support production above nameplate
capacity
Alumina & Hydrate margins• Reduce demurrage costs • Lift optimization margin
Processimprovements
Operational costs
Optimizemargins
125
Improvement program ahead of plan BetterBauxite &Alumina
BNOK 1.3
Hilde M. Aasheim, EVP Primary Metal
Primary Metal Better, bigger and greener with technology and digitization
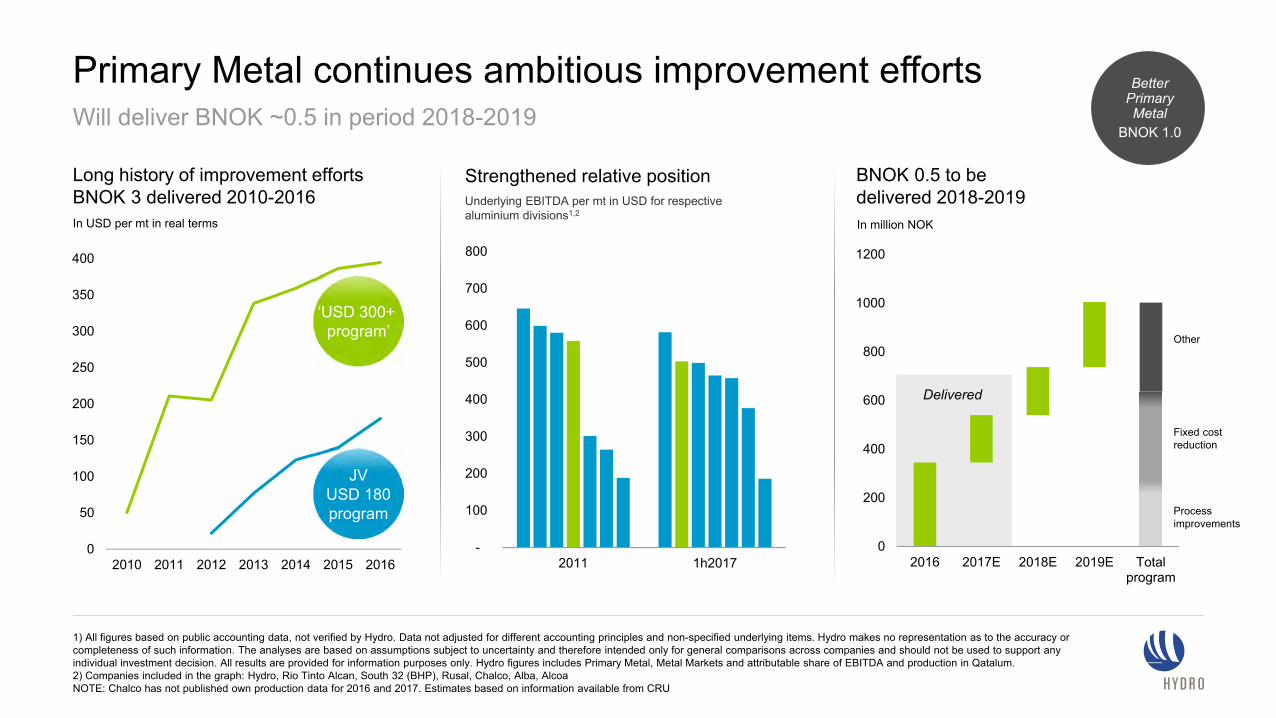
Primary Metal continues ambitious improvement efforts
1) All figures based on public accounting data, not verified by Hydro. Data not adjusted for different accounting principles and non-specified underlying items. Hydro makes no representation as to the accuracy or completeness of such information. The analyses are based on assumptions subject to uncertainty and therefore intended only for general comparisons across companies and should not be used to support any individual investment decision. All results are provided for information purposes only. Hydro figures includes Primary Metal, Metal Markets and attributable share of EBITDA and production in Qatalum. 2) Companies included in the graph: Hydro, Rio Tinto Alcan, South 32 (BHP), Rusal, Chalco, Alba, AlcoaNOTE: Chalco has not published own production data for 2016 and 2017. Estimates based on information available from CRU
0
200
400
600
800
1000
1200
2016 2017E 2018E 2019E Totalprogram
Other
Fixed costreduction
Processimprovements
BNOK 0.5 to be delivered 2018-2019
Strengthened relative position
-
100
200
300
400
500
600
700
800
2011 1h2017
Underlying EBITDA per mt in USD for respective aluminium divisions1,2
In million NOK
Long history of improvement effortsBNOK 3 delivered 2010-2016
Delivered
0
50
100
150
200
250
300
350
400
2010 2011 2012 2013 2014 2015 2016
‘USD 300+ program’
JVUSD 180program
In USD per mt in real terms
Will deliver BNOK ~0.5 in period 2018-2019Better
PrimaryMetal
BNOK 1.0
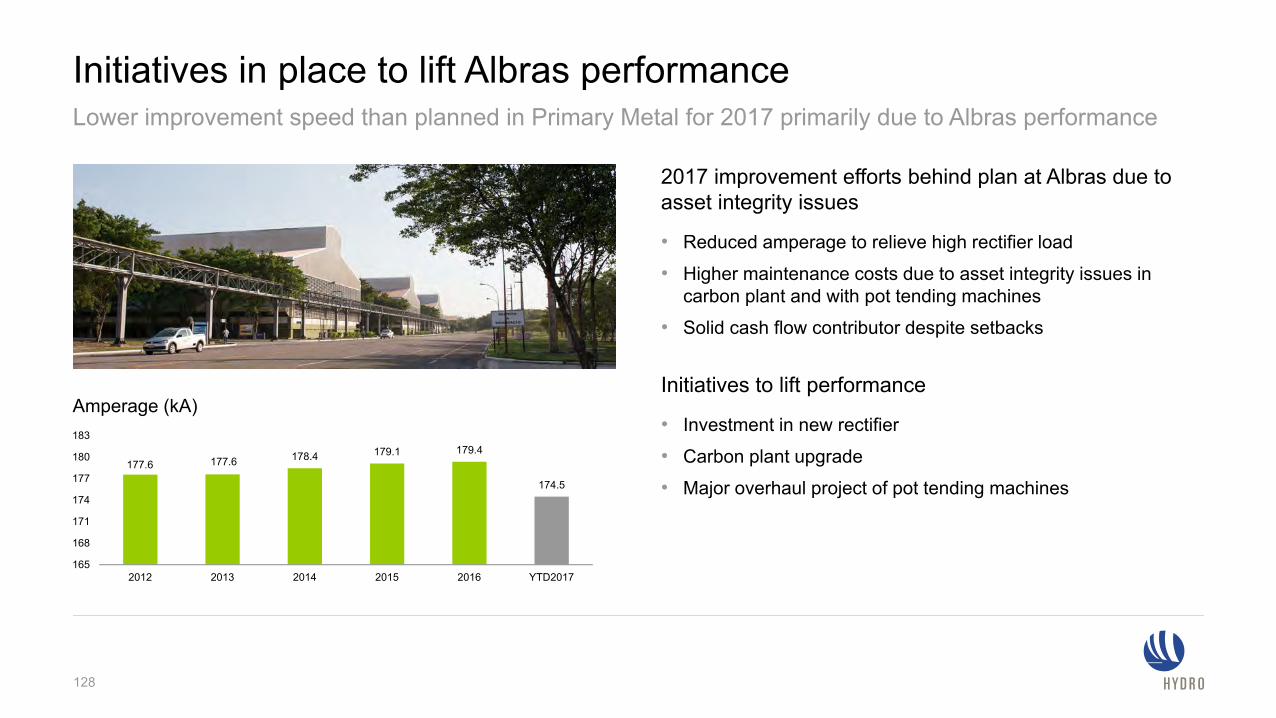
Initiatives in place to lift Albras performance
2017 improvement efforts behind plan at Albras due to asset integrity issues
• Reduced amperage to relieve high rectifier load
• Higher maintenance costs due to asset integrity issues in carbon plant and with pot tending machines
• Solid cash flow contributor despite setbacks
Initiatives to lift performance
• Investment in new rectifier
• Carbon plant upgrade
• Major overhaul project of pot tending machines177.6 177.6 178.4 179.1 179.4
174.5
165
168
171
174
177
180
183
2012 2013 2014 2015 2016 YTD2017
Amperage (kA)
Lower improvement speed than planned in Primary Metal for 2017 primarily due to Albras performance
128
Known technologies and enablers
Technology spin-offs
-25
0
25
50
75
100
125
150
175
200
2014 2015 2016 2017E 2018E 2019E 2020 2021 2022 2023 2024 2025E
Fully owned Joint ventures Albras reduction
Delivered
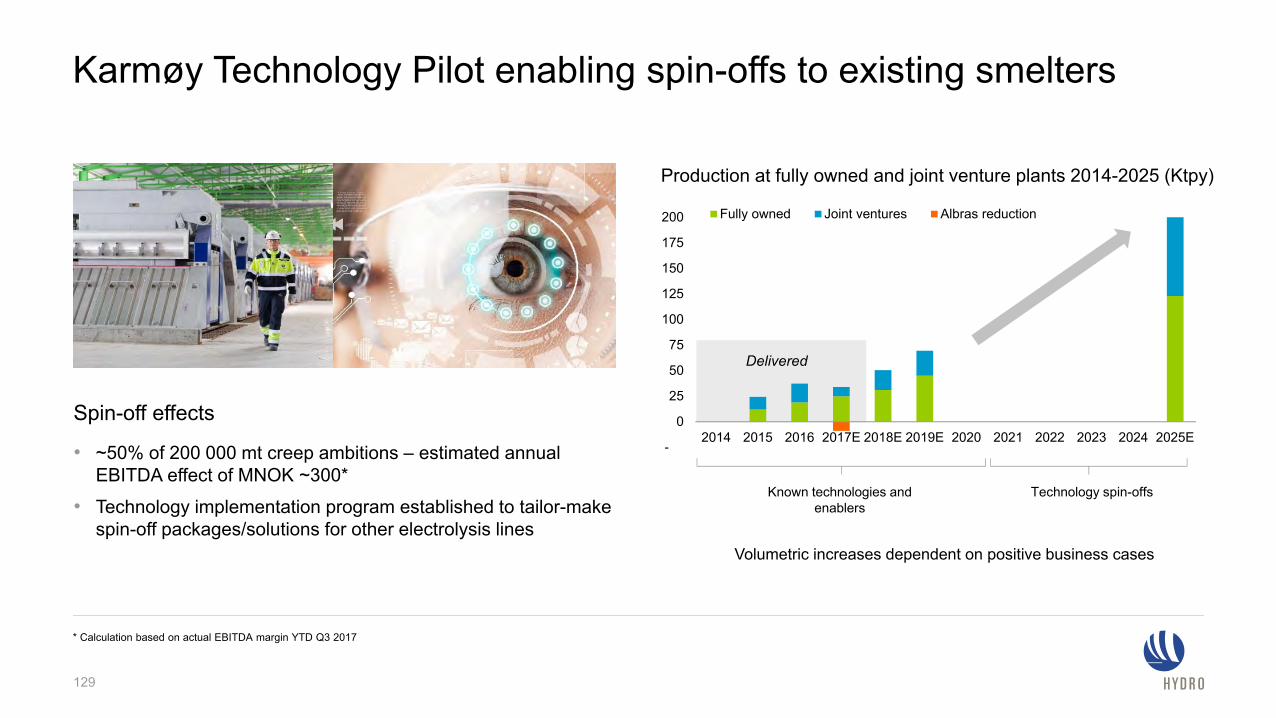
Karmøy Technology Pilot enabling spin-offs to existing smelters
129
* Calculation based on actual EBITDA margin YTD Q3 2017
Production at fully owned and joint venture plants 2014-2025 (Ktpy)
Spin-off effects
• ~50% of 200 000 mt creep ambitions – estimated annual EBITDA effect of MNOK ~300*
• Technology implementation program established to tailor-make spin-off packages/solutions for other electrolysis lines
Volumetric increases dependent on positive business cases
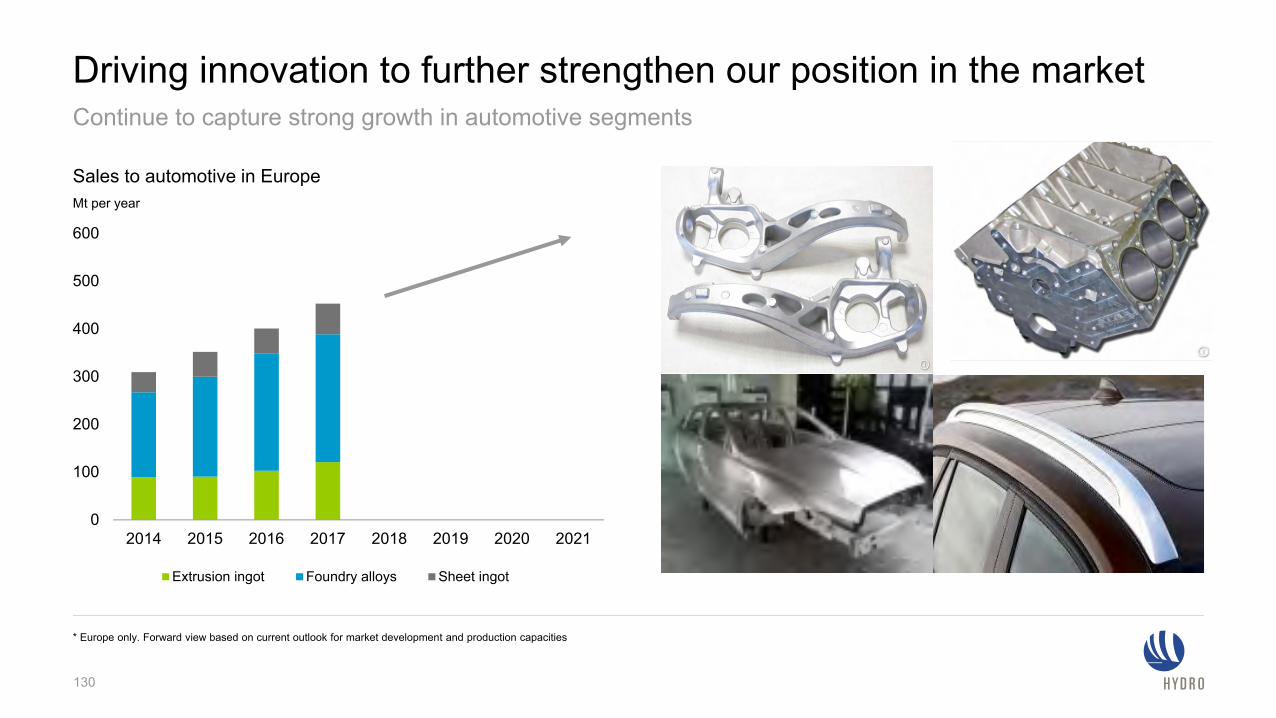
Driving innovation to further strengthen our position in the market
130
* Europe only. Forward view based on current outlook for market development and production capacities
Continue to capture strong growth in automotive segments
Mt per year
Sales to automotive in Europe
0
100
200
300
400
500
600
2014 2015 2016 2017 2018 2019 2020 2021
Extrusion ingot Foundry alloys Sheet ingot
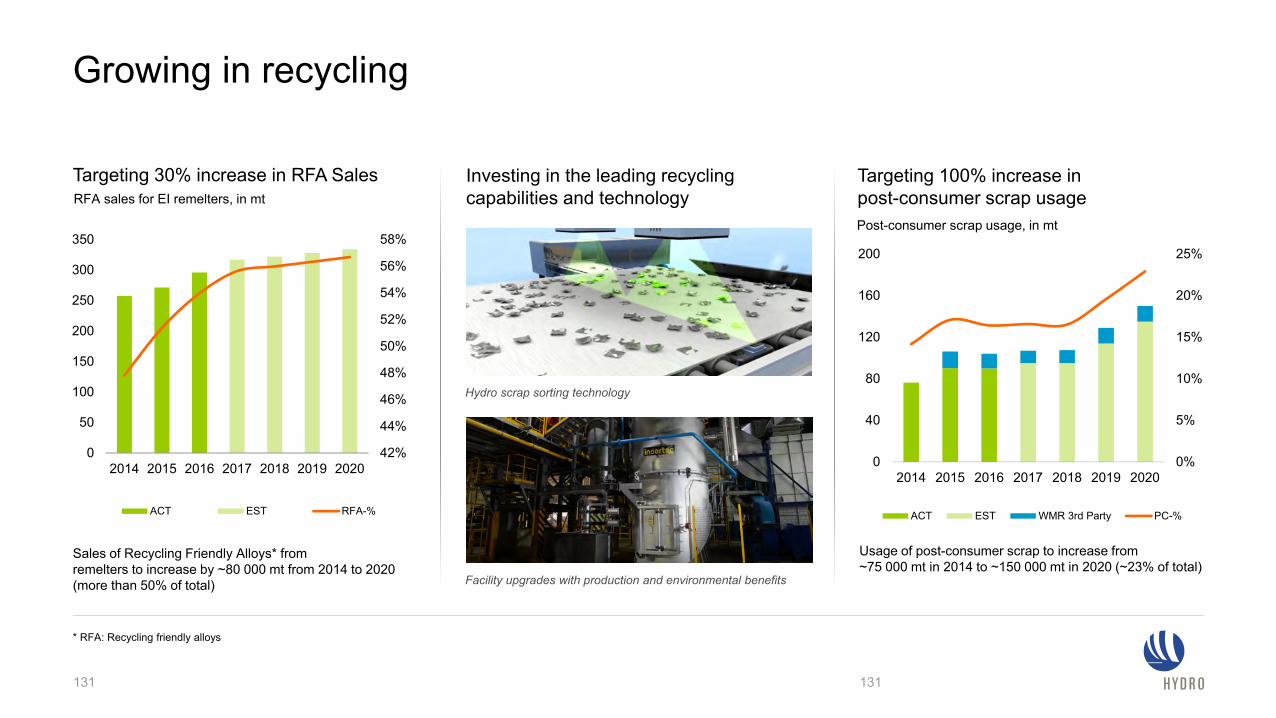
Growing in recycling
131
* RFA: Recycling friendly alloys
Investing in the leading recycling capabilities and technology
Hydro scrap sorting technology
Facility upgrades with production and environmental benefits
42%
44%
46%
48%
50%
52%
54%
56%
58%
0
50
100
150
200
250
300
350
2014 2015 2016 2017 2018 2019 2020
ACT EST RFA-%
Targeting 30% increase in RFA Sales
Sales of Recycling Friendly Alloys* from remelters to increase by ~80 000 mt from 2014 to 2020 (more than 50% of total)
RFA sales for EI remelters, in mt
131
Targeting 100% increase in post-consumer scrap usage
Usage of post-consumer scrap to increase from ~75 000 mt in 2014 to ~150 000 mt in 2020 (~23% of total)
0%
5%
10%
15%
20%
25%
0
40
80
120
160
200
2014 2015 2016 2017 2018 2019 2020
ACT EST WMR 3rd Party PC-%
Post-consumer scrap usage, in mt
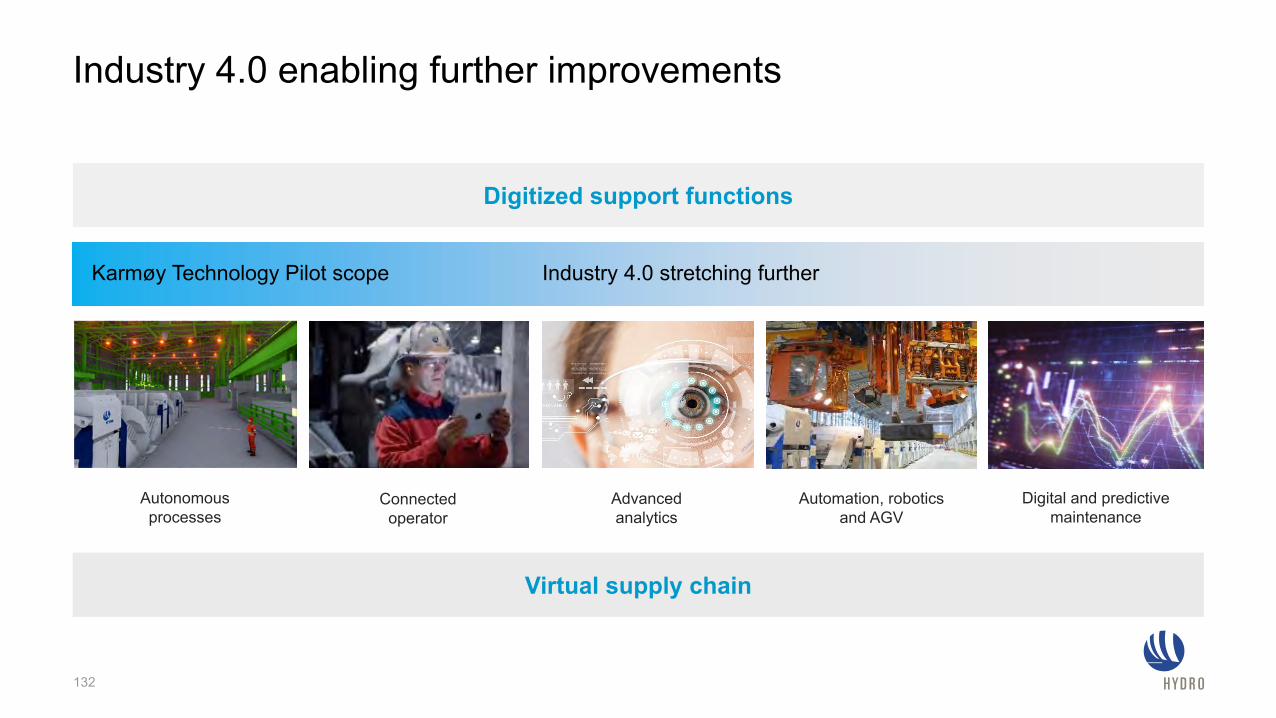
Industry 4.0 enabling further improvements
132
Digitized support functions
Advanced analytics
Autonomous processes
Connected operator
Automation, robotics and AGV
Digital and predictive maintenance
Industry 4.0 stretching furtherKarmøy Technology Pilot scope
Virtual supply chain
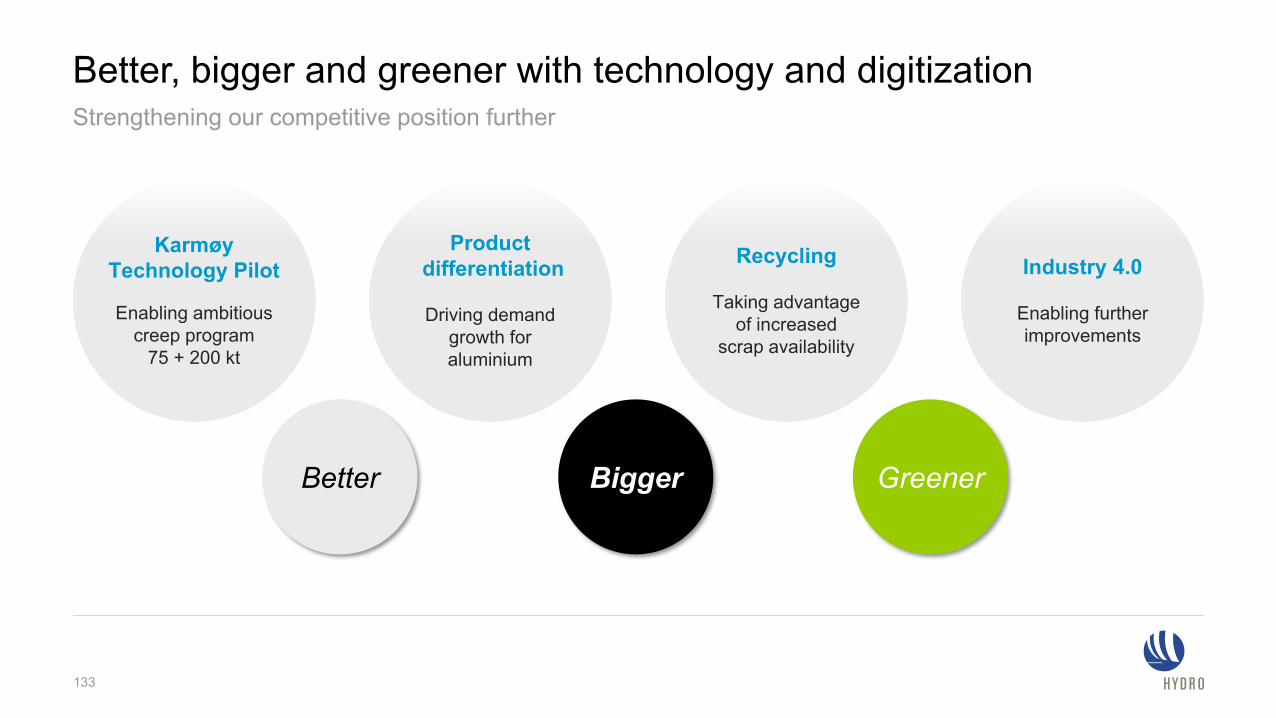
Better, bigger and greener with technology and digitization Strengthening our competitive position further
133
Recycling
Taking advantage of increased
scrap availability
KarmøyTechnology Pilot
Enabling ambitious creep program
75 + 200 kt
Industry 4.0
Enabling further improvements
Productdifferentiation
Driving demand growth for aluminium
Better GreenerBigger
Kjetil Ebbesberg, EVP Rolled Products
Rolled Products Expanding in higher-margin and fast-growing segments
Ambition
Marketgrowth1
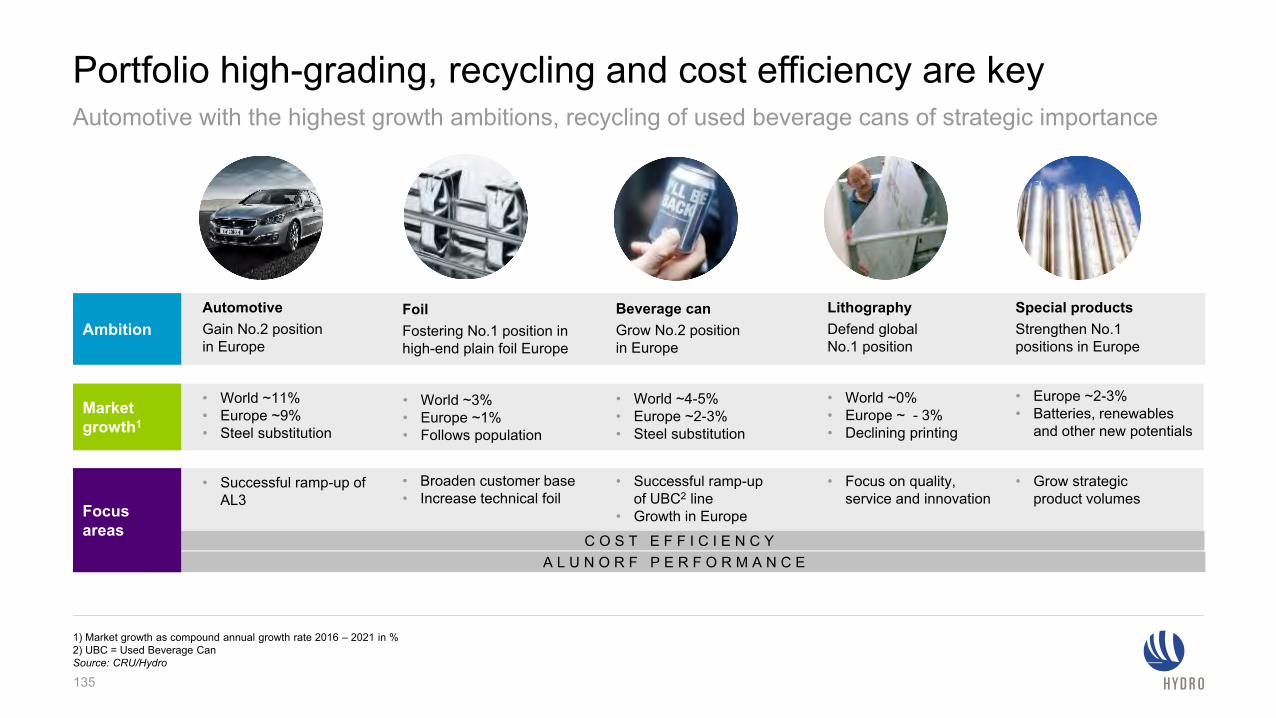
Portfolio high-grading, recycling and cost efficiency are key
135
Automotive with the highest growth ambitions, recycling of used beverage cans of strategic importance
1) Market growth as compound annual growth rate 2016 – 2021 in %2) UBC = Used Beverage CanSource: CRU/Hydro
AutomotiveGain No.2 position in Europe
• World ~11%• Europe ~9%• Steel substitution
• Successful ramp-up of AL3
FoilFostering No.1 position in high-end plain foil Europe
• World ~3%• Europe ~1%• Follows population
• Broaden customer base • Increase technical foil
Beverage canGrow No.2 position in Europe
• World ~4-5%• Europe ~2-3%• Steel substitution
• Successful ramp-up of UBC2 line
• Growth in Europe
LithographyDefend global No.1 position
• World ~0%• Europe ~ - 3%• Declining printing
• Focus on quality, service and innovation
Special productsStrengthen No.1positions in Europe
• Europe ~2-3%• Batteries, renewables
and other new potentials
• Grow strategic product volumes
C O S T E F F I C I E N C YA L U N O R F P E R F O R M A N C E
Focusareas
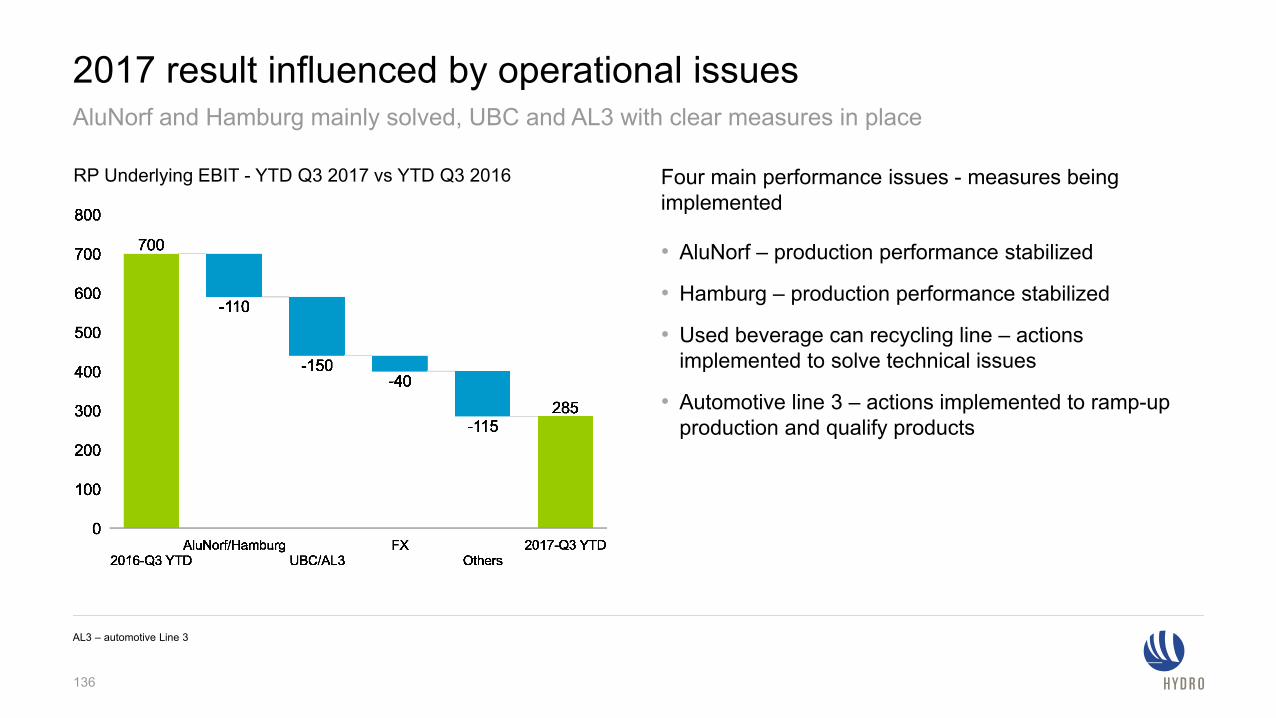
2017 result influenced by operational issues
136
AluNorf and Hamburg mainly solved, UBC and AL3 with clear measures in place
AL3 – automotive Line 3
Four main performance issues - measures being implemented
• AluNorf – production performance stabilized
• Hamburg – production performance stabilized
• Used beverage can recycling line – actions implemented to solve technical issues
• Automotive line 3 – actions implemented to ramp-up production and qualify products
RP Underlying EBIT - YTD Q3 2017 vs YTD Q3 2016
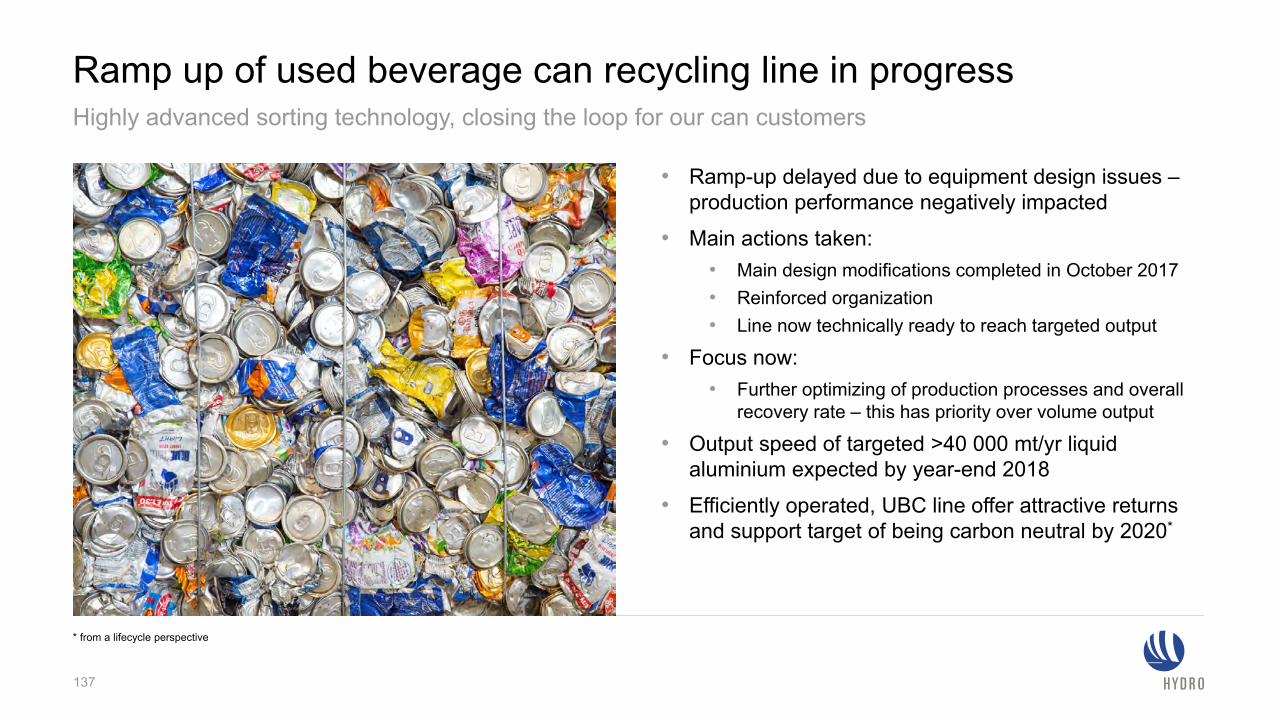
Ramp up of used beverage can recycling line in progressHighly advanced sorting technology, closing the loop for our can customers
* from a lifecycle perspective
• Ramp-up delayed due to equipment design issues –production performance negatively impacted
• Main actions taken: • Main design modifications completed in October 2017• Reinforced organization• Line now technically ready to reach targeted output
• Focus now: • Further optimizing of production processes and overall
recovery rate – this has priority over volume output
• Output speed of targeted >40 000 mt/yr liquid aluminium expected by year-end 2018
• Efficiently operated, UBC line offer attractive returns and support target of being carbon neutral by 2020*
137
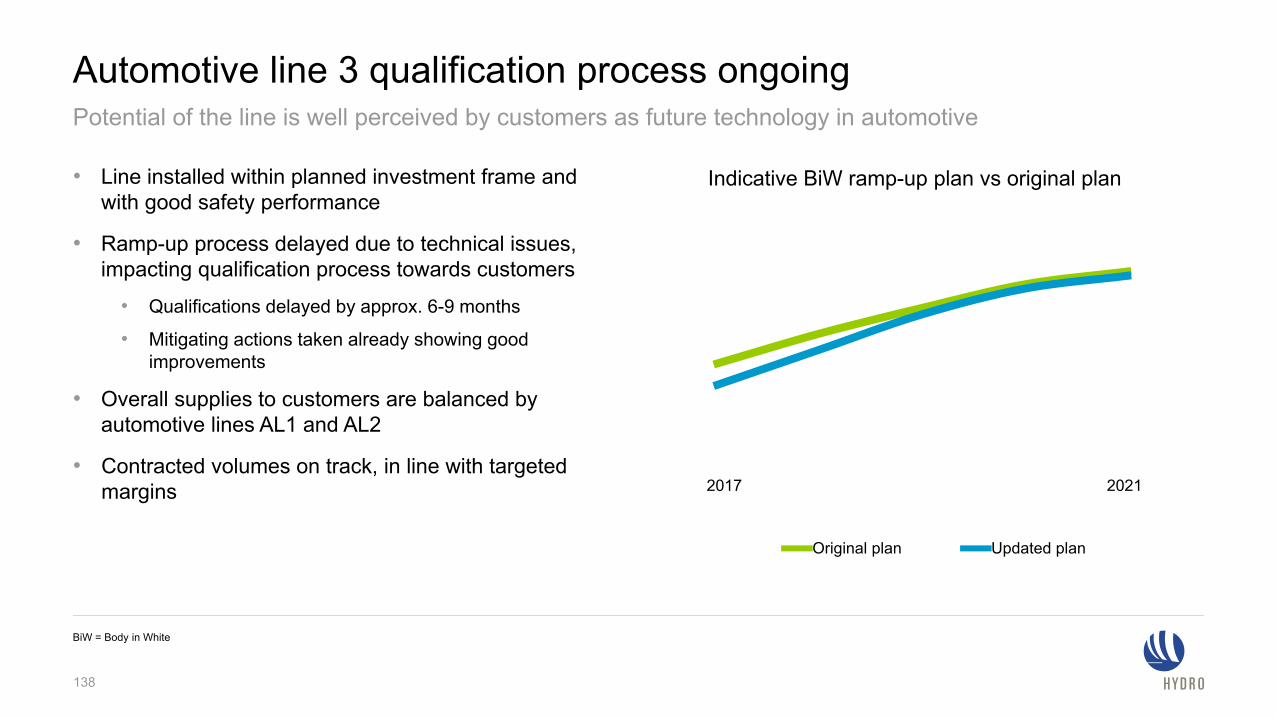
Automotive line 3 qualification process ongoing
• Line installed within planned investment frame and with good safety performance
• Ramp-up process delayed due to technical issues, impacting qualification process towards customers
• Qualifications delayed by approx. 6-9 months
• Mitigating actions taken already showing good improvements
• Overall supplies to customers are balanced by automotive lines AL1 and AL2
• Contracted volumes on track, in line with targeted margins
Potential of the line is well perceived by customers as future technology in automotive
BiW = Body in White
Original plan Updated plan
2017 2021
Indicative BiW ramp-up plan vs original plan
138
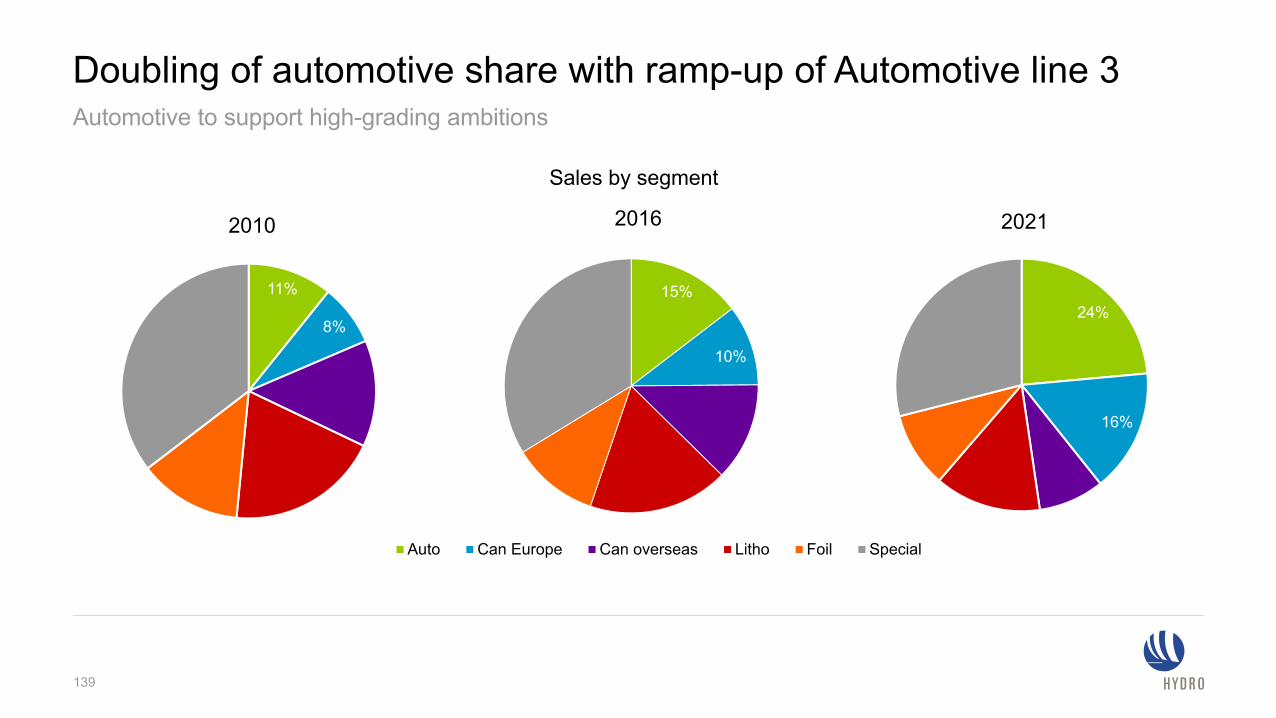
Doubling of automotive share with ramp-up of Automotive line 3
139
Automotive to support high-grading ambitions
Sales by segment
15%
10%
2016
Auto Can Europe Can overseas Litho Foil Special
24%
16%
2021
11%
8%
2010
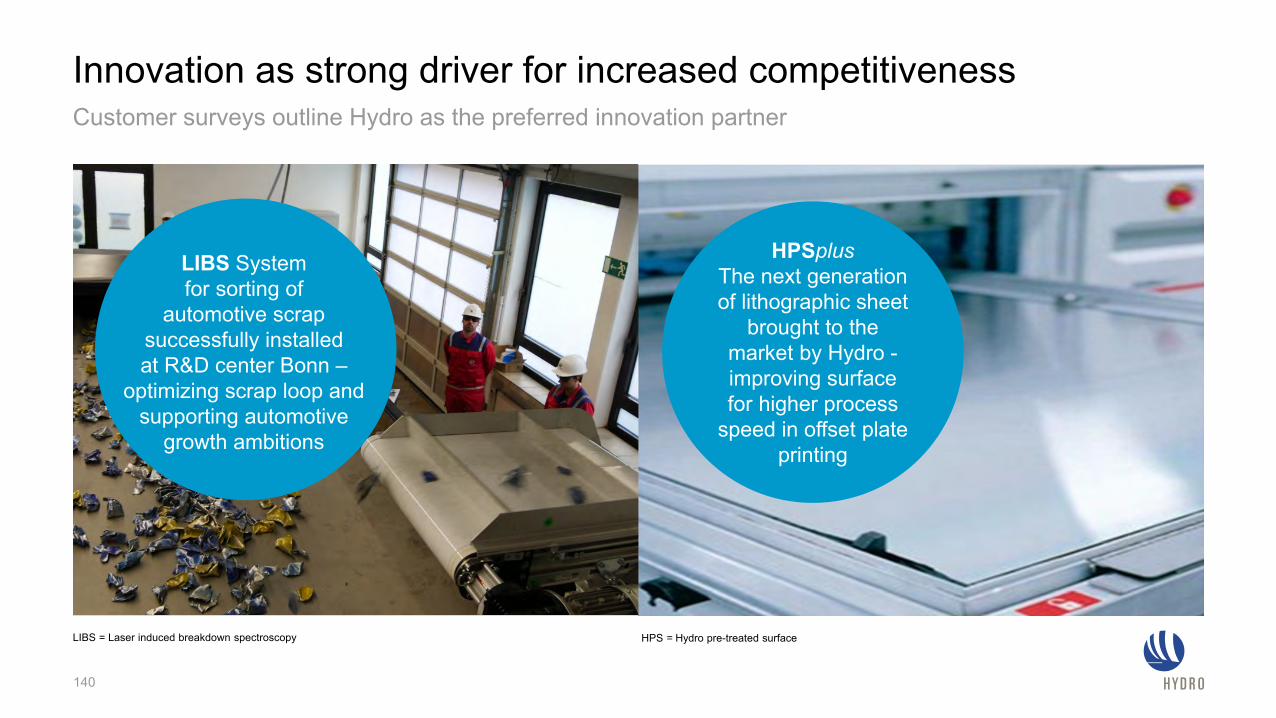
Innovation as strong driver for increased competitiveness Customer surveys outline Hydro as the preferred innovation partner
LIBS = Laser induced breakdown spectroscopy
140
LIBS System for sorting of
automotive scrap successfully installed at R&D center Bonn –
optimizing scrap loop and supporting automotive
growth ambitions
HPSplusThe next generation of lithographic sheet
brought to the market by Hydro -improving surface for higher process
speed in offset plate printing
HPS = Hydro pre-treated surface
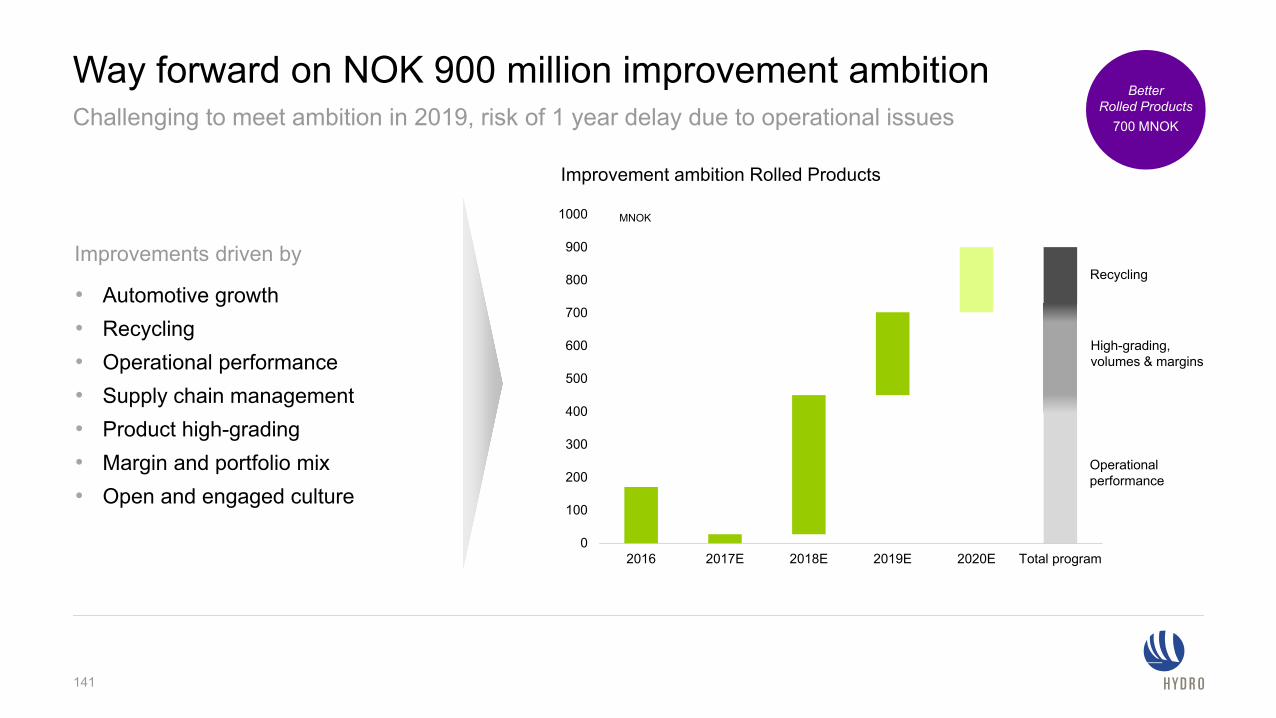
Way forward on NOK 900 million improvement ambition
141
Challenging to meet ambition in 2019, risk of 1 year delay due to operational issues
0
100
200
300
400
500
600
700
800
900
1000
2016 2017E 2018E 2019E 2020E Total program
MNOK
Improvement ambition Rolled Products
Improvements driven by
• Automotive growth• Recycling• Operational performance• Supply chain management• Product high-grading• Margin and portfolio mix • Open and engaged culture
High-grading, volumes & margins
Operationalperformance
Recycling
BetterRolled Products
700 MNOK
Arvid Moss, EVP Energy and Corporate Business Development
The future belongs to sustainable businesses
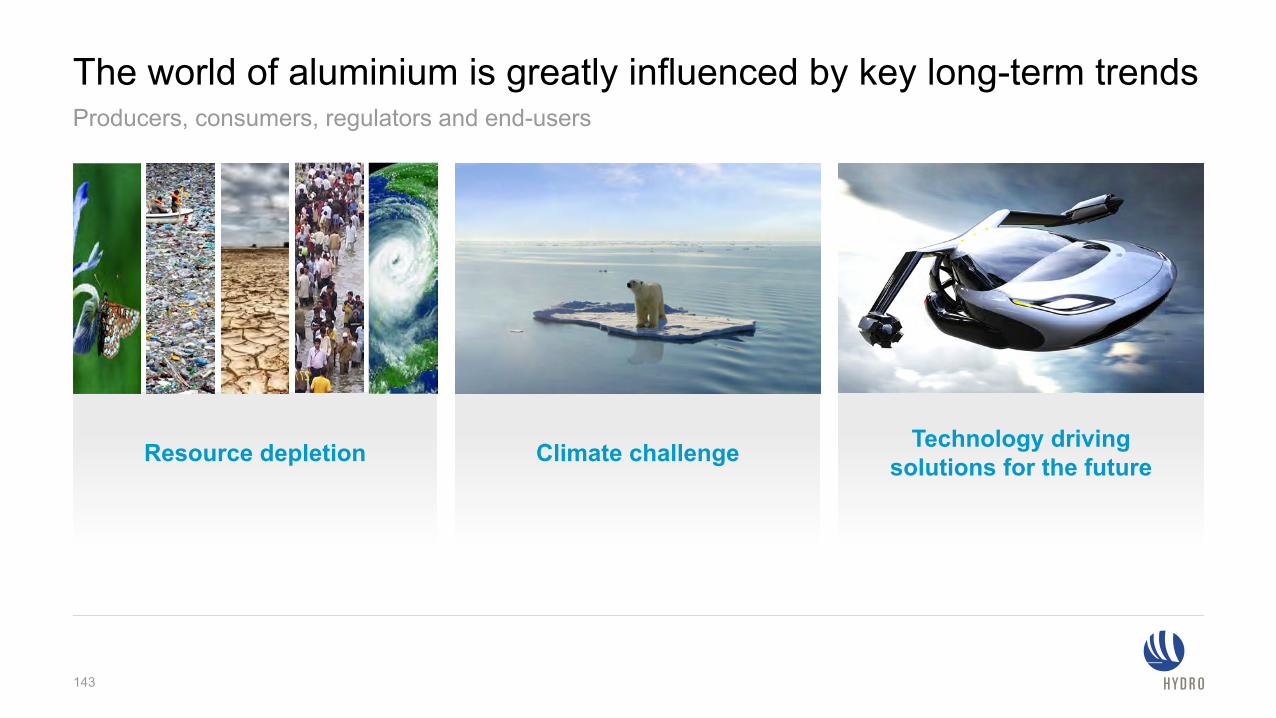
Technology drivingsolutions for the future
143
Resource depletion Climate challenge
The world of aluminium is greatly influenced by key long-term trendsProducers, consumers, regulators and end-users
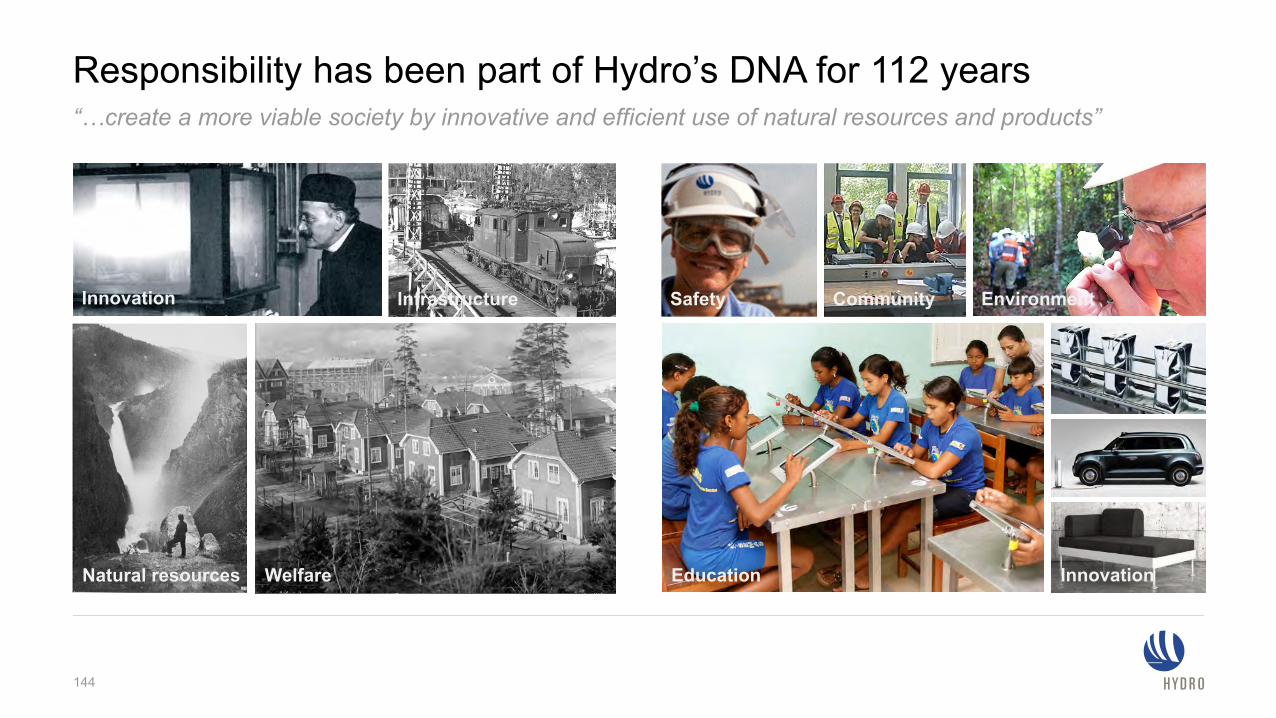
Responsibility has been part of Hydro’s DNA for 112 years“…create a more viable society by innovative and efficient use of natural resources and products”
144
Innovation Infrastructure
WelfareNatural resources
Safety Community Environment
Education Innovation
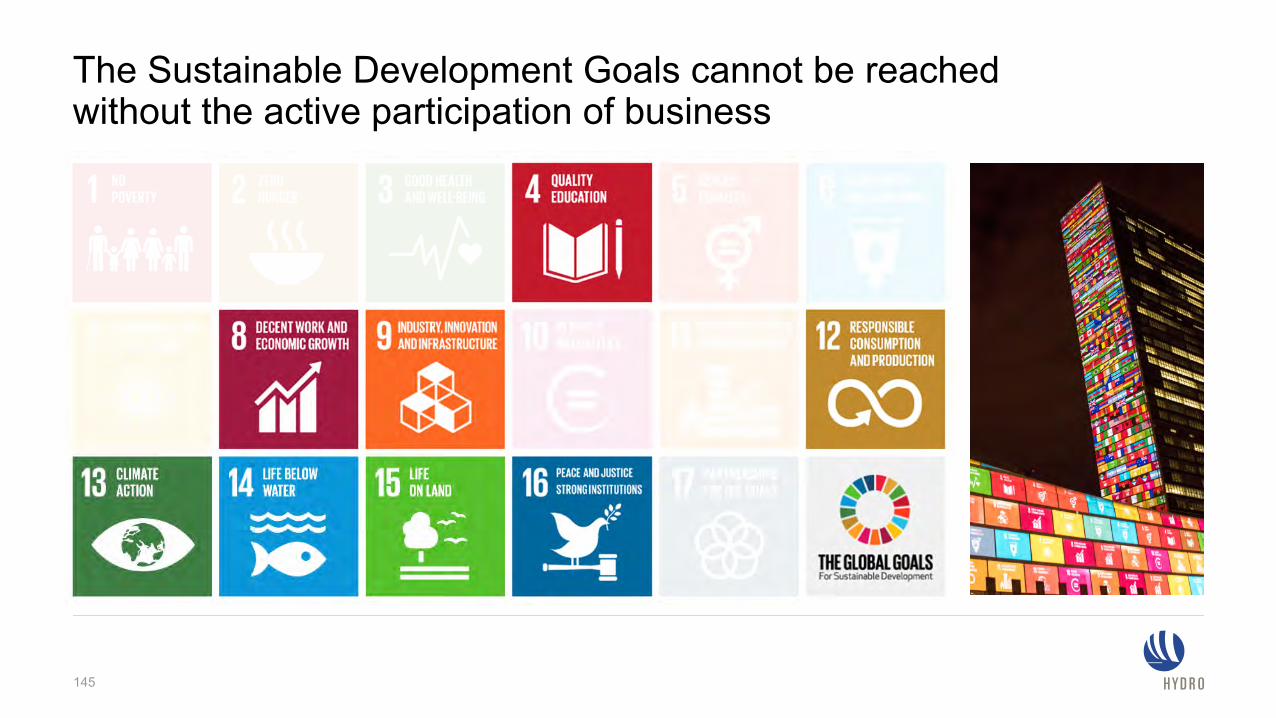
The Sustainable Development Goals cannot be reachedwithout the active participation of business
145
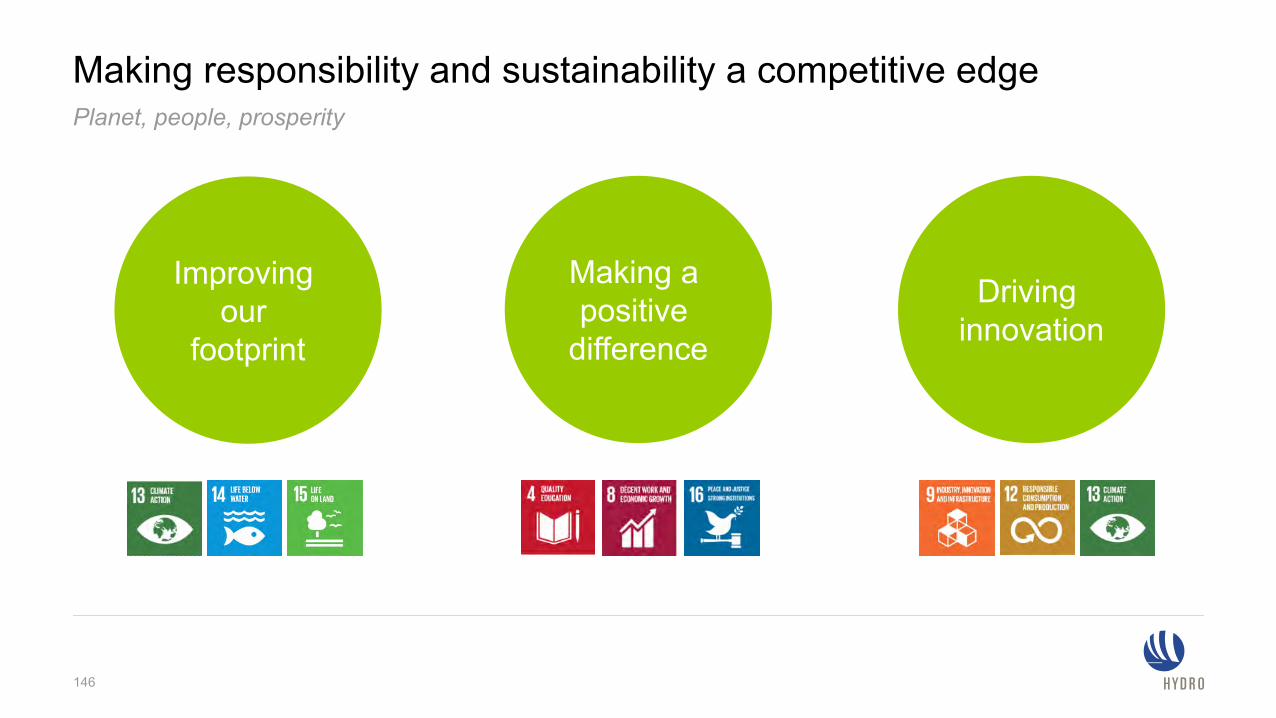
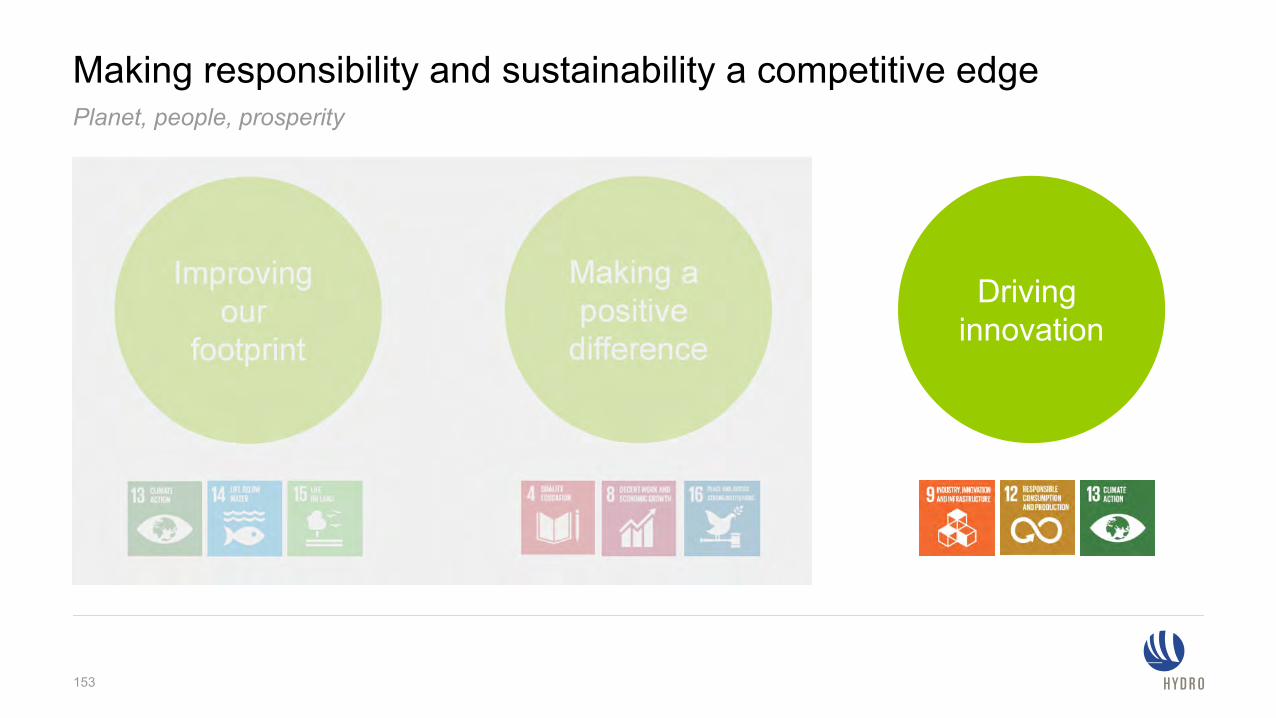
Making responsibility and sustainability a competitive edge
146
Planet, people, prosperity
Making a positive
difference
Driving innovation
Improvingour
footprint
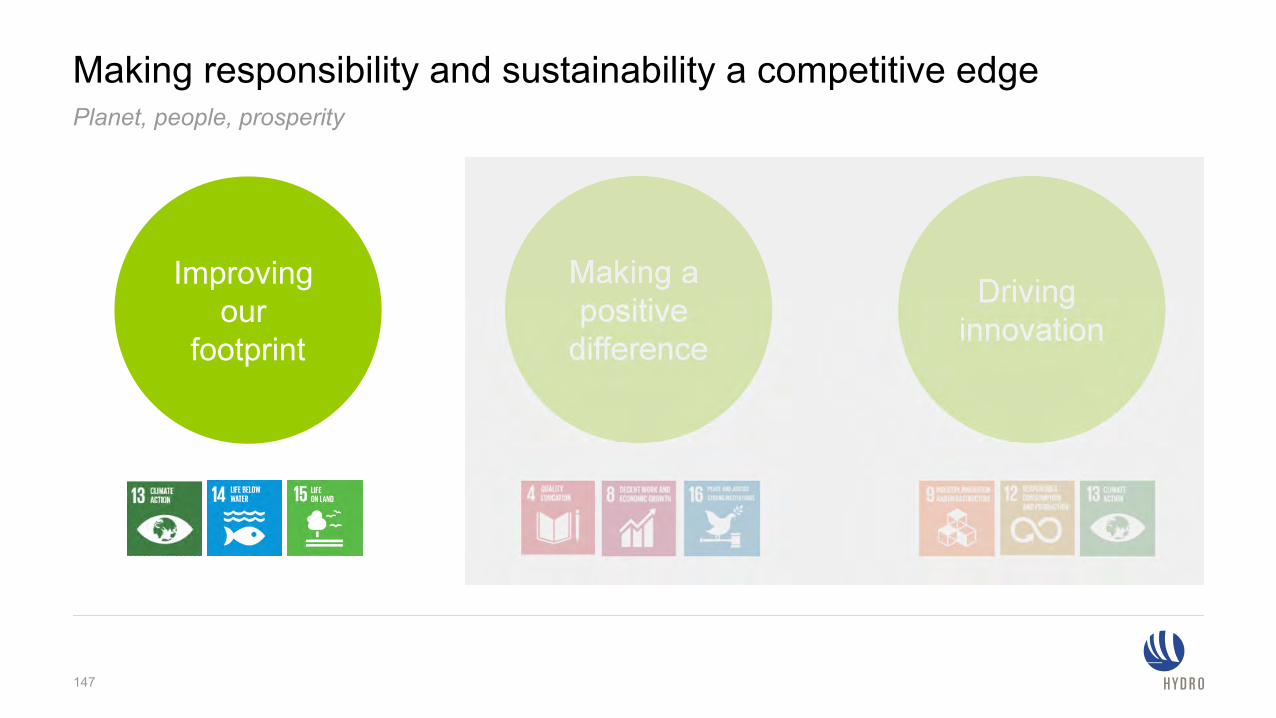
Making responsibility and sustainability a competitive edge
147
Planet, people, prosperity
Making a positive
difference
Driving innovation
Improvingour
footprint
0
2
4
6
8
10
12
14
16
18
20
Sout
h Af
rica
Indi
a
Uni
ted
Sta
tes
Chi
na
Aus
tralia
Bah
rain
UAE
Qat
ar
Sau
di A
rabi
a
Rus
sia
Mal
aysi
a
Braz
il
Can
ada
Nor
way
Icel
and
Direct Indirect
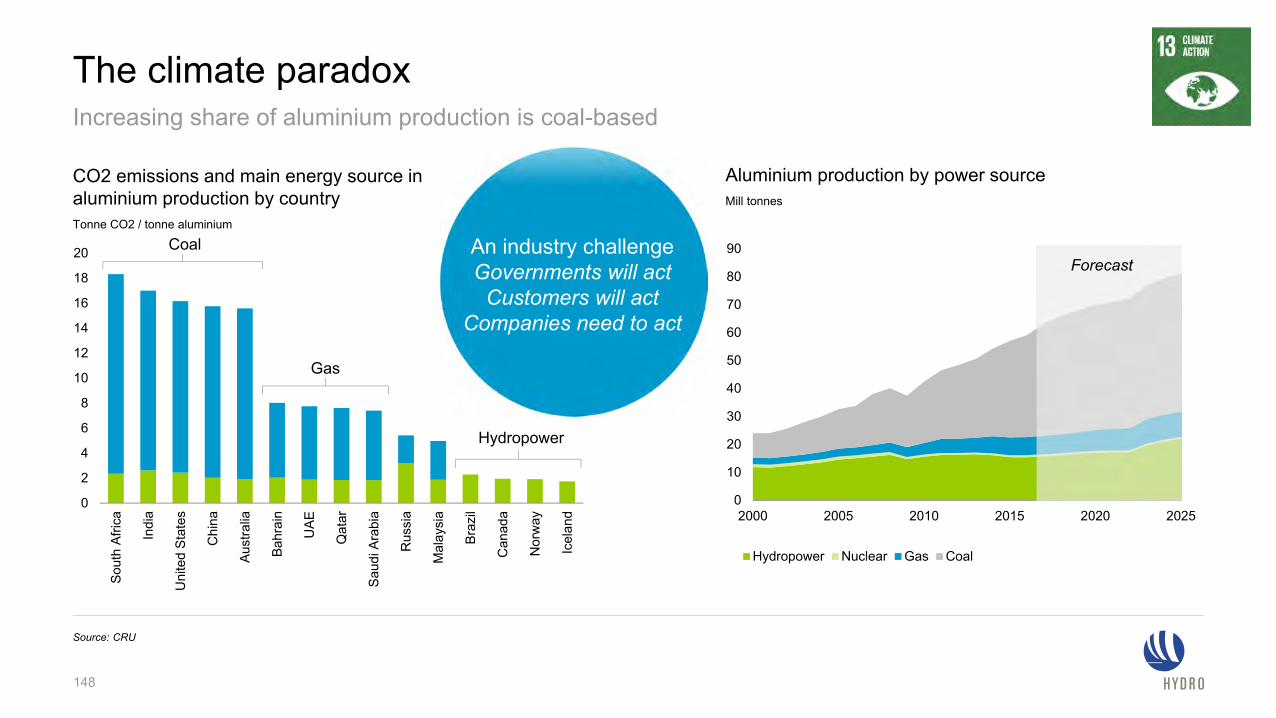
The climate paradox
Source: CRU
0
10
20
30
40
50
60
70
80
90
2000 2005 2010 2015 2020 2025
Hydropower Nuclear Gas Coal
Hydropower
Gas
Coal
Aluminium production by power sourceMill tonnes
CO2 emissions and main energy source in aluminium production by countryTonne CO2 / tonne aluminium
Forecast
148
Increasing share of aluminium production is coal-based
An industry challengeGovernments will act
Customers will actCompanies need to act
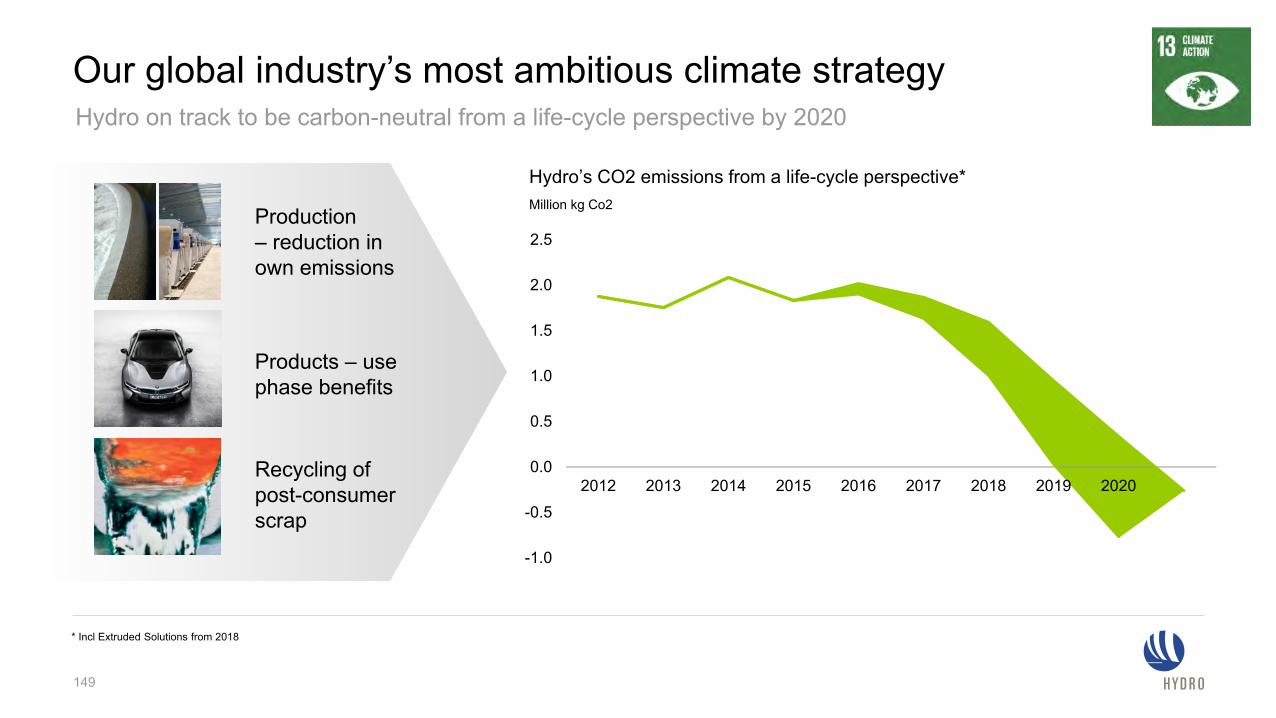
-1.0
-0.5
0.0
0.5
1.0
1.5
2.0
2.5
2012 2013 2014 2015 2016 2017 2018 2019 2020
Our global industry’s most ambitious climate strategy
Production – reduction in own emissions
Products – usephase benefits
Recycling of post-consumer scrap
149
Hydro on track to be carbon-neutral from a life-cycle perspective by 2020
Million kg Co2
Hydro’s CO2 emissions from a life-cycle perspective*
* Incl Extruded Solutions from 2018
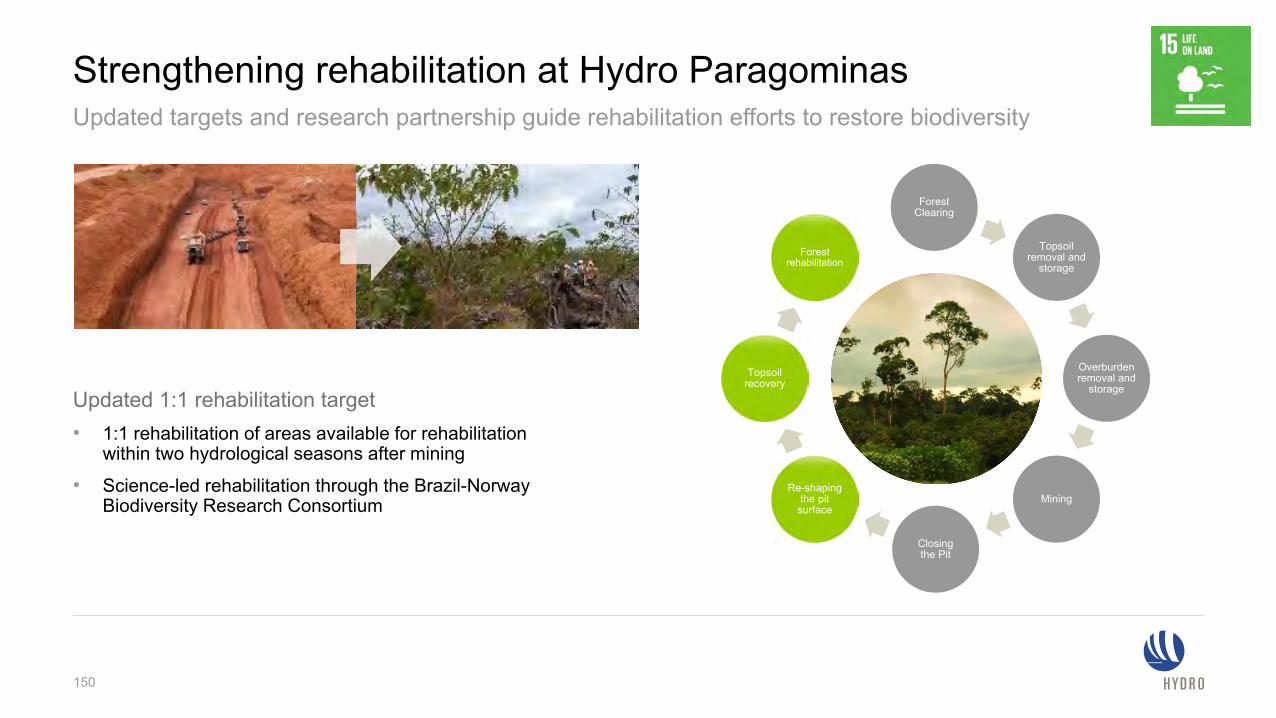
Strengthening rehabilitation at Hydro Paragominas
Updated 1:1 rehabilitation target• 1:1 rehabilitation of areas available for rehabilitation
within two hydrological seasons after mining
• Science-led rehabilitation through the Brazil-Norway Biodiversity Research Consortium
Updated targets and research partnership guide rehabilitation efforts to restore biodiversity
Forest Clearing
Topsoil removal and
storage
Overburden removal and
storage
Mining
Closing the Pit
Re-shaping the pit surface
Topsoil recovery
Forest rehabilitation
150
151
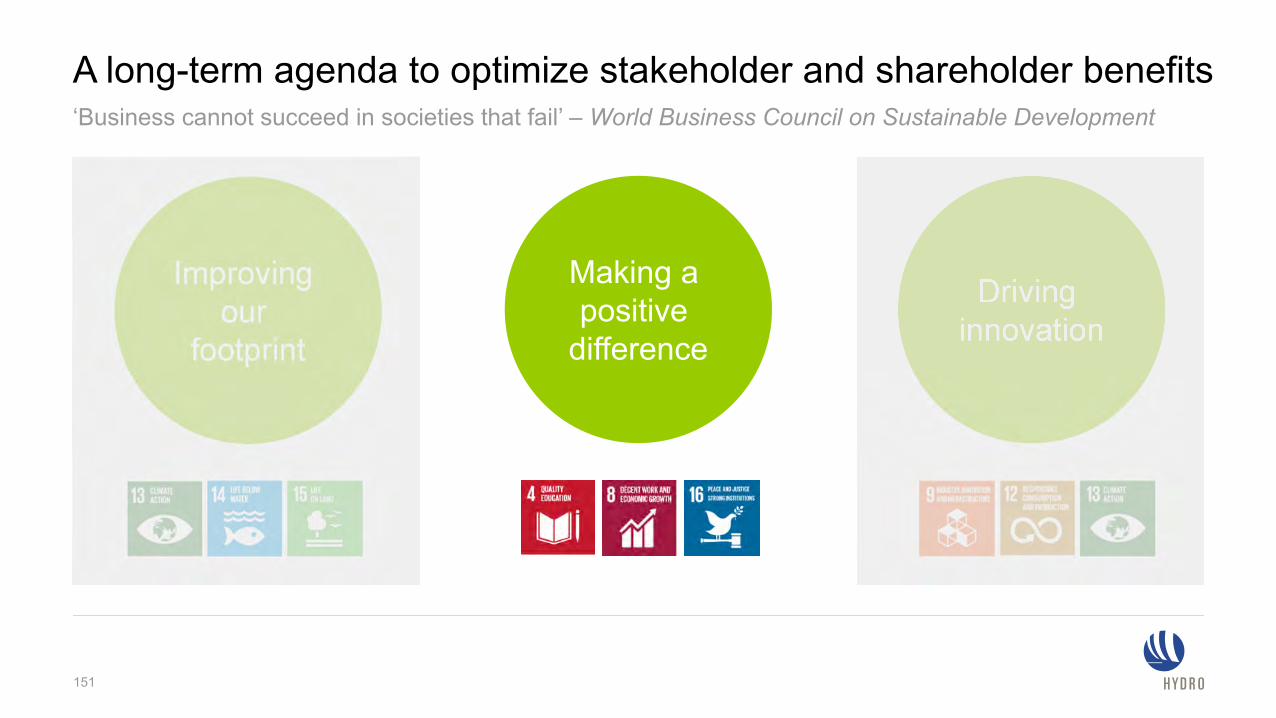
Making a positive
difference
Driving innovation
Improvingour
footprint
‘Business cannot succeed in societies that fail’ – World Business Council on Sustainable Development
A long-term agenda to optimize stakeholder and shareholder benefits
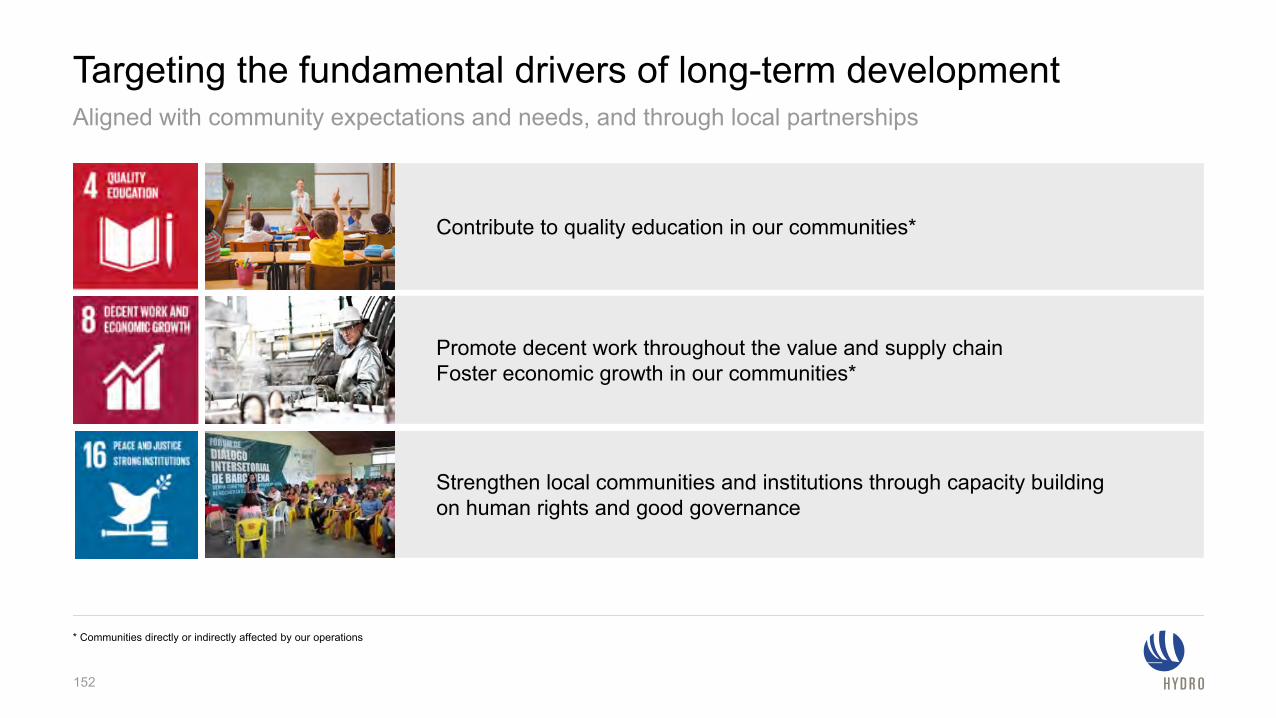
Targeting the fundamental drivers of long-term development
152
Aligned with community expectations and needs, and through local partnerships
* Communities directly or indirectly affected by our operations
Contribute to quality education in our communities*
Promote decent work throughout the value and supply chainFoster economic growth in our communities*
Strengthen local communities and institutions through capacity buildingon human rights and good governance
153
Making a positive
difference
Driving innovation
Improvingour
footprint
Planet, people, prosperity
Making responsibility and sustainability a competitive edge
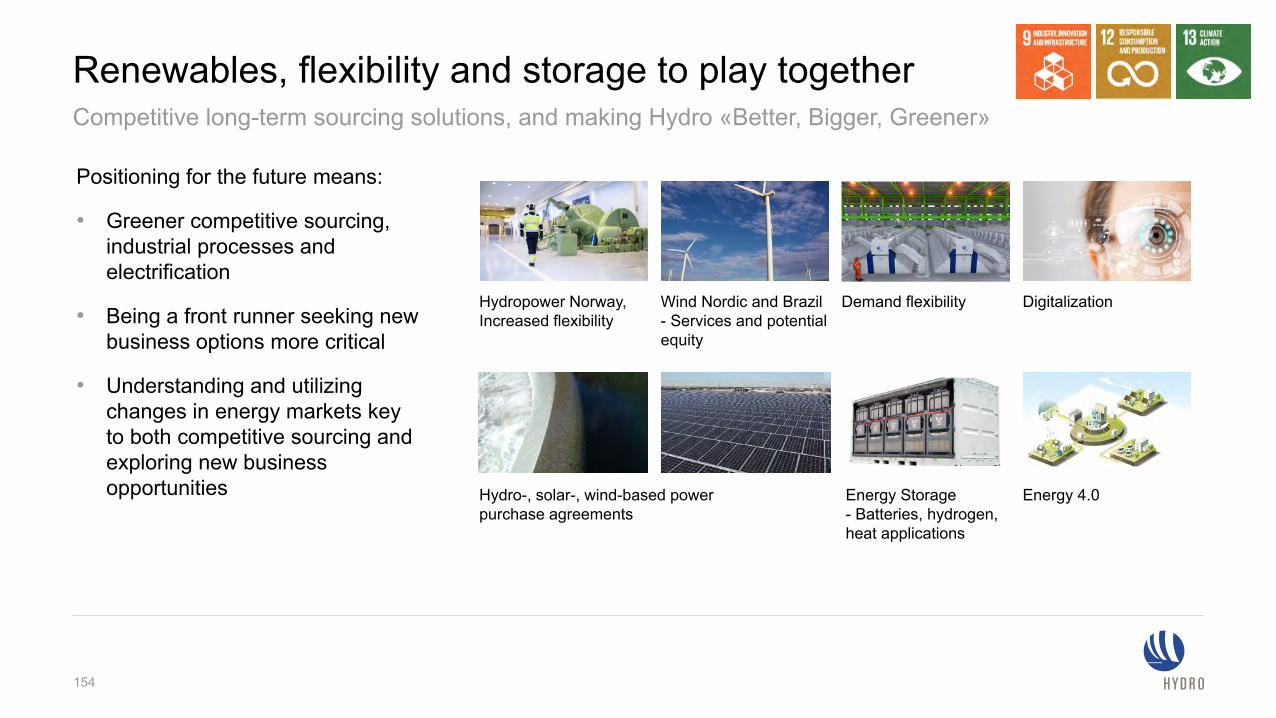
Hydro-, solar-, wind-based powerpurchase agreements
Renewables, flexibility and storage to play together
154
Competitive long-term sourcing solutions, and making Hydro «Better, Bigger, Greener»
Wind Nordic and Brazil- Services and potential equity
Energy 4.0
Hydropower Norway, Increased flexibility
DigitalizationDemand flexibility
Positioning for the future means:
• Greener competitive sourcing, industrial processes and electrification
• Being a front runner seeking new business options more critical
• Understanding and utilizing changes in energy markets key to both competitive sourcing and exploring new business opportunities Energy Storage
- Batteries, hydrogen, heat applications
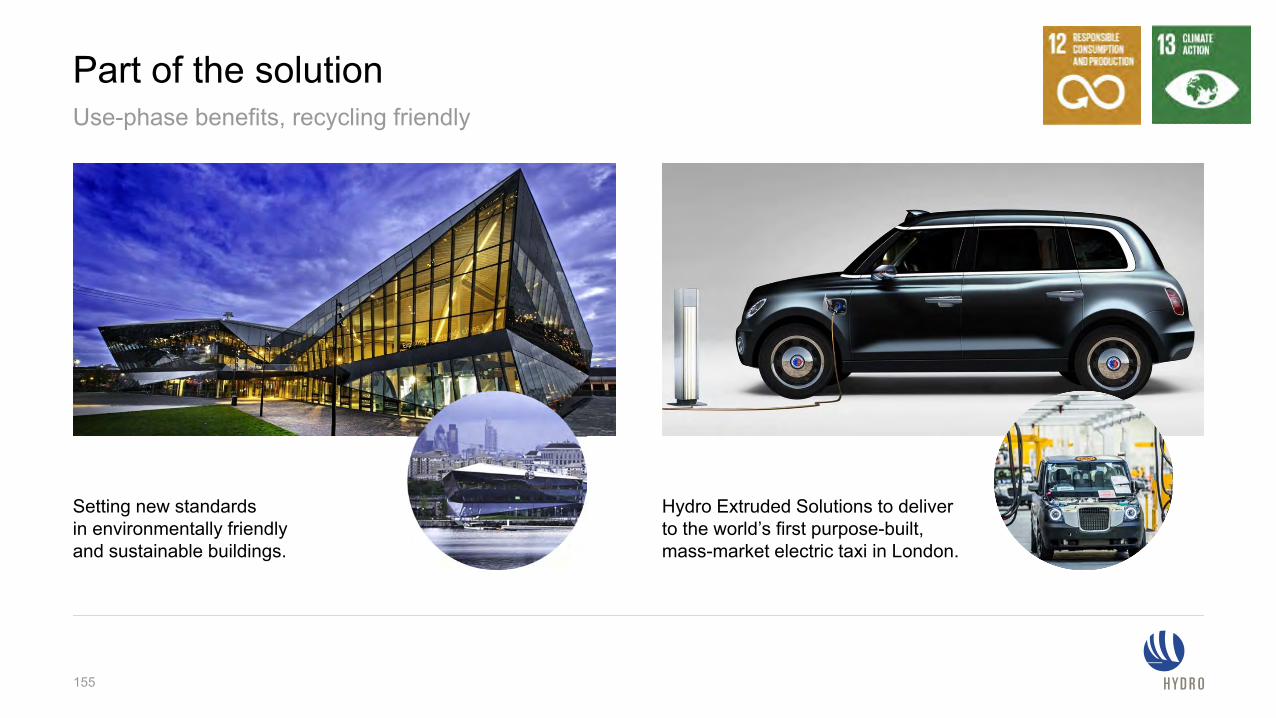
Part of the solution
155
Use-phase benefits, recycling friendly
Setting new standards in environmentally friendly and sustainable buildings.
Hydro Extruded Solutions to deliver to the world’s first purpose-built, mass-market electric taxi in London.
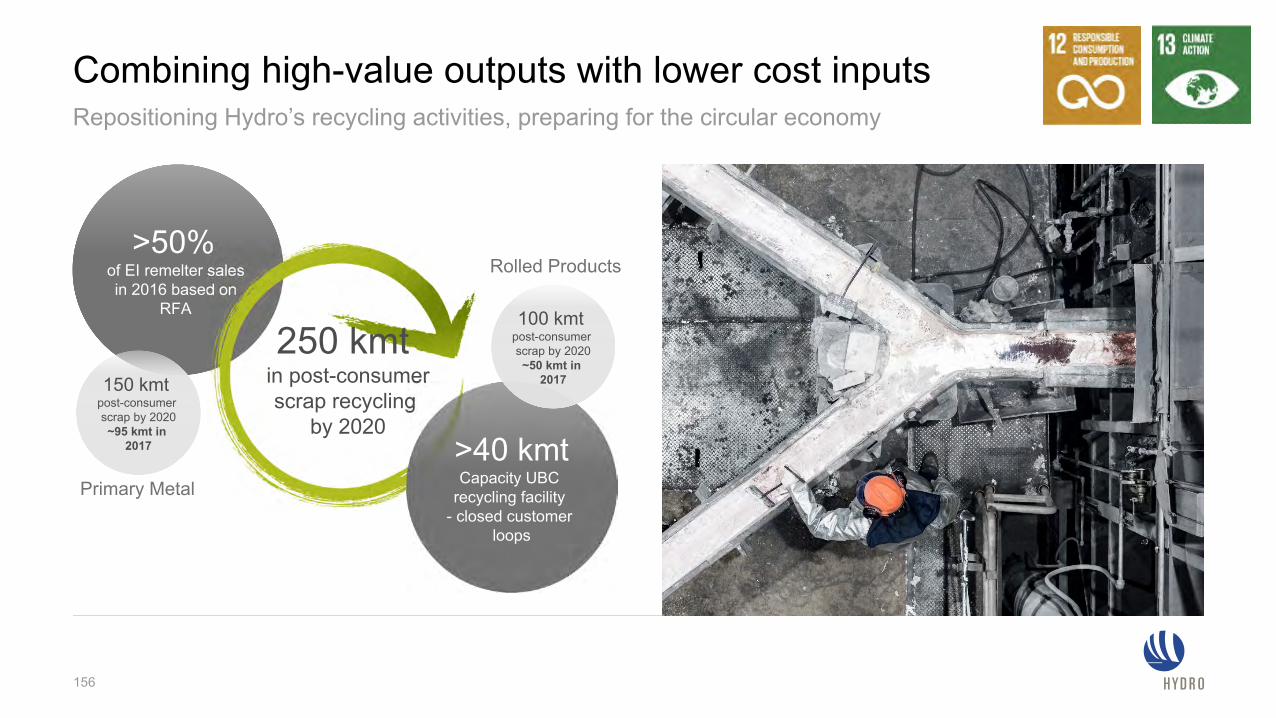
Combining high-value outputs with lower cost inputsRepositioning Hydro’s recycling activities, preparing for the circular economy
>50% of EI remelter sales in 2016 based on
RFA
150 kmtpost-consumerscrap by 2020~95 kmt in
2017
Primary Metal
Rolled Products
250 kmtin post-consumerscrap recycling
by 2020>40 kmtCapacity UBC
recycling facility- closed customer
loops
100 kmtpost-consumerscrap by 2020~50 kmt in
2017
156
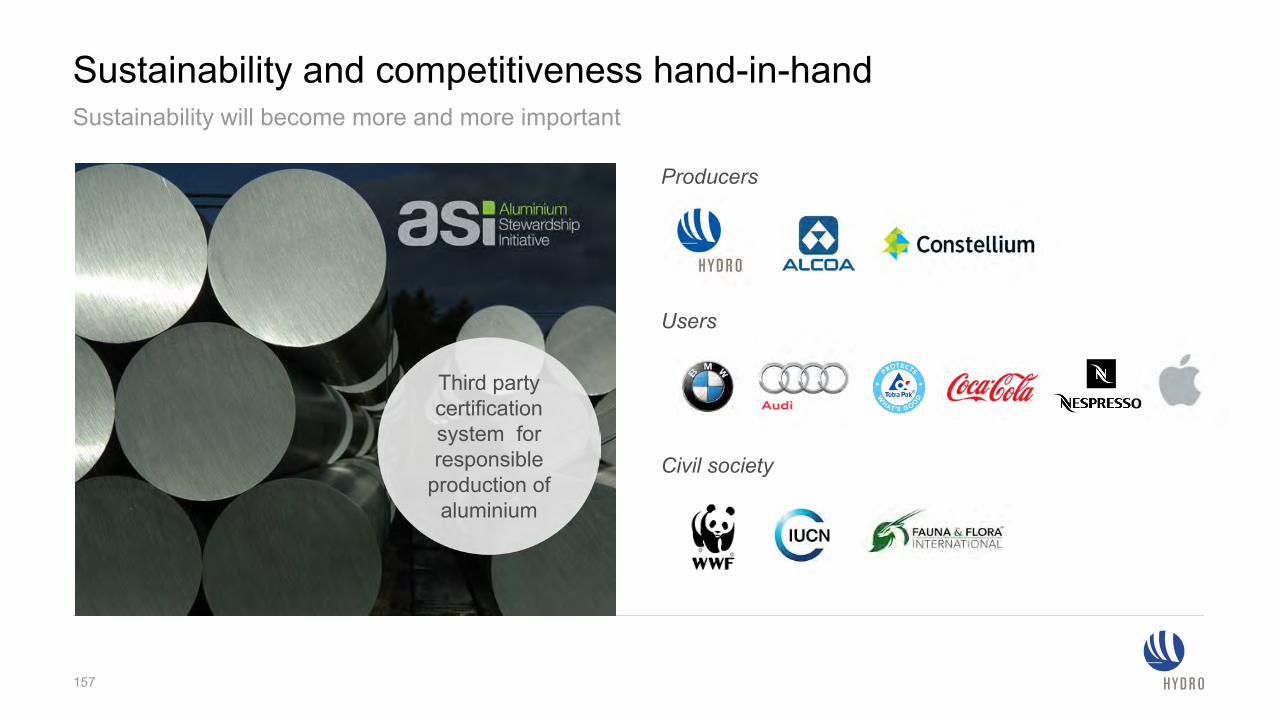
Sustainability and competitiveness hand-in-hand
Producers
Users
Civil society
Sustainability will become more and more important
157
Third party certification system for responsible
production of aluminium
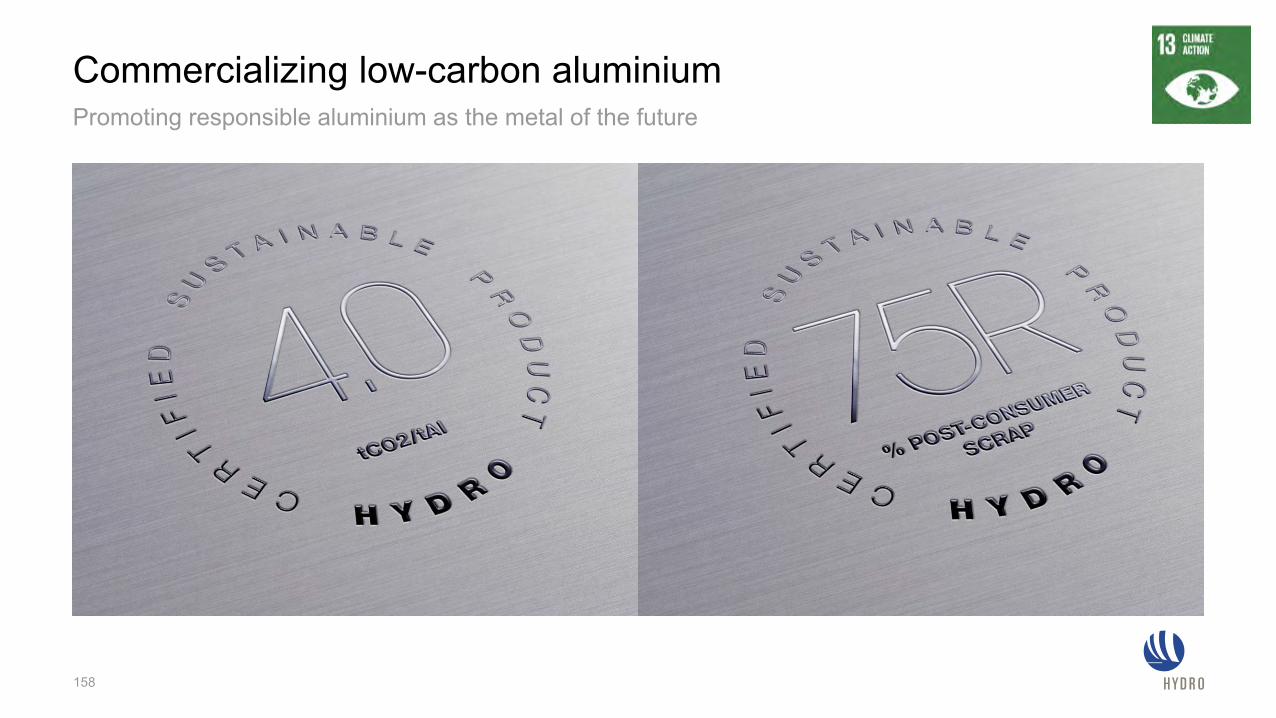
Commercializing low-carbon aluminium
158
Promoting responsible aluminium as the metal of the future
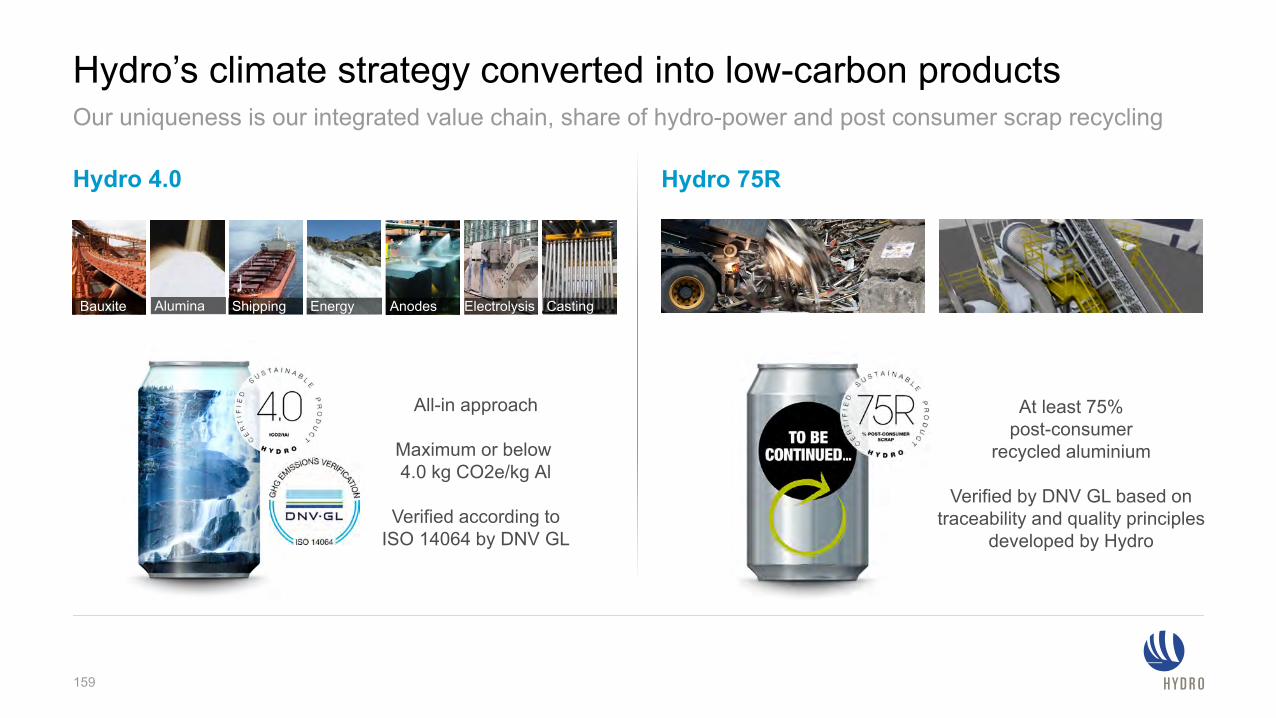
Hydro’s climate strategy converted into low-carbon products
159
Our uniqueness is our integrated value chain, share of hydro-power and post consumer scrap recycling
Hydro 75RHydro 4.0
Bauxite Alumina Shipping Energy Anodes Electrolysis Casting
All-in approach
Maximum or below 4.0 kg CO2e/kg Al
Verified according toISO 14064 by DNV GL
At least 75%post-consumer
recycled aluminium
Verified by DNV GL based ontraceability and quality principles
developed by Hydro
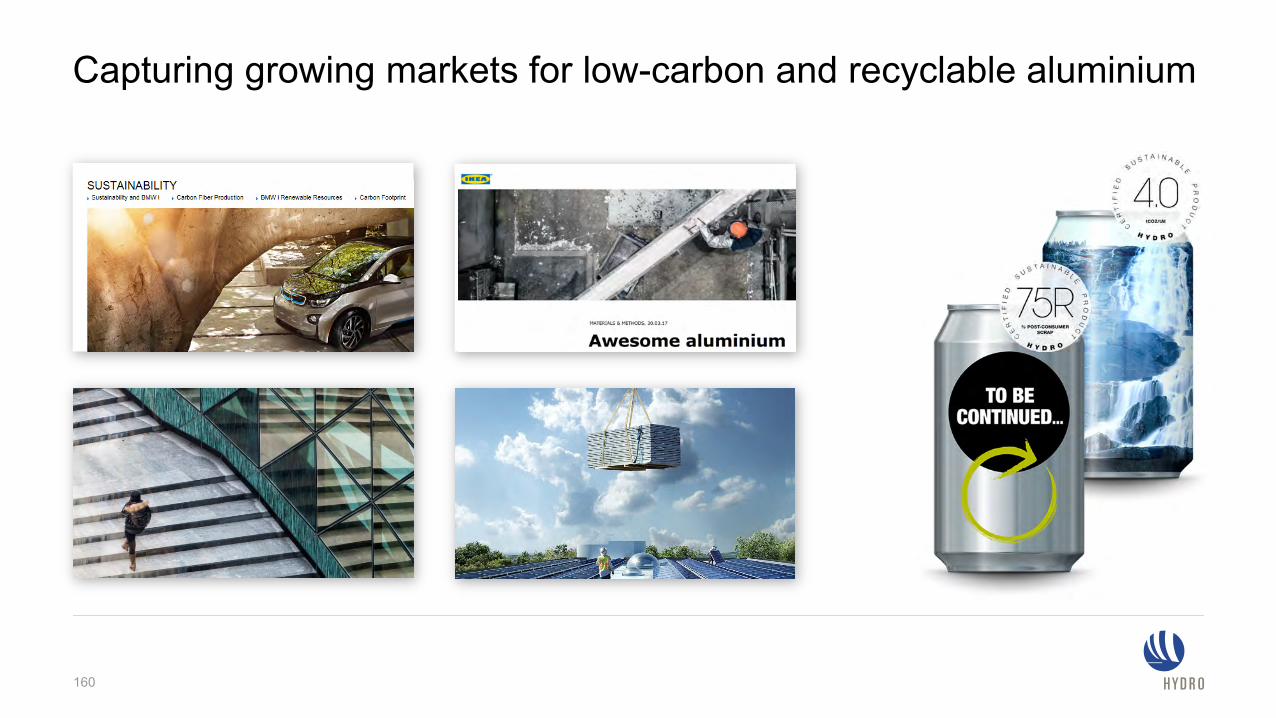
Capturing growing markets for low-carbon and recyclable aluminium
160
Responsibility and business hand in hand
161
The future belongs to sustainable
businesses