strategic conservation planning
TRANSCRIPT

ABSTRACT
As stewards promote conservation on alandscape, challenges often arise stemmingfrom limited time, budgets, or personnel toimplement the stewardship ideals envi-sioned. Coinciding with these challenges,our societal values and thoughts towardconservation have grown more complexand demanding. An emerging strategy toimplement more effectively conservationgoals on the land is known as strategic con-servation planning. Strategic conservationplanning is a tool that may be utilized topromote conservation initiatives effectivelythrough comprehensively combining space,time, natural and anthropogenic processes,along with processes to develop consensusamong stakeholders (Pressey et al. 2007).This research project studies the landscape
and landowners of the Central WisconsinGrassland Conservation Area (CWGCA).ArcGIS was utilized to complete a geospa-tial analysis of the CWGCA landscape fo-cusing on land use, core grassland habitat,and the location of landowners who hadpreviously indicated their interest in pro-moting grassland conservation initiativeson their land. By understanding the loca-tion of the interested landowners in con-junction with their relative location to coregrassland habitat, a telephone survey wasconducted to understand the perspectiveslandowners (n=14) hold toward govern-ment agencies working in the area. Resultsprovide several landscape specific prioritiesto promote the expansion of core grasslandhabitat, along with insights into the experi-ences and attitudes of landowners. None ofthe telephone survey respondents indicated
395
Strategic Conservation Planning:The Relationship between the Landscapeand Landowners in the Central Wisconsin
Grassland Conservation Area
Anthony K. Sharp
Science Operations Center2801 Progress Rd.
Madison, Wisconsin [email protected]
Aaron W. Thompson
UW-SP College of Natural Resources800 Reserve Street
Stevens Point, Wisconsin [email protected]
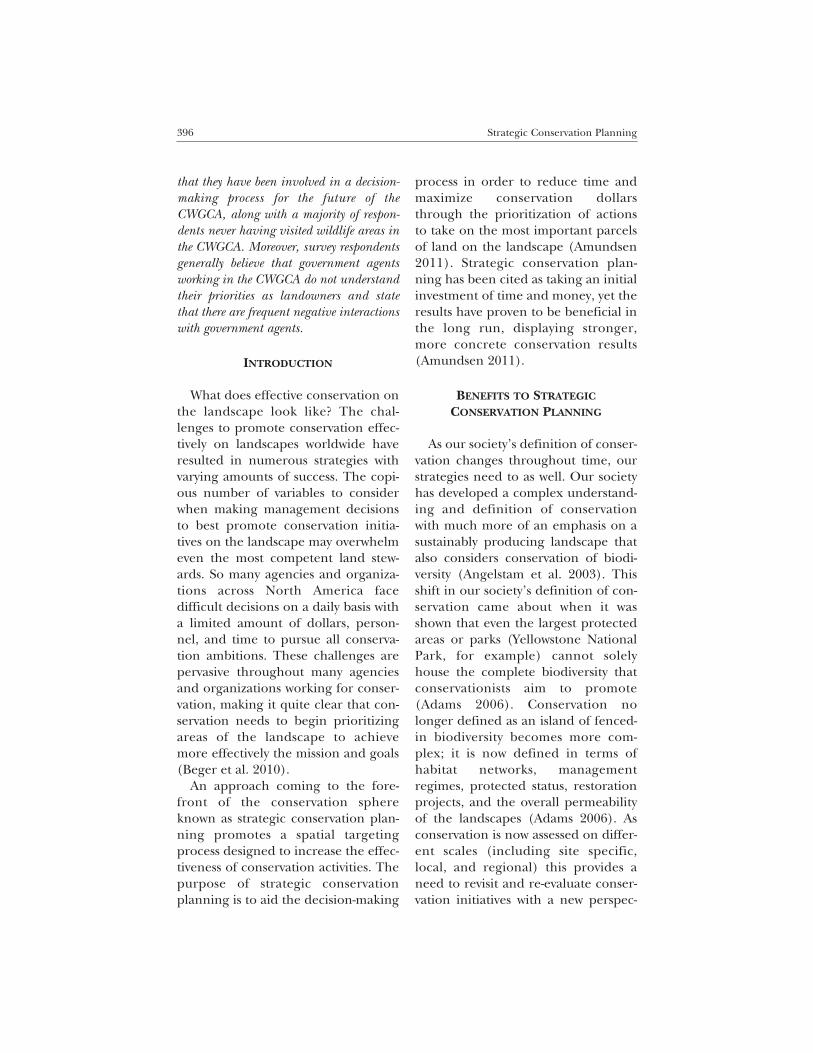
that they have been involved in a decision-making process for the future of theCWGCA, along with a majority of respon-dents never having visited wildlife areas inthe CWGCA. Moreover, survey respondentsgenerally believe that government agentsworking in the CWGCA do not understandtheir priorities as landowners and statethat there are frequent negative interactionswith government agents.
INTRODUCTION
What does effective conservation onthe landscape look like? The chal-lenges to promote conservation effec-tively on landscapes worldwide haveresulted in numerous strategies withvarying amounts of success. The copi-ous number of variables to considerwhen making management decisionsto best promote conservation initia-tives on the landscape may overwhelmeven the most competent land stew-ards. So many agencies and organiza-tions across North America facedifficult decisions on a daily basis witha limited amount of dollars, person-nel, and time to pursue all conserva-tion ambitions. These challenges arepervasive throughout many agenciesand organizations working for conser-vation, making it quite clear that con-servation needs to begin prioritizingareas of the landscape to achievemore effectively the mission and goals(Beger et al. 2010).An approach coming to the fore-
front of the conservation sphereknown as strategic conservation plan-ning promotes a spatial targetingprocess designed to increase the effec-tiveness of conservation activities. Thepurpose of strategic conservationplanning is to aid the decision-making
process in order to reduce time andmaximize conservation dollarsthrough the prioritization of actionsto take on the most important parcelsof land on the landscape (Amundsen2011). Strategic conservation plan-ning has been cited as taking an initialinvestment of time and money, yet theresults have proven to be beneficial inthe long run, displaying stronger,more concrete conservation results(Amundsen 2011).
BENEFITS TO STRATEGIC
CONSERVATION PLANNING
As our society’s definition of conser-vation changes throughout time, ourstrategies need to as well. Our societyhas developed a complex understand-ing and definition of conservationwith much more of an emphasis on asustainably producing landscape thatalso considers conservation of biodi-versity (Angelstam et al. 2003). Thisshift in our society’s definition of con-servation came about when it wasshown that even the largest protectedareas or parks (Yellowstone NationalPark, for example) cannot solelyhouse the complete biodiversity thatconservationists aim to promote(Adams 2006). Conservation nolonger defined as an island of fenced-in biodiversity becomes more com-plex; it is now defined in terms ofhabitat networks, managementregimes, protected status, restorationprojects, and the overall permeabilityof the landscapes (Adams 2006). Asconservation is now assessed on differ-ent scales (including site specific,local, and regional) this provides aneed to revisit and re-evaluate conser-vation initiatives with a new perspec-
396 Strategic Conservation Planning

tive that strategizes and prioritizes(Angelstam et al. 2003).Strategic conservation planning
looks to expand the efforts that wereonce too narrow, and prioritize effortsthat were once too grandiose. Strategicconservation planning efforts look tobroaden the narrow “single-species”approach to planning and broadenplanning efforts to entire ecosystemsinstead of site-specific wildlife areas(Theobald et al. 2000; Iowa State Uni-versity 2008). While there is an empha-sis in strategic conservation planningto look at maps, assign priority levelsto parcels of land, and develop strat-egy, it is also abundantly clear that alocal “bottom-up” approach must beused to have meaningful, long-lastingactions on the landscape (Theobald etal. 2000; Smith 2008).
BOTTOM-UP APPROACH TO THE
PLANNING PROCESS
Planning for conservation is abouthuman values (Theobald et al. 2000).In order to prioritize conservation ac-tivities effectively, multiple stake-holder participation must be presentso as to provide a wide spectrum ofcommunity values. The “bottom-up”approach to strategic conservationplanning is not a specific process;rather it is a collection of methodsaimed at increasing the role of localstakeholders in identifying and solv-ing conservation problems. The needto incorporate local perspectives in abottom-up approach has developeddue to the outdated, unrealistic, andineffective methods once dominantlyused by government agencies to act inthe best interest for the wider commu-nity (Campbell & Marshall 2000;
Smith 2008). Strategic conservationplanning must avoid placing the en-tire decision making process solely inthe hands of government agents, sci-entists, and other technical specialists.The key to successful conservation isto encourage citizens in articulatingtheir personal values and goals inorder to develop effectively the de-sired endpoints for the landscape inwhich they live (Theobald et al. 2000;Smith 2008). Although technical andscientific data are absolutely necessaryin a planning process, this informa-tion alone is not sufficient to informconservation planning (Theobald etal. 2000). Both the planners and thosethat will be affected by the outcomesmust work together for true success(Theobald et al. 2000). Having thepublic involved in creating strategicobjectives will then allow an agency ororganization to reach out to the own-ers of specific parcels to fulfill thestrategy with the support of the gen-eral public. The benefits of strategicconservation planning are numerous,compared to the more limiting histor-ical conservation efforts, because it en-ables an agency or organization tosave more land, improve stewardshipefforts, help the decision-makingprocess with clear criteria, improvefundraising efforts, and improve cred-ibility (Amundsen 2011). In addition,a process that focuses on specific geo-graphic areas can make it easier toidentify local stakeholders and engagethem in a meaningful process.
CENTRAL WISCONSIN GRASSLAND
CONSERVATION AREA
With the benefits of strategic con-servation described above, the follow-
The Passenger Pigeon, Vol. 75, No. 4, 2013 397

Figure 1. Study Area: the ‘S’ shaped CWGCA—Information based on Wisconsin DNR maps (2013).
398 Strategic Conservation Planning
ing will convey an overview of our re-search area, the Central WisconsinGrassland Conservation Area(CWGCA). The CWGCA will then beinspected using the lens of strategicconservation planning, communityvalues, and collaboration.
CWGCA Background Information—
Central Wisconsin boasts some ofthe best open landscapes in the mid-west. Grassland prairie is one of suchecosystems in this landscape and ishome to the native Greater Prairie-Chicken (Tympanuchus cupido). Figure
1 illustrates the current CWGCA areawhich is comprised of an ‘S’ shapedborder running through the center ofthe state (WDNR 2013A). This ‘S’shaped conservation area runsthrough the counties of Taylor, Clark,Marathon, Portage, Wood, and Adamsas shown in Figure 1. The CWGCAprovides an expansive biome for theGreater Prairie-Chicken and manyother grassland-dependent species.There has been a dramatic decline ingrassland ecosystems in Wisconsin, aswell as throughout North America;thus, the documented decline ofprairie and savanna plants and ani-

The Passenger Pigeon, Vol. 75, No. 4, 2013 399
mals has caused great concern for sci-entists, hunters, and the public.To ameliorate this decline of Wis-
consin grassland ecosystems, the Wis-consin Department of NaturalResources (WDNR) is aiming to in-crease the amount of grassland pre-served in the state. The current areasestablished under permanent grass-land protection are approximately22,000 acres (WDNR 2013B). Thislarge tract of grassland is mandated tobe managed and preserved for biodi-versity and grassland health, yet theGreater Prairie-Chicken (the umbrellaspecies), still remains threatened andon the decline (WDNR 2013B). Fac-tors behind the declining Wisconsingrassland habitat go back to 200+years of Wisconsin land use decisions.The CWGCA is surrogate grasslandthat was once forested and latercleared for agricultural production.Central Wisconsin, like much of themid-western United States, has seen agreat change in agriculture practicesand production. Problems that havealtered the central Wisconsin grass-land within the last half century in-clude an upsurge in cranberry bedsand cranberry production, declininggrassland grazing, an encroaching for-est becoming established on pastureland, along with more center-pivot ir-rigation agriculture development, andrural residential development, toname but a few.
The Greater Prairie-Chicken—
The Greater Prairie-Chicken of theCWGCA is a vulnerable species and atrisk of falling below a critical thresh-old where recovery is not likely. TheGreater Prairie-Chicken is very area-sensitive with a low tolerance for
human disturbance and habitatchange (WDNR 2013B). The GreaterPrairie-Chicken’s choice of habitat re-quires both short grass for mating, tallgrass for nesting, and limited to notree cover to reduce predation. TheGreater Prairie-Chicken requires dif-ferent types of grass and many acres ofopen space. An undisturbed tall grassprairie of 10,000-20,000 acres of non-fragmented prairie land is estimatedto be the ideal habitat coverage tomaintain a healthy breeding popula-tion of Greater Prairie-Chickens, al-though “Little information has beenpublished on mortality of juvenileSage Grouse or the level of produc-tion necessary to maintain a stablepopulation” (Connelly et al. 2004). Itshould also be noted that GreaterPrairie-Chicken is not migratory.
Threats to the Greater Prairie Chicken—
The Greater Prairie-Chicken popu-lation of central Wisconsin is facingunprecedented pressures that areboth natural and anthropogenic. Al-though harsh spring rains and sum-mer droughts are threats to theGreater Prairie-Chicken population,human interactions remain by far thegreatest threat. The direct effects ofthe human interactions include thefragmentation of the Greater Prairie-Chicken’s habitat which creates iso-lated Greater Prairie-Chicken popula-tions which leads to the limitations ofpossible dispersal, as well as a bottle-neck in genetic variety and a situationwhere it is impossible to re-colonizeareas. Other anthropogenic effects af-fecting the Greater Prairie-Chickenpopulation include the use of pesti-cides on crops that reduce the avail-ability of insects (food source). The
stress on water resources that center-pivot agricultural production puts onthe ecosystem affects the ecosystem’sability to rebound from droughts, alsoindirectly affecting the GreaterPrairie-Chicken population. The useof fire as a management tool is alsolimited, thus allowing forest succes-sion to encroach upon the open grass-lands. Trees and telephone poles cre-ate perches for predatory birds thatfurther restrict Greater Prairie-Chicken population growth.
Greater Prairie-Chicken Rehabilitation—
The overall Greater Prairie-Chickenpopulation in central Wisconsin is de-clining and is at a consistent height ofvulnerability (Riddle et al. 2013). TheGreater Prairie-Chicken population iscontinually threatening to cross athreshold where the population is un-able to recover.The “Wisconsin Greater Prairie-
Chicken Management Plan 2004-2014” was written by the WDNR inorder to document a 10-year programgoal to guarantee the viability of theGreater Prairie-Chicken population inWisconsin (WDNR 2013B). The pri-mary purpose of this document is tomotivate conservation practicesthrough governmental and non-gov-ernmental partnerships. The docu-ment has aimed to conserve grasslandhabitat and the Greater Prairie-Chicken by permanently conservingan additional 15,000 acres of grass-land by 2014. Much of the documentis focused on the connectivity ofGreater Prairie-Chicken populations.The Greater Prairie Chicken Man-
agement Plan introduces a programfor preservation, which is identifiedthrough nine 10-year objectives, 51
strategies, and 17 data research needs.Of the nine objectives, numbers onethrough six discuss habitat implemen-tation, where the last three objectivesdiscuss genetic diversity, recoveryplans, and grassland partnerships.The public was addressed in the
Management Plan with regards to theneeded collaborative efforts in coordi-nation with both public and privatelands, partnerships, public responsesand opinions, historical public partici-pation, government actions, publicawareness of grasslands, boominggrounds on public and private lands,public and private land conservationstrategies, etc.
METHODS
Two objectives were completed inorder to couple the prioritization ofthe most significant parcels of landwith the landowners interested ingrassland conservation. The first re-search objective was a geo-spatialanalysis of the CWGCA. The secondresearch objective executed a tele-phone survey of the landowners whohad both previously indicated interestin grassland conservation initiativesand also live near core grassland habi-tat.
Objective 1: Geo-spatial Analysis—
The first objective of this researchfocuses on understanding currentland use patterns within the CWGCAarea. This objective inspects how theland is being used to identify wherethe current grassland habitat is and toidentify how much core grasslandhabitat exists in the CWGCA. The spa-tial analysis was developed using Ar-cGIS (ver. 10.1) to analyze CWGCA
400 Strategic Conservation Planning

land cover, grassland fragmentation,and grassland core habitat. A three-step approach was used to completethis analysis, including:
• Step 1: Land Cover Data Process-ing & Reclassification;
• Step 2: Identification of Frag-menting Land Uses;
• Step 3: Grassland FragmentationAnalysis.
These steps are a modified analysisprocedure using the Landscape Frag-mentation Tool version 2 developedby Parent et al. (2007) for understand-ing forest fragmentation and applyingthis technique to grassland habitatfragmentation.
Step 1: Land Cover Data Processing& Reclassification—
In order to begin the process of tar-geting landowners for improved grass-land conservation efforts, it isnecessary to acquire high quality spa-tial data that allow for identifyingwhere these grasslands exist. For thisstudy the USDA 2010 National Agri-cultural Statistics Service CroplandData Layer (NASS CDL) (USDA2010) provided recent, relatively fine-scale (30 meter by 30 meter cell reso-lution) land cover data. Moreimportantly this dataset included in-formation about the location of grass-lands and various pasture types criticalto understanding Greater Prairie-Chicken habitat in the CWGCA.The first step in developing this
analysis required aggregating landcover types into meaningful use classes.This process was accomplished by re-classifying the NASS CDL into 8 cate-gories, including: (1) row crops—suchas corn and soybeans, (2) fixed agricul-
ture—such as cranberries and or-chards, (3) grasslands—including vari-ous pasture types, (4) forest andshrublands, (5) barren, (6) wetlands,(7) urban, and (8) water. This com-mon technique allowed for under-standing current land use patterns inthe six counties that encompass theCWGCA.
Step 2: Identification of FragmentingLand Uses—
The next step in the analysisprocess, in order to use the LandscapeFragmentation Tool, requires deter-mining if each land use classificationis target habitat, a fragmenting landuse (negatively affecting the targethabitat type), or a non-fragmenting(or benign) land use type. For thepurposes of this analysis the aggregateland use categories were reclassifiedinto the following:
• Target Habitat: Included only thegrassland land use category asthese represent the desired habi-tat type in the CWGCA.
• Fragmenting Land Use: Includedrow crops, fixed agriculture, for-est, and urban land use categoriesas they represent land uses thatare actively or have the potentialto displace grasslands in theCWGCA.
• Non-fragmenting Land Use: In-cluded wetland and water as nei-ther land use type is likely toreplace grassland habitat in thenear future.
Step 3: Grassland FragmentationAnalysis—
The three land cover types (target,fragmenting, and non-fragmenting)
The Passenger Pigeon, Vol. 75, No. 4, 2013 401
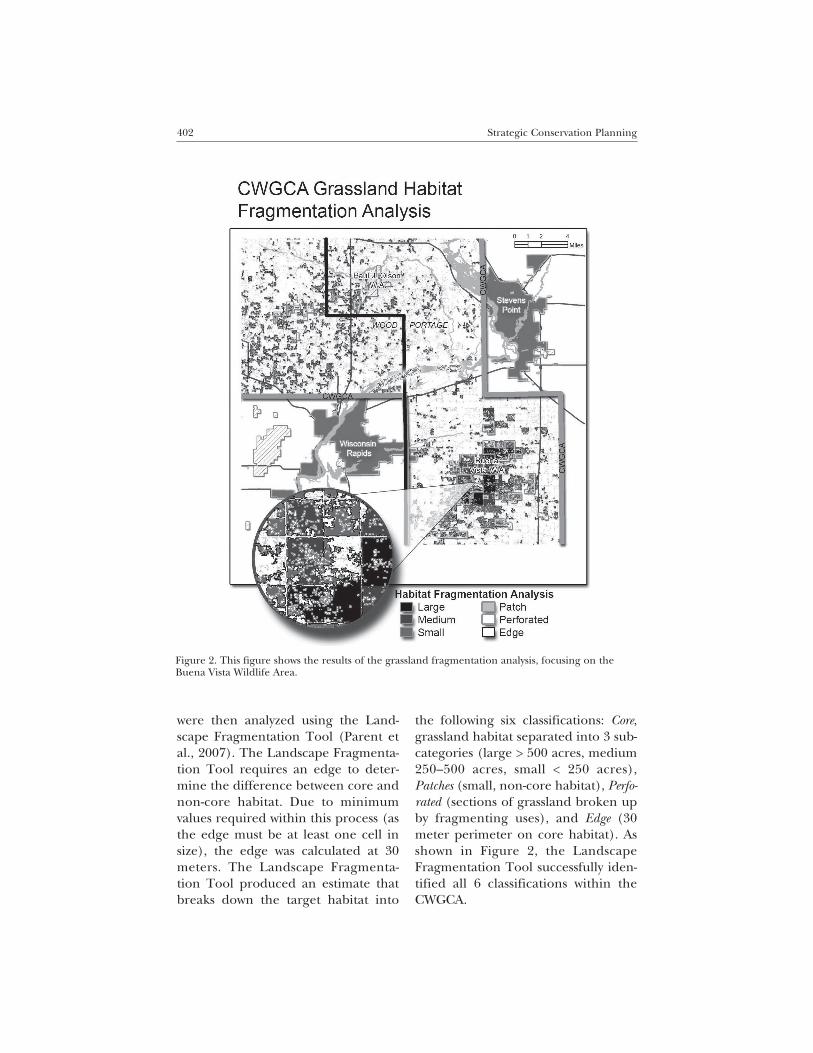
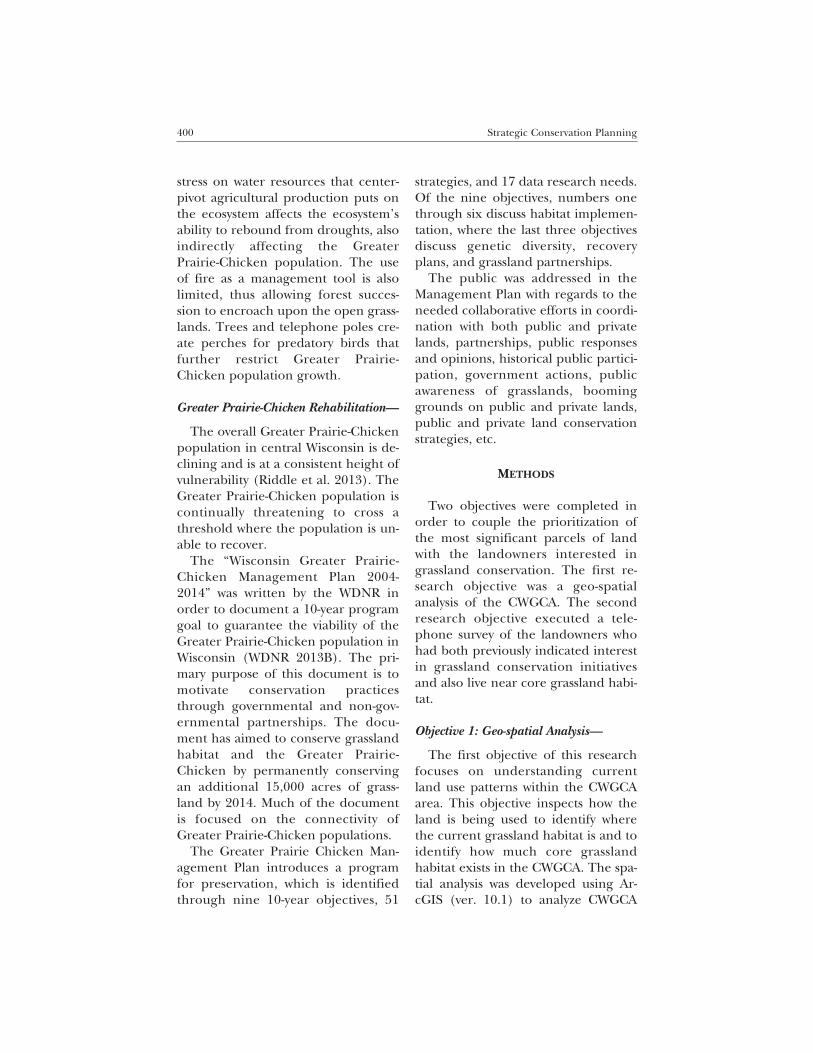
Figure 2. This figure shows the results of the grassland fragmentation analysis, focusing on theBuena Vista Wildlife Area.
402 Strategic Conservation Planning
were then analyzed using the Land-scape Fragmentation Tool (Parent etal., 2007). The Landscape Fragmenta-tion Tool requires an edge to deter-mine the difference between core andnon-core habitat. Due to minimumvalues required within this process (asthe edge must be at least one cell insize), the edge was calculated at 30meters. The Landscape Fragmenta-tion Tool produced an estimate thatbreaks down the target habitat into
the following six classifications: Core,grassland habitat separated into 3 sub-categories (large > 500 acres, medium250–500 acres, small < 250 acres),Patches (small, non-core habitat), Perfo-rated (sections of grassland broken upby fragmenting uses), and Edge (30meter perimeter on core habitat). Asshown in Figure 2, the LandscapeFragmentation Tool successfully iden-tified all 6 classifications within theCWGCA.

The Passenger Pigeon, Vol. 75, No. 4, 2013 403
Objective 2: Overview: QuantitativeAnalysis of Landowner Attitudes andInvolvement in the CWGCA—
The second objective built upongeo-spatial analysis and initiated thehuman dimensions aspects of strategicconservation planning. The locationof landowners who had indicated in-terest in grassland conservation initia-tives on their private land wereidentified on the CWGCA landscape.A telephone survey was then con-ducted with the landowners that metthe research criteria. Criteria identi-fied the landowners who ownedparcels within two miles of the previ-ously evaluated core grassland habitat.The purpose of the telephone surveywas to gather quantitative data to un-derstand landowner’s involvementwith grassland conservation, and theirattitudes toward trust and communi-cation with the government agenciesworking in the CWGCA. The follow-ing steps were executed to completeObjective 2:
• Step 1: Identification of Inter-ested Landowners.
• Step 2: Telephone Survey De-sign.
• Step 3: Sample Description.
Step 1: Identification of InterestedLandowners—
The dissemination of the postcardis a result of a combined effort on be-half of the Wisconsin Department ofNatural Resources and Golden SandsResource Conservation and Develop-ment Council, Inc. (RC&D) in 2010.These two entities partnered togetherto create a mailing packet as an out-reach method for the CWGCA. Themailing packets were partially funded
by the United States Fish & WildlifeService (USFWS) through the Neo-tropical Migratory Bird ConservationAct grant. The packet that was mailedto landowners included a cover letter,a CWGCA partnership project de-scription flyer, a county specific tri-fold explaining the differentconservations programs offered tolandowners, a Farm Service Agency(FSA) fact sheet about the State Acresfor Wildlife Enhancement (SAFE)program for enhanced grasslandwildlife, and a pre-paid post card inwhich landowners were encouraged toindicate any items that matched theirinterest.The pre-paid postcard sent to 1,605
landowners by the Golden SandsRC&D in July, 2010 providedlandowners the opportunity to indi-cate their interest in grassland conser-vation programs. The following is thepostcard which was sent to land-owners:
“Please check the item(s) thatmatch your interest. Then simplymail this postage paid card back tous! We’ll send you more informa-tion or have a representative con-tact you.
• I want information about local,state, and federal rental pay-ments, easements, or cost-shareprograms that protect grasslandsand provide income.
• I want information about a con-servation easement with a non-government organization andpossible savings on my property.
• I want information about rota-tional grazing and turning ahealthy profit on my livestock.

404 Strategic Conservation Planning
• I want information about sellingall or part of my property for per-manent grassland protection.
• I am undecided. Please call mesoon to talk about these options.
• I’m not interest in any of theabove. Please take me off yourmailing list.
Name, telephone number, besttime to call.”
The following are the distinguish-ing criteria which generated a list of1,605 landowners to receive the initial2010 mailings:
• Booming grounds—Within a halfmile of active or historical boom-ing grounds.
• Nesting grounds—Within a mileof active or historical nestinggrounds.
• Adjacent or abuts public ownedor managed property.
• Landscape—Primarily open andundeveloped.
• Acreage—A minimum of 20acres.
A total of 71 landowners (4%) sentback a postcard indicating an interestin grassland conservation. Thelandowners wanting to be taken offthe mailing list were not a part ofthose 71. The Golden Sands RC&Dstaff working in the Grassland Conser-vation Program then matched thelandowner’s interest with the appro-priate government agency. At thatpoint the government agency was re-sponsible for contacting thelandowner in order to determine thelandowner’s eligibility of their landfor conservation initiatives.A key informant at the Golden
Sands RC&D helped provide the re-
search team with the responses andcontact information for all of thelandowners that replied to the post-cards. Of the 71 landowners that ex-pressed interest in promotingconservation initiatives on their landonly 63 were geo-coded into pointshape files through ArcGIS becausetheir primary mailing addresses werewithin the CWGCA. Surrounding thepoint shape files (landowner’s loca-tion) a two mile buffer was used toidentify those landowners who areproximal to core grassland habitat.Landowner names and addresses werethen searched in a white pages data-base to ensure their accuracy. Thelandowners (n=27) that were proxi-mal to core grassland and had match-ing names, addresses, and telephoneaddresses were then identified as thesample for the telephone survey.Of the identified landowners
(n=27), six were not possible to con-tact (reasons including disconnectedtelephones, landowners moving, anddeceased), leaving a total of 21landowners on the list. Of the 21landowners, there were 14 who fullycompleted the telephone survey yield-ing a response rate of 66.6%. Datawere then cleaned for responseswhich were incomplete to negate theproblematic issues associated withcomputations.Figure 3 displays the identification
of the landowners who have expressedboth interest in promoting grasslandconservation efforts in the CWGCAand are proximal to grassland habitat.Tiger Roads data were clipped intothe 6-county CWGCA area from theWisconsin Map data. The buffer toolwas then applied to the point shapefiles that represented the landownerswho expressed interest in grassland

Figure 3. Twenty-four landowner’s were identified through geocoding addresses within a 2 milebuffer of core grasslands. Please note that the 2 mile buffers indicating landowners in this imagehas been purposefully distorted to restrict information that may be used to identify specificlandowners.
The Passenger Pigeon, Vol. 75, No. 4, 2013 405
conservation initiatives within theCWGCA. A buffer of two miles wasused to determine which landownersown parcels in proximity to grasslandcore habitat.
Step 2: Telephone Survey Design—
Landowners within the CWGCAwere identified as being both inter-ested in promoting grassland conser-vation initiatives on their lands andowning parcels of land within twomiles of core habitat. The CWGCALandowners Survey was designed togather a better understanding of theinvolvement of landowners in CWGCAlandscape planning, landowners expe-rience interacting with governmentagents, and their communication
preferences. Literature on the spec-trum of public participation (Arnstein1969) also provided topics for surveydesign.The variables that were meas-ured in the telephone interview in-clude:
• Landowner’s attitudes towardgovernment agent’s and agenciesability to communicate.
• Landowner’s involvement in theCWGCA.
• Landowner’s trust in governmentagencies involved in the CWGCA.
The CWGCA Landowner Surveyand script was developed firstly on anonline survey web-site (surveymon-key.com) to ensure accuracy of resultswhile telephoning landowners. Before

406 Strategic Conservation Planning
telephoning landowners an introduc-tory letter was sent in the mail to alllandowners on the survey list statinginformation about the purpose of theresearch and to expect a telephonecall (Dillman 2000). All questions forthe telephone survey were quantita-tive in nature utilizing binary or Lik-ert-type scaling systems. The finalquestion was open ended and askedabout thoughts toward the future.The research team typed responseswhile on the phone with the survey re-spondents.
RESULTS
The research objectives were suc-cessfully implemented as indicatedabove, yielding results both geo-graphic and quantitative in content.The following section is divided intotwo parts: the landscape inventory andthe quantitative results of the tele-phone survey. Following the results adiscussion will provide insight intohow both objectives interact with eachother.
Objective 1 Results: Core Grassland—
The following is an account of thefragmented grassland acres in the six-county grassland analysis. Approxi-mately 10% of the six county area iscomprised of grass parcels. Thesenumbers are an approximation basedon conversion of raster cells intoacres:
• 2,654 acres of core grasslandhabitat;
• 6,338 acres of perforated grass;• 23,068 acres of edge grass; and,• 377,443 acres of grass patches.
Most striking in regards to the frag-mentation analysis are the thousandsof acres of grass patches (approxi-mately 377,443 acres) within theCWGCA six-county area, while onlyapproximately 2,654 acres are in coregrassland. This indicates that whilegrassland is abundant, it is highlyfragmented and in small acreageclusters. Additionally, the relativeabundance of perforated (approxi-mately 6,338 acres) and edge (ap-proximately 23,068 acres) grasslandidentified by the fragmentationanalysis indicates that existing coregrassland area could be enhancedthrough the management of keyparcels. This can be seen in Figure 2where Buena Vista, which is managedfor the Greater Prairie-Chicken andgrassland, has potential to increasequickly the size of core grasslandhabitat. Once again we see manage-ment challenges in the CWGCA, asefforts to promote habitat connectiv-ity that enables species to move aboutthe landscape may not be supportingthe core habitat that is integral to theGreater Prairie-Chicken survival(Hodgson et al. 2009).
Objective 2 Results: Telephone Survey—
The results of objective 2 revealedthe landowners’ involvement with theCWGCA, their experience communi-cating with government agents, andtheir trust in the government agen-cies. Although this was a preliminarystudy, lacking an ideal sample size tomake broader generalizations, thereare still trends and overwhelmingagreement among this sample oflandowners on many topics that areimportant to future work in theCWGCA.

Figure 4. Landowner Visits to the CWGCA. Horizontal axis displays the frequency of visits, whereasthe vertical axis displays the number of respondents that indicated their visitation to the CWGCA.
Figure 5. Respondents Involvement in the CWGCA. The horizontal axis represents severalstatements that indicate the involvement of the respondents; the vertical axis represents thepercentage of respondents who have indicated their involvement. Seventy percent of therespondents indicated that they knew about the Greater Prairie-Chicken Festival, whereas 0%indicated that they have ever been a part of the decision-making process.
The Passenger Pigeon, Vol. 75, No. 4, 2013 407
Objective 2 Results: Landowner
Involvement—
Figure 4 represents the landowners’(n=14) experience visiting theWildlife Areas (Buena Vista, Leola,Paul J. Olson, Mead). The vertical axispresents the number of landownerswho responded to the according fre-
quency visits. Fifty-seven percent ofthe respondents indicated that theyhave never been to any of the CWGCAWildlife Areas mentioned above.Figure 5 displays the respondents’
average involvement in the CWGCA.The horizontal axis presents severalstatements which indicate involve-ment. The vertical axis represents per-
All these charts in
this article also
were forced to 300
dpi. They will work
if the quality is ac-
ceptable to you.

Figure 6. Agency communication skills. A Likert-type scale was utilized to understand therespondent’s agreement level to several statements about government agent’s communicationskills. The horizontal axis represents several statements about government agent.
408 Strategic Conservation Planning
centage of respondents that answeredyes to the statements.Results indicate that 70% of the re-
spondents (n=14) stated that they areaware that there is a Greater Prairie-Chicken Festival which occurs yearly inmid-April, yet only 14% of the respon-dents (n=14) stated that they have at-tended the festival. Sixty-four percentof the respondents (n=14) stated thatthey are aware of the goals of theCWGCA; however, only 17% of the re-spondents (n=12) stated that they areaware of how to be actively involved inthe CWGCA landscape decision-making processes. These numbers maystem from the fact that only 15% of therespondents (n=13) stated that theyhad been invited to stakeholder meet-ings that take place for the CWGCA.Lastly, 0% of the respondents (n=13)stated that they have ever been a partof making decisions for the future ofthe CWGCA.
Objective 2 Results: Communicationwith Government Agents—
Figure 6 conveys three statementsthat were asked of the respondents toindicate their experience with govern-ment agents’ communications skills. ALikert-type scale was utilized to accu-rately understand the attitudes towardthe ability of government agents tocommunicate effectively. The horizon-tal axis represents the statements ofthe respondents and the vertical axisrepresents their agreement, wherenegative 1 is disagreement, 0 indicatesneutrality, and positive 1 is an agree-ment to the statement.Respondents (n=12) generally dis-
agreed about the statement “govern-ment agents understand yourpriorities as a landowner” with a meanof –0.31. Respondents (n=13) indi-cated that there is a slight agreementabout the statement “governmentagents communication skills are effec-tive” with a mean of 0.07, while a large
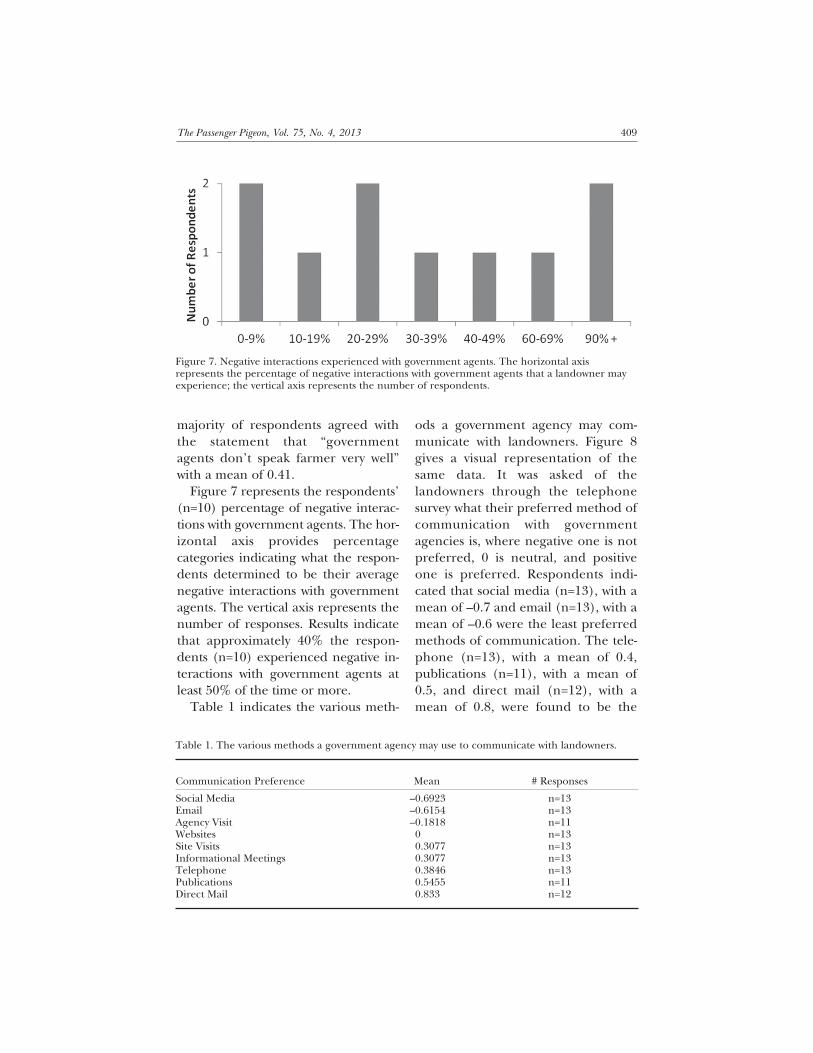
Figure 7. Negative interactions experienced with government agents. The horizontal axisrepresents the percentage of negative interactions with government agents that a landowner mayexperience; the vertical axis represents the number of respondents.
Table 1. The various methods a government agency may use to communicate with landowners.
Communication Preference Mean # Responses
Social Media –0.6923 n=13Email –0.6154 n=13Agency Visit –0.1818 n=11Websites 0 n=13Site Visits 0.3077 n=13Informational Meetings 0.3077 n=13Telephone 0.3846 n=13Publications 0.5455 n=11Direct Mail 0.833 n=12
The Passenger Pigeon, Vol. 75, No. 4, 2013 409
majority of respondents agreed withthe statement that “governmentagents don’t speak farmer very well”with a mean of 0.41.Figure 7 represents the respondents’
(n=10) percentage of negative interac-tions with government agents. The hor-izontal axis provides percentagecategories indicating what the respon-dents determined to be their averagenegative interactions with governmentagents. The vertical axis represents thenumber of responses. Results indicatethat approximately 40% the respon-dents (n=10) experienced negative in-teractions with government agents atleast 50% of the time or more.Table 1 indicates the various meth-
ods a government agency may com-municate with landowners. Figure 8gives a visual representation of thesame data. It was asked of thelandowners through the telephonesurvey what their preferred method ofcommunication with governmentagencies is, where negative one is notpreferred, 0 is neutral, and positiveone is preferred. Respondents indi-cated that social media (n=13), with amean of –0.7 and email (n=13), with amean of –0.6 were the least preferredmethods of communication. The tele-phone (n=13), with a mean of 0.4,publications (n=11), with a mean of0.5, and direct mail (n=12), with amean of 0.8, were found to be the

Figure 8. Preferred communication methods. The horizontal axis displays the spectrum ofcommunication methods; the vertical axis illustrates the average respondent’s preference towardthe communication method. –1 is not preferred, 0 is neutral, and +1 is preferred
Figure 9. Respondents experience working with agencies in the CWGCA. The horizontal axis liststhe different agencies working in the CWGCA; the vertical axis represents the percentage ofrespondents who have previously, or currently are, working with those agencies.
410 Strategic Conservation Planning
most preferred method to communi-cate. Please note that it was direct mailthat provided contact information ofthis sample.
Objective 2 Results:
Trust in Government Agencies—
Figure 9 illustrates the respondentswho have previously worked with, or
are currently working with, the gov-ernment agencies that are involved inthe CWGCA. The horizontal axis illus-trates the agencies which are active inthe CWGCA, whereas the vertical axisconveys the percentage of the respon-dents that stated yes to working withthe agencies at any given time. Fifty-seven percent of the respondents

Figure 10. Respondents trust in agencies. The horizontal axis list the agencies working in theCWGCA; the vertical axis indicates the respondent’s agreement, where 0 = neutral and +1 = likelyto work with the agency in the future.
The Passenger Pigeon, Vol. 75, No. 4, 2013 411
(n=14) stated that they have had a his-tory working with the FSA while 14%of the respondents (n=14) stated thatthey have worked with the NRCS.Eight percent of the respondents(n=13) stated that they have workedwith the USFWS, while 46% of the re-spondents (n=13) stated that theyhave worked with the DNR.Figure 10 displays the results of the
respondents’ trust in the agenciesworking in the CWGCA by utilizing aLikert-type scale. The horizontal axislists the agencies working in theCWGCA whereas the vertical axis indi-cates the respondent’s agreement,where 0 = neutral and +1 is likely towork with the agency in the future. Re-spondents (n=14) indicated a slightlikelihood to work with NRCS, with amean of 0.14 likelihood, whereas re-spondents (n=11) provided overallneutrality toward the NRCS, with amean of 0.0. Respondents (n=14) indi-cated a near neutral likelihood to work
with the USFWS, with a mean of 0.07,while the respondents (n=14) were themost likely to work with the DNR inthe future, with a mean of 0.57.
Discussion
The results of both the geo-spatialanalysis and quantitative researchcompleted through the telephone sur-vey provide many aspects to discussabout the future of the CWGCA. Whatwe can observe through the variousmaps presented in the results sectionsclearly indicates the likely areas ofgrassland expansion, as well as theareas that would not be effective topursue for grassland expansion.There are three apparent results fromthe geo-spatial analysis. The first isthat the Wisconsin River appears to befunctioning as a barrier between thenorthern and southern parts of theCWGCA. This suggests that theCWGCA could be managed differ-ently, with one grassland complex an-
chored in Paul J. Olson in the northand Buena Vista anchoring the south.The second result indicates that thereis a need to prioritize investments forcore habitat by focusing on connectiv-ity and restoration within existinggrassland habitat hotspots. This invest-ment for core habitat is especially im-portant in a world where climatechange and extreme weather eventsare anticipated (Hodgson et al. 2009).The landscapes, land uses, and demo-graphics of the CWGCA also ought tobe inspected further since landownershave different values throughout thearea. Thirdly, efforts to expand thecore grassland complexes may benefitfrom looking for opportunities in thenorthwest of the northern section ofthe CWGCA, as the southern sectionalready houses several large core areaslacking in other parts of the CWGCA.The telephone survey provided in-
formation directly from the type oflandowners that have indicated theirinterest in providing grassland conser-vation initiatives on their land. In re-gards to the respondent’s involvementwith the CWGCA it is shown that re-spondents have heard of the GreaterPrairie-Chicken Festival, although gen-erally do not attend. It is also shownthat they know about the goals of theCWGCA, but are not aware of how tobe involved. These results illustrate thedisconnect between the CWGCA andthe people living in the immediatearea. Furthermore, a majority of therespondents state that they have neveronce been out to the CWGCA WildlifeAreas. Other results show that only afew landowners have been invited toCWGCA meetings, but none of themresponded stating that they have beeninvolved in the landscape decision-making process. These results strongly
suggest that the government agenciesinvolved in the CWGCA initiatives canbenefit from enhancing their efforts togather input from landowners in theCWGCA, but face a public that cur-rently appears to be uninvolved in anytype of collaborative process. The geo-spatial analyses of this research projectcannot ensure a public that will be in-terested in participating; however, themethods undertaken for this researchhave utilized a tool which allowed in-sight into the types of landowners thatare willing to implement conservationpractices on their property. Geo-spa-tial analysis provides a tool for man-agers to respond to the complexnatural resource problems at a land-scape scale (Thompson et al. 2011).Results of the communication sec-
tion of the telephone survey indicatethat government agents are not ex-celling at understanding the prioritiesof the landowners, nor able to effec-tively relate to farmers. These resultsfurther support the results of the over-whelming percentage of frequent neg-ative interactions. The results alonestrongly illustrate the necessity for gov-ernment agents both to develop theirunderstanding of the priorities of thelandowners in the CWGCA and to im-prove their communication methods.Respondents also indicated which
agencies they have worked with previ-ously as well as the likelihood of work-ing with agencies in the future. Whatis notable about these differences isthat fewer respondents would be likelyto work with the FSA in the future.This can be dually noted for theNRCS. On the flipside, many respon-dents stated that they have workedwith the WDNR in the past and indi-cated that they are likely to continueto work with WDNR in the future.
412 Strategic Conservation Planning

CONCLUSION
The CWGCA boasts some of thebest open landscapes east of the Mis-sissippi, yet the decline of the indica-tor species, the Greater Prairie-Chicken, displays an overall negativetrend for the health of this grassland.While there are limitations in thesmall sample of landowners surveyedfor this research, our findings suggestthat a strategic conservation planningprocess that creates opportunities forlandowners in the CWGCA to discussthe future that they envision for thislandscape can provide benefits and re-solve some of the on-going challengesin managing for grassland habitat.For a successful strategic conserva-
tion planning process in the CWGCAthe involvement and work of a widediversity of partners and stakeholdersis required to obtain a sense of sharedownership on the landscape. By in-volving a wide variety of stakeholdersworking towards a collective vision ef-forts are likely to be a success (Gray1989). In situations where the com-munity has minimal connection to“place,” it has been shown that build-ing trust is problematic and such ef-forts are likely to be undermined bynon-local and economic forces (Ar-mitage et al. 2009). It is integral thatstakeholders affected by decisions un-derstand ecological data and analysis;otherwise, approaches may be seen asexcessively technical and discourageefforts (Theobald et al. 2000).It is not likely that any single agency
or organization has the ability toachieve a successful CWGCA on itsown. Collaboration through the part-nering of the different stakeholders inthe CWGCA is likely to provide direc-tion to each stakeholder on how to ef-
fectively implement appropriate tasksbased on the abilities and strengths ofthat stakeholder.
GEOSPATIAL
A 6-county CWGCA managementregime comes across as a grand visionwhich is short on focused detail. Theneed to re-examine the CWGCA withmore detail requires a focused strat-egy that identifies and prioritizes par-ticular parcels of grasslands. Theadvantage to focusing on strategicparcels allows managers to concen-trate acquisition, management, andcommunity engagement resources towhere they are needed the most andwhere they will do the most good. Thedata show that there are a lot ofparcels of grass on the landscape (ap-proximately 377,000 acres); yet lessthan 3,000 acres are considered corehabitat when running the fragmenta-tion tool. This provides a further ques-tion as to how (and where) the 22,000acres of grassland cited in the GreaterPrairie-Chicken Management Plan ismanaged (WDNR 2013B). Managerslooking to expand core grasslandhabitat now have the tools to priori-tize parcels, identify the landowner ofspecific parcels, and engage specificcommunities to garner the supportneeded in directed manner necessaryfor success. The search for core habi-tat through the fragmentation toolprovides quantifiable measurementsof grassland in the CWGCA. Knowingthe amount and location of core habi-tat in the CWGCA is one of the mostimportant findings of this researchproject and is worth further investiga-tion.
The Passenger Pigeon, Vol. 75, No. 4, 2013 413

414 Strategic Conservation Planning
ATTITUDES AND VALUES
The future of the CWGCA relies ondeveloping a strong understanding ofthe priorities and values of thelandowners in the CWGCA. TheCWGCA landscape is a landscapedominated by many types of agricul-ture production and that dominanceis not likely to change. If conservationis to take place on this landscape itmust do so in a way that is acceptableand compatible to the value systems ofagricultural producers of the region.The respondents of the telephone sur-vey show that there are an unaccept-able number of negative interactionswith government agents that regularlyoccur. The regular negative interac-tions that landowners experience arebacked with further data which indi-cates that firstly landowners believethat government agents do not under-stand their priorities, and secondlygovernment agents are not able to re-late adequately. Although the findingsare negative, it is noteworthy that themajority of the respondents did statethat they are likely to work with theWDNR in the future. This positive in-dication among key landowners pro-vides a platform for this agency todirect future outreach activities.Data from the telephone survey also
indicate that landowners are mini-mally involved in the CWGCA at thistime. Landowners have heard about aGreater Prairie-Chicken festival andare familiar with the goals of CWGCAinitiatives; however, invitations forlandowners to participate, knowledgeon how to participate effectively, andexperience in being a part of the deci-sion-making process are nominal tonon-existent.Another indicator of landowner in-
volovment in the CWGCA comingfrom the survey is the fact that manylandowners are not visiting thewildlife areas on the landscape. Thisfinding of minimal visits coupled withlandowners not attending festivals,not attending meetings, not seeingtheir input considered for manage-ment, and only 71 or 1,605 replyingwith a post card expressing interestclearly displays a lack of landowner in-volvement. Landowner connection tothe landscape right in their backyardsis a basic initiative that must be pur-sued to have a public that cares abouttheir landscape. Having involved citi-zens is the key to real conservation,not the number of projects completedin the name of conservation, or, asLeopold once stated “. . . The acreagebought for public parks or forests isnot the thing; what matters is whetherprivate landowners regard theirforests and their landscapes as a pub-lic trust.” (Leopold 1937).Land-use planning in the CWGCA
for both the public and private enti-ties must identify and build upon theshared values that are held. It is neces-sary to bring multiple stakeholders tothe table in order to create a formal-ized and fair decision-making processthat is necessary for the future of theCWGCA. Without a clear CWGCAgovernance structure in place, the dis-cussions, meetings, and public inputhearings are less than likely to yieldthe results necessary for the changestoward collaboration that are neededon this landscape. A priority for theCWGCA Partnership is to construct agovernance system with a protocol formaking decisions. When a protocolfor decision-making is in place, finaloutcomes are more likely to be ac-cepted even by those who are op-

The Passenger Pigeon, Vol. 75, No. 4, 2013 415
posed, because those who opposedhad an opportunity to voice their con-cerns and opinions.
ACKNOWLEDGMENTS
The authors would like to thankSharon Schwab, CWGCA PartnershipCoordinator from 2005 to 2013, forher role in the development of this re-search.
LITERATURE CITED
Adams, J. S. 2006. The future of the wild: radi-cal conservation for a crowded world. BeaconPress.
Amundsen, O. M. 2011. Strategic conservationplanning. Land Trust Alliance.
Angelstam, P., G. Mikusinski, B. I. Rönnbäck, A.Östman, M. Lazdinis, J. M. Roberge, and J.Olsson. 2003. Two-dimensional gap analysis: atool for efficient conservation planning andbiodiversity policy implementation. AMBIO:A Journal of the Human Environment 32(8):527–534.
Arnstein, S. R. 1969. A ladder of citizen partici-pation. Journal of the American Institute ofplanners 35(4): 216–224.
Beger, M., H. S. Grantham, R. L. Pressey, K. A.Wilson, E. L. Peterson, D. Dorfman, and H. P.Possingham. 2010. Conservation planning forconnectivity across marine, freshwater, andterrestrial realms. Biological Conservation143(3): 565–575.
Campbell, H. and R. Marshall. 2000. Public in-volvement and planning: looking beyond theone to the many. International PlanningStudies 5(3): 321–344.
Connelly, J. W., S. T. Knick, M. A. Schroeder,and S. J. Stiver. 2004, June. Conservation as-sessment of Greater Sage Grouse and sage-brush habitats. Cheyenne, WY: WesternAssociation of Fish and Wildlife Agencies.
Dillman, D. A. 2000. Mail and internet surveys:The tailored design method. John Wiley &Sons.
Gray, B. 1989. Collaborating: Finding commonground for multi-party problems. Sand Fran-cisco, CA. Jossey-Bass.
Hodgson, J. A., C. D. Thomas, B. A. Wintle, andA. Moilanen. 2009. Climate change, connec-tivity, and conservation decision-making:back to basics. Journal of Applied Ecology46: 964–969.
Iowa State University. 2008. A targeted conser-
vation approach for improving environmen-tal quality. Retrieved 28 May 2013 fromhttp://www.extension.iastate.edu/Publications/PMR1002.pdf
Leopold, A. 1937. Conservation Blueprints, pp.401–404 in A Sand County Almanac andOther Writings on Ecology and Conserva-tion, Curt Meine, editor. 2013. The Libraryof America, New York.
Parent, J., D. L. Civco, and J. Hurd. 2007. Simu-lating Future Forest Fragmentation in a Con-necticut Region Undergoing Suburbaniza-tion. Proc. 2007 ASPRS Annual Convention,Tampa, FL 11 p.
Pressey, R. L., M. Cabeza, M. E. Watts, R. M.Cowling, and K. A. Wilson. 2007. Conserva-tion planning in a changing world. Trends inEcology & Evolution 22(11): 583–592.
Riddle, J., S. Hull, L. Kardash, and E. Grossman.2013. Estimates of Greater Prairie-ChickenPopulation Trends, Detection Probability,and Lek Abundance. Wisconsin GreaterPrairie-Chicken Conservation Genetics PanelMeeting, Madison, WI.
Smith, J. L. 2008. A critical appreciation of the“bottom-up” approach to sustainable watermanagement: embracing complexity ratherthan desirability. Local Environment 13(4):353–366.
Theobald, D. M., N. T. Hobbs, T. Bearly, J. A.Zack, T. Shenk, and W. E. Riebsame. 2000.Incorporating biological information in localland-use decision making: designing a systemfor conservation planning. Landscape ecol-ogy 15(1): 35–45.
Thompson, A. W., L. S. Prokopy, K. Floress, andD. C. Weinkauf. 2011. A Method for Incorpo-rating Community Priorities into GIS Chal-lenges, Choices, and Directions forLandscape Planners. Landscape Journal30(2): 299–312.
USDA, National Agricultural Statistics Service.2010 Wisconsin Cropland Data Layer: 2010Edition
Wisconsin Department of Natural Resources.Central Wisconsin Grassland ConservationArea [Map], Retrieved 8 March 2013 from:http://dnr.wi.gov/topic/lands/Grasslands/documents/cwgca.pdf
Wisconsin Department of Natural Resources.Wisconsin Greater Prairie-Chicken Manage-ment Plan 2004–2014 [Management Plan],Retrieved 8 March 2013
Anthony K. Sharp completed this researchproject as part of his Masters of Science de-gree in the Human Dimensions of NaturalResource Management through the Univer-
416
Osprey as seen by Dennis Connell
sity of Wisconsin-Stevens Point. He is nowa Research Social Scientist working for theWisconsin Department of Natural Re-sources’ Science Operations Center, Madi-son, Wisconsin.
Aaron W. Thompson, PhD is an assistantprofessor of Natural Resource Planning at
the University of Wisconsin-Stevens Point.His teaching and research focus is on usingsocial data to inform collaborative action toaddress issues facing the rural landscape,including farmland preservation, habitatconnectivity, and degradation of ecologicalsystems.