strategic benefits-health care
TRANSCRIPT
January 22, 2015
SHRM Survey Findings: 2014 Strategic Benefits—
Health Care
2
Introduction
The 2014 Strategic Benefits Survey, administered annually since 2012 by the Society for Human
Resource Management (SHRM), is used to determine whether various employee benefits are
leveraged to recruit and retain top talent. This research study, split into a six-part series, features the
following topics:
Part 1: Wellness Initiatives
Part 2: Flexible Work Arrangements
Part 3: Health Care
Part 4: Leveraging Benefits to Retain Employees
Part 5: Leveraging Benefits to Recruit Employees
Part 6: Communicating Benefits
Definitions
For the purpose of this survey, total health care costs include employer-paid premiums, administration
costs and any individual medical claims covered by the employer.
2014 Strategic Benefits Survey—Health Care ©SHRM 2015
Introduction and Definitions
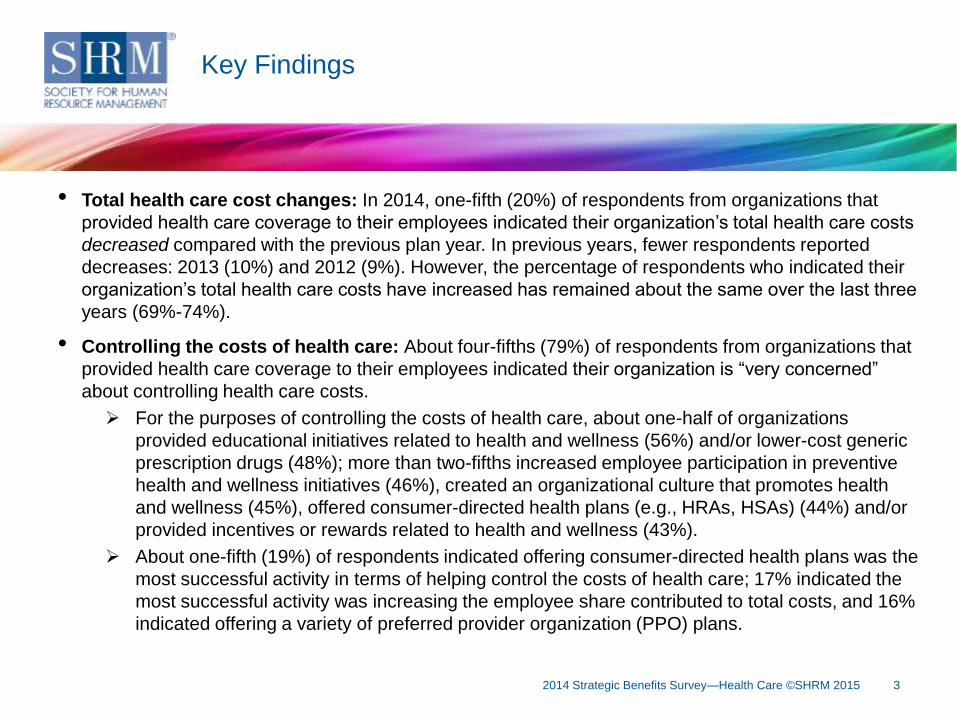
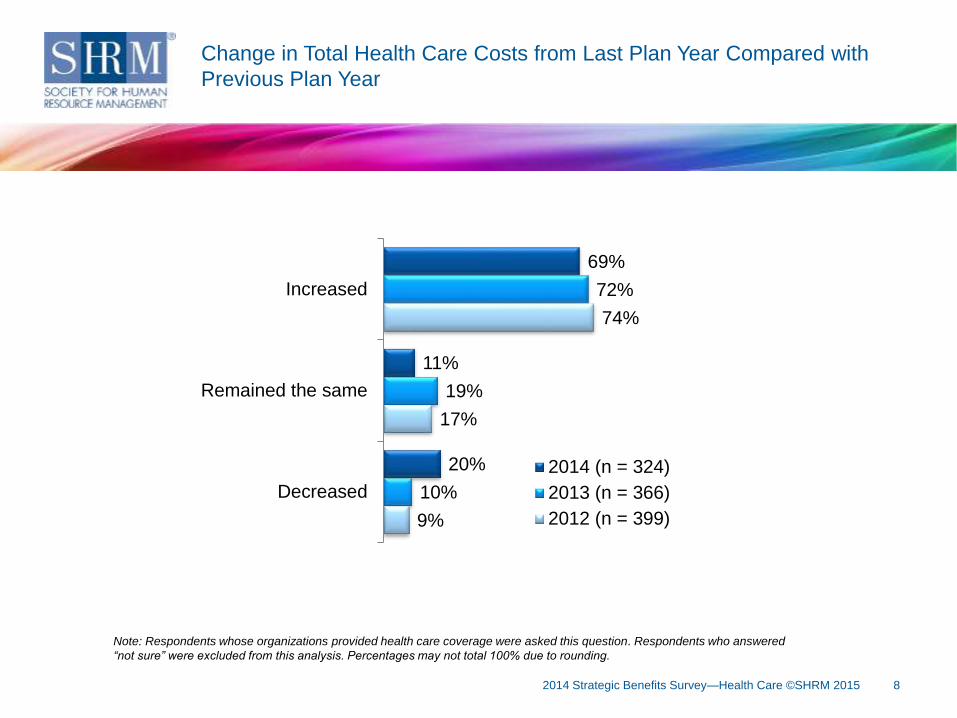
• Total health care cost changes: In 2014, one-fifth (20%) of respondents from organizations that
provided health care coverage to their employees indicated their organization’s total health care costs
decreased compared with the previous plan year. In previous years, fewer respondents reported
decreases: 2013 (10%) and 2012 (9%). However, the percentage of respondents who indicated their
organization’s total health care costs have increased has remained about the same over the last three
years (69%-74%).
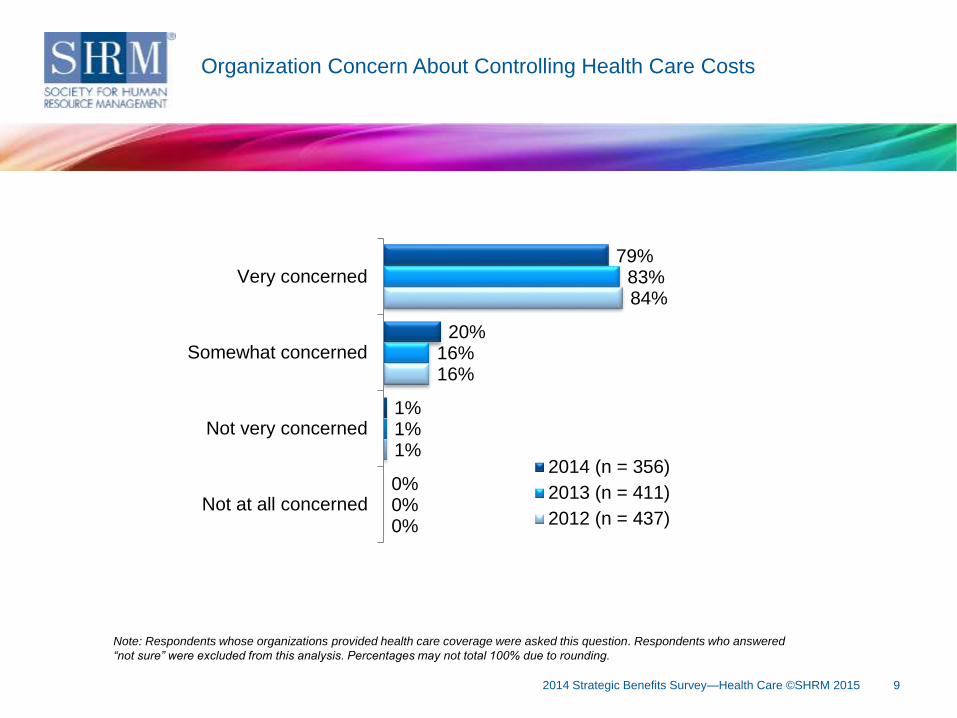
• Controlling the costs of health care: About four-fifths (79%) of respondents from organizations that
provided health care coverage to their employees indicated their organization is “very concerned”
about controlling health care costs.
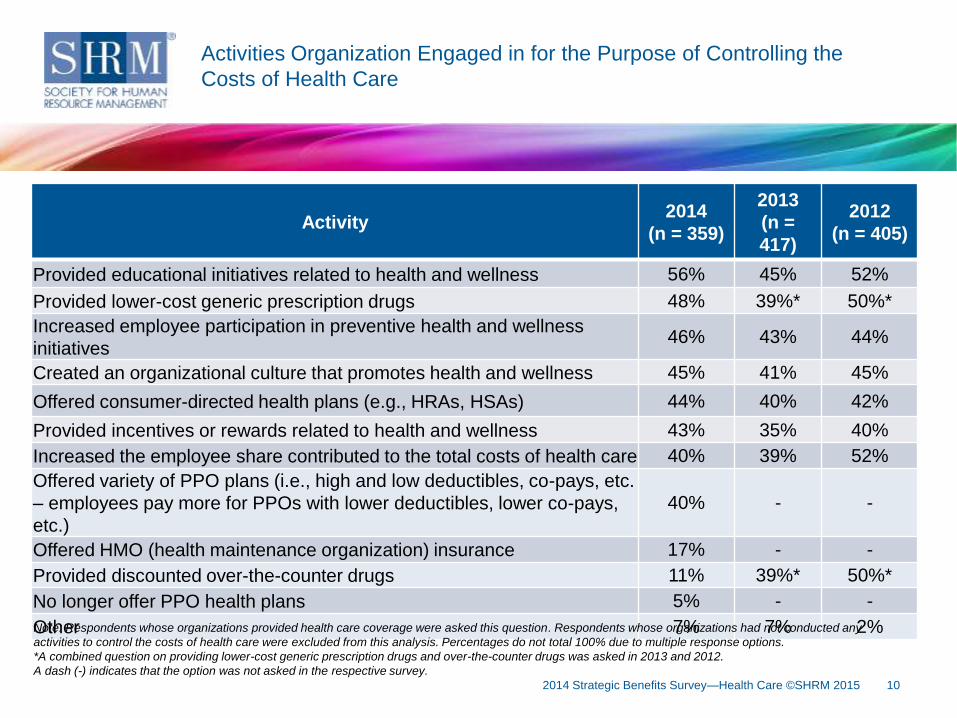
For the purposes of controlling the costs of health care, about one-half of organizations
provided educational initiatives related to health and wellness (56%) and/or lower-cost generic
prescription drugs (48%); more than two-fifths increased employee participation in preventive
health and wellness initiatives (46%), created an organizational culture that promotes health
and wellness (45%), offered consumer-directed health plans (e.g., HRAs, HSAs) (44%) and/or
provided incentives or rewards related to health and wellness (43%).
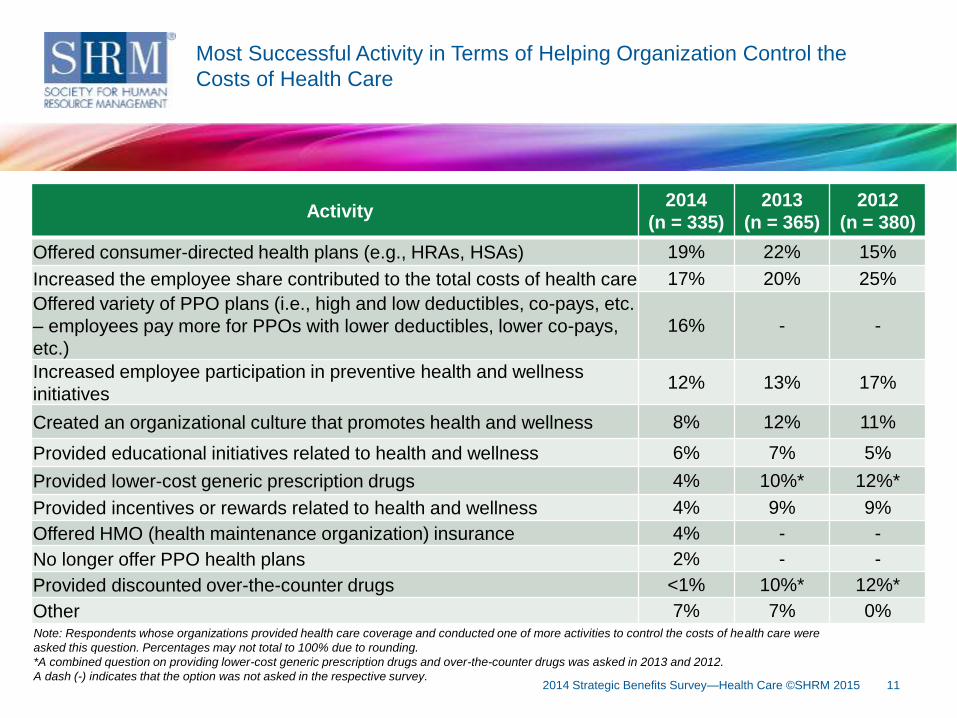
About one-fifth (19%) of respondents indicated offering consumer-directed health plans was the
most successful activity in terms of helping control the costs of health care; 17% indicated the
most successful activity was increasing the employee share contributed to total costs, and 16%
indicated offering a variety of preferred provider organization (PPO) plans.
3
Key Findings
2014 Strategic Benefits Survey—Health Care ©SHRM 2015
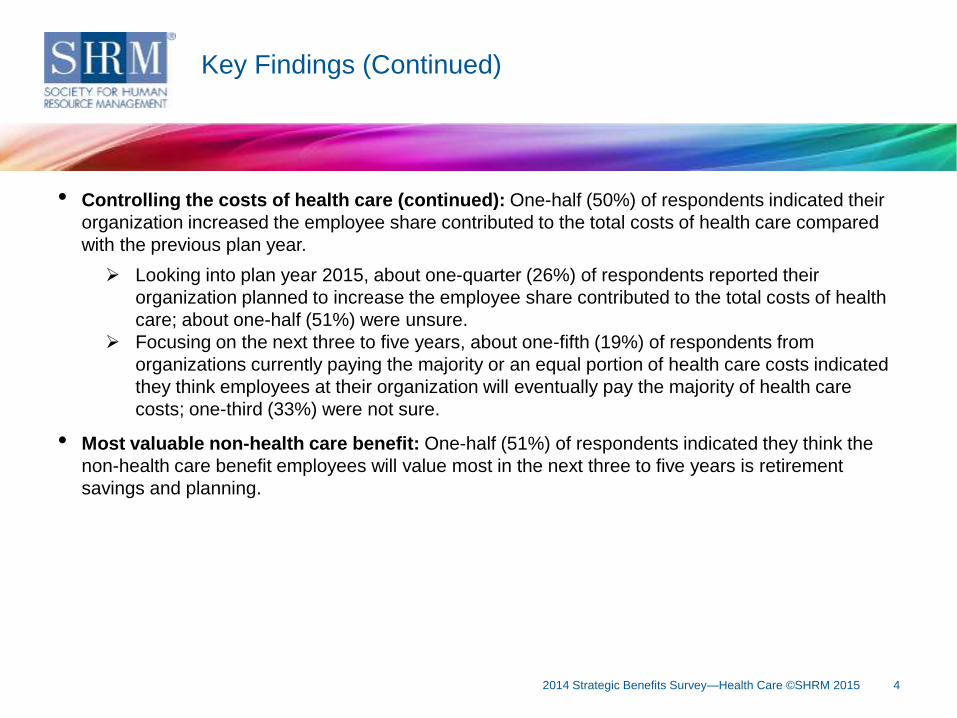
• Controlling the costs of health care (continued): One-half (50%) of respondents indicated their
organization increased the employee share contributed to the total costs of health care compared
with the previous plan year.
Looking into plan year 2015, about one-quarter (26%) of respondents reported their
organization planned to increase the employee share contributed to the total costs of health
care; about one-half (51%) were unsure.
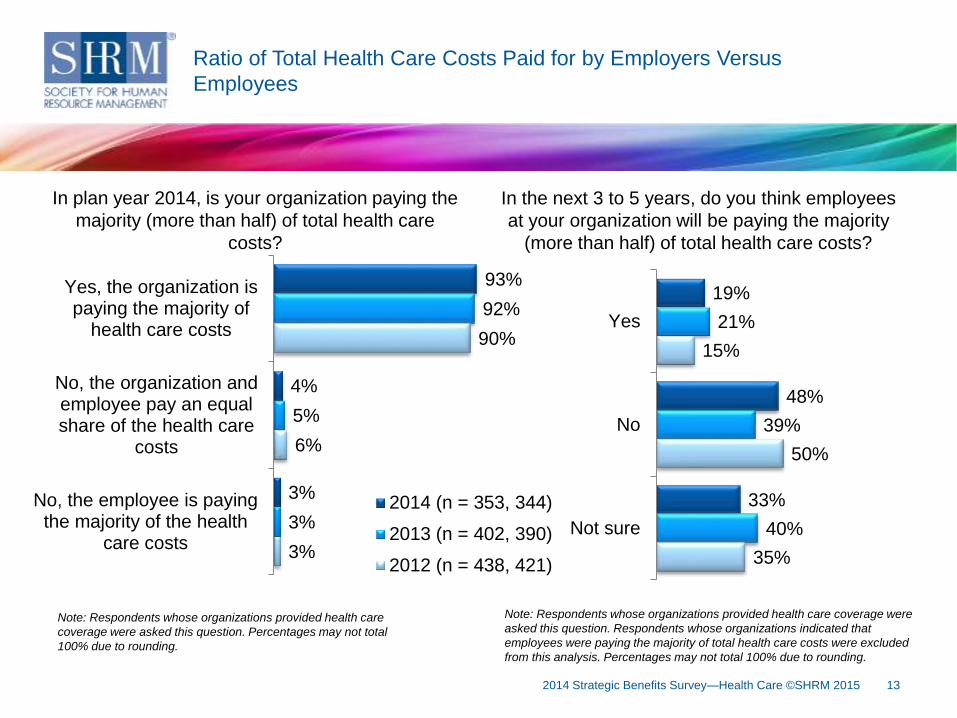
Focusing on the next three to five years, about one-fifth (19%) of respondents from
organizations currently paying the majority or an equal portion of health care costs indicated
they think employees at their organization will eventually pay the majority of health care
costs; one-third (33%) were not sure.
• Most valuable non-health care benefit: One-half (51%) of respondents indicated they think the
non-health care benefit employees will value most in the next three to five years is retirement
savings and planning.
42014 Strategic Benefits Survey—Health Care ©SHRM 2015
Key Findings (Continued)
• Managing the cost of health care is likely to remain a key focus of HR professionals for the
foreseeable future. Over the last three years, organizations have continued to express concern
about controlling health care costs, and these concerns are unlikely to abate anytime soon,
especially in light of the implementation of the employer mandate of the Affordable Care Act.
• Most employers continue to see their health care costs rising year after year, putting pressure on
HR to continue to look for cost savings. Over the last three years, more than two-thirds of
respondents indicated their organization’s total health care costs increased compared with the
previous plan year (69%-74%).
• A better understanding of how costs are being successfully managed could have a significant
impact. A small but growing number of organizations that provide health care coverage to their
employees experienced a decrease in their total health care costs—an unexpected counter-trend to
years of rising costs. A better understanding of the reasons behind these exceptions to the
dominant trend of rising costs will be important for gaining an insight into how the proportion of
costs borne by organizations and employees will evolve in the future.
5
What Do These Findings Mean for the HR Profession?
2014 Strategic Benefits Survey—Health Care ©SHRM 2015
• Wellness initiatives look set to continue to be a critical part of organizations’ strategies for
controlling health care costs. Organizations are adopting a variety of wellness offerings for
employees in an effort to promote a healthier workplace. Studies have shown that wellness
programs have an impact on health care costs, though the return can take three to five years to
see.
• Looking ahead, a growing number of employers are likely to ask employees to contribute more to
their health care costs. Shifting health care costs to employees carries a risk of decreasing
employee job satisfaction. In a healthier job market this could have real implications for attracting
talent, causing some employers to rethink their cost-shifting strategies. In some cases, HR
professionals may need to make a strong business case for continuing to invest in employee health
care benefits despite the cost.
6
What Do These Findings Mean for the HR Profession?
(Continued)
2014 Strategic Benefits Survey—Health Care ©SHRM 2015
2014 Strategic Benefits Survey—Health Care ©SHRM 2015 7
Key Findings
Health Care
8
What do these findings mean for the HR profession?Change in Total Health Care Costs from Last Plan Year Compared with
Previous Plan Year
2014 Strategic Benefits Survey—Health Care ©SHRM 2015
69%
11%
20%
72%
19%
10%
74%
17%
9%
Increased
Remained the same
Decreased
2014 (n = 324)
2013 (n = 366)
2012 (n = 399)
Note: Respondents whose organizations provided health care coverage were asked this question. Respondents who answered
“not sure” were excluded from this analysis. Percentages may not total 100% due to rounding.
9
What do these findings mean for the HR profession?Organization Concern About Controlling Health Care Costs
2014 Strategic Benefits Survey—Health Care ©SHRM 2015
79%
20%
1%
0%
83%
16%
1%
0%
84%
16%
1%
0%
Very concerned
Somewhat concerned
Not very concerned
Not at all concerned
2014 (n = 356)
2013 (n = 411)
2012 (n = 437)
Note: Respondents whose organizations provided health care coverage were asked this question. Respondents who answered
“not sure” were excluded from this analysis. Percentages may not total 100% due to rounding.
10
What do these findings mean for the HR profession?Activities Organization Engaged in for the Purpose of Controlling the
Costs of Health Care
2014 Strategic Benefits Survey—Health Care ©SHRM 2015
Activity2014
(n = 359)
2013
(n =
417)
2012
(n = 405)
Provided educational initiatives related to health and wellness 56% 45% 52%
Provided lower-cost generic prescription drugs 48% 39%* 50%*
Increased employee participation in preventive health and wellness
initiatives46% 43% 44%
Created an organizational culture that promotes health and wellness 45% 41% 45%
Offered consumer-directed health plans (e.g., HRAs, HSAs) 44% 40% 42%
Provided incentives or rewards related to health and wellness 43% 35% 40%
Increased the employee share contributed to the total costs of health care 40% 39% 52%
Offered variety of PPO plans (i.e., high and low deductibles, co-pays, etc.
– employees pay more for PPOs with lower deductibles, lower co-pays,
etc.)
40% - -
Offered HMO (health maintenance organization) insurance 17% - -
Provided discounted over-the-counter drugs 11% 39%* 50%*
No longer offer PPO health plans 5% - -
Other 7% 7% 2%Note: Respondents whose organizations provided health care coverage were asked this question. Respondents whose organizations had not conducted any
activities to control the costs of health care were excluded from this analysis. Percentages do not total 100% due to multiple response options.
*A combined question on providing lower-cost generic prescription drugs and over-the-counter drugs was asked in 2013 and 2012.
A dash (-) indicates that the option was not asked in the respective survey.
11
What do these findings mean for the HR profession?Most Successful Activity in Terms of Helping Organization Control the
Costs of Health Care
2014 Strategic Benefits Survey—Health Care ©SHRM 2015
Note: Respondents whose organizations provided health care coverage and conducted one of more activities to control the costs of health care were
asked this question. Percentages may not total to 100% due to rounding.
*A combined question on providing lower-cost generic prescription drugs and over-the-counter drugs was asked in 2013 and 2012.
A dash (-) indicates that the option was not asked in the respective survey.
Activity2014
(n = 335)
2013
(n = 365)
2012
(n = 380)
Offered consumer-directed health plans (e.g., HRAs, HSAs) 19% 22% 15%
Increased the employee share contributed to the total costs of health care 17% 20% 25%
Offered variety of PPO plans (i.e., high and low deductibles, co-pays, etc.
– employees pay more for PPOs with lower deductibles, lower co-pays,
etc.)
16% - -
Increased employee participation in preventive health and wellness
initiatives12% 13% 17%
Created an organizational culture that promotes health and wellness 8% 12% 11%
Provided educational initiatives related to health and wellness 6% 7% 5%
Provided lower-cost generic prescription drugs 4% 10%* 12%*
Provided incentives or rewards related to health and wellness 4% 9% 9%
Offered HMO (health maintenance organization) insurance 4% - -
No longer offer PPO health plans 2% - -
Provided discounted over-the-counter drugs <1% 10%* 12%*
Other 7% 7% 0%

12
What do these findings mean for the HR profession?
In the next plan year, does your organization
plan to increase the employee share
contributed to the total costs of health care?
In the current plan year, did your organization
increase the employee share contributed to the
total costs of health care compared with the
previous plan year?
Note: Respondents whose organizations provided health care
coverage were asked this question. Response options
provided were “yes/no/not sure.” Respondents who answered
“not sure” were excluded from this analysis. Only “yes”
responses are shown.
50%
45%
47%
Yes
2014 (n = 338, 357)
2013 (n = 389, 406)
2012 (n = 410, 439)
26%
23%
51%
24%
21%
55%
22%
18%
60%
Yes
No
Not sure
Note: Respondents whose organizations provided health care coverage were
asked this question.
2014 Strategic Benefits Survey—Health Care ©SHRM 2015
Change in Employee Share Contributed to Total Costs of Health Care
from Last Plan Year Compared with Previous Plan Year
13
What do these findings mean for the HR profession?Ratio of Total Health Care Costs Paid for by Employers Versus
Employees
In the next 3 to 5 years, do you think employees
at your organization will be paying the majority
(more than half) of total health care costs?
In plan year 2014, is your organization paying the
majority (more than half) of total health care
costs?
Note: Respondents whose organizations provided health care
coverage were asked this question. Percentages may not total
100% due to rounding.
19%
48%
33%
21%
39%
40%
15%
50%
35%
Yes
No
Not sure
Note: Respondents whose organizations provided health care coverage were
asked this question. Respondents whose organizations indicated that
employees were paying the majority of total health care costs were excluded
from this analysis. Percentages may not total 100% due to rounding.
2014 Strategic Benefits Survey—Health Care ©SHRM 2015
93%
4%
3%
92%
5%
3%
90%
6%
3%
Yes, the organization ispaying the majority of
health care costs
No, the organization andemployee pay an equalshare of the health care
costs
No, the employee is payingthe majority of the health
care costs
2014 (n = 353, 344)
2013 (n = 402, 390)
2012 (n = 438, 421)
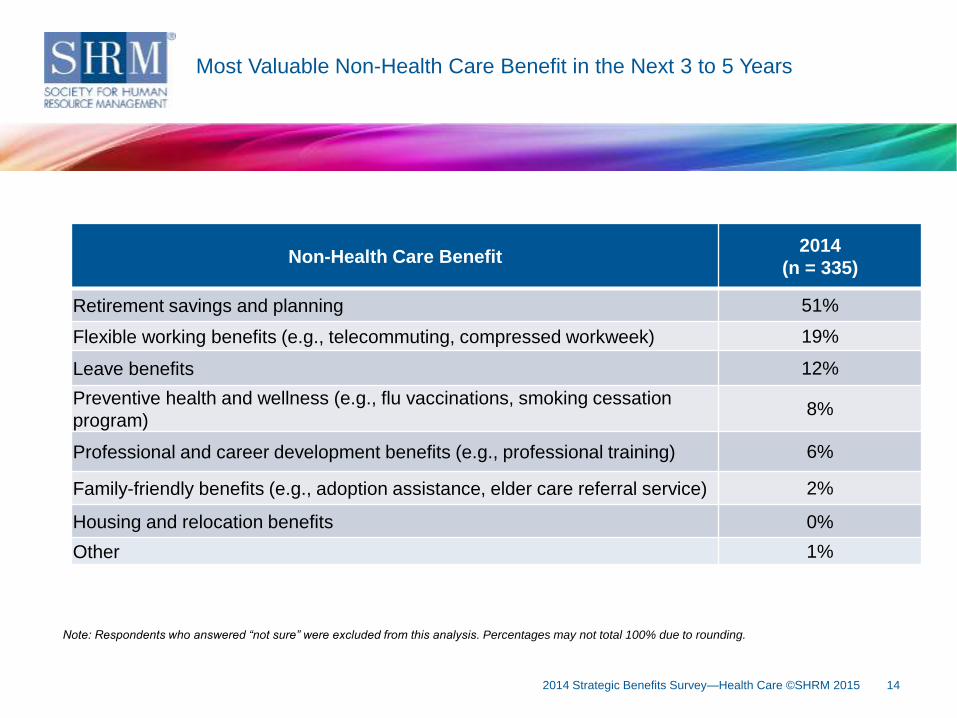
Most Valuable Non-Health Care Benefit in the Next 3 to 5 Years
142014 Strategic Benefits Survey—Health Care ©SHRM 2015
Note: Respondents who answered “not sure” were excluded from this analysis. Percentages may not total 100% due to rounding.
Non-Health Care Benefit2014
(n = 335)
Retirement savings and planning 51%
Flexible working benefits (e.g., telecommuting, compressed workweek) 19%
Leave benefits 12%
Preventive health and wellness (e.g., flu vaccinations, smoking cessation
program)8%
Professional and career development benefits (e.g., professional training) 6%
Family-friendly benefits (e.g., adoption assistance, elder care referral service) 2%
Housing and relocation benefits 0%
Other 1%
2014 Strategic Benefits Survey—Health Care ©SHRM 2015 15
Key Findings
Demographics
16
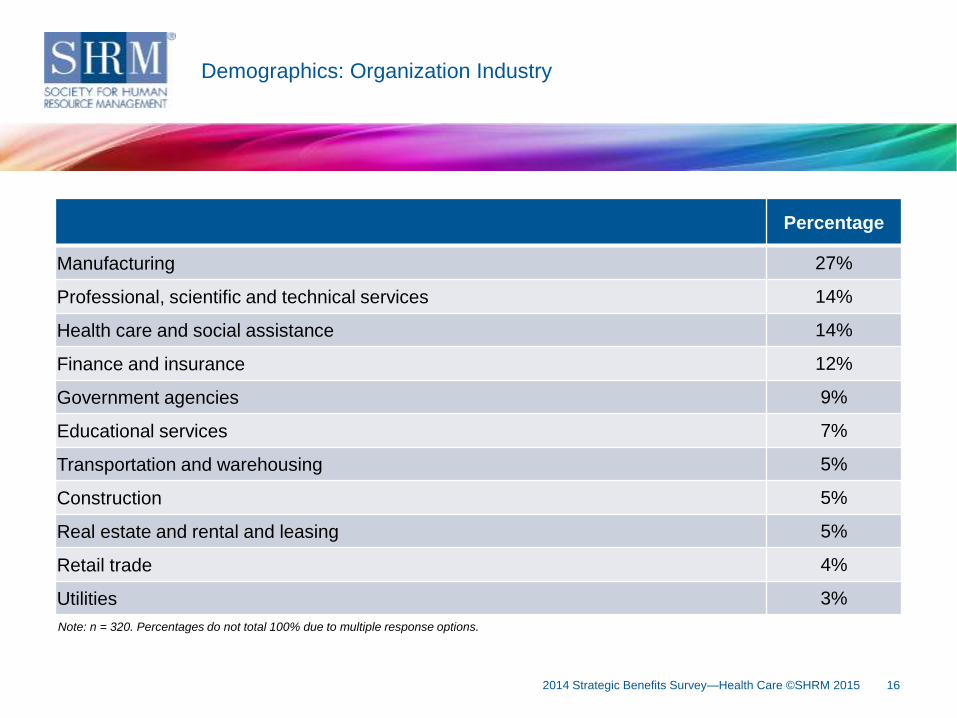
Note: n = 320. Percentages do not total 100% due to multiple response options.
Percentage
Manufacturing 27%
Professional, scientific and technical services 14%
Health care and social assistance 14%
Finance and insurance 12%
Government agencies 9%
Educational services 7%
Transportation and warehousing 5%
Construction 5%
Real estate and rental and leasing 5%
Retail trade 4%
Utilities 3%
Demographics: Organization Industry
2014 Strategic Benefits Survey—Health Care ©SHRM 2015
17
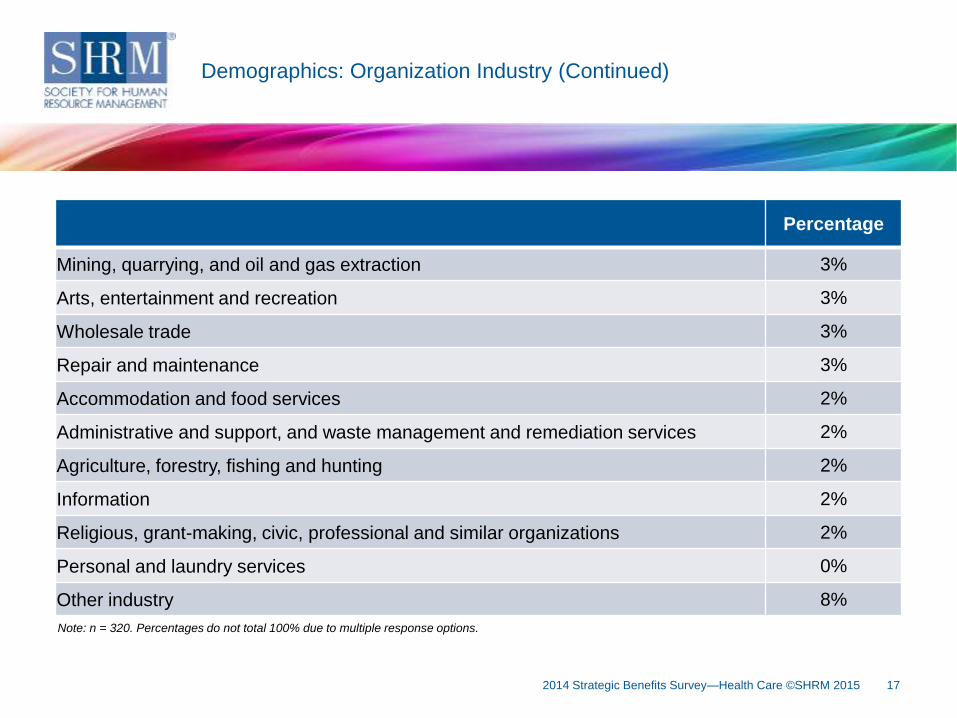
Key FinDemographics: Organization Industry (Continued)
Note: n = 320. Percentages do not total 100% due to multiple response options.
Percentage
Mining, quarrying, and oil and gas extraction 3%
Arts, entertainment and recreation 3%
Wholesale trade 3%
Repair and maintenance 3%
Accommodation and food services 2%
Administrative and support, and waste management and remediation services 2%
Agriculture, forestry, fishing and hunting 2%
Information 2%
Religious, grant-making, civic, professional and similar organizations 2%
Personal and laundry services 0%
Other industry 8%
2014 Strategic Benefits Survey—Health Care ©SHRM 2015
18
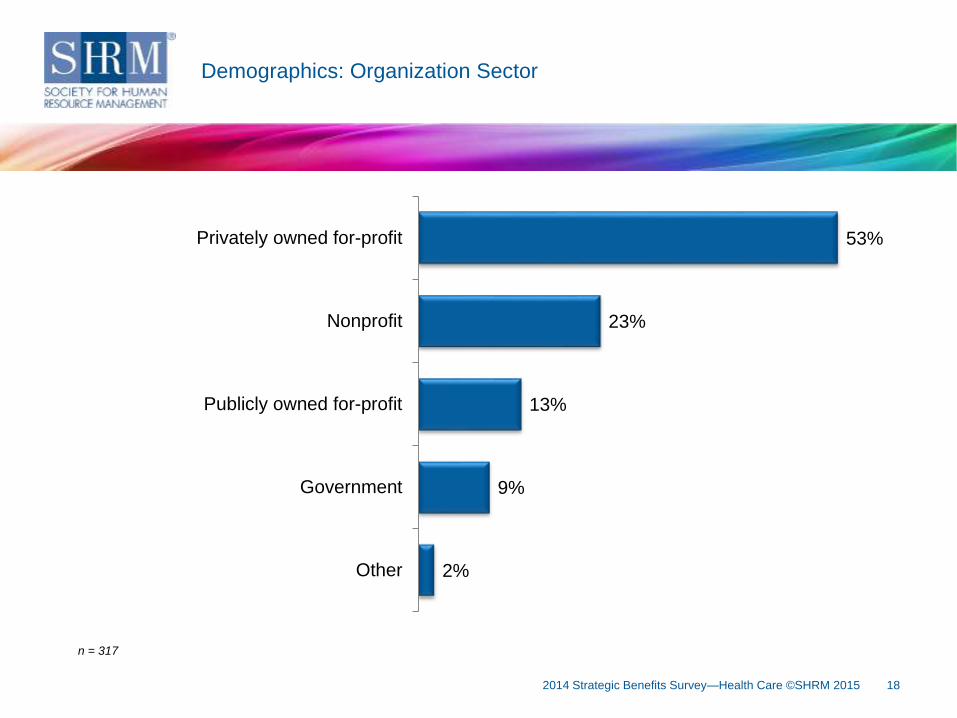
Key FinDemographics: Organization Sector
53%
23%
13%
9%
2%
Privately owned for-profit
Nonprofit
Publicly owned for-profit
Government
Other
n = 317
2014 Strategic Benefits Survey—Health Care ©SHRM 2015
19
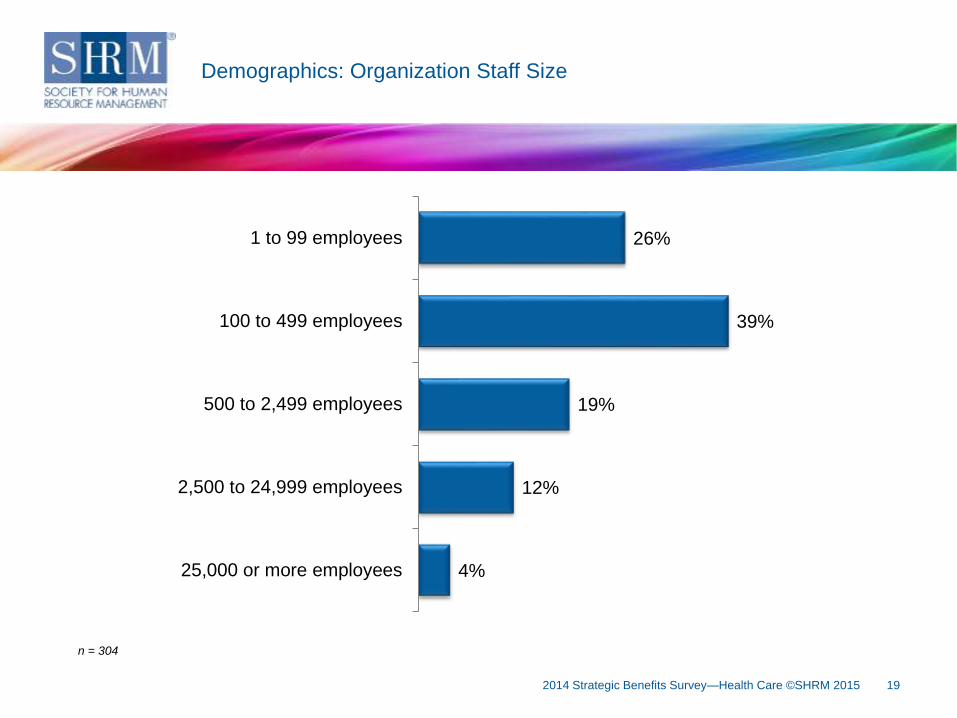
Key FinDemographics: Organization Staff Size
n = 304
26%
39%
19%
12%
4%
1 to 99 employees
100 to 499 employees
500 to 2,499 employees
2,500 to 24,999 employees
25,000 or more employees
2014 Strategic Benefits Survey—Health Care ©SHRM 2015
20
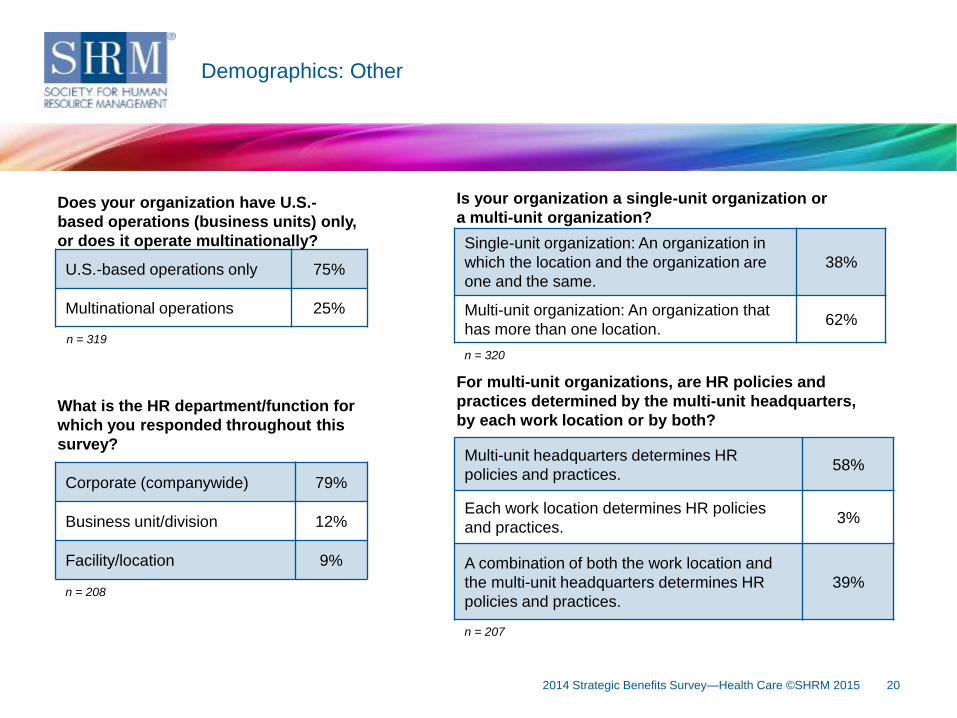
Key FinDemographics: Other
n = 319
U.S.-based operations only 75%
Multinational operations 25%
Does your organization have U.S.-
based operations (business units) only,
or does it operate multinationally?
n = 320
n = 207
n = 208
Single-unit organization: An organization in
which the location and the organization are
one and the same.
38%
Multi-unit organization: An organization that
has more than one location.62%
Is your organization a single-unit organization or
a multi-unit organization?
For multi-unit organizations, are HR policies and
practices determined by the multi-unit headquarters,
by each work location or by both?
Multi-unit headquarters determines HR
policies and practices.58%
Each work location determines HR policies
and practices.3%
A combination of both the work location and
the multi-unit headquarters determines HR
policies and practices.
39%
Corporate (companywide) 79%
Business unit/division 12%
Facility/location 9%
What is the HR department/function for
which you responded throughout this
survey?
2014 Strategic Benefits Survey—Health Care ©SHRM 2015
21
SHRM Survey Findings:
Survey Methodology
• Response rate = 10%
• 380 HR professionals from a randomly selected sample of SHRM’s membership participated in this
survey
• Margin of error +/- 5%
• Survey fielded April-May 2014
Survey Methodology
2014 Strategic Benefits Survey—Health Care ©SHRM 2015
22
For more survey/poll findings, visit shrm.org/surveys
For more information about SHRM’s Customized Research Services, visit
shrm.org/customizedresearch
Follow us on Twitter @SHRM_Research
2014 Strategic Benefits Survey—Health Care ©SHRM 2015
About SHRM Research
Project lead:
Karen Wessels, researcher, SHRM Research
Project contributors:
Evren Esen, director, SHRM-SCP, Survey Programs, SHRM Research
Alexander Alonso, Ph.D., SHRM-SCP, vice president, SHRM Research
Jennifer Schramm, manager, SHRM-SCP, Workforce Trends and Forecasting, SHRM
Research
Copy editor:
Katya Scanlan, SHRM Knowledge Center
23
Founded in 1948, the Society for Human Resource Management (SHRM) is the
world’s largest HR membership organization devoted to human resource management.
Representing more than 275,000 members in over 160 countries, the Society is the
leading provider of resources to serve the needs of HR professionals and advance the
professional practice of human resource management. SHRM has more than 575
affiliated chapters within the United States and subsidiary offices in China, India and
United Arab Emirates. Visit us at shrm.org.
2014 Strategic Benefits Survey—Health Care ©SHRM 2015
About SHRM