strained craters on ganymede
TRANSCRIPT

Strained craters on Ganymede
Robert T. Pappalardoa,*, Geoffrey C. Collinsb
aLaboratory for Atmospheric and Space Physics, University of Colorado, Boulder, CO 80309, USAbDepartment of Physics and Astronomy, Wheaton College, Norton, MA 02766, USA
Received 12 June 2004; received in revised form 28 October 2004; accepted 10 November 2004
Abstract
High-resolution images of Jupiter’s satellite Ganymede obtained by the Galileo spacecraft reveal several elliptical craters that are
transected by sets of subparallel ridges and troughs oriented roughly orthogonal to the long axis of the crater, implying that these craters have
been extensionally strained. We analyze five such craters, four in the ancient dark terrain and one in bright grooved terrain, inferring their
strain histories by assuming each crater was originally circular. These strained craters have been elongated by amounts ranging from w5 to
w50%. All are deformed by extension near perpendicular to subparallel ridges and troughs, and some are also deformed by distributed
simple shear parallel to these tectonic structures. The rift zones that deform these craters show extensions of w5 up to w180% for a well-
defined fault zone that rifts Saltu crater within dark terrain of Nicholson Regio. Extensional fault zones consisting of domino-style normal
faults and representing strains of several tens of percent may be common on Ganymede, and strains of this order can alter pre-existing surface
features beyond recognition through the process of tectonic resurfacing.
q 2005 Elsevier Ltd. All rights reserved.
Keywords: Ganymede; Craters; Extension; Strain
1. Background
1.1. Tectonism on Ganymede
In 1979, moderate resolution Voyager spacecraft images
(up to w500 m/pixel) of Jupiter’s ice-rich moon Ganymede
revealed bright lineated swaths tens of kilometers wide and
up to hundreds of kilometers long, termed ‘grooved terrain,’
which cross-cut the satellite’s ancient dark terrain (Fig. 1a)
(Smith et al., 1979a,b). Bright swaths of grooved terrain
contain sets of subparallel curvilinear ridges and troughs of
regular spacing, commonly trending subparallel to and
confined within prominent bounding grooves (Shoemaker et
al., 1982; McKinnon and Parmentier, 1986). Based on
Voyager regional-scale observations, bright grooved terrain
was generally interpreted as having formed by a three-step
process: (1) formation of a broad fault-bounded graben in
dark terrain; (2) volcanic eruption of relatively clean water
and/or ice to flood the broad graben and to resurface the dark
0191-8141/$ - see front matter q 2005 Elsevier Ltd. All rights reserved.
doi:10.1016/j.jsg.2004.11.010
* Corresponding author. Tel.: C1 303 492 6423; fax: C1 303 492 6946
E-mail address: [email protected] (R.T. Pappalardo).
terrain within, creating bright smooth terrain; and (3) further
extension to produce the grooved terrain as sets of narrow
subparallel graben (Golombek and Allison, 1981; Parmen-
tier et al., 1982; Shoemaker et al., 1982; McKinnon and
Parmentier, 1986; Allison and Clifford, 1987).
The assumption that individual grooves represent graben
led to estimations of a few percent extensional strain across
grooved terrain swaths (Golombek, 1982). This estimate
seemed consistent with a w1% limit on the global
expansion of Ganymede imposed by the large-scale
coherence of the ancient dark terrain comprising Galileo
Regio (McKinnon, 1981), and with the suggestion that
grooved terrain extension may be related to global
expansion resulting from differentiation of the satellite
(Squyres, 1980). It was proposed that strike–slip tectonism
might have helped to shape bright grooved terrain
(Lucchitta, 1980; Murchie and Head, 1988), but its relative
role was unclear because of image resolution limitations.
In 1996, the first high-resolution images returned from
the Galileo spacecraft (w75 m/pixel) confirmed that exten-
sional tectonism, along with a component of horizontal
simple shear, has been instrumental in shaping grooved
terrain in the Uruk Sulcus region (Pappalardo et al., 1998).
Stereo imaging of the region subsequently indicated that
Journal of Structural Geology 27 (2005) 827–838
www.elsevier.com/locate/jsg

Fig. 1. Regional-scale views of Ganymede, with boxed areas indicating the locations of subsequent figures, as labeled. In each image, the scale bar is 20 km and
north is toward the top. (a) Voyager 2 (1 km/pixel) view of dark terrain of Marius Regio, cross-cut by bright grooved terrain of NW-trending Mashu Sulcus. (b)
Dark terrain of Nicholson Regio, transected by several fracture sets and by NE-trending Arbela Sulcus (Galileo observations G7GSNICHOL01, 176 m/pixel,
and 28GSARBELA02, 133 m/pixel, on Voyager 1 context). (c) Dark terrain of Marius Regio, in the vicinity of WNW-trending Anshar Sulcus (Galileo
observation G8GSANSHAR01, 150 m/pixel). (d) Bright grooved terrain of Nun Sulci (Galileo observation G7GSNUNSUL01, 164 m/pixel, on Voyager 1
context). (e) Marius Regio where it borders grooved terrain of N-trending Erech Sulcus and NW-trending Sippar Sulcus (Galileo observation G8GSERECH,
143 m/pixel, on Voyager 2 context). (f) Dark terrain of Marius Regio along its border with NE-trending Philus Sulcus (Galileo observation G2NIPPUR01,
99 m/pixel, overlain onto Galileo image G8GSREGCON01, 920 m/pixel).
R.T. Pappalardo, G.C. Collins / Journal of Structural Geology 27 (2005) 827–838828
fault blocks typically w1 km in topographic wavelength are
superimposed on the longer wavelength topography (typi-
cally w8 km) that had been imaged by Voyager (Collins et
al., 1998a; Pappalardo et al., 1998). The morphologies and
geological associations of these fault blocks suggest that
they were formed by domino-style (imbricate) normal
faulting (Pappalardo et al., 1998), implying a high degree of
extensional strain relative to graben formation (Wernicke
and Burchfiel, 1982). A minimum extensional strain of
w50% was estimated by Collins et al. (1998a) based on the
R.T. Pappalardo, G.C. Collins / Journal of Structural Geology 27 (2005) 827–838 829
geometry of fault blocks as inferred from these high-
resolution Uruk Sulcus images. However, it remained
unclear whether such high extensional strain was represen-
tative of grooved terrain or relatively rare.
Galileo images obtained during subsequent encounters
with Ganymede showed that zones of subparallel ridges and
troughs also exist within the ancient dark terrain (e.g. Fig.
1b) (Patel et al., 1999; Prockter et al., 2000). Unlike most
areas within the grooved terrain, lanes of ridge and trough
terrain within dark terrain do not occur in well-defined sets
confined by prominent bounding grooves. We adopt the
generic term ‘ridge and trough terrain’ (RTT) (Pappalardo
and Greeley, 1995) as inclusive of ridge-and-trough sets of
various specific morphologies within both bright and dark
terrains on Ganymede. The morphologies of dark terrain
RTT are analogous to those in some bright grooved terrain,
and the structures have been similarly interpreted as
domino-style normal fault blocks (Patel et al., 1999). This
interpretation implies that high-strain normal faulting may
have occurred within dark terrain regions as well.
1.2. Tectonic resurfacing hypothesis
Based on analysis of the Uruk Sulcus region, Head et al.
(1997a) suggested that high-strain domino-style normal
faulting might be able to deform pre-existing topography to
the extent that it is unrecognizable, effectively ‘tectonically
resurfacing’ older terrains without the aid of icy volcanism.
Expanding on this model, Patel et al. (1999) suggested that
in pervasively faulted RTT zones within dark terrain, a thin
veneer of dark material may shed into topographic lows to
reveal underlying brighter, icier material along upfaulted
ridge crests and slopes, resulting in a greater integrated
brightness of faulted terrain in regions lacking any icy
volcanism. Subsequently, Schenk et al. (2001) used stereo
data to demonstrate that some lanes of bright terrain are
low-lying and relatively flat over large distances, consistent
with their emplacement through icy volcanism, reinforcing
the Voyager-based volcanic resurfacing scenario. Some
high-resolution images of Ganymede obtained in May, 2000
show extremely smooth patches within bright terrain,
consistent with emplacement through volcanic resurfacing
(Giese et al., 2001), and other images show pervasive
tectonism, consistent with tectonic resurfacing (Head et al.,
2002). The relative roles of tectonism and volcanism in
shaping Ganymede’s grooved terrain remains an open issue
(Pappalardo et al., 2004).
1.3. Craters as strain markers
To test the hypothesis that high-strain imbricate fault
blocks are common to RTT on Ganymede and potentially
can tectonically resurface pre-existing terrain, we examine
tectonically deformed craters, which can serve as strain
markers. Craters serve as natural strain markers on
tectonically deformed planets because most originate as
near-circular, for all impactors that strike a planetary
surface at O108 from the horizontal (Gault and Wedekind,
1978). Terrestrial structural geologists have a well-
established practice of using markers of known initial
shape to infer strain (e.g. Ramsay, 1967; Means, 1976;
Ramsay and Huber, 1983). Initially spherical objects such
as pebbles, oolites, or some fossils are deformed by
homogeneous strain ellipsoids. Planar sections through
these objects yield elliptical shapes that define the shape
and orientation of the strain ellipse in that plane.
Determination of angular changes (e.g. through measure-
ments of the angles between initially perpendicular lines of
a bilaterally symmetric fossil) in more than one direction
can also provide sufficient information to characterize the
shape and orientation of the strain ellipse in the measure-
ment plane.
On the planet Mercury, the geometry of deformed craters
has been used to infer crustal shortening along presumed
reverse faults (Strom et al., 1975; Dzurisin, 1978). The
ellipticity of Martian craters has been used to infer the total
extensional strain across the craters as well as the strain
represented by individual faults (Thomas and Allemand,
1993; Golombek et al., 1996). On Venus, extensional strain
across craters has been estimated by assuming that
individual lineaments are normal fault scarps that have
deformed the craters they transect (Grimm, 1994). All these
previous planetary studies only examine the elongation of
craters but do not evaluate the relative roles of simple
extension and simple shear.
Though few strained craters were recognized in Voyager
images of Ganymede (Shoemaker et al., 1982), several
strained craters tens of kilometers in size were imaged at
relatively high resolution by Galileo. Here, we concentrate
on five relatively large strained craters, each elliptical in
shape with its long axis approximately orthogonal to the
trend of transecting RTT, suggesting that each was
extensionally strained during RTT formation. We infer the
degree of extensional strain and horizontal simple shear
recorded by each crater, to provide insight into these
deformation mechanisms. We note that no examples of
shortened craters or other large-scale contractional struc-
tures have yet been identified on Ganymede (Pappalardo et
al., 2004).
2. Strained crater analyses
Each of the five strained craters that we have analyzed in
detail (Figs. 1–3 and Table 1) retains recognizable rim
segments along a substantial portion of its circumference,
allowing the pre-deformation crater diameter (L0) and the
amount of crater elongation (EC) to be estimated by one of
two methods, depending on whether the crater is transected
and split by a zone of RTT (Method 1), or if the RTT is
distributed across the entire crater (Method 2). Each of these
methods can then be used to calculate the displacement by

Fig. 2. The extensionally strained craters examined, shown at a common
scale. The crater images are in Lambert azimuthal equal area projections,
each centered on the target crater. (a) Saltu, within dark terrain of Nicholson
Regio. (b) Unnamed crater in dark terrain of Marius Regio, near Anshar
Sulcus. (c) A pair of strained craters, east of Arbela Sulcus; arrow indicates
the analyzed crater. (d) Nefertum, within grooved terrain of Nun Sulci. (e)
Erichthonius, east of Erech Sulcus.
Fig. 3. Sketch maps of strained craters depicted in Fig. 2. For those craters
analyzed by Method 1 ((a) and (c)), shown in gray are the circles fit to each
rim segment and their corresponding centers. For craters analyzed by
Method 2 ((b), (d) and (e)), shown in gray are the best-fit ellipses and their
corresponding major and minor axes. Representative troughs and other
craters are shown, and stipples indicate areas of bright terrain. The central
pits of pit craters are marked by inward-pointing ticks.
R.T. Pappalardo, G.C. Collins / Journal of Structural Geology 27 (2005) 827–838830
simple extension (dE) and the displacement by simple shear
(dS) accommodated by the RTT. All measurements of crater
strain are performed using images in Lambert azimuthal
equal area projection centered on the approximate center of
the crater, preserving the shapes of concentric features.
Although this projection is neither conformal nor equidi-
stant, all measurements are obtained !0.58 from the map
projection center, ensuring negligible measurement error
from map distortion.
2.1. Method 1: split craters
Method 1 is used where a narrowly constrained zone of
RTT transects a crater, leaving two relatively undeformed
arc-shaped rim segments on either side of the RTT (e.g.
Saltu, Figs. 2a and 3a). Locations along the crest of each of
the two intact rim segments were digitized, and best-fit
circles were calculated for each of the two sets of points.
The best fit circles were calculated by finding the radius and
center coordinates that minimize the RMS error between the
equation for a circle and the set of digitized points, using an
algorithm for the downhill simplex method (Press et al.,
1992). For each crater measured using Method 1, the pre-
deformation crater rim diameter L0 reported in Table 1 is an
average of repeated measurements of the best fit circles
from the two intact rim segments, and the error is
compounded from averaging the best fit circles and their
associated RMS errors (e.g. Taylor, 1996). A line is then
drawn through the centers of the two best fit circles, and the
distance from the outer edge of one circle to the outer edge
of the other circle is adopted as the final (strained) crater
major axis L1 (Fig. 4). For comparison with previous studies
of strained craters on other planets (Section 1.3), we
calculate the crater elongation as
EC Z ðL1=L0ÞK1: (1)

Table 1
Characteristics of five extensionally strained craters imaged by Galileo and analyzed in this study
Crater Saltu Marius unnamed Nicholson unnamed Nefertum Erichthonius
Figure numbers 1b, 2a 1c, 2b 1b, 2c 1d, 2d 1e, 2e
Galileo observation G7GSNICHOL01 G8GSANSHAR01 28GSARBELA02 G7GSNUNSUL01 G8GSERECH_01
Resolution (m/pixel) 176 150 130 164 143
Crater geographic
location
Nicholson Regio Marius Regio Nicholson Regio Nun Sulci Marius Regio
Terrain type Dark Dark Dark Bright Dark
Center latitude, longi-
tude
14.1S, 352.9W 11.1N, 191.4W 17.7S, 346.4W 44.4N, 321.1W 15.38S, 175.32W
Method used Method 1 Method 2 Method 1 Method 2 Method 2
Original crater diam-
eter, L0 (km)
26.2G2.1 23.3G0.5 18.2G0.5 25.7G0.1 30.2G0.1
Minor axis length, L2
(km)
– 22.2G0.2 – 25.6G0.1 30.2G0.1
Major axis length, L1
(km)
39.0G1.3 26.9G0.2 22.9G0.4 29.9G0.2 31.8G0.1
Major axis azimuth,
AM
N6W N19.2EG1.08 N77W N47.8EG1.58 N24.1EG2.18
Crater elongation, EC
(%)
48.9G0.1 15.3G0.0 25.8G0.1 16.2G0.0 5.2G0.0
RTT azimuth, AR N80.1E G4.98 N39.0WG8.58 N25.7EG9.28 N55.2WG4.68 N68.1WG8.08
Major axis-RTT angle,
q (8)
C86G5 K58.2G6.2 K77G9 C77.0G3.5 C87.8G5.9
Simple shear displa-
cement, dS (km)
0.9G1.1 K4.5G0.7 K1.1G0.7 2.0G0.6 0.1G0.4
Simple extension dis-
placement, dE (km)
12.8G0.9 2.5G1.1 4.6G0.3 3.9G0.3 1.5G0.2
RTT zone final width,
RF (km)
20.6G2.4 – 8.8G0.8 – –
RTT zone original
width, R0 (km)
7.0G2.4 – 4.3G0.9 – –
Total RTT extension,
ERTT (%)
183G68 O10.5G4.5a 107G27 15.3G1.3 5.1G0.5
a Minimum estimate because most of the strain appears to be concentrated in a narrow zone (see text).
R.T. Pappalardo, G.C. Collins / Journal of Structural Geology 27 (2005) 827–838 831
The total displacement across the RTT zone is rep-
resented by a vector connecting the two circle centers. The
magnitude d of this vector is related to the measured crater
diameter and major axis by
d Z L1 KL0: (2)
This displacement vector may be a combination of simple
extension and simple shear components across the faults of
the RTT zone. The displacement caused by simple
extension is the component of the displacement vector
perpendicular to the faults in the RTT zone
dE Z d sin q; (3)
while the displacement due to simple shear is the component
of the displacement vector parallel to the faults in the RTT
zone
dS Z d cos q: (4)
The angle q is measured between the average azimuth AR of
faults in the RTT zone and the azimuth AM of the
displacement vector; clockwise is defined as positive q.
The intact rim segments on either side of the RTT zone
serve as relatively undeformed markers for the deformation
within the RTT zone. The observed width of the RTT zone
varies within each of the craters, and the average measured
value is labeled RF in Table 1. The original width of the RTT
zone, R0, is found by subtracting the amount of simple
extension dE from RF. The extensional strain across the RTT
zone is then
ERTT Z ðRF=R0ÞK1: (5)
Table 1 includes error estimates. For L0, errors are based
on best-fit circle approximations to digitized crater seg-
ments, again using the downhill simplex method (Press et
al., 1992). Errors for L1 and RF are based on the standard
deviation of repeated measurements, and errors for AR are
based on repeated measurements of the RTT trend within
the deformed crater and the associated 1Ks variation in
measured trend. Error estimates for other derived values are
based on standard propagation of measurement errors (e.g.
Taylor, 1996) as measured parameters are employed in the
equations above.
2.2. Method 2: distributed deformation
Method 2 is used for craters pervasively deformed by

Fig. 4. Parameter definitions for strain measurements by Method 1. The
crater rim is represented as a thick black line, while faults are represented
by horizontal gray lines. (a) Before strain: L0 is the original crater diameter,
R0 is the pre-extension width of the RTT zone, AR is the azimuth of the RTT
zone. (b) After strain: L1 is the crater rim-to-rim distance along a line
passing through the best fit circle centers, d is the displacement vector, dE is
the simple extension component of the displacement vector, dS is the simple
shear component of the displacement vector, and RF is the observed width
of the RTT zone.
Fig. 5. Parameter definitions for strain measurements by Method 2. (a)
Before strain: L0 is the original crater diameter. (b) After simple extension
only: S is the stretch of the axis of the crater perpendicular to the faults. (c)
After simple extension and simple shear: L1 is the major axis of the ellipse,
L2 is the minor axis of the ellipse, q is the angle between the RTT and the
major axis, dS is the displacement by simple shear of the top of the crater
relative to the bottom, and the dashed gray line represents the pre-shear
ellipse from (b). Although a sequence of simple extension followed by
simple shear is shown for clarity of explanation, the sequence of shear vs.
extension cannot be determined.
R.T. Pappalardo, G.C. Collins / Journal of Structural Geology 27 (2005) 827–838832
distributed RTT, notably Nefertum (Figs. 2d and 3d) and
Erichthonius (Figs. 2e and 3e). In such distributed
deformation, the deformed crater rim closely approximates
a strain ellipse (Fig. 5). The pre-deformation crater rim
diameter L0 is preserved along a line parallel to the RTT
trend, whether the faults in the RTT have accommodated
extension and/or simple shear of the crater. To determine
the strain that has affected each crater, locations were
digitized along the deformed rim, and a best-fit ellipse was
calculated by finding the center coordinates, major axis L1,
minor axis L2, and major axis azimuth AM that minimize the
RMS error between the equation for an ellipse and the set of
digitized points, using the downhill simplex method (Press
et al., 1992). Measurement errors were determined by the
RMS error of this minimization method, repeating this
process with 20 different complete sets of digitized rim
segments and then calculating a final standard deviation
based on the repeated measurements, each with its own
associated error.
With the shape and orientation of the strain ellipse
determined, the amount of simple extension and simple
shear accommodated by the RTT can be found. The ratio of
the major axis to the minor axis of the ellipse L1/L2 is the
ellipticity R, and the angle between the RTT trend and the
major axis of the ellipse is q. Following the reasoning of
Ramsay (1967), we derive the equations for a strain ellipse
that includes both the shear strain g and the stretch S due to
simple extension. The quadratic elongations of the strain
ellipse are related to the stretch and shear strain as

R.T. Pappalardo, G.C. Collins / Journal of Structural Geology 27 (2005) 827–838 833
l1; l2 Z1
21CS2 Cg2G
ffiffiffiffiffiffiffiffiffiffiffiffiffiffiffiffiffiffiffiffiffiffiffiffiffiffiffiffiffiffiffiffiffiffiffiffiffiffiffiffiffiffiffiffiffiffiffiffiffiffiffiffiffiffiffiffiffiffiffiS4 C2S2ðg2 K1ÞC ðg2 C1Þ2
p� �:
(6)
The ellipticity may be written in terms of the quadratic
elongations as
R2 Z l1=l2; (7)
and the angle q between the RTT and the major axis of the
ellipse is related as
tan qZgg2
SC
1
SK
S
l1
� �K1
: (8)
The results of these equations are plotted in Fig. 6, which
shows that for each value of R and q, the values of S and g
are uniquely constrained. Note that there is no way to
distinguish between (1) extension followed by horizontal
shearing, (2) horizontal shearing followed by extension, or
(3) simultaneous horizontal shearing and extension; the final
strain ellipse will be the same regardless of the sequence of
deformation.
For each crater measured using Method 2, we use the
values of L1, L2, and AM from the best fit ellipse, together
with the measured azimuth AR of the RTT to calculate R and
q. We then use Eqs. (6)–(8) to determine the stretch and
shear strain consistent with the currently observed crater
shape. Because of the complexity of Eqs. (5) and (7), it is
difficult to mathematically propagate the errors in R and q to
errors in S and g; therefore, we estimated these errors by
plotting the contours of the error ranges in R and q on a plot
of S vs. g.
The displacement by simple extension dE is then simply
dE Z L0ðSK1Þ; (9)
from the definition of stretch, while the displacement by
simple shear dS is the product of the shear strain g and the
length L0 S of the strain ellipse perpendicular to the RTT
direction
dS Z L0Sg (10)
as illustrated by Fig. 5. Values of dS are reported in Table 1
with positive defined as dextral shear, and negative as
sinistral. The extensional strain across the RTT is simply
ERTT ¼ SK1: (11)
Errors in dE, dS, and ERTT were propagated from errors in
L0, S, and g based on standard techniques (e.g. Taylor,
1996). Because the RTT is distributed throughout the crater,
we do not report values for the initial and final widths of the
RTT zone for craters measured by Method 2.
3. Results
The characteristics of the strained craters are summar-
ized in Table 1 along with the results of the strain analyses.
3.1. Saltu
Saltu crater (provisionally named by the International
Astronomical Union) is located within the dark terrain of
Nicholson Regio (Figs. 2a and 3a). Voyager images of this
region revealed curvilinear structures resembling furrows,
in close association with ‘dark smooth material’, which was
proposed to be cryovolcanic in origin (Murchie et al., 1989).
Galileo images (Fig. 1b) reveal no evidence for icy
volcanism in the area; instead, brighter patches are
associated with fracture zones and commonly appear to be
higher in elevation, with darker material shedding into
topographic lows (Moore et al., 1999; Prockter et al., 2000).
Furthermore, the apparent furrows are instead well-defined
zones of RTT.
One such RTT zone cuts the crater Saltu. Bright
lineaments are generally inferred to be high-standing ridges
and steep slopes, while dark lineaments are low-lying
troughs, analogous to those observed elsewhere on Gany-
mede (Pappalardo et al., 1998; Oberst et al., 1999; Prockter
et al., 2000). Fourier analysis shows that multiple
topographic wavelengths exist here, similar to those found
in bright grooved terrain (Patel et al., 1999); thus, this RTT
may have formed by normal faulting and extensional
necking of the lithosphere, analogous to formation of bright
grooved terrain (Collins et al., 1998a; Dombard and
McKinnon, 2001). The lack of identifiable cryovolcanic
materials here implies that formation of at least some RTT
on Ganymede does not require icy volcanism.
Using Method 1 described above, we find Saltu has
lengthened by 49% in a NNW–SSE direction. The
displacement due to dextral simple shear is 0.9G1.1 km,
so shear in this area is minor, and not required to explain the
characteristics of Saltu. The extensional strain across the
RTT zone alone is nominally 180%, the highest local strain
yet inferred on Ganymede.
3.2. Marius Regio unnamed
Unnamed crater B (Figs. 2b and 3b) is located within
Marius Regio, w30 km south of the southeastern tip of
Anshar Sulcus. Prockter et al. (2000) have mapped the
structures in this region as identified in Galileo images
(Fig. 1c), finding evidence for a two-stage stress history.
The first stage involved formation of the rift zone that
cuts the unnamed crater B, while the second stage
involved a w258 counterclockwise rotation of the stress
field and included transtensional rifting to form Anshar
Sulcus.
Measurement using Method 2 shows that the Marius
unnamed crater has been elongated by 15% overall.
Analysis of this crater is complicated because it is crosscut
by two RTT sets. The more subdued set, inferred to be the
older, is unlikely to accommodate more than a few percent
of the extension, based on morphological comparison to the
subdued, widely spaced fractures in the Erichthonius crater
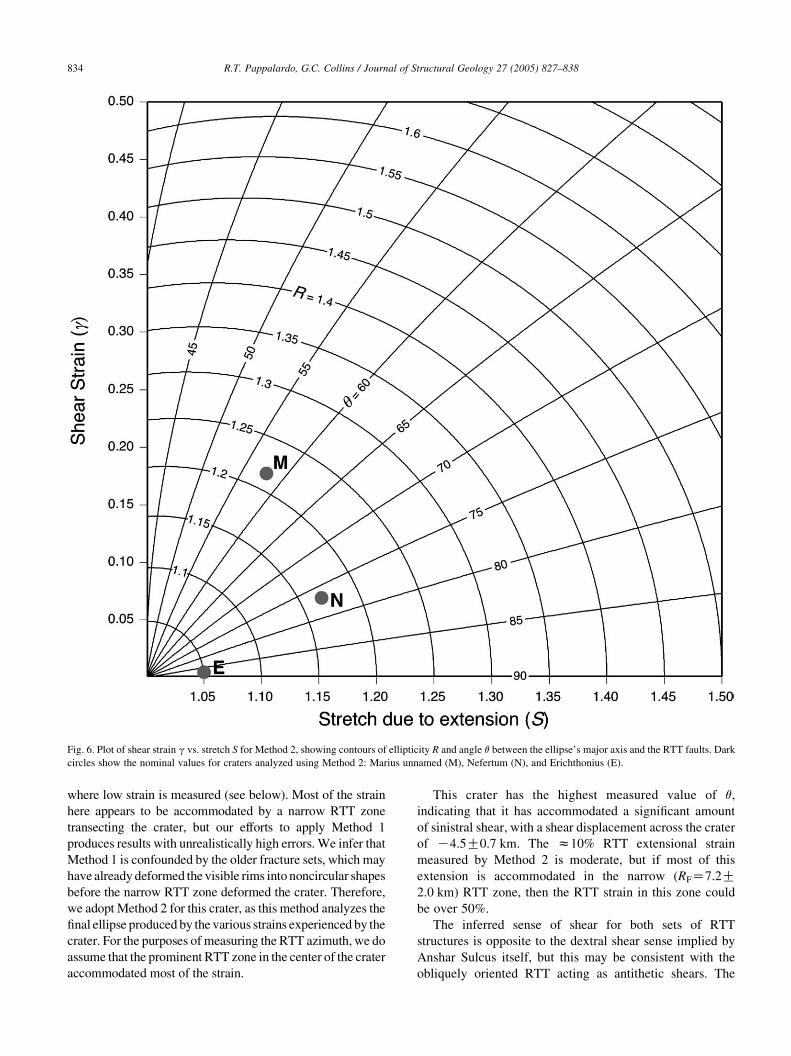
Fig. 6. Plot of shear strain g vs. stretch S for Method 2, showing contours of ellipticity R and angle q between the ellipse’s major axis and the RTT faults. Dark
circles show the nominal values for craters analyzed using Method 2: Marius unnamed (M), Nefertum (N), and Erichthonius (E).
R.T. Pappalardo, G.C. Collins / Journal of Structural Geology 27 (2005) 827–838834
where low strain is measured (see below). Most of the strain
here appears to be accommodated by a narrow RTT zone
transecting the crater, but our efforts to apply Method 1
produces results with unrealistically high errors. We infer that
Method 1 is confounded by the older fracture sets, which may
have already deformed the visible rims into noncircular shapes
before the narrow RTT zone deformed the crater. Therefore,
we adopt Method 2 for this crater, as this method analyzes the
final ellipse produced by the various strains experienced by the
crater. For the purposes of measuring the RTT azimuth, we do
assume that the prominent RTT zone in the center of the crater
accommodated most of the strain.
This crater has the highest measured value of q,
indicating that it has accommodated a significant amount
of sinistral shear, with a shear displacement across the crater
of K4.5G0.7 km. The z10% RTT extensional strain
measured by Method 2 is moderate, but if most of this
extension is accommodated in the narrow (RFZ7.2G2.0 km) RTT zone, then the RTT strain in this zone could
be over 50%.
The inferred sense of shear for both sets of RTT
structures is opposite to the dextral shear sense implied by
Anshar Sulcus itself, but this may be consistent with the
obliquely oriented RTT acting as antithetic shears. The

R.T. Pappalardo, G.C. Collins / Journal of Structural Geology 27 (2005) 827–838 835
orientation of the more prominent (newer) RTT structures is
a good match to the expected orientation of sinistral shears
that formed antithetic to Anshar Sulcus itself (see fig. 8b in
Prockter et al., 2000). The degraded (older) RTT structures
are a much better match to the expected orientation of
dextral antithetic structures in the epoch preceding the
inferred regional stress rotation.
3.3. Nicholson Regio unnamed
The unnamed crater in question within Nicholson Regio
(Fig. 2c, arrow, and Fig. 3c) is located 53 km east of Arbela
Sulcus (Fig. 1b), observed at 130 m/pixel during the Galileo
G28 encounter with Ganymede. Arbela Sulcus resembles
crustal spreading bands on Europa (Prockter et al., 2002),
and may have accommodated both extension and left lateral
shear, based on reconstruction of older features on either
side of the sulcus (Head et al., 2002).
The Nicholson Regio unnamed crater is cut by NNE-
trending RTT, with most of the faults concentrated in a
narrow band in the western portion of the crater. Applying
Method 1, elongation of this crater is estimated as 26%. If
this extension is all concentrated in the RTT that cuts the
western portion of the crater, the extensional strain across
this narrow RTT zone is about 100%. Minor sinistral shear
(dSZ1.1G0.7 km) along the RTT faults is consistent with
the dextral sense of shear inferred along Arbela Sulcus, and
may form a conjugate set with ENE-trending faults such as
those cutting Saltu to the northwest.
3.4. Nefertum
Nefertum crater (Figs. 2d and 3d) is located within the Nun
Sulci. Interpretations of Voyager images suggested that the
region’s grooved terrain had undergone sinistral offset, and that
this crater might record contraction and shear strain (Murchie
and Head, 1988). Analysis of Galileo images (Fig. 1d) supports
the interpretation of sinistral horizontal shear along narrow E–
W-trending zones that transect the imaged region, but Nefertum
is instead found to be strained by NW-trending faults that
predate the throughgoing shear zones (Collins et al., 1998b).
Pervasive distributed deformation of Nefertum by RTT
of Nun Sulci requires application of Method 2. We estimate
that Nefertum is elongated (primarily through extension) by
about 16% overall. It is the crater’s southwestern rim, where
extensional strain is most concentrated, that is deformed
nearly beyond recognition. The dextral shear (dSZ2.0G0.6 km) could be consistent with late-stage E–W exten-
sional strain inferred in this area (Collins et al., 1998b)
being accommodated by shear along these NW-trending
faults.
3.5. Erichthonius
Erichthonius (Figs. 2e and 3e) lies in the dark terrain of
southern Marius Regio, 86 km northeast of the junction of
Erech Sulcus and Sippar Sulcus (Fig. 1e). Erichthonius is
the least deformed crater analyzed, estimated by Method 2
to have been elongated through extension by 5%. The
troughs cutting Erichthonius are narrow and widely spaced,
unlike the RTT in more highly strained craters. Horizontal
shear, if any, is inferred to be minor (dSZ0.1G0.4 km), and
the measurement error makes the sense of shear ambiguous.
The morphological characteristics of the troughs transecting
Erichthonius and the relatively low extensional strain they
accommodate are consistent with these troughs being graben.
4. Other strained craters
Some deformed craters observed in Galileo images have
experienced multiple generations of extensional defor-
mation and/or shear deformation. For example, Figs. 7a
and 8a illustrate an unnamed crater in Nicholson Regio
crosscut by fault sets of at least four different orientations.
This crater is barely recognizable by the remnants of a
bright near-circular rim. Stereo-derived topography of this
area confirms a distinct circular depression within this rim
(B. Giese, personal communication). This crater has
experienced severe tectonism, which could be a principal
reason why the crater is barely recognizable in images.
In another example of a severely deformed structure, an
elliptical crater (19.9!12.2 km) is observed in the dark
terrain of Marius Regio, just southeast of the boundary with
Philus Sulcus (Figs. 1f, 7b, and 8b) (Head et al., 1997b). At
least three differently oriented sets of fractures cut this
crater, none of which is aligned with the long or short axes
of the crater. The dearth of structures perpendicular to the
long axis suggests that this crater was not primarily
deformed by extensional strain. Structural relationships in
neighboring Philus Sulcus strongly suggest dextral shear in
this area (Head et al., 1997b). A distributed network of faint
lineaments subparallel to Philus Sulcus cut through this
crater, oblique to the crater’s long axis. If these lineaments
have deformed the crater by simple shear, then the dextral
shear inferred within Philus Sulcus also deformed the
neighboring dark terrain, including this elliptical crater.
Many smaller strained craters are also found (e.g. Figs.
7c and 8c). However, craters on the order of 10 km or
smaller are too small for their strain to be successfully
measured by the methods presented above. This is because
small alcoves and promontories along the crater rims
become large enough with respect to the crater diameter
to cause large errors in the circle and ellipse fitting
algorithms, precluding measurement of small to moderate
strain across these craters.
We note that the 56 km central pit crater Lugalmeslam
(Figs. 7d and 8d), on the boundary between the dark terrain of
Marius Regio and bright terrain of Mashu Sulcus (Fig. 1a), was
targeted by Galileo high resolution imaging in part because it
seemed that post-crater activity in grooved terrain might have
extended the crater. Moreover, Voyager images suggested that

Fig. 7. Additional candidate strained craters, arranged from greatest to least
inferred strain. In each image, the scale bar is 10 km and north is toward the
top. Lambert azimuthal equal area projections are centered on each crater.
(a) A severely deformed crater in Nicholson Regio is recognizable only by
fragments of its bright rim crest and by stereo-derived topography
(28GSARBELA02, 133 m/pixel). (b) An elliptical crater in Marius Regio
near the border of Philus Sulcus may owe its shape to distributed dextral
shear (G2NIPPUR01, 99 m/pixel). (c) A crater in Nicholson Regio is
transected by narrow tectonic troughs (28GSNICHOL02, 125 m/pixel). (d)
The central pit crater Lugalmeslam post-dates both Marius Regio to its
southwest and Mashu Sulcus to its northeast, and in Galileo images the
crater does not show evidence that it was tectonically strained
(G8GSPITCRA01, 146 m/pixel).
Fig. 8. Sketch maps of craters depicted in Fig. 7. Crater rims are dashed
where severely modified. Representative troughs and other craters are
shown, and stipples indicate areas of bright terrain. The central pit of
Lugalmeslam (d) is marked by inward-pointing ticks.
R.T. Pappalardo, G.C. Collins / Journal of Structural Geology 27 (2005) 827–838836
bright smooth cryovolcanic material might have extruded into
Lugalmeslam (Murchie and Head, 1989). The Galileo image
(Fig. 7d) shows that the crater has emplaced a blanket of ejecta
on top of Mashu Sulcus, so it post-dates grooved terrain
activity. Rather than being extensionally strained, Lugalme-
slam’s northeastern rim appears to have experienced enhanced
failure and collapse where it transected faults in Mashu Sulcus.
Furthermore, no discernable evidence of icy volcanism is
found: the smooth bright material observed in Voyager images
is likely impact melt from the Lugalmeslam impact, rather
than volcanically emplaced ice.
5. Discussion
The strained craters examined here serve as valuable
constraints on the nature of the RTT zones that cut them.
Those craters transected by RTT consisting of pervasive,
closely spaced ridges and troughs (i.e. all craters of
Table 1 other than Erichthonius) are extensionally strained
by O10%, while individual RTT swaths can represent
strains of O100%. These strains imply rift zones that are
dominated by domino-style normal faults, rather than sets of
narrow graben.
Having measured the relatively low strain portions of
deformed craters by Method 1, we infer the highest strains
in rift zones that split these craters. These highest strains are
in accord with a model of tectonic resurfacing, which at
extreme strains may be able to modify pre-existing
structures beyond recognition (Head et al., 1997a). The
tectonic resurfacing model is supported by two additional
observations. First, the craters examined here fall within the
size range transitional from central peak to central pit craters
on Ganymede (Schenk, 1991). While the least strained
craters examined here (Figs. 2d and e, and 7c and d) do
retain their central structures, the more highly strained
craters (Figs. 2a–c, and 7a) show no obvious central
structures, presumably because these structures were
tectonically destroyed by RTT formation. Second, the
southwestern rim of Nefertum (Fig. 2d), where extensional
strain appears to be most concentrated, is deformed nearly
beyond recognition, suggesting that this crater (at 15%
strain overall) is on the verge of being tectonically
destroyed. These observations suggest that w15% is a
lower bound to the amount of strain that may begin to make
a crater unrecognizable through tectonic resurfacing, while
strains on the order of tens of percent likely can tectonically
alter pre-existing structures on Ganymede beyond
recognition.
We note that several strained craters were fortuitously
captured in Galileo high-resolution images of dark terrain,
but only one large strained crater (Nefertum) is observed in

R.T. Pappalardo, G.C. Collins / Journal of Structural Geology 27 (2005) 827–838 837
high resolution images of bright terrain. It is feasible that
some pre-existing craters in bright terrain have been wiped
out by tectonism. This is a plausible scenario if bright
grooved terrain has typically experienced tens of percent
extension. However, not all bright terrain exhibits high
extensional strain, as there are examples of craters in bright
terrain that do not exhibit appreciable strain despite being
transected by numerous lineaments (Pappalardo et al.,
2004).
Highly extended terrains are common in terrestrial
environments, where they are balanced by convergence
elsewhere. However, large extensional strains seem at odds
with the lack of convergence-related structures recognized
on Ganymede. Global expansion could have resulted during
interior differentiation of the satellite, with corresponding
areal expansion of as much as 6.5% (Squyres, 1980; Mueller
and McKinnon, 1988). However, the large-scale coherence
of dark terrain of Galileo Regio suggests a global expansion
limit of w1% (McKinnon, 1981). If tilt-block style normal
faulting is common on Ganymede, as appears to be the case,
then these limits to the total expected extensional strain
might be challenged. However, the total amount of
extension implied by grooved terrain formation has not
yet been evaluated in light of Galileo imaging, as the task is
confounded by limited high-resolution coverage. Mapping
and morphological classification of ridges and troughs in
regional- and global-scale images may enable such an
estimate. It may be that Ganymede, like its neighboring
satellite Europa (Prockter and Pappalardo, 2000), is hiding
at least some degree of contractional strain in low-
amplitude, long-wavelength folds, which could be detected
by altimetry on a future spacecraft mission.
6. Conclusions
Five craters identified in high-resolution images of
Jupiter’s ice-rich moon Ganymede have been elongated by
w5–50%. All are deformed by extension along subparallel
ridges and troughs, and some are also deformed by
distributed horizontal simple shear along these tectonic
structures. Ridge-and-trough fault zones with high exten-
sional strains (tens of percent) may be common on
Ganymede and probably consist of domino-style normal
faults. Extensional strain w15% across Nefertum crater
represents a lower bound to the amount of strain that may
begin to make a crater unrecognizable, and strains on the
order of tens of percent can likely alter pre-existing
structures on Ganymede beyond recognition through
tectonic resurfacing. A w20 km ridge-and-trough zone
that splits Saltu crater has experienced w180% extension.
These results for the degree and style of strain
represented by crater-deforming tectonic structures will be
valuable for application to RTT elsewhere on Ganymede
based on morphological comparisons. Deformed craters on
Ganymede have experienced some of the greatest tectonic
strains recorded beyond the Earth. Stress mechanisms are
unknown but might be related to satellite differentiation,
nonsynchronous rotation, or convection (Pappalardo et al.,
2004). It is not clear how Ganymede’s extensional strain is
resolved elsewhere on the satellite because contractional
structures are not apparent. The methods for analyzing
extensional and shear components of crater strain that are
described here can be applied to strained craters on other
planets. On Ganymede and other planetary bodies, sets of
tectonic structures are relatively unaffected by erosion, so
their morphologies and origins serve as well-preserved
examples of how strain can modify planetary surfaces.
Acknowledgements
David Ferrill, Alan Morris, Eric Grosfils, and Steve
Reynolds provided very thorough and constructive reviews,
which greatly improved the foundations of this work. We
also thank Elizabeth Turtle for providing the original circle-
fitting program used in this study, Amy Barr for assistance
in programming the ellipse fitting program, and Moses
Milazzo and Nina Dieter for constructing the Galileo
Ganymede image mosaics. This work was funded through
NASA Jupiter System Data Analysis Program grant NAG5-
8046 and NASA Planetary Geology and Geophysics
Program grant NAG5-11616.
References
Allison, M.L., Clifford, S.M., 1987. Ice-covered water volcanism on
Ganymede. Journal of Geophysical Research 92, 7865–7876.
Collins, G.C., Head, J.W., Pappalardo, R.T., 1998a. The role of extensional
instability in creating Ganymede grooved terrain: insights from Galileo
high-resolution stereo imaging. Geophysical Research Letters 25, 233–
236.
Collins, G.C., Head, J.W., Pappalardo, R.T., Galileo SSI Team, 1998b.
Geology of the Galileo G7 Nun Sulci target area, Ganymede, Lunar and
Planetary Science Conference XXIX, abstract #1755 [CD-ROM].
Lunar and Planetary Institute, Houston.
Dombard, A.J., McKinnon, W.B., 2001. Formation of grooved terrain on
Ganymede: extensional instability mediated by cold, superplastic creep.
Icarus 154, 321–336.
Dzurisin, D., 1978. The tectonic and volcanic history of Mercury as inferred
from studies of scarps, ridges, troughs, and other lineaments. Journal of
Geophysical Research 83, 4883–4906.
Gault, D.E., Wedekind, J.A., 1978. Experimental studies of oblique impact.
Proceedings of the 9th Lunar and Planetary Science Conference, pp.
3843–3875.
Giese, B., Wagner, R., Neukum, G., Pappalardo, R., Head, J.W., Galileo
Imaging Team, 2001. The topography of bright/dark terrain on
Ganymede, Lunar and Planetary Science Conference XXXII, abstract
#1751 [CD-ROM]. Lunar and Planetary Institute, Houston.
Golombek, M.P., 1982. Constraints on the expansion of Ganymede and the
thickness of the lithosphere. Proceedings of the 13th Lunar and
Planetary Science Conference. Journal of Geophysical Research 87,
A77–A83.

R.T. Pappalardo, G.C. Collins / Journal of Structural Geology 27 (2005) 827–838838
Golombek, M.P., Allison, M.L., 1981. Sequential development of grooved
terrain and polygons on Ganymede. Geophysical Research Letters 8,
1139–1142.
Golombek, M.P., Tanaka, K.L., Franklin, B.J., 1996. Extension across
Tempe Terra, Mars, from measurements of fault scarp widths and
deformed craters. Journal of Geophysical Research 99, 23163–23171.
Grimm, R.E., 1994. Recent deformation rates on Venus. Journal of
Geophysical Research 99, 23163–23171.
Head, J.W., Pappalardo, R., Collins, G., Greeley, R., Galileo Imaging
Team, 1997a. Tectonic resurfacing on Ganymede and its role in the
formation of grooved terrain. Lunar and Planetary Science Conference.
XXVIII 1997; 535–536.
Head, J.W., Pappalardo, R., Collins, G., Prockter, L., Galileo Imaging
Team, 1997b. Nippur Sulcus Region, Ganymede: Nature of high-
latitude groove lanes and their relationship to Marius Regio from
Galileo SSI data. Lunar and Planetary Science Conference. XXVIII
1997; 537–538.
Head, J.W., Pappalardo, R., Collins, G., Belton, M.J.S., Giese, B.,
Wagner, R., Breneman, H., Spaun, N., Nixon, B., Neukum, G.,
Moore, J., 2002. Evidence for Europa-like resurfacing styles on
Ganymede. Geophysical Research Letters 29 (24), 251.10.1029/
2002GL015961
Lucchitta, B.K., 1980. Grooved terrain on Ganymede. Icarus 44, 481–501.
McKinnon, W.B., 1981. Tectonic deformation of Galileo Regio and limits
to the planetary expansion of Ganymede. In: Proceedings of the Lunar
and Planetary Science Conference, vol. 12B. Pergamon, New York, pp.
1585–1597.
McKinnon, W.B., Parmentier, E.M., 1986. Ganymede and Callisto. In:
Burns, J.A., Matthews, M.S. (Eds.), Satellites. University of Arizona
Press, Tucson, pp. 718–763.
Means, W.D., 1976. Basic Concepts of Continuum Mechanics for
Geologists. Springer, New York. 339pp.
Moore, J.M., Asphaug, E., Morrison, D., Spencer, J.R., Chapman, C.R.,
Sullivan, R.J., Chuang, F.C., Klemaszewski, J.E., Greeley, R.,
Bender, K.C., Geissler, P.E., Helfenstein, P., Pilcher, C.B., 1999.
Mass movement and landform degradation on the icy Galilean
satellites: results of the Galileo nominal mission. Icarus 140, 294–312.
Mueller, S., McKinnon, W.B., 1988. Three-layered models of Ganymede
and Callisto: compositions, structures, and aspects of evolution. Icarus
76, 437–464.
Murchie, S.L., Head, J.W., 1988. Possible breakup of dark terrain on
Ganymede by large-scale shear faulting. Journal of Geophysical
Research 93, 8795–8824.
Murchie, S.L., Head, J.W., 1989. Geologic map of the Philus Sulcus
quadrangle of Ganymede, US Geological Survey Map I-1966, scale,
1:5,000,000.
Oberst, J., Schreiner, B., Giese, B., Neukum, G., Head, J., Pappalardo, R.,
Helfenstein, P., 1999. The distribution of bright and dark material on
Ganymede in relationship to surface elevation and slopes. Icarus 140,
283–293.
Pappalardo, R.T., Greeley, R., 1995. A review of the origins of subparallel
ridges and troughs: Generalized morphological predictions from
terrestrial models. Journal of Geophysical Research 100, 18,985–
19,007.
Pappalardo, R.T., Head, J.W., Collins, G.C., Kirk, R.L., Neukum, G.,
Oberst, J., Giese, B., Greeley, R., Chapman, C.R., Helfenstein, P.,
Moore, J.M., McEwen, A., Tufts, B.R., Senske, D.A., Breneman, H.H.,
Klaasen, K., 1998. Grooved terrain on Ganymede: first results from
Galileo high-resolution imaging. Icarus 135, 276–302.
Pappalardo, R.T., Collins, G.C., Head, J.W., Helfenstein, P., McCord, T.,
Moore, J.M., Prockter, L.M., Schenk, P.M., Spencer, J., 2004. Geology
of Ganymede. In: Bagenal, F., Dowling, T.E., McKinnon, W.B. (Eds.),
Jupiter: The Planet, Satellites and Magnetosphere. Cambridge Univer-
sity Press, Cambridge, pp. 363–396.
Parmentier, E.M., Squyres, S.W., Head, J.W., Allison, M.L., 1982. The
tectonics of Ganymede. Nature 295, 290–293.
Patel, J.G., Pappalardo, R.T., Head, J.W., Collins, G.C., Hiesinger, H.,
Sun, J., 1999. Topographic wavelengths of Ganymede groove lanes
from Fourier analysis of Galileo images. Journal of Geophysical
Research 104, 24,057–24,074.
Press, W.H., Teukolsky, S.A., Vetterling, W.T., Flannery, B.P., 1992.
Numerical Recipes in C: the Art of Scientific Computing. Cambridge
University Press, New York. 1020pp.
Prockter, L.M., Pappalardo, R.T., 2000. Folds on Europa: implications for
crustal cycling and accommodation of extension. Science 289, 941–
943.
Prockter, L.M., Head, J.W., Pappalardo, R.T., Senske, D.A., Neukum, G.,
Wagner, R., Wolf, U., Oberst, J., Giese, B., Moore, J.M.,
Chapman, C.R., Helfenstein, P., Greeley, R., Breneman, H.H.,
Belton, M.J.S., 1998. Dark terrain on Ganymede: geological mapping
and interpretation of Galileo Regio at high resolution. Icarus 135, 317–
344.
Prockter, L.M., Figueredo, P., Pappalardo, R.T., Head, J.W., Collins, G.C.,
2000. Geology and mapping of dark terrain on Ganymede and
implications for grooved terrain formation. Journal of Geophysical
Research 105, 22,519–22,540.
Prockter, L.M., Head III, J.W., Pappalardo, R.T., Patel, J.G., Sullivan, R.J.,
Clifton, A.E., Giese, B., Wagner, R., Neukum, G., 2002. Morphology of
Europan bands at high resolution: a mid-ocean ridge-type rift
mechanism. Journal of Geophysical Research 107 (E5),
101029/2000JE001458.
Ramsay, J.G., 1967. Folding and Fracturing of Rocks. McGraw-Hill, New
York. 568pp.
Ramsay, J.G., Huber, M.I., 1983. The Techniques of Modern Structural
Geology. Vol. 1: Strain Analysis. Academic Press, New York. 307pp.
Schenk, P.M., 1991. Ganymede and Callisto: complex crater formation and
planetary crusts. Journal of Geophysical Research 96, 15,635–15,664.
Schenk, P.M., McKinnon, W.B., Gwynn, D., Moore, J.M., 2001. Flooding
of Ganymede’s bright terrains by low-viscosity water-ice lavas. Nature
410, 57–60.
Shoemaker, E.M., Lucchitta, B.K., Plescia, J.B., Squyres, S.W.,
Wilhelms, D.E., 1982. The geology of Ganymede. In: Morrison, D.
(Ed.), Satellites of Jupiter. University of Arizona Press, Tucson,
pp. 435–520.
Smith, B.A., Voyager Imaging Team, 1979a. The Jupiter system through
the eyes of Voyager 1. Science 204, 951–972.
Smith, B.A., Voyager Imaging Team, 1979b. The Galilean satellites and
Jupiter: Voyager 2 imaging science results. Science 206, 927–950.
Squyres, S.W., 1980. Volume changes in Ganymede and Callisto and the
origin of grooved terrain. Geophysical Research Letters 7, 593–596.
Strom, R.G., Trask, N.J., Guest, J.E., 1975. Tectonism and volcanism on
Mercury. Journal of Geophysical Research 80, 2478–2507.
Taylor, J.R., 1996. An Introduction to Error Analysis: the Study of
Uncertainties in Physical Measurements, 2nd ed. University Science
Books, Herndon, Va. 327pp.
Thomas, P.G., Allemand, P., 1993. Quantitative analysis of the extensional
tectonics of Tharsis Bulge Mars: geodynamic implications. Journal of
Geophysical Research 98, 13,097–13,108.
Wernicke, B., Burchfiel, B.C., 1982. Modes of extensional tectonics.
Journal of Structural Geology 4, 105–115.