stornoway corporate update presentation january 22, 2015
TRANSCRIPT
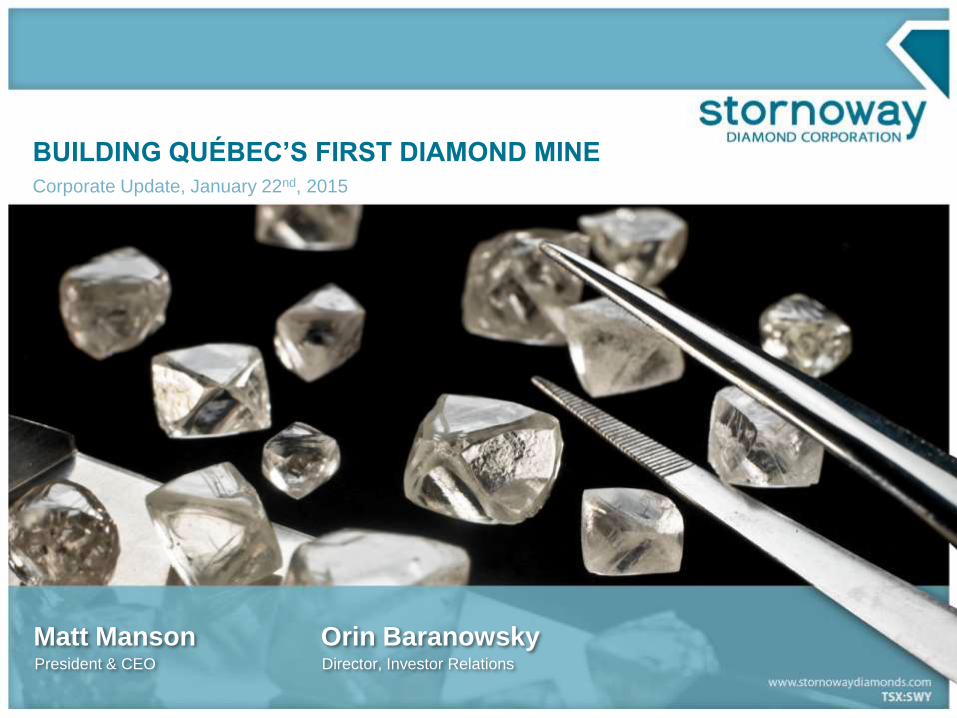
BUILDING QUÉBEC’S FIRST DIAMOND MINECorporate Update, January 22nd, 2015
Matt Manson Orin BaranowskyPresident & CEO Director, Investor Relations
2
Forward-Looking Information
This presentation contains "forward-looking information" within the meaning of Canadian securities legislation and “forward-looking statements” within the meaning
of the United States Private Securities Litigation Reform Act of 1995. This information and these statements, referred to herein as “forward-looking statements”,
are made as of the date of this presentation and the Company does not intend, and does not assume any obligation, to update these forward-looking statements,
except as required by law.
Forward-looking statements relate to future events or future performance and reflect current expectations or beliefs regarding future events and include, but are not
limited to, statements with respect to: (i) the amount of mineral resources and exploration targets; (ii) the amount of future production over any period; (iii) net
present value and internal rates of return of the mining operation; (iv) assumptions relating to recovered grade, average ore recovery, internal dilution, mining
dilution and other mining parameters set out in the Feasibility Study or Optimization Study; (v) assumptions relating to gross revenues, operating cash flow and
other revenue metrics set out in the Feasibility Study or Optimization Study; (vi) mine expansion potential and expected mine life; (vii) expected time frames for
completion of permitting and regulatory approvals and making a production decision; (viii) future exploration plans; (ix) future market prices for rough diamonds;
and (x) sources of and anticipated financing requirements. Any statements that express or involve discussions with respect to predictions, expectations, beliefs,
plans, projections, objectives, assumptions or future events or performance (often, but not always, using words or phrases such as “expects”, “anticipates”, “plans”,
“projects”, “estimates”, “assumes”, “intends”, “strategy”, “goals”, “objectives” or variations thereof or stating that certain actions, events or results “may”, “could”,
“would”, “might” or “will” be taken, occur or be achieved, or the negative of any of these terms and similar expressions) are not statements of historical fact and
may be forward-looking statements.
Forward-looking statements are made based upon certain assumptions and other important factors that, if untrue, could cause the actual results, performances or
achievements of Stornoway to be materially different from future results, performances or achievements expressed or implied by such statements. Such
statements and information are based on numerous assumptions regarding present and future business strategies and the environment in which Stornoway will
operate in the future, including the price of diamonds, anticipated costs and Stornoway’s ability to achieve its goals. Certain important factors that could cause
actual results, performances or achievements to differ materially from those in the forward-looking statements include, but are not limited to: (i) required capital
investment and estimated workforce requirements; (ii) estimates of net present value and internal rates of return; (iii) receipt of regulatory approvals on acceptable
terms within commonly experienced time frames; (iv) anticipated timelines for the commencement of mine production; (v) market prices for rough diamonds and
the potential impact on the Renard Project’s value; and (vi) future exploration plans and objectives. Additional risks are described in Stornoway's most recently
filed Annual Information Form, annual and interim MD&As, and other disclosure documents available under the Company’s profile at: www.sedar.com.
When relying on our forward-looking statements to make decisions with respect to Stornoway, investors and others should carefully consider the foregoing factors
and other uncertainties and potential events. Stornoway does not undertake to update any forward-looking statement, whether written or oral, that may be made
from time to time by Stornoway or on our behalf, except as required by law.
Readers are referred to the technical report dated as of February 28th, 2013 entitled “The Renard Diamond Project, Québec, Canada, Feasibility Study Update, NI
43-101 Technical Report, February 28, 2013” in respect of the January 2013 Optimization Study, and the press release dated July 23, 2013 in respect of the July
2013 Mineral Resource estimate for further details and assumptions relating to the project. The Qualified Persons that prepared the technical reports and press
releases that form the basis for the presentation are listed in the Company’s AIF dated July 29, 2014. Disclosure of a scientific or technical nature in this
presentation has been reviewed and approved by Robin Hopkins, P.Geol. (NT/NU), Vice President, Exploration, a “qualified person” under NI 43-101.
3
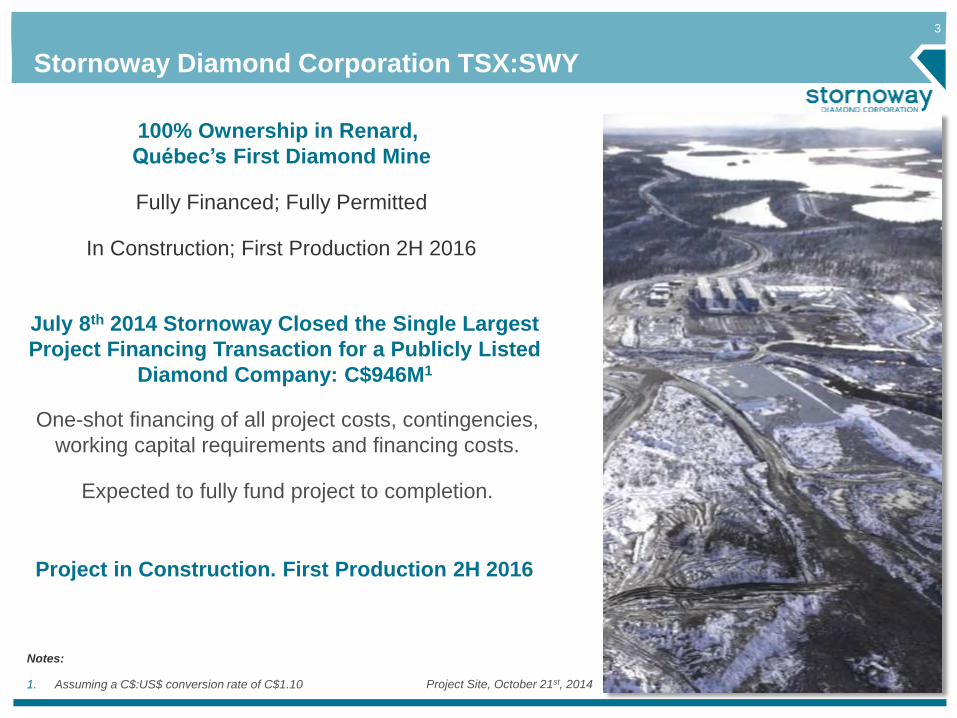
Stornoway Diamond Corporation TSX:SWY
100% Ownership in Renard,
Québec’s First Diamond Mine
Fully Financed; Fully Permitted
In Construction; First Production 2H 2016
July 8th 2014 Stornoway Closed the Single Largest
Project Financing Transaction for a Publicly Listed
Diamond Company: C$946M1
One-shot financing of all project costs, contingencies,
working capital requirements and financing costs.
Expected to fully fund project to completion.
Project in Construction. First Production 2H 2016
Notes:
1. Assuming a C$:US$ conversion rate of C$1.10 Project Site, October 21st, 2014
4
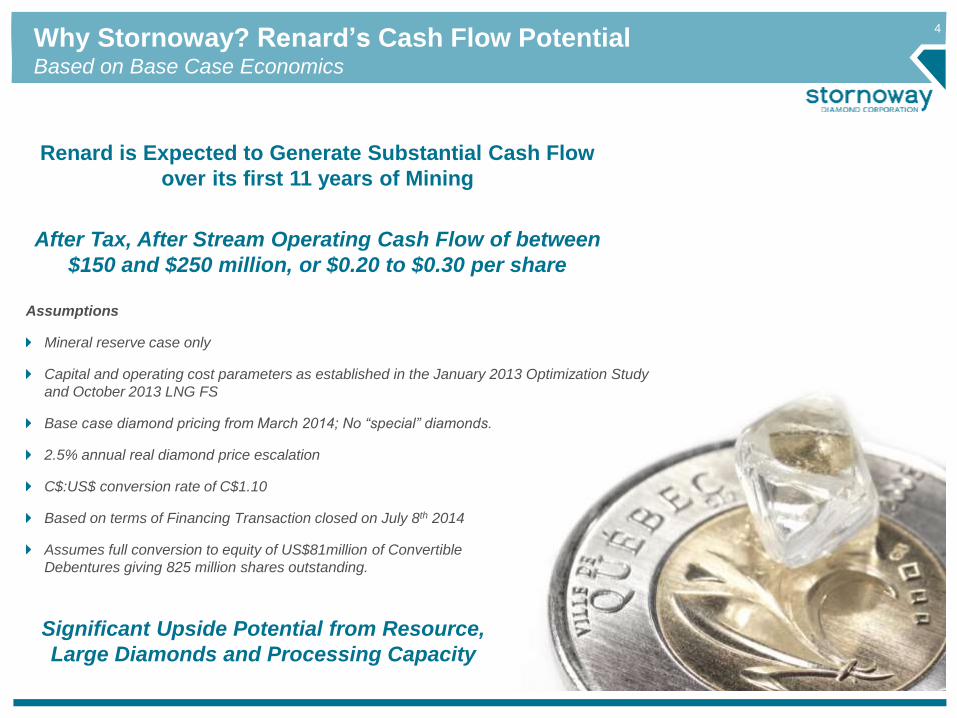
Why Stornoway? Renard’s Cash Flow PotentialBased on Base Case Economics
Renard is Expected to Generate Substantial Cash Flow
over its first 11 years of Mining
After Tax, After Stream Operating Cash Flow of between
$150 and $250 million, or $0.20 to $0.30 per share
Assumptions
Mineral reserve case only
Capital and operating cost parameters as established in the January 2013 Optimization Study
and October 2013 LNG FS
Base case diamond pricing from March 2014; No “special” diamonds.
2.5% annual real diamond price escalation
C$:US$ conversion rate of C$1.10
Based on terms of Financing Transaction closed on July 8th 2014
Assumes full conversion to equity of US$81million of Convertible
Debentures giving 825 million shares outstanding.
Significant Upside Potential from Resource,
Large Diamonds and Processing Capacity
5
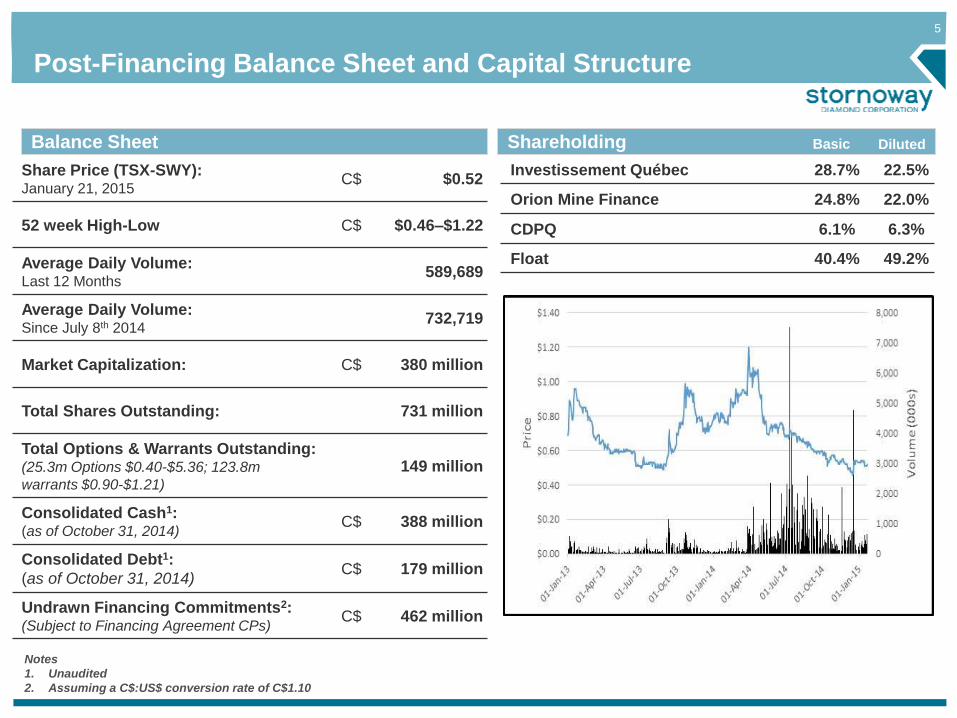
Shareholding
Share Price (TSX-SWY):January 21, 2015
C$ $0.52
52 week High-Low C$ $0.46–$1.22
Average Daily Volume:Last 12 Months
589,689
Average Daily Volume:Since July 8th 2014
732,719
Market Capitalization: C$ 380 million
Total Shares Outstanding: 731 million
Total Options & Warrants Outstanding:(25.3m Options $0.40-$5.36; 123.8m
warrants $0.90-$1.21)
149 million
Consolidated Cash1: (as of October 31, 2014)
C$ 388 million
Consolidated Debt1:
(as of October 31, 2014)C$ 179 million
Undrawn Financing Commitments2: (Subject to Financing Agreement CPs)
C$ 462 million
Balance Sheet
Post-Financing Balance Sheet and Capital Structure
Notes
1. Unaudited
2. Assuming a C$:US$ conversion rate of C$1.10
Investissement Québec 28.7% 22.5%
Orion Mine Finance 24.8% 22.0%
CDPQ 6.1% 6.3%
Float 40.4% 49.2%
DilutedBasic
6
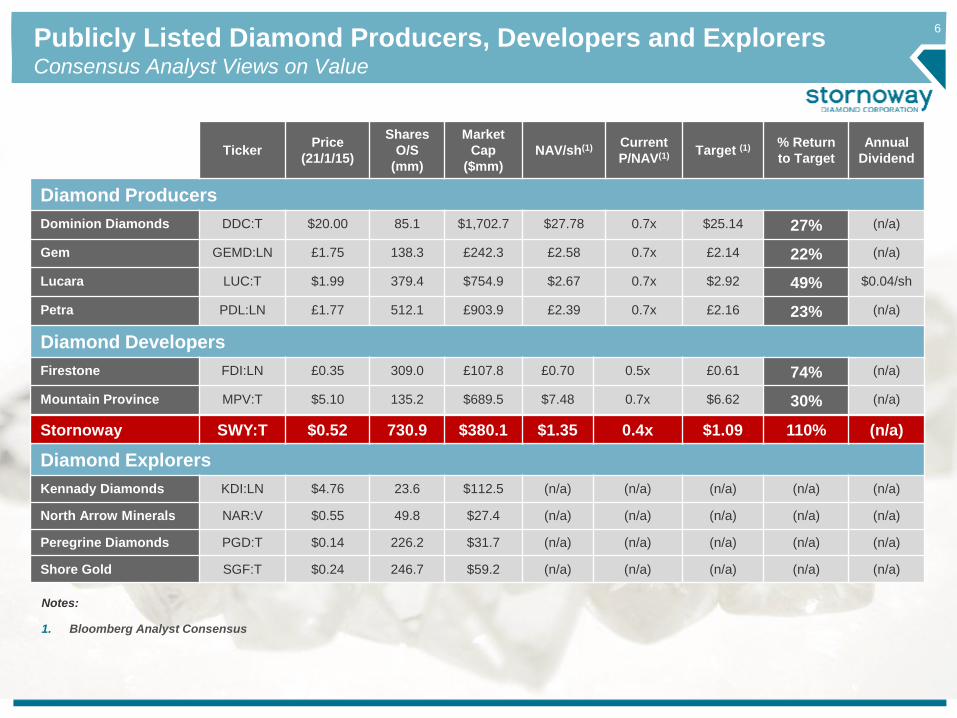
Publicly Listed Diamond Producers, Developers and ExplorersConsensus Analyst Views on Value
TickerPrice
(21/1/15)
Shares
O/S
(mm)
Market
Cap
($mm)
NAV/sh(1) Current
P/NAV(1) Target (1) % Return
to Target
Annual
Dividend
Diamond Producers
Dominion Diamonds DDC:T $20.00 85.1 $1,702.7 $27.78 0.7x $25.14 27% (n/a)
Gem GEMD:LN £1.75 138.3 £242.3 £2.58 0.7x £2.14 22% (n/a)
Lucara LUC:T $1.99 379.4 $754.9 $2.67 0.7x $2.92 49% $0.04/sh
Petra PDL:LN £1.77 512.1 £903.9 £2.39 0.7x £2.16 23% (n/a)
Diamond Developers
Firestone FDI:LN £0.35 309.0 £107.8 £0.70 0.5x £0.61 74% (n/a)
Mountain Province MPV:T $5.10 135.2 $689.5 $7.48 0.7x $6.62 30% (n/a)
Stornoway SWY:T $0.64 730.9 $1.35 0.5x $1.15 (n/a)
Diamond Explorers
Kennady Diamonds KDI:LN $4.76 23.6 $112.5 (n/a) (n/a) (n/a) (n/a) (n/a)
North Arrow Minerals NAR:V $0.55 49.8 $27.4 (n/a) (n/a) (n/a) (n/a) (n/a)
Peregrine Diamonds PGD:T $0.14 226.2 $31.7 (n/a) (n/a) (n/a) (n/a) (n/a)
Shore Gold SGF:T $0.24 246.7 $59.2 (n/a) (n/a) (n/a) (n/a) (n/a)
Notes:
1. Bloomberg Analyst Consensus
Stornoway SWY:T $0.52 730.9 $380.1 $1.35 0.4x $1.09 110% (n/a)

77
Renard: Québec’s First Diamond Mine
8
Lynx
R10
N
R7
R1Hibou
R4
R9R2
R3
R65
R8
Kimberlite Bodies with
Measured and Indicated
Resources
Hibou
Lynx
R4
R9R2
R3
R65
Kimberlite Bodies with
Resource Potential
R1Hibou
Lynx
Legend
Stornoway Properties
Hydro-Québec Facility
Renard Kimberlites
Kimberlitic Dyke
Regional Kimberlites
Hydro-Québec
Powerlines
Route 167 Extension/
Renard Mine Road
Road
Exploration/ Mining
Projects
LEGEND:
0 1 2
Kilometers
60 0 60 120
Kilometers
Renard
LG3LG2LG4
Laforge 1
Laforge 2
Brisay
Foxtrot Property
Strateco
Eastmain MineWestern Troy
Troilus Mine
Eleonore
Temiscamie
Mistissini
ChibougamauMatagami
Wemindji
Renard Kimberlite Bodies
Kimberlite Bodies with
Inferred Resources
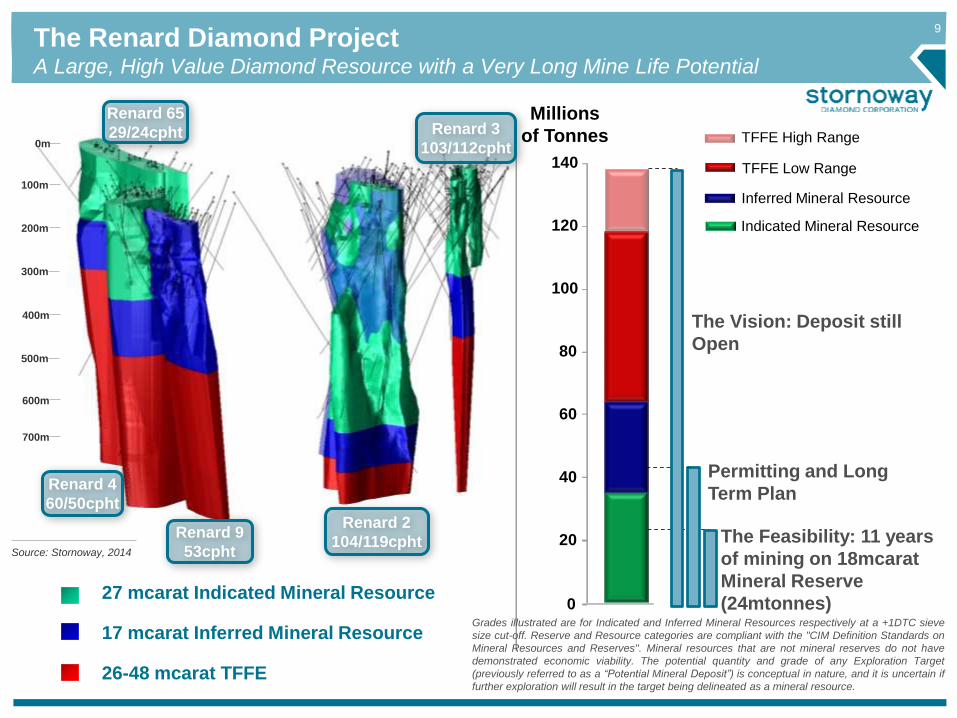
9
The Feasibility: 11 years
of mining on 18mcarat
Mineral Reserve
(24mtonnes)
Permitting and Long
Term Plan
The Vision: Deposit still
Open
40
60
80
100
120
140
Millions
of Tonnes
20
0
TFFE High Range
Inferred Mineral Resource
TFFE Low Range
Indicated Mineral Resource
The Renard Diamond ProjectA Large, High Value Diamond Resource with a Very Long Mine Life Potential
0m
100m
200m
400m
600m
700m
500m
300m
Renard 65
29/24cpht Renard 3
103/112cpht
Renard 2
104/119cphtRenard 9
53cpht
Renard 4
60/50cpht
27 mcarat Indicated Mineral Resource
17 mcarat Inferred Mineral Resource
26-48 mcarat TFFE
Source: Stornoway, 2014
Grades illustrated are for Indicated and Inferred Mineral Resources respectively at a +1DTC sieve
size cut-off. Reserve and Resource categories are compliant with the "CIM Definition Standards on
Mineral Resources and Reserves". Mineral resources that are not mineral reserves do not have
demonstrated economic viability. The potential quantity and grade of any Exploration Target
(previously referred to as a “Potential Mineral Deposit”) is conceptual in nature, and it is uncertain if
further exploration will result in the target being delineated as a mineral resource.
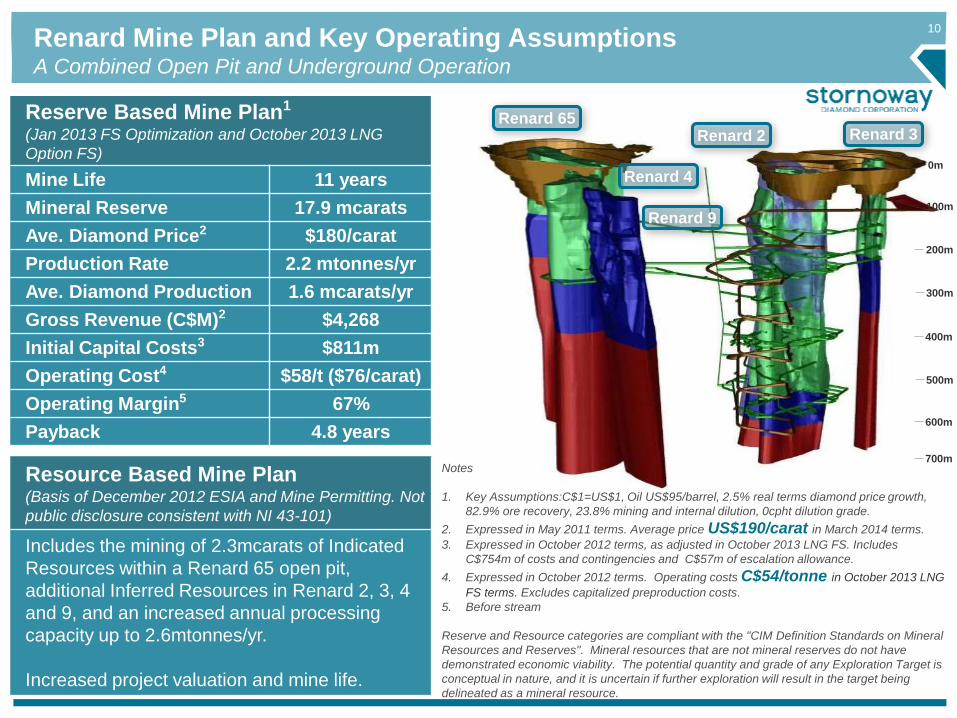
Renard Mine Plan and Key Operating AssumptionsA Combined Open Pit and Underground Operation
0m
100m
200m
400m
600m
700m
500m
300m
Notes
1. Key Assumptions:C$1=US$1, Oil US$95/barrel, 2.5% real terms diamond price growth,
82.9% ore recovery, 23.8% mining and internal dilution, 0cpht dilution grade.
2. Expressed in May 2011 terms. Average price US$190/carat in March 2014 terms.
3. Expressed in October 2012 terms, as adjusted in October 2013 LNG FS. Includes
C$754m of costs and contingencies and C$57m of escalation allowance.
4. Expressed in October 2012 terms. Operating costs C$54/tonne in October 2013 LNG
FS terms. Excludes capitalized preproduction costs.
5. Before stream
Reserve and Resource categories are compliant with the "CIM Definition Standards on Mineral
Resources and Reserves". Mineral resources that are not mineral reserves do not have
demonstrated economic viability. The potential quantity and grade of any Exploration Target is
conceptual in nature, and it is uncertain if further exploration will result in the target being
delineated as a mineral resource.
Reserve Based Mine Plan1
(Jan 2013 FS Optimization and October 2013 LNG
Option FS)
Mine Life 11 years
Mineral Reserve 17.9 mcarats
Ave. Diamond Price2 $180/carat
Production Rate 2.2 mtonnes/yr
Ave. Diamond Production 1.6 mcarats/yr
Gross Revenue (C$M)2 $4,268
Initial Capital Costs3 $811m
Operating Cost4 $58/t ($76/carat)
Operating Margin5 67%
Payback 4.8 years
Resource Based Mine Plan(Basis of December 2012 ESIA and Mine Permitting. Not
public disclosure consistent with NI 43-101)
Includes the mining of 2.3mcarats of Indicated
Resources within a Renard 65 open pit,
additional Inferred Resources in Renard 2, 3, 4
and 9, and an increased annual processing
capacity up to 2.6mtonnes/yr.
Increased project valuation and mine life.
Renard 65Renard 2 Renard 3
Renard 4
Renard 9
10
11
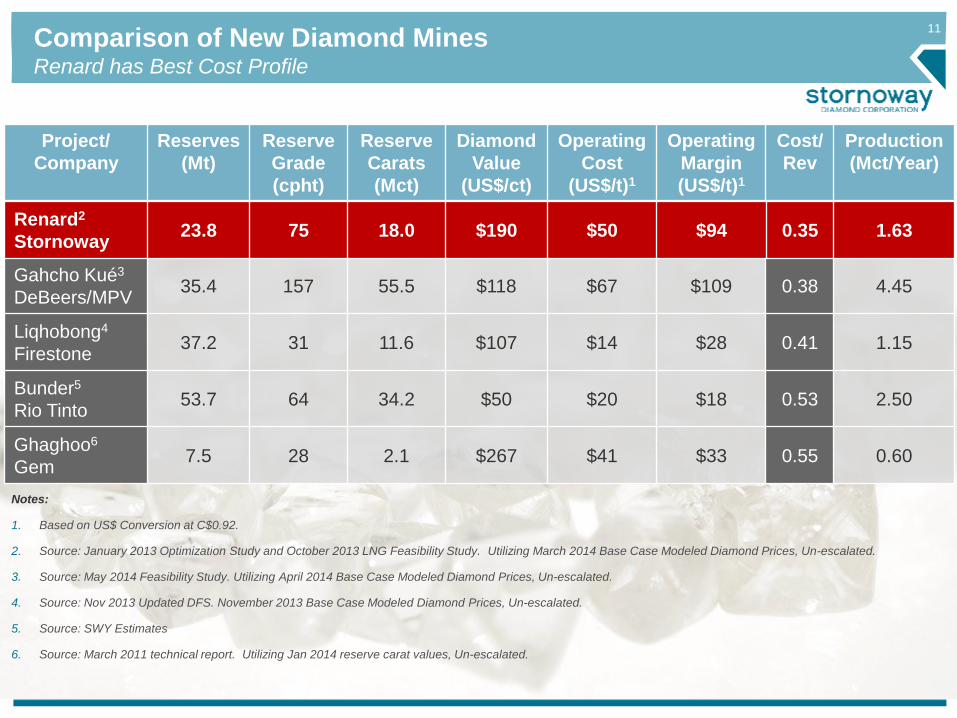
Comparison of New Diamond MinesRenard has Best Cost Profile
Project/
Company
Reserves
(Mt)
Reserve
Grade
(cpht)
Reserve
Carats
(Mct)
Diamond
Value
(US$/ct)
Operating
Cost
(US$/t)1
Operating
Margin
(US$/t)1
Cost/
Rev
Production
(Mct/Year)
Renard2
Stornoway23.8 75 18.0 $190 $50 $94 0.35 1.63
Gahcho Kué3
DeBeers/MPV35.4 157 55.5 $118 $67 $109 0.38 4.45
Liqhobong4
Firestone37.2 31 11.6 $107 $14 $28 0.41 1.15
Bunder5
Rio Tinto53.7 64 34.2 $50 $20 $18 0.53 2.50
Ghaghoo6
Gem7.5 28 2.1 $267 $41 $33 0.55 0.60
Notes:
1. Based on US$ Conversion at C$0.92.
2. Source: January 2013 Optimization Study and October 2013 LNG Feasibility Study. Utilizing March 2014 Base Case Modeled Diamond Prices, Un-escalated.
3. Source: May 2014 Feasibility Study. Utilizing April 2014 Base Case Modeled Diamond Prices, Un-escalated.
4. Source: Nov 2013 Updated DFS. November 2013 Base Case Modeled Diamond Prices, Un-escalated.
5. Source: SWY Estimates
6. Source: March 2011 technical report. Utilizing Jan 2014 reserve carat values, Un-escalated.
Renard2
Stornoway23.8 75 18.0 $190 $50 $94 0.35 1.63
12
-
500,000
1,000,000
1,500,000
2,000,000
2,500,000
20
13
20
14
20
15
20
16
20
17
20
18
20
19
20
20
20
21
20
22
20
23
20
24
20
25
20
26
20
27
Dia
mo
nd
s (
cara
ts)
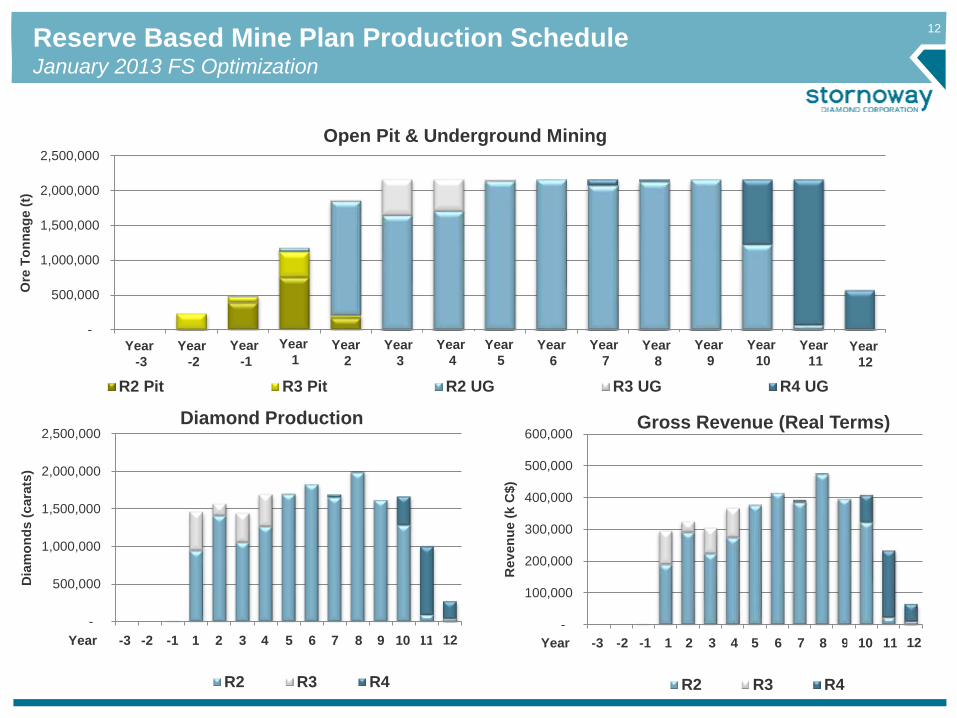
Diamond Production
R2 R3 R4
Reserve Based Mine Plan Production ScheduleJanuary 2013 FS Optimization
-
500,000
1,000,000
1,500,000
2,000,000
2,500,00020
13
20
14
20
15
20
16
20
17
20
18
20
19
20
20
20
21
20
22
20
23
20
24
20
25
20
26
20
27
Ore
To
nn
ag
e (
t)
Open Pit & Underground Mining
R2 Pit R3 Pit R2 UG R3 UG R4 UG
-
100,000
200,000
300,000
400,000
500,000
600,000
20
13
20
14
20
15
20
16
20
17
20
18
20
19
20
20
20
21
20
22
20
23
20
24
20
25
20
26
20
27
Rev
en
ue (
k C
$)
Gross Revenue (Real Terms)
R2 R3 R4
Year
1Year
2
Year
3
Year
4
Year
5
Year
6
Year
7
Year
8
Year
9
Year
10
Year
11Year
-3
Year
-2
Year
-1Year
12
Year -3 -2 -1 1 2 3 4 5 6 7 8 9 1110 12Year -3 -2 -1 1 2 3 4 5 6 7 8 9 1110 12
13
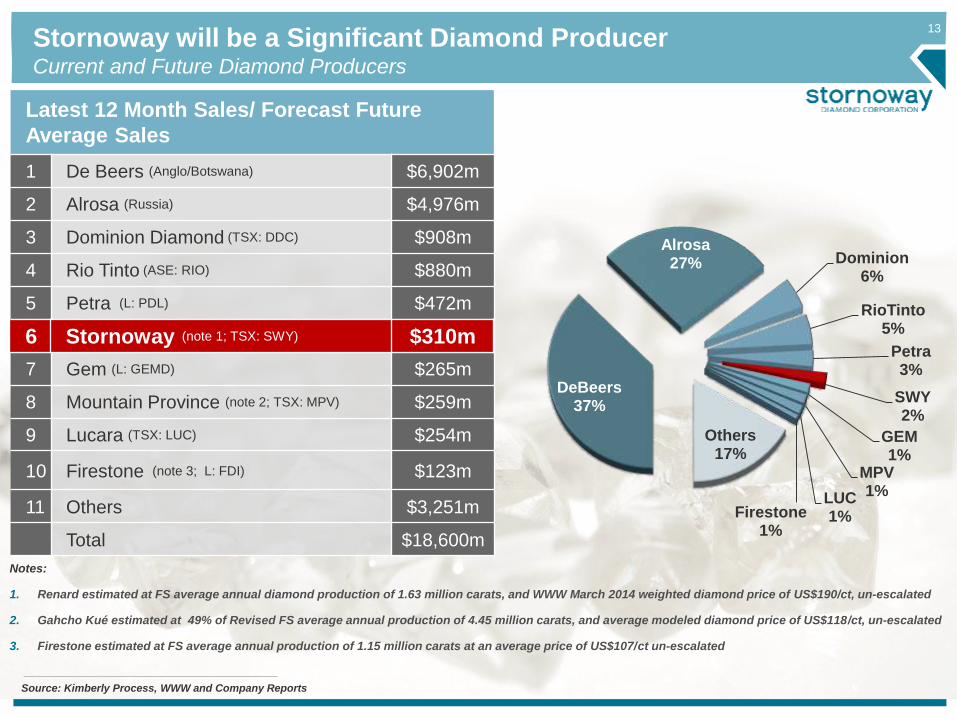
Stornoway will be a Significant Diamond ProducerCurrent and Future Diamond Producers
Source: Kimberly Process, WWW and Company Reports
Latest 12 Month Sales/ Forecast Future
Average Sales
1 De Beers (Anglo/Botswana) $6,902m
2 Alrosa (Russia) $4,976m
3 Dominion Diamond (TSX: DDC) $908m
4 Rio Tinto (ASE: RIO) $880m
5 Petra (L: PDL) $472m
6 Stornoway (note 2; TSX: SWY) $310m
7 Gem (L: GEMD) $265m
8 Mountain Province (note 2; TSX: MPV) $259m
9 Lucara (TSX: LUC) $254m
10 Firestone (note 3; L: FDI) $123m
11 Others $3,251m
Total $18,600m
DeBeers37%
Alrosa27% Dominion
6%
RioTinto5%
Petra3%
SWY2%
GEM1%
MPV1%LUC
1%Firestone1%
Others17%
Notes:
1. Renard estimated at FS average annual diamond production of 1.63 million carats, and WWW March 2014 weighted diamond price of US$190/ct, un-escalated
2. Gahcho Kué estimated at 49% of Revised FS average annual production of 4.45 million carats, and average modeled diamond price of US$118/ct, un-escalated
3. Firestone estimated at FS average annual production of 1.15 million carats at an average price of US$107/ct un-escalated
6 Stornoway (note 1; TSX: SWY) $310m
14
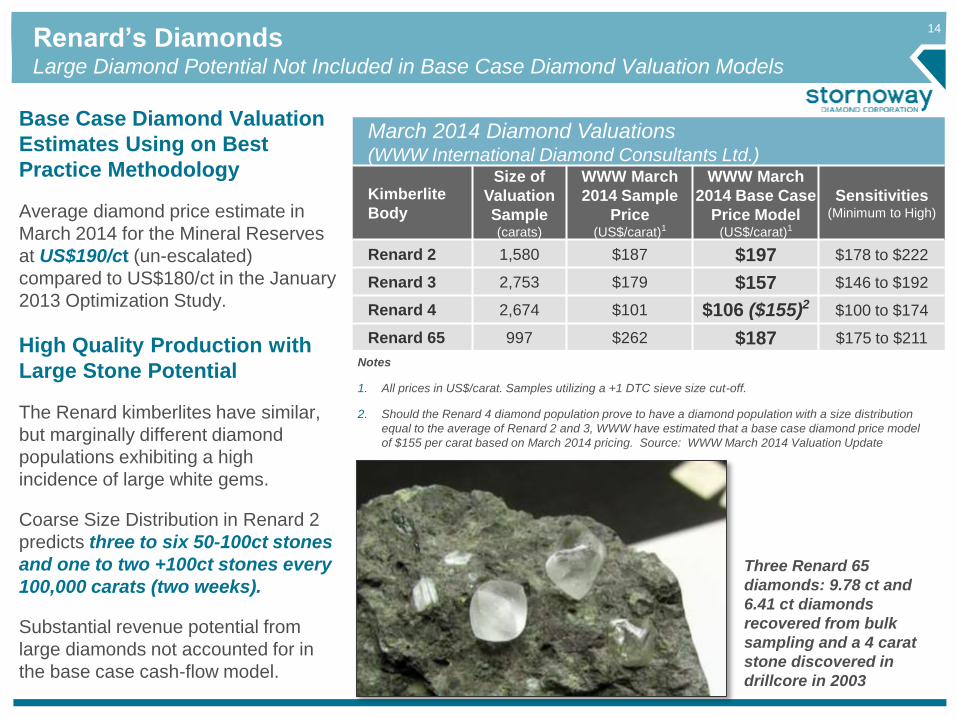
Renard’s DiamondsLarge Diamond Potential Not Included in Base Case Diamond Valuation Models
March 2014 Diamond Valuations (WWW International Diamond Consultants Ltd.)
Kimberlite
Body
Size of
Valuation
Sample(carats)
WWW March
2014 Sample
Price(US$/carat)1
WWW March
2014 Base Case
Price Model(US$/carat)1
Sensitivities(Minimum to High)
Renard 2 1,580 $187 $197 $178 to $222
Renard 3 2,753 $179 $157 $146 to $192
Renard 4 2,674 $101 $106 ($155)2 $100 to $174
Renard 65 997 $262 $187 $175 to $211
Notes
1. All prices in US$/carat. Samples utilizing a +1 DTC sieve size cut-off.
2. Should the Renard 4 diamond population prove to have a diamond population with a size distribution
equal to the average of Renard 2 and 3, WWW have estimated that a base case diamond price model
of $155 per carat based on March 2014 pricing. Source: WWW March 2014 Valuation Update
Three Renard 65
diamonds: 9.78 ct and
6.41 ct diamonds
recovered from bulk
sampling and a 4 carat
stone discovered in
drillcore in 2003
Base Case Diamond Valuation
Estimates Using on Best
Practice Methodology
Average diamond price estimate in
March 2014 for the Mineral Reserves
at US$190/ct (un-escalated)
compared to US$180/ct in the January
2013 Optimization Study.
High Quality Production with
Large Stone Potential
The Renard kimberlites have similar,
but marginally different diamond
populations exhibiting a high
incidence of large white gems.
Coarse Size Distribution in Renard 2
predicts three to six 50-100ct stones
and one to two +100ct stones every
100,000 carats (two weeks).
Substantial revenue potential from
large diamonds not accounted for in
the base case cash-flow model.
1515
Renard Construction Progress
16
Ebe Scherkus
Chairman of the
Board
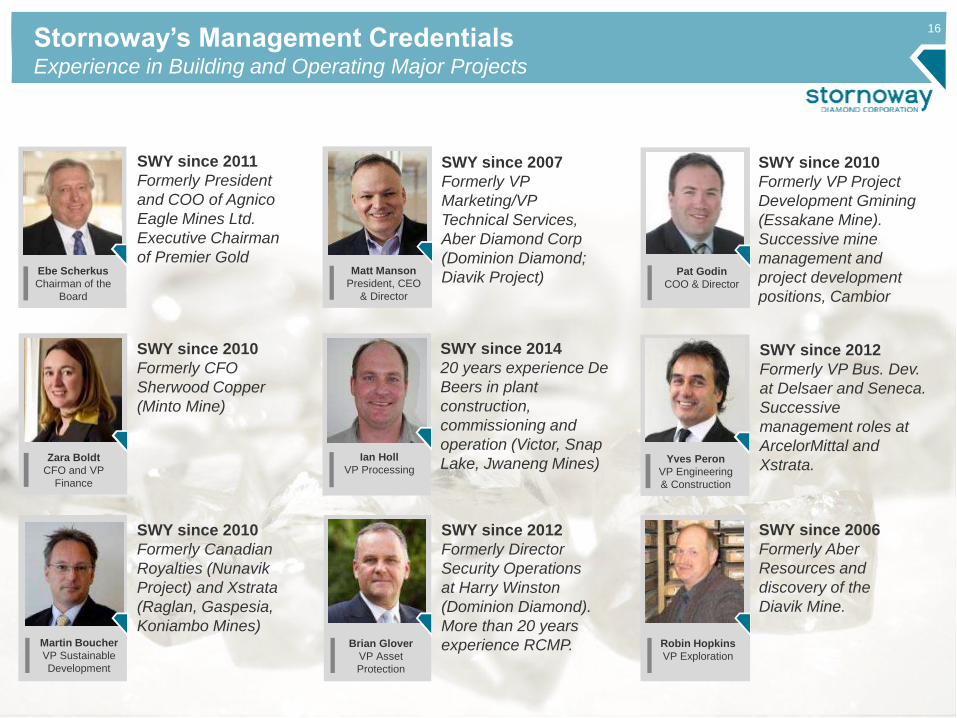
Stornoway’s Management CredentialsExperience in Building and Operating Major Projects
Matt Manson
President, CEO
& Director
Pat Godin
COO & Director
SWY since 2011
Formerly President
and COO of Agnico
Eagle Mines Ltd.
Executive Chairman
of Premier Gold
SWY since 2007
Formerly VP
Marketing/VP
Technical Services,
Aber Diamond Corp
(Dominion Diamond;
Diavik Project)
SWY since 2010
Formerly VP Project
Development Gmining
(Essakane Mine).
Successive mine
management and
project development
positions, Cambior
Ian Holl
VP Processing
SWY since 2014
20 years experience De
Beers in plant
construction,
commissioning and
operation (Victor, Snap
Lake, Jwaneng Mines) Yves Peron
VP Engineering
& Construction
SWY since 2012
Formerly VP Bus. Dev.
at Delsaer and Seneca.
Successive
management roles at
ArcelorMittal and
Xstrata.
Martin Boucher
VP Sustainable
Development
SWY since 2010
Formerly Canadian
Royalties (Nunavik
Project) and Xstrata
(Raglan, Gaspesia,
Koniambo Mines)Brian Glover
VP Asset
Protection
SWY since 2012
Formerly Director
Security Operations
at Harry Winston
(Dominion Diamond).
More than 20 years
experience RCMP. Robin Hopkins
VP Exploration
SWY since 2006
Formerly Aber
Resources and
discovery of the
Diavik Mine.
Zara Boldt
CFO and VP
Finance
SWY since 2010
Formerly CFO
Sherwood Copper
(Minto Mine)
17
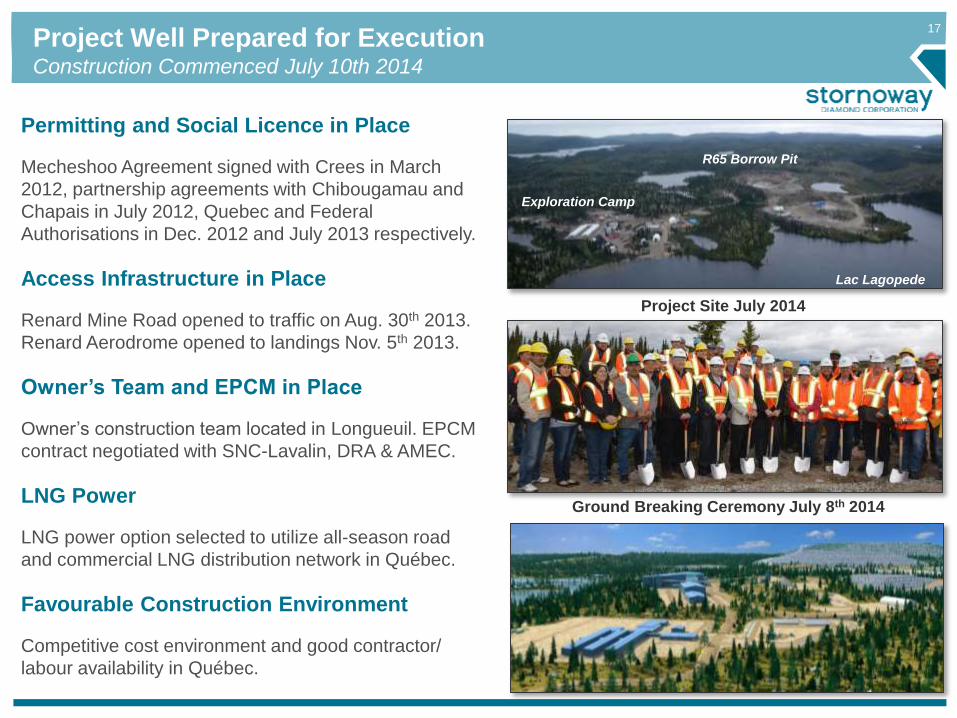
Project Well Prepared for ExecutionConstruction Commenced July 10th 2014
Project Site July 2014
Permitting and Social Licence in Place
Mecheshoo Agreement signed with Crees in March
2012, partnership agreements with Chibougamau and
Chapais in July 2012, Quebec and Federal
Authorisations in Dec. 2012 and July 2013 respectively.
Access Infrastructure in Place
Renard Mine Road opened to traffic on Aug. 30th 2013.
Renard Aerodrome opened to landings Nov. 5th 2013.
Owner’s Team and EPCM in Place
Owner’s construction team located in Longueuil. EPCM
contract negotiated with SNC-Lavalin, DRA & AMEC.
LNG Power
LNG power option selected to utilize all-season road
and commercial LNG distribution network in Québec.
Favourable Construction Environment
Competitive cost environment and good contractor/
labour availability in Québec.
R65 Borrow Pit
Exploration Camp
Lac Lagopede
Ground Breaking Ceremony July 8th 2014
18
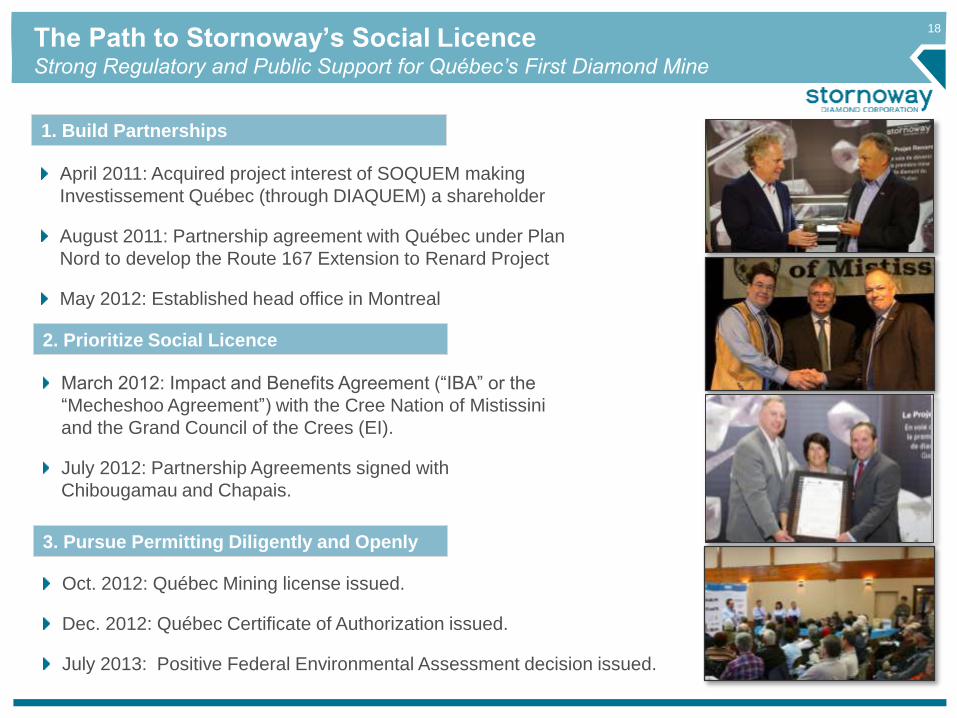
The Path to Stornoway’s Social LicenceStrong Regulatory and Public Support for Québec’s First Diamond Mine
2. Prioritize Social Licence
3. Pursue Permitting Diligently and Openly
March 2012: Impact and Benefits Agreement (“IBA” or the
“Mecheshoo Agreement”) with the Cree Nation of Mistissini
and the Grand Council of the Crees (EI).
July 2012: Partnership Agreements signed with
Chibougamau and Chapais.
Oct. 2012: Québec Mining license issued.
Dec. 2012: Québec Certificate of Authorization issued.
July 2013: Positive Federal Environmental Assessment decision issued.
1. Build Partnerships
April 2011: Acquired project interest of SOQUEM making
Investissement Québec (through DIAQUEM) a shareholder
August 2011: Partnership agreement with Québec under Plan
Nord to develop the Route 167 Extension to Renard Project
May 2012: Established head office in Montreal
19
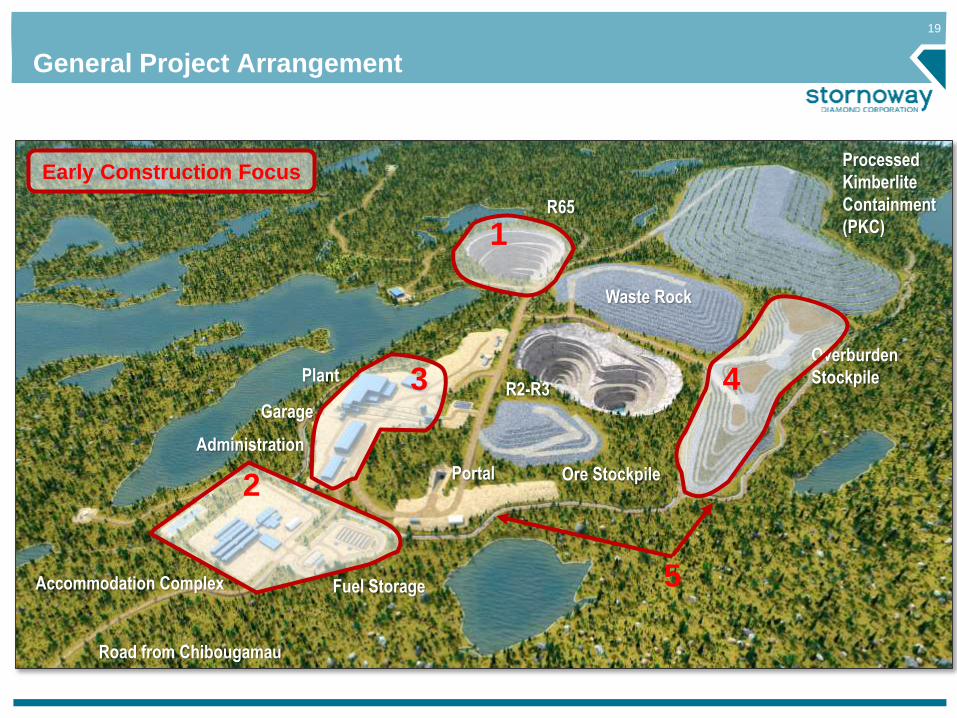
Waste Rock
Processed
Kimberlite
Containment
(PKC)
Overburden
StockpileR2-R3
Ore Stockpile
R65
Accommodation Complex
Plant
Road from Chibougamau
Garage
Administration
Portal
General Project Arrangement
Fuel Storage
2
3 4
5
1
Early Construction Focus
20
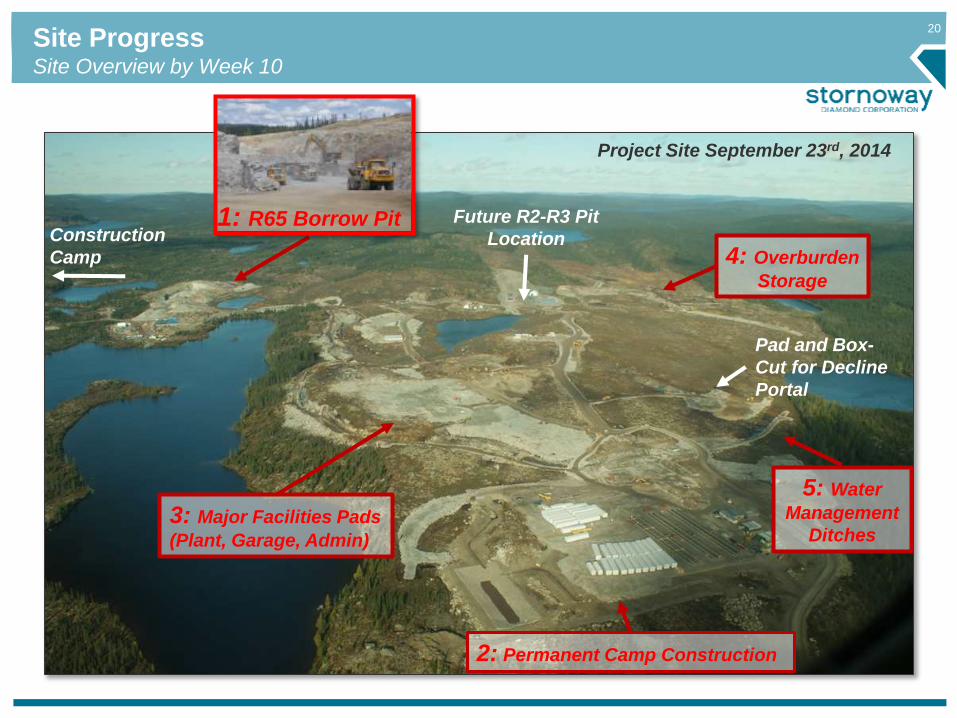
Site ProgressSite Overview by Week 10
Project Site September 23rd, 2014
Construction
Camp
3: Major Facilities Pads
(Plant, Garage, Admin)
2: Permanent Camp Construction
Pad and Box-
Cut for Decline
Portal
Future R2-R3 Pit
Location
5: Water
Management
Ditches
4: Overburden
Storage
1: R65 Borrow Pit
21
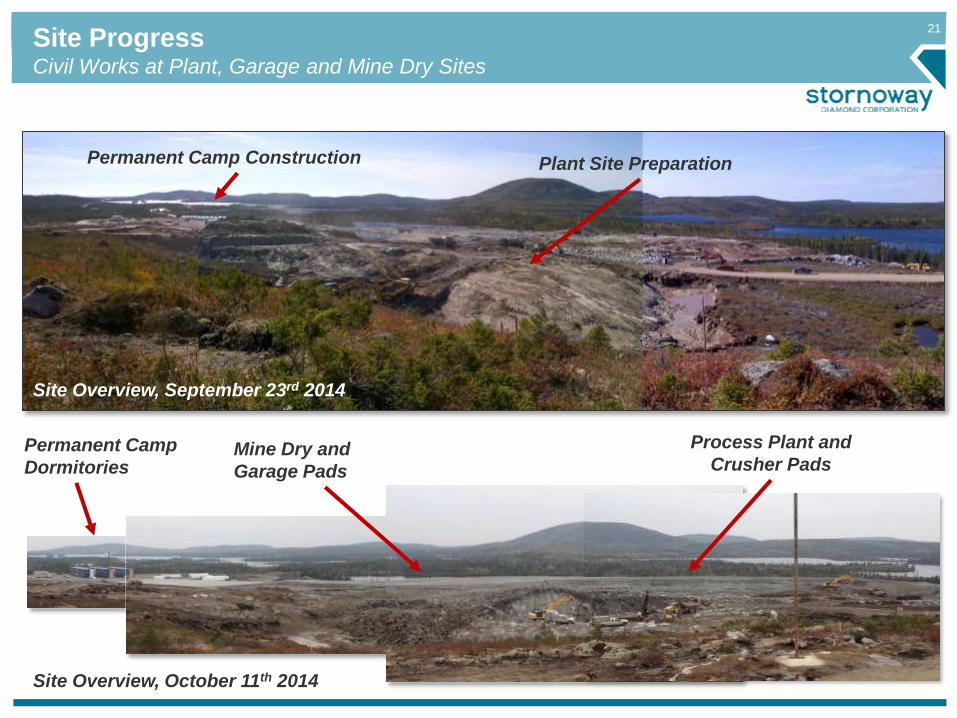
Site ProgressCivil Works at Plant, Garage and Mine Dry Sites
Site Overview, September 23rd 2014
Permanent Camp Construction Plant Site Preparation
Site Overview, October 11th 2014
Permanent Camp
DormitoriesMine Dry and
Garage Pads
Process Plant and
Crusher Pads
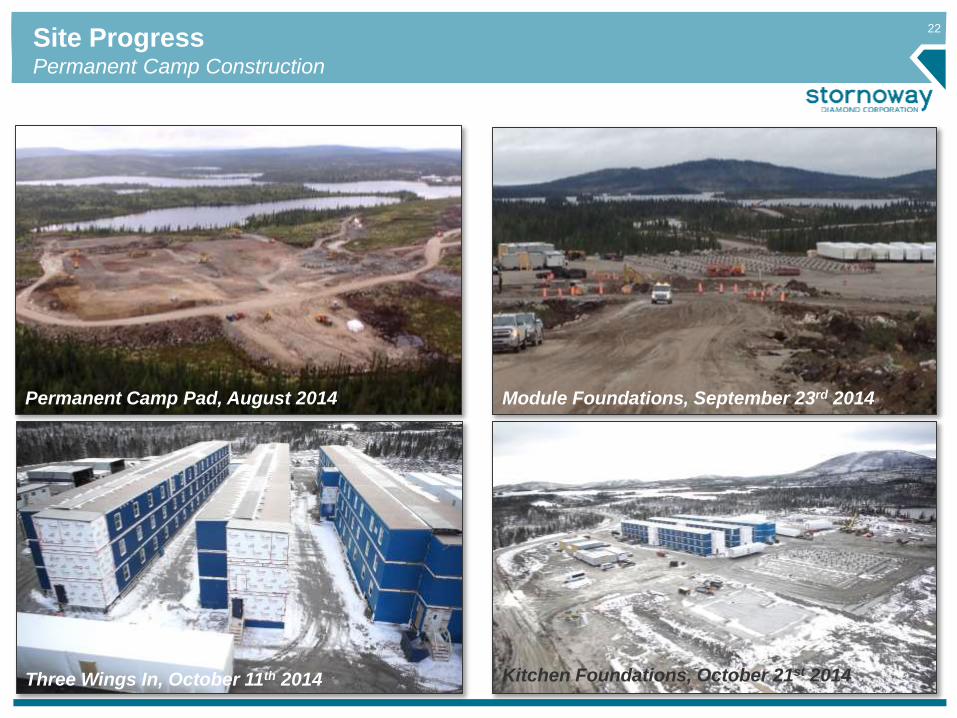
22
Site ProgressPermanent Camp Construction
Permanent Camp Pad, August 2014 Module Foundations, September 23rd 2014
Three Wings In, October 11th 2014 Kitchen Foundations, October 21st 2014
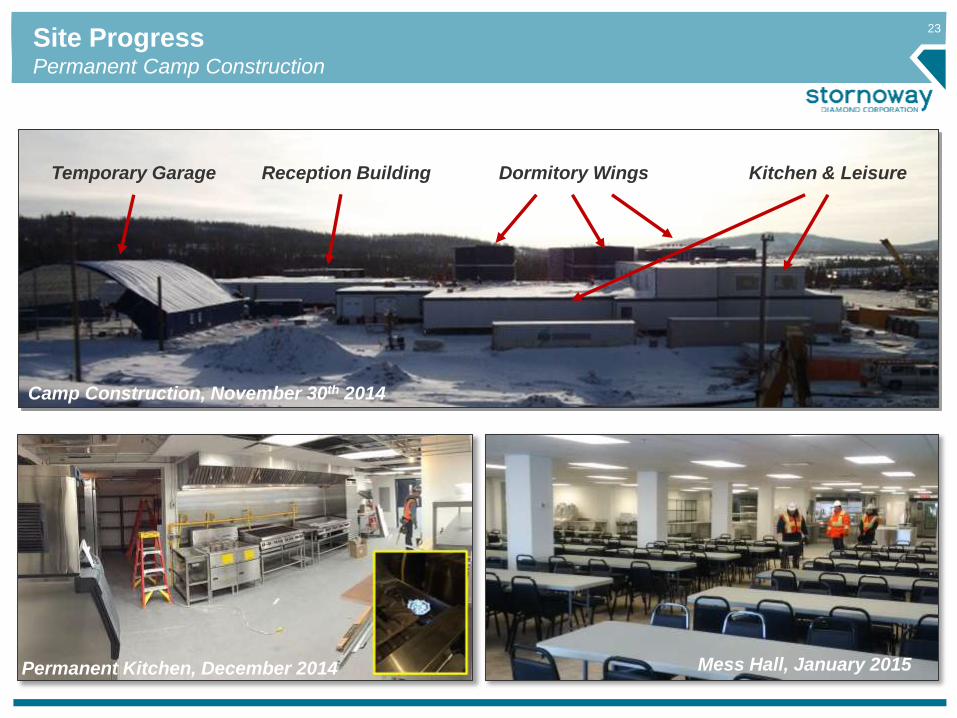
23
Site ProgressPermanent Camp Construction
Camp Construction, November 30th 2014
Dormitory Wings Kitchen & LeisureReception BuildingTemporary Garage
Permanent Kitchen, December 2014 Mess Hall, January 2015
24
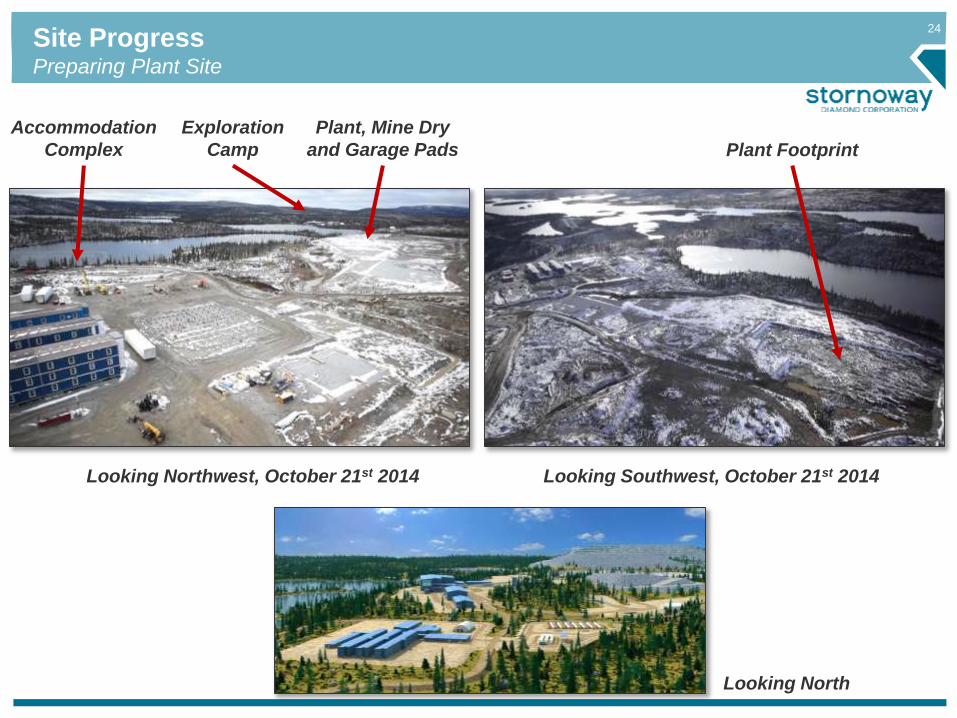
Site ProgressPreparing Plant Site
Looking Northwest, October 21st 2014 Looking Southwest, October 21st 2014
Exploration
Camp
Plant, Mine Dry
and Garage Pads
Looking North
Accommodation
Complex Plant Footprint
25
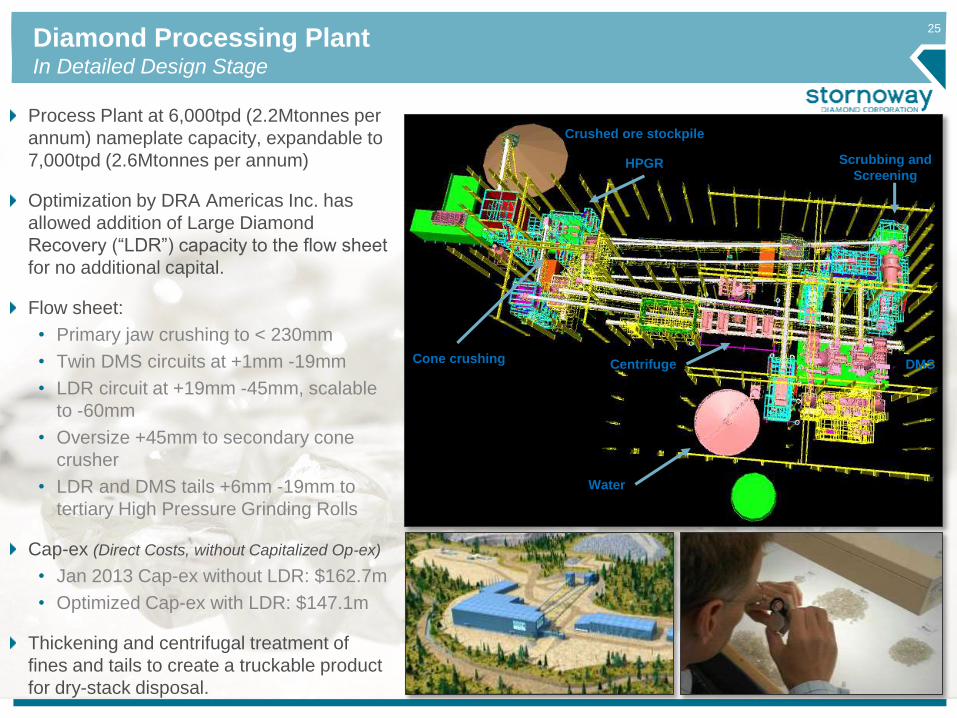
Process Plant at 6,000tpd (2.2Mtonnes per
annum) nameplate capacity, expandable to
7,000tpd (2.6Mtonnes per annum)
Optimization by DRA Americas Inc. has
allowed addition of Large Diamond
Recovery (“LDR”) capacity to the flow sheet
for no additional capital.
Flow sheet:
• Primary jaw crushing to < 230mm
• Twin DMS circuits at +1mm -19mm
• LDR circuit at +19mm -45mm, scalable
to -60mm
• Oversize +45mm to secondary cone
crusher
• LDR and DMS tails +6mm -19mm to
tertiary High Pressure Grinding Rolls
Cap-ex (Direct Costs, without Capitalized Op-ex)
• Jan 2013 Cap-ex without LDR: $162.7m
• Optimized Cap-ex with LDR: $147.1m
Thickening and centrifugal treatment of
fines and tails to create a truckable product
for dry-stack disposal.
Diamond Processing PlantIn Detailed Design Stage
Crushed ore stockpile
Scrubbing and
Screening
DMSCentrifugeCone crushing
HPGR
Water
26
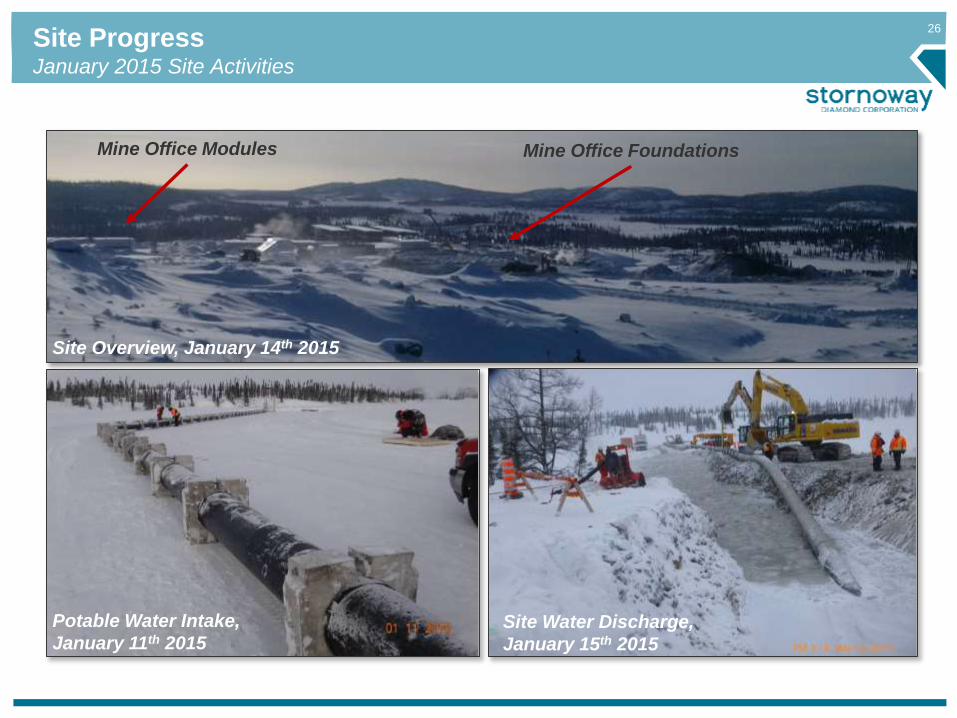
Site ProgressJanuary 2015 Site Activities
Site Overview, January 14th 2015
Potable Water Intake,
January 11th 2015Site Water Discharge,
January 15th 2015
Mine Office FoundationsMine Office Modules
27
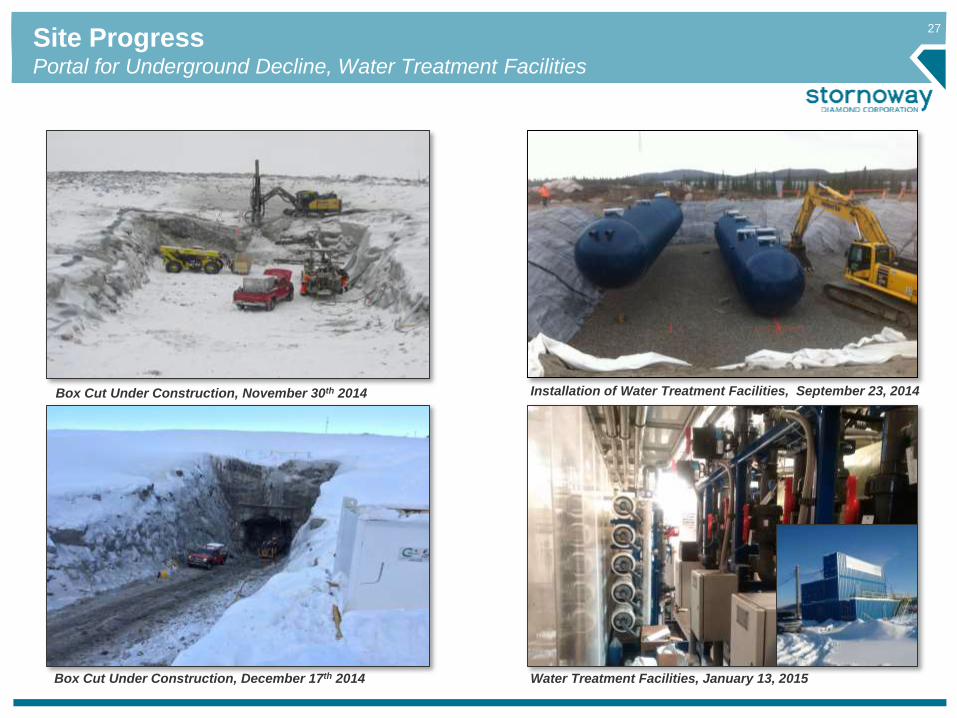
Site ProgressPortal for Underground Decline, Water Treatment Facilities
Box Cut Under Construction, November 30th 2014
Box Cut Under Construction, December 17th 2014 Water Treatment Facilities, January 13, 2015
Installation of Water Treatment Facilities, September 23, 2014
28
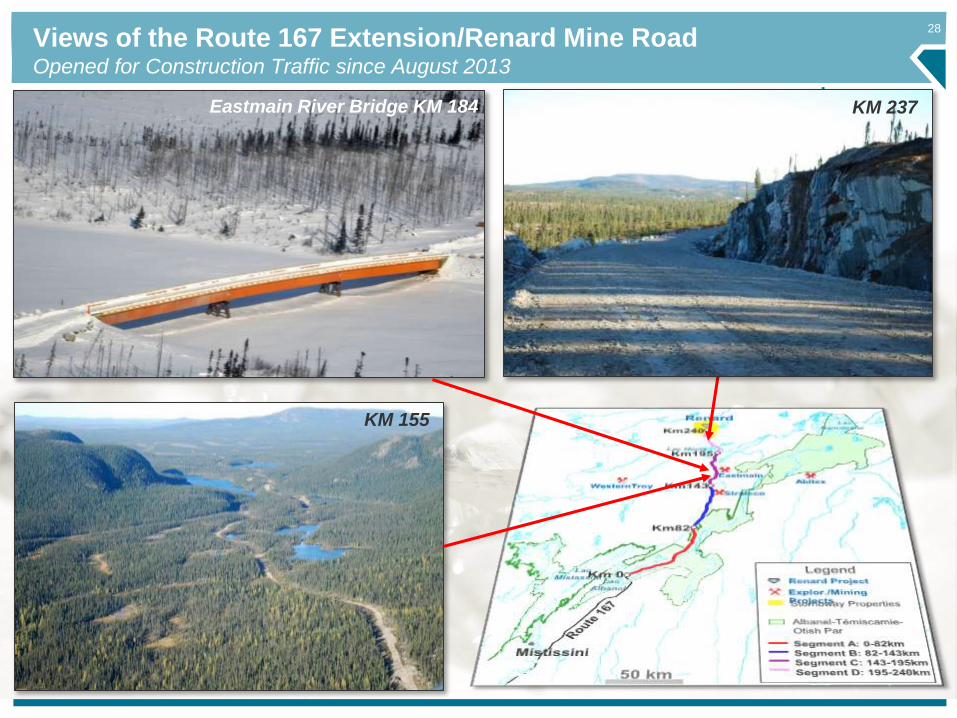
Views of the Route 167 Extension/Renard Mine RoadOpened for Construction Traffic since August 2013
KM 237
KM 155
Eastmain River Bridge KM 184
29
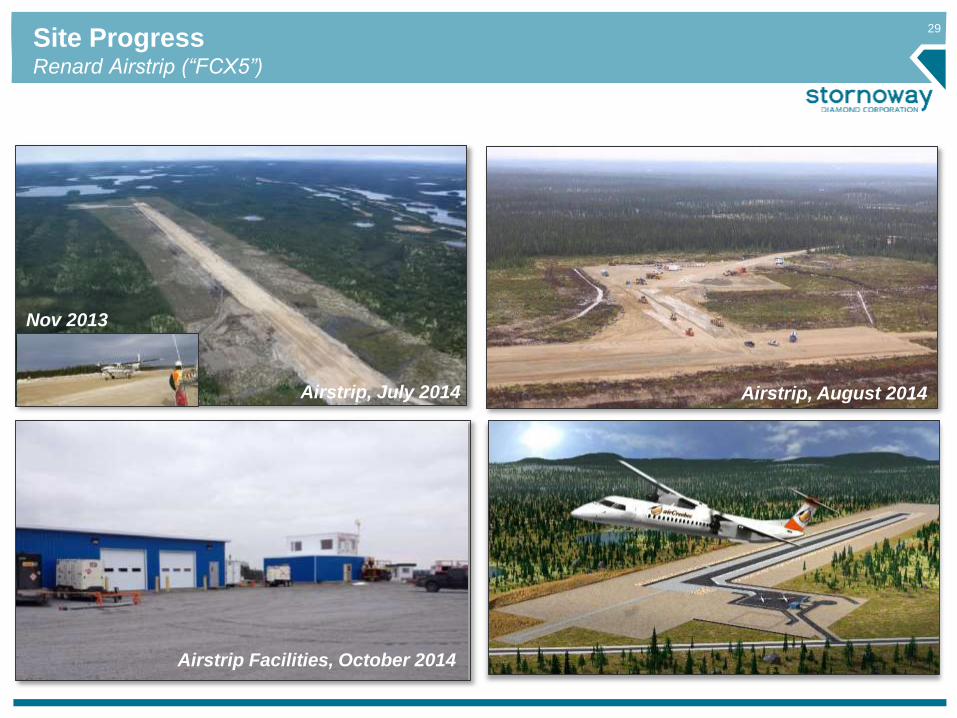
Airstrip, July 2014
Nov 2013
Airstrip, August 2014
Site ProgressRenard Airstrip (“FCX5”)
Airstrip Facilities, October 2014
30
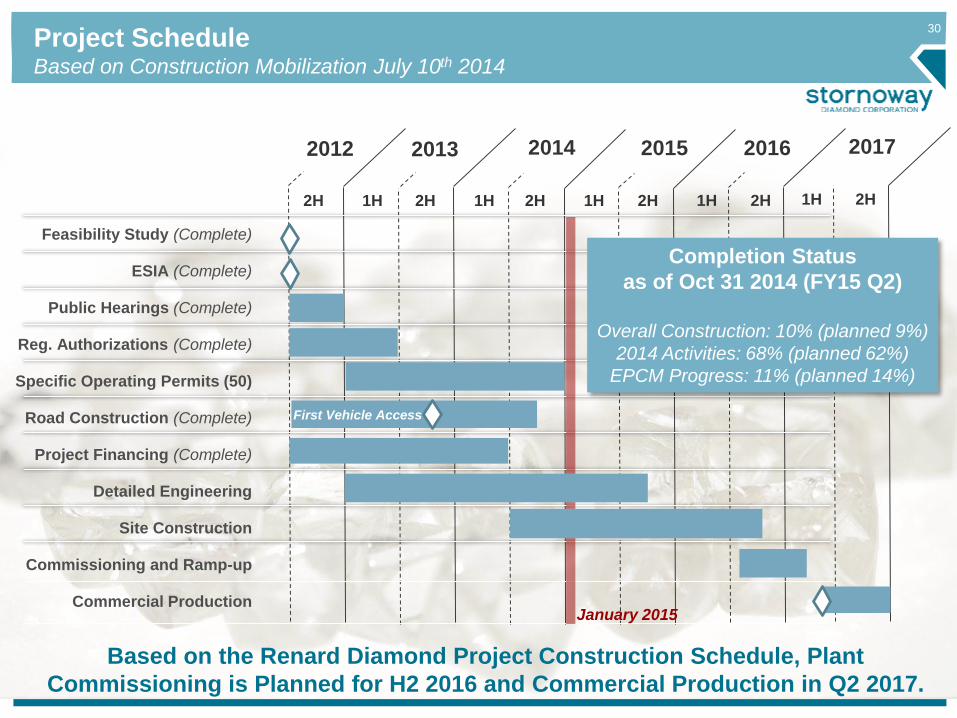
Project ScheduleBased on Construction Mobilization July 10th 2014
Feasibility Study (Complete)
ESIA (Complete)
Public Hearings (Complete)
Reg. Authorizations (Complete)
Specific Operating Permits (50)
Road Construction (Complete)
Project Financing (Complete)
Detailed Engineering
Site Construction
Commissioning and Ramp-up
Commercial Production
2012
2H 2H 2H 2H2H 1H 1H 1H1H
2013 2014 2015 2016
2H1H
2017
Based on the Renard Diamond Project Construction Schedule, Plant
Commissioning is Planned for H2 2016 and Commercial Production in Q2 2017.
January 2015
First Vehicle Access
Completion Status
as of Oct 31 2014 (FY15 Q2)
Overall Construction: 10% (planned 9%)
2014 Activities: 68% (planned 62%)
EPCM Progress: 11% (planned 14%)
31
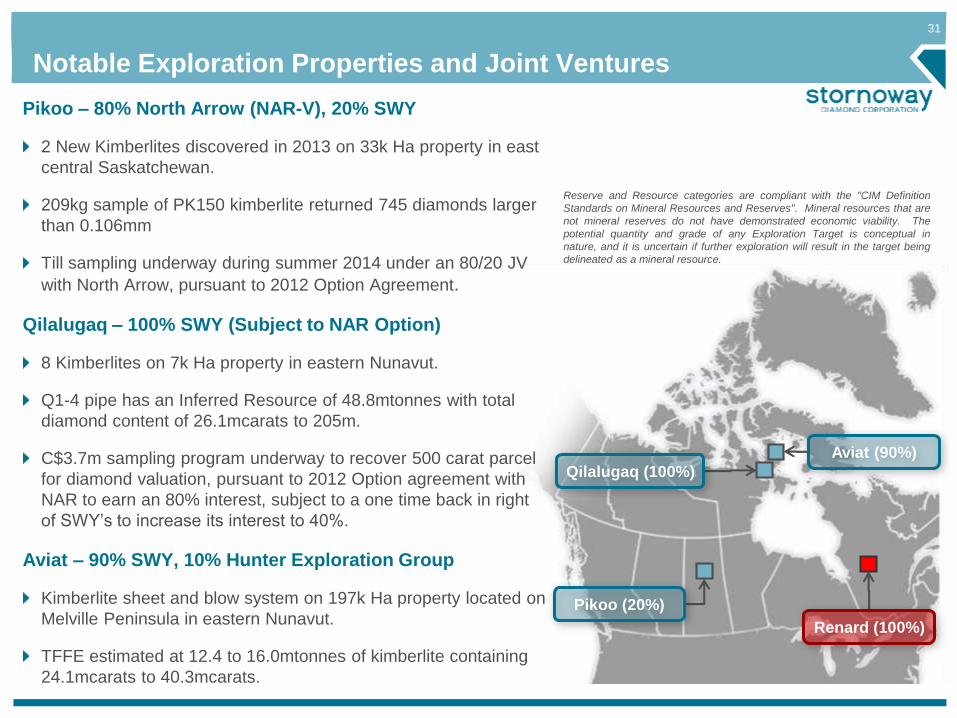
Notable Exploration Properties and Joint Ventures
Reserve and Resource categories are compliant with the "CIM Definition
Standards on Mineral Resources and Reserves". Mineral resources that are
not mineral reserves do not have demonstrated economic viability. The
potential quantity and grade of any Exploration Target is conceptual in
nature, and it is uncertain if further exploration will result in the target being
delineated as a mineral resource.
Renard (100%)
Aviat (90%)
Qilalugaq (100%)
Pikoo (20%)
Pikoo – 80% North Arrow (NAR-V), 20% SWY
2 New Kimberlites discovered in 2013 on 33k Ha property in east
central Saskatchewan.
209kg sample of PK150 kimberlite returned 745 diamonds larger
than 0.106mm
Till sampling underway during summer 2014 under an 80/20 JV
with North Arrow, pursuant to 2012 Option Agreement.
Qilalugaq – 100% SWY (Subject to NAR Option)
8 Kimberlites on 7k Ha property in eastern Nunavut.
Q1-4 pipe has an Inferred Resource of 48.8mtonnes with total
diamond content of 26.1mcarats to 205m.
C$3.7m sampling program underway to recover 500 carat parcel
for diamond valuation, pursuant to 2012 Option agreement with
NAR to earn an 80% interest, subject to a one time back in right
of SWY’s to increase its interest to 40%.
Aviat – 90% SWY, 10% Hunter Exploration Group
Kimberlite sheet and blow system on 197k Ha property located on
Melville Peninsula in eastern Nunavut.
TFFE estimated at 12.4 to 16.0mtonnes of kimberlite containing
24.1mcarats to 40.3mcarats.

32
Stornoway Diamond Corporation TSX:SWY
100% Ownership in the Renard Diamond
Project, One of the World’s Few New
Diamond Projects Under Development
Fully Permitted and Fully Financed
Québec: World Leading Mining Jurisdiction
Top Tier Profitability Profile
Now, In Construction to Build Canada’s
Next Diamond Mine
First Production 2H 2016
3333
Appendix
34
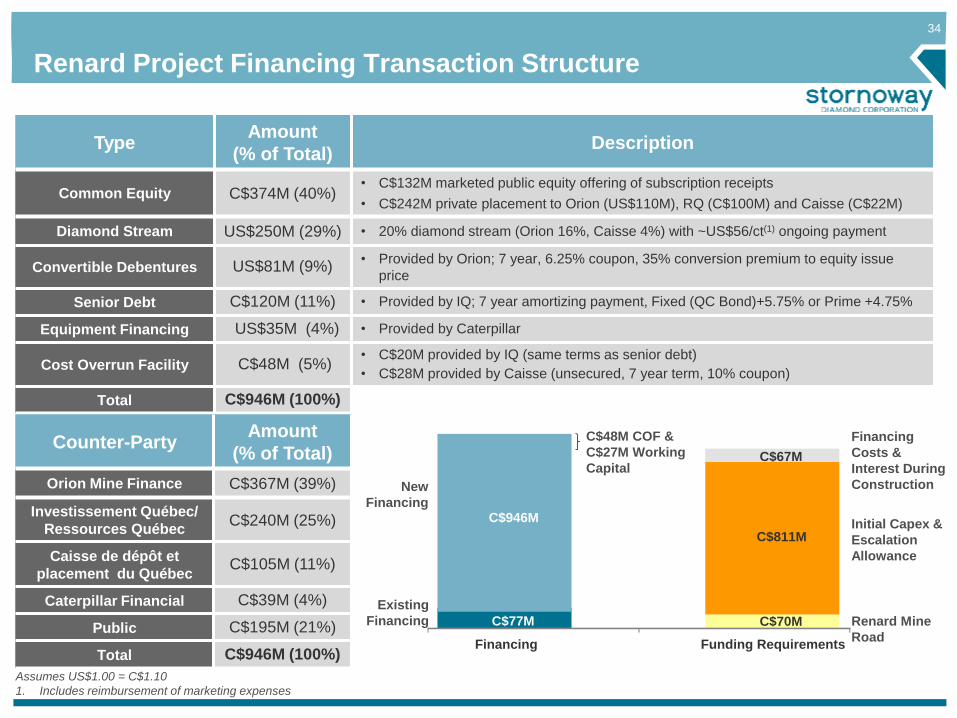
Renard Project Financing Transaction Structure
TypeAmount
(% of Total)Description
Common Equity C$374M (40%)• C$132M marketed public equity offering of subscription receipts
• C$242M private placement to Orion (US$110M), RQ (C$100M) and Caisse (C$22M)
Diamond Stream US$250M (29%) • 20% diamond stream (Orion 16%, Caisse 4%) with ~US$56/ct(1) ongoing payment
Convertible Debentures US$81M (9%)• Provided by Orion; 7 year, 6.25% coupon, 35% conversion premium to equity issue
price
Senior Debt C$120M (11%) • Provided by IQ; 7 year amortizing payment, Fixed (QC Bond)+5.75% or Prime +4.75%
Equipment Financing US$35M (4%) • Provided by Caterpillar
Cost Overrun Facility C$48M (5%)• C$20M provided by IQ (same terms as senior debt)
• C$28M provided by Caisse (unsecured, 7 year term, 10% coupon)
Total C$946M (100%)
Assumes US$1.00 = C$1.10
1. Includes reimbursement of marketing expenses
Counter-PartyAmount
(% of Total)
Orion Mine Finance C$367M (39%)
Investissement Québec/
Ressources QuébecC$240M (25%)
Caisse de dépôt et
placement du QuébecC$105M (11%)
Caterpillar Financial C$39M (4%)
Public C$195M (21%)
Total C$946M (100%)
C$77M
C$811M
C$946M
C$70M
C$67M
Financing Funding Requirements
New
Financing
Existing
Financing
C$48M COF &
C$27M Working
Capital
Financing
Costs &
Interest During
Construction
Renard Mine
Road
Initial Capex &
Escalation
Allowance
35
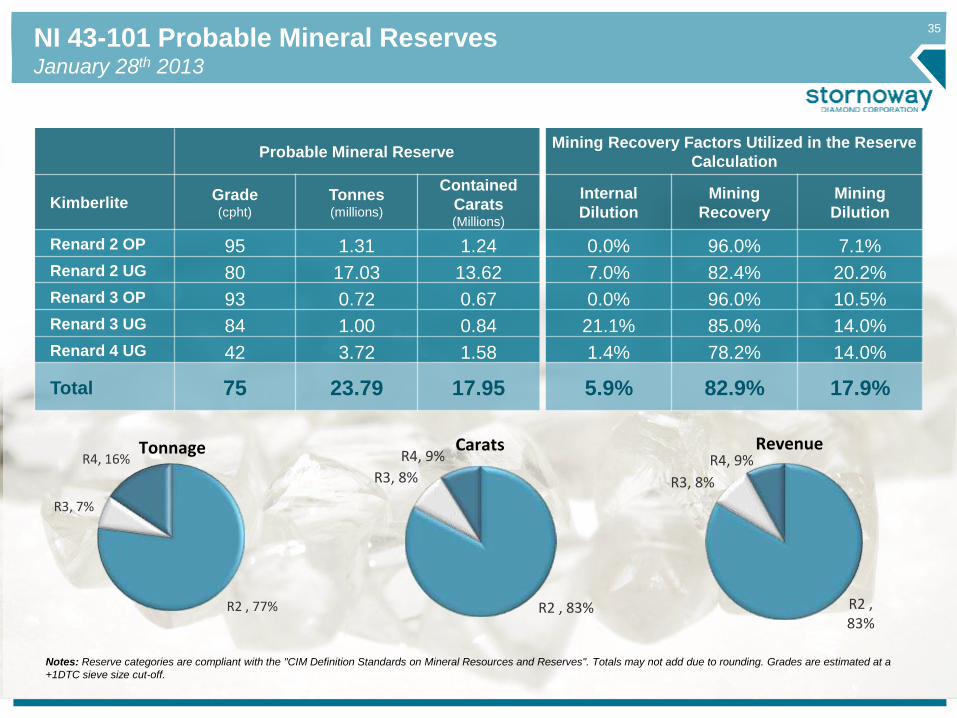
Probable Mineral ReserveMining Recovery Factors Utilized in the Reserve
Calculation
KimberliteGrade(cpht)
Tonnes(millions)
Contained
Carats(Millions)
Internal
Dilution
Mining
Recovery
Mining
Dilution
Renard 2 OP 95 1.31 1.24 0.0% 96.0% 7.1%
Renard 2 UG 80 17.03 13.62 7.0% 82.4% 20.2%
Renard 3 OP 93 0.72 0.67 0.0% 96.0% 10.5%
Renard 3 UG 84 1.00 0.84 21.1% 85.0% 14.0%
Renard 4 UG 42 3.72 1.58 1.4% 78.2% 14.0%
Total 75 23.79 17.95 5.9% 82.9% 17.9%
Notes: Reserve categories are compliant with the "CIM Definition Standards on Mineral Resources and Reserves". Totals may not add due to rounding. Grades are estimated at a
+1DTC sieve size cut-off.
R2 , 83%
R3, 8%
R4, 9%Revenue
R2 , 77%
R3, 7%
R4, 16%Tonnage
R2 , 83%
R3, 8%
R4, 9%Carats
NI 43-101 Probable Mineral ReservesJanuary 28th 2013
36
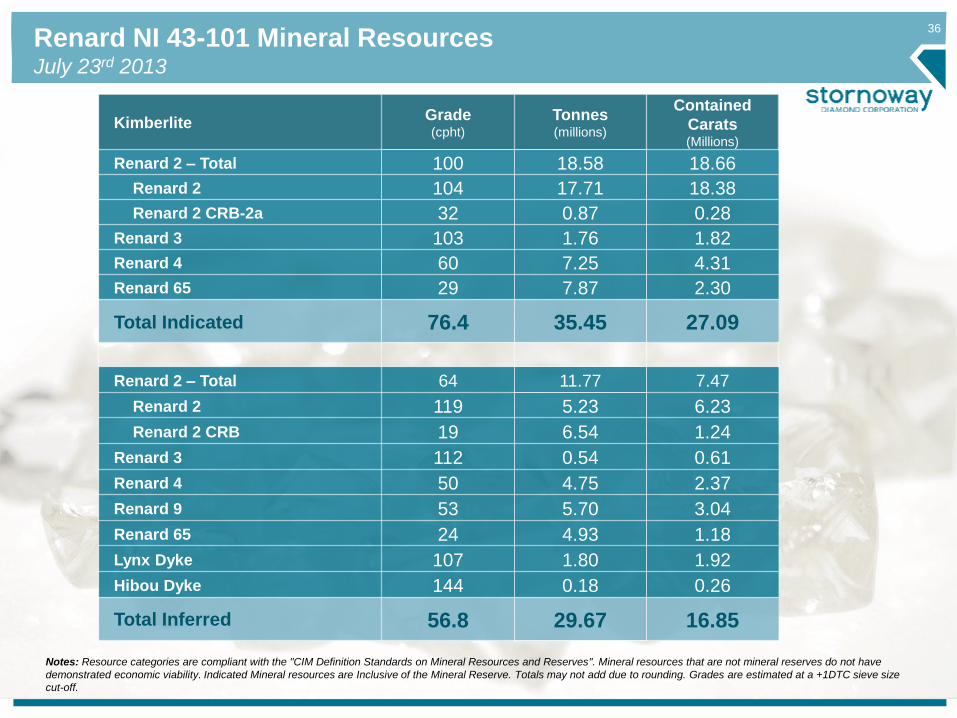
Notes: Resource categories are compliant with the "CIM Definition Standards on Mineral Resources and Reserves". Mineral resources that are not mineral reserves do not have
demonstrated economic viability. Indicated Mineral resources are Inclusive of the Mineral Reserve. Totals may not add due to rounding. Grades are estimated at a +1DTC sieve size
cut-off.
Renard NI 43-101 Mineral ResourcesJuly 23rd 2013
KimberliteGrade(cpht)
Tonnes(millions)
Contained
Carats(Millions)
Renard 2 – Total 100 18.58 18.66
Renard 2 104 17.71 18.38
Renard 2 CRB-2a 32 0.87 0.28
Renard 3 103 1.76 1.82
Renard 4 60 7.25 4.31
Renard 65 29 7.87 2.30
Total Indicated 76.4 35.45 27.09
Renard 2 – Total 64 11.77 7.47
Renard 2 119 5.23 6.23
Renard 2 CRB 19 6.54 1.24
Renard 3 112 0.54 0.61
Renard 4 50 4.75 2.37
Renard 9 53 5.70 3.04
Renard 65 24 4.93 1.18
Lynx Dyke 107 1.80 1.92
Hibou Dyke 144 0.18 0.26
Total Inferred 56.8 29.67 16.85
37
Notes: The potential quantity and grade of any exploration target (previously referred to as “potential mineral deposit”) is conceptual in nature, and it is uncertain if further exploration
will result in the target being delineated as a mineral resource. The exploration upside for the Renard kimberlite pipes has been determined by projecting reasonable kimberlite
volumes from the base of the inferred Resource to a depth of 700m below surface. In the case of the Lynx and Hibou dykes, the exploration upside was established on the basis of
known drill intersections of kimberlite for which insufficient diamond sampling exists to adequately estimate a diamond resource grade.
Target for Further ExplorationJuly 23rd 2013. Changes to Previous January 2011 Estimates in Italics
KimberliteGrade(cpht)
Tonnes(millions)
Contained Carats(Millions)
Renard 2 104 to 158 4.0 to 4.6 4.2 to 7.3
Renard 3 105 to 168 0.8 to 1.7 0.8 to 2.8
Renard 4 50 to 77 11.1 to 15.4 5.6 to 11.8
Renard 9 52 to 68 3.9 to 6.3 2.0 to 4.3
Renard 65 25 to 33 29.0 to 40.9 7.3 to 13.5
Lynx Dyke 96 to 120 3.1 to 3.2 3.0 to 3.8
Hibou Dyke 104 to 151 2.7 to 2.9 2.9 to 4.3
Total Exploration
Upside
54.6
(-0.8%)to
74.9
(-0.8%)
25.7
(+9.1%)to
47.8
(-1.4%)
38
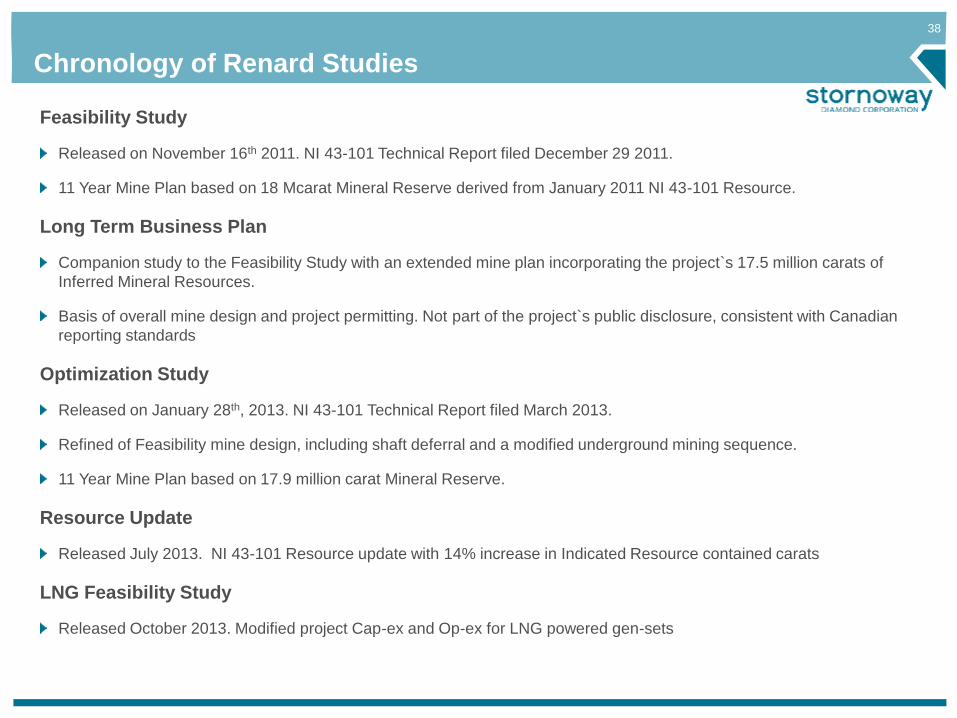
Chronology of Renard Studies
Feasibility Study
Released on November 16th 2011. NI 43-101 Technical Report filed December 29 2011.
11 Year Mine Plan based on 18 Mcarat Mineral Reserve derived from January 2011 NI 43-101 Resource.
Long Term Business Plan
Companion study to the Feasibility Study with an extended mine plan incorporating the project`s 17.5 million carats of
Inferred Mineral Resources.
Basis of overall mine design and project permitting. Not part of the project`s public disclosure, consistent with Canadian
reporting standards
Optimization Study
Released on January 28th, 2013. NI 43-101 Technical Report filed March 2013.
Refined of Feasibility mine design, including shaft deferral and a modified underground mining sequence.
11 Year Mine Plan based on 17.9 million carat Mineral Reserve.
Resource Update
Released July 2013. NI 43-101 Resource update with 14% increase in Indicated Resource contained carats
LNG Feasibility Study
Released October 2013. Modified project Cap-ex and Op-ex for LNG powered gen-sets
39
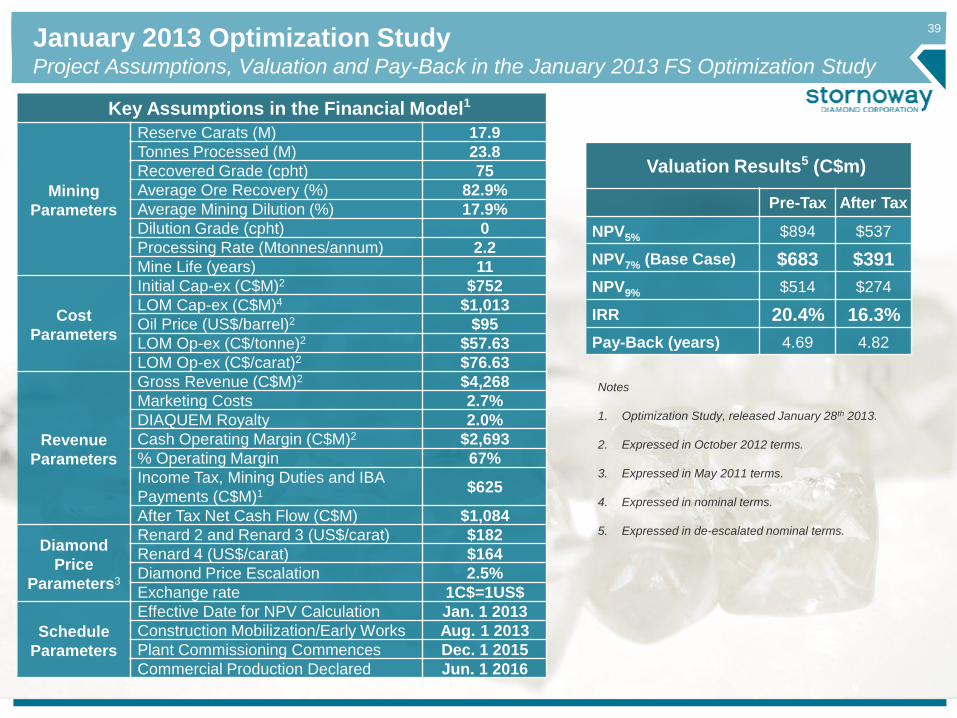
January 2013 Optimization Study Project Assumptions, Valuation and Pay-Back in the January 2013 FS Optimization Study
Key Assumptions in the Financial Model1
Mining
Parameters
Reserve Carats (M) 17.9
Tonnes Processed (M) 23.8
Recovered Grade (cpht) 75
Average Ore Recovery (%) 82.9%
Average Mining Dilution (%) 17.9%
Dilution Grade (cpht) 0
Processing Rate (Mtonnes/annum) 2.2
Mine Life (years) 11
Cost
Parameters
Initial Cap-ex (C$M)2 $752
LOM Cap-ex (C$M)4 $1,013
Oil Price (US$/barrel)2 $95
LOM Op-ex (C$/tonne)2 $57.63
LOM Op-ex (C$/carat)2 $76.63
Revenue
Parameters
Gross Revenue (C$M)2 $4,268
Marketing Costs 2.7%
DIAQUEM Royalty 2.0%
Cash Operating Margin (C$M)2 $2,693
% Operating Margin 67%
Income Tax, Mining Duties and IBA
Payments (C$M)1 $625
After Tax Net Cash Flow (C$M) $1,084
Diamond
Price
Parameters3
Renard 2 and Renard 3 (US$/carat) $182
Renard 4 (US$/carat) $164
Diamond Price Escalation 2.5%
Exchange rate 1C$=1US$
Schedule
Parameters
Effective Date for NPV Calculation Jan. 1 2013
Construction Mobilization/Early Works Aug. 1 2013
Plant Commissioning Commences Dec. 1 2015
Commercial Production Declared Jun. 1 2016
Valuation Results5 (C$m)
Pre-Tax After Tax
NPV5% $894 $537
NPV7% (Base Case) $683 $391
NPV9% $514 $274
IRR 20.4% 16.3%
Pay-Back (years) 4.69 4.82
Notes
1. Optimization Study, released January 28th 2013.
2. Expressed in October 2012 terms.
3. Expressed in May 2011 terms.
4. Expressed in nominal terms.
5. Expressed in de-escalated nominal terms.
40
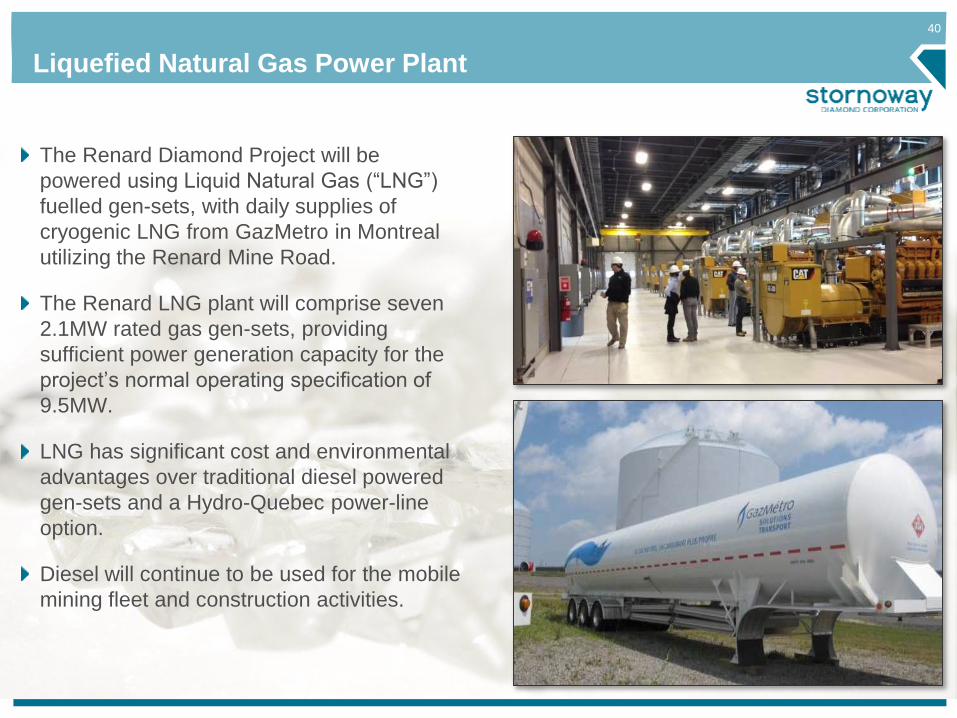
Liquefied Natural Gas Power Plant
The Renard Diamond Project will be
powered using Liquid Natural Gas (“LNG”)
fuelled gen-sets, with daily supplies of
cryogenic LNG from GazMetro in Montreal
utilizing the Renard Mine Road.
The Renard LNG plant will comprise seven
2.1MW rated gas gen-sets, providing
sufficient power generation capacity for the
project’s normal operating specification of
9.5MW.
LNG has significant cost and environmental
advantages over traditional diesel powered
gen-sets and a Hydro-Quebec power-line
option.
Diesel will continue to be used for the mobile
mining fleet and construction activities.
41
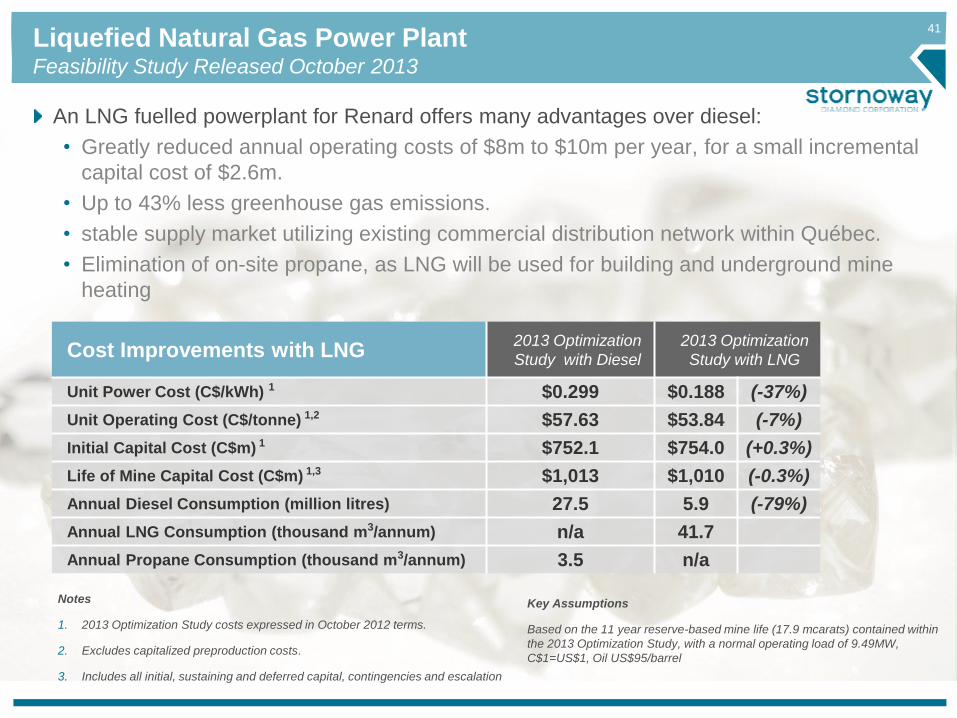
Liquefied Natural Gas Power PlantFeasibility Study Released October 2013
An LNG fuelled powerplant for Renard offers many advantages over diesel:
• Greatly reduced annual operating costs of $8m to $10m per year, for a small incremental
capital cost of $2.6m.
• Up to 43% less greenhouse gas emissions.
• stable supply market utilizing existing commercial distribution network within Québec.
• Elimination of on-site propane, as LNG will be used for building and underground mine
heating
Cost Improvements with LNG2013 Optimization
Study with Diesel
2013 Optimization
Study with LNG
Unit Power Cost (C$/kWh) 1 $0.299 $0.188 (-37%)
Unit Operating Cost (C$/tonne) 1,2 $57.63 $53.84 (-7%)
Initial Capital Cost (C$m) 1 $752.1 $754.0 (+0.3%)
Life of Mine Capital Cost (C$m) 1,3 $1,013 $1,010 (-0.3%)
Annual Diesel Consumption (million litres) 27.5 5.9 (-79%)
Annual LNG Consumption (thousand m3/annum) n/a 41.7
Annual Propane Consumption (thousand m3/annum) 3.5 n/a
Notes
1. 2013 Optimization Study costs expressed in October 2012 terms.
2. Excludes capitalized preproduction costs.
3. Includes all initial, sustaining and deferred capital, contingencies and escalation
Key Assumptions
Based on the 11 year reserve-based mine life (17.9 mcarats) contained within
the 2013 Optimization Study, with a normal operating load of 9.49MW,
C$1=US$1, Oil US$95/barrel
42
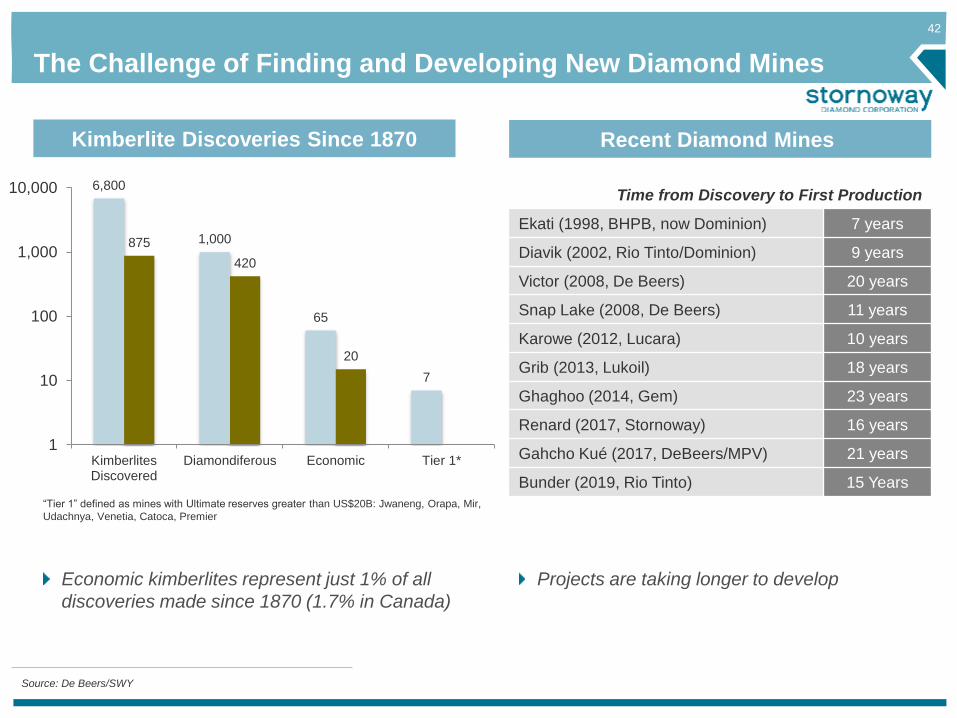
The Challenge of Finding and Developing New Diamond Mines
“Tier 1” defined as mines with Ultimate reserves greater than US$20B: Jwaneng, Orapa, Mir,
Udachnya, Venetia, Catoca, Premier
Kimberlite Discoveries Since 1870
6,800
1,000
65
7
875
420
20
1
10
100
1,000
10,000
KimberlitesDiscovered
Diamondiferous Economic Tier 1*
Recent Diamond Mines
Source: De Beers/SWY
Economic kimberlites represent just 1% of all
discoveries made since 1870 (1.7% in Canada)
Time from Discovery to First Production
Ekati (1998, BHPB, now Dominion) 7 years
Diavik (2002, Rio Tinto/Dominion) 9 years
Victor (2008, De Beers) 20 years
Snap Lake (2008, De Beers) 11 years
Karowe (2012, Lucara) 10 years
Grib (2013, Lukoil) 18 years
Ghaghoo (2014, Gem) 23 years
Renard (2017, Stornoway) 16 years
Gahcho Kué (2017, DeBeers/MPV) 21 years
Bunder (2019, Rio Tinto) 15 Years
Projects are taking longer to develop
43
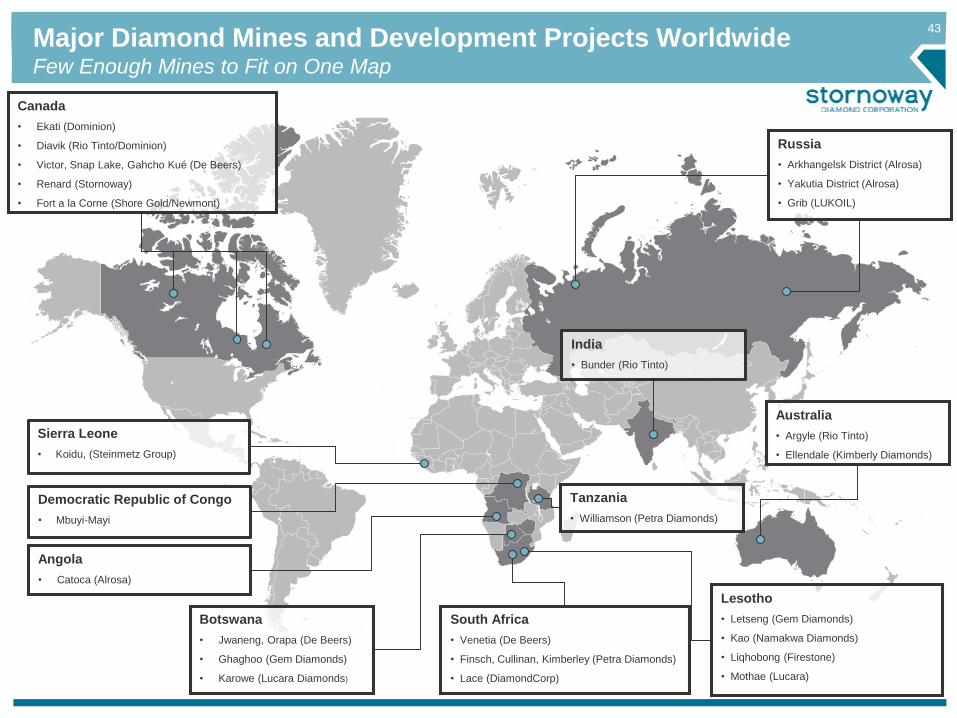
Major Diamond Mines and Development Projects WorldwideFew Enough Mines to Fit on One Map
South Africa
• Venetia (De Beers)
• Finsch, Cullinan, Kimberley (Petra Diamonds)
• Lace (DiamondCorp)
Tanzania
• Williamson (Petra Diamonds)
Russia
• Arkhangelsk District (Alrosa)
• Yakutia District (Alrosa)
• Grib (LUKOIL)
India
• Bunder (Rio Tinto)
Australia
• Argyle (Rio Tinto)
• Ellendale (Kimberly Diamonds)
Canada
• Ekati (Dominion)
• Diavik (Rio Tinto/Dominion)
• Victor, Snap Lake, Gahcho Kué (De Beers)
• Renard (Stornoway)
• Fort a la Corne (Shore Gold/Newmont)
Botswana
• Jwaneng, Orapa (De Beers)
• Ghaghoo (Gem Diamonds)
• Karowe (Lucara Diamonds)
Angola
• Catoca (Alrosa)
Democratic Republic of Congo
• Mbuyi-Mayi
Sierra Leone
• Koidu, (Steinmetz Group)
Lesotho
• Letseng (Gem Diamonds)
• Kao (Namakwa Diamonds)
• Liqhobong (Firestone)
• Mothae (Lucara)
44
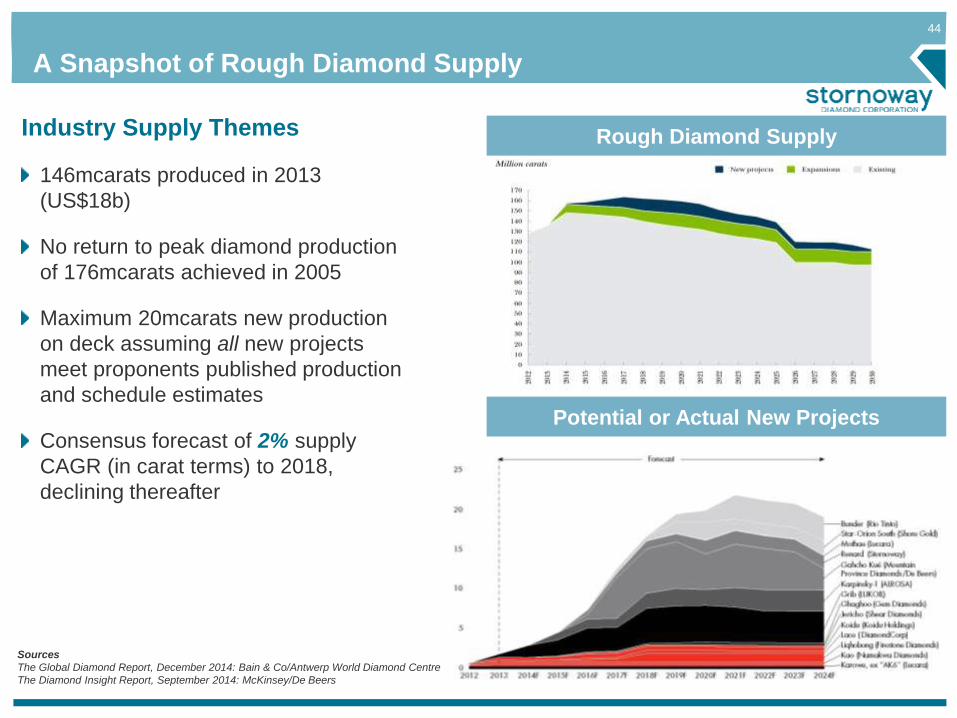
A Snapshot of Rough Diamond Supply
Industry Supply Themes
146mcarats produced in 2013
(US$18b)
No return to peak diamond production
of 176mcarats achieved in 2005
Maximum 20mcarats new production
on deck assuming all new projects
meet proponents published production
and schedule estimates
Consensus forecast of 2% supply
CAGR (in carat terms) to 2018,
declining thereafter
Potential or Actual New Projects
Rough Diamond Supply
Sources
The Global Diamond Report, December 2014: Bain & Co/Antwerp World Diamond Centre
The Diamond Insight Report, September 2014: McKinsey/De Beers
45
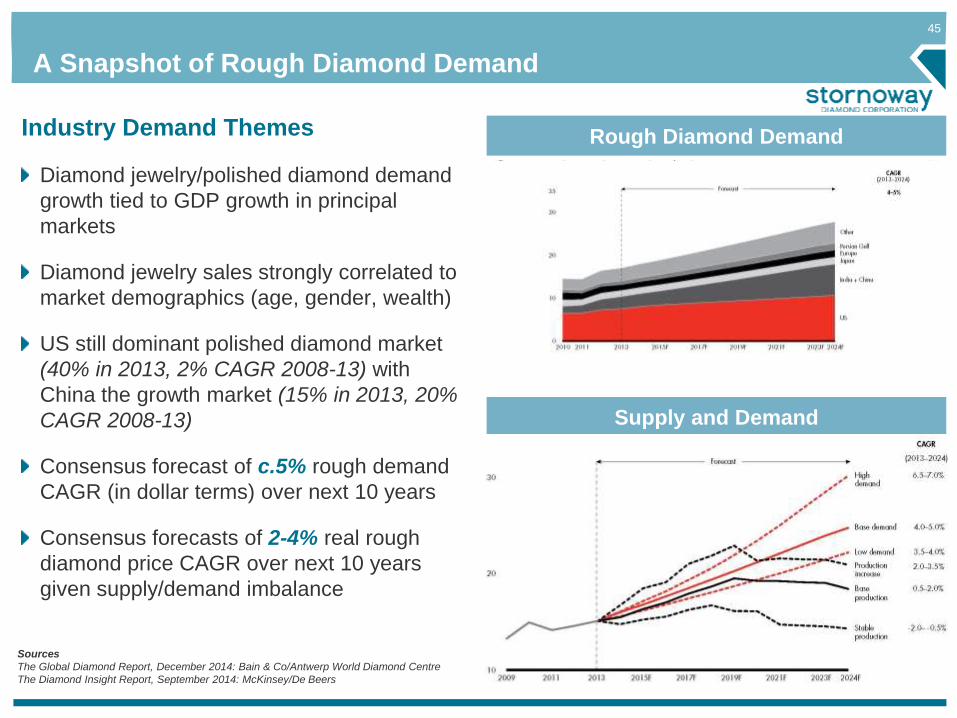
A Snapshot of Rough Diamond Demand
Rough Diamond Demand
Supply and Demand
Industry Demand Themes
Diamond jewelry/polished diamond demand
growth tied to GDP growth in principal
markets
Diamond jewelry sales strongly correlated to
market demographics (age, gender, wealth)
US still dominant polished diamond market
(40% in 2013, 2% CAGR 2008-13) with
China the growth market (15% in 2013, 20%
CAGR 2008-13)
Consensus forecast of c.5% rough demand
CAGR (in dollar terms) over next 10 years
Consensus forecasts of 2-4% real rough
diamond price CAGR over next 10 years
given supply/demand imbalance
Sources
The Global Diamond Report, December 2014: Bain & Co/Antwerp World Diamond Centre
The Diamond Insight Report, September 2014: McKinsey/De Beers
46
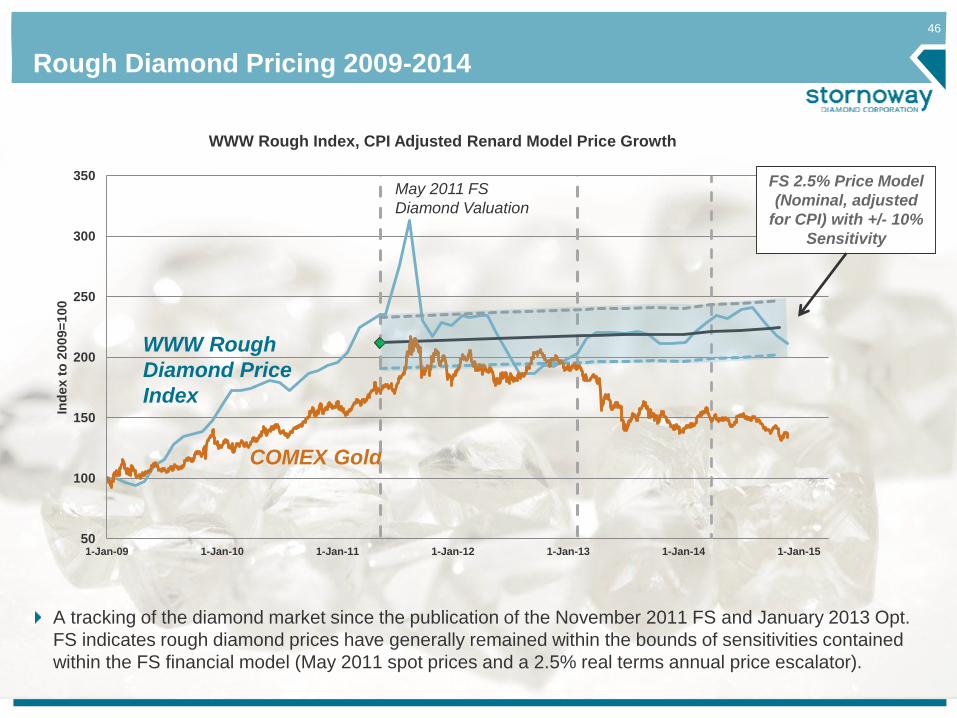
Rough Diamond Pricing 2009-2014
A tracking of the diamond market since the publication of the November 2011 FS and January 2013 Opt.
FS indicates rough diamond prices have generally remained within the bounds of sensitivities contained
within the FS financial model (May 2011 spot prices and a 2.5% real terms annual price escalator).
WWW Rough
Diamond Price
Index
COMEX Gold
May 2011 FS
Diamond Valuation
50
100
150
200
250
300
350
1-Jan-09 1-Jan-10 1-Jan-11 1-Jan-12 1-Jan-13 1-Jan-14 1-Jan-15
Ind
ex t
o 2
009=
100
WWW Rough Index, CPI Adjusted Renard Model Price Growth
FS 2.5% Price Model
(Nominal, adjusted
for CPI) with +/- 10%
Sensitivity
47
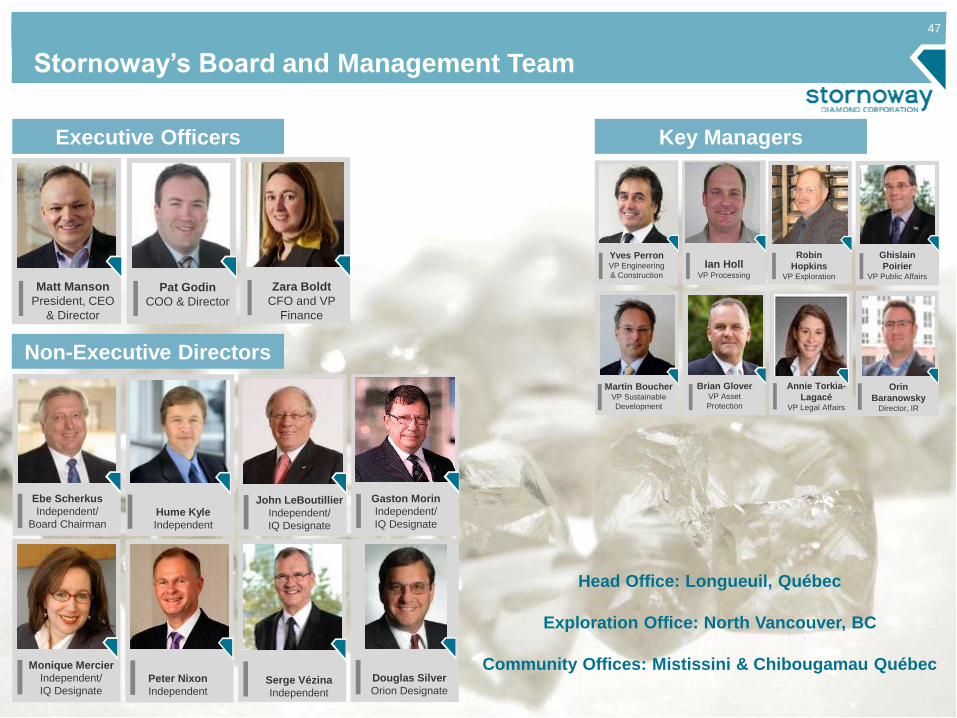
Hume Kyle
Independent
Zara Boldt
CFO and VP
Finance
Pat Godin
COO & Director
Matt Manson
President, CEO
& Director
John LeBoutillier
Independent/
IQ Designate
Monique Mercier
Independent/
IQ DesignatePeter Nixon
Independent
Ebe Scherkus
Independent/
Board Chairman
Executive Officers
Non-Executive Directors
Key Managers
Head Office: Longueuil, Québec
Exploration Office: North Vancouver, BC
Community Offices: Mistissini & Chibougamau Québec
Stornoway’s Board and Management Team
Serge Vézina
Independent
Yves PerronVP Engineering
& Construction
Ghislain
PoirierVP Public Affairs
Brian Glover VP Asset
Protection
Martin BoucherVP Sustainable
Development
Robin
Hopkins VP Exploration
Orin
BaranowskyDirector, IR
Douglas Silver
Orion Designate
Ian HollVP Processing
Annie Torkia-
LagacéVP Legal Affairs
Gaston Morin
Independent/
IQ Designate
48
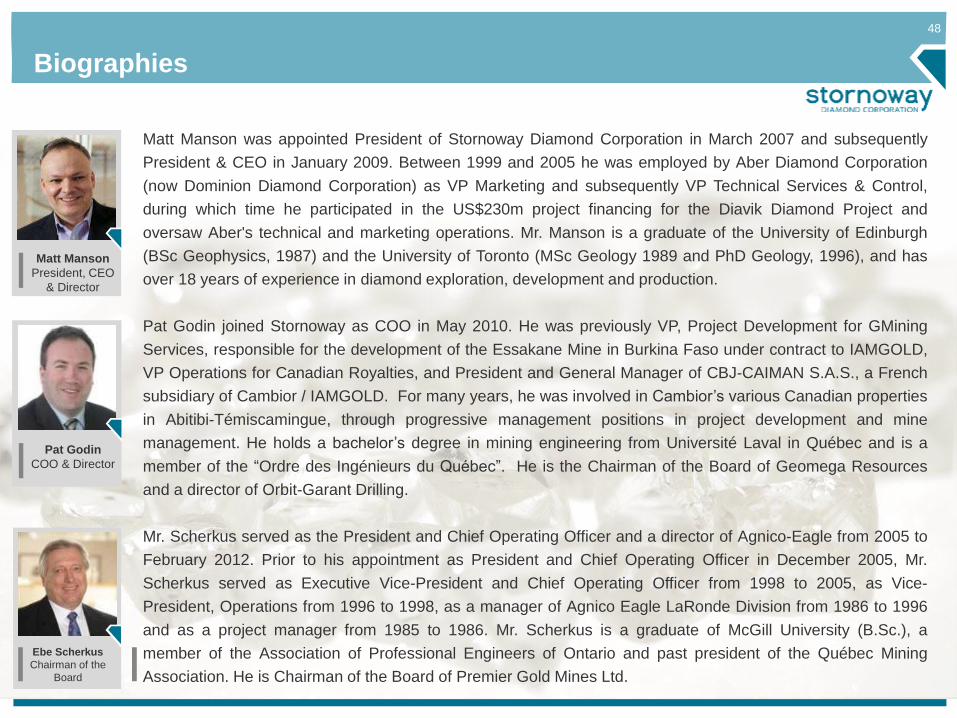
Pat Godin
COO & Director
Biographies
Ebe Scherkus
Chairman of the
Board
Matt Manson was appointed President of Stornoway Diamond Corporation in March 2007 and subsequently
President & CEO in January 2009. Between 1999 and 2005 he was employed by Aber Diamond Corporation
(now Dominion Diamond Corporation) as VP Marketing and subsequently VP Technical Services & Control,
during which time he participated in the US$230m project financing for the Diavik Diamond Project and
oversaw Aber's technical and marketing operations. Mr. Manson is a graduate of the University of Edinburgh
(BSc Geophysics, 1987) and the University of Toronto (MSc Geology 1989 and PhD Geology, 1996), and has
over 18 years of experience in diamond exploration, development and production.
Pat Godin joined Stornoway as COO in May 2010. He was previously VP, Project Development for GMining
Services, responsible for the development of the Essakane Mine in Burkina Faso under contract to IAMGOLD,
VP Operations for Canadian Royalties, and President and General Manager of CBJ-CAIMAN S.A.S., a French
subsidiary of Cambior / IAMGOLD. For many years, he was involved in Cambior’s various Canadian properties
in Abitibi-Témiscamingue, through progressive management positions in project development and mine
management. He holds a bachelor’s degree in mining engineering from Université Laval in Québec and is a
member of the “Ordre des Ingénieurs du Québec”. He is the Chairman of the Board of Geomega Resources
and a director of Orbit-Garant Drilling.
Mr. Scherkus served as the President and Chief Operating Officer and a director of Agnico-Eagle from 2005 to
February 2012. Prior to his appointment as President and Chief Operating Officer in December 2005, Mr.
Scherkus served as Executive Vice-President and Chief Operating Officer from 1998 to 2005, as Vice-
President, Operations from 1996 to 1998, as a manager of Agnico Eagle LaRonde Division from 1986 to 1996
and as a project manager from 1985 to 1986. Mr. Scherkus is a graduate of McGill University (B.Sc.), a
member of the Association of Professional Engineers of Ontario and past president of the Québec Mining
Association. He is Chairman of the Board of Premier Gold Mines Ltd.
Matt Manson
President, CEO
& Director
49
Stornoway Diamond Corporation TSX:SWY
Head Office:
1111 Rue St. Charles Ouest,
Longueuil, Québec J4K 4G4
Tel: +1 (450) 616-5555
IR Contact:
Orin Baranowsky, CFA, Director IR
Tel: +1 (416) 304-1026 x103
www.stornowaydiamonds.com