stocktouch slides 062215
TRANSCRIPT
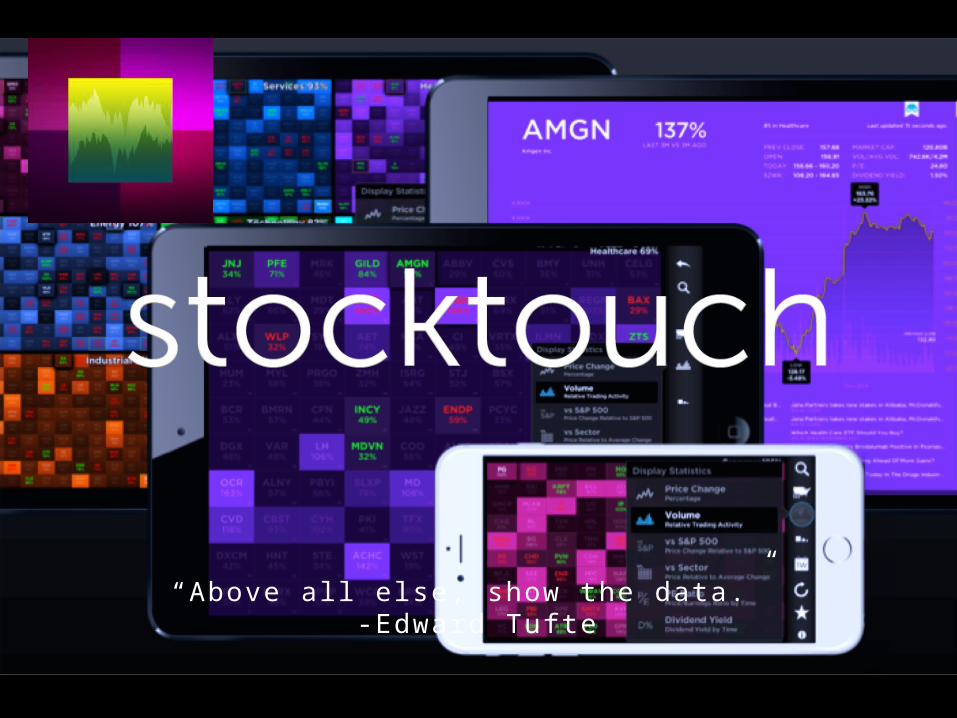
“Above all else, show the data.” -Edward Tufte

Mobile-Tech Industry Recognition

A New Way To Interact With Data
“The purpose of visualization is insight, not pictures” -- Ben Schneiderman

“The greatest value of a picture is when it forces us to notice what we never expected to
see” -- John Tukey
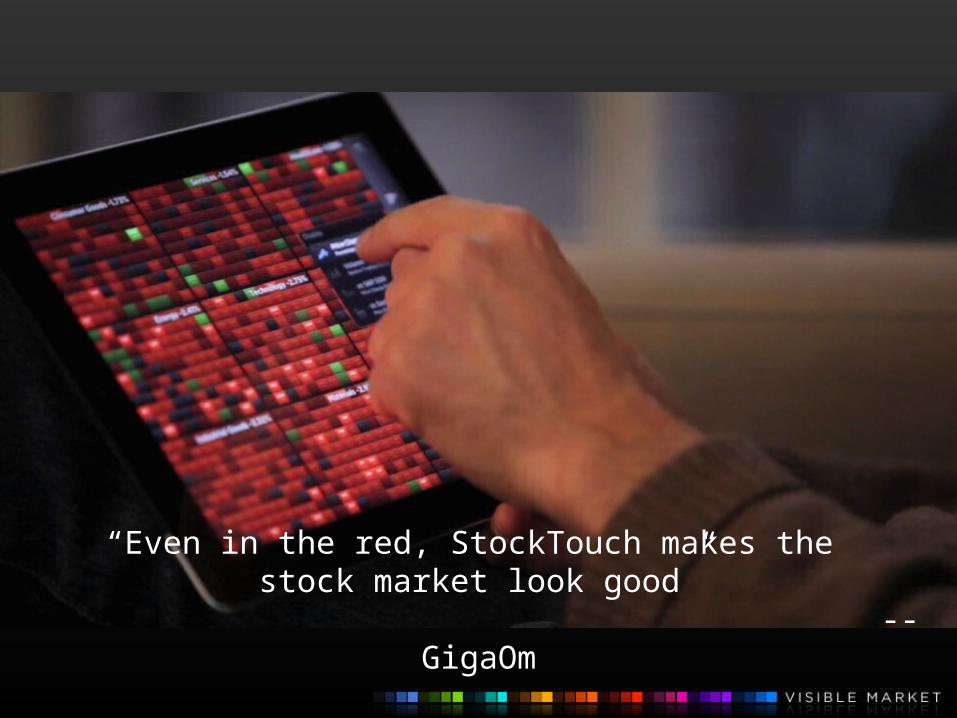
“Even in the red, StockTouch makes the stock market look good”
-- GigaOm
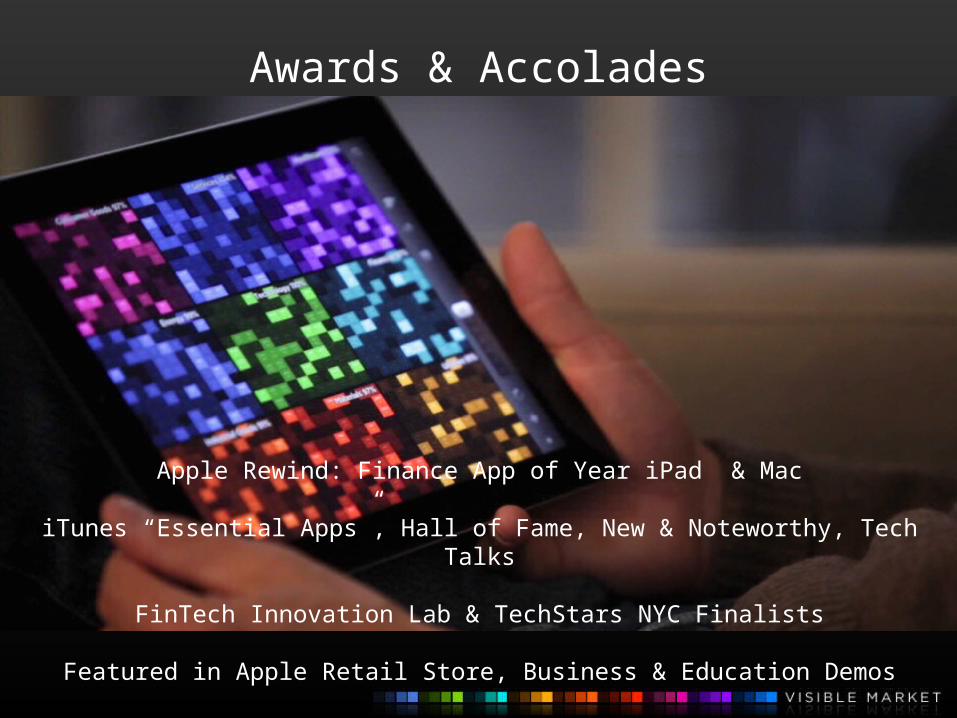
Awards & Accolades
Apple Rewind: Finance App of Year iPad & Mac
iTunes “Essential Apps”, Hall of Fame, New & Noteworthy, Tech Talks
FinTech Innovation Lab & TechStars NYC Finalists
Featured in Apple Retail Store, Business & Education Demos

Traction
900k Lifetime Uniques & 3.7m Updates
50kMAU 300k users latest version
Wired: Top Mobile Apps on Wall Street
Apps Magazine: Best Business App of Year

“Graphical excellence is that which gives to the viewer the greatest number of ideas in the
shortest time with the least ink in the smallest space.”
-- Edward Tufte

Patents & Intellectual Property
DYNAMIC VISUAL STATISTICAL DATA DISPLAY AND NAVIGATION SYSTEM AND METHOD FOR LIMITED DISPLAY DEVICE
US Patent: 8,972,295*
* Other patents pending.

Gamification &Visualization
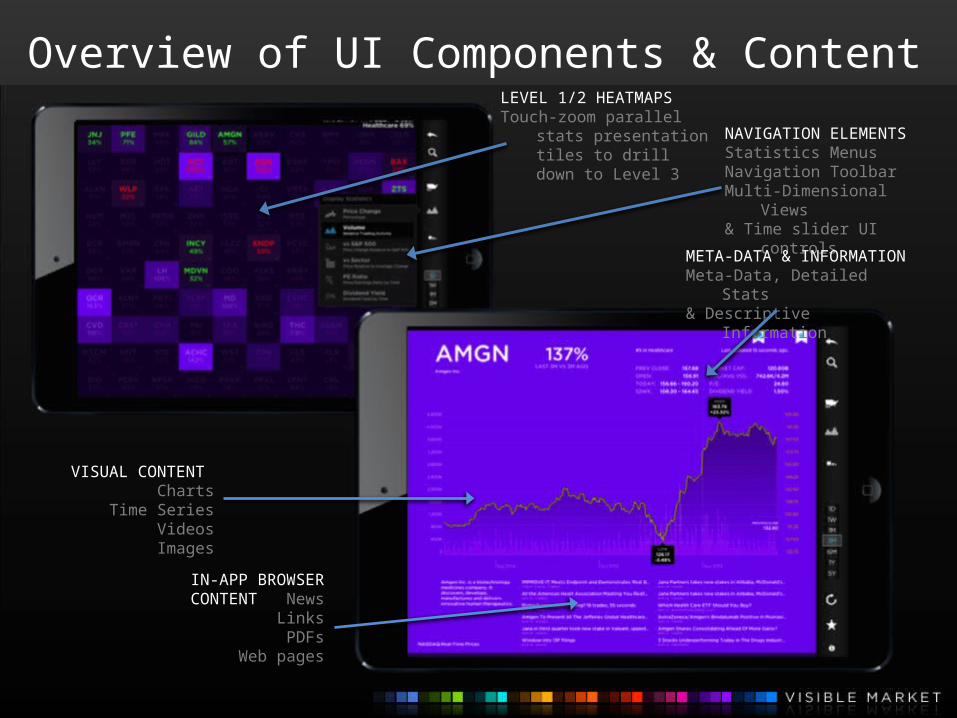
Overview of UI Components & Content
VISUAL CONTENT Charts
Time SeriesVideos
Images
NAVIGATION ELEMENTSStatistics MenusNavigation ToolbarMulti-Dimensional Views& Time slider UI controls
META-DATA & INFORMATIONMeta-Data, Detailed Stats& Descriptive Information
IN-APP BROWSER CONTENT News
LinksPDFs
Web pages
LEVEL 1/2 HEATMAPSTouch-zoom parallel stats
presentation tiles to drill down to Level 3
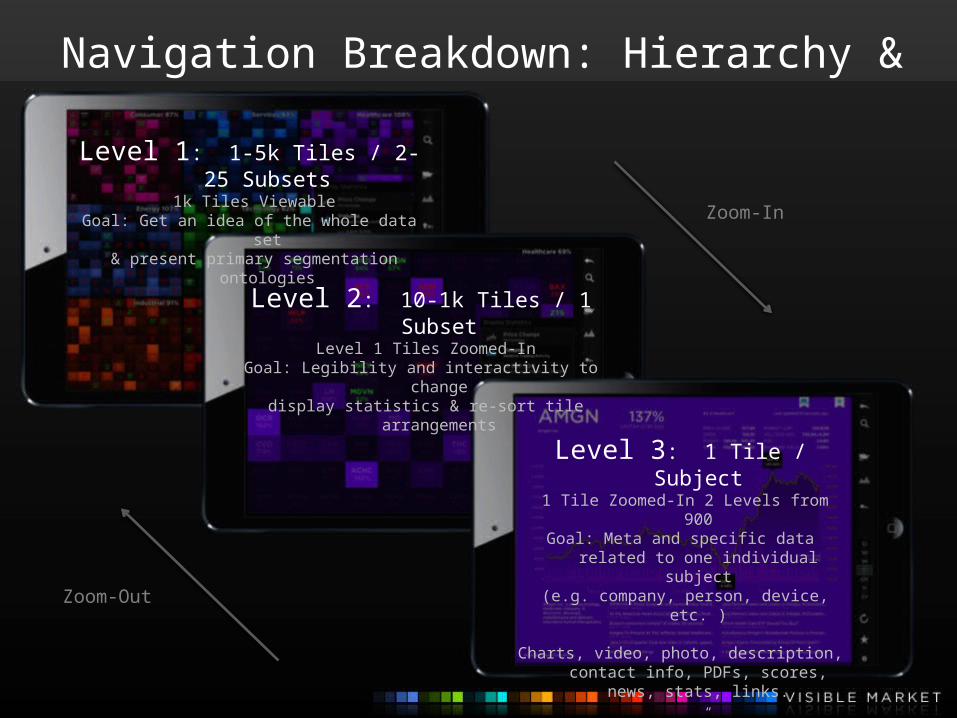
Navigation Breakdown: Hierarchy & Levels
Level 1: 1-5k Tiles / 2-25 Subsets
1k Tiles ViewableGoal: Get an idea of the whole data set
& present primary segmentation ontologies
Level 2: 10-1k Tiles / 1 Subset Level 1 Tiles Zoomed-In
Goal: Legibility and interactivity to change display statistics & re-sort tile arrangements
Level 3: 1 Tile / Subject 1 Tile Zoomed-In 2 Levels from 900
Goal: Meta and specific data related to one individual subject
(e.g. company, person, device, etc. )
Charts, video, photo, description, contact info, PDFs, scores, news,
stats, links.
Links open “Level 4” and/or in-app browser
Zoom-In
Zoom-Out
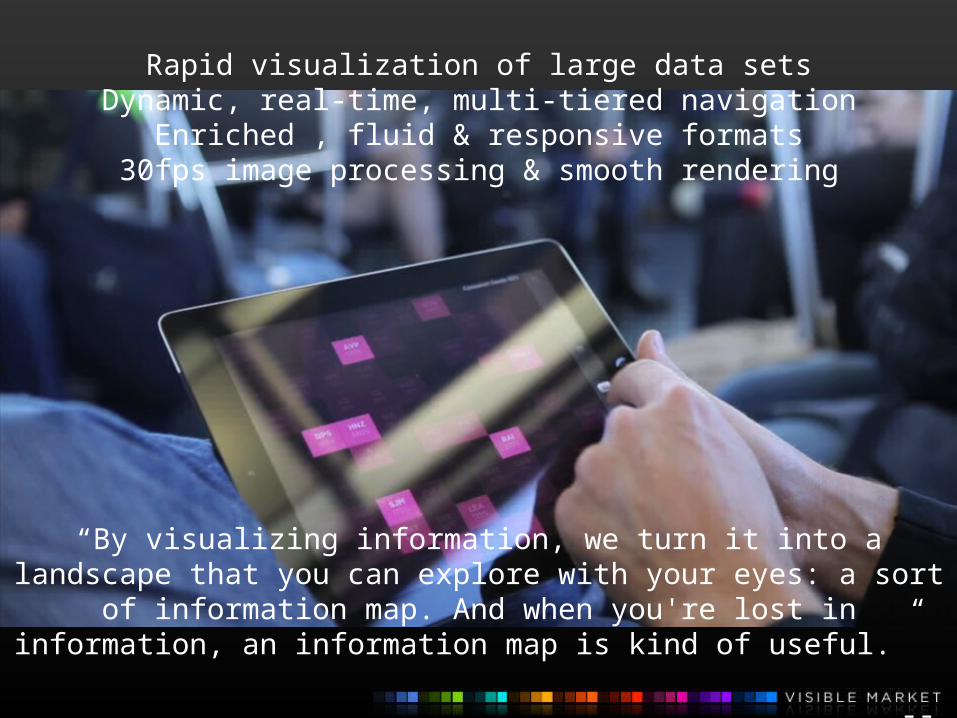
Rapid visualization of large data setsDynamic, real-time, multi-tiered navigation
Enriched , fluid & responsive formats30fps image processing & smooth rendering
“By visualizing information, we turn it into a landscape that you can explore with your eyes: a sort of information map. And
when you're lost in information, an information map is kind of useful.”
-- David McCandless
