“stock trading using rspop: a novel rough set-based neuro ...plaza.ufl.edu/yiz21cn/refer/rough...
TRANSCRIPT
This article has been accepted for inclusion in a future issue.
IEEE TRANSACTIONS ON NEURAL NETWORKS 1
Stock Trading Using RSPOP: A Novel RoughSet-Based Neuro-Fuzzy Approach
Kai Keng Ang, Student Member, IEEE, and Chai Quek, Member, IEEE
Abstract—This paper investigates the method of forecastingstock price difference on artificially generated price series datausing neuro-fuzzy systems and neural networks. As trading profitsis more important to an investor than statistical performance, thispaper proposes a novel rough set-based neuro-fuzzy stock tradingdecision model called stock trading using rough set-based pseudoouter-product (RSPOP) which synergizes the price difference fore-cast method with a forecast bottleneck free trading decision model.The proposed stock trading with forecast model uses the pseudoouter-product based fuzzy neural network using the compositionalrule of inference [POPFNN-CRI(S)] with fuzzy rules identifiedusing the RSPOP algorithm as the underlying predictor modeland simple moving average trading rules in the stock tradingdecision model. Experimental results using the proposed stocktrading with RSPOP forecast model on real world stock marketdata are presented. Trading profits in terms of portfolio end valuesobtained are benchmarked against stock trading with dynamicevolving neural-fuzzy inference system (DENFIS) forecast model,the stock trading without forecast model and the stock tradingwith ideal forecast model. Experimental results showed that theproposed model identified rules with greater interpretability andyielded significantly higher profits than the stock trading withDENFIS forecast model and the stock trading without forecastmodel.
Index Terms—Forecasting theory, fuzzy neural networks, roughset theory, stock market, time series.
I. INTRODUCTION
THERE are two major approaches to the analysis of stockmarket price prediction: Fundamental and technical
analyses. Fundamental analysis is the approach of studying theoverall economy, industry, financial conditions and manage-ment of companies to measure the intrinsic value of a particularsecurity (please refer to [1] for a classical guide to fundamentalanalysis). This approach uses revenues, earnings, future growth,return on equity, profit margins, and other data to determine acompany’s underlying value and the potential for future growthof its security. Technical analysis, on the other hand, does notattempt to measure a security’s intrinsic value. This approachevaluates securities by analyzing statistics generated by marketactivity, such as past prices and volume (please refer to [2] fora modern guide to technical analysis). The pioneering technicalanalysis technique is attributed to C. Dow back in the late 1800s[3]. The efficient market hypothesis (EMH) [4] is generally
Manuscript received May 12, 2005; revised August 11, 2005. This work wassupported by the Singapore Millennium Foundation.
The authors are with the Centre for Computational Intelligence, School ofComputer Engineering, Nanyang Technological University, Singapore 639798,Singapore (e-mail: [email protected]).
Digital Object Identifier 10.1109/TNN.2006.875996
interpreted to imply that the technical approach to forecastingstock price is invalid, but recent literature presented from abehavioral finance perspective [5] and statistical inference fromcomputational algorithms [6] further exemplified the evidenceon the predictability of financial market using technical anal-ysis. Thus technical analysis has recently enjoyed a renaissanceand most major brokerage firms publish technical commentaryon the market and individual securities.
The main approach in financial forecasting is to identifytrends at an early stage in order to maintain an investmentstrategy until evidence indicates that the trend has reversed.Predictability of security from past real-world data usingtwo of the simplest and most popular trading rules, namelymoving average and trading range break-out rules, were firstinvestigated in [3] on the Dow Jones Index. Other techniquesused include regression methods and the ARIMA models [7],but these models fail to give satisfactory forecast for someseries because of their linear structures and some other inherentlimitations [8]. Although there are also ARCH/GARCH models[9] to deal with the nonconstant variance, these models also failto give satisfactory forecast for some series [8] (please referto [10]–[12] for a modern guide to the statistical approach totechnical financial forecasting). Increasingly applications ofartificial intelligence (AI) techniques, mainly artificial neuralnetworks, have been applied to technical financial forecasting[13]–[15] as they have the ability to learn complex nonlinearmapping and self-adaptation for different statistical distribu-tions (please refer to [16] for a review and evaluation of neuralnetworks in technical financial forecasting). An investigationon the nonlinear predictability of security returns from pastreal-world returns using single layer feed-forward neuralnetwork and moving average rules was presented in [17] onthe Dow Jones Index. The results showed that evidence ofnonlinear predictability in stock market returns can be foundby using the past buy and sell signals of the moving averagerules. Application of AI techniques in financial forecasting isnot restricted only to the technical analysis approach, but hasalso been applied to the fundamental approach. For example,in the work of [18], a genetic algorithm based fuzzy neuralnetwork is trained with additional political, financial, economicfactors etc. to formulate trading decisions. A number of re-search investigations have been published on the applicationof AI techniques in the technical analysis approach of fore-casting stock price, but only a few presented quantitative resultson trading performance using real world stock market data[19]–[24]. Saad et al. [21] performed analysis of predictabilitybased on a history of closing price of a number of high volatilitystocks and consumer stocks using time delay, recurrent andprobabilistic neural networks. Leigh et al. [22] used neural
1045-9227/$20.00 © 2006 IEEE
This article has been accepted for inclusion in a future issue.
2 IEEE TRANSACTIONS ON NEURAL NETWORKS
networks and genetic algorithm to perform pattern recognitionof the bull flag pattern and to learn the trading rules from priceand volume of the NYSE Composite Index. Results showed thatthe forecasting method yielded statistically significant returnsthat are better than the overall average 20-day horizon priceincrease. Moody et al. [23], [25] used recurrent reinforcementlearning without forecasting to train a trading system to tradeusing past prices of S&P500 stock index while accounting forthe effects of transaction costs (please refer to [26] for detailson reinforcement learning). Chen et al. [24] used a probabilisticneural network (PNN) to forecast the direction of price momentof the Taiwan Stock Index and presented two PNN-guidedinvestment strategies to translate the predicted direction totrading signals. Field and Singh [20] used Pareto evolutionaryneural network (Pareto-ENN) to forecast 37 different interna-tional stock indexes.
Although neural networks possess the properties required fortechnical financial forecasting, they cannot be used to explainthe causal relationship between input and output variables be-cause of their black box nature. Neuro-fuzzy hybridization syn-ergizes neural networks and fuzzy systems by combining thehuman-like reasoning style of fuzzy systems with the learningand connectionist structure of neural networks. Neuro-fuzzy hy-bridization is widely termed as fuzzy neural networks (FNNs) orneuro-fuzzy systems (NFSs) in the literature [27]. NFSs incor-porates the human-like reasoning style of fuzzy systems throughthe use of fuzzy sets and a linguistic model consisting of a set ofIF–THEN fuzzy rules. Thus the main strength of NFSs is thatthey are universal approximators [28]–[30] with the ability tosolicit interpretable IF–THEN rules [31]. In recent years, in-creasing number of research applied NFSs in financial engi-neering [32]. Some works that applied NFSs in forecasting stockprice are [8], [21], [33]–[35].
This paper proposes a novel rough set-based neuro-fuzzystock trading decision model called stock trading using roughset-based pseudo outer-product (RSPOP). Section II reviewsthe two main NFSs and outlines the proposed rough set-basedneuro-fuzzy approach. Section III reviews the commonly usedtime-delayed price forecast approach and the time-delayedprice difference forecast approach in forecasting stock prices.Section IV presents experimental results of forecasting stockprice difference using various neuro-fuzzy systems and neuralnetworks on artificially generated price series data. Section Vreviews existing trading models with and without forecast andpresents the proposed forecast bottleneck free stock tradingwith RSPOP forecast model. Section VI presents extensiveexperimental results using the proposed stock trading withRSPOP forecast model on real world stock market data. Thetrading profits in terms of portfolio end values are presentedand compared against the stock trading with dynamic evolvingneural-fuzzy inference system (DENFIS) [36] forecast model,the stock trading without forecast model and the stock tradingwith ideal forecast model. Finally, Section VII concludes thispaper.
II. ROUGH SET-BASED NEURO-FUZZY APPROACH
The strength of neuro-fuzzy systems involves two contradic-tory requirements in fuzzy modeling: interpretability verses ac-
curacy. In practice, one of the two properties prevails. The fuzzymodeling research field is divided into two areas: linguistic fuzzymodeling that is focused on interpretability, mainly the Mam-dani model [37] given in (1); and precise fuzzy modeling that isfocused on accuracy, mainly the Takagi–Sugeno–Kang (TSK)model [38] given in (2) and (3) (please refer to [39] for a re-cent comprehensive coverage on interpretability issues of fuzzymodeling) [31], [39], [40]. Both of these models are investigatedin this paper, specifically the Dynamic Evolving Neural-FuzzyInference System (DENFIS) (please refer to Section III in [36]for a description of DENFIS) which is based on the precisefuzzy model and the pseudo outer-product based fuzzy neuralnetwork (POPFNN) (please refer to [41, Sec. II] for a brief de-scription of POPFNN) which is based on the linguistic fuzzymodel
IF is AND
is THEN is (1)
IF is AND
is THEN (2)
(3)
where , are the input vector and outputvalue, respectively; , are the linguistic labels with fuzzysets associated defining their meaning; number of inputs; and
are tbe number of rules.The consequents in (1) are linear functions of the inputs
whereas the consequents in (2) are simply linguistic labels.Therefore, the TSK model has decreased interpretability butincreased representative power compared against the Mamdanimodel [39]. Recently, a number of research work addressingthe issues of the TSK model have been reported [42]–[44].In contrast, an increased number of fuzzy rules is needed inthe Mamdani model to yield the same representative power ofthe TSK model. Recently, Rough Set methods [45] have beenshown to significantly reduce pattern dimensionality and provento be viable data mining techniques in [46]. This motivatedthe investigation of the rough set-based neuro-fuzzy approach,which uses the RSPOP algorithm [41] to identify the fuzzyrules in POPFNN. The use of the RSPOP algorithm reducedcomputational complexity, improved the interpretability byidentifying significantly fewer fuzzy rules as well as improvedthe accuracy of the POPFNN (please refer to [41, Sec. IV] fora detailed description of the RSPOP algorithm).
The RSPOP algorithm consists of three parts. The first partRule Identification identifies only one most influential rule in-stead of all possible rules from one instant of the training data.The second part Attribute Reduction performs feature selectionthrough the reduction of redundant attributes using the conceptof knowledge reduction from rough set theory [45]. As there aremany possible reducts for a given rule set, this part uses an ob-jective measure to identify reducts that improve rather than de-teriorate the inferred consequence after attribute reduction. Thethird part Rule Reduction performs partial feature selection byextending the reduction to rules without redundant attributes.
This article has been accepted for inclusion in a future issue.
ANG AND QUEK: STOCK TRADING USING RSPOP: A NOVEL ROUGH SET-BASED NEURO-FUZZY APPROACH 3
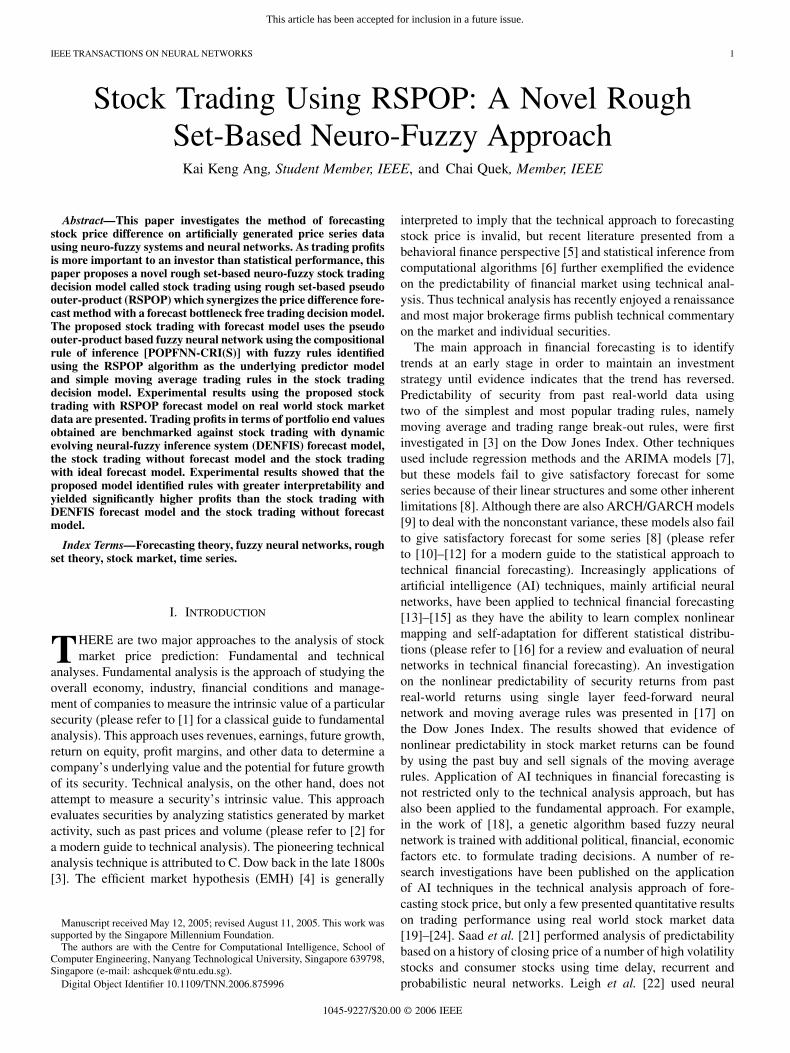
TABLE IFUZZY RULES IDENTIFIED USING RSPOP ON NAKANISHI DATA SET (A) FROM
[41]
An example from [41] is used to help illustrate the RSPOPrule identification and reduction process. Table I shows the ini-tial and reduced rules identified using RSPOP on the Nakan-ishi example (a) data set [35]. The setsand represent the condition and consequent at-tributes, respectively, where , ,
, , and repre-sent the membership functions. The first part Rule Identificationidentified an initial 22 rules. The second part Attribute Reduc-tion identified one reduct that resulted inno deterioration of the objective measure. Thus, the attributeis redundant and the number of rules is reduced from 22 to 20after removing duplicated rules. The third part Rule Reductionidentified groups of reducible rules that resulted in no deterio-ration of objective measures and reduced the number of rulesfrom 20 to 17.
III. STOCK PRICE FORECAST
Time series prediction has a diverse range of applications [7],and forecasting stock price is one such application. As time se-ries prediction is concerned with the estimation of equationscontaining stochastic components, it is modeled by an th-orderlinear difference equation with constant coefficients given in (4)[10]
(4)
where is the time series where represents a value at timeinstant ; is one of the arbitrary parameters that do not de-pend on any values of or ; and is the term called theforcing process where it can be any function of time, current andlagged values of other variables and/or stochastic disturbances.
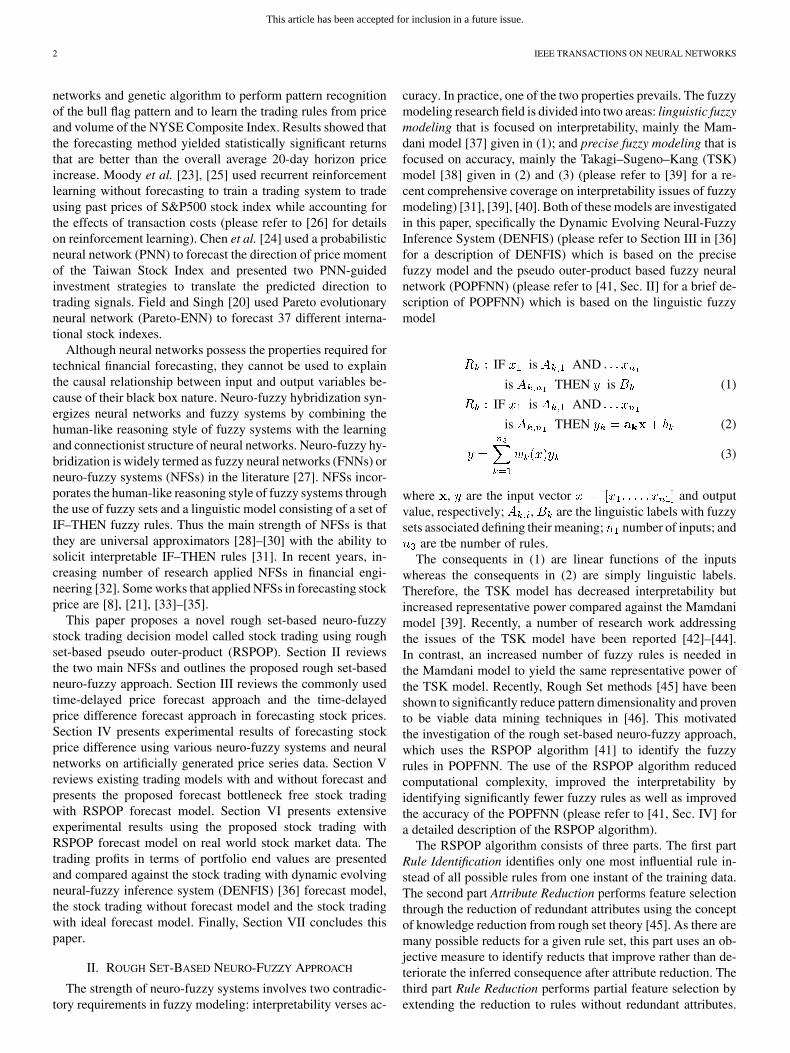
Fig. 1. Time-delayed price forecast approach.
If is just a sequence of unspecified exogenous variablesrepresented by a stochastic variable instead, then (4) re-sembles an autoregressive equation [10] and time series pre-diction is formulated as: Given values
; predict as . Some called this timeseries prediction using neural networks as time-delayed neuralnetwork [21]; some called it recurrent neural network [33]. Inthe case of nonlinear time series prediction, it is known as thetime delay embedding technique [47] and denotes the em-bedding dimension [48], [49]. The linear time series predictionin (4) is henceforth referred to as the time-delayed approach todiscern it from recurrent networks with feedback connections.Several works applied this approach using neural networks orneuro-fuzzy systems [21], [33], [50]–[52]. As a benchmark, thebest estimation of (4) is the Random Walk model, which sug-gests that the day-to-day price change of a stock should havea mean value of zero [10]. Formally, the Random Walk modelasserts that the value of the time series should follow the sto-chastic difference equation in (5) [10]. Therefore, the predictedvalue using the Random Walk model is simply as given in(6)
(5)
(6)
where is a normal random deviate with an expected meanof zero.
Fig. 1 illustrates the forecasting of stock price using the time-delayed approach. This architecture employs previous valuesof the series as input to the network and the predicted value asan output from the network. Each node represents a lagoperation for one time instant. The network is trained using aseries of known prior to its use as a time series predictor.Specifically, assume that are known, thetraining data set is formed using of these input–outputdata tuples.
Incidentally, quite a number of research publications usingneural networks based on the time-delayed price forecast ap-proach did not compare against the random walk model (see[16, App. A ]), except a recent work in [24]. This is becausethe time-delayed approach performs direct forecast on a stock

This article has been accepted for inclusion in a future issue.
4 IEEE TRANSACTIONS ON NEURAL NETWORKS
price series that is usually non-stationary. A time series is sta-tionary, which is an important property in time series analysis,when the mean value of the series remains constant over the timeseries. Since many econometric time series are non-stationary,the time-delayed price forecast approach tend to include lineartrends and thus deterministic shifts in the out-of-sample forecastperiod tend to exacerbate forecast errors [12] when comparedagainst the random walk model.
Although financial analysts often adopt trading practices thatrely on forecasting the price levels of financial instruments,Sanders and Ritzman [53] showed that people focus on theuse of judgemental approach as a basis for forecasting and thisapproach is about as accurate as the best statistical approaches.O’Connor et al. [54] examined the way people forecast trendsin time series and how they respond to changes in the trend andpresented studies of laboratory experiments that showed indi-viduals have different tendencies and behaviours for upwardand downward series. A recent study in [24] suggested thattrading strategies guided by forecasts on the direction of pricechange, which is also the forecast of trends, is more effectiveand generate greater profits. Empirical results on the index ofTaiwan Stock Exchange in [24] showed that this approach usingprobabilistic neural network obtained higher returns than otherinvestment strategies. In addition, the recent development in thetheory of economic forecasting in [11], [12] showed that trans-forming nonstationary econometric time series to stationarityby differencing and cointegration helped robustify the priceforecasts and avoid deterministic shifts in the out-of-sampleforecasts which exacerbate the forecast errors. Thus the notionof the human inherent ability in forecasting price trends andthe recent development in the theory of economic forecastingmotivate the investigation of forecasting of the stock pricedifference instead of price level.
From (4), the approach in forecasting the price difference isformulated as: Given values ,compute , and predictthe change in represented as where isthe difference operator.
Subtracting from (4) gives
(7)
where is another arbitrary parameter; is a stochasticrandom error term; and .
Clearly, (7) is a modified version of (4) and can thenbe obtained using (8)
(8)
Fig. 2. Time-delayed price difference forecast approach.
This approach uses the difference operator compared totime-delayed price forecast approach in Fig. 1, so we called thisthe time-delayed price difference forecast approach. This ap-proach is illustrated in Fig. 2.
IV. EXPERIMENT ON ARTIFICIAL PRICE DATA
In this section, an artificial experimental stock price data setis constructed given in (9) and (10) to investigate the predictiveperformance of the time-delayed price difference forecast ap-proach using various networks
(9)
(10)
where and are constants; and are normal randomdeviates with zero mean and unit variance.
The stochastically generated artificial experimental data set,which consists of 10000 data samples, is shown in Fig. 3. Thisdata set is constructed similar to the simulation model used in[25] with the parameters , and initial condi-tions and using (9) and (10). In this experi-ment, the first 3000 data samples of the differenced price seriesare used to train the following networks and the remaining datasamples of the differenced price series are used for testing.
1) Feed-forward neural network trained using back-propaga-tion (FFNN-BP) [55].
2) Radial basis function networks (RBFN) [56].3) Adaptive-network-based fuzzy inference systems (AN-
FISs) [57] with subtractive clustering [58].4) Evolving fuzzy neural networks (EFuNNs) [59].5) Dynamic evolving neural-fuzzy inference system
(DENFIS) [36].6) Pseudo outer-product fuzzy neural network using com-
positional rule of inference and singleton fuzzifier [60]using RSPOP [41] to identify fuzzy rules (abbreviated asRSPOP-CRI).
This article has been accepted for inclusion in a future issue.
ANG AND QUEK: STOCK TRADING USING RSPOP: A NOVEL ROUGH SET-BASED NEURO-FUZZY APPROACH 5
Fig. 3. Artificially generated data set.
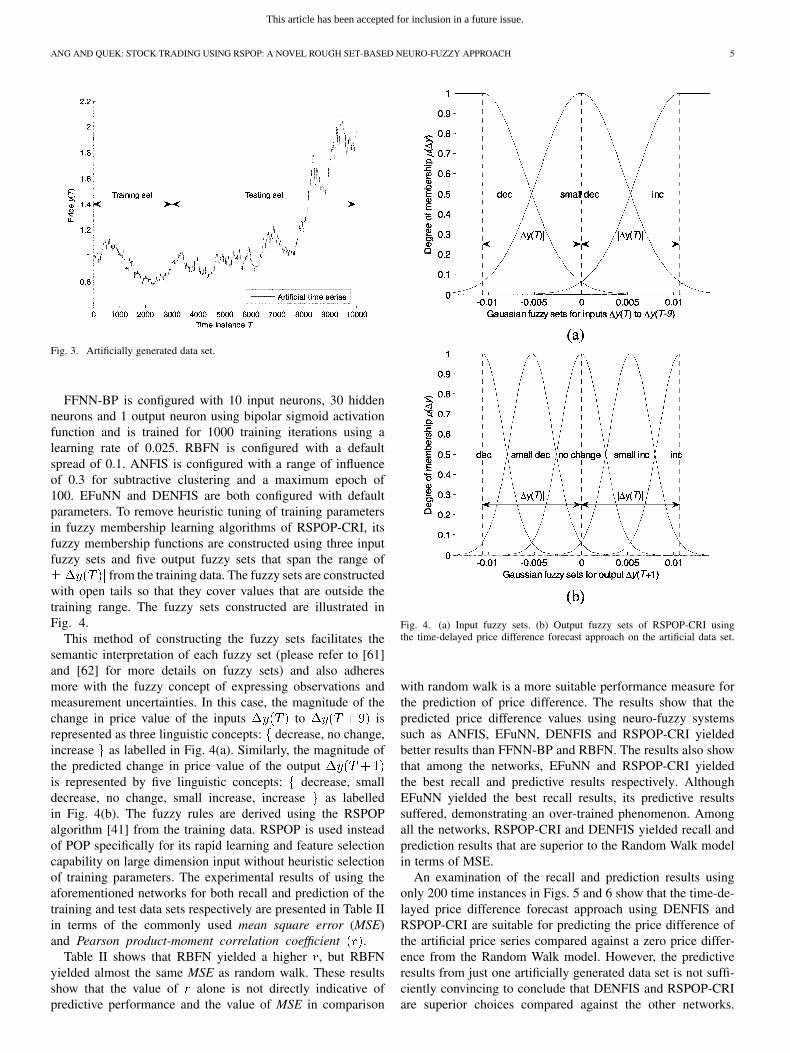
FFNN-BP is configured with 10 input neurons, 30 hiddenneurons and 1 output neuron using bipolar sigmoid activationfunction and is trained for 1000 training iterations using alearning rate of 0.025. RBFN is configured with a defaultspread of 0.1. ANFIS is configured with a range of influenceof 0.3 for subtractive clustering and a maximum epoch of100. EFuNN and DENFIS are both configured with defaultparameters. To remove heuristic tuning of training parametersin fuzzy membership learning algorithms of RSPOP-CRI, itsfuzzy membership functions are constructed using three inputfuzzy sets and five output fuzzy sets that span the range of
from the training data. The fuzzy sets are constructedwith open tails so that they cover values that are outside thetraining range. The fuzzy sets constructed are illustrated inFig. 4.
This method of constructing the fuzzy sets facilitates thesemantic interpretation of each fuzzy set (please refer to [61]and [62] for more details on fuzzy sets) and also adheresmore with the fuzzy concept of expressing observations andmeasurement uncertainties. In this case, the magnitude of thechange in price value of the inputs to isrepresented as three linguistic concepts: decrease, no change,increase as labelled in Fig. 4(a). Similarly, the magnitude ofthe predicted change in price value of the outputis represented by five linguistic concepts: decrease, smalldecrease, no change, small increase, increase as labelledin Fig. 4(b). The fuzzy rules are derived using the RSPOPalgorithm [41] from the training data. RSPOP is used insteadof POP specifically for its rapid learning and feature selectioncapability on large dimension input without heuristic selectionof training parameters. The experimental results of using theaforementioned networks for both recall and prediction of thetraining and test data sets respectively are presented in Table IIin terms of the commonly used mean square error (MSE)and Pearson product-moment correlation coefficient .
Table II shows that RBFN yielded a higher , but RBFNyielded almost the same MSE as random walk. These resultsshow that the value of alone is not directly indicative ofpredictive performance and the value of MSE in comparison
Fig. 4. (a) Input fuzzy sets. (b) Output fuzzy sets of RSPOP-CRI usingthe time-delayed price difference forecast approach on the artificial data set.
with random walk is a more suitable performance measure forthe prediction of price difference. The results show that thepredicted price difference values using neuro-fuzzy systemssuch as ANFIS, EFuNN, DENFIS and RSPOP-CRI yieldedbetter results than FFNN-BP and RBFN. The results also showthat among the networks, EFuNN and RSPOP-CRI yieldedthe best recall and predictive results respectively. AlthoughEFuNN yielded the best recall results, its predictive resultssuffered, demonstrating an over-trained phenomenon. Amongall the networks, RSPOP-CRI and DENFIS yielded recall andprediction results that are superior to the Random Walk modelin terms of MSE.
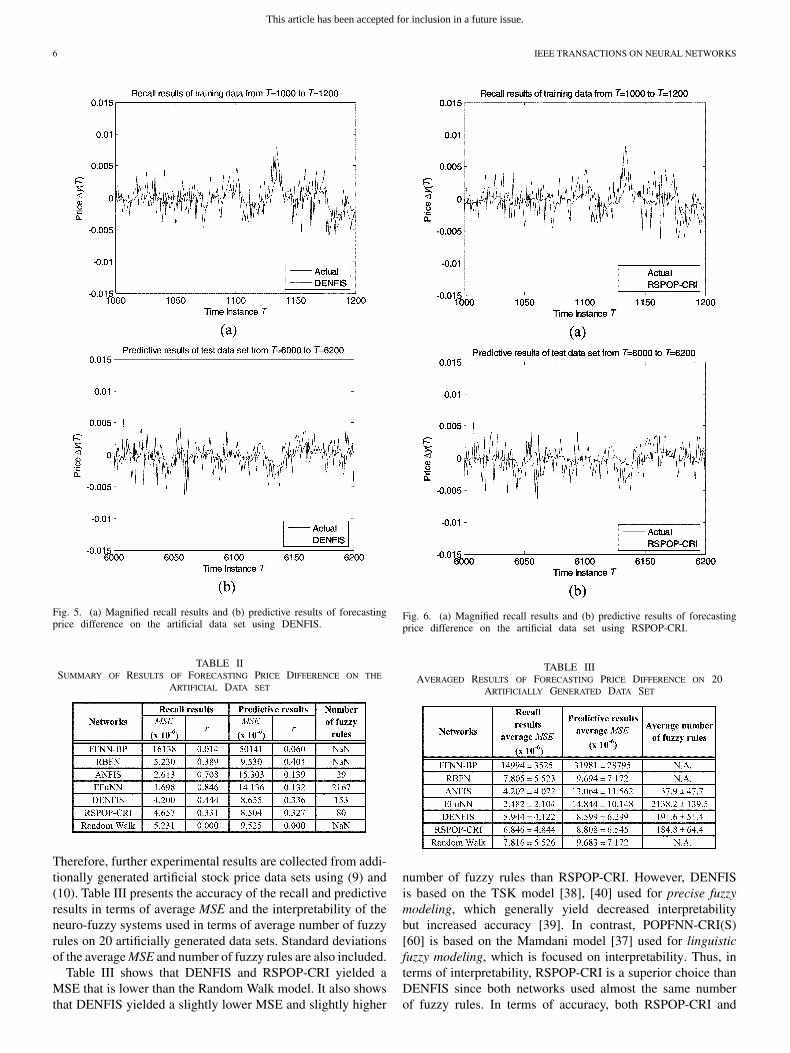
An examination of the recall and prediction results usingonly 200 time instances in Figs. 5 and 6 show that the time-de-layed price difference forecast approach using DENFIS andRSPOP-CRI are suitable for predicting the price difference ofthe artificial price series compared against a zero price differ-ence from the Random Walk model. However, the predictiveresults from just one artificially generated data set is not suffi-ciently convincing to conclude that DENFIS and RSPOP-CRIare superior choices compared against the other networks.
This article has been accepted for inclusion in a future issue.
6 IEEE TRANSACTIONS ON NEURAL NETWORKS
Fig. 5. (a) Magnified recall results and (b) predictive results of forecastingprice difference on the artificial data set using DENFIS.
TABLE IISUMMARY OF RESULTS OF FORECASTING PRICE DIFFERENCE ON THE
ARTIFICIAL DATA SET
Therefore, further experimental results are collected from addi-tionally generated artificial stock price data sets using (9) and(10). Table III presents the accuracy of the recall and predictiveresults in terms of average MSE and the interpretability of theneuro-fuzzy systems used in terms of average number of fuzzyrules on 20 artificially generated data sets. Standard deviationsof the average MSE and number of fuzzy rules are also included.
Table III shows that DENFIS and RSPOP-CRI yielded aMSE that is lower than the Random Walk model. It also showsthat DENFIS yielded a slightly lower MSE and slightly higher
Fig. 6. (a) Magnified recall results and (b) predictive results of forecastingprice difference on the artificial data set using RSPOP-CRI.
TABLE IIIAVERAGED RESULTS OF FORECASTING PRICE DIFFERENCE ON 20
ARTIFICIALLY GENERATED DATA SET
number of fuzzy rules than RSPOP-CRI. However, DENFISis based on the TSK model [38], [40] used for precise fuzzymodeling, which generally yield decreased interpretabilitybut increased accuracy [39]. In contrast, POPFNN-CRI(S)[60] is based on the Mamdani model [37] used for linguisticfuzzy modeling, which is focused on interpretability. Thus, interms of interpretability, RSPOP-CRI is a superior choice thanDENFIS since both networks used almost the same numberof fuzzy rules. In terms of accuracy, both RSPOP-CRI and
This article has been accepted for inclusion in a future issue.
ANG AND QUEK: STOCK TRADING USING RSPOP: A NOVEL ROUGH SET-BASED NEURO-FUZZY APPROACH 7
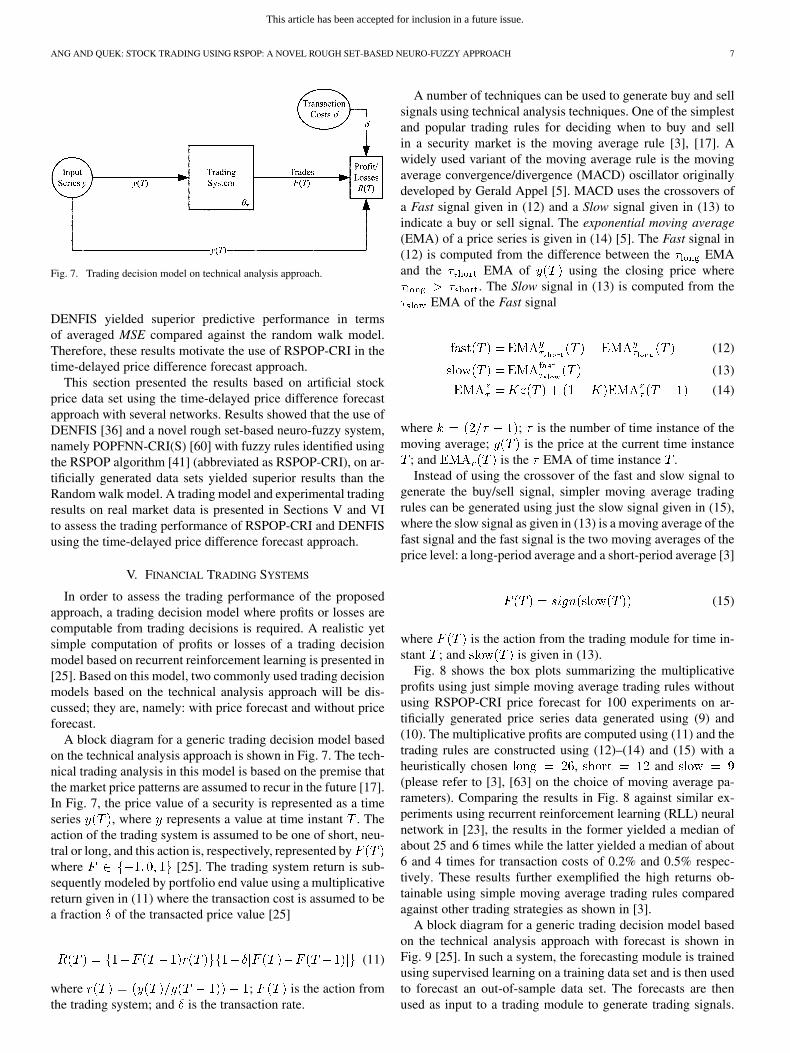
Fig. 7. Trading decision model on technical analysis approach.
DENFIS yielded superior predictive performance in termsof averaged MSE compared against the random walk model.Therefore, these results motivate the use of RSPOP-CRI in thetime-delayed price difference forecast approach.
This section presented the results based on artificial stockprice data set using the time-delayed price difference forecastapproach with several networks. Results showed that the use ofDENFIS [36] and a novel rough set-based neuro-fuzzy system,namely POPFNN-CRI(S) [60] with fuzzy rules identified usingthe RSPOP algorithm [41] (abbreviated as RSPOP-CRI), on ar-tificially generated data sets yielded superior results than theRandom walk model. A trading model and experimental tradingresults on real market data is presented in Sections V and VIto assess the trading performance of RSPOP-CRI and DENFISusing the time-delayed price difference forecast approach.
V. FINANCIAL TRADING SYSTEMS
In order to assess the trading performance of the proposedapproach, a trading decision model where profits or losses arecomputable from trading decisions is required. A realistic yetsimple computation of profits or losses of a trading decisionmodel based on recurrent reinforcement learning is presented in[25]. Based on this model, two commonly used trading decisionmodels based on the technical analysis approach will be dis-cussed; they are, namely: with price forecast and without priceforecast.
A block diagram for a generic trading decision model basedon the technical analysis approach is shown in Fig. 7. The tech-nical trading analysis in this model is based on the premise thatthe market price patterns are assumed to recur in the future [17].In Fig. 7, the price value of a security is represented as a timeseries , where represents a value at time instant . Theaction of the trading system is assumed to be one of short, neu-tral or long, and this action is, respectively, represented bywhere [25]. The trading system return is sub-sequently modeled by portfolio end value using a multiplicativereturn given in (11) where the transaction cost is assumed to bea fraction of the transacted price value [25]
(11)
where ; is the action fromthe trading system; and is the transaction rate.
A number of techniques can be used to generate buy and sellsignals using technical analysis techniques. One of the simplestand popular trading rules for deciding when to buy and sellin a security market is the moving average rule [3], [17]. Awidely used variant of the moving average rule is the movingaverage convergence/divergence (MACD) oscillator originallydeveloped by Gerald Appel [5]. MACD uses the crossovers ofa Fast signal given in (12) and a Slow signal given in (13) toindicate a buy or sell signal. The exponential moving average(EMA) of a price series is given in (14) [5]. The Fast signal in(12) is computed from the difference between the EMAand the EMA of using the closing price where
. The Slow signal in (13) is computed from theEMA of the Fast signal
(12)
(13)
(14)
where ; is the number of time instance of themoving average; is the price at the current time instance
; and is the EMA of time instance .Instead of using the crossover of the fast and slow signal to
generate the buy/sell signal, simpler moving average tradingrules can be generated using just the slow signal given in (15),where the slow signal as given in (13) is a moving average of thefast signal and the fast signal is the two moving averages of theprice level: a long-period average and a short-period average [3]
(15)
where is the action from the trading module for time in-stant ; and is given in (13).
Fig. 8 shows the box plots summarizing the multiplicativeprofits using just simple moving average trading rules withoutusing RSPOP-CRI price forecast for 100 experiments on ar-tificially generated price series data generated using (9) and(10). The multiplicative profits are computed using (11) and thetrading rules are constructed using (12)–(14) and (15) with aheuristically chosen , and(please refer to [3], [63] on the choice of moving average pa-rameters). Comparing the results in Fig. 8 against similar ex-periments using recurrent reinforcement learning (RLL) neuralnetwork in [23], the results in the former yielded a median ofabout 25 and 6 times while the latter yielded a median of about6 and 4 times for transaction costs of 0.2% and 0.5% respec-tively. These results further exemplified the high returns ob-tainable using simple moving average trading rules comparedagainst other trading strategies as shown in [3].
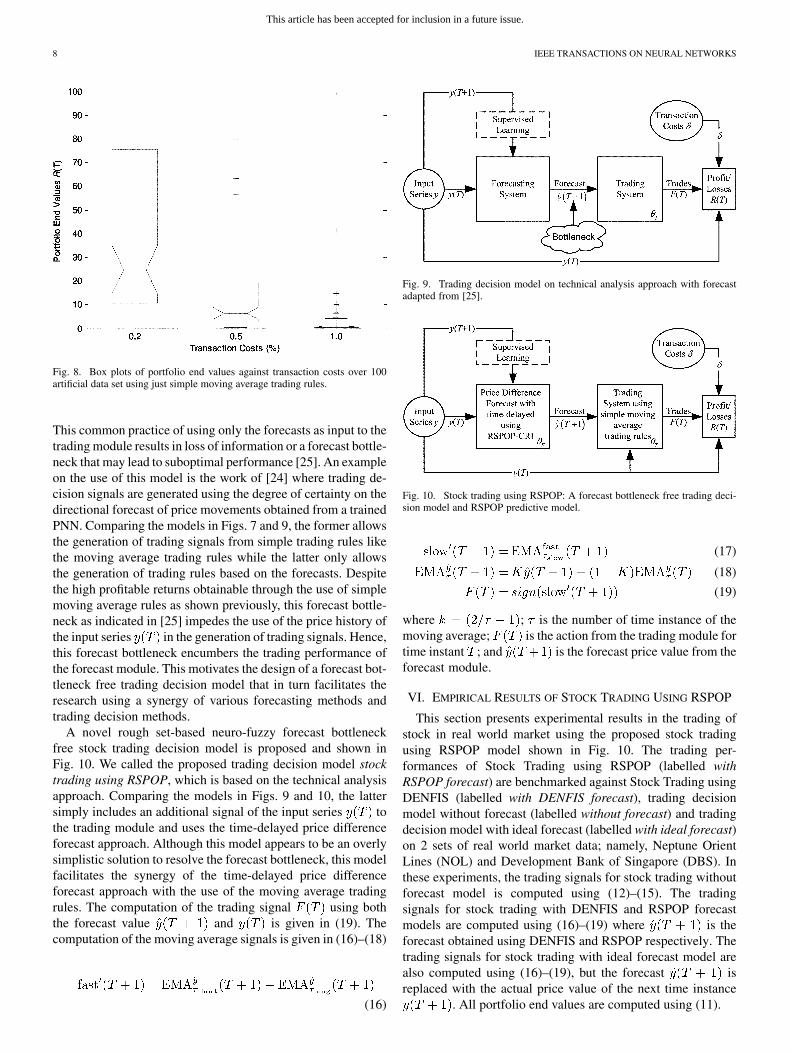
A block diagram for a generic trading decision model basedon the technical analysis approach with forecast is shown inFig. 9 [25]. In such a system, the forecasting module is trainedusing supervised learning on a training data set and is then usedto forecast an out-of-sample data set. The forecasts are thenused as input to a trading module to generate trading signals.
This article has been accepted for inclusion in a future issue.
8 IEEE TRANSACTIONS ON NEURAL NETWORKS
Fig. 8. Box plots of portfolio end values against transaction costs over 100artificial data set using just simple moving average trading rules.
This common practice of using only the forecasts as input to thetrading module results in loss of information or a forecast bottle-neck that may lead to suboptimal performance [25]. An exampleon the use of this model is the work of [24] where trading de-cision signals are generated using the degree of certainty on thedirectional forecast of price movements obtained from a trainedPNN. Comparing the models in Figs. 7 and 9, the former allowsthe generation of trading signals from simple trading rules likethe moving average trading rules while the latter only allowsthe generation of trading rules based on the forecasts. Despitethe high profitable returns obtainable through the use of simplemoving average rules as shown previously, this forecast bottle-neck as indicated in [25] impedes the use of the price history ofthe input series in the generation of trading signals. Hence,this forecast bottleneck encumbers the trading performance ofthe forecast module. This motivates the design of a forecast bot-tleneck free trading decision model that in turn facilitates theresearch using a synergy of various forecasting methods andtrading decision methods.
A novel rough set-based neuro-fuzzy forecast bottleneckfree stock trading decision model is proposed and shown inFig. 10. We called the proposed trading decision model stocktrading using RSPOP, which is based on the technical analysisapproach. Comparing the models in Figs. 9 and 10, the lattersimply includes an additional signal of the input series tothe trading module and uses the time-delayed price differenceforecast approach. Although this model appears to be an overlysimplistic solution to resolve the forecast bottleneck, this modelfacilitates the synergy of the time-delayed price differenceforecast approach with the use of the moving average tradingrules. The computation of the trading signal using boththe forecast value and is given in (19). Thecomputation of the moving average signals is given in (16)–(18)
(16)
Fig. 9. Trading decision model on technical analysis approach with forecastadapted from [25].
Fig. 10. Stock trading using RSPOP: A forecast bottleneck free trading deci-sion model and RSPOP predictive model.
(17)
(18)
(19)
where ; is the number of time instance of themoving average; is the action from the trading module fortime instant ; and is the forecast price value from theforecast module.
VI. EMPIRICAL RESULTS OF STOCK TRADING USING RSPOP
This section presents experimental results in the trading ofstock in real world market using the proposed stock tradingusing RSPOP model shown in Fig. 10. The trading per-formances of Stock Trading using RSPOP (labelled withRSPOP forecast) are benchmarked against Stock Trading usingDENFIS (labelled with DENFIS forecast), trading decisionmodel without forecast (labelled without forecast) and tradingdecision model with ideal forecast (labelled with ideal forecast)on 2 sets of real world market data; namely, Neptune OrientLines (NOL) and Development Bank of Singapore (DBS). Inthese experiments, the trading signals for stock trading withoutforecast model is computed using (12)–(15). The tradingsignals for stock trading with DENFIS and RSPOP forecastmodels are computed using (16)–(19) where is theforecast obtained using DENFIS and RSPOP respectively. Thetrading signals for stock trading with ideal forecast model arealso computed using (16)–(19), but the forecast isreplaced with the actual price value of the next time instance
. All portfolio end values are computed using (11).

This article has been accepted for inclusion in a future issue.
ANG AND QUEK: STOCK TRADING USING RSPOP: A NOVEL ROUGH SET-BASED NEURO-FUZZY APPROACH 9
Fig. 11. Price and trading signals on NOL using the stock trading with RSPOP forecast model.
Fig. 12. Portfolio end values R(T ) on NOL.
A. NOL
In this experiment, the trading performance of using the pro-posed stock trading with RSPOP forecast model on the dailyclosing price of the NOL is compared against the stock tradingwith DENFIS forecast model, the stock trading without fore-cast model and the stock trading with ideal forecast model. Theforecast models are trained with previous values of thedifferenced price series as inputs. The experimental price seriesconsists of 5917 price values obtained from the Yahoo Financewebsite on the counter N03.SI from the period of January 2,1980 to March 1, 2005. The in-sample training data set is con-structed using the first 4000 data points and the out-of-sampletest data set is constructed using the more recent 1917 datapoints. Trading signals are generated using heuristically chosenmoving average parameters , ,and the portfolio end values are calculated with a transac-tion cost of . The moving average trading rule is mod-
ified by the introduction of a 1% moving average band. The in-troduction of this hysteresis band reduces the number of tradingsignals by eliminating the “whiplash” signals when the short-pe-riod and long-period moving averages are close [3].
Figs. 11 and 12 show the out-of-sample price series, thelong and short EMAs, the trading signals and the portfolio endvalues . Starting with a portfolio value of ,at the end of the experiment, the stock trading without forecastmodel yielded a portfolio end value of , theproposed stock trading with RSPOP forecast model yielded
, the stock trading with DENFIS forecastmodel yielded and the stock trading withideal forecast model yielded . The results showthat the stock trading with forecast models yielded higher re-turns than the stock trading without forecast model and yieldedlower returns than the stock trading with ideal forecast model.Overall, the use of the proposed stock trading with RSPOPforecast model yielded an increase of in
This article has been accepted for inclusion in a future issue.
10 IEEE TRANSACTIONS ON NEURAL NETWORKS
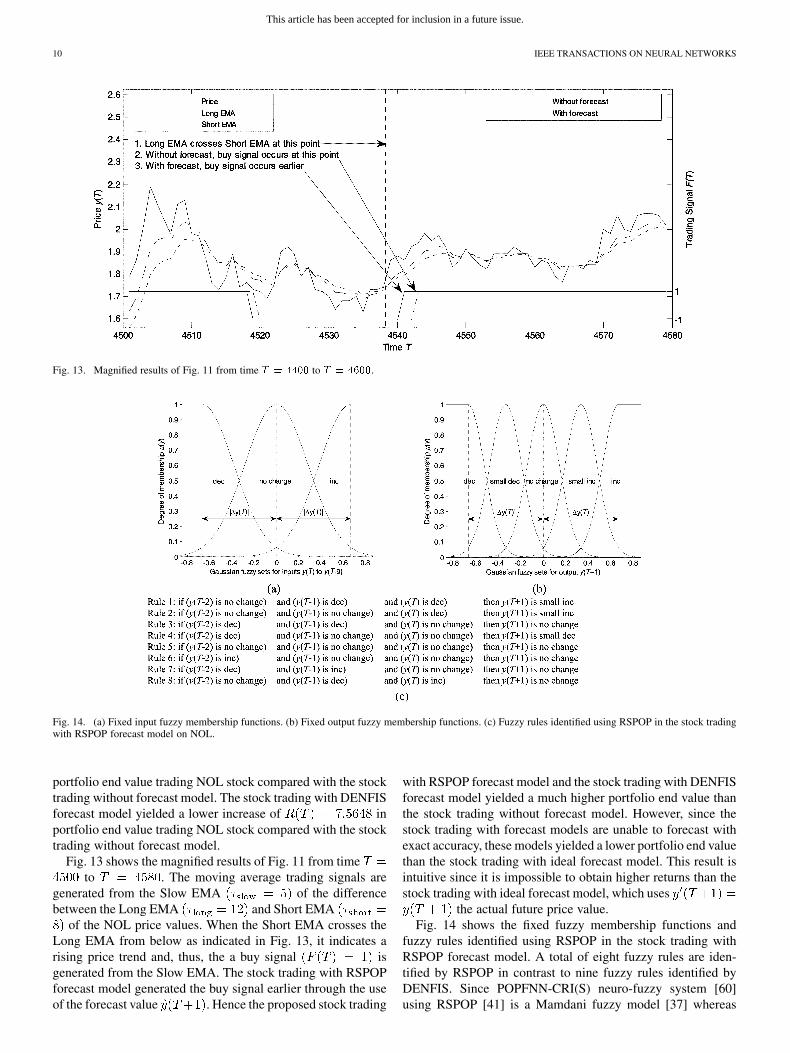
Fig. 13. Magnified results of Fig. 11 from time T = 4400 to T = 4600.
Fig. 14. (a) Fixed input fuzzy membership functions. (b) Fixed output fuzzy membership functions. (c) Fuzzy rules identified using RSPOP in the stock tradingwith RSPOP forecast model on NOL.
portfolio end value trading NOL stock compared with the stocktrading without forecast model. The stock trading with DENFISforecast model yielded a lower increase of inportfolio end value trading NOL stock compared with the stocktrading without forecast model.
Fig. 13 shows the magnified results of Fig. 11 from timeto . The moving average trading signals are
generated from the Slow EMA of the differencebetween the Long EMA and Short EMA
of the NOL price values. When the Short EMA crosses theLong EMA from below as indicated in Fig. 13, it indicates arising price trend and, thus, the a buy signal isgenerated from the Slow EMA. The stock trading with RSPOPforecast model generated the buy signal earlier through the useof the forecast value . Hence the proposed stock trading
with RSPOP forecast model and the stock trading with DENFISforecast model yielded a much higher portfolio end value thanthe stock trading without forecast model. However, since thestock trading with forecast models are unable to forecast withexact accuracy, these models yielded a lower portfolio end valuethan the stock trading with ideal forecast model. This result isintuitive since it is impossible to obtain higher returns than thestock trading with ideal forecast model, which uses
the actual future price value.Fig. 14 shows the fixed fuzzy membership functions and
fuzzy rules identified using RSPOP in the stock trading withRSPOP forecast model. A total of eight fuzzy rules are iden-tified by RSPOP in contrast to nine fuzzy rules identified byDENFIS. Since POPFNN-CRI(S) neuro-fuzzy system [60]using RSPOP [41] is a Mamdani fuzzy model [37] whereas

This article has been accepted for inclusion in a future issue.
ANG AND QUEK: STOCK TRADING USING RSPOP: A NOVEL ROUGH SET-BASED NEURO-FUZZY APPROACH 11
Fig. 15. Price and trading signals on NOL using the stock trading with RSPOP forecast model but using another set of moving average trading parameters.
Fig. 16. Portfolio end values R(T ) on NOL using another set of moving average parameters.
DENFIS neuro-fuzzy system [36] is a TSK fuzzy model [40],the rules identified in the former are more interpretable thanDENFIS model [39]. Moreover, Fig. 14 shows that only thethree of the time-delayed price values ( , and
) are used in the stock trading with RSPOP forecastmodel instead of the all the time-delayed price values toforecast the future price values. Since the heuristically chosenvalue of does not represent the embedding dimensionof the NOL price series, the results show that the use of theRSPOP algorithm enabled the computation of an appropriatevalue of the embedding dimension. In contrast, the fuzzy rulesin the stock trading with DENFIS forecast model used all tentime-delayed price values and the fuzzy rules are too complexto be listed. Therefore, the results showed that the proposedstock trading with RSPOP forecast model not only yielded ahigher portfolio end value than the stock trading with DENFISforecast model, but also yielded more interpretable rules by
computing an appropriate embedding dimension comparedagainst the stock trading with DENFIS forecast model.
B. NOL—Different Trading Parameters
The experiment is repeated using another set of moving av-erage parameters , , , and theportfolio end values are calculated with the same transac-tion cost of . Figs. 15 and 16 show the out-of-sampleprice series with long and short EMAs, the trading signals andthe portfolio end values using this set of moving averageparameters.
Starting with a portfolio value of , at theend of the experiment, the stock trading without forecastmodel yielded a portfolio end value of , theproposed stock trading model RSPOP forecast model yielded
, the stock trading with DENFIS forecastmodel yielded and the stock trading with
This article has been accepted for inclusion in a future issue.
12 IEEE TRANSACTIONS ON NEURAL NETWORKS
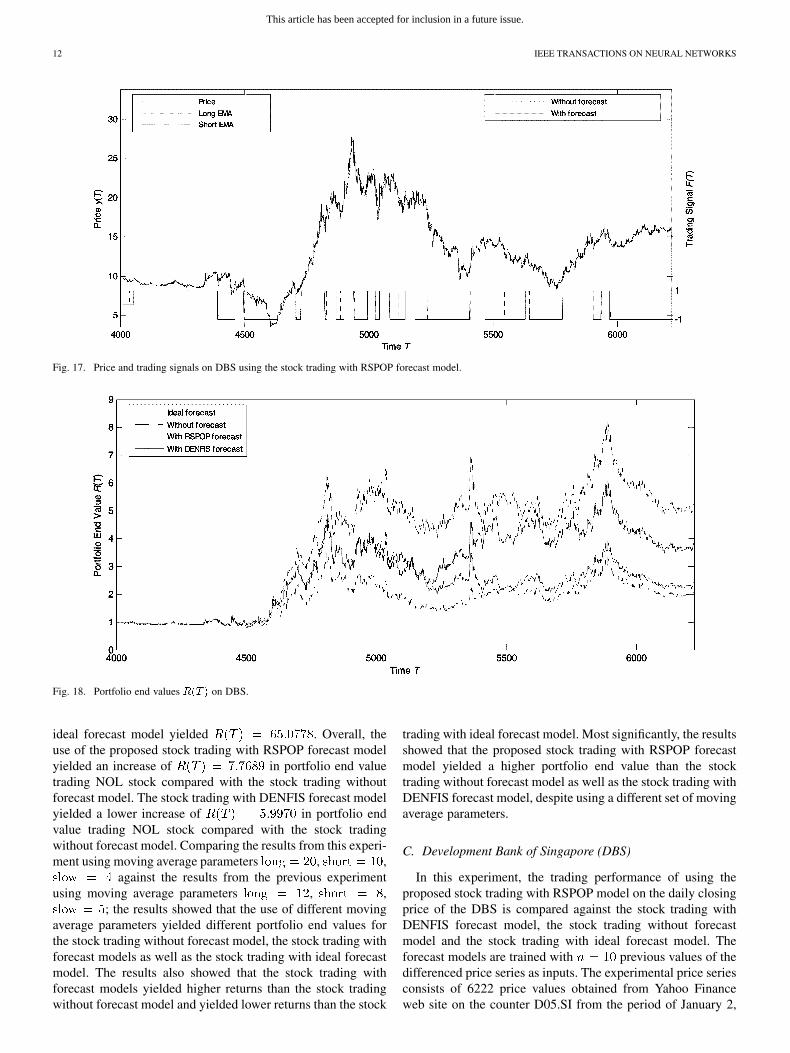
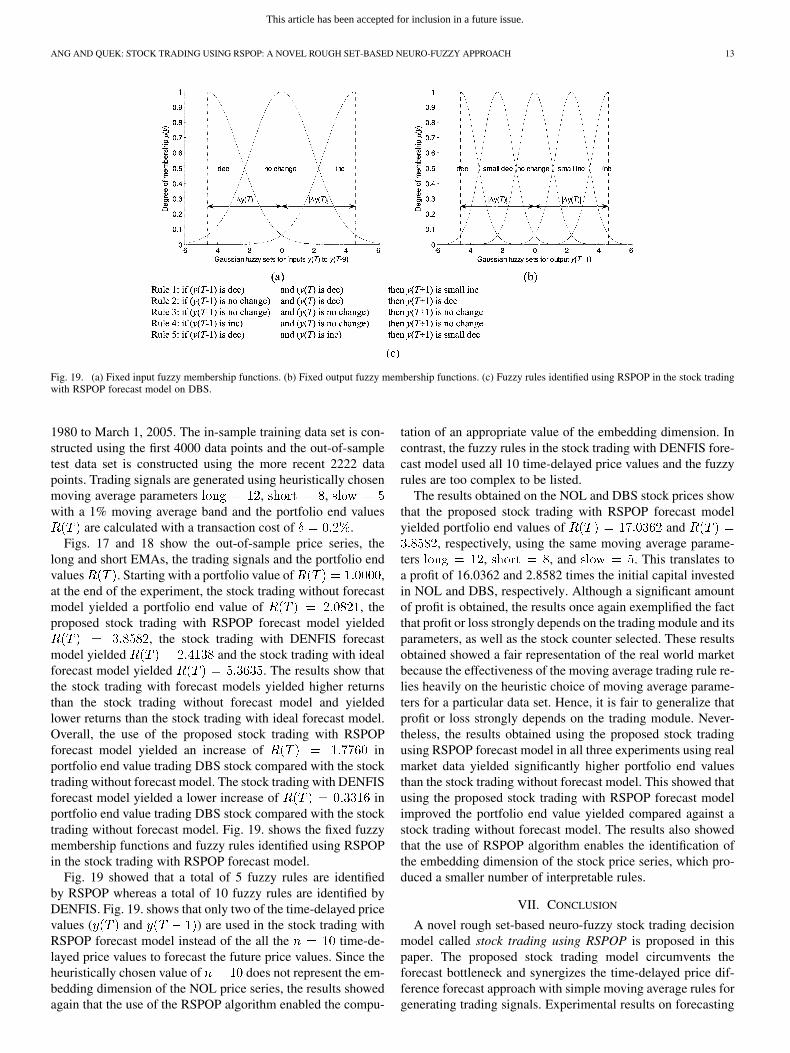
Fig. 17. Price and trading signals on DBS using the stock trading with RSPOP forecast model.
Fig. 18. Portfolio end values R(T ) on DBS.
ideal forecast model yielded . Overall, theuse of the proposed stock trading with RSPOP forecast modelyielded an increase of in portfolio end valuetrading NOL stock compared with the stock trading withoutforecast model. The stock trading with DENFIS forecast modelyielded a lower increase of in portfolio endvalue trading NOL stock compared with the stock tradingwithout forecast model. Comparing the results from this experi-ment using moving average parameters , ,
against the results from the previous experimentusing moving average parameters , ,
; the results showed that the use of different movingaverage parameters yielded different portfolio end values forthe stock trading without forecast model, the stock trading withforecast models as well as the stock trading with ideal forecastmodel. The results also showed that the stock trading withforecast models yielded higher returns than the stock tradingwithout forecast model and yielded lower returns than the stock
trading with ideal forecast model. Most significantly, the resultsshowed that the proposed stock trading with RSPOP forecastmodel yielded a higher portfolio end value than the stocktrading without forecast model as well as the stock trading withDENFIS forecast model, despite using a different set of movingaverage parameters.
C. Development Bank of Singapore (DBS)
In this experiment, the trading performance of using theproposed stock trading with RSPOP model on the daily closingprice of the DBS is compared against the stock trading withDENFIS forecast model, the stock trading without forecastmodel and the stock trading with ideal forecast model. Theforecast models are trained with previous values of thedifferenced price series as inputs. The experimental price seriesconsists of 6222 price values obtained from Yahoo Financeweb site on the counter D05.SI from the period of January 2,
This article has been accepted for inclusion in a future issue.
ANG AND QUEK: STOCK TRADING USING RSPOP: A NOVEL ROUGH SET-BASED NEURO-FUZZY APPROACH 13
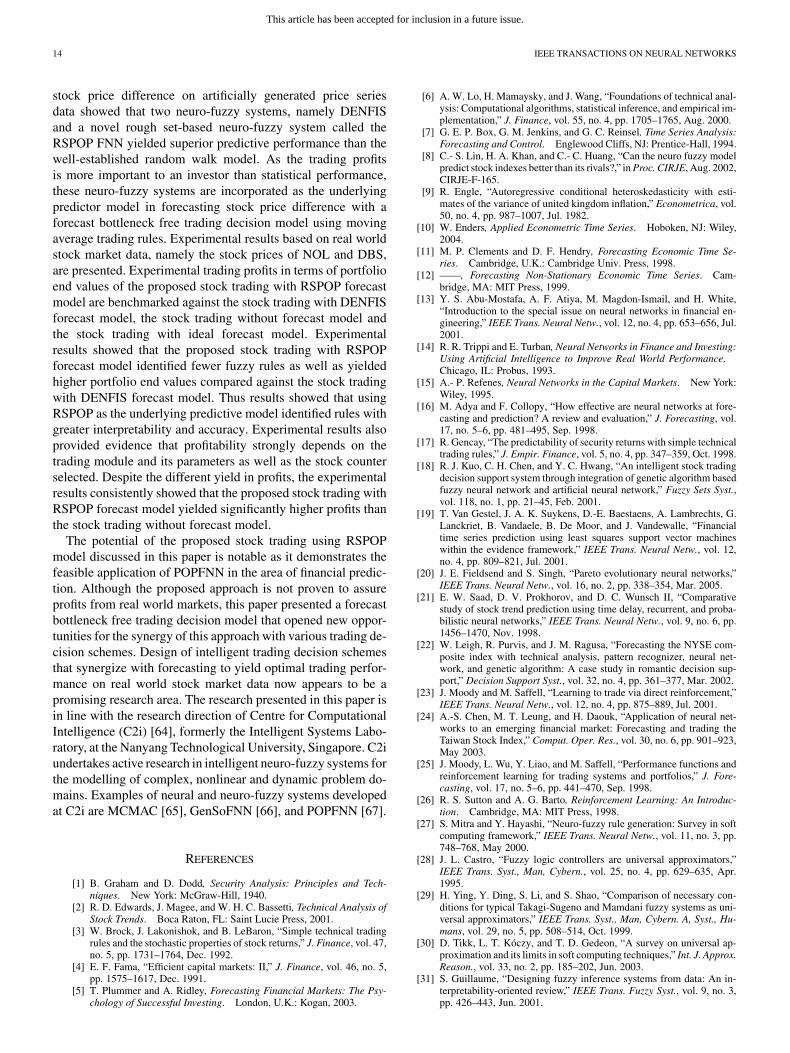
Fig. 19. (a) Fixed input fuzzy membership functions. (b) Fixed output fuzzy membership functions. (c) Fuzzy rules identified using RSPOP in the stock tradingwith RSPOP forecast model on DBS.
1980 to March 1, 2005. The in-sample training data set is con-structed using the first 4000 data points and the out-of-sampletest data set is constructed using the more recent 2222 datapoints. Trading signals are generated using heuristically chosenmoving average parameters , ,with a 1% moving average band and the portfolio end values
are calculated with a transaction cost of .Figs. 17 and 18 show the out-of-sample price series, the
long and short EMAs, the trading signals and the portfolio endvalues . Starting with a portfolio value of ,at the end of the experiment, the stock trading without forecastmodel yielded a portfolio end value of , theproposed stock trading with RSPOP forecast model yielded
, the stock trading with DENFIS forecastmodel yielded and the stock trading with idealforecast model yielded . The results show thatthe stock trading with forecast models yielded higher returnsthan the stock trading without forecast model and yieldedlower returns than the stock trading with ideal forecast model.Overall, the use of the proposed stock trading with RSPOPforecast model yielded an increase of inportfolio end value trading DBS stock compared with the stocktrading without forecast model. The stock trading with DENFISforecast model yielded a lower increase of inportfolio end value trading DBS stock compared with the stocktrading without forecast model. Fig. 19. shows the fixed fuzzymembership functions and fuzzy rules identified using RSPOPin the stock trading with RSPOP forecast model.
Fig. 19 showed that a total of 5 fuzzy rules are identifiedby RSPOP whereas a total of 10 fuzzy rules are identified byDENFIS. Fig. 19. shows that only two of the time-delayed pricevalues ( and ) are used in the stock trading withRSPOP forecast model instead of the all the time-de-layed price values to forecast the future price values. Since theheuristically chosen value of does not represent the em-bedding dimension of the NOL price series, the results showedagain that the use of the RSPOP algorithm enabled the compu-
tation of an appropriate value of the embedding dimension. Incontrast, the fuzzy rules in the stock trading with DENFIS fore-cast model used all 10 time-delayed price values and the fuzzyrules are too complex to be listed.
The results obtained on the NOL and DBS stock prices showthat the proposed stock trading with RSPOP forecast modelyielded portfolio end values of and
, respectively, using the same moving average parame-ters , , and . This translates toa profit of 16.0362 and 2.8582 times the initial capital investedin NOL and DBS, respectively. Although a significant amountof profit is obtained, the results once again exemplified the factthat profit or loss strongly depends on the trading module and itsparameters, as well as the stock counter selected. These resultsobtained showed a fair representation of the real world marketbecause the effectiveness of the moving average trading rule re-lies heavily on the heuristic choice of moving average parame-ters for a particular data set. Hence, it is fair to generalize thatprofit or loss strongly depends on the trading module. Never-theless, the results obtained using the proposed stock tradingusing RSPOP forecast model in all three experiments using realmarket data yielded significantly higher portfolio end valuesthan the stock trading without forecast model. This showed thatusing the proposed stock trading with RSPOP forecast modelimproved the portfolio end value yielded compared against astock trading without forecast model. The results also showedthat the use of RSPOP algorithm enables the identification ofthe embedding dimension of the stock price series, which pro-duced a smaller number of interpretable rules.
VII. CONCLUSION
A novel rough set-based neuro-fuzzy stock trading decisionmodel called stock trading using RSPOP is proposed in thispaper. The proposed stock trading model circumvents theforecast bottleneck and synergizes the time-delayed price dif-ference forecast approach with simple moving average rules forgenerating trading signals. Experimental results on forecasting
This article has been accepted for inclusion in a future issue.
14 IEEE TRANSACTIONS ON NEURAL NETWORKS
stock price difference on artificially generated price seriesdata showed that two neuro-fuzzy systems, namely DENFISand a novel rough set-based neuro-fuzzy system called theRSPOP FNN yielded superior predictive performance than thewell-established random walk model. As the trading profitsis more important to an investor than statistical performance,these neuro-fuzzy systems are incorporated as the underlyingpredictor model in forecasting stock price difference with aforecast bottleneck free trading decision model using movingaverage trading rules. Experimental results based on real worldstock market data, namely the stock prices of NOL and DBS,are presented. Experimental trading profits in terms of portfolioend values of the proposed stock trading with RSPOP forecastmodel are benchmarked against the stock trading with DENFISforecast model, the stock trading without forecast model andthe stock trading with ideal forecast model. Experimentalresults showed that the proposed stock trading with RSPOPforecast model identified fewer fuzzy rules as well as yieldedhigher portfolio end values compared against the stock tradingwith DENFIS forecast model. Thus results showed that usingRSPOP as the underlying predictive model identified rules withgreater interpretability and accuracy. Experimental results alsoprovided evidence that profitability strongly depends on thetrading module and its parameters as well as the stock counterselected. Despite the different yield in profits, the experimentalresults consistently showed that the proposed stock trading withRSPOP forecast model yielded significantly higher profits thanthe stock trading without forecast model.
The potential of the proposed stock trading using RSPOPmodel discussed in this paper is notable as it demonstrates thefeasible application of POPFNN in the area of financial predic-tion. Although the proposed approach is not proven to assureprofits from real world markets, this paper presented a forecastbottleneck free trading decision model that opened new oppor-tunities for the synergy of this approach with various trading de-cision schemes. Design of intelligent trading decision schemesthat synergize with forecasting to yield optimal trading perfor-mance on real world stock market data now appears to be apromising research area. The research presented in this paper isin line with the research direction of Centre for ComputationalIntelligence (C2i) [64], formerly the Intelligent Systems Labo-ratory, at the Nanyang Technological University, Singapore. C2iundertakes active research in intelligent neuro-fuzzy systems forthe modelling of complex, nonlinear and dynamic problem do-mains. Examples of neural and neuro-fuzzy systems developedat C2i are MCMAC [65], GenSoFNN [66], and POPFNN [67].
REFERENCES
[1] B. Graham and D. Dodd, Security Analysis: Principles and Tech-niques. New York: McGraw-Hill, 1940.
[2] R. D. Edwards, J. Magee, and W. H. C. Bassetti, Technical Analysis ofStock Trends. Boca Raton, FL: Saint Lucie Press, 2001.
[3] W. Brock, J. Lakonishok, and B. LeBaron, “Simple technical tradingrules and the stochastic properties of stock returns,” J. Finance, vol. 47,no. 5, pp. 1731–1764, Dec. 1992.
[4] E. F. Fama, “Efficient capital markets: II,” J. Finance, vol. 46, no. 5,pp. 1575–1617, Dec. 1991.
[5] T. Plummer and A. Ridley, Forecasting Financial Markets: The Psy-chology of Successful Investing. London, U.K.: Kogan, 2003.
[6] A. W. Lo, H. Mamaysky, and J. Wang, “Foundations of technical anal-ysis: Computational algorithms, statistical inference, and empirical im-plementation,” J. Finance, vol. 55, no. 4, pp. 1705–1765, Aug. 2000.
[7] G. E. P. Box, G. M. Jenkins, and G. C. Reinsel, Time Series Analysis:Forecasting and Control. Englewood Cliffs, NJ: Prentice-Hall, 1994.
[8] C.- S. Lin, H. A. Khan, and C.- C. Huang, “Can the neuro fuzzy modelpredict stock indexes better than its rivals?,” in Proc. CIRJE, Aug. 2002,CIRJE-F-165.
[9] R. Engle, “Autoregressive conditional heteroskedasticity with esti-mates of the variance of united kingdom inflation,” Econometrica, vol.50, no. 4, pp. 987–1007, Jul. 1982.
[10] W. Enders, Applied Econometric Time Series. Hoboken, NJ: Wiley,2004.
[11] M. P. Clements and D. F. Hendry, Forecasting Economic Time Se-ries. Cambridge, U.K.: Cambridge Univ. Press, 1998.
[12] ——, Forecasting Non-Stationary Economic Time Series. Cam-bridge, MA: MIT Press, 1999.
[13] Y. S. Abu-Mostafa, A. F. Atiya, M. Magdon-Ismail, and H. White,“Introduction to the special issue on neural networks in financial en-gineering,” IEEE Trans. Neural Netw., vol. 12, no. 4, pp. 653–656, Jul.2001.
[14] R. R. Trippi and E. Turban, Neural Networks in Finance and Investing:Using Artificial Intelligence to Improve Real World Performance.Chicago, IL: Probus, 1993.
[15] A.- P. Refenes, Neural Networks in the Capital Markets. New York:Wiley, 1995.
[16] M. Adya and F. Collopy, “How effective are neural networks at fore-casting and prediction? A review and evaluation,” J. Forecasting, vol.17, no. 5–6, pp. 481–495, Sep. 1998.
[17] R. Gencay, “The predictability of security returns with simple technicaltrading rules,” J. Empir. Finance, vol. 5, no. 4, pp. 347–359, Oct. 1998.
[18] R. J. Kuo, C. H. Chen, and Y. C. Hwang, “An intelligent stock tradingdecision support system through integration of genetic algorithm basedfuzzy neural network and artificial neural network,” Fuzzy Sets Syst.,vol. 118, no. 1, pp. 21–45, Feb. 2001.
[19] T. Van Gestel, J. A. K. Suykens, D.-E. Baestaens, A. Lambrechts, G.Lanckriet, B. Vandaele, B. De Moor, and J. Vandewalle, “Financialtime series prediction using least squares support vector machineswithin the evidence framework,” IEEE Trans. Neural Netw., vol. 12,no. 4, pp. 809–821, Jul. 2001.
[20] J. E. Fieldsend and S. Singh, “Pareto evolutionary neural networks,”IEEE Trans. Neural Netw., vol. 16, no. 2, pp. 338–354, Mar. 2005.
[21] E. W. Saad, D. V. Prokhorov, and D. C. Wunsch II, “Comparativestudy of stock trend prediction using time delay, recurrent, and proba-bilistic neural networks,” IEEE Trans. Neural Netw., vol. 9, no. 6, pp.1456–1470, Nov. 1998.
[22] W. Leigh, R. Purvis, and J. M. Ragusa, “Forecasting the NYSE com-posite index with technical analysis, pattern recognizer, neural net-work, and genetic algorithm: A case study in romantic decision sup-port,” Decision Support Syst., vol. 32, no. 4, pp. 361–377, Mar. 2002.
[23] J. Moody and M. Saffell, “Learning to trade via direct reinforcement,”IEEE Trans. Neural Netw., vol. 12, no. 4, pp. 875–889, Jul. 2001.
[24] A.-S. Chen, M. T. Leung, and H. Daouk, “Application of neural net-works to an emerging financial market: Forecasting and trading theTaiwan Stock Index,” Comput. Oper. Res., vol. 30, no. 6, pp. 901–923,May 2003.
[25] J. Moody, L. Wu, Y. Liao, and M. Saffell, “Performance functions andreinforcement learning for trading systems and portfolios,” J. Fore-casting, vol. 17, no. 5–6, pp. 441–470, Sep. 1998.
[26] R. S. Sutton and A. G. Barto, Reinforcement Learning: An Introduc-tion. Cambridge, MA: MIT Press, 1998.
[27] S. Mitra and Y. Hayashi, “Neuro-fuzzy rule generation: Survey in softcomputing framework,” IEEE Trans. Neural Netw., vol. 11, no. 3, pp.748–768, May 2000.
[28] J. L. Castro, “Fuzzy logic controllers are universal approximators,”IEEE Trans. Syst., Man, Cybern., vol. 25, no. 4, pp. 629–635, Apr.1995.
[29] H. Ying, Y. Ding, S. Li, and S. Shao, “Comparison of necessary con-ditions for typical Takagi-Sugeno and Mamdani fuzzy systems as uni-versal approximators,” IEEE Trans. Syst., Man, Cybern. A, Syst., Hu-mans, vol. 29, no. 5, pp. 508–514, Oct. 1999.
[30] D. Tikk, L. T. Kóczy, and T. D. Gedeon, “A survey on universal ap-proximation and its limits in soft computing techniques,” Int. J. Approx.Reason., vol. 33, no. 2, pp. 185–202, Jun. 2003.
[31] S. Guillaume, “Designing fuzzy inference systems from data: An in-terpretability-oriented review,” IEEE Trans. Fuzzy Syst., vol. 9, no. 3,pp. 426–443, Jun. 2001.
This article has been accepted for inclusion in a future issue.
ANG AND QUEK: STOCK TRADING USING RSPOP: A NOVEL ROUGH SET-BASED NEURO-FUZZY APPROACH 15
[32] R. R. Trippi and J. K. Lee, Artificial Intelligence in Finance & In-vesting: State-of-the-Art Technologies for Securities Selection andPortfolio Management. Chicago, IL: Irwin Professional, 1996.
[33] K. N. Pantazopoulos, L. H. Tsoukalas, N. G. Bourbakis, M. J. Brun,and E. N. Houstis, “Financial prediction and trading strategies usingneurofuzzy approaches,” IEEE Trans. Syst., Man, Cybern. B, Cybern.,vol. 28, no. 4, pp. 520–531, Aug. 1998.
[34] T. Nishina and M. Hagiwara, “Fuzzy inference neural network,” Neu-rocomput., vol. 14, no. 3, pp. 223–239, Feb. 1997.
[35] H. Nakanishi, I. B. Turksen, and M. Sugeno, “A review and comparisonof six reasoning methods,” Fuzzy Sets Syst., vol. 57, no. 3, pp. 257–294,Aug. 1993.
[36] N. K. Kasabov and Q. Song, “DENFIS: Dynamic evolving neural-fuzzy inference system and its application for time-series prediction,”IEEE Trans. Fuzzy Syst., vol. 10, no. 2, pp. 144–154, Apr. 2002.
[37] E. H. Mamdani and S. Assilian, “An experiment in linguistic synthesiswith a fuzzy logic controller,” Int. J. Man-Machine Stud., vol. 7, no. 1,pp. 1–13, 1975.
[38] T. Takagi and M. Sugeno, “Fuzzy identification of systems and its ap-plications to modeling and control,” IEEE Trans. Syst., Man, Cybern.,vol. SMC-15, no. 1, pp. 116–132, Jan. 1985.
[39] J. Casillas, O. Cordón, F. Herrera, and L. Magdalena, InterpretabilityIssues in Fuzzy Modeling. Berlin, Germany: Springer-Verlag, 2003.
[40] M. Sugeno and G. T. Kang, “Structure identification of fuzzy model,”Fuzzy Sets Syst., vol. 28, no. 1, pp. 15–33, Oct. 1988.
[41] K. K. Ang and C. Quek, “RSPOP: Rough set-based pseudo outer-product fuzzy rule identification algorithm,” Neural Comput., vol. 17,no. 1, pp. 205–243, Jan. 2005.
[42] T. A. Johansen and R. Babuska, “Multiobjective identification ofTakagi-Sugeno fuzzy models,” IEEE Trans. Fuzzy Syst., vol. 11, no.6, pp. 847–860, Dec. 2003.
[43] J. Yen, L. Wang, and C. W. Gillespie, “Improving the interpretability ofTSK fuzzy models by combining global learning and local learning,”IEEE Trans. Fuzzy Syst., vol. 6, no. 4, pp. 530–537, Nov. 1998.
[44] Y. Jin, “Fuzzy modeling of high-dimensional systems: Complexity re-duction,” IEEE Trans. Fuzzy Syst., vol. 8, no. 2, pp. 212–221, Apr.2000.
[45] Z. Pawlak, Rough Sets: Theoretical Aspects of Reasoning AboutData. Boston, MA: Kluwer, 1991.
[46] R. W. Swiniarski and A. Skowron, “Rough set methods in feature selec-tion and recognition,” Pattern Recogn. Lett., vol. 24, no. 6, pp. 833–849,Mar. 2003.
[47] D. Kugiumtzis, B. Lillekjendlie, and N. Christophersen, “Chaotic timeseries part I: Estimation of some invariant properties in state space,”Model., Ident. Control, vol. 15, no. 4, pp. 205–224, 1994.
[48] N. H. Packard, J. P. Crutchfield, J. D. Farmer, and R. S. Shaw, “Geom-etry from a time series,” Phys. Rev. Lett., vol. 45, no. 9, pp. 712–715,Sep. 1980.
[49] F. Takens, , D. A. Rand and L.- S. Young, Eds., “Detecting strangeattractors in turbulence,” in Dynamical Systems and Turbulence. NewYork: Springer-Verlag, 1981, pp. 366–381.
[50] L. P. Maguire, B. Roche, T. M. McGinnity, and L. J. McDaid, “Pre-dicting a chaotic time series using a fuzzy neural network,” Inform.Sci., vol. 112, no. 1–4, pp. 125–136, Dec. 1998.
[51] T. Kimoto, K. Asakawa, M. Yoda, and M. Takeoka, “Stock marketprediction system with modular neural networks,” in Proc. IJCNN Int.Joint Conf. Neural Networks, 1990, vol. 1, pp. 1–6.
[52] L.-X. Wang and J. M. Mendel, “Generating fuzzy rules by learningfrom examples,” IEEE Trans. Syst., Man, Cybern., vol. 22, no. 6, pp.1414–1427, Nov. 1992.
[53] N. R. Sanders and L. P. Ritzman, “The need for contextual andtechnical knowledge in judgmental forecasting,” J. Behav. DecisionMaking, vol. 5, no. 1, pp. 39–52, Jan. 1992.
[54] M. O’Connor, W. Remus, and K. Griggs, “Going up-going down: Howgood are people at forecasting trends and changes in trends?,” J. Fore-casting, vol. 16, no. 3, pp. 165–176, May 1997.
[55] D. E. Rumelhart, G. E. Hinton, and R. J. Williams, , D. E. Rumelhartand J. L. McClelland, Eds., “Learning internal representations by errorpropagation,” in Parallel Distributed Processing: Explorations in theMicrostructure of Cognition. Cambridge, MA: MIT Press, 1986, vol.1, pp. 318–362.
[56] S. Chen, C. F. N. Cowan, and P. M. Grant, “Orthogonal least squareslearning algorithm for radial basis,” IEEE Trans. Neural Netw., vol. 2,no. 2, pp. 302–309, Mar. 1991.
[57] J.-S. R. Jang, “ANFIS: Adaptive-network-based fuzzy inferencesystem,” IEEE Trans. Syst., Man, Cybern., vol. 23, no. 3, pp. 665–685,May 1993.
[58] S. L. Chiu, “Fuzzy model identification based on cluster estimation,”J. Intell. Fuzzy Syst., vol. 2, no. 3, pp. 267–278, 1994.
[59] N. Kasabov, “Evolving fuzzy neural networks for supervised/unsuper-vised online knowledge-based learning,” IEEE Trans. Syst., Man, Cy-bern. B, Cybern., vol. 31, no. 6, pp. 902–918, Dec. 2001.
[60] K. K. Ang, C. Quek, and M. Pasquier, “POPFNN-CRI(S): Pseudo outerproduct based fuzzy neural network using the compositional rule ofinference and singleton fuzzifier,” IEEE Trans. Syst., Man, Cybern. B,Cybern., vol. 33, no. 6, pp. 838–849, Dec. 2003.
[61] G. J. Klir and B. Yuan, Fuzzy Sets and Fuzzy Logic: Theory and Appli-cations. Upper Saddle River, NJ: Prentice-Hall, 1995.
[62] D. Dubois and H. Prade, Fundamentals of Fuzzy Sets. Boston, MA:Kluwer, 2000.
[63] S. Taylor, Basics of moving averages 2001 [Online]. Available: http://www.investopedia.com/articles/technical/052201.asp
[64] Centre for computational intelligence 2005 [Online]. Available: http://www.c2i.ntu.edu.sg
[65] K. K. Ang and C. Quek, “Improved MCMAC with momentum, neigh-borhood, and averaged trapezoidal output,” IEEE Trans. Syst., Man,Cybern. B, Cybern., vol. 30, no. 3, pp. 491–500, Jun. 2000.
[66] W. L. Tung and C. Quek, “GenSoFNN: A generic self-organizingfuzzy neural network,” IEEE Trans. Neural Netw., vol. 13, no. 5, pp.1075–1086, Sep. 2002.
[67] R. W. Zhou and C. Quek, “POPFNN: A pseudo outer-product basedfuzzy neural network,” Neural Networks, vol. 9, no. 9, pp. 1569–1581,Dec. 1996.
Kai Keng Ang (S’05) received the B.A.Sc. (withfirst-class honors) and M.Phil. degrees in computerengineering from Nanyang Technological Univer-sity, Singapore, in 1997 and 1999, respectively. Heis currently working toward the Ph.D. degree atthe Centre for Computational Intelligence, Schoolof Computer Engineering, Nanyang TechnologicalUniversity.
He was a Senior Software Engineer with DelphiAutomotive Systems, Singapore, Pte, Ltd., workingon embedded software for automotive engine con-
trollers from 1999 to 2003.Mr. Ang was awarded the Singapore Millennium Foundation Ph.D. Scholar-
ship in 2005.
Chai Quek (M’83) received the B.Sc. degree in elec-trical and electronics engineering and the Ph.D. de-gree in intelligent control, both from Heriot Watt Uni-versity, Edinburgh, U.K., in 1986 and 1990, respec-tively.
He is an Associate Professor and a member ofthe Centre for Computational Intelligence, Schoolof Computer Engineering, Nanyang TechnologicalUniversity, Singapore. His research interests includeintelligent control, intelligent architectures, artificialintelligence in education, neural networks, fuzzy
systems, fuzzy rule-based systems, and genetic algorithms.