stock moves in the portfolios of sector, thematic and smallcap mutual fund categories
TRANSCRIPT

RETAIL RESEARCH
The following tables portray the stock moves in the portfolios of Sector, Thematic and Small-cap categories in the last one year period, comparing the portfolio data between June 2015 & June 2014. Summary: i. Equity Sector – Banking:
a) Mostly preferred stocks by the Banking sector funds (as on June 2015) - HDFC Bank, ICICI Bank, Axis Bank, Yes Bank, SBI, etc. b) In some of stocks such as Shriram Transport Finance Company Ltd, Allahabad Bank, Axis Bank Ltd and IndusInd Bank Ltd, witnessed increased exposures considerably in the last one
year period. c) Dewan Housing Finance Corporation Ltd, Capital First Ltd, Shriram City Union Finance Ltd - some stocks which seen added newly in the recent periods in the portfolio of banking funds. d) Over all banking category increased positions in the stocks such as Axis Bank Ltd, HDFC Bank Ltd, IndusInd Bank Ltd, etc.
There are 11 schemes are coming under Equity Sector – Banking category. They are Baroda Pio Bank&Fin, Birla SL Banking & Fin, ICICI Pru Banking & Fin, LIC NOMURA MF Banking & Fin, Reliance Banking, Religare Invesco Banking, Sahara Banking & Financial Services, SBI Banking & Financial Services, Sundaram Fin Serv Oppo, Taurus Banking & Financial Servi and UTI-Banking Sector Fund.
ii. Equity Sector – FMCG:
a) Most preferred stocks by FMCG funds are ITC Ltd, Britannia Industries Ltd, Procter & Gamble Hygiene and Health Care Ltd, United Breweries Ltd, etc (as on June 2015). b) FMCG funds increased their investment notably in stocks such as Thangamayil Jewellery Ltd, Eveready Industries India Ltd, Procter & Gamble Hygiene and Health Care Ltd, Jyothy
Laboratories Ltd, etc. c) Newly added some stocks by the Equity FMCG Category during recent periods are United Breweries Ltd, Manpasand Beverages Ltd, Asian Paints Ltd, etc.
There are 2 funds as ICICI Pru FMCG and SBI FMCG Fund coming under this FMCG category.
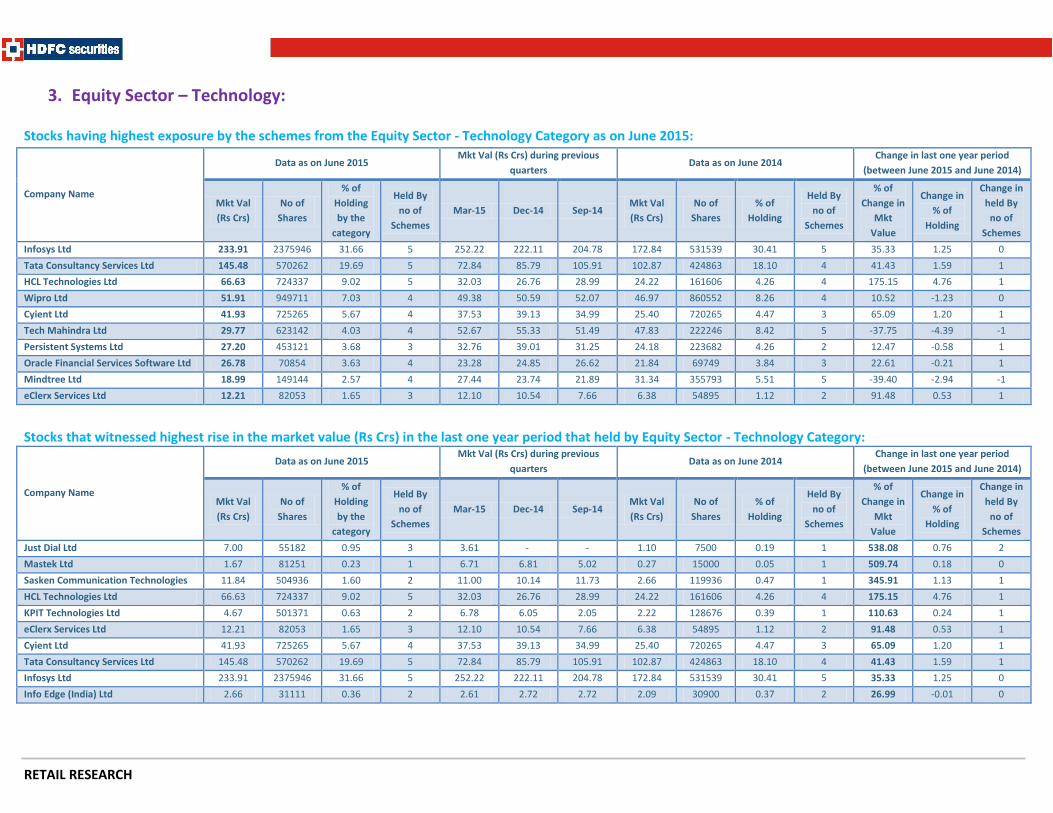
iii. Equity Sector – Technology:
a) Most preferred stocks by Technology funds (as on June 2015) are Infosys Ltd, Tata Consultancy Services Ltd, HCL Technologies Ltd, Wipro Ltd, Cyient Ltd, etc. b) Technology funds increased their exposure in Just Dial Ltd, Mastek Ltd, Sasken Communication Technologies, HCL Technologies Ltd, etc. c) Newly added stocks by the Equity Technology Category during recent periods are Hexaware Technologies Ltd, Accelya Kale Solutions Ltd, Majesco Ltd, etc. d) Overall Technology funds category increased position in the stocks in last one year such as HCL Technologies Ltd, Tata Consultancy Services Ltd, Infosys Ltd, Cyient Ltd, etc.
There are 5 schemes - Birla Sun Life New Millennium, DSP BR Technology.com, Franklin Infotech, ICICI Pru Technology and SBI IT Fund coming under this category.
iv. Equity Sector – Pharma:
a) Most preferred stocks by Pharma funds (as on June 2015) are Sun Pharmaceuticals Industries Ltd, Lupin Ltd, Divis Laboratories Ltd, Cadila Healthcare Ltd, etc. b) Pharma funds increased their exposure in last one year in Pfizer Ltd, Glenmark Pharmaceuticals Ltd, Torrent Pharmaceuticals Ltd, etc. c) Newly added stocks by the Equity Pharmaceuticals Category during recent periods are Ajanta Pharma Ltd and Fulford (India) Ltd.
RETAIL RESEARCH
August 06, 2015
Stock moves in the portfolios of Sector, Thematic and Small-cap Mutual Fund Categories

RETAIL RESEARCH
d) Sun Pharmaceuticals Industries Ltd, Aurobindo Pharma Ltd and Glenmark Pharmaceuticals Ltd are some of the stocks wherein the Pharma category increased their position in the last one year.
There are 3 funds - Reliance Pharma, SBI Pharma and UTI-Pharma & Healthcare coming under this category.
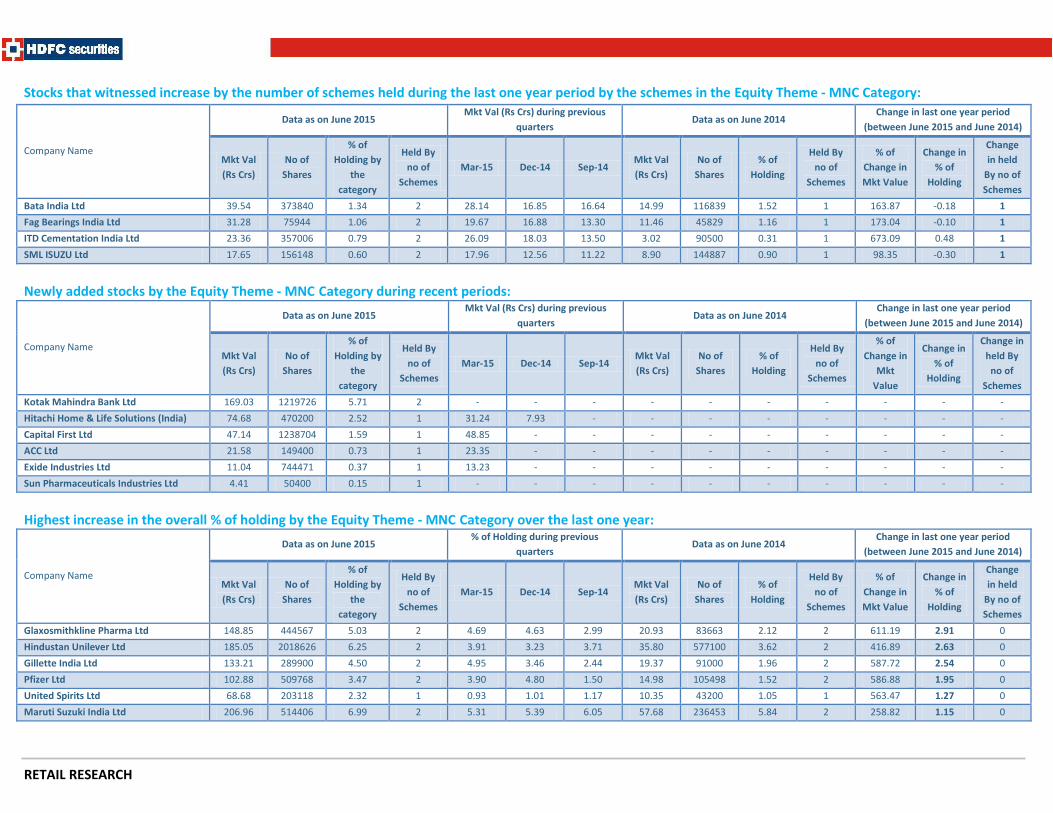
v. Equity Theme – MNC:
a) Most preferred stocks by MNC funds (as on June 2015) are Maruti Suzuki India Ltd, Bosch Ltd, Hindustan Unilever Ltd, Bayer CropScience Ltd, Kotak Mahindra Bank Ltd, etc. b) Whirlpool of India Ltd , ITD Cementation India Ltd, Mahindra CIE Automotive Ltd are the Stocks that witnessed highest rise in the market value (Rs Crs) in the last one year period that
are held by Equity Theme - MNC Category. c) Newly added stocks by the Equity Theme - MNC Category during recent periods are Kotak Mahindra Bank Ltd, Hitachi Home & Life Solutions (India), Capital First Ltd, ACC Ltd, etc.
There are 2 funds - Birla Sun Life MNC and UTI-MNC Fund coming under this category.
vi. Equity Theme – Infrastructure:
a) Top 5 highest exposures by infrastructure funds (as on June 2015) are Larsen & Toubro Ltd, ICICI Bank Ltd, State Bank of India, Cummins India Ltd and Axis Bank Ltd.
b) Highest increase in the holding in stocks such as National Buildings Construction Corporation, Hindustan Construction Company Ltd, LIC Housing Finance Ltd, etc.
c) Increase in the preference by maximum Infrastructure funds in stocks such as Ashoka Buildcon Ltd, Techno Electric & Engineering Company Ltd, ITD Cementation India Ltd, Sadbhav
Engineering Ltd, etc.
d) Oil & Natural Gas Corpn Ltd, Vedanta Ltd, Power Finance Corporation Ltd are some of unfavoured stocks as most of the funds exited from these stocks.
e) Inox Wind Ltd, Sanghvi Movers Ltd, PNC Infratech Ltd are some of Newly added stocks by the Equity Theme - Infrastructure Category during recent periods.
There are 24 funds coming under this category.
vii. Equity Diversified – Small-cap:
a) Top 5 highest exposures by Equity Diversified Small-cap funds (as on June 2015) are DCB Bank Ltd, Indoco Remedies Ltd, SRF Ltd, Kalpataru Power Transmission and Navin Fluorine
International.
b) Stocks that witnessed highest rise in the market value (Rs Crs) in the last one year period held by Small-cap Category are Radico Khaitan Ltd, WPIL Ltd, Relaxo Footwears Ltd, Chambal
Ferti & Chemicals Ltd, etc.
c) Some of stocks whose market capitalization rose more than 100% in last one year period that have been held by the Small cap category are Hitachi Home & Life Solutions, Mahindra CIE
Automotive Ltd, Eveready Industries India Ltd, Ramkrishna Forgings Ltd, CCL Products (India) Ltd, etc.
d) Stocks that witnessed increase by the number of schemes held during the last one year period by the schemes in the Equity Small-cap funds Category are HSIL Ltd, SRF Ltd, Ador
Welding Ltd, etc.
e) Century Plyboards (India) Ltd, Suzlon Energy Ltd, ALSTOM India Ltd are some of newly added stocks by the Equity Small-cap funds Category during recent periods.
There are 17 funds including open ended and close ended funds coming under this category. Open ended funds include DSP BR Micro-Cap, Reliance Small Cap and SBI Small & Midcap funds.

RETAIL RESEARCH
1. Equity Sector – Banking: Stocks having more exposure by Banking sector Category as on June 2015:
Company Name
Data as on June 2015 Mkt Val (Rs Crs) during previous
quarters Data as on June 2014
Change in last one year period
(between June 2015 and June 2014)
Mkt Val
(Rs Crs)
No of
Shares
% of
Holding
by the
category
Held By
no of
Schemes
Mar-15 Dec-14 Sep-14 Mkt Val
(Rs Crs)
No of
Shares
% of
Holding
Held By
no of
Schemes
% of
Change in
Mkt
Value
Change in
% of
Holding
by the
category
Change
in held
By no of
Schemes
HDFC Bank Ltd 1025.67 9611161 22.86 11 987.41 767.42 690.40 577.72 7032082 18.48 9 78 4.38 2
ICICI Bank Ltd 606.19 19681414 13.51 11 627.89 591.95 478.69 547.26 3858991 17.51 9 11 -4 2
Axis Bank Ltd 486.16 8697954 10.84 11 456.14 188.16 112.31 94.00 489860 3.01 8 417 7.83 3
Yes Bank Ltd 214.43 2541336 4.78 9 224.71 189.34 145.41 146.75 2712230 4.69 6 46 0.09 3
State Bank of India 184.88 7036028 4.12 10 239.89 281.04 148.76 221.57 824838 7.09 9 -17 -2.97 1
Federal Bank Ltd 180.32 12200229 4.02 8 160.98 159.45 124.27 127.50 9536309 4.08 8 41 -0.06 0
IndusInd Bank Ltd 174.90 2004329 3.90 8 124.34 78.36 61.69 43.67 763923 1.40 7 300 2.5 1
IDFC Ltd 114.41 7746151 2.55 8 114.68 125.57 103.93 34.73 2570675 1.11 3 229 1.44 5
Bank of Baroda 97.96 6795796 2.18 9 30.24 18.63 17.77 25.68 293017 0.82 7 281 1.36 2
Max India Ltd 96.62 1999407 2.15 6 91.03 92.54 73.38 62.78 2177842 2.01 3 54 0.14 3
Indiabulls Housing Finance Ltd 90.41 1452552 2.02 1 90.91 124.56 109.08 106.75 2808730 3.41 1 -15 -1.39 0
Stocks that witnessed highest rise in the market value (Rs Crs) in the last one year period that held by Equity Sector - Banking Category:
Company Name
Data as on June 2015 Mkt Val (Rs Crs) During previous
quarters Data as on June 2014
Change in last one year period
(between June 2015 and June 2014)
Mkt Val
(Rs Crs)
No of
Shares
% of
Holding
by the
category
Held By
no of
Schemes
Mar-15 Dec-14 Sep-14 Mkt Val
(Rs Crs)
No of
Shares
% of
Holding
Held By
no of
Schemes
% of
Change
in Mkt
Value
Change in %
of Holding
by the
category
Change
in held
By no of
Schemes
Shriram Transport Finance Company Ltd 23.50 275544 0.52 6 17.97 15.73 3.27 0.76 8360 0.02 2 3006 0.5 4
Allahabad Bank 4.77 550000 0.11 1 5.51 6.64 0.32 22215 0.01 2 1380 0.1 -1
Axis Bank Ltd 486.16 8697954 10.84 11 456.14 188.16 112.31 94.00 489860 3.01 8 417 7.83 3
IndusInd Bank Ltd 174.90 2004329 3.90 8 124.34 78.36 61.69 43.67 763923 1.40 7 300 2.5 1
Bank of Baroda 97.96 6795796 2.18 9 30.24 18.63 17.77 25.68 293017 0.82 7 281 1.36 2
IDFC Ltd 114.41 7746151 2.55 8 114.68 125.57 103.93 34.73 2570675 1.11 3 229 1.44 5
IIFL Holdings Ltd 3.59 208477 0.08 1 3.73 1.27 100000 0.04 1 183 0.04 0
DCB Bank Ltd 40.80 3130947 0.91 5 32.08 25.94 13.83 14.42 1740000 0.46 3 183 0.45 2
Kotak Mahindra Bank Ltd 49.80 359131 1.11 7 27.28 18.57 22.11 17.69 200184 0.57 6 182 0.54 1
Reliance Capital Ltd 86.23 2377881 1.92 2 83.12 76.54 39.93 31.31 476881 1.00 2 175 0.92 0

RETAIL RESEARCH
Newly added stocks by the Equity Banking Category during recent periods:
Company Name
Data as on June 2015 Mkt Val (Rs Crs) During previous quarters Data as on June 2014 Change in last one year period (between
June 2015 and June 2014)
Mkt Val
(Rs Crs)
No of
Shares
% of
Holding by
the
category
Held By no
of Schemes Mar-15 Dec-14 Sep-14
Mkt Val
(Rs Crs)
No of
Shares
% of
Holdin
g
Held By
no of
Schemes
% of
Change in
Mkt Value
Change in %
of Holding by
the category
Change
in held
By no of
Schemes
Dewan Housing Finance Corporation Ltd 15.48 367680 0.35 1 12.52 - - - - - - - - -
Capital First Ltd 12.96 340500 0.29 1 11.26 - - - - - - - - -
Shriram City Union Finance Ltd 4.35 25000 0.10 1 4.92 - - - - - - - - -
Multi Commodity Exchange of India Ltd 2.69 25810 0.06 2 - - - - - - - - - -
L&T Finance Holdings Ltd 1.98 300000 0.04 1 - - - - - - - - - -
CRISIL Ltd 1.70 8768 0.04 1 - - - - - - - - - -
Highest increase in the overall % of holding by the Equity Banking Category over the last one year:
Company Name
Data as on June 2015 % of Holding During previous
quarters Data as on June 2014
Change in last one year period (between
June 2015 and June 2014)
Mkt Val (Rs Crs) No of
Shares
% of Holding
by the
category
Held By
no of
Schemes
Mar-15 Dec-14 Sep-14 Mkt Val
(Rs Crs)
No of
Shares
% of
Holding
Held By
no of
Schemes
% of
Change
in Mkt
Value
Change in %
of Holding by
the category
Change in
held By no of
Schemes
Axis Bank Ltd 486.16 8697954 10.84 11 10.50 4.81 3.56 94.00 489860 3.01 8 417 7.83 3
HDFC Bank Ltd 1025.67 9611161 22.86 11 22.74 19.64 21.90 577.72 7032082 18.48 9 78 4.38 2
IndusInd Bank Ltd 174.90 2004329 3.90 8 2.86 2.01 1.96 43.67 763923 1.40 7 300 2.50 1
IDFC Ltd 114.41 7746151 2.55 8 2.64 3.21 3.30 34.73 2570675 1.11 3 229 1.44 5
Bank of Baroda 97.96 6795796 2.18 9 0.70 0.48 0.56 25.68 293017 0.82 7 281 1.36 2
Reliance Capital Ltd 86.23 2377881 1.92 2 1.91 1.96 1.27 31.31 476881 1.00 2 175 0.92 0
Repco Home Finance Ltd 80.74 1253648 1.80 4 1.87 1.93 1.27 29.50 641717 0.94 2 174 0.86 2
Kotak Mahindra Bank Ltd 49.80 359131 1.11 7 0.63 0.48 0.70 17.69 200184 0.57 6 182 0.54 1

RETAIL RESEARCH
2. Equity Sector – FMCG:
Stocks having more exposure by the schemes from the Equity Sector - FMCG Category as on June 2015:
Company Name
Data as on June 2015 Mkt Val (Rs Crs) during previous
quarters Data as on June 2014
Change in last one year period (between
June 2015 and June 2014)
Mkt Val
(Rs Crs)
No of
Shares
% of
Holding
by the
category
Held By
no of
Schemes
Mar-15 Dec-14 Sep-14 Mkt Val
(Rs Crs)
No of
Shares
% of
Holding
Held By
no of
Schemes
% of Change
in Mkt Value
Change in %
of Holding
Change
in held
By no of
Schemes
ITC Ltd 182.83 5802394 39.77 2 190.27 188.07 192.36 180.33 5548965 46.85 2 1.39 -7.08 0
Britannia Industries Ltd 37.12 134329 8.07 2 34.22 36.17 32.46 20.70 205395 5.38 2 79.32 2.69 0
Procter & Gamble Hygiene and Health Care Ltd 28.22 41590 6.14 2 17.49 16.32 15.21 12.41 29137 3.22 1 127.41 2.92 1
United Breweries Ltd 19.10 204612 4.15 2 14.09 10.50 - - - - - - 4.15 2
Colgate-Palmolive (India) Ltd 17.80 87336 3.87 2 22.91 22.77 29.48 16.23 107333 4.22 1 9.67 -0.35 1
United Spirits Ltd 16.71 49480 3.64 2 18.10 16.75 27.25 25.25 105395 6.56 2 -33.81 -2.92 0
Manpasand Beverages Ltd 13.37 417960 2.91 2 - - - - - - - - 2.91 2
V I P Industries Ltd 13.02 1372432 2.83 2 12.79 13.92 13.35 7.66 708161 1.99 2 70.09 0.84 0
Kansai Nerolac Paints Ltd 12.56 585760 2.73 1 12.66 13.61 11.04 11.87 82893 3.08 1 5.79 -0.35 0
Asian Paints Ltd 12.42 164485 2.70 2 - - - - - - - - 2.70 2
Stocks that witnessed highest rise in the market value (Rs Crs) in the last one year period that held by Equity Sector - FMCG Category:
Company Name
Data as on June 2015 Mkt Val (Rs Crs) during previous
quarters Data as on June 2014
Change in last one year period (between
June 2015 and June 2014)
Mkt Val
(Rs Crs)
No of
Shares
% of
Holding
by the
category
Held By
no of
Schemes
Mar-15 Dec-14 Sep-14 Mkt Val
(Rs Crs)
No of
Shares
% of
Holding
Held By
no of
Schemes
% of Change
in Mkt Value
Change in %
of Holding
Change
in held
By no of
Schemes
Thangamayil Jewellery Ltd 2.90 161000 0.63 1 3.14 3.83 0.29 0.31 16000 0.08 1 841.99 0.55 0
Eveready Industries India Ltd 10.19 311269 2.22 1 14.28 11.68 6.71 4.39 650000 1.14 1 132.27 1.08 0
Procter & Gamble Hygiene and Health Care Ltd 28.22 41590 6.14 2 17.49 16.32 15.21 12.41 29137 3.22 1 127.41 2.92 1
Jyothy Laboratories Ltd 11.38 389793 2.48 2 7.03 6.83 6.47 6.21 361020 1.61 2 83.17 0.87 0
Britannia Industries Ltd 37.12 134329 8.07 2 34.22 36.17 32.46 20.70 205395 5.38 2 79.32 2.69 0
V I P Industries Ltd 13.02 1372432 2.83 2 12.79 13.92 13.35 7.66 708161 1.99 2 70.09 0.84 0
Zydus Wellness Ltd 3.56 39715 0.77 1 4.04 3.24 2.55 2.33 39715 0.61 1 52.80 0.16 0
Bata India Ltd 9.11 86083 1.98 1 7.70 9.22 6.52 6.31 49208 1.64 1 44.27 0.34 0
Jubilant Foodworks Ltd 6.64 35773 1.44 2 7.78 7.25 5.47 5.44 41629 1.41 1 21.99 0.03 1
Colgate-Palmolive (India) Ltd 17.80 87336 3.87 2 22.91 22.77 29.48 16.23 107333 4.22 1 9.67 -0.35 1

RETAIL RESEARCH
Newly added stocks by the Equity FMCG Category during recent periods:
Company Name
Data as on June 2015 Mkt Val (Rs Crs) during previous
quarters Data as on June 2014
Change in last one year period (between
June 2015 and June 2014)
Mkt Val
(Rs Crs)
No of
Shares
% of
Holding
by the
category
Held By
no of
Schemes
Mar-15 Dec-14 Sep-14 Mkt Val
(Rs Crs)
No of
Shares
% of
Holding
Held By
no of
Schemes
% of Change
in Mkt Value
Change in %
of Holding
Change
in held
By no of
Schemes
United Breweries Ltd 19.10 204612 4.15 2 14.09 10.50 - - - - - - - -
Manpasand Beverages Ltd 13.37 417960 2.91 2 - - - - - - - - - -
Asian Paints Ltd 12.42 164485 2.70 2 - - - - - - - - - -
Titan Company Ltd 8.20 223847 1.78 1 7.00 - - - - - - - - -
Indian Terrain Fashions Ltd 5.66 91000 1.23 1 5.43 - - - - - - - - -
Havells India Ltd 4.33 153199 0.94 1 4.68 4.72 - - - - - - - -
Page Industries Ltd 4.04 2674 0.88 1 3.67 3.14 2.13 - - - - - - -
Nestle India Ltd 2.38 3743 0.52 1 10.30 9.47 - - - - - - - -
Radico Khaitan Ltd 2.04 250000 0.44 1 2.23 2.17 - - - - - - - -
La Opala RG Ltd 0.80 23615 0.17 1 0.89 1.07 0.80 - - - - - - -
Stocks exited totally by the Equity FMCG Category during recent periods:
Company Name
Data as on June 2015 Mkt Val (Rs Crs) during previous
quarters Data as on June 2014
Change in last one year period (between
June 2015 and June 2014)
Mkt Val
(Rs Crs)
No of
Shares
% of
Holding
by the
category
Held By
no of
Schemes
Mar-15 Dec-14 Sep-14 Mkt Val
(Rs Crs)
No of
Shares
% of
Holding
Held By
no of
Schemes
% of Change
in Mkt Value
Change in %
of Holding
Change
in held
By no of
Schemes
Globus Spirits Ltd - - - - 0.02 0.03 - - - - - - - -
Mcleod Russel India Ltd - - - - 1.06 1.05 1.00 - - - - - - -
Navneet Education Ltd - - - - - - 2.51 - - - - - - -
V-Guard Industries Ltd - - - - - - - - - - - - - -
Dabur India Ltd - - - - - - - 1.96 104547 0.51 1 - - -
Emami Ltd - - - - - - 1.31 8.71 171628 2.26 1 - - -
Hawkins Cooker Ltd - - - - - - - 2.97 10461 0.77 1 - - -
Marico Kaya Enterprises Ltd - - - - - - - 0.12 10000 0.03 1 - - -
VST Industries Ltd - - - - 4.37 10.87 17.31 19.91 110665 5.17 2 - - -
RETAIL RESEARCH
3. Equity Sector – Technology:
Stocks having highest exposure by the schemes from the Equity Sector - Technology Category as on June 2015:
Company Name
Data as on June 2015 Mkt Val (Rs Crs) during previous
quarters Data as on June 2014
Change in last one year period
(between June 2015 and June 2014)
Mkt Val
(Rs Crs)
No of
Shares
% of
Holding
by the
category
Held By
no of
Schemes
Mar-15 Dec-14 Sep-14 Mkt Val
(Rs Crs)
No of
Shares
% of
Holding
Held By
no of
Schemes
% of
Change in
Mkt
Value
Change in
% of
Holding
Change in
held By
no of
Schemes
Infosys Ltd 233.91 2375946 31.66 5 252.22 222.11 204.78 172.84 531539 30.41 5 35.33 1.25 0
Tata Consultancy Services Ltd 145.48 570262 19.69 5 72.84 85.79 105.91 102.87 424863 18.10 4 41.43 1.59 1
HCL Technologies Ltd 66.63 724337 9.02 5 32.03 26.76 28.99 24.22 161606 4.26 4 175.15 4.76 1
Wipro Ltd 51.91 949711 7.03 4 49.38 50.59 52.07 46.97 860552 8.26 4 10.52 -1.23 0
Cyient Ltd 41.93 725265 5.67 4 37.53 39.13 34.99 25.40 720265 4.47 3 65.09 1.20 1
Tech Mahindra Ltd 29.77 623142 4.03 4 52.67 55.33 51.49 47.83 222246 8.42 5 -37.75 -4.39 -1
Persistent Systems Ltd 27.20 453121 3.68 3 32.76 39.01 31.25 24.18 223682 4.26 2 12.47 -0.58 1
Oracle Financial Services Software Ltd 26.78 70854 3.63 4 23.28 24.85 26.62 21.84 69749 3.84 3 22.61 -0.21 1
Mindtree Ltd 18.99 149144 2.57 4 27.44 23.74 21.89 31.34 355793 5.51 5 -39.40 -2.94 -1
eClerx Services Ltd 12.21 82053 1.65 3 12.10 10.54 7.66 6.38 54895 1.12 2 91.48 0.53 1
Stocks that witnessed highest rise in the market value (Rs Crs) in the last one year period that held by Equity Sector - Technology Category:
Company Name
Data as on June 2015 Mkt Val (Rs Crs) during previous
quarters Data as on June 2014
Change in last one year period
(between June 2015 and June 2014)
Mkt Val
(Rs Crs)
No of
Shares
% of
Holding
by the
category
Held By
no of
Schemes
Mar-15 Dec-14 Sep-14 Mkt Val
(Rs Crs)
No of
Shares
% of
Holding
Held By
no of
Schemes
% of
Change in
Mkt
Value
Change in
% of
Holding
Change in
held By
no of
Schemes
Just Dial Ltd 7.00 55182 0.95 3 3.61 - - 1.10 7500 0.19 1 538.08 0.76 2
Mastek Ltd 1.67 81251 0.23 1 6.71 6.81 5.02 0.27 15000 0.05 1 509.74 0.18 0
Sasken Communication Technologies 11.84 504936 1.60 2 11.00 10.14 11.73 2.66 119936 0.47 1 345.91 1.13 1
HCL Technologies Ltd 66.63 724337 9.02 5 32.03 26.76 28.99 24.22 161606 4.26 4 175.15 4.76 1
KPIT Technologies Ltd 4.67 501371 0.63 2 6.78 6.05 2.05 2.22 128676 0.39 1 110.63 0.24 1
eClerx Services Ltd 12.21 82053 1.65 3 12.10 10.54 7.66 6.38 54895 1.12 2 91.48 0.53 1
Cyient Ltd 41.93 725265 5.67 4 37.53 39.13 34.99 25.40 720265 4.47 3 65.09 1.20 1
Tata Consultancy Services Ltd 145.48 570262 19.69 5 72.84 85.79 105.91 102.87 424863 18.10 4 41.43 1.59 1
Infosys Ltd 233.91 2375946 31.66 5 252.22 222.11 204.78 172.84 531539 30.41 5 35.33 1.25 0
Info Edge (India) Ltd 2.66 31111 0.36 2 2.61 2.72 2.72 2.09 30900 0.37 2 26.99 -0.01 0

RETAIL RESEARCH
Stocks that witnessed increase by the number of schemes held during the last one year period by the schemes in the Equity Sector - Technology Category:
Company Name
Data as on June 2015 Mkt Val (Rs Crs) during previous
quarters Data as on June 2014
Change in last one year period
(between June 2015 and June 2014)
Mkt Val
(Rs Crs)
No of
Shares
% of
Holding
by the
category
Held By
no of
Schemes
Mar-15 Dec-14 Sep-14 Mkt Val
(Rs Crs)
No of
Shares
% of
Holding
Held By
no of
Schemes
% of
Change in
Mkt
Value
Change in
% of
Holding
Change in
held By
no of
Schemes
Just Dial Ltd 7.00 55182 0.95 3 3.61 - - 1.10 7500 0.19 1 538.08 0.76 2
Tata Consultancy Services Ltd 145.48 570262 19.69 5 72.84 85.79 105.91 102.87 424863 18.10 4 41.43 1.59 1
HCL Technologies Ltd 66.63 724337 9.02 5 32.03 26.76 28.99 24.22 161606 4.26 4 175.15 4.76 1
Cyient Ltd 41.93 725265 5.67 4 37.53 39.13 34.99 25.40 720265 4.47 3 65.09 1.20 1
Persistent Systems Ltd 27.20 453121 3.68 3 32.76 39.01 31.25 24.18 223682 4.26 2 12.47 -0.58 1
Oracle Financial Services Software Ltd 26.78 70854 3.63 4 23.28 24.85 26.62 21.84 69749 3.84 3 22.61 -0.21 1
eClerx Services Ltd 12.21 82053 1.65 3 12.10 10.54 7.66 6.38 54895 1.12 2 91.48 0.53 1
Sasken Communication Technologies 11.84 504936 1.60 2 11.00 10.14 11.73 2.66 119936 0.47 1 345.91 1.13 1
KPIT Technologies Ltd 4.67 501371 0.63 2 6.78 6.05 2.05 2.22 128676 0.39 1 110.63 0.24 1
Newly added stocks by the Equity Technology Category during recent periods:
Company Name
Data as on June 2015 Mkt Val (Rs Crs) during previous
quarters Data as on June 2014
Change in last one year period
(between June 2015 and June 2014)
Mkt Val
(Rs Crs)
No of
Shares
% of
Holding
by the
category
Held By
no of
Schemes
Mar-15 Dec-14 Sep-14 Mkt Val
(Rs Crs)
No of
Shares
% of
Holding
Held By
no of
Schemes
% of
Change in
Mkt
Value
Change in
% of
Holding
Change in
held By
no of
Schemes
Hexaware Technologies Ltd 5.35 209300 0.72 2 - - - - - - - - - -
Accelya Kale Solutions Ltd 4.52 45280 0.61 2 5.43 5.37 3.23 - - - - - - -
Majesco Ltd 4.53 157278 0.61 1 - - - - - - - - - -
Tata Communications Ltd 3.92 88500 0.53 1 3.46 1.06 - - - - - - - -
Zensar Technologies Ltd 2.59 39410 0.35 1 2.53 - - - - - - - - -
Redington India Ltd 2.35 243304 0.32 1 3.19 3.34 - - - - - - -
D-Link India Ltd 2.21 113443 0.30 1 2.19 3.30 4.47 - - - - - - -
Shemaroo Entertainment Ltd 1.23 50000 0.17 1 0.92 1.14 1.18 - - - - - - -
Sonata Software Ltd 1.16 90000 0.16 1 1.61 1.14 0.32 - - - - - - -
Zee Entertainment Enterprises Ltd 1.10 30000 0.15 1 1.25 - 0.19 - - - - - - -
PVR Ltd 0.53 8300 0.07 1 0.55 - - - - - - - - -
City Online Services Ltd 0.16 200000 0.02 1 0.28 0.17 - - - - - - - -

RETAIL RESEARCH
Highest increase in the overall % of holding by the Equity Technology Category over the last one year:
Company Name
Data as on June 2015 % of Holding during previous
quarters Data as on June 2014
Change in last one year period
(between June 2015 and June 2014)
Mkt Val
(Rs Crs)
No of
Shares
% of
Holding
by the
category
Held By
no of
Schemes
Mar-15 Dec-14 Sep-14 Mkt Val
(Rs Crs)
No of
Shares
% of
Holding
Held By
no of
Schemes
% of
Change in
Mkt
Value
Change in
% of
Holding
Change in
held By
no of
Schemes
HCL Technologies Ltd 66.63 724337 9.02 5 4.78 4.04 4.47 24.22 161606 4.26 4 175.15 4.76 1
Tata Consultancy Services Ltd 145.48 570262 19.69 5 10.86 12.94 16.33 102.87 424863 18.10 4 41.43 1.59 1
Infosys Ltd 233.91 2375946 31.66 5 37.61 33.51 31.57 172.84 531539 30.41 5 35.33 1.25 0
Cyient Ltd 41.93 725265 5.67 4 5.60 5.90 5.39 25.40 720265 4.47 3 65.09 1.20 1
Sasken Communication Technologies 11.84 504936 1.60 2 1.64 1.53 1.81 2.66 119936 0.47 1 345.91 1.13 1
Just Dial Ltd 7.00 55182 0.95 3 0.54 - - 1.10 7500 0.19 1 538.08 0.76 2
eClerx Services Ltd 12.21 82053 1.65 3 1.80 1.59 1.18 6.38 54895 1.12 2 91.48 0.53 1
4. Equity Sector – Pharmaceuticals:
Stocks that are having more exposure by the schemes from the Equity Sector - Pharmaceuticals Category as on June 2015:
Company Name
Data as on June 2015 Mkt Val (Rs Crs) during previous
quarters Data as on June 2014
Change in last one year period
(between June 2015 and June
2014)
Mkt Val
(Rs Crs)
No of
Shares
% of
Holding
by the
category
Held By
no of
Schemes
Mar-15 Dec-14 Sep-14 Mkt Val
(Rs Crs)
No of
Shares
% of
Holding
Held By
no of
Schemes
% of
Change
in Mkt
Value
Change
in % of
Holding
Change
in held
By no of
Schemes
Sun Pharmaceuticals Industries Ltd 368.76 4217098 18.32 3 293.02 234.40 231.16 162.33 2361679 13.30 3 127.16 5.02 -1
Lupin Ltd 201.81 1069903 10.02 3 240.46 172.40 161.51 128.13 1222394 10.50 3 57.51 -0.48 -1
Divis Laboratories Ltd 173.13 921367 8.60 3 153.56 142.53 148.96 116.37 797468 9.54 3 48.77 -0.94 -1
Cadila Healthcare Ltd 161.01 896141 8.00 3 176.00 153.54 129.67 106.81 997672 8.75 3 50.75 -0.75 -1
Abbott India Ltd 150.89 387434 7.49 1 153.70 152.06 134.76 92.28 424845 7.56 1 63.52 -0.07 -1
Dr Reddys Laboratories Ltd 146.75 412274 7.29 2 127.87 150.22 135.53 113.21 431638 9.28 3 29.62 -1.99 -2
Cipla Ltd 119.11 1935338 5.92 3 115.05 112.84 122.32 79.34 1811483 6.50 2 50.12 -0.58 0
Sanofi India Ltd 112.84 320200 5.60 2 92.90 98.59 94.85 92.56 293703 7.58 2 21.91 -1.98 -1
Ipca Laboratories Ltd 107.92 1520729 5.36 2 80.04 93.25 82.74 43.20 492473 3.54 3 149.84 1.82 -2
Aurobindo Pharma Ltd 73.30 505419 3.64 2 53.36 43.60 30.34 19.55 263663 1.60 2 274.95 2.04 -1

RETAIL RESEARCH
Stocks that witnessed highest rise in the market value (Rs Crs) in the last one year period that held by Equity Sector - Pharmaceuticals Category:
Company Name
Data as on June 2015 Mkt Val (Rs Crs) during previous
quarters Data as on June 2014
Change in last one year period
(between June 2015 and June
2014)
Mkt Val
(Rs Crs)
No of
Shares
% of
Holding
by the
category
Held By
no of
Schemes
Mar-15 Dec-14 Sep-14 Mkt Val
(Rs Crs)
No of
Shares
% of
Holding
Held By
no of
Schemes
% of
Change
in Mkt
Value
Change
in % of
Holding
Change
in held
By no of
Schemes
Pfizer Ltd 5.85 29006 0.29 1 7.17 6.67 0.36 0.30 2146 0.02 1 1821.23 0.27 -1
Glenmark Pharmaceuticals Ltd 44.08 443613 2.19 2 17.57 5.46 5.11 4.04 70841 0.33 1 991.47 1.86 0
Torrent Pharmaceuticals Ltd 34.32 264235 1.70 2 26.03 21.35 13.35 7.36 103711 0.60 2 366.21 1.10 -1
Strides Arcolab Ltd 45.94 413503 2.28 2 35.78 26.17 16.64 11.43 182619 0.94 2 301.98 1.34 -1
Natco Pharma Ltd 36.97 162143 1.84 2 29.75 12.31 12.47 9.63 95407 0.79 2 283.99 1.05 -1
Aurobindo Pharma Ltd 73.30 505419 3.64 2 53.36 43.60 30.34 19.55 263663 1.60 2 274.95 2.04 -1
Ipca Laboratories Ltd 107.92 1520729 5.36 2 80.04 93.25 82.74 43.20 492473 3.54 3 149.84 1.82 -2
Dishman Pharmaceuticals and Chemicals Ltd 1.93 122511 0.10 1 2.04 1.55 1.06 0.80 58000 0.07 1 142.42 0.03 -1
Sun Pharmaceuticals Industries Ltd 368.76 4217098 18.32 3 293.02 234.40 231.16 162.33 2361679 13.30 3 127.16 5.02 -1
FDC Ltd 40.92 2734958 2.03 1 45.74 48.06 32.17 21.03 1573931 1.72 1 94.58 0.31 -1
Stocks that witnessed fall in the number of schemes held during the last one year period by the schemes in the Equity Sector - Pharmaceuticals Category:
Company Name
Data as on June 2015 Mkt Val (Rs Crs) during previous
quarters Data as on June 2014
Change in last one year period
(between June 2015 and June 2014)
Mkt Val
(Rs Crs)
No of
Shares
% of
Holding
by the
category
Held By
no of
Schemes
Mar-15 Dec-14 Sep-14 Mkt Val
(Rs Crs)
No of
Shares
% of
Holding
Held By
no of
Schemes
% of
Change in
Mkt
Value
Change in
% of
Holding
Change
in held
By no of
Schemes
Dr Reddys Laboratories Ltd 146.75 412274 7.29 2 127.87 150.22 135.53 113.21 431638 9.28 3 29.62 -1.99 -1
Ipca Laboratories Ltd 107.92 1520729 5.36 2 80.04 93.25 82.74 43.20 492473 3.54 3 149.84 1.82 -1
Alembic Pharmaceuticals Ltd 19.88 300000 0.99 1 12.24 19.60 15.15 17.81 668739 1.46 2 11.62 -0.47 -1
Sun Pharma Advanced Research Company 7.53 191479 0.37 1 7.84 10.12 13.02 22.66 1391243 1.86 2 -66.78 -1.49 -1
Ajanta Pharma Ltd - - - - - 8.15 6.90 8.19 50000 0.67 1 -100.00 -0.67 -1
Fulford (India) Ltd - - - - 6.06 7.51 11.44 9.08 60810 0.74 1 -100.00 -0.74 -1

RETAIL RESEARCH
Newly added stocks by the Equity Pharmaceuticals Category during recent periods:
Company Name
Data as on June 2015 Mkt Val (Rs Crs) during previous
quarters Data as on June 2014
Change in last one year period
(between June 2015 and June 2014)
Mkt Val
(Rs Crs)
No of
Shares
% of
Holding
by the
category
Held By
no of
Schemes
Mar-15 Dec-14 Sep-14 Mkt Val
(Rs Crs)
No of
Shares
% of
Holding
Held By
no of
Schemes
% of
Change in
Mkt
Value
Change in
% of
Holding
Change
in held
By no of
Schemes
Sequent Scientific Ltd 27.01 380000 1.34 1 10.23 9.90 9.62 - - - - - - -
Shilpa Medicare Ltd 0.64 7392 0.03 1 0.73 0.51 0.40 - - - - - - -
Stocks exited totally by the Equity Pharmaceuticals Category during recent periods:
Company Name
Data as on June 2015 Mkt Val (Rs Crs) during previous
quarters Data as on June 2014
Change in last one year period
(between June 2015 and June 2014)
Mkt Val
(Rs Crs)
No of
Shares
% of
Holding
by the
category
Held By
no of
Schemes
Mar-15 Dec-14 Sep-14 Mkt Val
(Rs Crs)
No of
Shares
% of
Holding
Held By
no of
Schemes
% of
Change in
Mkt
Value
Change in
% of
Holding
Change
in held
By no of
Schemes
Ajanta Pharma Ltd - - - - - 8.15 6.90 8.19 50000 0.67 1 -100.00 -0.67 -2
Fulford (India) Ltd - - - - 6.06 7.51 11.44 9.08 60810 0.74 1 -100.00 -0.74 -2
Highest increase in the overall % of holding by the Equity Pharmaceuticals Category over the last one year:
Company Name
Data as on June 2015 % of Holding during previous
quarters Data as on June 2014
Change in last one year period
(between June 2015 and June 2014)
Mkt Val
(Rs Crs)
No of
Shares
% of
Holding
by the
category
Held By
no of
Schemes
Mar-15 Dec-14 Sep-14 Mkt Val
(Rs Crs)
No of
Shares
% of
Holding
Held By
no of
Schemes
% of
Change in
Mkt
Value
Change in
% of
Holding
Change
in held
By no of
Schemes
Sun Pharmaceuticals Industries Ltd 368.76 4217098 18.32 3 15.09 13.50 14.60 162.33 2361679 13.30 3 127.16 5.02 -1
Aurobindo Pharma Ltd 73.30 505419 3.64 2 2.75 2.51 1.92 19.55 263663 1.60 2 274.95 2.04 -1
Glenmark Pharmaceuticals Ltd 44.08 443613 2.19 2 0.91 0.31 0.32 4.04 70841 0.33 1 991.47 1.86 0
Ipca Laboratories Ltd 107.92 1520729 5.36 2 4.12 5.37 5.22 43.20 492473 3.54 3 149.84 1.82 -2
Strides Arcolab Ltd 45.94 413503 2.28 2 1.84 1.51 1.05 11.43 182619 0.94 2 301.98 1.34 -1
Torrent Pharmaceuticals Ltd 34.32 264235 1.70 2 1.34 1.23 0.84 7.36 103711 0.60 2 366.21 1.10 -1
Natco Pharma Ltd 36.97 162143 1.84 2 1.53 0.71 0.79 9.63 95407 0.79 2 283.99 1.05 -1
FDC Ltd 40.92 2734958 2.03 1 2.36 2.77 2.03 21.03 1573931 1.72 1 94.58 0.31 -1
Pfizer Ltd 5.85 29006 0.29 1 0.37 0.38 0.02 0.30 2146 0.02 1 1821.23 0.27 -1
Dishman Pharmaceuticals and Chemicals Ltd 1.93 122511 0.10 1 0.11 0.09 0.07 0.80 58000 0.07 1 142.42 0.03 -1
Shasun Pharmaceuticals Ltd 2.67 82002 0.13 1 0.17 0.17 0.12 1.52 103300 0.12 1 75.93 0.01 -1

RETAIL RESEARCH
5. Equity Theme – MNC:
Stocks that having highest exposure by the schemes from the Equity Theme - MNC Category on June 2015:
Company Name
Data as on June 2015 Mkt Val (Rs Crs) during previous
quarters Data as on June 2014
Change in last one year period
(between June 2015 and June 2014)
Mkt Val
(Rs Crs)
No of
Shares
% of
Holding by
the
category
Held By
no of
Schemes
Mar-15 Dec-14 Sep-14 Mkt Val
(Rs Crs)
No of
Shares
% of
Holding
Held By
no of
Schemes
% of
Change in
Mkt Value
Change in
% of
Holding
Change
in held
By no of
Schemes
Maruti Suzuki India Ltd 206.96 514406 6.99 2 120.50 85.73 71.61 57.68 236453 5.84 2 258.82 1.15 0
Bosch Ltd 201.18 92062 6.79 2 140.28 95.83 69.00 61.16 45113 6.19 2 228.94 0.60 0
Hindustan Unilever Ltd 185.05 2018626 6.25 2 88.88 51.42 43.94 35.80 577100 3.62 2 416.89 2.63 0
Bayer CropScience Ltd 169.98 428937 5.74 1 109.93 91.83 66.50 45.60 248701 4.62 1 272.74 1.12 0
Kotak Mahindra Bank Ltd 169.03 1219726 5.71 2 - - - - - - - - - -
ICRA Ltd 161.25 379194 5.45 1 122.82 80.35 54.09 47.73 180892 4.83 1 237.81 0.62 0
Glaxosmithkline Pharma Ltd 148.85 444567 5.03 2 106.42 73.60 35.35 20.93 83663 2.12 2 611.19 2.91 0
Honeywell Automation India Ltd 142.36 191598 4.81 2 133.90 100.43 74.85 64.37 126831 6.52 2 121.16 -1.71 0
Gillette India Ltd 133.21 289900 4.50 2 112.33 55.09 28.85 19.37 91000 1.96 2 587.72 2.54 0
Pfizer Ltd 102.88 509768 3.47 2 88.52 76.34 17.74 14.98 105498 1.52 2 586.88 1.95 0
Stocks that witnessed highest rise in the market value (Rs Crs) in the last one year period that held by Equity Theme - MNC Category:
Company Name
Data as on June 2015 Mkt Val (Rs Crs) during previous
quarters Data as on June 2014
Change in last one year period
(between June 2015 and June 2014)
Mkt Val
(Rs Crs)
No of
Shares
% of
Holding by
the
category
Held By
no of
Schemes
Mar-15 Dec-14 Sep-14 Mkt Val
(Rs Crs)
No of
Shares
% of
Holding
Held By
no of
Schemes
% of
Change in
Mkt Value
Change in
% of
Holding
Change
in held
By no of
Schemes
Whirlpool of India Ltd 6.52 87630 0.22 1 1.77 1.56 1.03 0.78 23317 0.08 1 733.12 0.14 0
ITD Cementation India Ltd 23.36 357006 0.79 2 26.09 18.03 13.50 3.02 90500 0.31 1 673.09 0.48 1
Mahindra CIE Automotive Ltd 29.44 1281328 0.99 1 27.73 11.92 5.22 3.93 244595 0.40 1 648.42 0.59 0
Glaxosmithkline Pharma Ltd 148.85 444567 5.03 2 106.42 73.60 35.35 20.93 83663 2.12 2 611.19 2.91 0
Gillette India Ltd 133.21 289900 4.50 2 112.33 55.09 28.85 19.37 91000 1.96 2 587.72 2.54 0
Pfizer Ltd 102.88 509768 3.47 2 88.52 76.34 17.74 14.98 105498 1.52 2 586.88 1.95 0
United Spirits Ltd 68.68 203118 2.32 1 21.07 16.03 13.84 10.35 43200 1.05 1 563.47 1.27 0
GlaxoSmithkline Consumer Healthcare 28.45 45365 0.96 1 7.60 7.07 6.29 5.03 11160 0.51 1 465.25 0.45 0
Hindustan Unilever Ltd 185.05 2018626 6.25 2 88.88 51.42 43.94 35.80 577100 3.62 2 416.89 2.63 0
Castrol India Ltd 30.51 703500 1.03 2 33.32 14.76 9.14 6.92 213000 0.70 2 341.11 0.33 0
RETAIL RESEARCH
Stocks that witnessed increase by the number of schemes held during the last one year period by the schemes in the Equity Theme - MNC Category:
Company Name
Data as on June 2015 Mkt Val (Rs Crs) during previous
quarters Data as on June 2014
Change in last one year period
(between June 2015 and June 2014)
Mkt Val
(Rs Crs)
No of
Shares
% of
Holding by
the
category
Held By
no of
Schemes
Mar-15 Dec-14 Sep-14 Mkt Val
(Rs Crs)
No of
Shares
% of
Holding
Held By
no of
Schemes
% of
Change in
Mkt Value
Change in
% of
Holding
Change
in held
By no of
Schemes
Bata India Ltd 39.54 373840 1.34 2 28.14 16.85 16.64 14.99 116839 1.52 1 163.87 -0.18 1
Fag Bearings India Ltd 31.28 75944 1.06 2 19.67 16.88 13.30 11.46 45829 1.16 1 173.04 -0.10 1
ITD Cementation India Ltd 23.36 357006 0.79 2 26.09 18.03 13.50 3.02 90500 0.31 1 673.09 0.48 1
SML ISUZU Ltd 17.65 156148 0.60 2 17.96 12.56 11.22 8.90 144887 0.90 1 98.35 -0.30 1
Newly added stocks by the Equity Theme - MNC Category during recent periods:
Company Name
Data as on June 2015 Mkt Val (Rs Crs) during previous
quarters Data as on June 2014
Change in last one year period
(between June 2015 and June 2014)
Mkt Val
(Rs Crs)
No of
Shares
% of
Holding by
the
category
Held By
no of
Schemes
Mar-15 Dec-14 Sep-14 Mkt Val
(Rs Crs)
No of
Shares
% of
Holding
Held By
no of
Schemes
% of
Change in
Mkt
Value
Change in
% of
Holding
Change in
held By
no of
Schemes
Kotak Mahindra Bank Ltd 169.03 1219726 5.71 2 - - - - - - - - - -
Hitachi Home & Life Solutions (India) 74.68 470200 2.52 1 31.24 7.93 - - - - - - - -
Capital First Ltd 47.14 1238704 1.59 1 48.85 - - - - - - - - -
ACC Ltd 21.58 149400 0.73 1 23.35 - - - - - - - - -
Exide Industries Ltd 11.04 744471 0.37 1 13.23 - - - - - - - - -
Sun Pharmaceuticals Industries Ltd 4.41 50400 0.15 1 - - - - - - - - - -
Highest increase in the overall % of holding by the Equity Theme - MNC Category over the last one year:
Company Name
Data as on June 2015 % of Holding during previous
quarters Data as on June 2014
Change in last one year period
(between June 2015 and June 2014)
Mkt Val
(Rs Crs)
No of
Shares
% of
Holding by
the
category
Held By
no of
Schemes
Mar-15 Dec-14 Sep-14 Mkt Val
(Rs Crs)
No of
Shares
% of
Holding
Held By
no of
Schemes
% of
Change in
Mkt Value
Change in
% of
Holding
Change
in held
By no of
Schemes
Glaxosmithkline Pharma Ltd 148.85 444567 5.03 2 4.69 4.63 2.99 20.93 83663 2.12 2 611.19 2.91 0
Hindustan Unilever Ltd 185.05 2018626 6.25 2 3.91 3.23 3.71 35.80 577100 3.62 2 416.89 2.63 0
Gillette India Ltd 133.21 289900 4.50 2 4.95 3.46 2.44 19.37 91000 1.96 2 587.72 2.54 0
Pfizer Ltd 102.88 509768 3.47 2 3.90 4.80 1.50 14.98 105498 1.52 2 586.88 1.95 0
United Spirits Ltd 68.68 203118 2.32 1 0.93 1.01 1.17 10.35 43200 1.05 1 563.47 1.27 0
Maruti Suzuki India Ltd 206.96 514406 6.99 2 5.31 5.39 6.05 57.68 236453 5.84 2 258.82 1.15 0

RETAIL RESEARCH
Bayer CropScience Ltd 169.98 428937 5.74 1 4.84 5.77 5.62 45.60 248701 4.62 1 272.74 1.12 0
Sterling Holiday Resorts (India) Ltd 77.12 2975489 2.60 1 2.70 2.17 2.26 18.61 1384000 1.88 1 314.32 0.72 0
ICRA Ltd 161.25 379194 5.45 1 5.41 5.05 4.57 47.73 180892 4.83 1 237.81 0.62 0
Bosch Ltd 201.18 92062 6.79 2 6.18 6.02 5.83 61.16 45113 6.19 2 228.94 0.60 0
Mahindra CIE Automotive Ltd 29.44 1281328 0.99 1 1.22 0.75 0.44 3.93 244595 0.40 1 648.42 0.59 0
6. Equity Theme – Infrastructure:
Stocks that having highest exposure by the schemes from the Equity Theme - Infrastructure Category on June 2015:
Company Name
Data as on June 2015 Mkt Val (Rs Crs) during previous
quarters Data as on June 2014
Change in last one year period
(between June 2015 and June 2014)
Mkt Val
(Rs Crs)
No of
Shares
% of
Holding
by the
category
Held By
no of
Schemes
Mar-15 Dec-14 Sep-14 Mkt Val
(Rs Crs)
No of
Shares
% of
Holding
Held By
no of
Schemes
% of
Change in
Mkt Value
Change
in % of
Holding
Change
in held
By no of
Schemes
Larsen & Toubro Ltd 912.80 5120065 7.37 23 863.96 706.00 717.87 919.72 5404734 7.60 22 -0.75 -0.23 1
ICICI Bank Ltd 538.71 17490642 4.35 13 564.81 702.34 628.90 681.52 4805585 5.63 14 -20.95 -1.28 -1
State Bank of India 527.54 20077482 4.26 10 517.43 661.25 533.37 525.87 1957637 4.34 10 0.32 -0.08 0
Cummins India Ltd 337.76 3767740 2.73 14 350.65 387.71 312.87 298.12 4604079 2.46 14 13.30 0.27 0
Axis Bank Ltd 314.65 5629676 2.54 10 328.75 286.74 195.55 193.91 1010268 1.60 8 62.26 0.94 2
Crompton Greaves Ltd 272.76 16785177 2.20 10 272.33 326.94 297.84 282.88 14094618 2.34 14 -3.58 -0.14 -4
Sadbhav Engineering Ltd 253.65 8725861 2.05 14 277.62 251.90 221.83 171.32 8736936 1.42 11 48.05 0.63 3
HDFC Bank Ltd 223.60 2095239 1.81 7 206.85 181.07 199.01 149.93 1825093 1.24 7 49.14 0.57 0
Kalpataru Power Transmission Ltd 209.67 8040146 1.69 12 171.50 161.42 105.34 134.70 7226343 1.11 11 55.66 0.58 1
Alstom T&D India Ltd 204.73 3817851 1.65 9 225.02 171.90 107.28 99.48 2871905 0.82 7 105.79 0.83 2
Stocks that witnessed highest rise in the market value (Rs Crs) in the last one year period that held by Equity Theme - Infrastructure Category:
Company Name
Data as on June 2015 Mkt Val (Rs Crs) during previous
quarters Data as on June 2014
Change in last one year period
(between June 2015 and June 2014)
Mkt Val
(Rs Crs)
No of
Shares
% of
Holding
by the
category
Held By
no of
Schemes
Mar-15 Dec-14 Sep-14 Mkt Val
(Rs Crs)
No of
Shares
% of
Holding
Held By
no of
Schemes
% of
Change in
Mkt Value
Change
in % of
Holding
Change
in held
By no of
Schemes
National Buildings Construction Corporation 18.11 200208 0.15 2 17.37 7.07 5.99 0.02 504 0.00 1 103972.41 0.15 1
Hindustan Construction Company Ltd 31.25 12575000 0.25 1 - - - 0.14 30000 0.00 1 22172.92 0.25 0
LIC Housing Finance Ltd 34.22 758855 0.28 1 40.55 0.31 18.51 0.27 8150 0.00 1 12724.89 0.28 0
Elgi Equipments Ltd 17.20 1375000 0.14 1 20.08 20.87 17.18 0.14 11715 0.00 1 11979.56 0.14 0
Genus Paper & Boards Ltd 0.01 23945 0.00 1 0.00 - - 0.00 23945 0.00 1 3750.00 0.00 0

RETAIL RESEARCH
Lakshmi Machine Works Ltd 13.69 37200 0.11 2 14.27 14.25 0.28 0.36 950 0.00 1 3740.95 0.11 1
Havells India Ltd 1.97 69699 0.02 1 1.98 8.04 0.07 0.06 500 0.00 1 3261.77 0.02 0
Ambuja Cements Ltd 15.37 668629 0.12 4 18.87 17.39 26.19 0.49 22100 0.00 2 3053.19 0.12 2
J K Cements Ltd 10.40 156137 0.08 2 11.19 3.60 0.30 0.39 9975 0.00 1 2594.79 0.08 1
ITD Cementation India Ltd 113.39 1737799 0.92 6 128.43 85.80 64.48 4.44 133029 0.04 1 2452.44 0.88 5
Stocks that witnessed increase by the number of schemes held during the last one year period by the schemes in the Equity Theme - Infrastructure Category:
Company Name
Data as on June 2015 Mkt Val (Rs Crs) during previous
quarters Data as on June 2014
Change in last one year period
(between June 2015 and June 2014)
Mkt Val
(Rs Crs)
No of
Shares
% of
Holding
by the
category
Held By
no of
Schemes
Mar-15 Dec-14 Sep-14 Mkt Val
(Rs Crs)
No of
Shares
% of
Holding
Held By
no of
Schemes
% of
Change in
Mkt Value
Change
in % of
Holding
Change
in held
By no of
Schemes
Ashoka Buildcon Ltd 138.73 7835441 1.12 12 110.30 80.74 77.80 83.37 5638841 0.69 5 66.40 0.43 7
Techno Electric & Engineering Company Ltd 73.51 1533534 0.59 8 45.10 27.51 17.56 17.32 622982 0.14 1 324.47 0.45 7
ITD Cementation India Ltd 113.39 1737799 0.92 6 128.43 85.80 64.48 4.44 133029 0.04 1 2452.44 0.88 5
Sadbhav Engineering Ltd 253.65 8725861 2.05 14 277.62 251.90 221.83 171.32 8736936 1.42 11 48.05 0.63 3
UltraTech Cement Ltd 199.88 667785 1.61 13 172.41 165.92 150.44 158.77 612176 1.31 10 25.89 0.30 3
Hindustan Petroleum Corporation Ltd 124.98 1714239 1.01 8 118.35 58.82 55.12 55.87 1342300 0.46 5 123.71 0.55 3
Gateway Distriparks Ltd 70.69 2061849 0.57 7 79.88 73.06 51.38 35.35 1536023 0.29 4 100.00 0.28 3
JK Lakshmi Cement Ltd 50.51 1455138 0.41 6 48.29 53.02 58.10 23.25 1092079 0.19 3 117.25 0.22 3
Ingersoll-Rand (India) Ltd 23.51 242096 0.19 4 23.89 18.11 13.21 2.25 33397 0.02 1 943.56 0.17 3
Stocks that witnessed decrease by the number of schemes held during the last one year period by the schemes in the Equity Theme - Infrastructure Category:
Company Name
Data as on June 2015 Mkt Val (Rs Crs) during previous
quarters Data as on June 2014
Change in last one year period
(between June 2015 and June 2014)
Mkt Val
(Rs Crs)
No of
Shares
% of
Holding
by the
category
Held By
no of
Schemes
Mar-15 Dec-14 Sep-14 Mkt Val
(Rs Crs)
No of
Shares
% of
Holding
Held By
no of
Schemes
% of
Change in
Mkt Value
Change
in % of
Holding
Change
in held
By no of
Schemes
Oil & Natural Gas Corpn Ltd 50.22 1622058 0.41 6 98.90 122.02 225.59 233.37 5494114 1.93 15 -78.48 -1.52 -9
Vedanta Ltd 25.54 1466484 0.21 4 53.03 82.47 131.02 220.59 7545846 1.82 12 -88.42 -1.61 -8
Power Finance Corporation Ltd 18.10 706887 0.15 4 19.35 55.33 27.42 105.29 3429033 0.87 12 -82.81 -0.72 -8
Engineers India Ltd 9.22 405520 0.07 2 9.64 14.51 33.62 65.05 2005162 0.54 10 -85.82 -0.47 -8
Reliance Industries Ltd 155.90 1558793 1.26 8 106.66 159.29 204.94 278.70 2744756 2.30 14 -44.06 -1.04 -6
Idea Cellular Ltd 53.40 3031463 0.43 6 60.45 36.97 55.38 106.91 8071607 0.88 12 -50.05 -0.45 -6
Tata Steel Ltd 22.08 725000 0.18 2 15.84 21.73 34.58 76.89 1455152 0.64 8 -71.28 -0.46 -6
Gujarat Mineral Development Corporation Ltd 18.20 1946858 0.15 3 43.26 73.92 97.89 143.58 8508105 1.19 9 -87.32 -1.04 -6

RETAIL RESEARCH
GAIL (India) Ltd 8.24 210000 0.07 1 8.27 14.28 49.53 57.04 1231855 0.47 7 -85.56 -0.40 -6
Bharat Petroleum Corporation Ltd 183.34 2084914 1.48 10 175.93 170.41 251.13 248.03 4131510 2.05 15 -26.08 -0.57 -5
Tata Power Company Ltd 84.18 11356073 0.68 5 89.48 106.31 91.78 121.24 11246682 1.00 10 -30.57 -0.32 -5
CESC Ltd 66.24 1185544 0.54 5 71.61 97.78 133.48 119.53 1691207 0.99 10 -44.58 -0.45 -5
Reliance Infrastructure Ltd 7.63 196424 0.06 1 5.53 17.50 5.92 39.43 509703 0.33 6 -80.65 -0.27 -5
ING Vysya Bank Ltd - - - - 40.42 46.04 50.21 67.81 1043501 0.56 5 -100.00 -0.56 -5
Crompton Greaves Ltd 272.76 16785177 2.20 10 272.33 326.94 297.84 282.88 14094618 2.34 14 -3.58 -0.14 -4
NTPC Ltd 152.56 11080844 1.23 8 172.31 117.66 120.09 167.12 10706256 1.38 12 -8.72 -0.15 -4
Bank of Baroda 137.83 9561904 1.11 6 181.81 223.82 196.71 230.86 2633887 1.91 10 -40.30 -0.80 -4
Voltas Ltd 117.77 3736291 0.95 8 105.12 90.06 149.93 163.28 7486701 1.35 12 -27.87 -0.40 -4
Oil India Ltd 30.00 671422 0.24 4 30.55 67.16 83.39 98.64 1678555 0.81 8 -69.59 -0.57 -4
Hindustan Zinc Ltd 13.93 833837 0.11 3 13.52 28.23 42.62 42.13 2521730 0.35 7 -66.93 -0.24 -4
Hindalco Industries Ltd 1.44 129000 0.01 1 1.66 2.13 2.57 12.12 738362 0.10 5 -88.09 -0.09 -4
Jindal Steel & Power Ltd 0.77 89690 0.01 2 14.01 19.18 21.33 56.20 1742316 0.46 6 -98.63 -0.45 -4
Jaiprakash Associates Ltd 0.01 12000 0.00 1 0.03 0.03 0.03 28.49 3691837 0.24 5 -99.95 -0.24 -4
Newly added stocks by the Equity Theme - Infrastructure Category during recent periods:
Company Name
Data as on June 2015 Mkt Val (Rs Crs) during previous
quarters Data as on June 2014
Change in last one year period
(between June 2015 and June 2014)
Mkt Val
(Rs Crs)
No of
Shares
% of
Holding
by the
category
Held By
no of
Schemes
Mar-15 Dec-14 Sep-14 Mkt Val
(Rs Crs)
No of
Shares
% of
Holding
Held By
no of
Schemes
% of
Change in
Mkt Value
Change
in % of
Holding
Change
in held
By no of
Schemes
Inox Wind Ltd 59.14 1397525 0.48 5 8.95 - - - - - - - 0.48 5
Sanghvi Movers Ltd 73.54 2267146 0.59 4 5.45 - - - - - - - 0.59 4
PNC Infratech Ltd 61.69 1584139 0.50 4 - - - - - - - - 0.50 4
Centum Electronics Ltd 44.89 630150 0.36 3 46.30 31.86 19.67 - - - - - 0.36 3
Astral Poly Technik Ltd 38.59 994671 0.31 3 45.99 39.18 0.30 - - - - - 0.31 3
TD Power Systems Ltd 36.10 1171000 0.29 3 42.62 47.48 - - - - - - 0.29 3
VRL Logistics Ltd 13.45 439069 0.11 3 - - - - - - - - 0.11 3
Snowman Logistics Ltd 8.09 816289 0.07 3 4.90 14.76 12.53 - - - - - 0.07 3
Brigade Enterprises Ltd 3.79 252400 0.03 3 3.61 - - - - - - - 0.03 3
Mahindra CIE Automotive Ltd 28.73 1250000 0.23 2 39.33 12.07 2.02 - - - - - 0.23 2
Supreme Infrastructure India Ltd 22.00 1266355 0.18 2 24.43 1.45 3.12 - - - - - 0.18 2
MEP Infrastructure Developers Ltd 21.93 3571523 0.18 2 - - - - - - - - 0.18 2
Suzlon Energy Ltd 11.77 5300000 0.10 2 9.03 - - - - - - - 0.10 2
Everest Industries Ltd 10.90 336385 0.09 2 10.76 9.06 0.16 - - - - - 0.09 2
Ahluwalia Contracts (India) Ltd 3.82 177000 0.03 2 1.62 1.46 0.58 - - - - - 0.03 2
PTC India Financial Services Ltd 3.73 834150 0.03 2 4.58 5.71 0.15 - - - - - 0.03 2

RETAIL RESEARCH
Bajaj Electricals Ltd 1.04 38268 0.01 2 0.78 0.55 - - - - - - 0.01 2
Highest increase in the overall % of holding by the Equity Theme - Infrastructure Category over the last one year:
Company Name
Data as on June 2015 Mkt Val (Rs Crs) during previous
quarters Data as on June 2014
Change in last one year period
(between June 2015 and June 2014)
Mkt Val
(Rs Crs)
No of
Shares
% of
Holding
by the
category
Held By
no of
Schemes
Mar-15 Dec-14 Sep-14 Mkt Val
(Rs Crs)
No of
Shares
% of
Holding
Held By
no of
Schemes
% of
Change in
Mkt Value
Change
in % of
Holding
Change
in held
By no of
Schemes
Axis Bank Ltd 314.65 5629676 2.54 10 2.54 2.19 1.63 193.91 1010268 1.60 8 62.26 0.94 2
ITD Cementation India Ltd 113.39 1737799 0.92 6 0.99 0.66 0.54 4.44 133029 0.04 1 2452.44 0.88 5
Alstom T&D India Ltd 204.73 3817851 1.65 9 1.74 1.31 0.89 99.48 2871905 0.82 7 105.79 0.83 2
Sadbhav Engineering Ltd 253.65 8725861 2.05 14 2.14 1.93 1.85 171.32 8736936 1.42 11 48.05 0.63 3
Sanghvi Movers Ltd 73.54 2267146 0.59 4 0.04 - - - - - - - 0.59 4
Kalpataru Power Transmission Ltd 209.67 8040146 1.69 12 1.33 1.23 0.88 134.70 7226343 1.11 11 55.66 0.58 1
HDFC Bank Ltd 223.60 2095239 1.81 7 1.60 1.38 1.66 149.93 1825093 1.24 7 49.14 0.57 0
Hindustan Petroleum Corporation Ltd 124.98 1714239 1.01 8 0.91 0.45 0.46 55.87 1342300 0.46 5 123.71 0.55 3
Siemens Ltd 143.61 1064676 1.16 8 1.23 0.76 0.78 77.50 810768 0.64 11 85.30 0.52 -3
PNC Infratech Ltd 61.69 1584139 0.50 4 - - - - - - - - 0.50 4
J Kumar Infraprojects Ltd 71.76 1018880 0.58 4 0.52 0.37 0.23 10.88 346686 0.09 2 559.72 0.49 2
Inox Wind Ltd 59.14 1397525 0.48 5 0.07 - - - - - - - 0.48 5
Techno Electric & Engineering Company Ltd 73.51 1533534 0.59 8 0.35 0.21 0.15 17.32 622982 0.14 1 324.47 0.45 7
Ashoka Buildcon Ltd 138.73 7835441 1.12 12 0.85 0.62 0.65 83.37 5638841 0.69 5 66.40 0.43 7
NCC Ltd 115.90 14733136 0.94 7 1.28 0.98 0.33 62.38 7778152 0.52 5 85.79 0.42 2
IDFC Ltd 144.80 9803578 1.17 11 1.21 1.59 1.71 91.94 6805256 0.76 9 57.49 0.41 2
7. Equity Diversified Small-cap:
Stocks that having highest exposure by the schemes from the Equity Diversified Small-cap Category on June 2015:
Company Name
Data as on June 2015 Mkt Val (Rs Crs) during
previous quarters Data as on June 2014
Change in last one year period (between
June 2015 and June 2014)
Mkt
Val (Rs
Crs)
No of
Shares
% of
Holding
by the
category
Held By
no of
Schemes
Market
Cap (Rs
Crs)
Mar-
15 Dec-14 Sep-14
Mkt
Val (Rs
Crs)
No of
Shares
% of
Holding
Held By
no of
Schemes
Market
Cap (Rs
Crs)
% of
Change
in Mkt
Value
Change
in % of
Holding
Change
in held
By no of
Schemes
Difference
in Market
Cap (Rs
Crs)
DCB Bank Ltd 128.80 9884620 2.60 9 3684 104.14 119.73 54.92 21.59 2605680 1.08 6 2074 496.61 1.52 3 77.62
Indoco Remedies Ltd 116.99 3238574 2.36 2 3328 117.82 100.93 93.74 43.61 2648635 2.19 2 1513 168.27 0.17 0 120.04
SRF Ltd 112.02 909066 2.26 11 7060 90.37 69.31 48.10 35.73 599360 1.79 5 3402 213.48 0.47 6 107.53

RETAIL RESEARCH
Kalpataru Power Transmission 108.52 4161716 2.19 2 4013 89.44 87.91 26.17 18.10 971069 0.91 1 2863 499.52 1.28 1 40.14
Navin Fluorine International 97.95 1006728 1.98 5 949 63.49 42.96 43.81 28.97 472553 1.45 2 598 238.13 0.53 3 58.73
Atul Ltd 95.90 802236 1.94 3 3552 88.91 97.07 79.24 45.66 512728 2.29 2 2640 110.03 -0.35 1 34.54
Eveready Industries India Ltd 83.56 2552302 1.69 1 2376 69.35 47.82 29.52 15.26 2261091 0.77 1 491 447.50 0.92 0 384.30
Sharda Cropchem Ltd 79.44 2382962 1.61 2 3000 75.33 64.13 50.42 - - - - - - 1.61 2 -
Solar Industries India Ltd 78.75 212230 1.59 2 6702 72.16 42.93 40.53 33.05 160996 1.66 1 3743 138.27 -0.07 1 79.04
Repco Home Finance Ltd 77.89 1209319 1.57 8 4017 70.48 77.33 49.84 11.09 241343 0.56 5 2858 602.10 1.01 3 40.55
Chambal Fert & Chemicals 76.09 13198719 1.54 2 2397 87.13 60.13 51.44 7.63 1326560 0.38 1 2389 897.56 1.16 1 0.35
Capital First Ltd 65.90 1731821 1.33 2 3463 81.04 76.00 51.29 30.08 1426544 1.51 2 1744 119.11 -0.18 0 98.57
SKS Microfinance Ltd 65.67 1407065 1.33 6 5907 63.21 60.90 33.60 25.11 908401 1.26 2 3487 161.49 0.07 4 69.39
Stocks that witnessed highest rise in the market value (Rs Crs) in the last one year period that held by Equity Diversified Small-cap Category:
Company Name
Data as on June 2015 Mkt Val (Rs Crs) during
previous quarters Data as on June 2014
Change in last one year period (between
June 2015 and June 2014)
Mkt
Val (Rs
Crs)
No of
Shares
% of
Holding
by the
category
Held By
no of
Schemes
Market
Cap (Rs
Crs)
Mar-
15 Dec-14 Sep-14
Mkt
Val (Rs
Crs)
No of
Shares
% of
Holding
Held By
no of
Schemes
Market
Cap (Rs
Crs)
% of
Change
in Mkt
Value
Change
in % of
Holding
Change
in held
By no of
Schemes
Difference
in Market
Cap (Rs
Crs)
Radico Khaitan Ltd 30.31 3708000 0.61 1 1086 26.49 - - 0.86 76025 0.04 4 1510 3413.32 0.57 -3 -28.06
WPIL Ltd 22.64 466000 0.46 4 474 27.17 29.65 2.83 1.40 33321 0.07 1 336 1512.48 0.39 3 41.29
Relaxo Footwears Ltd 32.31 340000 0.65 1 5702 12.05 7.85 2.85 2.09 55000 0.11 1 2283 1443.87 0.54 0 149.75
Chambal Ferti & Chemicals Ltd 76.09 13198719 1.54 2 2397 87.13 60.13 51.44 7.63 1326560 0.38 1 2389 897.56 1.16 1 0.35
Westlife Development Ltd 15.73 524377 0.32 1 4667 4.31 4.47 3.52 1.93 55000 0.10 1 5444 717.21 0.22 0 -14.29
Techno Electric & Engin Ltd 17.86 372713 0.36 4 2733 9.33 9.67 8.58 2.39 85306 0.12 1 1597 648.49 0.24 3 71.14
Siyaram Silk Mills Ltd 43.86 403622 0.89 2 1012 33.30 33.59 27.22 5.92 103158 0.30 1 539 641.03 0.59 1 87.77
Ramkrishna Forgings Ltd 16.82 258673 0.34 1 1786 12.68 7.98 3.09 2.29 130000 0.11 1 459 635.98 0.23 0 289.29
Alembic Pharmaceuticals Ltd 19.22 290000 0.39 1 12491 13.14 7.56 5.78 2.67 100000 0.13 1 5024 620.95 0.26 0 148.60
Swaraj Engines Ltd 22.86 252253 0.46 1 1119 19.24 20.39 22.79 3.20 33828 0.16 1 1176 614.76 0.30 0 -4.85
Repco Home Finance Ltd 77.89 1209319 1.57 8 4017 70.48 77.33 49.84 11.09 241343 0.56 5 2858 602.10 1.01 3 40.55
Essel Propack Ltd 31.73 2439660 0.64 1 2041 30.48 28.25 21.65 4.56 421040 0.23 1 1703 596.44 0.41 0 19.83
Stocks whose market capitalization rose more than 100% in last one year period that have been held by the Equity Diversified Small-cap Category:
Company Name
Data as on June 2015 Mkt Val (Rs Crs) during
previous quarters Data as on June 2014
Change in last one year period (between
June 2015 and June 2014)
Mkt
Val (Rs
Crs)
No of
Shares
% of
Holding
by the
category
Held By
no of
Schemes
Market
Cap (Rs
Crs)
Mar-
15 Dec-14 Sep-14
Mkt
Val (Rs
Crs)
No of
Shares
% of
Holding
Held By
no of
Schemes
Market
Cap (Rs
Crs)
% of
Change
in Mkt
Value
Change
in % of
Holding
Change
in held
By no of
Schemes
% of
Difference
in Market
Cap (Rs
Crs)

RETAIL RESEARCH
Hitachi Home & Life Solutions 44.66 281175 0.90 5 4310 69.54 47.13 29.40 10.72 356774 0.54 5 813 316.57 0.36 0 430.27
Mahindra CIE Automotive Ltd 20.13 875919 0.41 7 7424 20.12 19.50 5.66 4.46 277535 0.22 2 1479 350.89 0.19 5 401.81
Eveready Industries India Ltd 83.56 2552302 1.69 1 2376 69.35 47.82 29.52 15.26 2261091 0.77 1 491 447.50 0.92 0 384.30
Ramco Systems Ltd - - - - 2347 - - 3.55 2.57 121858 0.13 4 506 -100.00 -0.13 -4 363.94
Ramkrishna Forgings Ltd 16.82 258673 0.34 1 1786 12.68 7.98 3.09 2.29 130000 0.11 1 459 635.98 0.23 0 289.29
Bajaj Finance Ltd - - - 29266 - 23.93 18.69 13.78 68697 0.69 1 10033 -100.00 -0.69 -1 191.69
CCL Products (India) Ltd 38.54 2129548 0.78 1 2409 45.19 42.75 32.03 19.33 2800000 0.97 1 919 99.36 -0.19 0 162.01
J Kumar Infraprojects Ltd 13.10 186032 0.26 1 2270 12.71 9.55 5.86 2.66 84859 0.13 1 875 392.10 0.13 0 159.43
ISGEC Heavy Engineering Ltd - - - - 4344 7.54 6.97 2.97 2.39 10319 0.12 4 1699 -100.00 -0.12 -4 155.64
Relaxo Footwears Ltd 32.31 340000 0.65 1 5702 12.05 7.85 2.85 2.09 55000 0.11 1 2283 1443.87 0.54 0 149.75
Alembic Pharmaceuticals Ltd 19.22 290000 0.39 1 12491 13.14 7.56 5.78 2.67 100000 0.13 1 5024 620.95 0.26 0 148.60
Sun Pharma Advanced Res 7.85 199712 0.16 1 9280 9.83 3.73 3.96 3.25 199712 0.16 1 3853 141.36 0.00 0 140.82
KNR Constructions Ltd 15.08 287556 0.30 1 1471 12.22 9.44 8.15 6.57 287556 0.33 1 636 129.44 -0.03 0 131.37
MBL Infrastructures Ltd 18.31 358817 0.37 1 1059 18.19 11.90 9.99 7.89 293632 0.40 1 470 132.09 -0.03 0 125.58
Whirlpool of India Ltd 7.91 106315 0.16 2 9407 8.12 6.34 3.01 2.29 68286 0.11 1 4234 245.14 0.05 1 122.21
Shasun Pharmaceuticals Ltd - - - - 1961 3.77 2.89 - - - - - 886 - 0.00 0 121.39
Indoco Remedies Ltd 116.99 3238574 2.36 2 3328 117.82 100.93 93.74 43.61 2648635 2.19 2 1513 168.27 0.17 0 120.04
Bayer CropScience Ltd - - - - 14461 - - 10.26 7.80 42550 0.39 1 6680 -100.00 -0.39 -1 116.48
Ashok Leyland Ltd 2.14 294887 0.04 3 20633 2.66 7.11 10.27 6.65 1820732 0.33 4 9712 -67.81 -0.29 -1 112.45
Symphony Ltd 43.28 204230 0.87 1 7404 63.97 57.38 42.22 30.48 306287 1.53 1 3494 42.00 -0.66 0 111.92
SRF Ltd 112.02 909066 2.26 11 7060 90.37 69.31 48.10 35.73 599360 1.79 5 3402 213.48 0.47 6 107.53
Stocks that witnessed increase by the number of schemes held during the last one year period by the schemes in the Equity Diversified Small-cap Category:
Company Name
Data as on June 2015 Mkt Val (Rs Crs) during
previous quarters Data as on June 2014
Change in last one year period (between
June 2015 and June 2014)
Mkt
Val (Rs
Crs)
No of
Shares
% of
Holding
by the
category
Held By
no of
Schemes
Market
Cap (Rs
Crs)
Mar-15 Dec-14 Sep-14
Mkt
Val (Rs
Crs)
No of
Shares
% of
Holding
Held By
no of
Schemes
Market
Cap (Rs
Crs)
% of
Change
in Mkt
Value
Change
in % of
Holding
Change
in held
By no of
Schemes
Difference
in Market
Cap (Rs
Crs)
HSIL Ltd 42.27 1207202 0.85 8 2531 46.01 33.73 30.87 21.42 826955 1.08 1 1706 97.32 -0.23 7 48.31
SRF Ltd 112.02 909066 2.26 11 7060 90.37 69.31 48.10 35.73 599360 1.79 5 3402 213.48 0.47 6 107.53
Ador Welding Ltd 21.75 831535 0.44 7 357 17.46 16.66 13.37 9.45 402201 0.47 1 319 130.30 -0.03 6 11.85
Mahindra CIE Automotive Ltd 20.13 875919 0.41 7 7424 20.12 19.50 5.66 4.46 277535 0.22 2 1479 350.89 0.19 5 401.81
J K Cements Ltd 30.72 455502 0.62 8 4656 21.87 28.23 15.94 5.58 144097 0.28 4 2698 451.01 0.34 4 72.58
SKS Microfinance Ltd 65.67 1407065 1.33 6 5907 63.21 60.90 33.60 25.11 908401 1.26 2 3487 161.49 0.07 4 69.39
Timken India Ltd 38.78 672059 0.78 7 3913 35.56 34.80 13.31 8.25 254920 0.41 4 2197 370.16 0.37 3 78.15
DCB Bank Ltd 128.80 9884620 2.60 9 3684 104.14 119.73 54.92 21.59 2605680 1.08 6 2074 496.61 1.52 3 77.62
Grindwell Norton Ltd 40.46 543029 0.82 8 4119 30.33 33.60 17.35 11.19 265522 0.56 5 2335 261.42 0.26 3 76.43
Techno Electric & Engineering 17.86 372713 0.36 4 2733 9.33 9.67 8.58 2.39 85306 0.12 1 1597 648.49 0.24 3 71.14

RETAIL RESEARCH
Fag Bearings India Ltd 11.20 27200 0.23 4 6852 8.56 7.34 4.35 6.25 25000 0.31 1 4132 79.27 -0.08 3 65.81
Schneider Electric Infrastructure 18.58 882171 0.38 7 5034 19.50 15.33 15.83 13.76 1042684 0.69 4 3161 35.02 -0.31 3 59.27
Navin Fluorine International 97.95 1006728 1.98 5 949 63.49 42.96 43.81 28.97 472553 1.45 2 598 238.13 0.53 3 58.73
V-Guard Industries Ltd 16.87 188311 0.34 3 2689 12.18 21.98 3.03 - - - - 1764 - 0.34 3 52.42
Sundram Fasteners Ltd 11.84 782485 0.24 7 3160 5.56 11.55 9.58 3.56 354864 0.18 4 2102 232.73 0.06 3 50.32
Gateway Distriparks Ltd 14.57 425000 0.29 4 3731 10.07 8.62 6.28 5.64 245000 0.28 1 2504 158.47 0.01 3 49.00
Newly added stocks by the Equity Diversified Small-cap Category during recent periods:
Company Name
Data as on June 2015 Mkt Val (Rs Crs) during
previous quarters Data as on June 2014
Change in last one year period (between
June 2015 and June 2014)
Mkt
Val (Rs
Crs)
No of
Shares
% of
Holding
by the
category
Held By
no of
Schemes
Market
Cap (Rs
Crs)
Mar-15 Dec-14 Sep-14
Mkt
Val (Rs
Crs)
No of
Shares
% of
Holding
Held By
no of
Schemes
Market
Cap (Rs
Crs)
% of
Change
in Mkt
Value
Change
in % of
Holding
Change
in held
By no of
Schemes
Difference
in Market
Cap (Rs
Crs)
Century Plyboards (India) Ltd 20.55 1047332 0.42 6 4357 15.79 15.65 3.51 - - - - - - - - -
Suzlon Energy Ltd 17.23 7761215 0.35 6 11375 15.88 10.31 - - - - - - - - - -
ALSTOM India Ltd 13.92 193359 0.28 6 4830 13.87 12.10 - - - - - - - - - -
Arvind Ltd 42.41 1577408 0.86 4 6952 2.40 1.91 - - - - - - - - - -
Redington India Ltd 31.93 3306584 0.65 4 3860 39.61 39.89 - - - - - - - - - -
Trent Ltd 7.95 70560 0.16 4 3751 3.67 12.37 8.16 - - - - - - - - -
HeidelbergCement India Ltd 7.82 1074821 0.16 4 1650 3.77 4.13 4.42 - - - - - - - - -
Accel Frontline Ltd 4.65 630276 0.09 4 220 4.14 1.40 - - - - - - - - - -
Accelya Kale Solutions Ltd 3.21 32093 0.06 4 1488 1.73 1.86 1.37 - - - - - - - - -
OnMobile Global Ltd 3.07 370898 0.06 4 955 2.71 2.73 - - - - - - - - - -
TVS Srichakra Ltd 2.38 10507 0.05 4 1732 - - - - - - - - - - - -
Godfrey Phillips India Ltd 1.97 42945 0.04 4 2379 1.81 2.57 2.44 - - - - - - - - -
M M Forgings Ltd 19.34 320782 0.39 3 724 14.13 17.70 5.19 - - - - - - - - -
Praj Industries Ltd 17.37 1839849 0.35 3 1672 3.83 5.80 2.83 - - - - - - - - -
PVR Ltd 17.11 269373 0.35 3 2630 14.09 14.90 - - - - - - - - - -
Heritage Foods Ltd 15.36 410459 0.31 3 869 9.77 15.30 3.82 - - - - - - - - -
H T Media Ltd 11.34 1228300 0.23 3 2152 10.43 16.09 3.77 - - - - - - - - -
Texmaco Rail & Engineering Ltd 10.94 878000 0.22 3 2603 9.07 11.85 - - - - - - - - - -
EID Parry (India) Ltd 7.94 563049 0.16 3 2483 7.01 10.69 2.99 - - - - - - - - -
Premier Explosives Ltd 6.82 234510 0.14 3 258 0.23 - - - - - - - - - - -
Crompton Greaves Ltd 5.47 336913 0.11 3 10175 3.24 3.44 - - - - - - - - -
Mahindra & Mahindra Financial 4.91 175114 0.10 3 15936 3.81 - - - - - - - - - - -
Bajaj Finserv Ltd 4.64 30287 0.09 3 24283 - - - - - - - - - - - -
PNC Infratech Ltd 4.14 106299 0.08 3 1966 - - - - - - - - - - - -
Inox Wind Ltd 4.13 97642 0.08 3 9398 4.13 - - - - - - - - - - -

RETAIL RESEARCH
Castrol India Ltd 4.01 92539 0.08 3 21461 1.90 1.81 - - - - - - - - - -
Thermax Ltd 3.91 37397 0.08 3 12489 1.93 1.93 - - - - - - - - - -
Neyveli Lignite Corporation Ltd 3.91 478782 0.08 3 13699 - - - - - - - - - - - -
UPL Ltd 3.59 67061 0.07 3 22937 0.82 - - - - - - - - - - -
Phoenix Mills Ltd 2.76 73038 0.06 3 5495 1.84 1.92 - - - - - - - - - -
Century Textiles & Industries Ltd 2.65 37603 0.05 3 7164 - - - - - - - - - - - -
Just Dial Ltd 2.43 19130 0.05 3 8928 - - - - - - - - - - - -
Jet Airways (India) Ltd 2.21 78578 0.04 3 3200 - - - - - - - - - - - -
L&T Finance Holdings Ltd 1.80 272894 0.04 3 11339 - - - - - - - - - - - -
Glenmark Pharmaceuticals Ltd 1.63 16402 0.03 3 28027 - - - - - - - - - - - -
Arvind Infrastructure Ltd 0.07 15635 0.00 3 - - - - - - - - - - - - -
V-Guard Industries Ltd 16.87 188311 0.34 3 2689 12.18 21.98 3.03 - - - - - - - - -
Rane Holdings Ltd 14.65 251255 0.30 3 835 10.17 16.52 3.40 - - - - - - - - -
Vardhman Textiles Ltd 4.36 64355 0.09 3 4301 - - - - - - - - - - - -
Himatsingka Seide Ltd 18.58 1986039 0.38 3 917 11.21 15.40 3.27 - - - - - - - - -
Gammon Infrastructure Projects 10.95 8553062 0.22 3 1207 7.26 12.93 3.92 - - - - - - - - -
Coromandel International Ltd 3.99 159575 0.08 3 7225 1.23 1.26 - - - - - - - - - -
Indian Hotels Co Ltd 3.37 369050 0.07 3 7377 1.92 1.97 - - - - - - - - - -
India Cements Ltd 11.60 1230850 0.23 3 2892 6.11 10.14 5.87 - - - - - - - - -
Sharda Cropchem Ltd 79.44 2382962 1.61 2 3000 75.33 64.13 50.42 - - - - - - - - -
Can Fin Homes Ltd 9.36 121299 0.19 2 2049 2.01 4.75 3.69 - - - - - - - - -
TRF Ltd 8.69 247869 0.18 2 385 8.10 9.48 - - - - - - - - - -
Ipca Laboratories Ltd 59.22 834519 1.20 2 8956 51.38 41.62 8.71 - - - - - - - - -
PTC India Ltd 4.61 670848 0.09 2 2034 5.43 6.34 - - - - - - - - - -
Analyst: Dhuraivel Gunasekaran ([email protected]) Source: NAVIndia
RETAIL RESEARCH Tel: (022) 3075 3400 Fax: (022) 2496 5066 Corporate Office
HDFC securities Limited, I Think Techno Campus, Building - B, "Alpha", Office Floor 8, Near Kanjurmarg Station, Opp. Crompton Greaves, Kanjurmarg (East), Mumbai 400 042 Phone: (022) 3075 3400 Fax: (022)
2496 5066 Website: www.hdfcsec.com Email: [email protected]
Disclaimer: Mutual Funds investments are subject to risk. Past performance is no guarantee for future performance. This document has been prepared by HDFC Securities Limited and is meant for sole use by the
recipient and not for circulation. This document is not to be reported or copied or made available to others. It should not be considered to be taken as an offer to sell or a solicitation to buy any security. The
information contained herein is from sources believed reliable. We do not represent that it is accurate or complete and it should not be relied upon as such. We may have from time to time positions or options on,
and buy and sell securities referred to herein. We may from time to time solicit from, or perform investment banking, or other services for, any company mentioned in this document. This report is intended for non-
Institutional Clients.
This report has been prepared by the Retail Research team of HDFC Securities Ltd. The views, opinions, estimates, ratings, target price, entry prices and/or other parameters mentioned in this document may or
may not match or may be contrary with those of the other Research teams (Institutional, PCG) of HDFC Securities Ltd.