stock market development and internationalization: do...
TRANSCRIPT

ier.com/locate/jempfin
Journal of Empirical Finance 13 (2006) 316–350www.elsev
Stock market development and internationalization: Doeconomic fundamentals spur both similarly?☆
Stijn Claessens a,b,c, Daniela Klingebiel c, Sergio L. Schmukler c,⁎
a University of Amsterdam, The Netherlandsb CEPR, United Kingdom
c World Bank, United States
Abstract
We study how local stock market development and internationalization–listing, trading, and capitalraising in international exchanges–are related to economic fundamentals. Using panel data, we find thathigher-income economies with sounder macro policies, more efficient legal systems, greater openness, andhigher growth opportunities have more developed local markets. Importantly, these fundamentals also relateto internationalization, and actually more so, since the better the fundamentals, the higher the ratio ofinternationalization to local market activity. Furthermore, we find that greater domestic stock marketdevelopment is associated with subsequent higher internationalization. These findings are not consistentwith firms internationalizing to escape poor domestic environments, but rather with better countryfundamentals allowing firms to internationalize and with countries with more developed stock marketsexperiencing more internationalization. With liquidity agglomeration, better fundamentals might further
☆ This paper was revised while Schmukler was visiting the IMF Research Department. For useful comments, we wouldlike to thank Cheol Eun, Ken Kavajecz, Ruben Lee, Vincent Reinhart, Helene Rey, Benn Steil, Frank Warnock, JosefZechner, two anonymous referees, and participants at presentations held at the AICG-conference (Seoul), the BrookingsInstitution, the CEPR/ESGI/CFS Workshop on the New Economy (Brussels), Indiana University, the Inter-AmericanDevelopment Bank, Stanford University, University of Oxford, and the World Bank. We would like to thank especiallyGeert Bekaert (the Editor) for extensive comments and support. We are grateful to Ying Lin and Francisco Vazquez and,particularly, Tatiana Didier and Juan Carlos Gozzi Valdez for outstanding research assistance. For help with the data, weare grateful to Pamela Dottin, Monica Erpen, Dori Flanagan, Himmat Kalsi, Angela Marshall, RichardWebster-Smith, andCheryl Workman. We also thank Geert Bekaert and Chris Lundblad for kindly sharing with us the data on growthopportunities. The World Bank Latin American Regional Studies Program and Research Support Budget provided amplefinancial support that made this research possible. The findings, interpretations and conclusions expressed in this paper areentirely those of the authors and do not necessarily represent the views of the World Bank.⁎ Corresponding author.E-mail addresses: [email protected] (S. Claessens), [email protected] (D. Klingebiel),
[email protected] (S.L. Schmukler).
0927-5398/$ - see front matter © 2006 Elsevier B.V. All rights reserved.doi:10.1016/j.jempfin.2006.03.002
317S. Claessens et al. / Journal of Empirical Finance 13 (2006) 316–350
accelerate internationalization, with potential negative effects on domestic markets, as others have alreadyargued.© 2006 Elsevier B.V. All rights reserved.
JEL classification: G15; G18; G20Keywords: Stock exchange development; Internationalization of financial markets; Trading migration; Cross-listing;ADRs
1. Introduction
Financial markets, especially stock markets, have grown considerably in developed anddeveloping countries over the last two decades. Several factors have aided in their growth,importantly, improved macroeconomic fundamentals, such as monetary stability and highereconomic growth. General economic and capital market specific reforms, including privatizationof state-owned enterprises, financial liberalization, the establishment of stock exchanges andbond markets, and an improved institutional framework for investors, have further encouragedcapital market development.
Financial globalization has also advanced in the last two decades with increased cross-bordercapital flows, tighter links among financial markets, and greater commercial presence of foreignfinancial firms in countries around the world. An important element of the globalization trend hasbeen the increase in the stock exchange activities that take place abroad, most notably for emergingmarkets, but also for developed countries. Many firms now cross-list on international exchanges,with depositary receipts being a particularly popular instrument to access international markets.1
Going forward, many expect these globalization trends to continue as access to informationimproves, standards (concerning corporate governance, listing, accounting, and others) becomemore harmonized, technology advances, and inter-market linkages further increase.
In this paper, we try to shed light on how economic fundamentals affect the processes ofdomestic stock market development and internationalization of stock exchange activities. We dothis by analyzing a basic question: how do the macroeconomic and institutional factors that drivethe development of local stock markets affect the internationalization process? Many papers haveanalyzed the factors influencing stock market development. More recently, a number of papershave also studied the factors driving internationalization. However, papers have studied theseprocesses separately, working with different methodologies and samples, making comparisonsdifficult. In this paper, we use the same framework to analyze how economic fundamentals affectboth domestic stock market development and the internationalization of stock market activities(listing, capital raising, and trading abroad) for a large panel of countries and years, therebyfacilitating comparisons between the factors driving the two processes.
How economic fundamentals affect domestic stock market development and the inter-nationalization of stock market activities is not obvious. At least two possible views exist on
1 There are different ways to “list” domestic stocks in international financial markets. A traditional way is to cross-listthe share in another exchange. European companies tend to use this method of internationalization most often. A verypopular way to internationalize among emerging market firms has been through depositary receipts, called AmericanDepositary Receipts (ADRs) or Global Depositary Receipts (GDRs). These are instruments issued by international banks,like Bank of New York or Citibank, representing a claim on the home securities held with a local custodian. DR programsgrow or shrink depending on demand, since the issuance of DRs and the conversion back to the underlying shares onlyinvolve a small transaction cost. See Levy-Yeyati et al. (2006).
318 S. Claessens et al. / Journal of Empirical Finance 13 (2006) 316–350
the relation between economic fundamentals and domestic stock market development andinternationalization.
One view is that better institutional and macroeconomic environments spur more developeddomestic stock markets, and therefore reduce the need and desire to use international markets. Thefirst part of this view is uncontroversial, as much evidence exists on the positive link betweenfundamentals and financial market development.2 The second part is behind a number of recentpapers on internationalization. According to this view, poor domestic environments prompt firmsand investors to use international markets more intensively. An unfavorable domestic environmenthas long been considered one of the main reasons for capital flight and greater use by domesticresidents of all types of financial services offered internationally (see, for example, Collier et al.,2000). This may also apply to the services offered by stock markets. Karolyi (2004), for example,argues that the growth of American Depositary Receipt (ADR) programs in emerging economies isthe consequence of badly functioning stock markets, resulting from economic, political, legal, orother institutional forces that create incentives for firms to leave. Moreover, the literature on“bonding” argues that international markets are more attractive to firms from countries with weakinstitutional environments since they offer them the ability to “bond” themselves to a system thatbetter protects investors' rights (see Benos and Weisbach, 2004, for a review of this literature).3
Thus, poor domestic environments are associated with worse domestic market development, butgreater use of international markets. Conversely, improvements in fundamentals help developdomestic markets, but reduce the use of international markets.
A second view considers that better domestic environments increase the attractiveness ofassets to investors. Markets in general will offer larger amounts of external financing, higherliquidity, and a lower cost of capital when a firm's host country fundamentals improve. Under thisview, macroeconomic and institutional factors determine the willingness of domestic andinternational markets to provide financing to firms. Investors in international markets, with theability to invest globally, may reward more a better environment than investors in domesticmarkets.4 Provided that there is access to international markets, better domestic fundamentalswill, under this view, lead to more (not less) use of international capital markets.
The second view thus differs from the first one. Under the first view, any firm regardless of itsdomestic environment can choose to go abroad and in doing so can escape, at least in part, thepoor domestic environment. Under the second view, however, only firms from goodenvironments are able to go abroad, as the suppliers of capital grant them access to internationalmarkets at attractive enough terms.
2 The foundations of financial markets and the relation between financial market development and macroeconomicvariables, financial reform, and other country factors have been extensively documented. The general finding is thatfinancial markets tend to develop as income per capita grows, financial reform progresses, and the institutionalenvironment improves. See Levine (1997) for an earlier review and Levine (2005) for a recent update.3 One of the first papers in this literature is Coffee (1999), who argues that cross-listing in an exchange with better
investor protection is a form of bonding, creating a credible and binding commitment by the issuer to protect the interestsof minority shareholders. Reese and Weisbach (2002) find that, after cross-listing in the U.S., firms from countries with aweaker corporate governance framework are more likely to issue consecutively equity at home. They argue that this isbecause cross-listing improves investor protection for all shareholders, including those outside the U.S. There are,however, skeptics of the bonding view. Licht (2003) and Siegel (2005), for example, argue that the host regulatorstypically provide only limited protection against minority rights abuses by controlling shareholders in the firm's homecountry, and thus the value from bonding is reduced.4 Several authors argue that integration with global financial markets increases market discipline, reducing the
government's ability to expropriate investors and conduct unsound policies, as international investors can easily shifttheir capital across countries (see, for example, Obstfeld, 1998; Stulz, 2005; The Economist, 2001).
319S. Claessens et al. / Journal of Empirical Finance 13 (2006) 316–350
In sum, while there are arguments for both a positive and negative impact on internation-alization of an improvement in those fundamentals that positively affect local market devel-opment, empirical tests can help us disentangle which view is best supported by the data. Doingso requires a formal analysis of the determinants of both stock market development and inter-nationalization. We conduct this analysis for a large panel dataset, comprising 78 countries andusing a relatively long time series, from 1984 to 2000. We start by documenting the patterns indomestic market capitalization, trading, and capital raising for high-, middle-, and low-incomecountries. Using individual firm data, we calculate similar measures of the level of inter-nationalization and document these for each country grouping. We then formally analyze thefactors driving domestic stock market development and internationalization, measured in eachcase by market capitalization, trading activity, and capital raising.
Our results show that there are a (small) number of fundamental factors that affect both thedevelopment of local stock markets and the degree of international activity. We also find thatgenerally these fundamentals affect local markets and international activity in the sameway, i.e., asa country's macroeconomic and institutional environment improves, domestic stock exchangeactivity increases, but so does activity abroad. Moreover, we find that improvements in countryfundamentals tend to have a greater impact on the internationalization process, i.e., interna-tionalization accelerates as fundamentals improve. We also show that countries with moredeveloped domestic stock markets see relatively more (subsequent) internationalization of stockmarket activities.
Regarding the two views on the role of fundamentals, the findings that the processes of localstock market development and internationalization are driven by the same factors and that theseprocesses are positively related are not consistent with the arguments that explain interna-tionalization as the result of a poor domestic environment. The evidence rather supports the viewthat access to international markets depends to a greater extent on investors' assessment of thefirms' home country environment, and less so on the decision of firms to escape countries withpoor environments by going abroad.
The paper is structured as follows. Section 2 provides a description of the data and illustratessome of the main trends in stock market development and internationalization over time and acrossour sample of countries. Section 3 describes the basic econometric tests and results. Section 4presents some robustness tests and extensions. Section 5 concludes.
2. Data and descriptive analysis
This section describes the data used in the paper. As some of these data are unique and new, wefirst discuss in detail the data sources. Second, we present some general trends and summarystatistics of the variables under study.
2.1. Data sources
We are interested in the domestic and international dimensions of stock market activity. Asmeasures of stock market activity, we use three variables: market capitalization, value traded, andamount of new equity capital raised. For all, we need data on both domestic and internationalactivity. Getting data for these various measures is not easy, however, especially as we want to beas comprehensive as possible, covering as many countries and as long a times series as possible.While there are several data sources on market capitalization and trading that comprise a largenumber of countries, there is no comprehensive database on the degree of new capital raised
320 S. Claessens et al. / Journal of Empirical Finance 13 (2006) 316–350
domestically. There are even less comprehensive data available on the degree to which securitiesare listed and traded abroad and the degree of capital raising in foreign markets. We therefore needto combine a number of sources.5
On domestic activity, the dollar amounts of market capitalization and value traded on the majordomestic stock exchanges come from the International Finance Corporation's (IFC's) EmergingMarkets Factbook, now named the Standard & Poor's Emerging Markets Database.6 The dataseton these domestic activity measures comprises the period 1975–2000 for 82 countries, but due todata availability on the explanatory variables, our sample is restricted to 78 countries covering theperiod 1984–2000. The amount of equity capital raised by domestic firms in the local stockmarket comes from the World Federation of Exchanges and covers the period 1982–2000 for 43countries.
On foreign activity, we have data from the Bank of NewYork, which cover the three major stockexchanges in the U.S.: AMEX, NASDAQ, and the New York Stock Exchange (NYSE). The baselist of companies with depositary receipt (DR) programs comes from two Bank of New Yorksources: the Complete DR Directory and a database with the value traded at the ticker level. Thesetwo datasets contain the list of current DR programs and the effective date of each program. TheDR Directory includes all currently active programs, dating back to January 1956, with most ofthem being initiated after 1980. The resulting database accounts for 1951 active DR programs from1524 firms in 80 countries. However, these two databases do not include DR programs that wereterminated before March 2001. To account for these programs, we use an additional database, alsoprovided by the Bank of New York, which lists all terminated DR programs. The set of terminatedDR programs relevant for our study amounts to 214 firms. We augment the foreign activityinformation with data from NASDAQ and NYSE. The data on foreign corporations listed on thoseexchanges give us practically all the stocks that cross-listed or otherwise accessed the U.S. equitymarkets over this period.
In terms of trading abroad, we focus on trading in DRs. The dataset on DR value traded alsocomes from Bank of New York and covers the period January 1989–November 2000, providingthe value traded in U.S. dollars in New York.7 Companies that are not shown to be tradingaccording to Bank of New York are assigned a zero. We also have data on value traded by foreignfirms on the London Stock Exchange (LSE) for 45 countries for the period January 1998–November 2000. However, given that the time span of the LSE data is muchmore limited, we focusour analysis of trading on the Bank of New York data.8
Capital raised abroad, as we define it, refers to the sum of the amount of new equity financingwhich is obtained by using a non-domestic instrument, such as a foreign listing or an ADR, and anynew equity issue abroad. On capital raised abroad, we use a combination of two different datasets.One comes from the Bank of NewYork, which covers capital raised through depositary receipts forthe periodMay 1980–November 2000. It contains 1178 operations from 864 firms in 54 countries.The other dataset covers all capital raising operations in international markets by firms and is
5 The list of countries covered and the groupings by income level are provided in Appendix Table 1, while the datasources are detailed in Appendix Table 2.6 While this data source is the best available for a large cross-section of countries, it only covers listing and trading in
the major formal, organized public stock exchange in a country and ignores any over-the-counter trading and activity inother markets. As such, it underestimates a country’s total market activity.7 Using these data, we extrapolate the amount traded in December 2000 to obtain an estimate for the value traded
abroad during all of 2000.8 Since we only have data for trading in DRs, we cannot study whether differences in the forms of internationalization
(e.g., cross-listing, ADRs/GDRs, global shares) matter for liquidity.
321S. Claessens et al. / Journal of Empirical Finance 13 (2006) 316–350
compiled by Euromoney. This database provides a more comprehensive account of capital raised,because it includes both DR programs and cross-border listings. It reports 8795 operations from5665 firms in 86 countries, covering the period January 1983–April 2001. The use of both datasetsalso helps us to cross-check the data, obtain missing information, and correct reporting errors. Bycombining these two datasets, we create a series on capital raised in foreign markets.
The data from Bank of New York, Euromoney, LSE, NASDAQ, and NYSE allow us toconstruct a list of “international” firms for each country. Under our definition, internationalfirms are those that list in international markets, directly or via DRs, or raise capital ininternational equity markets. With this classification we determine the market capitalization ofall international firms for each country, which we use as one measure of the degree ofinternationalization at the country level.9 This measure does not indicate, however, whether theshares of these firms are actively traded in international markets. For some cross-listed stocks,for example, trading is largely in the home market rather than abroad. Also, some stocks mighthave little free float available for outside investors, as they are closely held. Both facts may leadto an overestimation of the degree of internationalization when using market capitalization. Theother measures of the degree of internationalization (trading and capital raised abroad) do notsuffer from these potential problems, since they quantify the actual activity that takes place ininternational markets.
2.2. Descriptive statistics
Based on the data compiled, we calculate nine variables for analysis, three for the developmentof local stock exchanges, three for the internationalization of stock exchanges, and three for therelative degree of internationalization. The first three are: market capitalization over grossdomestic product (GDP), value traded domestically over GDP, and capital raised domesticallyover GDP. The next three are: market capitalization of international firms over GDP, value tradedabroad over GDP, and capital raised abroad over GDP. The last three are: market capitalization ofinternational firms over total domestic market capitalization, value traded abroad over valuetraded domestically, and capital raised abroad over capital raised domestically. In all cases wework with annual data, using end-of-year stock data and flow data cumulative over the year.10
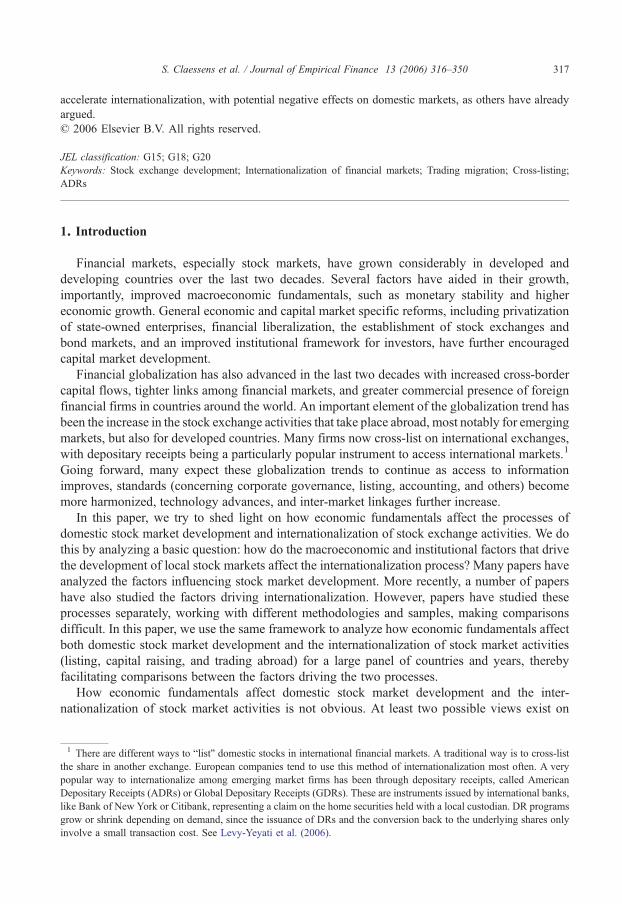
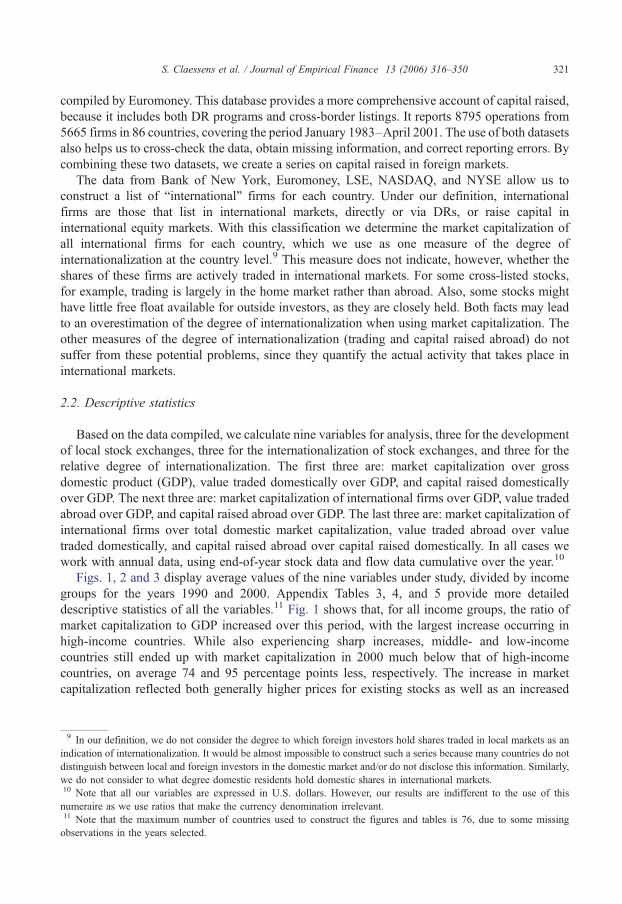
Figs. 1, 2 and 3 display average values of the nine variables under study, divided by incomegroups for the years 1990 and 2000. Appendix Tables 3, 4, and 5 provide more detaileddescriptive statistics of all the variables.11 Fig. 1 shows that, for all income groups, the ratio ofmarket capitalization to GDP increased over this period, with the largest increase occurring inhigh-income countries. While also experiencing sharp increases, middle- and low-incomecountries still ended up with market capitalization in 2000 much below that of high-incomecountries, on average 74 and 95 percentage points less, respectively. The increase in marketcapitalization reflected both generally higher prices for existing stocks as well as an increased
9 In our definition, we do not consider the degree to which foreign investors hold shares traded in local markets as anindication of internationalization. It would be almost impossible to construct such a series because many countries do notdistinguish between local and foreign investors in the domestic market and/or do not disclose this information. Similarly,we do not consider to what degree domestic residents hold domestic shares in international markets.10 Note that all our variables are expressed in U.S. dollars. However, our results are indifferent to the use of thisnumeraire as we use ratios that make the currency denomination irrelevant.11 Note that the maximum number of countries used to construct the figures and tables is 76, due to some missingobservations in the years selected.

Market Capitalization / GDP
44%38%
12%
116%
42%
21%
0%
20%
40%
60%
80%
100%
120%
140%
High-Income Countries Middle-Income Countries
16%8%
3%
100%
19%
7%
0%
20%
40%
60%
80%
100%
120%
1%2% 2%
7%
2%1%
0%
1%
2%
3%
4%
5%
6%
7%
8%
9%
10%
1990 2000
Value Traded / GDP
Capital Raised Domestically / GDP
1990 2000
Low-Income Countries
High-Income Countries Middle-Income Countries Low-Income Countries
High-Income Countries Middle-Income Countries Low-Income Countries
Fig. 1. Stock market development. This figure shows market capitalization over GDP, value traded domestically over GDP,and capital raised domestically over GDP at two points in time. The series are averages across countries, grouped byincome level, following the classification of the World Development Indicators, World Bank (see Appendix Table 1). Thesources are Standard & Poor's (former IFC) Emerging Markets Database for market capitalization and value tradeddomestically and World Federation of Exchanges for capital raised domestically.
322 S. Claessens et al. / Journal of Empirical Finance 13 (2006) 316–350
0.1%0.0% 0.0%
1.2%
0.2%0.1%
0.0%
0.2%
0.4%
0.6%
0.8%
1.0%
1.2%
1.4%
1990 2000
10%
69%
15%
4%0.0%0.5%
0%
10%
20%
30%
40%
50%
60%
70%
80%
1%
13%
3%
0.0%0.1% 0.5%
0%
2%
4%
6%
8%
10%
12%
14%
16%
Capital Raised Abroad / GDP
1990 2000
Market Capitalization of International Firms / GDP
Value Traded Abroad / GDP
High-Income Countries Middle-Income Countries Low-Income Countries
High-Income Countries Middle-Income Countries Low-Income Countries
High-Income Countries Middle-Income Countries Low-Income Countries
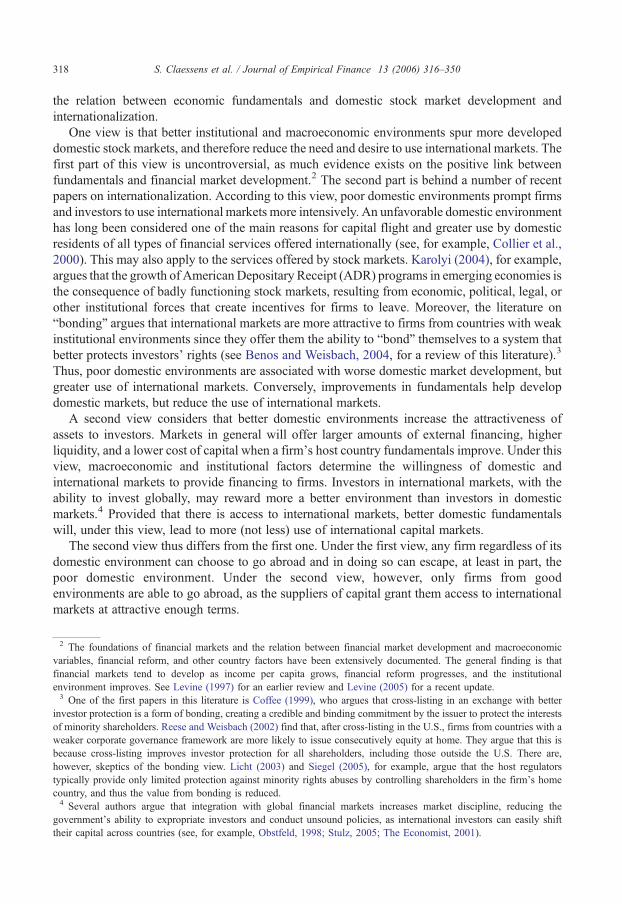
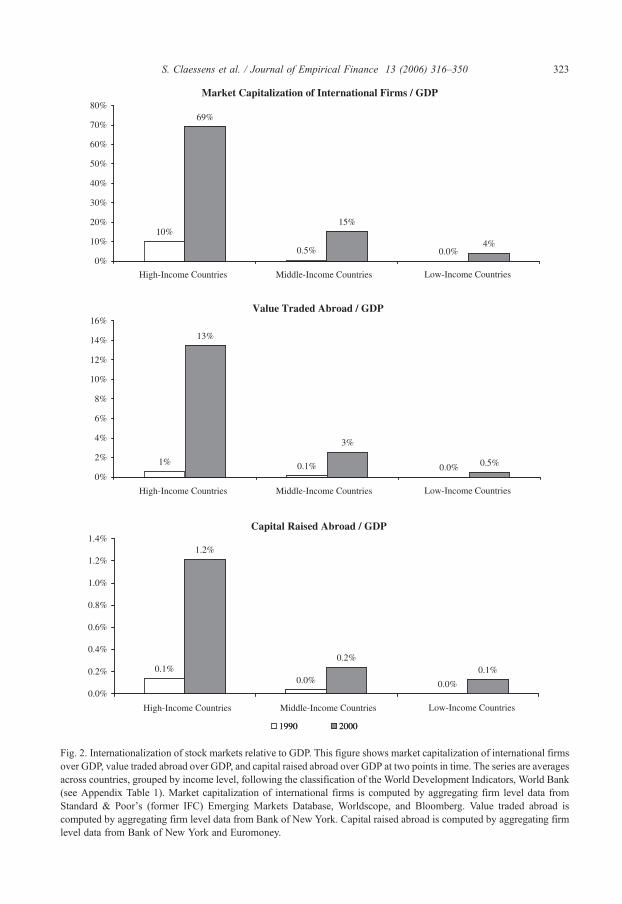
Fig. 2. Internationalization of stock markets relative to GDP. This figure shows market capitalization of international firmsover GDP, value traded abroad over GDP, and capital raised abroad over GDP at two points in time. The series are averagesacross countries, grouped by income level, following the classification of the World Development Indicators, World Bank(see Appendix Table 1). Market capitalization of international firms is computed by aggregating firm level data fromStandard & Poor's (former IFC) Emerging Markets Database, Worldscope, and Bloomberg. Value traded abroad iscomputed by aggregating firm level data from Bank of New York. Capital raised abroad is computed by aggregating firmlevel data from Bank of New York and Euromoney.
323S. Claessens et al. / Journal of Empirical Finance 13 (2006) 316–350
25%
3%
56%
43%
18%
0.1%0%
10%
20%
30%
40%
50%
60%
70%
High-Income Countries Middle-Income Countries Low-Income Countries
High-Income Countries Middle-Income Countries Low-Income Countries
40%
3%
31%
42%
7%
0.0%0%
5%
10%
15%
20%
25%
30%
35%
40%
45%
7% 6%
28%
65%
1%0.0%0%
10%
20%
30%
40%
50%
60%
70%
80%
1990 2000
Market Capitalization of International Firms / Total Market Capitalization
Value Traded Abroad / Value Traded Domestically
40%
3%
31%
42%
0%
10%
20%
30%
40%
50%
Capital Raised Abroad / Capital Raised Domestically
7% 6%
28%
65%
1%0.0%0%
10%
20%
30%
40%
50%
60%
70%
80%
1990 2000
High-Income Countries Middle-Income Countries Low-Income Countries
0.0%
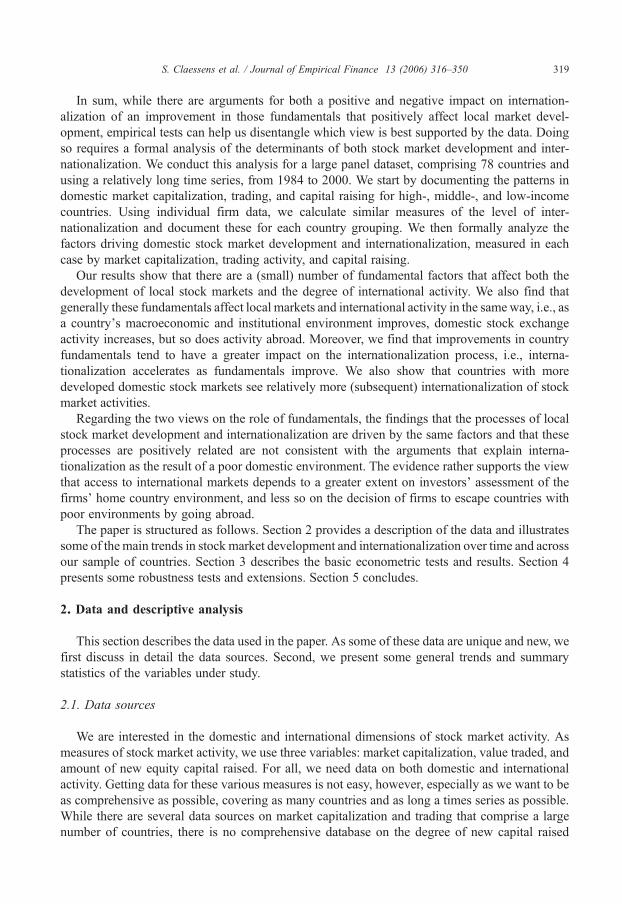
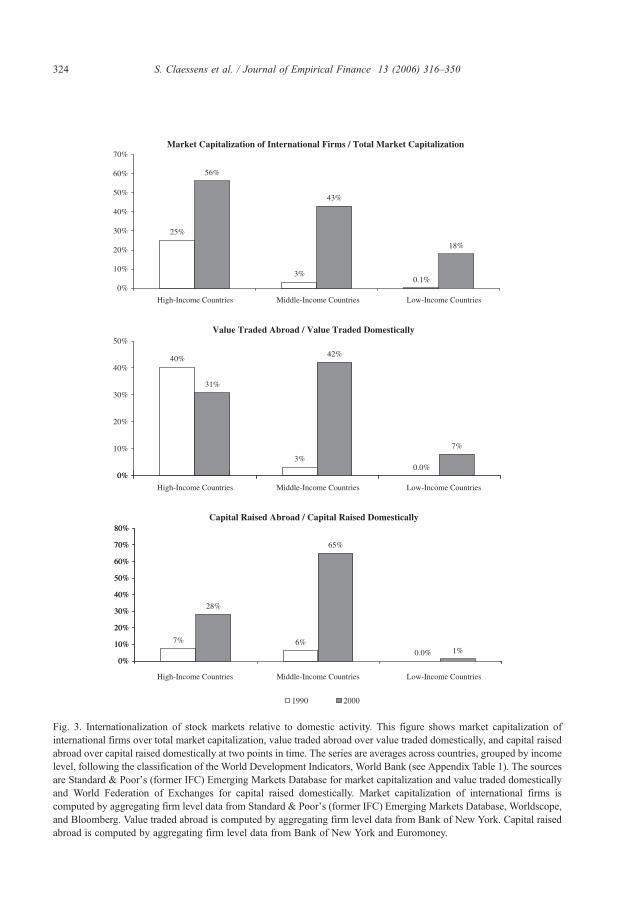
Fig. 3. Internationalization of stock markets relative to domestic activity. This figure shows market capitalization ofinternational firms over total market capitalization, value traded abroad over value traded domestically, and capital raisedabroad over capital raised domestically at two points in time. The series are averages across countries, grouped by incomelevel, following the classification of the World Development Indicators, World Bank (see Appendix Table 1). The sourcesare Standard & Poor's (former IFC) Emerging Markets Database for market capitalization and value traded domesticallyand World Federation of Exchanges for capital raised domestically. Market capitalization of international firms iscomputed by aggregating firm level data from Standard & Poor's (former IFC) Emerging Markets Database, Worldscope,and Bloomberg. Value traded abroad is computed by aggregating firm level data from Bank of New York. Capital raisedabroad is computed by aggregating firm level data from Bank of New York and Euromoney.
324 S. Claessens et al. / Journal of Empirical Finance 13 (2006) 316–350
325S. Claessens et al. / Journal of Empirical Finance 13 (2006) 316–350
number of listings. For high-income countries, for example, the average number of companieslisted on domestic exchanges increased from 703 in 1990 to 900 in 2000.
Value traded as a ratio of GDP has also grown strongly in the high-income group with over a15-fold increase during the period 1975–2000 and over a six-fold increase between 1990 and2000. Fig. 1 shows that growth has been less pronounced in the middle- and low-income group.The growth patterns in value traded mimic those in market capitalization. As for capital raised,Fig. 1 shows that low- and middle-income countries have much lower ratios of capital raised toGDP than high-income countries do, although again there are large variations among countrieswithin each group. Capital raising figures show a sharp increase for high-income countries overthe period, but for middle- and low-income nations, capital raised domestically over GDPremained flat or decreased between 1990 and 2000.
Fig. 2 displays the three measures of the extent of internationalization: market capitalization ofinternational firms as a ratio of GDP, value traded abroad relative to GDP, and capital raisedabroad over GDP. Again, the figures show the indicators split by income group. As a ratio of GDP,the patterns for market capitalization of international firms, value traded abroad, and capital raisedabroad for the three groups of countries are similar to those for domestic activity. For high-incomecountries, the market capitalization of international firms increased from ten percent of GDP to69% between 1990 and 2000. In middle- and low-income countries, market capitalization ofinternational firms increased from less than one percent of GDP to 15% and four percent,respectively. Similar patterns across income groups can be observed in the panels that displayvalue traded abroad and capital raised abroad to GDP.
Fig. 3 shows the three indicators of the degree of internationalization relative to domesticactivity: market capitalization of international firms as a ratio of total market capitalization,value traded abroad relative to value traded domestically, and capital raised abroad over capitalraised domestically. The ratio of market capitalization of international firms to total marketcapitalization shows clearly how strong the internationalization trend has been, especially formiddle-income countries. For these economies, the ratio of market capitalization of internationalfirms to total market capitalization jumped from only a few percentage points in 1990 to 43% in2000. In the low- and high-income countries, the ratio of foreign to total market capitalizationalso rose sharply. In 2000, market capitalization of international firms over total marketcapitalization stood at an average 56% for high-income countries and 18% for low-incomecountries.12
Somewhat similar trends are present for value traded abroad relative to value tradeddomestically and for capital raised abroad over capital raised domestically, a pronounced increasefor middle-income countries during the 1990s and a relatively slow increase for low-incomecountries. The average trading ratio for middle-income countries, for example, rose from a fewpercentage points to 42% in 2000, and more trading takes place abroad than at home for many ofthese countries. At the same time, the average ratio of trading abroad to home trading rose fromzero to seven percent for low-income countries. The high-income country group saw a decline in
12 The (increasing) market capitalization of international firms is accounted for by relatively few companies, as typicallylarge companies list abroad. But the growth in the number of international firms has been large as well. Though notreported in the appendix tables, for middle-income countries, the average number of companies listed abroad per countryincreased from four in 1990 to 24 in 2000. Low-income countries had on average 14 companies listed abroad in 2000.With more companies listing abroad, high-income countries experienced the highest average increase in terms ofnumbers. While, on average, only 21 companies were trading abroad in 1990, this number increased to 65 in 2000 forhigh-income countries. See Claessens et al. (2003) for more information on the characteristics of firms going abroad.
326 S. Claessens et al. / Journal of Empirical Finance 13 (2006) 316–350
the share of trading abroad in the last few years, with the ratio decreasing from 40% to 31%between 1990 and 2000.13
In terms of capital raised abroad, the trends towards internationalization are striking as well,especially for the middle-income countries. For this group, capital raised abroad relative to capitalraised domestically jumped from six percent in 1990 to 65% in 2000. The increase was lesspronounced in high-income countries, going from 7% to 28% during the same period. Low-income countries, on the other hand, had an almost negligible ratio of capital raised abroadrelative to capital raised domestically over the whole period.
3. Dependent and explanatory variables, methodology, and results
In this section, we investigate how economic fundamentals explain the stock marketdevelopment and internationalization processes described above by estimating differentregressions. We first discuss the dependent and explanatory variables we use, then describe themethodology, and finally present the regression results.14
3.1. Dependent and explanatory variables
We want to analyze the determinants of domestic stock market development and inter-nationalization. We also want to study whether the internationalization process is more, less, orequally sensitive to economic fundamentals than the domestic stock market development process.To do all this, we use the nine variables described in Section 2 as dependent variables.
Although many other papers have already studied the determinants of domestic stock marketdevelopment, we still study local market development as a benchmark to the analysis of interna-tionalization. Of the estimations, the regressions analyzing the ratio of international to domesticactivity are the main focus of attention in this paper. The ones using the ratios of internationalactivity to GDP are also informative because they portray the extent of the internationalizationprocess, not just relative to domestic activity.
In terms of explanatory variables, we use variables found to be important in the literature onstock market development (see Levine, 2005). Many papers have shown that stock marketdevelopment varies with the overall level of development of the country (see, for example, LaPorta et al., 1997, 2006; Levine, 1999; Rajan and Zingales, 2003), with more developed countrieshaving deeper markets. We therefore use a general measure of development, in particular, GDP percapita in U.S. dollars. Furthermore, as the legal and institutional environments have been found tomatter for financial development (see Beck and Levine, 2005), we use measures of countries' legalsystems. Specifically, for the quality of the institutional framework, we use the law and orderindex, as reported by the International Country Risk Guide service. We also use a dummy forEnglish legal origin, which has been shown to be correlated with judicial efficiency and legalrights, including the strength of minority shareholders protection (see La Porta et al., 1998).
We include two variables to control for macroeconomic performance, the inflation rate overthe year and the level of government deficit over GDP, since macroeconomic instability tends toadversely affect financial market development (see, for example, Bencivenga and Smith, 1992;
13 This number may underestimate the degree of internationalization, however, because while we have data on trading inADRs and GDRs, the main vehicle used for internationalization by firms from low- and middle-income countries, we donot cover trading in cross-listed stocks, a vehicle more typically used by firms from high-income countries.14 The variables used in this analysis are described in more detail in Appendix Table 2.

327S. Claessens et al. / Journal of Empirical Finance 13 (2006) 316–350
Boyd et al., 2001; Huybens and Smith, 1999). Moreover, a large government deficit can crowdout private capital markets, as governments may tap capital markets to finance it.
We also control for the extent of financial openness as that has been found to affect local stockmarket development (Bekaert and Harvey, 2000, 2003; Edison and Warnock, 2003a; Henry,2000; Kim and Singal, 2000; Levine and Zervos, 1998). Furthermore, an open capital account is aprerequisite for firms to access international markets (and for international investors to accesslocal markets). To capture financial openness we use three different indicators. As a measure ofgeneral financial liberalization, and specifically for the ease of foreign ownership in a country, weuse the de jure measure of capital account liberalization reported by the IMF.15 Since we areanalyzing stock markets, we also use a specific de jure indicator of stock market liberalization,which unfortunately has a narrower country coverage. More precisely, we combine the Bekaert etal. (2005) official liberalization dates, which mostly comprise developing countries, with theKaminsky and Schmukler (2003) measure of liberalization, which also includes developedeconomies, to get the widest possible coverage.16 Alternatively, as a measure of de factoopenness, we use equity flows, including both portfolio equity flows and foreign directinvestment (FDI) flows, relative to GDP.17 This variable captures the effective integration withinternational capital markets and the de facto openness of the stock market; it can also be viewedas a measure of foreign demand for domestic equity.
Finally, we control for the possibility that local capital market development and theparticipation in international markets are affected by the growth opportunities that firms face. Theinitial public offering (IPO) literature (see Ritter and Welch, 2002 for a review) has highlightedthe role that growth opportunities play in affecting the desire of firms to seek external financing.Growth opportunities thus may be particularly relevant for explaining capital raising behavior.Moreover, firms may go abroad simply because they face good domestic and/or internationalgrowth opportunities, become too large for the domestic equity market, and must raise capital ininternational markets. Growth opportunities may have an effect that is irrespective of or inaddition to that of the economic fundamentals mentioned above. In fact, in a broad sense, growthopportunities could also be interpreted as another economic fundamental. The level of growthopportunities can thus affect both the development of local stock markets (since countries withbetter growth opportunities may need larger stock markets to satisfy a higher demand for externalfunds) and the desire of firms to access international equity markets (to the extent thatinternational markets provide an alternative, and often cheaper, source of financing).
While controlling for growth opportunities is important, growth opportunities are difficult tomeasure, especially at an aggregate country level. Also, one needs an indicator that is exogenous,
15 This measure has advantages and drawbacks. Perhaps, the main advantage is its wide coverage. One drawback is thatthe IMF revised the reporting format for capital account restrictions in 1996, when it started to provide more details onaspects of capital account liberalization. Before 1996, the IMF measure of capital account liberalization was a simpledummy variable. As a consequence, we needed to splice the two series together to create a series of capital accountliberalization going back. We did this by using the year-by-year dummy measures up to 1995, and then creating a singleliberalization dummy after 1996 if at least half of the detailed aspects covered by the IMF signaled liberalization.16 Alternatively, we ran regressions using just the Bekaert et al. (2005) variable and their “First Sign” stock liberalizationmeasure, which is based on the earliest of three possibilities: the launching of a country fund, an ADR announcement,and the official liberalization date. We obtained similar results using these measures, but to save space we do not reportthem. Another possible variable is the Edison and Warnock (2003b) index of the intensity of stock market liberalization.However, this measure is limited to 29 emerging markets, so it would restrict our sample too much.17 We include FDI flows because those flows, apart from new investment, also represent purchases of existing equity. Infact, equity flows are classified as FDI flows when they represent a purchase of at least ten percent of a company's equity.
328 S. Claessens et al. / Journal of Empirical Finance 13 (2006) 316–350
in the sense that it does not use local price information. Fortunately, we are able to use the globalgrowth opportunities index from Bekaert et al. (in press), which measures how each country'sindustry mix is priced in global capital markets, using the price earnings ratios of global industryportfolios.18
3.2. Methodology
In all cases, we pool the data over time and across countries to use both balanced andunbalanced panels.19 For all our tests, we use the same regressors for both domestic stock marketdevelopment and internationalization. Regarding the estimation techniques, we use least squaresestimators with random effects for the variables related to domestic market development. For thevariables capturing the internationalization of stock markets, we estimate random effects Tobitmodels. The difference in techniques is motivated by the different nature of the data on domesticand international activity. There are data on capitalization, value traded, and capital raised for thedomestic market of most countries analyzed; otherwise there are missing observations. In thiscase, linear estimations can yield consistent and efficient results. For the variables related to theinternationalization of stock markets, we have either positive values or observations with zeros.These zeros are informative because they mean that the data are censored at that point. Tobitmodels account for this feature of the data and yield consistent estimates. Random effects models,used for both regressions, take into consideration the possible lack of homoscedasticity in thedata, estimating different variances across countries.
Before reporting the results, there are two further methodological points worth discussing.First, in general, while we believe that the variables used are largely exogenous to the differentmeasures of stock market development and internationalization, there can still be endogeneityleft. One variable that might be more susceptible to endogeneity is capital flows, given thatforeign investment tends to go to countries with more developed markets and more open tointernationalization. To reduce this potential problem, and since good instruments are hard toobtain, we use the capital flow variable lagged one period. To confirm that our results are notaffected by this variable, we also report estimations without it. We find that the coefficients on theother variables are unaffected by the inclusion of this variable, and therefore do not think that thistype of endogeneity is driving the results. In any event, our main interest lies in the comparisonbetween how fundamentals affect domestic stock market development and internationalization,and we do not think that the potential endogeneity of some variables affects this comparison.Moreover, we try to avoid giving the impression that we estimate a causal relation.
The second methodological point is that we enter the inflation rate linearly in thespecifications. However, the theoretical literature on credit market frictions, finance, and growthsuggests that the relation between inflation and financial sector development may becharacterized by thresholds. Boyd et al. (2001) confirm econometrically that higher levels ofinflation are associated with smaller, less active, and less efficient banking systems and stockmarkets. They also highlight the nonlinear relation between inflation and financial sector
18 Bekaert et al. (in press) use two country-specific industry weightings to calculate each country's growth opportunitiesindex. One is based on the relative market capitalization of each industry in the local stock market. The other one is basedon the relative value added of each of the industries in the respective country. We report the results using the latterweighting scheme, but also estimated the regressions using the former, obtaining similar results.19 For the regressions of internationalization, we exclude the U.S. and U.K., since these are the main financial centerswhere the internationalization takes place. Both countries are included in the regressions of domestic stock marketdevelopment. We also estimated these regressions excluding these countries, and obtained analogous results.

Table 1Stock market development
Market capitalization/GDP
(1) (2) (3) (4) (5) (6)
Log of GDP per capita 0.213⁎⁎⁎ 0.144⁎⁎⁎ 0.200⁎⁎⁎ 0.163⁎⁎⁎ 0.121⁎⁎⁎ 0.130⁎⁎⁎
[7.462] [5.091] [7.667] [6.969] [4.548] [4.895]Law and order 0.014 0.026⁎ 0.006 0.012 0.004 0.003
[0.962] [1.707] [0.448] [1.063] [0.298] [0.250]English legal origin 0.224⁎⁎
[2.286]Log (1+ inflation) −0.017
[0.471]Government deficit/GDP −2.625⁎⁎⁎ −2.044⁎⁎⁎ −1.770⁎⁎⁎ −2.110⁎⁎⁎ −2.079⁎⁎⁎
[7.385] [6.670] [6.471] [7.220] [7.123]Capital account liberalization 0.098⁎⁎⁎ 0.051
[2.682] [1.270]Stock market liberalization 0.059⁎⁎
[1.993]Total equity flows/GDP
(one year lagged)3.845⁎⁎⁎ 4.747⁎⁎⁎ 4.607⁎⁎⁎
[7.583] [8.041] [7.782]Global measure of country
growth opportunities0.439⁎⁎⁎ 0.435⁎⁎⁎
[8.059] [7.997]
No. of observations 1007 843 745 802 684 684No. of countries 77 73 55 71 49 49Overall R-squared 0.205 0.229 0.205 0.270 0.352 0.416
Value traded domestically/GDP
(1) (2) (3) (4) (5) (6)
Log of GDP per capita 0.215⁎⁎⁎ 0.115⁎⁎⁎ 0.126⁎⁎⁎ 0.101⁎⁎⁎ 0.086⁎⁎⁎ 0.089⁎⁎⁎
[9.347] [6.716] [6.410] [5.919] [4.161] [4.231]Law and order −0.018 0.000 −0.005 −0.005 −0.013 −0.013
[1.609] [0.006] [0.383] [0.498] [1.128] [1.146]English legal origin 0.051
[0.800]Log (1+ inflation) 0.016
[0.563]Government deficit/GDP −1.425⁎⁎⁎ −1.558⁎⁎⁎ −1.243⁎⁎⁎ −1.471⁎⁎⁎ −1.460⁎⁎⁎
[6.102] [5.830] [5.080] [5.480] [5.430]Capital account liberalization 0.049 0.004
[1.788] [0.171]Stock market liberalization 0.006
[0.223]Total equity flows/GDP
(one year lagged)2.851⁎⁎⁎ 3.582⁎⁎⁎ 3.527⁎⁎⁎
[6.518] [6.729] [6.563]Global measure of country
growth opportunities0.300⁎⁎⁎ 0.299⁎⁎⁎
[5.937] [5.903]
No. of observations 999 838 741 797 681 681No. of countries 77 73 55 71 49 49Overall R-squared 0.150 0.175 0.197 0.233 0.281 0.292
(continued on next page)
329S. Claessens et al. / Journal of Empirical Finance 13 (2006) 316–350
Capital raised domestically/GDP
(1) (2) (3) (4) (5) (6)
Log of GDP per capita 0.011⁎⁎⁎ 0.006⁎⁎⁎ 0.002 0.002 0.000 0.000[3.727] [3.140] [1.151] [1.301] [0.172] [0.236]
Law and order −0.007⁎⁎⁎ −0.002⁎⁎ −0.002⁎⁎ −0.002⁎ −0.002⁎ −0.002⁎[3.518] [2.012] [2.185] [1.773] [1.898] [1.881]
English legal origin 0.007⁎
[1.903]Log (1+ inflation) −0.002
[0.595]Government deficit/GDP −0.021 −0.016 −0.011 −0.023 −0.021
[0.993] [0.729] [0.520] [1.063] [0.987]Capital account liberalization 0.007⁎ −0.001
[1.850] [0.462]Stock market liberalization 0.009⁎⁎⁎
[3.165]Total equity flows/GDP
(one year lagged)0.194⁎⁎⁎ 0.181⁎⁎⁎ 0.168⁎⁎⁎
[5.087] [4.734] [4.381]Global measure of country
growth opportunities0.013⁎⁎⁎ 0.013⁎⁎⁎
[3.369] [3.403]
No. of observations 541 468 438 437 414 414No. of countries 43 41 37 39 34 34Overall R-squared 0.034 0.000 0.006 0.051 0.098 0.157
This table shows least square regressions estimated using random effects models for a panel of 78 countries between 1984and 2000. A constant is estimated but not reported. Absolute values of z-statistics are in brackets. ⁎, ⁎⁎, ⁎⁎⁎ meansignificance at ten, five, and one percent, respectively. See Appendix Table 2 for the definition of the variables.
Table 1 (continued )
330 S. Claessens et al. / Journal of Empirical Finance 13 (2006) 316–350
performance. Therefore, as an alternative, we also explored nonlinear effects of inflation ondomestic stock market development. Though not reported in the tables to save space, the resultssuggest that nonlinear effects might be important, although they do not affect the basicconclusions reported here.
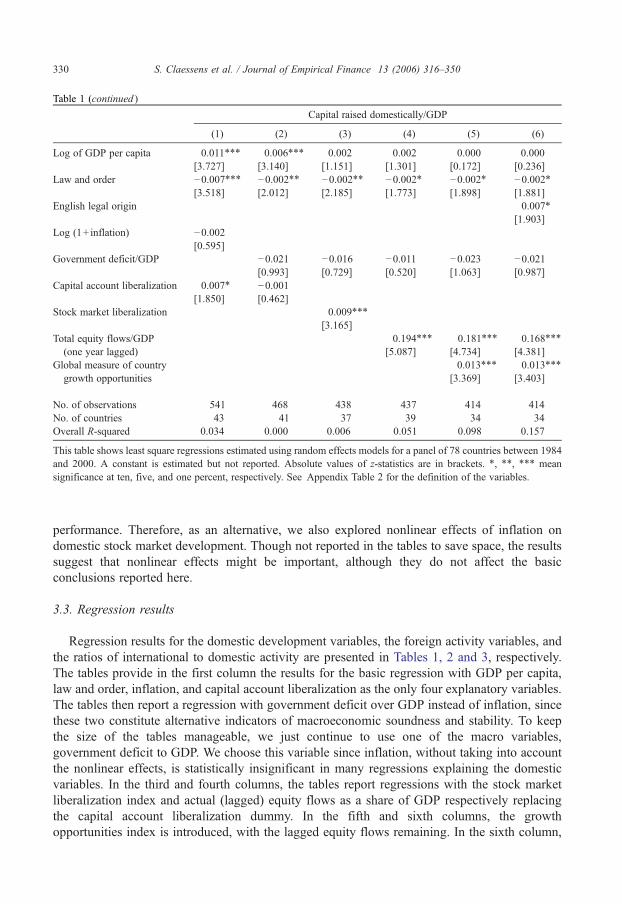
3.3. Regression results
Regression results for the domestic development variables, the foreign activity variables, andthe ratios of international to domestic activity are presented in Tables 1, 2 and 3, respectively.The tables provide in the first column the results for the basic regression with GDP per capita,law and order, inflation, and capital account liberalization as the only four explanatory variables.The tables then report a regression with government deficit over GDP instead of inflation, sincethese two constitute alternative indicators of macroeconomic soundness and stability. To keepthe size of the tables manageable, we just continue to use one of the macro variables,government deficit to GDP. We choose this variable since inflation, without taking into accountthe nonlinear effects, is statistically insignificant in many regressions explaining the domesticvariables. In the third and fourth columns, the tables report regressions with the stock marketliberalization index and actual (lagged) equity flows as a share of GDP respectively replacingthe capital account liberalization dummy. In the fifth and sixth columns, the growthopportunities index is introduced, with the lagged equity flows remaining. In the sixth column,
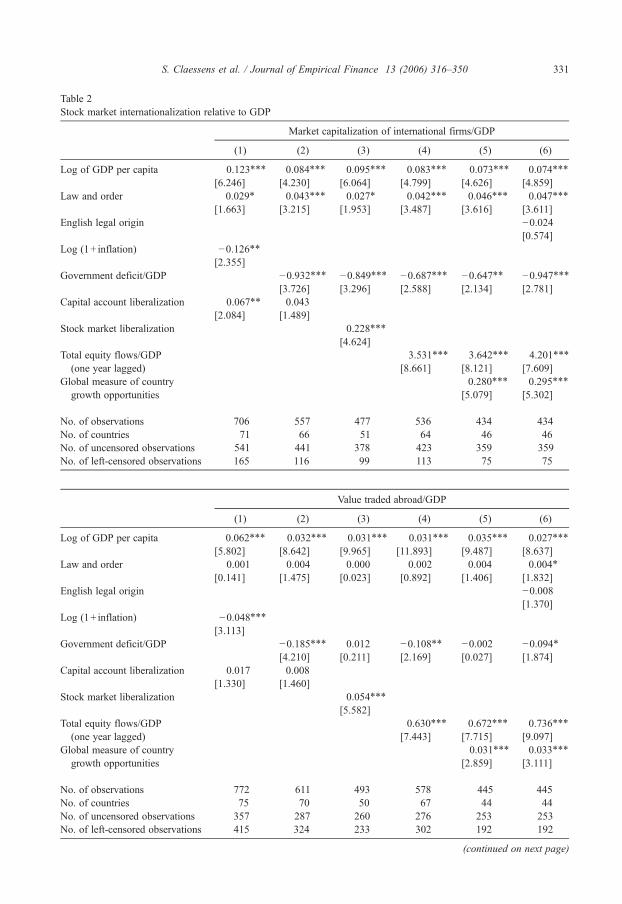
Table 2Stock market internationalization relative to GDP
Market capitalization of international firms/GDP
(1) (2) (3) (4) (5) (6)
Log of GDP per capita 0.123⁎⁎⁎ 0.084⁎⁎⁎ 0.095⁎⁎⁎ 0.083⁎⁎⁎ 0.073⁎⁎⁎ 0.074⁎⁎⁎
[6.246] [4.230] [6.064] [4.799] [4.626] [4.859]Law and order 0.029⁎ 0.043⁎⁎⁎ 0.027⁎ 0.042⁎⁎⁎ 0.046⁎⁎⁎ 0.047⁎⁎⁎
[1.663] [3.215] [1.953] [3.487] [3.616] [3.611]English legal origin −0.024
[0.574]Log (1+ inflation) −0.126⁎⁎
[2.355]Government deficit/GDP −0.932⁎⁎⁎ −0.849⁎⁎⁎ −0.687⁎⁎⁎ −0.647⁎⁎ −0.947⁎⁎⁎
[3.726] [3.296] [2.588] [2.134] [2.781]Capital account liberalization 0.067⁎⁎ 0.043
[2.084] [1.489]Stock market liberalization 0.228⁎⁎⁎
[4.624]Total equity flows/GDP
(one year lagged)3.531⁎⁎⁎ 3.642⁎⁎⁎ 4.201⁎⁎⁎
[8.661] [8.121] [7.609]Global measure of country
growth opportunities0.280⁎⁎⁎ 0.295⁎⁎⁎
[5.079] [5.302]
No. of observations 706 557 477 536 434 434No. of countries 71 66 51 64 46 46No. of uncensored observations 541 441 378 423 359 359No. of left-censored observations 165 116 99 113 75 75
Value traded abroad/GDP
(1) (2) (3) (4) (5) (6)
Log of GDP per capita 0.062⁎⁎⁎ 0.032⁎⁎⁎ 0.031⁎⁎⁎ 0.031⁎⁎⁎ 0.035⁎⁎⁎ 0.027⁎⁎⁎
[5.802] [8.642] [9.965] [11.893] [9.487] [8.637]Law and order 0.001 0.004 0.000 0.002 0.004 0.004⁎
[0.141] [1.475] [0.023] [0.892] [1.406] [1.832]English legal origin −0.008
[1.370]Log (1+ inflation) −0.048⁎⁎⁎
[3.113]Government deficit/GDP −0.185⁎⁎⁎ 0.012 −0.108⁎⁎ −0.002 −0.094⁎
[4.210] [0.211] [2.169] [0.027] [1.874]Capital account liberalization 0.017 0.008
[1.330] [1.460]Stock market liberalization 0.054⁎⁎⁎
[5.582]Total equity flows/GDP
(one year lagged)0.630⁎⁎⁎ 0.672⁎⁎⁎ 0.736⁎⁎⁎
[7.443] [7.715] [9.097]Global measure of country
growth opportunities0.031⁎⁎⁎ 0.033⁎⁎⁎
[2.859] [3.111]
No. of observations 772 611 493 578 445 445No. of countries 75 70 50 67 44 44No. of uncensored observations 357 287 260 276 253 253No. of left-censored observations 415 324 233 302 192 192
(continued on next page)
331S. Claessens et al. / Journal of Empirical Finance 13 (2006) 316–350

Capital raised abroad/GDP
(1) (2) (3) (4) (5) (6)
Log of GDP per capita 0.003⁎⁎⁎ 0.003⁎⁎⁎ 0.002⁎⁎⁎ 0.003⁎⁎⁎ 0.002⁎⁎⁎ 0.002⁎⁎⁎
[6.874] [6.164] [4.686] [5.332] [4.021] [3.945]Law and order 0.001⁎⁎⁎ 0.001⁎⁎⁎ 0.000 0.001⁎⁎⁎ 0.001⁎⁎ 0.001⁎⁎
[2.878] [4.040] [0.328] [3.035] [2.334] [2.329]English legal origin 0.000
[0.180]Log (1+ inflation) −0.002
[1.270]Government deficit/GDP −0.017⁎⁎ −0.011 −0.017⁎⁎ −0.014⁎ −0.014⁎
[2.208] [1.459] [2.129] [1.867] [1.855]Capital account liberalization 0.001 0.002⁎⁎
[1.139] [2.104]Stock market liberalization 0.008⁎⁎⁎
[7.258]Total equity flows/GDP
(one year lagged)0.055⁎⁎⁎ 0.044⁎⁎⁎ 0.044⁎⁎⁎
[4.572] [3.265] [3.167]Global measure of country
growth opportunities0.009⁎⁎⁎ 0.009⁎⁎⁎
[5.836] [5.822]
No. of observations 1,056 884 760 825 669 669No. of countries 76 72 53 70 47 47No. of uncensored observations 444 372 326 352 311 311No. of left-censored observations 612 512 434 473 358 358
This table shows Tobit regressions estimated using random effects models for a panel of 78 countries between 1984 and2000. A constant is estimated but not reported. Absolute values of z-statistics are in brackets. ⁎, ⁎⁎, ⁎⁎⁎mean significanceat ten, five, and one percent, respectively. See Appendix Table 2 for the definition of the variables.
Table 2 (continued )
332 S. Claessens et al. / Journal of Empirical Finance 13 (2006) 316–350
we include the English legal origin dummy as a proxy for shareholders rights and the generalquality of the legal system. We discuss the results in turn.
The regression results for the ratio of market capitalization to GDP (Table 1, top panel)indicate that general stock market development in our sample of countries and time period isrelated to the variables in ways already identified in the literature. In particular, GDP percapita, enforcement of laws, and English legal origin are positively associated with stockmarket capitalization, while inflation and government deficits are negatively related to stockmarket development. However, not all variables are always statistically significant, in partbecause the correlations are quite high, such as between GDP per capita and the law and orderindex.20 More financial openness, measured by any of the three indicators (capital accountliberalization, stock market liberalization, and actual equity flows), is also positively related tostock market development (although capital account liberalization is not statistically significantwhen the regression also includes the government deficit). The growth opportunities variableenters positively and significantly in the last two specifications. This positive relation may
20 The correlation between GDP per capita and the law and order index for our sample is 0.75 and is significant at theone percent level. We also estimated these regressions without including GDP per capita and found law and order to besignificant, while the results for the rest of the variables remain mostly the same.

Table 3Stock market internationalization relative to domestic activity
Market capitalization of international firms/total market capitalization
(1) (2) (3) (4) (5) (6)
Log of GDP per capita 0.084⁎⁎⁎ 0.146⁎⁎⁎ 0.181⁎⁎⁎ 0.136⁎⁎⁎ 0.127⁎⁎⁎ 0.130⁎⁎⁎
[6.548] [13.507] [13.257] [14.300] [13.310] [10.728]Law and order 0.032⁎⁎⁎ 0.040⁎⁎⁎ 0.032⁎⁎⁎ 0.051⁎⁎⁎ 0.054⁎⁎⁎ 0.042⁎⁎⁎
[2.981] [4.519] [3.237] [5.606] [5.645] [4.285]English legal origin 0.046⁎⁎
[2.006]Log (1+ inflation) −0.214⁎⁎⁎
[7.686]Government deficit/GDP −0.670⁎⁎⁎ 0.259 −0.223 −0.253 0.281
[3.719] [1.410] [0.789] [1.200] [1.371]Capital account liberalization 0.075⁎⁎⁎ 0.058⁎⁎⁎
[3.177] [3.032]Stock market liberalization 0.211⁎⁎⁎
[5.930]Total equity flows/GDP
(one year lagged)3.217⁎⁎⁎ 2.868⁎⁎⁎ 2.609⁎⁎⁎
[9.976] [8.697] [7.684]Global measure of country
growth opportunities0.194⁎⁎⁎ 0.190⁎⁎⁎
[4.488] [4.509]
No. of observations 682 525 461 516 419 419No. of countries 71 65 51 64 45 45No. of uncensored observations 535 426 372 417 44 344No. of left-censored observations 147 99 89 99 75 75
Value traded abroad/value traded domestically
(1) (2) (3) (4) (5) (6)
Log of GDP per capita 0.308⁎⁎⁎ 0.458⁎⁎⁎ 0.398⁎⁎⁎ 0.345⁎⁎⁎ 0.370⁎⁎⁎ 0.272⁎⁎⁎
[5.420] [8.370] [9.438] [11.280] [9.191] [5.909]Law and order 0.052 0.113⁎⁎⁎ −0.027 0.102⁎⁎⁎ 0.011 0.050
[1.455] [2.644] [0.879] [4.088] [0.428] [1.267]English legal origin −0.187
[1.460]Log (1+ inflation) −0.447⁎⁎⁎
[4.764]Government deficit/GDP −0.045 2.046⁎⁎⁎ 1.746⁎⁎ 1.991⁎⁎⁎ 1.781⁎⁎
[0.049] [3.649] [2.336] [3.416] [2.201]Capital account liberalization 0.155 0.130
[1.625] [1.217]Stock market liberalization 0.607⁎⁎⁎
[5.425]Total equity flows/GDP
(one year lagged)5.421⁎⁎⁎ 6.048⁎⁎⁎ 5.390⁎⁎⁎
[6.099] [6.435] [4.930]Global measure of country
growth opportunities0.149 0.177
[1.179] [1.276]
No. of observations 720 571 470 546 438 438No. of countries 73 67 49 65 44 44No. of uncensored observations 345 282 255 271 248 248No. of left-censored observations 375 289 215 275 190 190
(continued on next page)
333S. Claessens et al. / Journal of Empirical Finance 13 (2006) 316–350
Capital raised abroad/capital raised domestically
(1) (2) (3) (4) (5) (6)
Log of GDP per capita 0.287⁎⁎⁎ 0.308⁎⁎⁎ 0.298⁎⁎⁎ 0.310⁎⁎⁎ 0.272⁎⁎⁎ 0.269⁎⁎⁎
[3.656] [3.572] [3.356] [3.927] [3.272] [3.207]Law and order −0.087 −0.082 −0.155⁎⁎ −0.084 −0.051 −0.051
[1.540] [1.221] [2.039] [1.369] [0.781] [0.771]English legal origin −0.071
[0.545]Log (1+ inflation) −0.185
[1.280]Government deficit/GDP −2.903⁎⁎ −2.353⁎ −0.976 −1.150 −1.206
[2.228] [1.687] [0.678] [0.803] [0.838]Capital account liberalization 0.119 0.106
[1.025] [0.797]Stock market liberalization 0.789⁎⁎⁎
[3.430]Total equity flows/GDP
(one year lagged)7.558⁎⁎⁎ 5.769⁎⁎ 6.059⁎⁎⁎
[3.354] [2.528] [2.581]Global measure of country
growth opportunities0.884⁎⁎⁎ 0.883⁎⁎⁎
[2.947] [2.942]
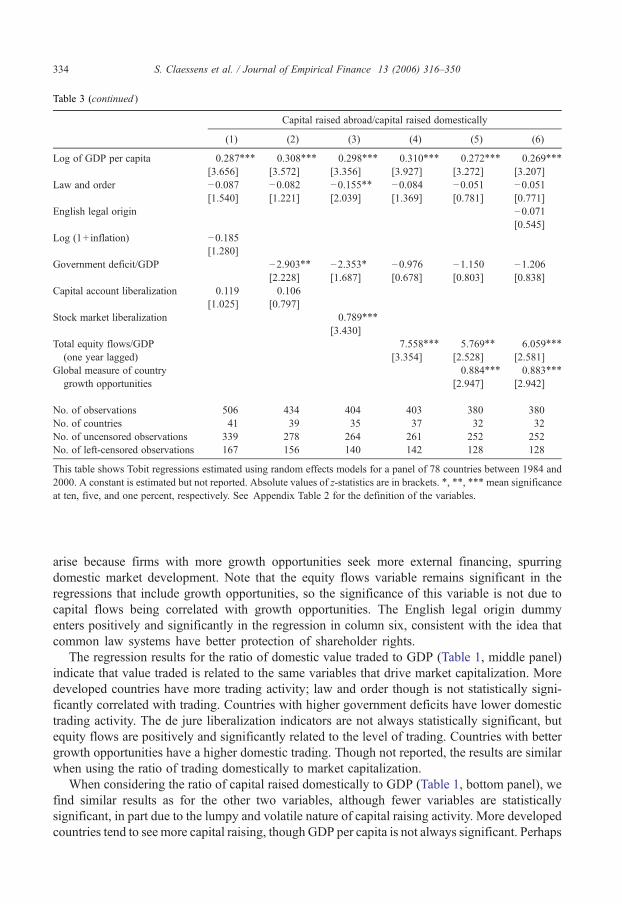
No. of observations 506 434 404 403 380 380No. of countries 41 39 35 37 32 32No. of uncensored observations 339 278 264 261 252 252No. of left-censored observations 167 156 140 142 128 128
This table shows Tobit regressions estimated using random effects models for a panel of 78 countries between 1984 and2000. A constant is estimated but not reported. Absolute values of z-statistics are in brackets. ⁎, ⁎⁎, ⁎⁎⁎mean significanceat ten, five, and one percent, respectively. See Appendix Table 2 for the definition of the variables.
Table 3 (continued )
334 S. Claessens et al. / Journal of Empirical Finance 13 (2006) 316–350
arise because firms with more growth opportunities seek more external financing, spurringdomestic market development. Note that the equity flows variable remains significant in theregressions that include growth opportunities, so the significance of this variable is not due tocapital flows being correlated with growth opportunities. The English legal origin dummyenters positively and significantly in the regression in column six, consistent with the idea thatcommon law systems have better protection of shareholder rights.
The regression results for the ratio of domestic value traded to GDP (Table 1, middle panel)indicate that value traded is related to the same variables that drive market capitalization. Moredeveloped countries have more trading activity; law and order though is not statistically signi-ficantly correlated with trading. Countries with higher government deficits have lower domestictrading activity. The de jure liberalization indicators are not always statistically significant, butequity flows are positively and significantly related to the level of trading. Countries with bettergrowth opportunities have a higher domestic trading. Though not reported, the results are similarwhen using the ratio of trading domestically to market capitalization.
When considering the ratio of capital raised domestically to GDP (Table 1, bottom panel), wefind similar results as for the other two variables, although fewer variables are statisticallysignificant, in part due to the lumpy and volatile nature of capital raising activity. More developedcountries tend to see more capital raising, though GDP per capita is not always significant. Perhaps

335S. Claessens et al. / Journal of Empirical Finance 13 (2006) 316–350
surprisingly, the law and order variable is statistically significant and negative in severalspecifications, although this seems to be driven by a few countries, such as South Africa,Philippines, Indonesia, Thailand, and Malaysia, that have very high values of capital raiseddomestically over GDP and relatively low values of law and order. Furthermore, the governmentdeficit over GDP is not statistically significant. Capital account and stock market liberalization aswell as equity flows, when statistically significant, are positively related to capital raised over GDP.The growth opportunities index is statistically significant and positive, whereas the English legalorigin variable, a proxy for shareholders right, is positive and significant (although only at the tenpercent level) in the last regression.
The Tobit regression results for the ratio of market capitalization of international firms to GDPare shown in the top panel of Table 2. The results indicate that the degree of internationalization isrelated to some of the same factors that are correlated with domestic stock market development. Inparticular, GDP per capita and law and order are positively associated with the market capi-talization of international firms. On the other hand, more inflation and larger government deficitsare correlated with lower relative market capitalization of international firms, again consistentlyso. The different measures of financial openness–the capital account and stock marketliberalization indexes as well as the ratio of equity capital flows to GDP–are in a consistentlypositive manner related to the ratio of market capitalization of international firms to GDP. Thegrowth opportunities index is strongly related to the market capitalization of international firms,but the legal origin dummy is not statistically significant.
The value of trading abroad relative to GDP also increases with the level of economicdevelopment (Table 2, middle panel). Law and order are, however, not statistically significant.Higher inflation and government deficits are negatively related to the value of shares traded abroad,being statistically significant in some specifications. Financial openness,measured by capital accountand stock market liberalization and equity flows, is positively related to value traded abroad, but thecapital account liberalization index is not statistically significant. Growth opportunities are alsopositively related to trading abroad, but the legal origin dummy is again not statistically significant.
The amount of capital raised abroad to GDP is also a function of similar factors (Table 2,bottom panel). The more developed the economy and the higher the law and order index, thegreater the amount of capital raised abroad relative to GDP. Furthermore, the degree of financialopenness is positively associated with capital raised abroad. Growth opportunities seem to inducefirms to raise capital in international equity markets.
In sum, the results suggest that, in general, internationalization is related to the same economicfundamentals that correlate with the development of domestic stock markets, and in the samedirection. Higher income, greater macroeconomic stability (associated with lower inflation andreduced fiscal deficits), stronger legal systems, more financial openness, and better growthopportunities are all positively related with both domestic stock market development andinternationalization relative to GDP. In other words, better economic fundamentals seem to helpdevelop local markets, but also increase internationalization.
These findings are at odds with the hypothesis that countries with worse fundamentals are theones that see firms seeking stock exchange activities in international markets. Rather, thesefindings support the view that better fundamentals facilitate both domestic stock marketdevelopment as well as access to foreign markets, with firms being able to attract foreign capitalas their countries become more attractive. The role of foreign investment as a demand factor ishighlighted by the fact that, after controlling for the level of development, institutions,macroeconomic indicators, and growth opportunities, equity flows are consistently positively andsignificantly correlated with all the indicators of stock market internationalization.
336 S. Claessens et al. / Journal of Empirical Finance 13 (2006) 316–350
Though the results above show that the factors that are related to domestic stock marketdevelopment are also related in the same direction to internationalization, the estimated coefficientsdo not reveal whether domestic stock market development and internationalization are similarlysensitive to fundamentals. The difficulty in comparing the coefficients comes in part from the factthat we use different samples and different models to estimate the two processes (a linear estimationand a Tobit one, respectively). To measure how economic fundamentals are related tointernationalization relative to how they are related to domestic stock market development, wenext study the ratio of foreign activity to domestic activity, e.g., the ratio of market capitalization ofinternational firms to total market capitalization. If the two variables, foreign and domestic activity,are related in a similar way and to the same degree to the independent variables we use, then thesevariables should not affect the degree of internationalization and the coefficientswill be insignificant.
The regression results for the ratio of market capitalization of international firms to total domesticmarket capitalization (Table 3, top panel) indicate that the degree of internationalization is alsorelated to fundamentals, and in a similar way. In particular, GDP per capita and enforcement of lawsare positively and statistically significantly associated with the ratio of the market capitalization ofinternational firms to total market capitalization. English legal origin is statistically significant andpositive, suggesting that countries with better legal systems are more attractive to investors ininternational financial centers and thus see relatively more internationalization of their stock marketactivity. Inflation and fiscal deficit (the latter only in one specification) have a negative andstatistically significant effect on this ratio. Capital account openness, stock market liberalization, andlagged equity flows are associated with greater internationalization. This positive sign is perhapssurprising: most countries opened their financial systems with the intention of attracting foreigninvestment and developing their own local financial markets, not to see their firms migrate tointernational financialmarkets. Growth opportunities positively affect the ratio, suggesting that firmswith greater growth opportunities tend to go abroad.
These findings imply that, while stock market development and the degree of internationalizationare related to the same fundamentals, improvements in these fundamentals seem to accelerateinternationalization more. Specifically, increases in GDP per capita, reductions in inflation,improvements in legal institutions, and more openness–in terms of rules and actual integration–appear to affect international activitymore, leading to an increase in the share ofmarket capitalizationlisted abroad. Particularly interesting is the statistically significant positive coefficient of the growthopportunities variable, which suggests that firms from countries with better growth opportunitiesseek out international markets relatively more than domestic ones, perhaps due to the inability ofdomestic markets to finance those opportunities at a relatively low cost.
The ratio of value traded abroad to value traded domestically shows a similar pattern, increasingwith the level of economic development, law and order, and financial openness (Table 3, middlepanel). Inflation is also negatively related to the relative value traded abroad. The English legalorigin dummy is not statistically significant, but stock market liberalization and the ratio of equityflows to GDP are both statistically significant and positive, suggesting that de jure and de factoliberalization facilitates trading abroad relatively more. The growth opportunities variable ispositive, but not statistically significant. Surprisingly, the government deficit, when significant, ispositively related to the value traded abroad. This does not mean that a larger government deficitboosts the trading of local shares in international markets. To the contrary, the results in Table 2show that a larger government deficit seems to be associated with lower trading abroad. The resultsin Table 3 rather suggest that government deficits have a greater negative impact on domestic valuetraded, i.e., a greater government deficit crowds out domestic market trading more thaninternational trading.

337S. Claessens et al. / Journal of Empirical Finance 13 (2006) 316–350
Finally, we find that the more developed the economy, the greater the ratio of capital raisedabroad to capital raised domestically (Table 3, bottom panel). Government deficit is onlystatistically significant with a negative coefficient in two specifications. Stock market libe-ralization and equity flows are significant and positive in all specifications, suggesting that a moreopen environment makes it relatively easier to raise capital abroad. Growth opportunities alsopositively affect the degree of capital raising abroad. The regression results on capital raised,however, are not as consistent as the other regressions. Again, the lack of significance of many ofthe variables may be explained by the fact that the ratio of capital raised abroad to capital raiseddomestically is very volatile from year to year, partly due to the lumpy nature of capital raising,with individual issues greatly impacting the ratio. But, it could also reflect that capital raisingdomestically and abroad are not distinctly affected by the economic fundamentals considered.
4. Robustness tests and extensions
The results reported in Section 3 suggest that the variables that affect the development of domesticcapital markets also tend to influence the internationalization process, and in the same direction.Moreover, their effects on internationalization seem to be stronger. While the results tend to beconsistent across specifications, there is variation across regressions due to a number of factors. Tostart, there is multicollinearity among some of the explanatory variables. Also, the data coveragechanges across specifications. Furthermore, different variables may capture different aspects of therelations. In this section, we report additional estimations that shed more light on the results.
We conduct four additional tests to check the robustness of the previous estimates andcomplement them. First, we investigate whether the unbalanced nature of the data makes for anydifferences. Second, we directly test the hypothesis that the degree of internationalization isdriven by past local market development. Third, we use additional explanatory variables. Fourth,we analyze whether the estimation technique affects the results.
In the previous section, we use unbalanced panels in the regressions, as data for some countriesare not available for the whole period. This means that we are comparing somewhat differentgroups of countries over time, which could affect our results. We now report regressions using abalanced panel for each specification, such that for each regression we have the same group ofcountries with observations for all years, but the country coverage is still different acrossspecifications.21 Since our main focus is the relative degree of internationalization, we report onlythe results for the ratio of international market activity to local market activity using a balancedpanel. The results are shown in Table 4.22
The regression results are generally robust to the use of balanced panels. Variables like GDPper capita, law and order, English legal origin, the various liberalization indicators, and growthopportunities remain statistically significant and positive in explaining the ratio of marketcapitalization of international firms to total market capitalization. Inflation remains statisticallysignificant and negative, although government deficit is statistically significant only in two
21 We allow the country coverage to vary across specifications to maximize the number of observations. Also note thatto increase the number of countries with observations for every year, we combined the data on fiscal deficit from theWorld Bank World Development Indicators (WDI), which we use in the regressions presented in Tables 1–3, with datafrom the IMF International Financial Statistics (IFS) and World Economic Outlook (WEO). The reason is that the WDIdatabase has missing data for fiscal deficit for many countries after 1998. Still, even when combining these sources, thesample in the regressions is reduced to a maximum of only 29 countries.22 We also estimated the regressions for domestic and international activity relative to GDP using a balanced panel andfound the results to be robust to this change.

Table 4Stock market internationalization relative to domestic activity — balanced panel
Market capitalization of international firms/total market capitalization
(1) (2) (3) (4) (5) (6)
Log of GDP per capita 0.132⁎⁎⁎ 0.240⁎⁎⁎ 0.175⁎⁎⁎ 0.155⁎⁎⁎ 0.182⁎⁎⁎ 0.187⁎⁎⁎
[11.028] [17.588] [10.851] [12.496] [13.016] [12.480]Law and order 0.029⁎⁎ 0.054⁎⁎⁎ 0.055⁎⁎⁎ 0.072⁎⁎⁎ 0.053⁎⁎⁎ 0.050⁎⁎⁎
[2.560] [4.979] [3.807] [6.229] [4.570] [4.332]English legal origin 0.123⁎⁎⁎
[5.094]Log (1+ inflation) −0.154⁎⁎⁎
[6.750]Government deficit/GDP −0.829⁎⁎⁎ −0.438⁎ −0.123 −0.224 0.258
[4.189] [1.953] [0.509] [0.773] [1.196]Capital account liberalization 0.052⁎⁎ 0.097⁎⁎⁎
[2.433] [4.518]Stock market liberalization 0.183⁎⁎⁎
[3.555]Total equity flows/GDP
(one year lagged)2.687⁎⁎⁎ 2.400⁎⁎⁎ 2.015⁎⁎⁎
[8.901] [8.423] [6.997]Global measure of country
growth opportunities0.240⁎⁎⁎ 0.231⁎⁎⁎
[5.293] [5.235]
No. of observations 408 336 336 312 312 312No. of countries 34 28 28 26 26 26No. of uncensored observations 320 286 286 270 267 267No. of left-censored observations 88 50 50 42 45 45
Value traded abroad/value traded domestically
(1) (2) (3) (4) (5) (6)
Log of GDP per capita 0.331⁎⁎⁎ 0.287⁎⁎⁎ 0.354⁎⁎⁎ 0.383⁎⁎⁎ 0.302⁎⁎⁎ 0.420⁎⁎⁎
[5.346] [3.626] [7.123] [7.045] [6.090] [7.695]Law and order 0.130⁎⁎⁎ 0.161⁎⁎⁎ 0.056 0.148⁎⁎⁎ 0.160⁎⁎⁎ 0.128⁎⁎⁎
[2.732] [2.939] [1.596] [4.085] [5.068] [3.917]English legal origin −0.738⁎⁎⁎
[8.855]Log (1+ inflation) −0.359⁎⁎⁎
[3.440]Government deficit/GDP −0.888 1.507⁎⁎ 1.563⁎ 1.727⁎⁎ 1.762⁎⁎
[0.910] [2.534] [1.772] [2.431] [2.413]Capital account liberalization 0.161⁎ 0.226⁎⁎
[1.755] [2.314]Stock market liberalization 0.387⁎⁎⁎
[3.313]Total equity flows/GDP
(one year lagged)3.004⁎⁎⁎ 4.601⁎⁎⁎ 3.579⁎⁎⁎
[2.991] [5.321] [3.917]Global measure of country
growth opportunities0.036 0.076
[0.264] [0.561]
No. of observations 516 420 408 348 348 348No. of countries 43 35 34 29 29 29No. of uncensored observations 279 275 263 232 225 225No. of left-censored observations 237 145 145 116 123 123
338 S. Claessens et al. / Journal of Empirical Finance 13 (2006) 316–350
Capital raised abroad/capital raised domestically
(1) (2) (3) (4) (5) (6)
Log of GDP per capita 0.532⁎⁎⁎ 0.309⁎ 0.247 0.191 0.105 0.144[3.256] [1.727] [1.609] [1.094] [0.598] [0.811]
Law and order −0.082 −0.062 −0.194⁎ −0.054 −0.031 −0.042[0.885] [0.703] [1.910] [0.574] [0.334] [0.453]
English legal origin 0.215[1.381]
Log (1+ inflation) −0.084[0.345]
Government deficit/GDP 0.334 1.169 3.412 3.005 2.393[0.176] [0.621] [1.550] [1.378] [1.079]
Capital account liberalization −0.012 0.064[0.067] [0.366]
Stock market liberalization 0.864⁎⁎⁎
[2.723]Total equity flows/GDP
(one year lagged)6.647⁎⁎ 5.149⁎ 4.781⁎
[2.536] [1.937] [1.794]Global measure of country
growth opportunities0.938⁎⁎ 0.964⁎⁎
[2.405] [2.474]
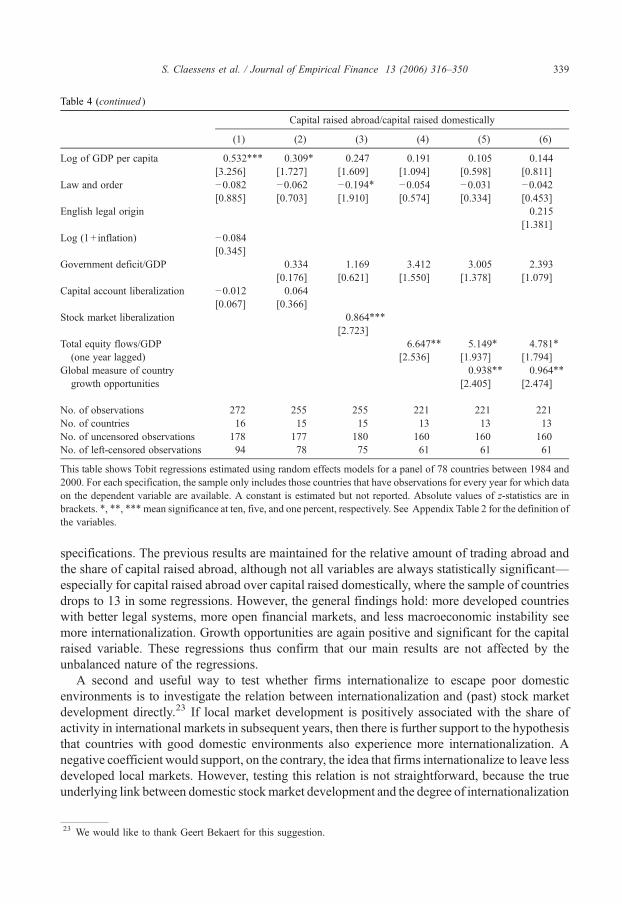
No. of observations 272 255 255 221 221 221No. of countries 16 15 15 13 13 13No. of uncensored observations 178 177 180 160 160 160No. of left-censored observations 94 78 75 61 61 61
This table shows Tobit regressions estimated using random effects models for a panel of 78 countries between 1984 and2000. For each specification, the sample only includes those countries that have observations for every year for which dataon the dependent variable are available. A constant is estimated but not reported. Absolute values of z-statistics are inbrackets. ⁎, ⁎⁎, ⁎⁎⁎mean significance at ten, five, and one percent, respectively. See Appendix Table 2 for the definition ofthe variables.
Table 4 (continued )
339S. Claessens et al. / Journal of Empirical Finance 13 (2006) 316–350
specifications. The previous results are maintained for the relative amount of trading abroad andthe share of capital raised abroad, although not all variables are always statistically significant—especially for capital raised abroad over capital raised domestically, where the sample of countriesdrops to 13 in some regressions. However, the general findings hold: more developed countrieswith better legal systems, more open financial markets, and less macroeconomic instability seemore internationalization. Growth opportunities are again positive and significant for the capitalraised variable. These regressions thus confirm that our main results are not affected by theunbalanced nature of the regressions.
A second and useful way to test whether firms internationalize to escape poor domesticenvironments is to investigate the relation between internationalization and (past) stock marketdevelopment directly.23 If local market development is positively associated with the share ofactivity in international markets in subsequent years, then there is further support to the hypothesisthat countries with good domestic environments also experience more internationalization. Anegative coefficient would support, on the contrary, the idea that firms internationalize to leave lessdeveloped local markets. However, testing this relation is not straightforward, because the trueunderlying link between domestic stockmarket development and the degree of internationalization
23 We would like to thank Geert Bekaert for this suggestion.
340 S. Claessens et al. / Journal of Empirical Finance 13 (2006) 316–350
is not obvious, as countries with more developed markets may see more migration abroad, butstock market development may then be hampered by this internationalization. It is thus difficult tocheck whether one has the right model. We believe that this is an important question for futureresearch that deserves more attention and exceeds the objectives of this paper. Therefore, theresults here should be taken only as a first step to study this relation.
To carry out this new test, we run our regressions for two of our internationalization variables–market capitalization of international firms and value traded abroad as ratios of their respectivedomestic values–controlling for a lagged indicator of domestic market development. Since we usethe lagged domestic market development variable as a regressor, we do not include the factors weused in the other regressions to explain stock market development itself (or internationalization),i.e., we do not include GDP per capita, law and order, and the macroeconomic variables. The onlyvariables we continue to include are the liberalization measures, since even when (lagged) domesticmarket development may drive internationalization, liberalization is a necessary condition toobserve internationalization. As measures of domestic market development, we use either laggedmarket capitalization or lagged value traded, both as a ratio of GDP.24 For these tests we omit thecapital raising variable given its lumpy nature. The results are reported in Table 5.
In the regressions of the degree of internationalization of market capitalization (upper panel) wefind that both lagged domestic stock market development variables are consistently positive andsignificant. In other words, domestic market development is positively associated with subsequentinternationalization, what is consistent with the fact that the same fundamentals that drive domesticstock market development also affect internationalization. The three liberalization variables–capitalaccount liberalization, stock market liberalization, and equity flows–have positive signs and are allstatistically significant. When using the ratio of value traded abroad to value traded domestically(lower panel), the results are maintained, except that the lagged value trade domestically is notalways statistically significant. The liberalization variables remain statistically significant andpositive. The regression results thus confirm that domestic market development tends to bepositively associated with a higher degree of internationalization. Importantly, we never find thatdomestic market development is negatively related to internationalization.
In addition to the control variables used throughout the paper, we also tried alternativevariables that proxy for other macroeconomic and institutional aspects related to stock marketdevelopment and internationalization. The other variables we used include interest ratesdifferentials, degree of corruption, and trading costs. Most of these variables are close proxies tothe variables for which we report regression results and we obtained similar conclusions. Thetrading costs variable was only available for a smaller set of countries and thus reduced the samplesize too much; also, the variable did not turn out to be significant.25 To save space, we do notreport these alternative specifications, but they confirmed the main results reported above.
Finally, we estimated the regressions of domestic market development using fixed effects,instead of random effects, and obtained similar results.26 We also estimated the regressions of
24 The measure of domestic market capitalization we use includes all (domestic and international) firms listed in thelocal market. We include the capitalization of the firms that go abroad as part of the domestic capitalization because thosefirms also list, trade, and raise capital in domestic capital markets. Another alternative would be to use a measure ofdomestic stock market development that includes only those firms that do not internationalize.25 We considered this variable because, in a cross-country study, Domowitz et al. (2001) show that turnover is inverselyrelated to trading costs, providing a possible explanation for the increase in turnover in recent years as direct costs(commissions, fees) have declined.26 We did not estimate Tobit regressions for the internationalization variables using fixed effects because of the difficultyin computing unbiased estimators.

Table 5Stock market internationalization and domestic stock market development
Market capitalization of international firms/total market capitalization
(1) (2) (3) (4) (5) (6) (7) (8)
Market capitalization/GDP (one year lagged) 0.224⁎⁎⁎ 0.222⁎⁎⁎ 0.168⁎⁎⁎ 0.220⁎⁎⁎
[12.376] [13.812] [9.756] [11.917]Value traded domestically/GDP (one year lagged) 0.215⁎⁎⁎ 0.189⁎⁎⁎ 0.184⁎⁎⁎ 0.222⁎⁎⁎
[8.523] [7.654] [9.179] [7.989]Capital account liberalization 0.147⁎⁎⁎ 0.142⁎⁎⁎
[7.865] [8.236]Stock market liberalization 0.318⁎⁎⁎ 0.333⁎⁎⁎
[9.432] [9.746]Total equity flows/GDP (one year lagged) 0.476⁎⁎⁎ 0.728⁎⁎⁎
[2.831] [4.266]
No. of observations 686 678 593 648 689 684 601 630No. of countries 71 71 56 69 72 72 57 68No. of uncensored observations 539 531 462 503 546 541 471 487No. of left-censored observations 147 147 131 145 143 143 130 143
Value traded abroad/value traded domestically
(1) (2) (3) (4) (5) (6) (7) (8)
Market capitalization/GDP (one year lagged) 0.476⁎⁎⁎ 0.412⁎⁎⁎ 0.284⁎⁎⁎ 0.163⁎⁎⁎
[7.944] [9.162] [6.758] [3.046]Value traded domestically/GDP (one year lagged) 0.176⁎⁎ 0.081 0.084 0.092
[2.441] [0.799] [1.042] [1.155]Capital account liberalization 0.248⁎⁎⁎ 0.208⁎⁎⁎
[3.820] [2.661]Stock market liberalization 0.536⁎⁎⁎ 0.603⁎⁎⁎
[5.561] [6.103]Total equity flows/GDP (one year lagged) 1.475⁎⁎⁎ 1.773⁎⁎⁎
[3.861] [5.173]
No. of observations 737 729 616 692 722 713 612 689No. of countries 76 76 54 73 75 75 54 73No. of uncensored observations 335 346 304 315 342 332 303 315No. of left-censored observations 402 383 312 377 380 381 309 374
This table shows Tobit regressions estimated using random effects models for a panel of 78 countries between 1984 and 2000. A constant is estimated but not reported. Absolute values of z-statistics are inbrackets. ⁎, ⁎⁎, ⁎⁎⁎ mean significance at ten, five, and one percent, respectively. See Appendix Table 2 for the definition of the variables.
341S.
Claessens
etal.
/Journal
ofEmpirical
Finance
13(2006)
316–350

342 S. Claessens et al. / Journal of Empirical Finance 13 (2006) 316–350
internationalization, both relative to GDP and domestic market development, using least squaresestimators with random and fixed effects alternatively (instead of using Tobit estimations). Inmost cases, the signs and significance of the coefficients tend to be consistent across modelspecifications, and in economic terms similar conclusions can be obtained from using thoseestimators.
5. Conclusions
In this paper, we show that the underlying factors affecting the development of local stockmarketsalso drive the internationalization of stock market activities. In particular, we find that, while betterfundamentals are associated with an increase in both domestic activity and internationalization,improvements in country fundamentals tend to have a larger impact on capital raising, listing, andtrading in foreign exchanges, resulting in a higher international activity relative to the domestic one.We also find that greater domestic market development is followed by a larger share of activityabroad.
The findings that the processes of local stock market development and internationalizationare driven by the same factors and that domestic market development is associated withsubsequent internationalization are not consistent with the view that countries with badfundamentals should see relatively more internationalization (and less local market de-velopment). They rather support the view that access to international markets depends in part oninvestors' assessment of the home country environment, and that better fundamentals makefirms more attractive to investors in international markets. As such, they imply for one that otherfactors, aside from those mentioned in the bonding and related literature, are important indriving the process of internationalization. Moreover, our results suggest that, while countriesmay worry about internationalization, this process may be a natural part of their overalleconomic and institutional development, including opening to international markets. This raisesquestions with important policy implications.
One key policy concern of the internationalization process is that it may affect domestic stockmarket development adversely as too little activity remains at home, exhibiting a potential viciouscycle. With liquidity agglomerating in one market, a process of improved fundamentals andincreased internationalization may have negative spillover effects on domestic markets, providinginternational markets an even greater advantage.27 Large-scale internationalization may thusmake it more difficult to sustain fully fledged local stock exchanges. This may not be a concernfor the larger corporations that are likely to be driving the process of internationalization in anycase. But many medium-sized firms may not be able to go directly overseas and may find itdifficult to obtain equity financing when domestic markets shrink. This phenomenon would havemajor implications for such firms.
To conclude, several extensions could complement the analysis conducted in this paper.Although we used as explanatory variables what we believe are the main drivers of stock marketdevelopment and internationalization as identified in the literature, we did not explore all thevariables mentioned in previous papers. Others, for example, have identified time zone
27 Karolyi (2004) and Moel (2001) offer evidence on how the use of ADRs is negatively related to local marketdevelopment. Grammig et al. (2005a,b) investigate how the trading of cross-listed stocks affects the relative importanceof price discovery in the home and host markets and find that greater liquidity in the U.S. increases the role for U.S. pricediscovery. Melvin and Valero-Tonone (2004) find a negative price impact of U.S. cross-listings on home-market rivalfirms, particularly in emerging market countries. Levine and Schmukler (2006, in press) analyze the channels throughwhich internationalization appears to negatively affect domestic market trading activity and liquidity.

343S. Claessens et al. / Journal of Empirical Finance 13 (2006) 316–350
differences and similarities in corporate governance and legal framework as affecting theinternationalization process. Also, the quality of the home countries' banking system and otherfinancial markets, as well as infrastructure factors (like the efficiency and reliability of clearingsystems), may be important elements in determining domestic stock market development and (thedegree of) internationalization. Furthermore, there may be specific aspects of the institutionalenvironment that are particularly relevant for domestic market development or for internation-alization, something our general indexes of the legal environment do not address. Finally,although we used individual firm level data to estimate our measures of internationalization, weonly studied domestic stock market development and internationalization at the country level, anddid not study the more micro, individual firm-specific behavior. Clearly, factors such as firm sizeare likely to affect the degree of internationalization. More research in these directions would bewelcomed.
Appendix A
Table 1List of countries by income level
Low-income countries Middle-income countries High-income countries
Armenia Argentina AustraliaAzerbaijan Botswana AustriaBangladesh Brazil BelgiumBulgaria Chile BritainChina Croatia CanadaColombia Czech Republic DenmarkCote D'Ivoire Estonia FinlandEcuador Hungary FranceEgypt Korea GermanyGhana Malaysia GreeceIndia Mexico Hong KongIndonesia Poland IrelandIran Islamic Republic Saudi Arabia IsraelJamaica Slovak Republic ItalyJordan South Africa JapanKazakhstan Trinidad and Tobago LuxembourgKenya Turkey MaltaLatvia Venezuela NetherlandsLithuania New ZealandMoldova NorwayMorocco PortugalNigeria SingaporePakistan SloveniaPeru SpainPhilippines SwedenRomania SwitzerlandRussia TaiwanSri Lanka United StatesThailandTunisiaUkraineZimbabwe
This table shows the list of countries grouped by income level following the classification of the World DevelopmentIndicators, World Bank.
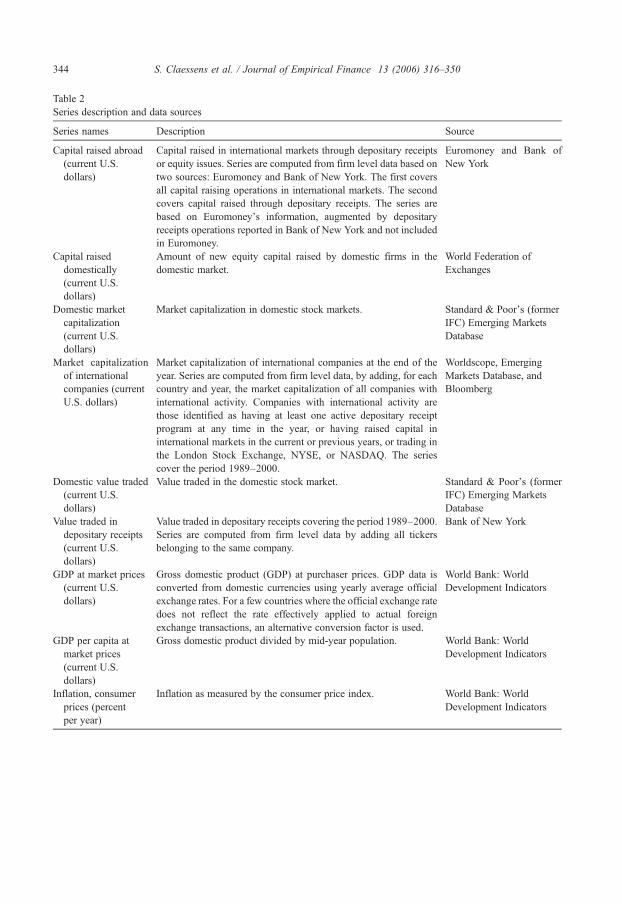
Table 2Series description and data sources
Series names Description Source
Capital raised abroad(current U.S.dollars)
Capital raised in international markets through depositary receiptsor equity issues. Series are computed from firm level data based ontwo sources: Euromoney and Bank of New York. The first coversall capital raising operations in international markets. The secondcovers capital raised through depositary receipts. The series arebased on Euromoney's information, augmented by depositaryreceipts operations reported in Bank of New York and not includedin Euromoney.
Euromoney and Bank ofNew York
Capital raiseddomestically(current U.S.dollars)
Amount of new equity capital raised by domestic firms in thedomestic market.
World Federation ofExchanges
Domestic marketcapitalization(current U.S.dollars)
Market capitalization in domestic stock markets. Standard & Poor's (formerIFC) Emerging MarketsDatabase
Market capitalizationof internationalcompanies (currentU.S. dollars)
Market capitalization of international companies at the end of theyear. Series are computed from firm level data, by adding, for eachcountry and year, the market capitalization of all companies withinternational activity. Companies with international activity arethose identified as having at least one active depositary receiptprogram at any time in the year, or having raised capital ininternational markets in the current or previous years, or trading inthe London Stock Exchange, NYSE, or NASDAQ. The seriescover the period 1989–2000.
Worldscope, EmergingMarkets Database, andBloomberg
Domestic value traded(current U.S.dollars)
Value traded in the domestic stock market. Standard & Poor's (formerIFC) Emerging MarketsDatabase
Value traded indepositary receipts(current U.S.dollars)
Value traded in depositary receipts covering the period 1989–2000.Series are computed from firm level data by adding all tickersbelonging to the same company.
Bank of New York
GDP at market prices(current U.S.dollars)
Gross domestic product (GDP) at purchaser prices. GDP data isconverted from domestic currencies using yearly average officialexchange rates. For a few countries where the official exchange ratedoes not reflect the rate effectively applied to actual foreignexchange transactions, an alternative conversion factor is used.
World Bank: WorldDevelopment Indicators
GDP per capita atmarket prices(current U.S.dollars)
Gross domestic product divided by mid-year population. World Bank: WorldDevelopment Indicators
Inflation, consumerprices (percentper year)
Inflation as measured by the consumer price index. World Bank: WorldDevelopment Indicators
344 S. Claessens et al. / Journal of Empirical Finance 13 (2006) 316–350
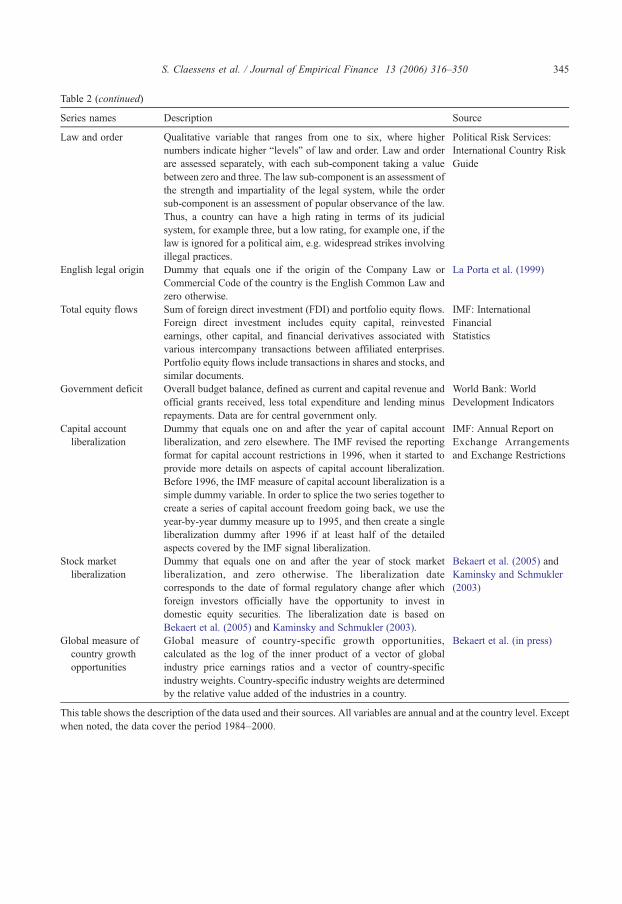
Table 2 (continued)
Series names Description Source
Law and order Qualitative variable that ranges from one to six, where highernumbers indicate higher “levels” of law and order. Law and orderare assessed separately, with each sub-component taking a valuebetween zero and three. The law sub-component is an assessment ofthe strength and impartiality of the legal system, while the ordersub-component is an assessment of popular observance of the law.Thus, a country can have a high rating in terms of its judicialsystem, for example three, but a low rating, for example one, if thelaw is ignored for a political aim, e.g. widespread strikes involvingillegal practices.
Political Risk Services:International Country RiskGuide
English legal origin Dummy that equals one if the origin of the Company Law orCommercial Code of the country is the English Common Law andzero otherwise.
La Porta et al. (1999)
Total equity flows Sum of foreign direct investment (FDI) and portfolio equity flows.Foreign direct investment includes equity capital, reinvestedearnings, other capital, and financial derivatives associated withvarious intercompany transactions between affiliated enterprises.Portfolio equity flows include transactions in shares and stocks, andsimilar documents.
IMF: InternationalFinancialStatistics
Government deficit Overall budget balance, defined as current and capital revenue andofficial grants received, less total expenditure and lending minusrepayments. Data are for central government only.
World Bank: WorldDevelopment Indicators
Capital accountliberalization
Dummy that equals one on and after the year of capital accountliberalization, and zero elsewhere. The IMF revised the reportingformat for capital account restrictions in 1996, when it started toprovide more details on aspects of capital account liberalization.Before 1996, the IMF measure of capital account liberalization is asimple dummy variable. In order to splice the two series together tocreate a series of capital account freedom going back, we use theyear-by-year dummy measure up to 1995, and then create a singleliberalization dummy after 1996 if at least half of the detailedaspects covered by the IMF signal liberalization.
IMF: Annual Report onExchange Arrangementsand Exchange Restrictions
Stock marketliberalization
Dummy that equals one on and after the year of stock marketliberalization, and zero otherwise. The liberalization datecorresponds to the date of formal regulatory change after whichforeign investors officially have the opportunity to invest indomestic equity securities. The liberalization date is based onBekaert et al. (2005) and Kaminsky and Schmukler (2003).
Bekaert et al. (2005) andKaminsky and Schmukler(2003)
Global measure ofcountry growthopportunities
Global measure of country-specific growth opportunities,calculated as the log of the inner product of a vector of globalindustry price earnings ratios and a vector of country-specificindustry weights. Country-specific industry weights are determinedby the relative value added of the industries in a country.
Bekaert et al. (in press)
This table shows the description of the data used and their sources. All variables are annual and at the country level. Exceptwhen noted, the data cover the period 1984–2000.
345S. Claessens et al. / Journal of Empirical Finance 13 (2006) 316–350
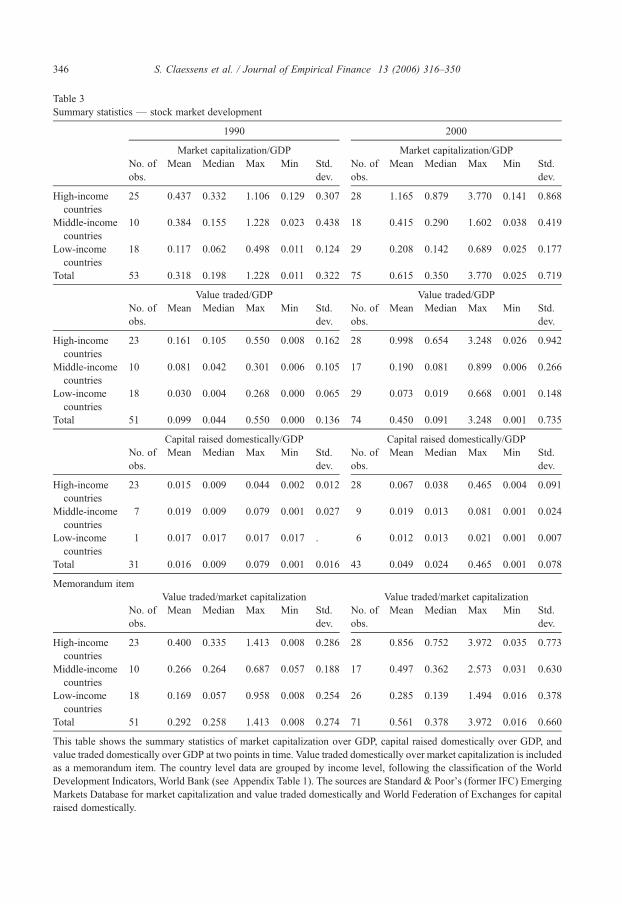
Table 3Summary statistics — stock market development
1990 2000
Market capitalization/GDP Market capitalization/GDPNo. ofobs.
Mean Median Max Min Std.dev.
No. ofobs.
Mean Median Max Min Std.dev.
High-incomecountries
25 0.437 0.332 1.106 0.129 0.307 28 1.165 0.879 3.770 0.141 0.868
Middle-incomecountries
10 0.384 0.155 1.228 0.023 0.438 18 0.415 0.290 1.602 0.038 0.419
Low-incomecountries
18 0.117 0.062 0.498 0.011 0.124 29 0.208 0.142 0.689 0.025 0.177
Total 53 0.318 0.198 1.228 0.011 0.322 75 0.615 0.350 3.770 0.025 0.719
Value traded/GDP Value traded/GDPNo. ofobs.
Mean Median Max Min Std.dev.
No. ofobs.
Mean Median Max Min Std.dev.
High-incomecountries
23 0.161 0.105 0.550 0.008 0.162 28 0.998 0.654 3.248 0.026 0.942
Middle-incomecountries
10 0.081 0.042 0.301 0.006 0.105 17 0.190 0.081 0.899 0.006 0.266
Low-incomecountries
18 0.030 0.004 0.268 0.000 0.065 29 0.073 0.019 0.668 0.001 0.148
Total 51 0.099 0.044 0.550 0.000 0.136 74 0.450 0.091 3.248 0.001 0.735
Capital raised domestically/GDP Capital raised domestically/GDPNo. ofobs.
Mean Median Max Min Std.dev.
No. ofobs.
Mean Median Max Min Std.dev.
High-incomecountries
23 0.015 0.009 0.044 0.002 0.012 28 0.067 0.038 0.465 0.004 0.091
Middle-incomecountries
7 0.019 0.009 0.079 0.001 0.027 9 0.019 0.013 0.081 0.001 0.024
Low-incomecountries
1 0.017 0.017 0.017 0.017 . 6 0.012 0.013 0.021 0.001 0.007
Total 31 0.016 0.009 0.079 0.001 0.016 43 0.049 0.024 0.465 0.001 0.078
Memorandum itemValue traded/market capitalization Value traded/market capitalization
No. ofobs.
Mean Median Max Min Std.dev.
No. ofobs.
Mean Median Max Min Std.dev.
High-incomecountries
23 0.400 0.335 1.413 0.008 0.286 28 0.856 0.752 3.972 0.035 0.773
Middle-incomecountries
10 0.266 0.264 0.687 0.057 0.188 17 0.497 0.362 2.573 0.031 0.630
Low-incomecountries
18 0.169 0.057 0.958 0.008 0.254 26 0.285 0.139 1.494 0.016 0.378
Total 51 0.292 0.258 1.413 0.008 0.274 71 0.561 0.378 3.972 0.016 0.660
This table shows the summary statistics of market capitalization over GDP, capital raised domestically over GDP, andvalue traded domestically over GDP at two points in time. Value traded domestically over market capitalization is includedas a memorandum item. The country level data are grouped by income level, following the classification of the WorldDevelopment Indicators, World Bank (see Appendix Table 1). The sources are Standard & Poor's (former IFC) EmergingMarkets Database for market capitalization and value traded domestically and World Federation of Exchanges for capitalraised domestically.
346 S. Claessens et al. / Journal of Empirical Finance 13 (2006) 316–350
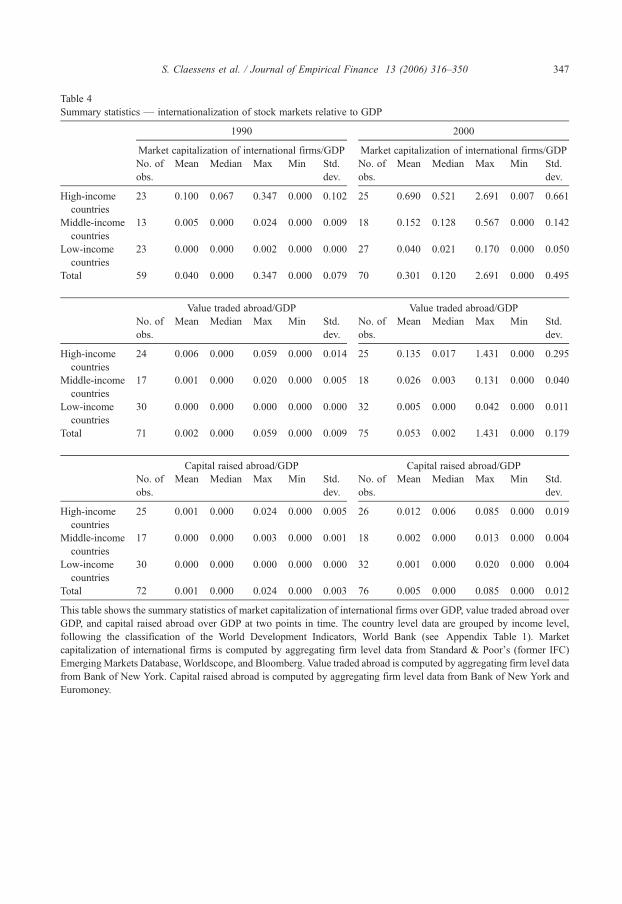
Table 4Summary statistics — internationalization of stock markets relative to GDP
1990 2000
Market capitalization of international firms/GDP Market capitalization of international firms/GDPNo. ofobs.
Mean Median Max Min Std.dev.
No. ofobs.
Mean Median Max Min Std.dev.
High-incomecountries
23 0.100 0.067 0.347 0.000 0.102 25 0.690 0.521 2.691 0.007 0.661
Middle-incomecountries
13 0.005 0.000 0.024 0.000 0.009 18 0.152 0.128 0.567 0.000 0.142
Low-incomecountries
23 0.000 0.000 0.002 0.000 0.000 27 0.040 0.021 0.170 0.000 0.050
Total 59 0.040 0.000 0.347 0.000 0.079 70 0.301 0.120 2.691 0.000 0.495
Value traded abroad/GDP Value traded abroad/GDPNo. ofobs.
Mean Median Max Min Std.dev.
No. ofobs.
Mean Median Max Min Std.dev.
High-incomecountries
24 0.006 0.000 0.059 0.000 0.014 25 0.135 0.017 1.431 0.000 0.295
Middle-incomecountries
17 0.001 0.000 0.020 0.000 0.005 18 0.026 0.003 0.131 0.000 0.040
Low-incomecountries
30 0.000 0.000 0.000 0.000 0.000 32 0.005 0.000 0.042 0.000 0.011
Total 71 0.002 0.000 0.059 0.000 0.009 75 0.053 0.002 1.431 0.000 0.179
Capital raised abroad/GDP Capital raised abroad/GDPNo. ofobs.
Mean Median Max Min Std.dev.
No. ofobs.
Mean Median Max Min Std.dev.
High-incomecountries
25 0.001 0.000 0.024 0.000 0.005 26 0.012 0.006 0.085 0.000 0.019
Middle-incomecountries
17 0.000 0.000 0.003 0.000 0.001 18 0.002 0.000 0.013 0.000 0.004
Low-incomecountries
30 0.000 0.000 0.000 0.000 0.000 32 0.001 0.000 0.020 0.000 0.004
Total 72 0.001 0.000 0.024 0.000 0.003 76 0.005 0.000 0.085 0.000 0.012
This table shows the summary statistics of market capitalization of international firms over GDP, value traded abroad overGDP, and capital raised abroad over GDP at two points in time. The country level data are grouped by income level,following the classification of the World Development Indicators, World Bank (see Appendix Table 1). Marketcapitalization of international firms is computed by aggregating firm level data from Standard & Poor's (former IFC)EmergingMarkets Database, Worldscope, and Bloomberg. Value traded abroad is computed by aggregating firm level datafrom Bank of New York. Capital raised abroad is computed by aggregating firm level data from Bank of New York andEuromoney.
347S. Claessens et al. / Journal of Empirical Finance 13 (2006) 316–350
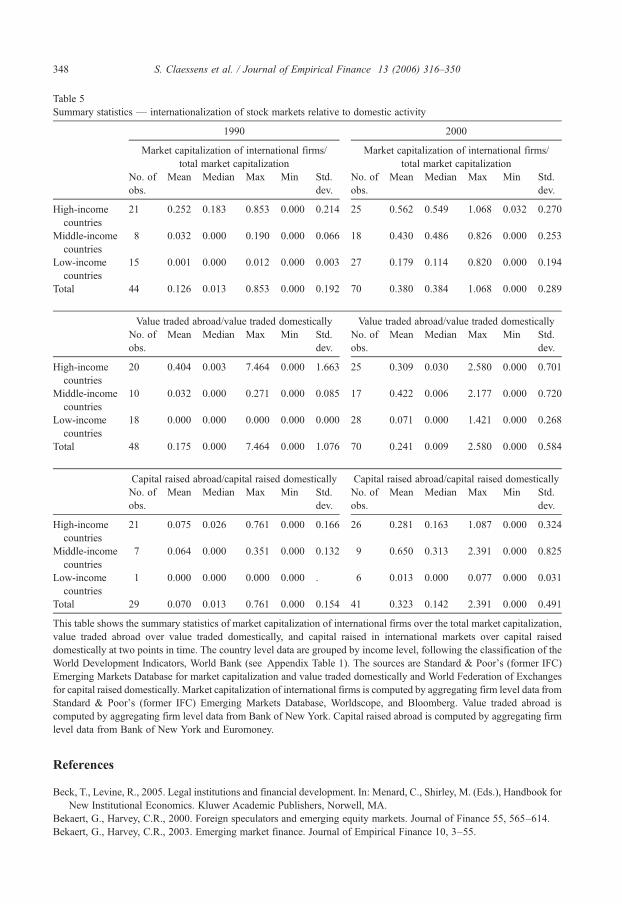
Table 5Summary statistics — internationalization of stock markets relative to domestic activity
1990 2000
Market capitalization of international firms/total market capitalization
Market capitalization of international firms/total market capitalization
No. ofobs.
Mean Median Max Min Std.dev.
No. ofobs.
Mean Median Max Min Std.dev.
High-incomecountries
21 0.252 0.183 0.853 0.000 0.214 25 0.562 0.549 1.068 0.032 0.270
Middle-incomecountries
8 0.032 0.000 0.190 0.000 0.066 18 0.430 0.486 0.826 0.000 0.253
Low-incomecountries
15 0.001 0.000 0.012 0.000 0.003 27 0.179 0.114 0.820 0.000 0.194
Total 44 0.126 0.013 0.853 0.000 0.192 70 0.380 0.384 1.068 0.000 0.289
Value traded abroad/value traded domestically Value traded abroad/value traded domesticallyNo. ofobs.
Mean Median Max Min Std.dev.
No. ofobs.
Mean Median Max Min Std.dev.
High-incomecountries
20 0.404 0.003 7.464 0.000 1.663 25 0.309 0.030 2.580 0.000 0.701
Middle-incomecountries
10 0.032 0.000 0.271 0.000 0.085 17 0.422 0.006 2.177 0.000 0.720
Low-incomecountries
18 0.000 0.000 0.000 0.000 0.000 28 0.071 0.000 1.421 0.000 0.268
Total 48 0.175 0.000 7.464 0.000 1.076 70 0.241 0.009 2.580 0.000 0.584
Capital raised abroad/capital raised domestically Capital raised abroad/capital raised domesticallyNo. ofobs.
Mean Median Max Min Std.dev.
No. ofobs.
Mean Median Max Min Std.dev.
High-incomecountries
21 0.075 0.026 0.761 0.000 0.166 26 0.281 0.163 1.087 0.000 0.324
Middle-incomecountries
7 0.064 0.000 0.351 0.000 0.132 9 0.650 0.313 2.391 0.000 0.825
Low-incomecountries
1 0.000 0.000 0.000 0.000 . 6 0.013 0.000 0.077 0.000 0.031
Total 29 0.070 0.013 0.761 0.000 0.154 41 0.323 0.142 2.391 0.000 0.491
This table shows the summary statistics of market capitalization of international firms over the total market capitalization,value traded abroad over value traded domestically, and capital raised in international markets over capital raiseddomestically at two points in time. The country level data are grouped by income level, following the classification of theWorld Development Indicators, World Bank (see Appendix Table 1). The sources are Standard & Poor's (former IFC)Emerging Markets Database for market capitalization and value traded domestically and World Federation of Exchangesfor capital raised domestically. Market capitalization of international firms is computed by aggregating firm level data fromStandard & Poor's (former IFC) Emerging Markets Database, Worldscope, and Bloomberg. Value traded abroad iscomputed by aggregating firm level data from Bank of New York. Capital raised abroad is computed by aggregating firmlevel data from Bank of New York and Euromoney.
348 S. Claessens et al. / Journal of Empirical Finance 13 (2006) 316–350
References
Beck, T., Levine, R., 2005. Legal institutions and financial development. In: Menard, C., Shirley, M. (Eds.), Handbook forNew Institutional Economics. Kluwer Academic Publishers, Norwell, MA.
Bekaert, G., Harvey, C.R., 2000. Foreign speculators and emerging equity markets. Journal of Finance 55, 565–614.Bekaert, G., Harvey, C.R., 2003. Emerging market finance. Journal of Empirical Finance 10, 3–55.
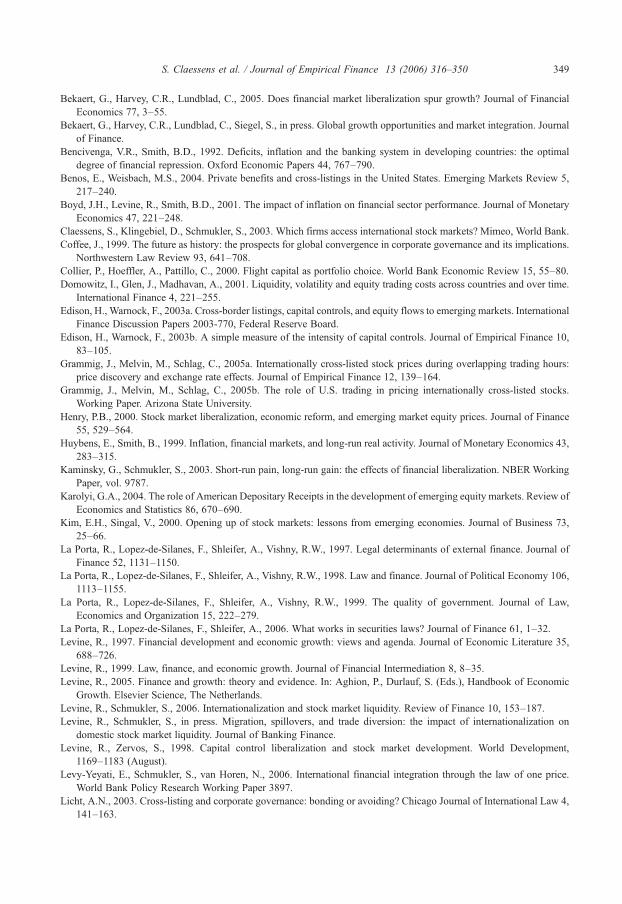
349S. Claessens et al. / Journal of Empirical Finance 13 (2006) 316–350
Bekaert, G., Harvey, C.R., Lundblad, C., 2005. Does financial market liberalization spur growth? Journal of FinancialEconomics 77, 3–55.
Bekaert, G., Harvey, C.R., Lundblad, C., Siegel, S., in press. Global growth opportunities and market integration. Journalof Finance.
Bencivenga, V.R., Smith, B.D., 1992. Deficits, inflation and the banking system in developing countries: the optimaldegree of financial repression. Oxford Economic Papers 44, 767–790.
Benos, E., Weisbach, M.S., 2004. Private benefits and cross-listings in the United States. Emerging Markets Review 5,217–240.
Boyd, J.H., Levine, R., Smith, B.D., 2001. The impact of inflation on financial sector performance. Journal of MonetaryEconomics 47, 221–248.
Claessens, S., Klingebiel, D., Schmukler, S., 2003. Which firms access international stock markets? Mimeo, World Bank.Coffee, J., 1999. The future as history: the prospects for global convergence in corporate governance and its implications.
Northwestern Law Review 93, 641–708.Collier, P., Hoeffler, A., Pattillo, C., 2000. Flight capital as portfolio choice. World Bank Economic Review 15, 55–80.Domowitz, I., Glen, J., Madhavan, A., 2001. Liquidity, volatility and equity trading costs across countries and over time.
International Finance 4, 221–255.Edison, H., Warnock, F., 2003a. Cross-border listings, capital controls, and equity flows to emerging markets. International
Finance Discussion Papers 2003-770, Federal Reserve Board.Edison, H., Warnock, F., 2003b. A simple measure of the intensity of capital controls. Journal of Empirical Finance 10,
83–105.Grammig, J., Melvin, M., Schlag, C., 2005a. Internationally cross-listed stock prices during overlapping trading hours:
price discovery and exchange rate effects. Journal of Empirical Finance 12, 139–164.Grammig, J., Melvin, M., Schlag, C., 2005b. The role of U.S. trading in pricing internationally cross-listed stocks.
Working Paper. Arizona State University.Henry, P.B., 2000. Stock market liberalization, economic reform, and emerging market equity prices. Journal of Finance
55, 529–564.Huybens, E., Smith, B., 1999. Inflation, financial markets, and long-run real activity. Journal of Monetary Economics 43,
283–315.Kaminsky, G., Schmukler, S., 2003. Short-run pain, long-run gain: the effects of financial liberalization. NBERWorking
Paper, vol. 9787.Karolyi, G.A., 2004. The role of American Depositary Receipts in the development of emerging equity markets. Review of
Economics and Statistics 86, 670–690.Kim, E.H., Singal, V., 2000. Opening up of stock markets: lessons from emerging economies. Journal of Business 73,
25–66.La Porta, R., Lopez-de-Silanes, F., Shleifer, A., Vishny, R.W., 1997. Legal determinants of external finance. Journal of
Finance 52, 1131–1150.La Porta, R., Lopez-de-Silanes, F., Shleifer, A., Vishny, R.W., 1998. Law and finance. Journal of Political Economy 106,
1113–1155.La Porta, R., Lopez-de-Silanes, F., Shleifer, A., Vishny, R.W., 1999. The quality of government. Journal of Law,
Economics and Organization 15, 222–279.La Porta, R., Lopez-de-Silanes, F., Shleifer, A., 2006. What works in securities laws? Journal of Finance 61, 1–32.Levine, R., 1997. Financial development and economic growth: views and agenda. Journal of Economic Literature 35,
688–726.Levine, R., 1999. Law, finance, and economic growth. Journal of Financial Intermediation 8, 8–35.Levine, R., 2005. Finance and growth: theory and evidence. In: Aghion, P., Durlauf, S. (Eds.), Handbook of Economic
Growth. Elsevier Science, The Netherlands.Levine, R., Schmukler, S., 2006. Internationalization and stock market liquidity. Review of Finance 10, 153–187.Levine, R., Schmukler, S., in press. Migration, spillovers, and trade diversion: the impact of internationalization on
domestic stock market liquidity. Journal of Banking Finance.Levine, R., Zervos, S., 1998. Capital control liberalization and stock market development. World Development,
1169–1183 (August).Levy-Yeyati, E., Schmukler, S., van Horen, N., 2006. International financial integration through the law of one price.
World Bank Policy Research Working Paper 3897.Licht, A.N., 2003. Cross-listing and corporate governance: bonding or avoiding? Chicago Journal of International Law 4,
141–163.

350 S. Claessens et al. / Journal of Empirical Finance 13 (2006) 316–350
Melvin, M., Valero-Tonone, V., 2004. The effects of international cross-listing on rival firms. Working Paper. ArizonaState University.
Moel, A., 2001. The role of American Depositary Receipts in the development of emerging markets. Economia 2,209–273.
Obstfeld, M., 1998. The global capital market: benefactor or menace? Journal of Economic Perspectives 12, 9–30.Rajan, R.G., Zingales, L., 2003. The great reversals: the politics of financial development in the twentieth century. Journal
of Financial Economics 69, 5–50.Reese Jr., W.A., Weisbach, M.S., 2002. Protection of minority shareholder interests, cross-listing in the United States, and
subsequent equity offerings. Journal of Financial Economics 66, 65–104.Ritter, J., Welch, I., 2002. A review of IPO activity, pricing, and allocations. Journal of Finance 57, 1795–1828.Siegel, J., 2005. Can foreign firms bond themselves effectively by renting U.S. securities laws? Journal of Financial
Economics 75, 319–359.Stulz, R.M., 2005. The limits of financial globalization. Journal of Finance 60, 1595–1638.The Economist, 2001. A survey of globalisation, September 29th.