stock market cycles, financial liberalization and volatility
TRANSCRIPT
Journal of International Money and Finance
22 (2003) 925–955
www.elsevier.com/locate/econbase
Stock market cycles, financial liberalizationand volatility
Sebastian Edwards a,�, Javier Gomez Biscarri b,Fernando Perez de Gracia c
a National Bureau of Economic Research and University of California, Los Angeles,
90095-1681 Los Angeles, USAb IESE Business School and Department of Economics, Universidad de Navarra, 31080 Pamplona, Spain
c Department of Economics, Universidad de Navarra, 31080 Pamplona, Spain
Abstract
In this paper we analyze the cycles of the stock markets in four Latin American and twoAsian countries, and we compare their characteristics. We divide our sample in two sub-periods in order to account for differences induced by the financial liberalization processes ofthe early 1990s. We find that cycles in emerging countries tend to have shorter duration andlarger amplitude and volatility than in developed countries. However, after financial liberal-ization Latin American stock markets have behaved more similarly to stock markets indeveloped countries whereas Asian countries have become more dissimilar. Concordance ofcycles across markets has increased significantly over time, especially for Latin Americancountries after liberalization.# 2003 Elsevier Ltd. All rights reserved.
JEL classification: C22; G15
Keywords: Emerging stock market; Bull; Bear; Concordance of cycles; Financial liberalization
1. Introduction
During the last decade the emerging markets have been characterized by a high
degree of financial instability. This has been particularly the case in Latin America,
where currency crises have become recurrent and where equity markets have
experienced dramatic swings. Partially motivated by this instability, a number of
� Corresponding author. Tel. +1-310-206 6797; fax: +1-310-206 5825.
E-mail address: [email protected] (S. Edwards).
0261-5606/$ - see front matter # 2003 Elsevier Ltd. All rights reserved.
doi:10.1016/j.jimonfin.2003.09.011
authors have recently investigated the behavior of Latin American financial mar-kets.1 Fischer (2002), for example, has analyzed the implications of the LatinAmerican currency crises for the future of the international monetary system.Eichengreen (2003), De Gregorio et al. (2000), and Edwards (1999) have investi-gated the role played by capital mobility in Latin America during the financial cri-ses of 1990s. Goldstein (2003) has looked more specifically at the forces behind thefinancial turmoil in Brazil during 2002.Rigobon (2003) has focused on alternative volatility measures in both equity and
bond markets in the period surrounding recent financial crises. Kaminsky andReinhart (2002) have investigated how interest rates, equity returns and bondspreads behave in times of global financial stress. Their main interest was to ana-lyze whether these variables exhibited co-movement across countries. Bekaert andHarvey (2000) analyzed equity returns in a group of emerging markets, includingsix Latin American countries, before and after the financial reforms. Edwards andSusmel (2003) investigated the time pattern of interest rate volatility in four LatinAmerican countries, and compared them to that of Hong Kong. Other recent stu-dies on financial volatility and contagion in the emerging markets, including LatinAmerica, are Karolyi and Stulz (1996); Janakiramanan and Lamba (1998);Edwards (2000); Eichengreen and Mody (2000), Bekaert et al. (2002a), Bekaertet al. (2002b), Chakrabarti and Roll (2002); Chen et al. (2002); Forbes and Rigo-bon (2002) and Bekaert et al. (2003).An important question, and one that we address in this paper, is whether stock
markets have similar features in the emerging nations and in the advanced coun-tries. The answer to this question is particularly germane to the current debate onthe role of financial liberalization and macroeconomic instability in the emergingand transition economies. Some authors – including Krugman (2000) and Stiglitz(2002) – have argued that financial markets in emerging nations are poorlydeveloped and thus they do not function properly – e.g. in the way that financialmarkets in advanced countries do. Under these circumstances, the argument goes,the emerging nations should not liberalize fully their capital markets; instead, theyshould impose some form of controls that regulate cross-border movements ofportfolio capital.More specifically, in this paper we analyze stock market cycles in a group of
Latin American countries: We investigate the characteristics of stock market cyclesin Argentina, Brazil, Chile and Mexico during 1975–2001, and we focus on thebehavior of ‘‘bear’’ and ‘‘bull’’ markets, as defined by Pagan and Sossounov(2003), among others: ‘‘Bull’’ and ‘‘bear’’ phases of stock markets are identifiedwith periods of a generalized upward trend (positive returns) and periods of a gen-
1 During the late 1980s and early 1990s the vast majority of the Latin American countries embarked
on ambitious market-oriented reforms. The reform blueprint has come to be known as the ‘‘Washington
Consensus.’’ A number of authors have argued that this reform process has failed, and that the Latin
American countries have grown at slower rates and have become more unstable. For an analysis of the
reforms see, for example, Edwards (1995). See Stiglitz (2002) for criticism of the reform process.
Edwards (2003) assesses the validity of Stiglitz’s critique.
S. Edwards et al. / Journal of International Money and Finance 22 (2003) 925–955926
eralized downward trend, respectively.2 We make a distinction between the pre-
and post-financial reform periods of the 1980s and 1990s, and we concentrate on
the following characteristics of stock market cycles: Duration, amplitude and vola-
tility. In addition, we analyze the extent to which returns depart from a triangular
representation, and we investigate the occurrence of big expansions and contrac-
tions. The results from this cycle analysis are then used to compare the behavior of
these four Latin American equity markets with those of two Asian nations – South
Korea and Thailand –, as well as with those of the US and Germany.The emerging stock markets analyzed in this paper – Argentina, Brazil, Chile,
Mexico, South Korea and Thailand – represent a highly diverse sample: During the
period under consideration they had different regulations regarding international
capital mobility, different domestic supervisory systems and different exchange rate
regimes.3 Moreover, all of them, with the exception of Chile, faced serious crises
during the last few years. This diverse data set, then, allows us to investigate the
behavior of bull and bear markets under different institutional settings and under
different external environments. We are particularly interested in addressing the
following questions:
. Is it possible to (unequivocally) detect bull and bear markets in these LatinAmerican and Asian countries?
. Do bull and bear markets in emerging countries behave similarly to those in themore advanced nations?
. Has stock market volatility been different across these countries? Has it changedthrough time? Is stock market volatility different in these countries than in thebenchmarks represented by two advanced countries (the US and Germany)?
. How do bear and bull market cycles compare across the emerging markets inour sample? What do these comparisons tell us – if anything – about the effectsof financial liberalization?
. Is it possible to explain the behavior of stock market cycles in our emerging mar-kets using traditional models, including those in the ‘‘random walk’’ family?
The rest of the paper is organized as follows: In Section 2 we present the meth-
odology used to identify bull and bear markets. In Section 3 we discuss the results
of our cycle analysis, and we conclude that bear and bull phases have behaved in a
2 Two explanations have been put forward for the existence of bull and bear markets. One view, tra-
ditionally held by Keynes (1936); Galbraith (1954) and Shiller (1989, 2000) among others, is that major
bull and bear markets are purely due to irrational ‘‘animal spirit.’’ An alternative view (DeLong, 1992;
Siegel, 1998) states that, although prices deviate from fundamentals in the short run, that is, in periods
of months or a few years, in the long run – decades or even generations – proportional differences
between market prices and fundamentals are kept within bounds. Under this interpretation, the major
bull and bear markets reflect large shifts in consensus perceptions of fundamentals and expectations of
the future.3 For details on the characteristics of the financial markets in the different countries and their refom
processes see Bekaert and Harvey (2000).
927S. Edwards et al. / Journal of International Money and Finance 22 (2003) 925–955
significantly different way in emerging and advanced countries, but the differencesseem to diminish in the post-financial liberalization period. In Section 4 we dealwith the issue of concordance or synchronicity of the cycles across countries. Themain findings in this section point at an increased synchronicity of the stock mar-kets in emerging countries, which move in a more parallel way during the 1990sthan they did in earlier periods. Both the financial liberalization processes of theearly 1990s and the financial crises of that decade seem to have contributed to thisincreased synchronicity. Section 5 complements the analysis in Sections 3 and 4 bylooking at a specific characteristic of the cycle that allows for formal significancetests on the shape, and some predictability features, of the cycle phases. Finally, inSection 6 we present a brief summary of the results and some concluding remarksregarding the directions for future research that our paper opens.
2. Identifying market phases: a non-parametric approach
There are two main approaches to locating the expansionary/contractionaryphases of the cycles in an economic variable.4 The first one advocates a parametricspecification of the data generating process, where two different regimes are al-lowed, one that corresponds to the expansions – and therefore contains some typeof upward trend – and another one that corresponds to the contractions and there-fore contains a downward trend. Examples of this approach are Goodwin (1993);Diebold and Rudebusch (1996); Kim and Nelson (1999); Hamilton and Lin (1996);Ramchand and Susmel (1998) and Maheu and McCurdy (2000). The second ap-proach takes a nonparametric perspective and, instead of fitting a fully specifiedstatistical data generating process, looks at the original data series in search for thespecific features of the cycle. That is, this procedure looks for periods of general-ized upward trend, which will be identified with the expansions, and periods of ageneralized downward trend which will be identified with the contractions. The keyfeature of the analysis is the location of turning points, peaks and troughs, in theseries. These turning points determine the different phases of the cycle, which canbe subsequently analyzed. This method was first applied by Bry and Boschan(1971) to the analysis of business cycles, and has since been used by Watson (1994);Artis et al. (1997) and Harding and Pagan (2000, 2002) for business cycles, and byGomez Biscarri and Perez de Gracia (2002); Kaminsky and Schmukler (2003) andPagan and Sossounov (2003) for stock market analysis.In this paper we opt for the nonparametric approach, as it allows for great
flexibility in analyzing some important features of the stock market cycles. In
4 We do not comment on the advantages/disadvantages of one approach vs. the other. A fascinating
discussion can be found in the exchange between Hamilton (2003) and Harding and Pagan (2003a,b).
Alternative methods such as the use of long-returns – twelve month returns, for example – can also be
used to focus on the medium term evolution of the stock market. However, the two methodologies we
comment specifically attempt to locate the two types of phases – bull and bear phases – and thus directly
address the analysis of stock cycles.
S. Edwards et al. / Journal of International Money and Finance 22 (2003) 925–955928

addition, this approach allows us to compare the actual stock market cycle to
parametric bench-marks, and to investigate issues related to predictability of the
market.We proceed as follows: We first identify the stock market phases in our six
emerging countries by locating the peaks and troughs of a stock index. We then
compute a battery of statistics for the phases in each country. This allows us to
measure the main characteristics of Latin American stock markets and to compare
their behavior to that of the Asian countries and of the US and Germany, the two
countries we have chosen as ‘‘representatives’’ of the developed economies.
2.1. Locating peaks and troughs
The first step in the analysis of the cycle phases requires the location of the turn-
ing points – peaks and troughs that signal the change in the trend of the market –
of the stock market index.Throughout the paper, pt denotes the natural log of the stock price, Pt. A peak/
trough in the series of stock prices is defined if pt is the highest/lowest in a window
of width 8 months.5 That is, there is a peak at t if
½pt�8; . . . ; pt�1 < pt > ptþ1; . . . ; ptþ8�; ð1Þ
and there is a trough at t if
½pt�8; . . . ; pt�1 > pt < ptþ1; . . . ; ptþ8�: ð2Þ
In order to ensure that we do not identify spurious phases we include the follow-
ing four censoring criteria:
1. We eliminate turns within eight months of the beginning/end of the series.2. Peaks or troughs next to the endpoints of the series are eliminated if they are
lower/higher than the endpoints.3. Complete cycles of less than sixteen months of duration are eliminated.4. Phases of less than four months are eliminated unless the fall/rise exceeds 20%
(the traditional rule of thumb for identifying a stock market cumulative move-ment as bullish or bearish).
After every censoring operation, alternation is enforced so that a peak will
always follow a trough and viceversa. Alternation is achieved by taking the highest
(lowest) of two consecutive peaks (troughs).
5 The results may be slightly sensitive to the choice of the window width. We use eight months, for a
total cycle length of 16 months, as suggested by Pagan and Sossounov (2003).
929S. Edwards et al. / Journal of International Money and Finance 22 (2003) 925–955
2.2. Stock markets cycles: duration, amplitude and volatility
Once the bear and bull phases have been identified, we calculate a battery ofstatistics for each country. These statistics allow us to obtain some key informationabout the behavior of stock prices in each of the phases. This behavior can then becompared across countries and across phases, in search for relevant differences instock market evolution. We use five different measures of cyclical behavior. Threedirectly relate to the shape of the phases of the cycle, while the other two focus onvolatility within the cycle and on the existence of ‘‘big swings.’’As a preliminary step, we define a dummy variable, St, which takes the value 1 if
there is a bull market at time t, i.e. if pt � pt�1 ¼ Dpt belongs to the bull market.6
Given that St ¼ 1 if there is a bull market at t, we calculate two ancillary statistics:
Total time spent in an expansion isPT
t¼1 St and total time spent in a contraction isPTt¼1 Bt; where Bt ¼ 1� St is an indicator for bear market. The Number of peaks
(expansions) can be counted as NTP ¼PT
t¼1 Stð1� Stþ1Þ � 1 (NTP is short for
‘‘Number of Trough to Peak’’) and the Number of troughs (contractions) is
NPT ¼PT
t¼1 Btð1� Btþ1Þ � 1:7 We also define the cumulated change over any ex
pansion as Zbullt ¼ StZt�1 þ StDpt, Z0 ¼ 0. Zt contains the running sum of returns
Dpt for bull markets (similar definition with Bt for bear markets) with the sum resetto zero whenever St ¼ 0.The five characteristics of the phases of the market that we study are:
1. Duration (D): Average duration in months of expansions and contractions canbe calculated as
DDbull ¼1
NTP
XT
t¼1
St; DDbear ¼1
NPT
XT
t¼1
Bt: ð3Þ
2. Amplitude (A): Amplitude of the phases, in percentage, refers to the total returnor total loss from the trough to the peak in a bull market or from the peak tothe trough in a bear market. Given that pt ¼ lnðPtÞ, the amplitude of any singlephase can be simply calculated as the sum of returns over the complete phase
6 Throughout the paper we refer to Dpt as ‘‘returns’’ though it more accurately corresponds to capital
gains. Most of the parallel studies (Pagan and Sossounov, 2003; Aggarwal et al., 1999) use capital gains
instead of returns, and we follow that same approach.7 Given that we only analyze complete phases, the initial and final phases are not counted. That is the
reason for the ‘‘�1’’ term in the formulas. However, if the initial and final phase are the same, then the
adjustment does not apply to the other type of phase. For example, if the initial and final phases are
bullish, the number of complete bull phases would be NTP ¼PT
t¼1 Stð1� Stþ1Þ � 1 and the number of
bear phases would be NPT ¼PT
t¼1 Btð1� Btþ1Þ:
S. Edwards et al. / Journal of International Money and Finance 22 (2003) 925–955930
and therefore average amplitude corresponds to:
AAbull ¼1
NTP
XT
t¼1
StDpt; AAbear ¼1
NPT
XT
t¼1
BtDpt: ð4Þ
3. Volatility (V): We measure volatility by the average size of the monthly returnin bull and bear phases:
Vbull ¼ 1PT
t¼1 St
XT
t¼1
St Dptj j; Vbear ¼ 1PT
t¼1 Bt
XT
t¼1
Bt Dptj j: ð5Þ
4. Proportion of big expansions (B+) and contractions (B�): The proportion ofexpansions and contractions that are bigger than 0.2 or smaller than �0.2 inpercentage return is:
Bþ ¼ 1
NTP
XT
t¼1I Stð1� Stþ1ÞZbull
t > 0:2� �
;
B� ¼ 1
NTP
XT
t¼1I Btð1� Btþ1ÞZbear
t < �0:2� �
: ð6Þ
Given that (Ztbull) and (Zt
bear) represent the cumulative return throughout thephase and up to time t, the summation term is calculating the value of thecumulative return at the end of the phase, that is, at the peak/trough. This isequivalent to the amplitude of the phase. The indicator function I[a] is thereforecounting the number of phases with amplitude bigger than 0.2 or smaller than�0.2.8
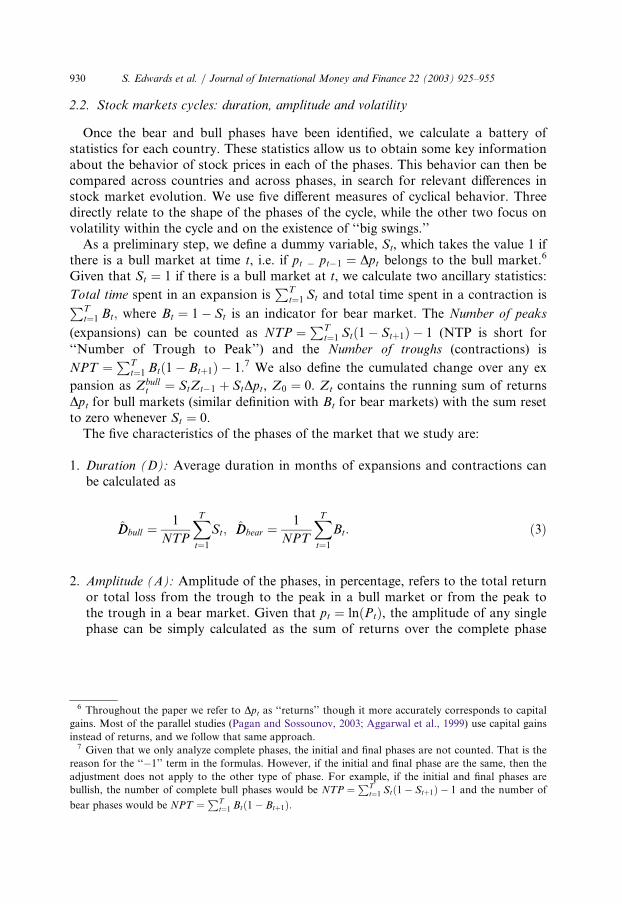
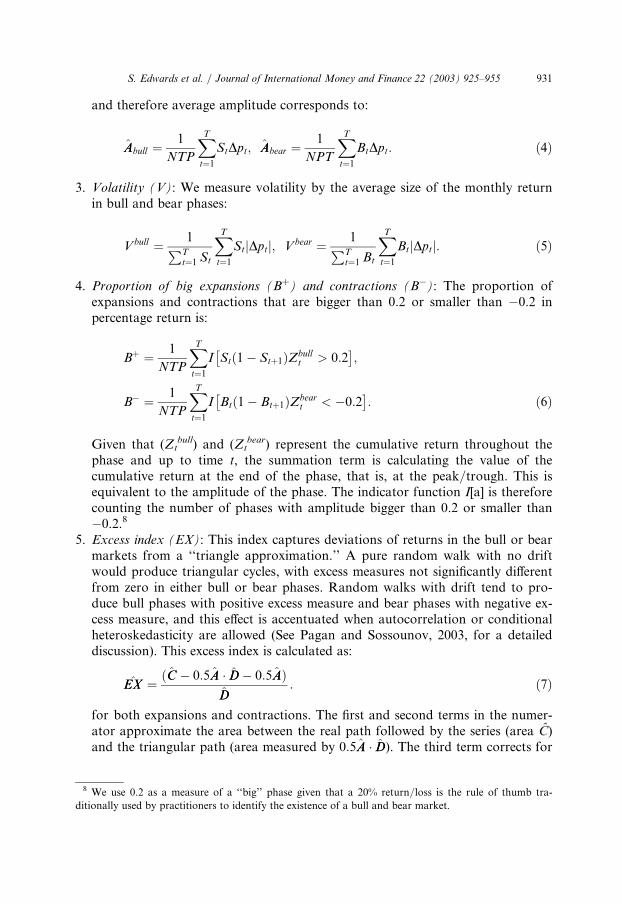
5. Excess index (EX): This index captures deviations of returns in the bull or bearmarkets from a ‘‘triangle approximation.’’ A pure random walk with no driftwould produce triangular cycles, with excess measures not significantly differentfrom zero in either bull or bear phases. Random walks with drift tend to pro-duce bull phases with positive excess measure and bear phases with negative ex-cess measure, and this effect is accentuated when autocorrelation or conditionalheteroskedasticity are allowed (See Pagan and Sossounov, 2003, for a detaileddiscussion). This excess index is calculated as:
EXEX ¼ ðCC � 0:5AA DD� 0:5AAÞDD
: ð7Þ
for both expansions and contractions. The first and second terms in the numer-ator approximate the area between the real path followed by the series (area C)and the triangular path (area measured by 0:5AA DD). The third term corrects for
8 We use 0.2 as a measure of a ‘‘big’’ phase given that a 20% return/loss is the rule of thumb tra-
ditionally used by practitioners to identify the existence of a bull and bear market.
931S. Edwards et al. / Journal of International Money and Finance 22 (2003) 925–955
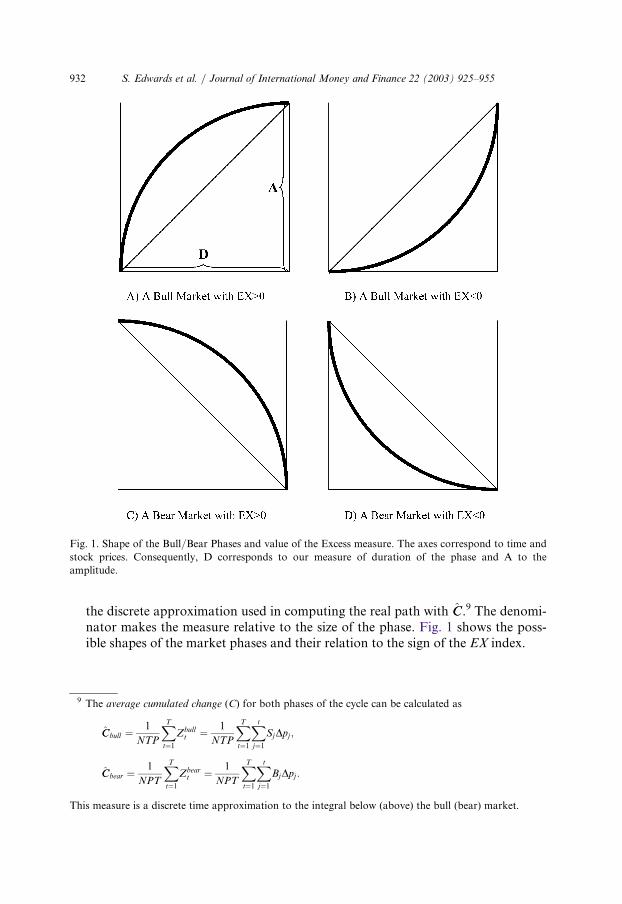
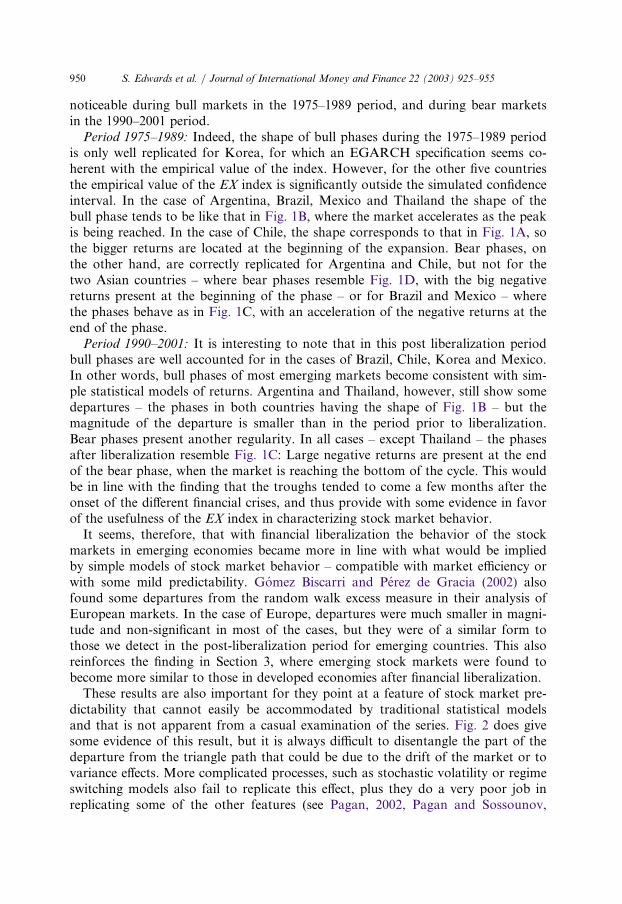
the discrete approximation used in computing the real path with CC.9 The denomi-nator makes the measure relative to the size of the phase. Fig. 1 shows the poss-ible shapes of the market phases and their relation to the sign of the EX index.
Fig. 1. Shape of the Bull/Bear Phases and value of the Excess measure. The axes correspond to time and
stock prices. Consequently, D corresponds to our measure of duration of the phase and A to the
amplitude.
9 The average cumulated change (C) for both phases of the cycle can be calculated as
CCbull ¼1
NTP
XT
t¼1
Zbullt ¼ 1
NTP
XT
t¼1
Xt
j¼1
SjDpj ;
CCbear ¼1
NPT
XT
t¼1
Zbeart ¼ 1
NPT
XT
t¼1
Xt
j¼1
BjDpj :
This measure is a discrete time approximation to the integral below (above) the bull (bear) market.
S. Edwards et al. / Journal of International Money and Finance 22 (2003) 925–955932
3. Bull and bear phases in selected emerging markets: basic results
We use monthly data on stock returns for Argentina, Brazil, Chile, Korea,
Mexico and Thailand. These data correspond to the S&P/IFCG Emerging Market
Indexes of Standard & Poor’s, formerly calculated by the IFC.10 The series run
from 1975:12 to 2001:01, thus yielding a total of 302 observations spanning
26 years.11
Starting in the late 1980s, all six countries in our sample embarked on major
financial reform processes that resulted in a liberalization of financial transactions
and in growing domestic capital markets. An important question, and one that is
at the center of recent criticisms of the reform process and the ‘‘Washington Con-
sensus,’’ is whether stock market cycles have exhibited an increase in amplitude
and volatility – i.e. increased instability – in the post-financial liberalization era. In
order to address this issue, in the analysis that follows we make a distinction
between the pre and post-liberalization periods. We follow Bekaert et al. (2001),
Table 1 to date the beginning of each liberalization episode. The following dates
were used:
. Argentina: 1989
. Brazil: 1991
. Chile: 1992
. Mexico: 1989
. South Korea: 1992
. Thailand: 1988
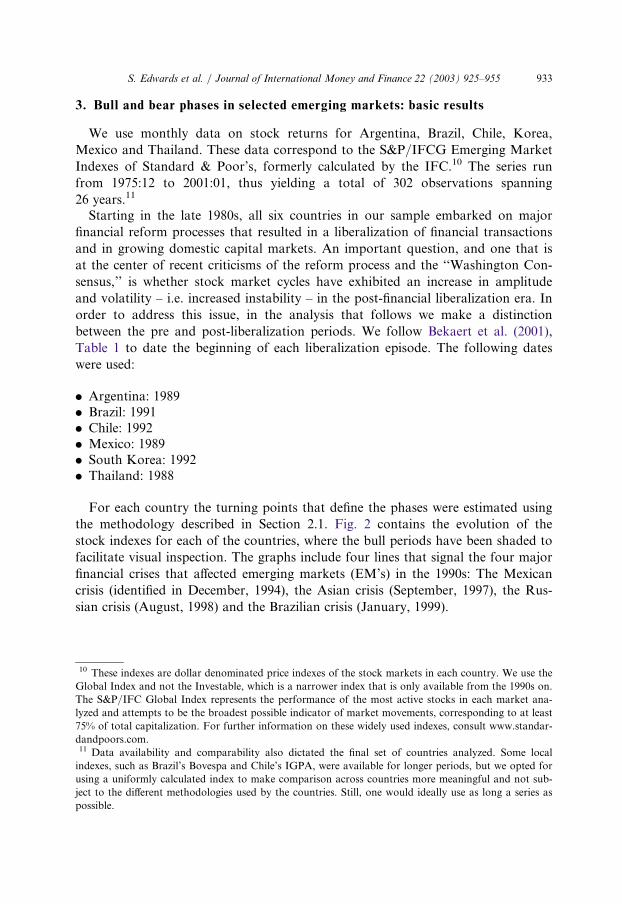
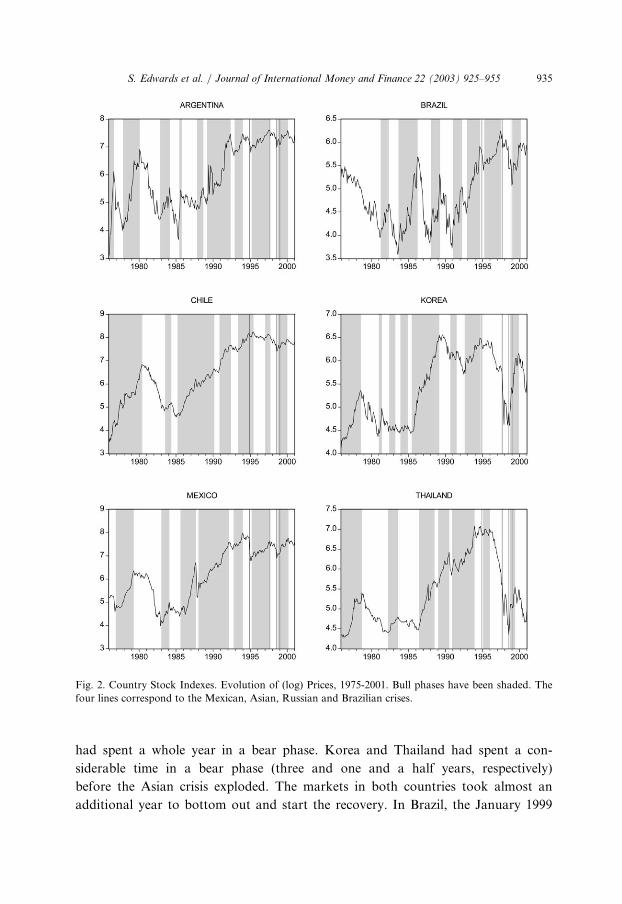
For each country the turning points that define the phases were estimated using
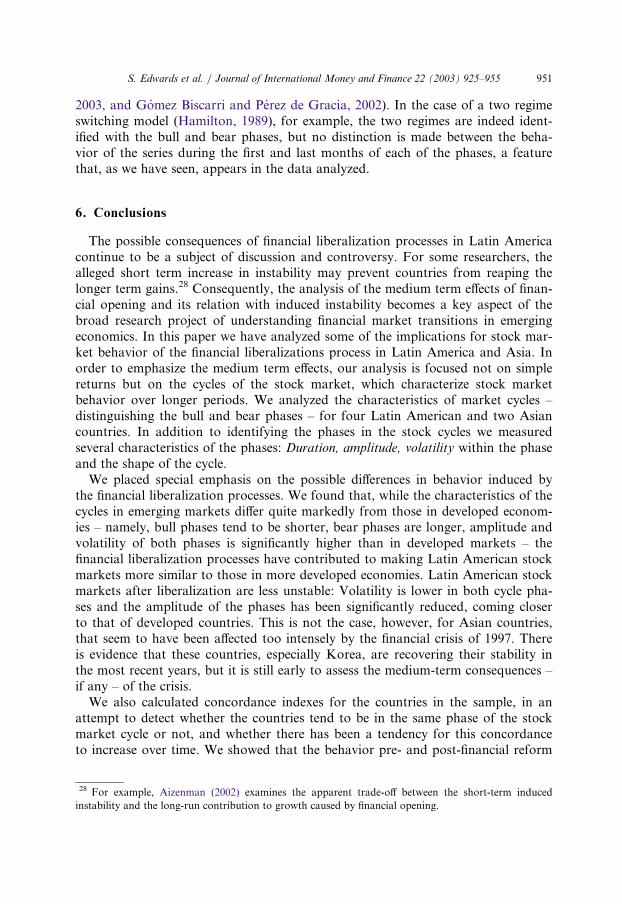
the methodology described in Section 2.1. Fig. 2 contains the evolution of the
stock indexes for each of the countries, where the bull periods have been shaded to
facilitate visual inspection. The graphs include four lines that signal the four major
financial crises that affected emerging markets (EM’s) in the 1990s: The Mexican
crisis (identified in December, 1994), the Asian crisis (September, 1997), the Rus-
sian crisis (August, 1998) and the Brazilian crisis (January, 1999).
10 These indexes are dollar denominated price indexes of the stock markets in each country. We use the
Global Index and not the Investable, which is a narrower index that is only available from the 1990s on.
The S&P/IFC Global Index represents the performance of the most active stocks in each market ana-
lyzed and attempts to be the broadest possible indicator of market movements, corresponding to at least
75% of total capitalization. For further information on these widely used indexes, consult www.standar-
dandpoors.com.11 Data availability and comparability also dictated the final set of countries analyzed. Some local
indexes, such as Brazil’s Bovespa and Chile’s IGPA, were available for longer periods, but we opted for
using a uniformly calculated index to make comparison across countries more meaningful and not sub-
ject to the different methodologies used by the countries. Still, one would ideally use as long a series as
possible.
933S. Edwards et al. / Journal of International Money and Finance 22 (2003) 925–955
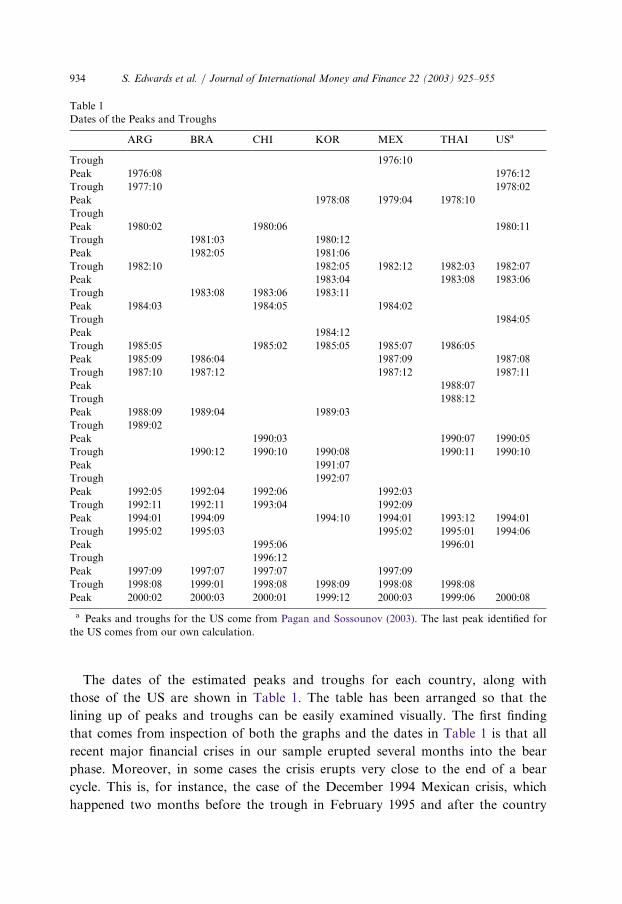
The dates of the estimated peaks and troughs for each country, along with
those of the US are shown in Table 1. The table has been arranged so that the
lining up of peaks and troughs can be easily examined visually. The first finding
that comes from inspection of both the graphs and the dates in Table 1 is that all
recent major financial crises in our sample erupted several months into the bear
phase. Moreover, in some cases the crisis erupts very close to the end of a bear
cycle. This is, for instance, the case of the December 1994 Mexican crisis, which
happened two months before the trough in February 1995 and after the country
Table 1
Dates of the Peaks and Troughs
ARG BRA CHI KOR MEX THAI USa
Trough 1976:10
Peak 1976:08 1976:12
Trough 1977:10 1978:02
Peak 1978:08 1979:04 1978:10
Trough
Peak 1980:02 1980:06 1980:11
Trough 1981:03 1980:12
Peak 1982:05 1981:06
Trough 1982:10 1982:05 1982:12 1982:03 1982:07
Peak 1983:04 1983:08 1983:06
Trough 1983:08 1983:06 1983:11
Peak 1984:03 1984:05 1984:02
Trough 1984:05
Peak 1984:12
Trough 1985:05 1985:02 1985:05 1985:07 1986:05
Peak 1985:09 1986:04 1987:09 1987:08
Trough 1987:10 1987:12 1987:12 1987:11
Peak 1988:07
Trough 1988:12
Peak 1988:09 1989:04 1989:03
Trough 1989:02
Peak 1990:03 1990:07 1990:05
Trough 1990:12 1990:10 1990:08 1990:11 1990:10
Peak 1991:07
Trough 1992:07
Peak 1992:05 1992:04 1992:06 1992:03
Trough 1992:11 1992:11 1993:04 1992:09
Peak 1994:01 1994:09 1994:10 1994:01 1993:12 1994:01
Trough 1995:02 1995:03 1995:02 1995:01 1994:06
Peak 1995:06 1996:01
Trough 1996:12
Peak 1997:09 1997:07 1997:07 1997:09
Trough 1998:08 1999:01 1998:08 1998:09 1998:08 1998:08
Peak 2000:02 2000:03 2000:01 1999:12 2000:03 1999:06 2000:08
a Peaks and troughs for the US come from Pagan and Sossounov (2003). The last peak identified for
the US comes from our own calculation.
S. Edwards et al. / Journal of International Money and Finance 22 (2003) 925–955934
had spent a whole year in a bear phase. Korea and Thailand had spent a con-
siderable time in a bear phase (three and one and a half years, respectively)
before the Asian crisis exploded. The markets in both countries took almost an
additional year to bottom out and start the recovery. In Brazil, the January 1999
Fig. 2. Country Stock Indexes. Evolution of (log) Prices, 1975-2001. Bull phases have been shaded. The
four lines correspond to the Mexican, Asian, Russian and Brazilian crises.
935S. Edwards et al. / Journal of International Money and Finance 22 (2003) 925–955
crisis coincides with the trough of an 18 month bear market. Argentina, finally,
reached a peak in February 2000, which means that by the time of the crisis in
late 2001 the Argentine market had spent almost two years in a bear phase.12
This finding, however, should be taken with a grain of salt. Indeed, although our
results are highly suggestive, they do not necessarily imply that bear markets are
good predictors of currency and financial crisis. Answering this question fully is,
however, beyond the scope of this paper.13
Table 2 presents results for the five statistics calculated for both the bull and bear
markets in our six EM’s. Additionally, we include the values of these statistics for
the US and German stock markets.14 The Table consists of two panels, that present
the results for the pre and post-reform periods.15 The data on the US and Germany
in Panel A correspond to the 1975–1989 period; those in Panel B are for 1990–2001.The results for the two subperiods are particularly interesting, and indicate that,
contrary to what the critics of the market oriented reform processes have argued,
the degree of equity markets instability has declined in our four Latin American
nations after the crisis. The main results in Table 2 may be summarized as follows:Duration: After the financial reforms of the late 1980s and early 1990s, average
duration of bear markets declined in all four Latin American countries, as it did in
Thailand. In Korea, on the other hand, average duration of bear markets increased
in the post reform period. The duration of bull markets stayed similar for the Asian
countries, it declined in the post-reform period in Chile and Brazil, and it increased
in Argentina and Mexico. When compared to the US, however, in the most recent
(post-reform) period duration of bear markets continues to be higher and duration
of bull markets continues to be lower in all six emerging markets than in the US.Amplitude: The amplitude of both bull and bear phases has been significantly lar-
ger in the emerging countries than in the developed nations. Emerging stock mar-
kets seem to offer a significant premium, or excess return, during expansions, that
compensates for the big losses during contractions, and for the substantially higher
volatility. For the emerging markets there appears to be an ordering of countries,
where those with bigger gains are also those with bigger losses. This phenomenon
is also present in the case of the European nations analyzed by Gomez Biscarri and
Perez de Gracia (2002). The figures for the emerging countries are staggering,
though: During the 25 year period, average gains during bull periods range from
12 Notice that this is also the case for earlier crises, such as the Mexican crisis of August 1982.13 The crisis early warnings model developed by Goldman Sachs (2002) does include a decline in the
stock market as a useful leading indicator.14 These results correspond to our own calculation for the US market during the period 1975:01 to
2000:12, using the turning points estimated by Pagan and Sossounov (2003). In the case of the German
market, the results correspond to the period from 1970:01 to 1999:11 estimated by Gomez Biscarri and
Perez de Gracia (2002).15 The data for the different emerging markets have been divided by using as the split date the peak or
trough that is the closest to the liberalization date, so that we keep complete phases both in the pre and
post-reform periods.
S. Edwards et al. / Journal of International Money and Finance 22 (2003) 925–955936
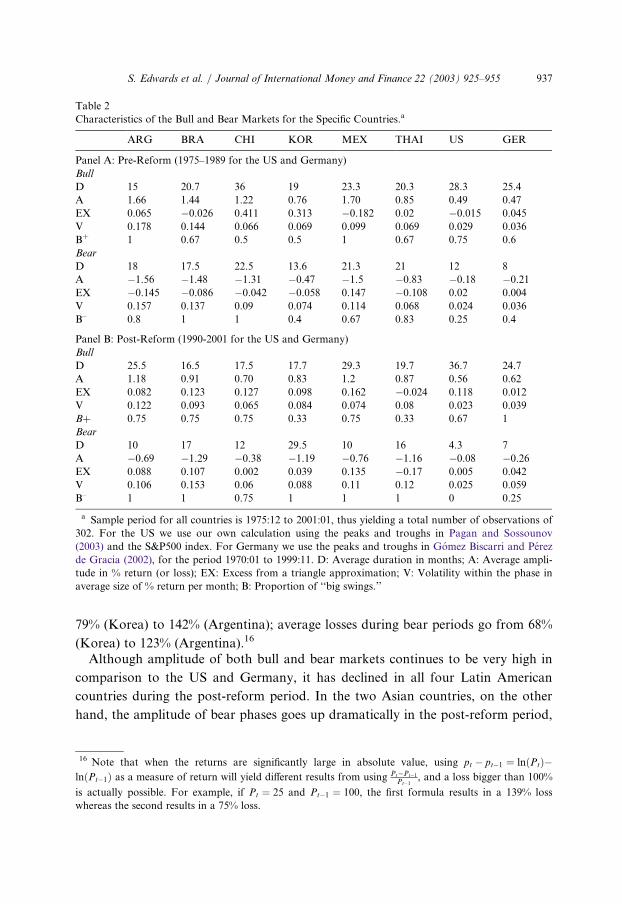
79% (Korea) to 142% (Argentina); average losses during bear periods go from 68%
(Korea) to 123% (Argentina).16
Although amplitude of both bull and bear markets continues to be very high in
comparison to the US and Germany, it has declined in all four Latin American
countries during the post-reform period. In the two Asian countries, on the other
hand, the amplitude of bear phases goes up dramatically in the post-reform period,
Table 2
Characteristics of the Bull and Bear Markets for the Specific Countries.a
ARG BRA CHI KOR MEX THAI US GER
Panel A: Pre-Reform (1975–1989 for the US and Germany)
Bull
D 15 20.7 36 19 23.3 20.3 28.3 25.4
A 1.66 1.44 1.22 0.76 1.70 0.85 0.49 0.47
EX 0.065 �0.026 0.411 0.313 �0.182 0.02 �0.015 0.045
V 0.178 0.144 0.066 0.069 0.099 0.069 0.029 0.036
B+ 1 0.67 0.5 0.5 1 0.67 0.75 0.6
Bear
D 18 17.5 22.5 13.6 21.3 21 12 8
A �1.56 �1.48 �1.31 �0.47 �1.5 �0.83 �0.18 �0.21EX �0.145 �0.086 �0.042 �0.058 0.147 �0.108 0.02 0.004
V 0.157 0.137 0.09 0.074 0.114 0.068 0.024 0.036
B– 0.8 1 1 0.4 0.67 0.83 0.25 0.4
Panel B: Post-Reform (1990-2001 for the US and Germany)
Bull
D 25.5 16.5 17.5 17.7 29.3 19.7 36.7 24.7
A 1.18 0.91 0.70 0.83 1.2 0.87 0.56 0.62
EX 0.082 0.123 0.127 0.098 0.162 �0.024 0.118 0.012
V 0.122 0.093 0.065 0.084 0.074 0.08 0.023 0.039
B+ 0.75 0.75 0.75 0.33 0.75 0.33 0.67 1
Bear
D 10 17 12 29.5 10 16 4.3 7
A �0.69 �1.29 �0.38 �1.19 �0.76 �1.16 �0.08 �0.26EX 0.088 0.107 0.002 0.039 0.135 �0.17 0.005 0.042
V 0.106 0.153 0.06 0.088 0.11 0.12 0.025 0.059
B– 1 1 0.75 1 1 1 0 0.25
a Sample period for all countries is 1975:12 to 2001:01, thus yielding a total number of observations of
302. For the US we use our own calculation using the peaks and troughs in Pagan and Sossounov
(2003) and the S&P500 index. For Germany we use the peaks and troughs in Gomez Biscarri and Perez
de Gracia (2002), for the period 1970:01 to 1999:11. D: Average duration in months; A: Average ampli-
tude in % return (or loss); EX: Excess from a triangle approximation; V: Volatility within the phase in
average size of % return per month; B: Proportion of ‘‘big swings.’’
16 Note that when the returns are significantly large in absolute value, using pt � pt�1 ¼ lnðPtÞ�lnðPt�1Þ as a measure of return will yield different results from using Pt�Pt�1
Pt�1, and a loss bigger than 100%
is actually possible. For example, if Pt ¼ 25 and Pt�1 ¼ 100, the first formula results in a 139% loss
whereas the second results in a 75% loss.
937S. Edwards et al. / Journal of International Money and Finance 22 (2003) 925–955
mostly because of the influence of the Asian crisis. Amplitude of bull phases inAsia is similar in the pre- and post-reform periods.
Volatility: Within each phase volatility is generally much larger in the emergingmarkets than in advanced countries. This is the case both in the pre- and post-reform periods. However, in the post financial liberalization period, volatility hasdeclined significantly in every Latin American country in our sample. Notice thatthe value of volatility is smaller in the second subperiod of bull phases in all fourLatin American countries and for bear phases in Argentina, Chile and Mexico. Inthe case of Asian countries, on the other hand, their markets evolved in theopposite way, and after 1990 their stock market fluctuations seem to behave morelike those of pre-1990s Latin America: Volatility of both bull and bear phases islarger in post-reform Korea and Thailand than before financial liberalization.The increased volatility of bear phases in the second subperiod for Brazil, Korea
and Thailand is mostly attributable to their own, very profound and unique, crises,and not to increased general instability: Notice that no volatility increase happenedin the bull periods of Brazil or in either phase in Argentina, Chile and Mexico.Consequently, these findings cast some doubt on the statements by critics of finan-cial liberalization which point at a generalized increase in volatility following theopening of emerging capital markets.
Excess index: As reflected in Table 2, the values of the EX index for our emergingcountries differ substantially from those of the US or Germany. The EM’s tend topresent widely varying EX indexes in both bull and bear phases. The signs are notalways positive and negative respectively, but some present bull phases with negativevalue of the EX index and bear phases with positive value. This evidence on the EXindex is in line with one of the key findings in Pagan and Sossounov (2003): Stockmarket phases do not look triangular, as it would be implied by a simple randomwalk. Instead, the beginning and end of both the bull and bear phase display some‘‘acceleration,’’ by which the large returns or losses are not distributed evenly acrossthe phase, but are instead concentrated close to one of the turning points. It wouldbe tempting to identify automatically these nonzero values of the EX index with adeparture from the random walk behavior and therefore from unpredictability, as itis done by Pagan and Sossounov. However, Gomez Biscarri and Perez de Gracia(2002) show that this is not exactly correct. Simulations in their paper prove that arandom walk with drift but no autocorrelation – and therefore, unpredictable be-yond the regular market return – generated cycles with EX measures significantlydifferent from zero in both phases. This implies that our results for the EM’s couldbe consistent with stock markets following random walks with drift, with or withoutautocorrelated returns. If one wants to use the EX index to test for the existence ofsome predictability in the market or for departures from the random walk behaviorthe values of the index that are consistent with statistical models of unpredictablereturns need to be calculated case by case. We take up this task, which yields impor-tant conclusions, in the last section of the paper.
Big expansions and contractions: The B+ and B– suggest that during the post-reform subsample most bear phases have been ‘‘bigger’’ than in the pre-reform per-iod. Indeed, as these indexes show, after 1990 all contractions of Latin American
S. Edwards et al. / Journal of International Money and Finance 22 (2003) 925–955938
and Asian stock markets have been large, except one in Chile, the country whosecycles look more similar to those of the developed economics. We attribute thiseffect mostly to the effect of the Asian crisis – notice that there are fewer years inthe post-reform period, and thus fewer bear phases – and not to the increased in-stability: As we have seen in the results on amplitude and volatility the evidencefavors a generalized reduction in instability, once the effect of the bear marketcaused by the Asian crisis is isolated.
4. Financial reforms and stock market cycles across countries
In this section we extend our bull and bear markets analysis and look at thejoint evolution of the six emerging stock markets investigated above. We are parti-cularly interested in understanding whether stock market phases tend to ‘‘coincide’’in time across emerging countries. That is, we try to identify whether, at a givenmoment in time, stock markets in EM’s are in the same phase of the stock marketcycle. We also try to ascertain whether this comovement or concordance acrossequity markets has intensified during the post-reform period. Since during the late1980s and early 1990s these countries relaxed their controls on international capitalmobility, we would expect an increase in the degree of comovement across theirequity markets.17
The rest of the section is organized as follows. First, we compare the timing ofthe peaks and troughs of the stock market series across time, trying to show howcoincident in time the turning points have been across our Latin American andAsian countries. Then we look more formally at the long run coincidence of thephases. We provide a dynamic measure of concordance that tracks the evolution ofthe synchronicity of cycle phases during the sample years. This latter measureallows us to comment on whether the stock markets of our EM’s have becomemore concordant over time.
4.1. Peaks and troughs in bull and bear phases
In Table 1 we presented the dates of the peaks and troughs identified for theequity cycles of our four Latin American nations, the two Asian nations and the US.These results show that before the financial market liberalizations of the late 1980sand early 1990s the peaks and troughs of our six EM’s were not aligned at all. Fur-thermore, they were not aligned with those identified for the US. In fact, all sixcountries seemed to follow widely differing patterns before 1990. For example,Argentina’s phases from 1975 to 1987 do not have a single turning point in commonwith, or within a seven month window of, those of Brazil. Similar results hold forthe rest of the countries: Peaks and troughs do not coincide in time until the USstock market crisis of 1987, when three of the EM’s – Argentina, Brazil and Mexico
17 The fact that emerging markets’ equities are considered to be an ‘‘asset class’’ provides greater sup-
port to the hypothesis that comovements across these countries should have increased in the post-reform
period.
939S. Edwards et al. / Journal of International Money and Finance 22 (2003) 925–955
– present a trough almost simultaneous to that in the US. It is slightly surprising
that it is the troughs that coincide in time, and not the peaks. This leads to think
that US investors pulled out of both the US and international markets at the time of
the crisis, regardless of whether the markets were going up or down, and when the
market recovered, capital flowed back into all four markets simultaneously.18 After
the crash, turning points become misaligned again until 1990 when, coinciding with
the worldwide recession, Brazil, Chile, Korea, Thailand and the US present a
trough.After 1990, a time when the countries in our sample had either initiated, or
were about to launch their reforms, individual cycles begin to exhibit evident
comovement. With the exception of Korea, that does not present a cycle in 1996-
1997, the other five countries all present very similar patterns, with peaks around
the second quarter of 1992, one during 1994, one in late 1997 (around the time of
the Asian crisis), and a final peak in early 2000. Troughs also come almost simul-
taneously in late 1992, early 1995 (after the peso crisis in Mexico) and a final one
in late 1998, following the Russian crisis. Only Brazil seemed to be affected by its
own crisis: It is the only country whose stock market did not bottom out in Sep-
tember 1998 at the time of the LTCM crisis – as did all the others –, but kept its
downward slide until January 1999, when it started to recover after the devalu-
ation of the real.It is interesting to note that the different financial crises of the 1990s had dissimi-
lar effects across EM’s. According to the data, the Mexican crisis affected Argen-
tina and Brazil, but it did not affect Chile, Korea or Thailand. In contrast, all six
countries were significantly affected by the collapse of the Asian markets in 1997.
We do not have enough data on the Russian equity market in order to carry a
similar analysis of the effects of that crisis on Russia’s own market. However, it
can be seen that the Russian crisis of August 1998 did not have any noticeable
effects in the EM’s in our sample. In fact, it seems that the crisis marked the begin-
ning of the recovery after the Asian flu, rather than sending the markets into
another downslide. As mentioned above, the crisis in Brazil did not spillover to
other markets.19
These findings suggest that in the post-reform period, emerging equity markets –
or at least the emerging markets considered in this paper – were becoming signifi-
cantly more integrated with each other. We turn now to a more formal analysis of
the concordance or synchronicity of the stock market phases in our EM’s.
18 The literature on the effects of the 1987 US stock market crisis is by now abundant. King and Wadh-
wani (1990). Lee and Kim (1993) and Choudhry (1996) are among the earlier contributions that docu-
ment an increase in world stock market comovements after the crisis. Forbes and Rigobon (2002) review
some of those contributions in the context of contagion of financial crises.19 Notice that we do not pretend to have established statistical causality.
S. Edwards et al. / Journal of International Money and Finance 22 (2003) 925–955940
4.2. Concordance of the cycle phases: are the cycles aligned?
In order to analyze formally the extent of the comovements of the stock marketdata in our six emerging countries, we use an index of synchronicity of the bull andbear phases which allows us to compare statistically the degree of alignment orconcordance of the cycle phases in two or more countries. This index is the con-cordance index (CI), used in Harding and Pagan (2000, 2002). The index is calcu-lated, for countries i and j, as
CIij ¼1
T
XT
t¼1
½Sit S
jt þ Bi
t Bjt� ð8Þ
where Sit ¼ 1 identifies a bull market at time t in country i and Bi
t ¼ 1 identifies abear market at time t in country i. This index calculates the number of periods forwhich the two countries are in the same phase, either bull or bear, and averagesout over the T periods.20
The values of the CI range from zero (perfect misalignment of phases) to one(perfect alignment). However given that random walks with drift generate cycleswith longer and bigger bull phases than bear phases, even if the shocks to the ran-dom walks are perfectly independent, the CI will be slightly bigger than 0.5, thevalue we would obtain if the phases were purely random draws from a 50:50 Ber-noulli distribution. Formal significance testing, consequently, requires resorting toa simulation method, which we describe later in the paper.21
Instead of focusing on two subperiods – pre- and post-liberalization – we analyzewhether the degree of concordance has tended to change – gradually, perhaps –through time. More specifically, we are interested in finding out if after the reformsthere is a tendency towards an increased degree of concordance across countries. In
20 This index is, in some senses, superior to cross-correlations of returns. Indeed, cross-correlations
have some limitations. First, they are subject to sectorial composition of the stock indexes and do not
account for movements in fundamentals (see Wolf, 1996). Second, the use of cross-correlations would be
affected by the existence, not infrequent in the case of stock market movements, of outliers. By identify-
ing the phases with a binary variable, we avoid the artificial increase of cross-correlation that results
from extremely big returns. Third, due to the trending behavior of stock prices return correlations tend
to be positive and statistically significant. Given that we are not interested in the concordance or corre-
lation per se, but on the concordance of the innovation to the return process the correlation would have
to be computed with the estimated residuals of the return process, thus being subject to the statistical
process that returns are assumed to follow. Finally, we are not interested in forecasting returns or in the
short term movements of the market: Our main concern is to calculate the concordance of stock market
phases, which are medium term fluctuations. Using cross-correlations of returns would put too much
emphasis on short term movements. The methodology used to construct the phase indicators guarantees
that we focus on the medium term trends of the stock market.21 Notice that this is also the case for the coefficients of correlation of returns: Traditional critical
values for significance of the coefficient of correlation between two series are biased downward for time
series with a drift and autocorrelation in returns. Thus, the significance test would have to be performed
on the innovations to the two series, estimated by first fitting a statistical model to the returns.
941S. Edwards et al. / Journal of International Money and Finance 22 (2003) 925–955
general, one would expect that financial reforms that open up domestic financialmarkets – even if they do so partially – would increase the extent of marketcomovement across countries. This would be particularly the case if the countries inquestion are considered to form a (semi) homogeneous ‘‘asset class.’’ Indeed, evenif restrictions to capital mobility are only partially lifted, we would expect a(gradual) increase in the CI through time. In order to address this issue we donot calculate static measures but a set of rolling CI’s (RCI’s), using a window ofwidth 50.22 That is, we calculate the series of RCI’s as
RCI sij ¼
1
50
Xs
t¼s�49
½Sit S
jt þ Bi
t Bjt�: ð9Þ
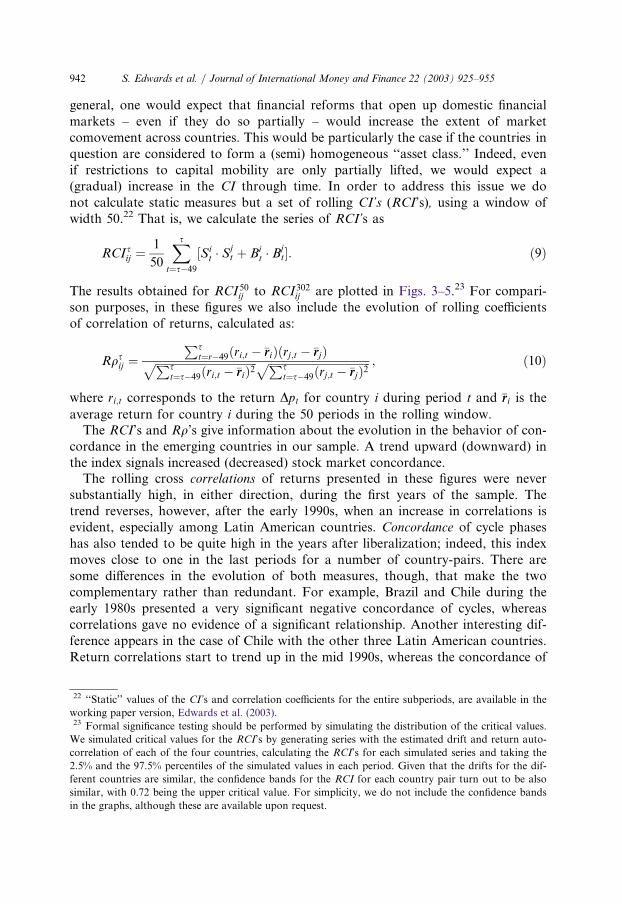
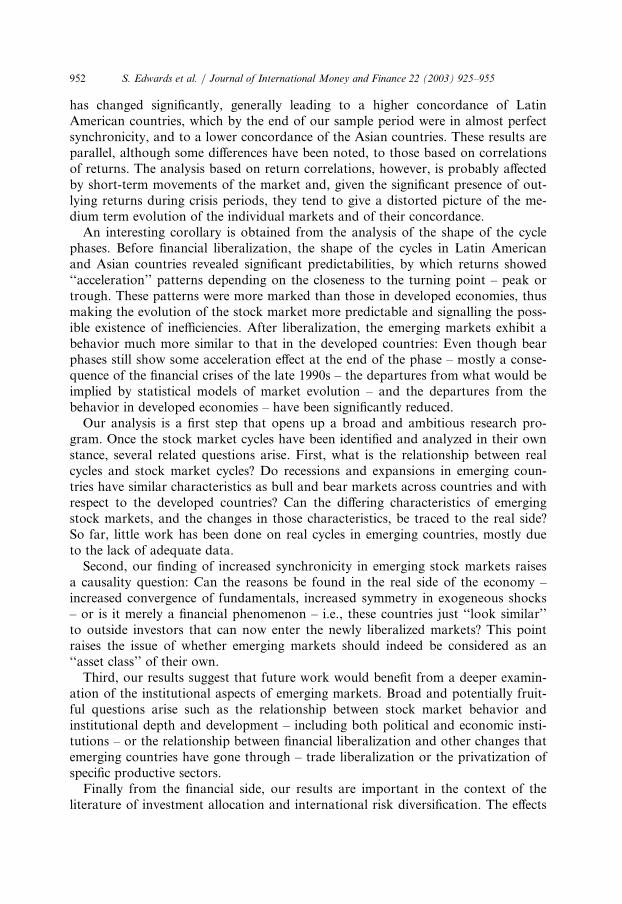
The results obtained for RCI50ij to RCI302ij are plotted in Figs. 3–5.23 For compari-son purposes, in these figures we also include the evolution of rolling coefficientsof correlation of returns, calculated as:
Rqsij ¼
Pst¼r�49ðri;t � �rriÞðrj;t � �rrjÞffiffiffiffiffiffiffiffiffiffiffiffiffiffiffiffiffiffiffiffiffiffiffiffiffiffiffiffiffiffiffiffiffiffiffiffiffiPs
t¼s�49ðri;t � �rriÞ2p ffiffiffiffiffiffiffiffiffiffiffiffiffiffiffiffiffiffiffiffiffiffiffiffiffiffiffiffiffiffiffiffiffiffiffiffiffiPs
t¼s�49ðrj;t � �rrjÞ2p ; ð10Þ
where ri;t corresponds to the return Dpt for country i during period t and �rri is the
average return for country i during the 50 periods in the rolling window.The RCI’s and Rq’s give information about the evolution in the behavior of con-
cordance in the emerging countries in our sample. A trend upward (downward) inthe index signals increased (decreased) stock market concordance.The rolling cross correlations of returns presented in these figures were never
substantially high, in either direction, during the first years of the sample. Thetrend reverses, however, after the early 1990s, when an increase in correlations isevident, especially among Latin American countries. Concordance of cycle phaseshas also tended to be quite high in the years after liberalization; indeed, this indexmoves close to one in the last periods for a number of country-pairs. There aresome differences in the evolution of both measures, though, that make the twocomplementary rather than redundant. For example, Brazil and Chile during theearly 1980s presented a very significant negative concordance of cycles, whereascorrelations gave no evidence of a significant relationship. Another interesting dif-ference appears in the case of Chile with the other three Latin American countries.Return correlations start to trend up in the mid 1990s, whereas the concordance of
22 ‘‘Static’’ values of the CI’s and correlation coefficients for the entire subperiods, are available in the
working paper version, Edwards et al. (2003).23 Formal significance testing should be performed by simulating the distribution of the critical values.
We simulated critical values for the RCI’s by generating series with the estimated drift and return auto-
correlation of each of the four countries, calculating the RCI’s for each simulated series and taking the
2.5% and the 97.5% percentiles of the simulated values in each period. Given that the drifts for the dif-
ferent countries are similar, the confidence bands for the RCI for each country pair turn out to be also
similar, with 0.72 being the upper critical value. For simplicity, we do not include the confidence bands
in the graphs, although these are available upon request.
S. Edwards et al. / Journal of International Money and Finance 22 (2003) 925–955942
phases only starts to increase well after the Asian crisis. Consequently, both mea-sures tell the same story about the high concordance of Latin American marketsafter financial liberalization, but the dynamic behavior identified is slightly differ-ent. We believe that the main limitation of cross correlations in our setting is thatthe abnormal returns during the crises in the second half of the 1990s generatelarge ‘‘outliers’’ that tend to blur the real concordance of the behavior of the stockmarkets in the medium term.
Fig. 3. Argentina: comparison of rolling correlation indexes of simple returns (dashed line) and rolling
concordance indexes of bull/bear states (solid line). The rolling window has size 50.
943S. Edwards et al. / Journal of International Money and Finance 22 (2003) 925–955
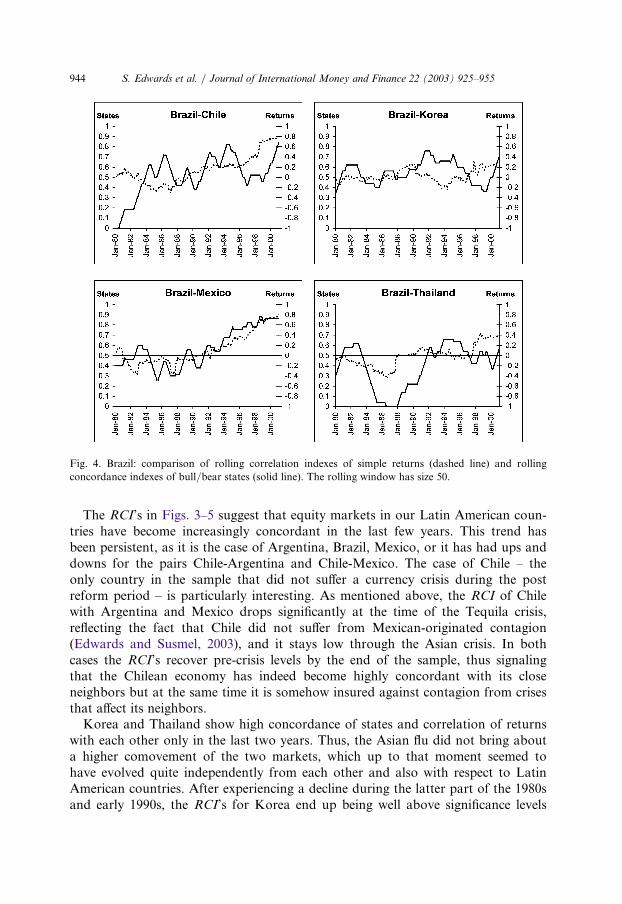
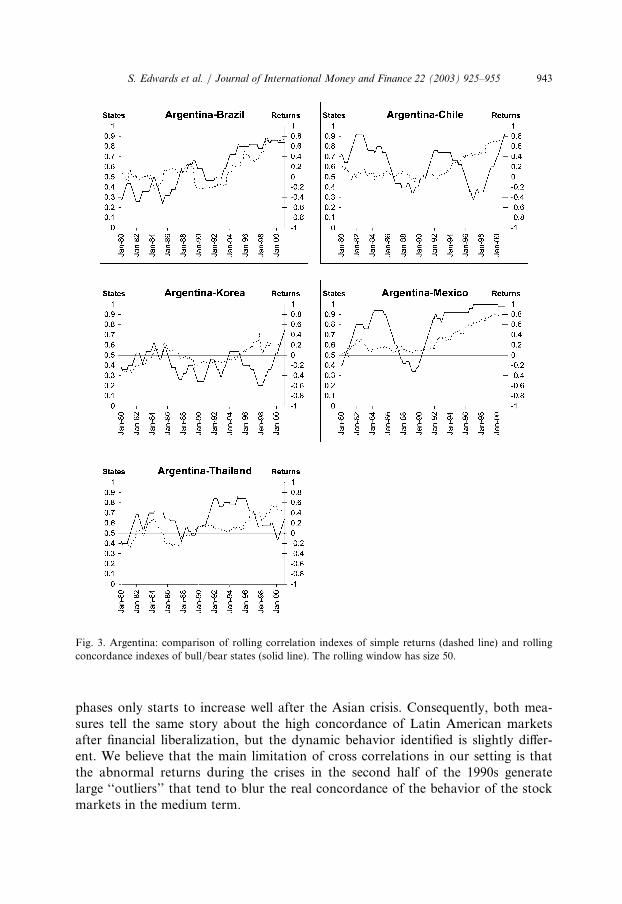
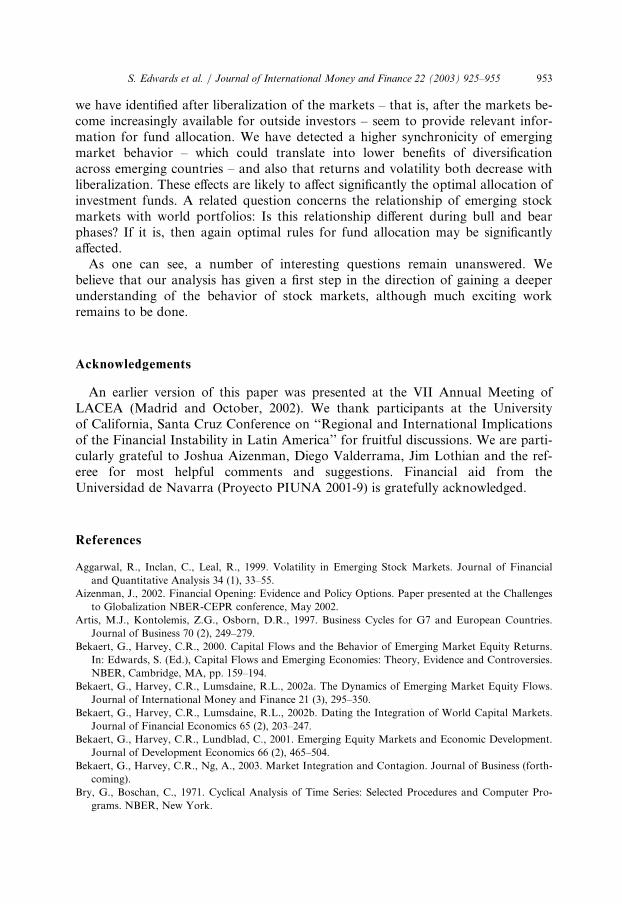
The RCI’s in Figs. 3–5 suggest that equity markets in our Latin American coun-tries have become increasingly concordant in the last few years. This trend hasbeen persistent, as it is the case of Argentina, Brazil, Mexico, or it has had ups anddowns for the pairs Chile-Argentina and Chile-Mexico. The case of Chile – theonly country in the sample that did not suffer a currency crisis during the postreform period – is particularly interesting. As mentioned above, the RCI of Chilewith Argentina and Mexico drops significantly at the time of the Tequila crisis,reflecting the fact that Chile did not suffer from Mexican-originated contagion(Edwards and Susmel, 2003), and it stays low through the Asian crisis. In bothcases the RCI’s recover pre-crisis levels by the end of the sample, thus signalingthat the Chilean economy has indeed become highly concordant with its closeneighbors but at the same time it is somehow insured against contagion from crisesthat affect its neighbors.Korea and Thailand show high concordance of states and correlation of returns
with each other only in the last two years. Thus, the Asian flu did not bring abouta higher comovement of the two markets, which up to that moment seemed tohave evolved quite independently from each other and also with respect to LatinAmerican countries. After experiencing a decline during the latter part of the 1980sand early 1990s, the RCI’s for Korea end up being well above significance levels
Fig. 4. Brazil: comparison of rolling correlation indexes of simple returns (dashed line) and rolling
concordance indexes of bull/bear states (solid line). The rolling window has size 50.
S. Edwards et al. / Journal of International Money and Finance 22 (2003) 925–955944
with respect to Argentina, Brazil and Chile, although they never reach levels simi-
lar to those of the Latin American countries among themselves. Thailand, on the
other hand, does not show signs of concordance with any Latin American country
except, maybe, Chile. It did show significant concordance in the earlier years –
before the crisis, around the liberalization dates –, but this concordance has in fact
decreased in recent periods.
Fig. 5. Chile, Korea, Mexico and Thailand: comparison of rolling correlation indexes of simple returns
(dashed line) and rolling concordance indexes of bull/bear states (solid line). The rolling window has
size 50.
945S. Edwards et al. / Journal of International Money and Finance 22 (2003) 925–955
Our results therefore show strong concordance of Latin American stock marketsand a clear tendency towards stronger concordance in the most recent years,especially after financial liberalization. Korea and Thailand have become less con-cordant with respect to all the other countries although Korea seems to be recover-ing and entering in phase again with the Latin American countries in the mostrecent years.These findings suggest that liberalization processes have indeed contributed to a
much stronger comovement of the stock markets in the emerging countries – bothin the short term, as measured by the correlations of returns, and in the mediumterm, as measured by the concordance indices –, and that this result is consistentacross countries. The financial crises have introduced some noise in these relation-ships, especially around the years of the Asian flu. After the effects of the Asiancrisis died away – the Russian and Brazilian crisis did not have a similar effect – allLatin American countries and Korea give evidence of strong comovement, whereasThailand seems to have become detached from the rest of the group. These resultsare in contrast with studies such as Wolf (1996), that claim that Asian equitymarkets have experienced a big increase in the degree of comovement during the1990s whereas comovements for the Latin American countries remained small evenafter the reforms.
5. The shape of emerging cycle phases: a simulation exercise
Our approach allows us to compare the actual stock market cycles to bench-marks characterized by random walk-type models in the basis of the cycle char-acteristics. In principle, all five cycle characteristics discussed in Section 2 could beused to test some statistical model. However, it turns out that most statistical mod-els can replicate fairly well all measures except for the EX index. This index, there-fore, is the one that can most successfully be used for a formal testing of whether astatistical model is consistent with observed market behavior. As pointed outabove, if the true data generating process is indeed a random walk, the cyclicalbehavior would follow a triangular path and the EX index would be zero. If, how-ever, empirical cycles depart from those generated by a random walk, the cyclicalpattern could take a number of alternative forms and the EX index would be eitherpositive or negative depending on the shape of the cycle phase: Fig. 1 depicted thefour possible shapes of the market behavior depending on whether the market isbullish or bearish and on the sign of the EX index.In order to gain a deeper understanding of whether stock market phases depart
from what random walk-based models would imply, we perform a simulationexperiment.24 First we fit three statistical models of returns to all six of our
24 Our procedure is a parametric bootstrap where we simulate returns from the implied distribution
given the estimated parameters of the process (Maddala and Li, 1996).
S. Edwards et al. / Journal of International Money and Finance 22 (2003) 925–955946
markets for the three different subperiods – full sample, 1975–1989 and 1990–2001.25 These three models differ with respect to the behavior of the volatility ofthe error term. The three models estimated are:
I) AR(1) returns
Dpt ¼ l þ qDpt�1 þ ret; et ! nidð0; 1Þ: ð11ÞII) AR(1) returns with GARCH(1,1) volatility
Dpt ¼ l þ qDpt�1 þ rtet; et ! nidð0; 1Þ;r2t ¼ a þ bu2t�1 þ cr2
t�1; ut ¼ rtet:ð12Þ
III) AR(1) returns with EGARCH(1,1) volatility
Dpt ¼ l þ qDpt�1 þ rtet; et ! nidð0; 1Þ;lnr2
t ¼ /0 þ /1et�1 þ /2jet�1j þ /3lnr2t�1:
ð13Þ
Note that all three models include the possibility of returns being autocorrelated,and therefore if there is indeed some autocorrelation in the market, it will show upin the coefficient q.26 We are therefore interested in detecting features that maypoint at predictabilities beyond that of a simple autocorrelation of returns.Second, we simulated 1,000 series of returns – of length equal to the number of
observations available in each country’s stock market series – for all six countries,given the estimated parameters for the above three models. We calculated the EXindexes for each of the 1,000 simulated series and constructed the simulated distri-bution of the EX index under each of the three models. From these simulated dis-tributions we find the 2.5% and 97.5% critical values.Third, we compared the values of the empirical EX indexes estimated for the
original series of the four countries (fourth and tenth rows in Table 2), with thecritical values that result from simulating the stock market with the estimatedparameters of the three models.27 The results of the simulated critical values for thedifferent countries and models appear in Table 3.These results indicate that all three statistical models fail to replicate correctly
the value of the EX index for all of our countries. Moreover, this failure is notsymmetric across time periods or across phases. In fact, the divergence between theEX indexes implied by the three models and the computed EX indexes is more
25 These three models have been chosen because they are the ones that best replicate the features of the
empirical cycles (see Pagan and Sossounov, 2003). More complicated models such as regime-switching
models or processes with stochastic volatility have been analyzed, but their performance in fitting the
features of the data is much poorer than that of the three simpler models we consider.26 Strictly speaking, therefore, if q 6¼ 0 the three models are not random walks. We do not comment on
the values of the estimated coefficients. Across countries and for the three different estimation periods,
the values of q differ substantially, some of them being statistically significant.27 All parameter values are available upon request. We omit them from the exposition in order to sim-
plify the discussion.
947S. Edwards et al. / Journal of International Money and Finance 22 (2003) 925–955
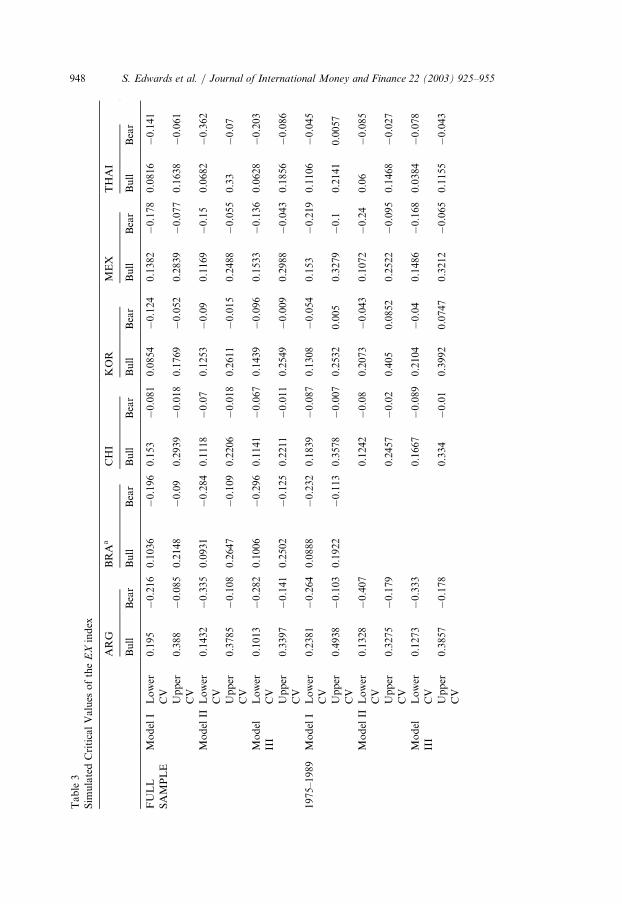
Table3
SimulatedCriticalValues
oftheEXindex
ARG
BRAa
CHI
KOR
MEX
THAI
Bull
Bear
Bull
Bear
Bull
Bear
Bull
Bear
Bull
Bear
Bull
Bear
FULL
SAMPLE
ModelI
Lower
CV
0.195
�0.216
0.1036
�0.196
0.153
�0.081
0.0854
�0.124
0.1382
�0.178
0.0816
�0.141
Upper
CV
0.388
�0.085
0.2148
�0.09
0.2939
�0.018
0.1769
�0.052
0.2839
�0.077
0.1638
�0.061
ModelII
Lower
CV
0.1432
�0.335
0.0931
�0.284
0.1118
�0.07
0.1253
�0.09
0.1169
�0.15
0.0682
�0.362
Upper
CV
0.3785
�0.108
0.2647
�0.109
0.2206
�0.018
0.2611
�0.015
0.2488
�0.055
0.33
�0.07
Model
III
Lower
CV
0.1013
�0.282
0.1006
�0.296
0.1141
�0.067
0.1439
�0.096
0.1533
�0.136
0.0628
�0.203
Upper
CV
0.3397
�0.141
0.2502
�0.125
0.2211
�0.011
0.2549
�0.009
0.2988
�0.043
0.1856
�0.086
1975–1989
ModelI
Lower
CV
0.2381
�0.264
0.0888
�0.232
0.1839
�0.087
0.1308
�0.054
0.153
�0.219
0.1106
�0.045
Upper
CV
0.4938
�0.103
0.1922
�0.113
0.3578
�0.007
0.2532
0.005
0.3279
�0.1
0.2141
0.0057
ModelII
Lower
CV
0.1328
�0.407
0.1242
�0.08
0.2073
�0.043
0.1072
�0.24
0.06
�0.085
Upper
CV
0.3275
�0.179
0.2457
�0.02
0.405
0.0852
0.2522
�0.095
0.1468
�0.027
Model
III
Lower
CV
0.1273
�0.333
0.1667
�0.089
0.2104
�0.04
0.1486
�0.168
0.0384
�0.078
Upper
CV
0.3857
�0.178
0.334
�0.01
0.3992
0.0747
0.3212
�0.065
0.1155
�0.043
S. Edwards et al. / Journal of International Money and Finance 22 (2003) 925–955948
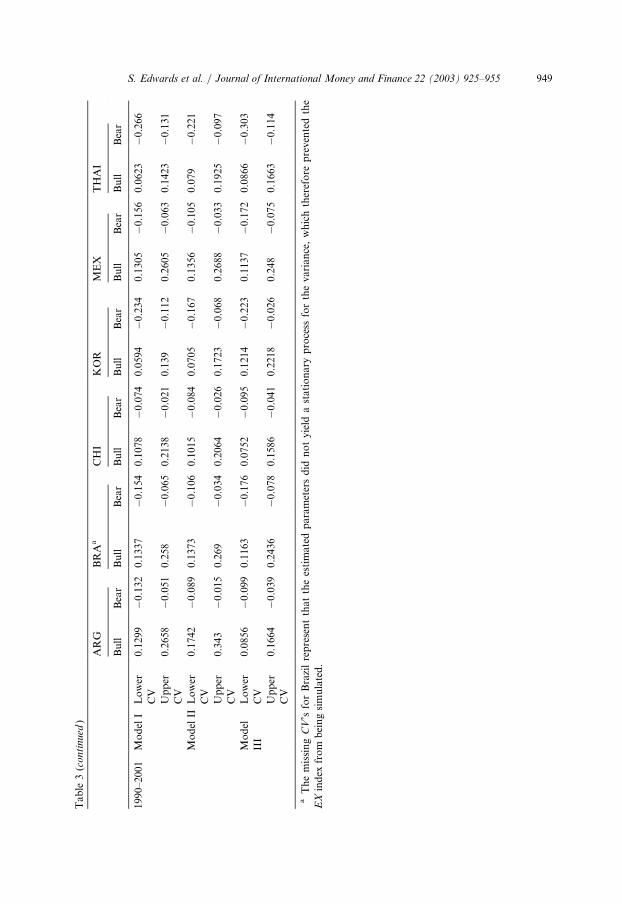
Table3(continued)
ARG
BRAa
CHI
KOR
MEX
THAI
Bull
Bear
Bull
Bear
Bull
Bear
Bull
Bear
Bull
Bear
Bull
Bear
1990–2001
ModelI
Lower
CV
0.1299
�0.132
0.1337
�0.154
0.1078
�0.074
0.0594
�0.234
0.1305
�0.156
0.0623
�0.266
Upper
CV
0.2658
�0.051
0.258
�0.065
0.2138
�0.021
0.139
�0.112
0.2605
�0.063
0.1423
�0.131
ModelII
Lower
CV
0.1742
�0.089
0.1373
�0.106
0.1015
�0.084
0.0705
�0.167
0.1356
�0.105
0.079
�0.221
Upper
CV
0.343
�0.015
0.269
�0.034
0.2064
�0.026
0.1723
�0.068
0.2688
�0.033
0.1925
�0.097
Model
III
Lower
CV
0.0856
�0.099
0.1163
�0.176
0.0752
�0.095
0.1214
�0.223
0.1137
�0.172
0.0866
�0.303
Upper
CV
0.1664
�0.039
0.2436
�0.078
0.1586
�0.041
0.2218
�0.026
0.248
�0.075
0.1663
�0.114
aThemissingCV’sforBrazilrepresentthattheestimatedparametersdid
notyield
astationary
process
forthevariance,whichtherefore
preventedthe
EXindex
from
beingsimulated.
949S. Edwards et al. / Journal of International Money and Finance 22 (2003) 925–955
noticeable during bull markets in the 1975–1989 period, and during bear marketsin the 1990–2001 period.
Period 1975–1989: Indeed, the shape of bull phases during the 1975–1989 periodis only well replicated for Korea, for which an EGARCH specification seems co-herent with the empirical value of the index. However, for the other five countriesthe empirical value of the EX index is significantly outside the simulated confidenceinterval. In the case of Argentina, Brazil, Mexico and Thailand the shape of thebull phase tends to be like that in Fig. 1B, where the market accelerates as the peakis being reached. In the case of Chile, the shape corresponds to that in Fig. 1A, sothe bigger returns are located at the beginning of the expansion. Bear phases, onthe other hand, are correctly replicated for Argentina and Chile, but not for thetwo Asian countries – where bear phases resemble Fig. 1D, with the big negativereturns present at the beginning of the phase – or for Brazil and Mexico – wherethe phases behave as in Fig. 1C, with an acceleration of the negative returns at theend of the phase.
Period 1990–2001: It is interesting to note that in this post liberalization periodbull phases are well accounted for in the cases of Brazil, Chile, Korea and Mexico.In other words, bull phases of most emerging markets become consistent with sim-ple statistical models of returns. Argentina and Thailand, however, still show somedepartures – the phases in both countries having the shape of Fig. 1B – but themagnitude of the departure is smaller than in the period prior to liberalization.Bear phases present another regularity. In all cases – except Thailand – the phasesafter liberalization resemble Fig. 1C: Large negative returns are present at the endof the bear phase, when the market is reaching the bottom of the cycle. This wouldbe in line with the finding that the troughs tended to come a few months after theonset of the different financial crises, and thus provide with some evidence in favorof the usefulness of the EX index in characterizing stock market behavior.It seems, therefore, that with financial liberalization the behavior of the stock
markets in emerging economies became more in line with what would be impliedby simple models of stock market behavior – compatible with market efficiency orwith some mild predictability. Gomez Biscarri and Perez de Gracia (2002) alsofound some departures from the random walk excess measure in their analysis ofEuropean markets. In the case of Europe, departures were much smaller in magni-tude and non-significant in most of the cases, but they were of a similar form tothose we detect in the post-liberalization period for emerging countries. This alsoreinforces the finding in Section 3, where emerging stock markets were found tobecome more similar to those in developed economies after financial liberalization.These results are also important for they point at a feature of stock market pre-
dictability that cannot easily be accommodated by traditional statistical modelsand that is not apparent from a casual examination of the series. Fig. 2 does givesome evidence of this result, but it is always difficult to disentangle the part of thedeparture from the triangle path that could be due to the drift of the market or tovariance effects. More complicated processes, such as stochastic volatility or regimeswitching models also fail to replicate this effect, plus they do a very poor job inreplicating some of the other features (see Pagan, 2002, Pagan and Sossounov,
S. Edwards et al. / Journal of International Money and Finance 22 (2003) 925–955950
2003, and Gomez Biscarri and Perez de Gracia, 2002). In the case of a two regimeswitching model (Hamilton, 1989), for example, the two regimes are indeed ident-ified with the bull and bear phases, but no distinction is made between the beha-vior of the series during the first and last months of each of the phases, a featurethat, as we have seen, appears in the data analyzed.
6. Conclusions
The possible consequences of financial liberalization processes in Latin Americacontinue to be a subject of discussion and controversy. For some researchers, thealleged short term increase in instability may prevent countries from reaping thelonger term gains.28 Consequently, the analysis of the medium term effects of finan-cial opening and its relation with induced instability becomes a key aspect of thebroad research project of understanding financial market transitions in emergingeconomics. In this paper we have analyzed some of the implications for stock mar-ket behavior of the financial liberalizations process in Latin America and Asia. Inorder to emphasize the medium term effects, our analysis is focused not on simplereturns but on the cycles of the stock market, which characterize stock marketbehavior over longer periods. We analyzed the characteristics of market cycles –distinguishing the bull and bear phases – for four Latin American and two Asiancountries. In addition to identifying the phases in the stock cycles we measuredseveral characteristics of the phases: Duration, amplitude, volatility within the phaseand the shape of the cycle.We placed special emphasis on the possible differences in behavior induced by
the financial liberalization processes. We found that, while the characteristics of thecycles in emerging markets differ quite markedly from those in developed econom-ies – namely, bull phases tend to be shorter, bear phases are longer, amplitude andvolatility of both phases is significantly higher than in developed markets – thefinancial liberalization processes have contributed to making Latin American stockmarkets more similar to those in more developed economies. Latin American stockmarkets after liberalization are less unstable: Volatility is lower in both cycle pha-ses and the amplitude of the phases has been significantly reduced, coming closerto that of developed countries. This is not the case, however, for Asian countries,that seem to have been affected too intensely by the financial crisis of 1997. Thereis evidence that these countries, especially Korea, are recovering their stability inthe most recent years, but it is still early to assess the medium-term consequences –if any – of the crisis.We also calculated concordance indexes for the countries in the sample, in an
attempt to detect whether the countries tend to be in the same phase of the stockmarket cycle or not, and whether there has been a tendency for this concordanceto increase over time. We showed that the behavior pre- and post-financial reform
28 For example, Aizenman (2002) examines the apparent trade-off between the short-term induced
instability and the long-run contribution to growth caused by financial opening.
951S. Edwards et al. / Journal of International Money and Finance 22 (2003) 925–955
has changed significantly, generally leading to a higher concordance of LatinAmerican countries, which by the end of our sample period were in almost perfectsynchronicity, and to a lower concordance of the Asian countries. These results areparallel, although some differences have been noted, to those based on correlationsof returns. The analysis based on return correlations, however, is probably affectedby short-term movements of the market and, given the significant presence of out-lying returns during crisis periods, they tend to give a distorted picture of the me-dium term evolution of the individual markets and of their concordance.An interesting corollary is obtained from the analysis of the shape of the cycle
phases. Before financial liberalization, the shape of the cycles in Latin Americanand Asian countries revealed significant predictabilities, by which returns showed‘‘acceleration’’ patterns depending on the closeness to the turning point – peak ortrough. These patterns were more marked than those in developed economies, thusmaking the evolution of the stock market more predictable and signalling the poss-ible existence of inefficiencies. After liberalization, the emerging markets exhibit abehavior much more similar to that in the developed countries: Even though bearphases still show some acceleration effect at the end of the phase – mostly a conse-quence of the financial crises of the late 1990s – the departures from what would beimplied by statistical models of market evolution – and the departures from thebehavior in developed economies – have been significantly reduced.Our analysis is a first step that opens up a broad and ambitious research pro-
gram. Once the stock market cycles have been identified and analyzed in their ownstance, several related questions arise. First, what is the relationship between realcycles and stock market cycles? Do recessions and expansions in emerging coun-tries have similar characteristics as bull and bear markets across countries and withrespect to the developed countries? Can the differing characteristics of emergingstock markets, and the changes in those characteristics, be traced to the real side?So far, little work has been done on real cycles in emerging countries, mostly dueto the lack of adequate data.Second, our finding of increased synchronicity in emerging stock markets raises
a causality question: Can the reasons be found in the real side of the economy –increased convergence of fundamentals, increased symmetry in exogeneous shocks– or is it merely a financial phenomenon – i.e., these countries just ‘‘look similar’’to outside investors that can now enter the newly liberalized markets? This pointraises the issue of whether emerging markets should indeed be considered as an‘‘asset class’’ of their own.Third, our results suggest that future work would benefit from a deeper examin-
ation of the institutional aspects of emerging markets. Broad and potentially fruit-ful questions arise such as the relationship between stock market behavior andinstitutional depth and development – including both political and economic insti-tutions – or the relationship between financial liberalization and other changes thatemerging countries have gone through – trade liberalization or the privatization ofspecific productive sectors.Finally from the financial side, our results are important in the context of the
literature of investment allocation and international risk diversification. The effects
S. Edwards et al. / Journal of International Money and Finance 22 (2003) 925–955952
we have identified after liberalization of the markets – that is, after the markets be-come increasingly available for outside investors – seem to provide relevant infor-mation for fund allocation. We have detected a higher synchronicity of emergingmarket behavior – which could translate into lower benefits of diversificationacross emerging countries – and also that returns and volatility both decrease withliberalization. These effects are likely to affect significantly the optimal allocation ofinvestment funds. A related question concerns the relationship of emerging stockmarkets with world portfolios: Is this relationship different during bull and bearphases? If it is, then again optimal rules for fund allocation may be significantlyaffected.As one can see, a number of interesting questions remain unanswered. We
believe that our analysis has given a first step in the direction of gaining a deeperunderstanding of the behavior of stock markets, although much exciting workremains to be done.
Acknowledgements
An earlier version of this paper was presented at the VII Annual Meeting ofLACEA (Madrid and October, 2002). We thank participants at the Universityof California, Santa Cruz Conference on ‘‘Regional and International Implicationsof the Financial Instability in Latin America’’ for fruitful discussions. We are parti-cularly grateful to Joshua Aizenman, Diego Valderrama, Jim Lothian and the ref-eree for most helpful comments and suggestions. Financial aid from theUniversidad de Navarra (Proyecto PIUNA 2001-9) is gratefully acknowledged.
References
Aggarwal, R., Inclan, C., Leal, R., 1999. Volatility in Emerging Stock Markets. Journal of Financial
and Quantitative Analysis 34 (1), 33–55.
Aizenman, J., 2002. Financial Opening: Evidence and Policy Options. Paper presented at the Challenges
to Globalization NBER-CEPR conference, May 2002.
Artis, M.J., Kontolemis, Z.G., Osborn, D.R., 1997. Business Cycles for G7 and European Countries.
Journal of Business 70 (2), 249–279.
Bekaert, G., Harvey, C.R., 2000. Capital Flows and the Behavior of Emerging Market Equity Returns.
In: Edwards, S. (Ed.), Capital Flows and Emerging Economies: Theory, Evidence and Controversies.
NBER, Cambridge, MA, pp. 159–194.
Bekaert, G., Harvey, C.R., Lumsdaine, R.L., 2002a. The Dynamics of Emerging Market Equity Flows.
Journal of International Money and Finance 21 (3), 295–350.
Bekaert, G., Harvey, C.R., Lumsdaine, R.L., 2002b. Dating the Integration of World Capital Markets.
Journal of Financial Economics 65 (2), 203–247.
Bekaert, G., Harvey, C.R., Lundblad, C., 2001. Emerging Equity Markets and Economic Development.
Journal of Development Economics 66 (2), 465–504.
Bekaert, G., Harvey, C.R., Ng, A., 2003. Market Integration and Contagion. Journal of Business (forth-
coming).
Bry, G., Boschan, C., 1971. Cyclical Analysis of Time Series: Selected Procedures and Computer Pro-
grams. NBER, New York.
953S. Edwards et al. / Journal of International Money and Finance 22 (2003) 925–955
Chakrabarti, R., Roll, R., 2002. East Asia and Europe during the 1997 Asian Collapse: A Clinical Study
of a Financial Crisis. Journal of Financial Markets 5 (1), 1–30.
Chen, G.M., Firth, M., Rui, O.M., 2002. Stock Market Linkages: Evidence from Latin America. Jour-
nal of Banking and Finance 26 (6), 1113–1141.
Choudhry, T., 1996. Stock Market Volatility and the Crash of 1987: Evidence from Six Emerging Mar-
kets. Journal of International Money and Finance 15 (6), 969–981.
De Gregorio, J., Edwards, S., Valdes, R., 2000. Controls on Capital Inflows: Do they work? Journal of
Development Economics 63 (1), 59–83.
DeLong, J.B., 1992. Bull and Bear in the United States. In: Newman, P., Milgate, M., Eatwell, J. (Eds.),
The New Palgrave Dictionary of Money and Finance. Mac Millan Press Limited, London, pp.
253–255.
Diebold, F.X., Rudebusch, G.D., 1996. Measuring Business Cycles: A Modern Perspective. Review of
Economics and Statistics 78 (1), 67–77.
Edwards, S., 1995. Crisis and Reform in Latin America: From Despair to Hope. Oxford University
Press, Oxford.
Edwards, S., 1999. How Effective are Capital Controls? Journal of Economic Perspectives 13 (4), 65–84.
Edwards, S., 2000. Contagion. The World Economy 23 (7), 873–900.
Edwards, S., 2003. Review of Joseph E Stiglitz’s ‘Globalization and its Discontents. Journal of Develop-
ment Economics 70 (1), 252–257.
Edwards, S., Gomez Biscarri, J., Perez de Gracia, F., 2003. Stock Market Cycles, Financial Liberal-
ization and Volatility. NBER Working Paper 9817.
Edwards, S., Susmel, R., 2003. Interest-Rate Volatility in Emerging Markets. Review of Economics and
Statistics 85 (2), 328–348.
Eichengreen, B., 2003. Capital Flows and Crises. MIT Press, Cambridge, MA.
Eichengreen, B., Mody, A., 2000. What Explains Changing Spreads on Emerging Market Debt? In:
Edwards, S. (Ed.), Capital Flows and Emerging Economies: Theory, Evidence and Controversies.
NBER, Cambridge, MA, pp. 107–136.
Fischer, S., 2002. Financial Crises and Reform of the International Financial System. NBER Working
Paper 9297.
Forbes, K., Rigobon, R., 2002. No Contagion, Only Interdependence: Measuring Stock Market
Comovements. Journal of Finance 57 (5), 2223–2261.
Galbraith, J.K., 1954. The Great Crash. Riverside Press, Cambridge, UK.
Goldman, S., 2002. GS Watch: A New Framework for Predicting Financial Crises in Emerging Mar-
kets. Goldman Sachs, New York.
Goldstein, M., 2003. Debt Sustainability, Brazil, and the IMF. IIE Working Paper 03-1.
Gomez Biscarri, J., Perez de Gracia, F., 2002. Stock Market Cycles and Stock Market Development in
Spain. Universidad de Navarra Department of Economics Working Paper 01/02.
Goodwin, T.H., 1993. Business-Cycle Analysis with a Markov-Switching Model. Journal of Business
and Economic Statistics 11 (3), 331–339.
Hamilton, J.D., 1989. A New Approach to the Economic Analysis of Nonstationary Time Series and
the Business Cycle. Econometrica 57 (2), 357–384.
Hamilton, J.D., 2003. Comment on ‘A Comparison of Two Business Cycle Dating Methods. Journal of
Economic Dynamics and Control 27 (9), 1691–1693.
Hamilton, J.D., Lin, G., 1996. Stock Market Volatility and the Business Cycle. Journal of Applied
Econometrics 11 (5), 573–593.
Harding, D., Pagan, A.R., 2000. Knowing the Cycle. In: Backhouse, R.E., Salanti, A. (Eds.), Macro-
economics and the Real World-Volume 1: Econometric Techniques and Macroeconomics. Oxford
University Press, Oxford, pp. 23–42.
Harding, D., Pagan, A.R., 2002. Dissecting the Cycle: A Methodological Investigation. Journal of Mon-
etary Economics 49 (2), 365–381.
Harding, D., Pagan, A.R., 2003a. A Comparison of two Business Cycle Dating Methods. Journal of
Economic Dynamics and Control 27 (9), 1681–1690.
S. Edwards et al. / Journal of International Money and Finance 22 (2003) 925–955954
Harding, D., Pagan, A.R., 2003b. Rejoinder to James Hamilton. Journal of Economic Dynamics and
Control 27 (9), 1695–1698.
Janakiramanan, S., Lamba, A.S., 1998. An Empirical Examination of Linkages between Pacific-Basin
Stock Markets. Journal of International Financial Markets, Institutions and Money 8 (2), 155–173.
Kaminsky, G., Reinhart, C., 2002. Financial Markets in Times of Stress. Journal of Development Eco-
nomics 69 (2), 451–470.
Kaminsky, G., Schmukler, S., 2003. Short-Run Pain, Long-Run Gain: The Effects of Financial Liberal-
ization. NBER Working Paper 9787.
Karolyi, G.A., Stulz, R., 1996. Why Do Markets Move Together? An Investigation of US-Japanese
Stock Return Comovements. Journal of Finance 51 (3), 951–986.
Keynes, J.M., 1936. The General Theory of Employment, Interest and Money Reprinted in The Col-
lected Writings of John Maynard Keynes. Macmillan Press Limited, London, 1973, (vol.7).
Kim, C., Nelson, C.R., 1999. State-Space Models with Regime Switching. MIT Press, Cambridge, MA.
King, M., Wadhwani, S., 1990. Transmission of Volatility between Stock Markets. Review of Financial
Studies 3 (1), 5–33.
Krugman, P., 2000. The Return of Depression Economics. Norton, New York.
Lee, S.B., Kim, K.J., 1993. Does the October 1987 Crash strengthen the Co-movements among National
Stock Markets? Review of Financial Economics 3 (1), 89–102.
Maddala, G.S., Li, H., 1996. Bootstrap Based Tests in Financial Modeling. In: Maddala, G.S., Rao,
C.R. (Eds.), Handbook of Statistics Vol. 14: Statistical Methods in Finance. North-Holland Publish-
ers, Amsterdam, pp. 463–488.
Maheu, J.M., McCurdy, T.H., 2000. Identifying Bull and Bear Markets in Stock Returns. Journal of
Business and Economic Statistics 18 (1), 100–112.
Pagan, A.R., 2002. Learning about Models and their Fit to the Data. International Economic Journal
16 (2), 1–18.
Pagan, A.R., Sossounov, K.A., 2003. A Simple Framework for Analyzing Bull and Bear Markets. Jour-
nal of Applied Econometrics 18 (1), 23–46.
Ramchand, L., Susmel, R., 1998. Volatility and Cross Correlation across Major Stock Markets. Journal
of Empirical Finance 5 (4), 397–416.
Rigobon, R., 2003. On the Measurement of the International Propagation of Shocks: Is it Stable? Jour-
nal of International Economics (forthcoming).
Shiller, R.J., 1989. Market Volatility. MIT Press, Cambridge, MA.
Shiller, R.J., 2000. Irrational Exuberance. Broadway Books, New York.
Siegel, J.J., 1998. Stocks for the Long Run. McGraw-Hill, New York.
Stiglitz, J., 2002. Globalization and its Discontents. Norton, New York.
Watson, M.W., 1994. Business-Cycle Durations and Postwar Stabilization of the US Economy. Amer-
ican Economic Review 84 (1), 24–46.
Wolf, H., 1996. Comovements among Emerging Equity Markets. In: Glick, R (Ed.), Managing Capital
Flows and Exchange Rates. Perspectives from the Pacific Basin. Cambridge University Press, Cam-
bridge, MA, pp. 267–285.
955S. Edwards et al. / Journal of International Money and Finance 22 (2003) 925–955