stock assessment of scup (stenotomus chrysops) for … fisheries science center reference document...
TRANSCRIPT
Northeast Fisheries Science Center Reference Document 12-25
Stock Assessment of Scup (Stenotomus chrysops) for 2012
by Mark Terceiro
Northeast Fisheries Science Center Reference Document 12-25
US DEPARTMENT OF COMMERCENational Oceanic and Atmospheric Administration
National Marine Fisheries ServiceNortheast Fisheries Science Center
Woods Hole, MA
October 2012
Stock Assessment ofScup (Stenotomus chrysops) for 2012
by Mark Terceiro
National Oceanic Atmospheric Administration, National Marine Fisheries Service,Northeast Fisheries Science Center, 166 Water Street, Woods Hole, MA,
02543 USA
Northeast Fisheries Science Center Reference Documents
This series is a secondary scientific series designed to assure the long-term documentation and to enable the timely transmission of research results by Center and/or non-Center researchers, where such results bear upon the research mission of the Center (see the outside back cover for the mission statement). These documents receive internal scientific review, and most receive copy editing. The National Marine Fisheries Service does not endorse any proprietary material, process, or product mentioned in these documents. All documents issued in this series since April 2001, and several documents issued prior to that date, have been copublished in both paper and electronic versions. To access the electronic version of a document in this series, go to http://www.nefsc.noaa.gov/nefsc/publications/. The electronic version is available in PDF format to permit printing of a paper copy directly from the Internet. If you do not have Internet access, or if a desired document is one of the pre-April 2001 documents available only in the paper version, you can obtain a paper copy by contacting the senior Center author of the desired document. Refer to the title page of the document for the senior Center author’s name and mailing address. If there is no Center author, or if there is corporate (i.e., non-individualized) authorship, then contact the Center’s Woods Hole Labora-tory Library (166 Water St., Woods Hole, MA 02543-1026). Editorial Treatment: To distribute this report quickly, it has not undergone the normal tech-nical and copy editing by the Northeast Fisheries Science Center’s (NEFSC’s) Editorial Office as have most other issues in the NOAA Technical Memorandum NMFS-NE series. Other than the four covers and first two preliminary pages, all writing and editing have been performed by the authors listed within. Information Quality Act Compliance: In accordance with section 515 of Public Law 106-554, the Northeast Fisheries Science Center completed both technical and policy reviews for this report. These predissemination reviews are on file at the NEFSC Editorial Office. This document may be cited as:
Terceiro M. 2012. Stock assessment of scup (Stenotomus chrysops) for 2012. US Dept Commer, Northeast Fish Sci Cent Ref Doc. 12-25; 104 p. Available from: National Marine Fisheries Service, 166 Water Street, Woods Hole, MA 02543-1026, or online at http://www.nefsc.noaa.gov/nefsc/publications/
ii
TABLE OF CONTENTS
Executive Summary ....................................................................................................................... iii Background ..................................................................................................................................... 1 Commercial Fishery Landings ........................................................................................................ 4 Commercial Fishery Discards ......................................................................................................... 5 Recreational Fishery Catch ............................................................................................................. 6 Marine Recreational Information Program Estimates of Recreational Fishery Catch ................... 6 Commercial Fishery Landings at Length and Age ......................................................................... 7 Commercial Fishery Discards at Length and Age .......................................................................... 8 Recreational Fishery Landings at Length and Age ......................................................................... 8 Recreational Fishery Discards at Length and Age .......................................................................... 8 Total Fishery Catch ......................................................................................................................... 9 Research Survey Indices of Abundance ......................................................................................... 9 2011 Updated Fishing Mortality Rate and Stock Size Estimates ................................................. 13 2008 DPS Assessment Biological Reference Points .................................................................... 14 2011 Updated Stock Status ........................................................................................................... 14 Assessment Uncertainty Considerations ....................................................................................... 14 Projection of the Overfishing Limit (OFL) for 2013 .................................................................... 15 Acknowledgements ....................................................................................................................... 15 References Cited ........................................................................................................................... 16
iii
EXECUTIVE SUMMARY
This assessment of the scup (Stenotomus chrysops) stock along the Atlantic coast (Massachusetts to North Carolina) is an update through 2011 of commercial and recreational fishery (MRIP) catch data, research survey indices of abundance, and the analyses of those data. The stock was not overfished and overfishing was not occurring in 2011 relative to the biological reference points established in the 2008 Northeast Data Poor Stocks (DPS) assessment. The fishing mortality rate (F) was estimated to be 0.034 in 2011, below the fishing mortality threshold reference point = Fishing mortality producing Maximum Sustainable Yield (FMSY) = F40% = 0.177. Spawning Stock Biomass (SSB) was estimated to be 190,424 metric tons (mt) = 420 million lbs in 2011, above the biomass target reference point = SSBMSY = SSB40% = 92,044 mt = 203 million lbs. Reported 2011 landings in the commercial fishery were 6,819 mt = 15.033 million lbs, about 73% of the commercial quota. Estimated 2011 landings in the recreational rod-and-reel fishery (as estimated by the MRIP) were 1,632 mt = 3.598 million lbs, about 61% of the recreational harvest limit. Total commercial and recreational landings in 2011 were 8,451 mt = 18.631 million lbs and total commercial and recreational discards were 2,086 mt = 4.599 million lbs, for a total catch in 2011 of 10,537 mt = 23.230 million lbs. Spawning stock biomass decreased from about 100,000 mt in 1963 to about 50,000 mt in 1969, then increased to about 75,000 mt during the late 1970s. SSB declined through the 1980s and early 1990s to less than 5,000 mt in the mid-1990s. SSB increased to above 100,000 mt = 220 million lbs since 2004 due to improved recruitment and low fishing mortality. SSB was estimated to be 190,424 mt = 420 million lbs in 2011. There is a 50% probability that SSB in 2011 was between 185,000 and 198,000 mt (408 and 436 million lbs). Fishing mortality calculated from the average of the currently fully recruited ages (2-7+) varied between F = 0.1 and F = 0.3 during the 1960s and 1970s. Fishing mortality increased during the 1980s and early 1990s, peaking at about F = 1.0 in the mid-1990s. Fishing mortality decreased after 1994, falling to less than F = 0.1 since 2001, with F in 2011 = 0.034. There is a 50% probability that F in 2011 was between 0.026 and 0.042. Recruitment at age 0 averaged 92 million fish during 1963-1983, the period in which recruitment estimates are influenced mainly by the assessment model stock-recruitment relationship. Since 1984, recruitment estimates from the model are influenced mainly by the fishery and survey catches at age, and averaged 110 million fish during 1984-2011. The 1999, 2000, and 2008 year classes are estimated to be the largest of the time series, at 207, 226, and 215 million age 0 fish. After below average recruitment in 2009 and 2010, the 2011 year class is estimated to be above average at 154 million age 0 fish. There is no consistent internal retrospective pattern in F, SSB, or recruitment evident in the 2012 updated assessment model. A between-assessment comparison provides another measure of assessment uncertainty due to changes in model estimates. The 2012 assessment estimates of SSB and F are intermediate with respect to the 2008 DPSWG assessment and 2009 update for the same years, and are very similar to those from 2010 and 2011 updates. The 2012 assessment estimates of the size of the 2007 through 2010 year classes are in general larger compared to the 2011 assessment. If the landings of scup in 2012 equal the specified Total Allowable Landings (TAL) = 16,749 mt = 36.925 million lbs, the 2012 median (50% probability) discards are projected to be
iv
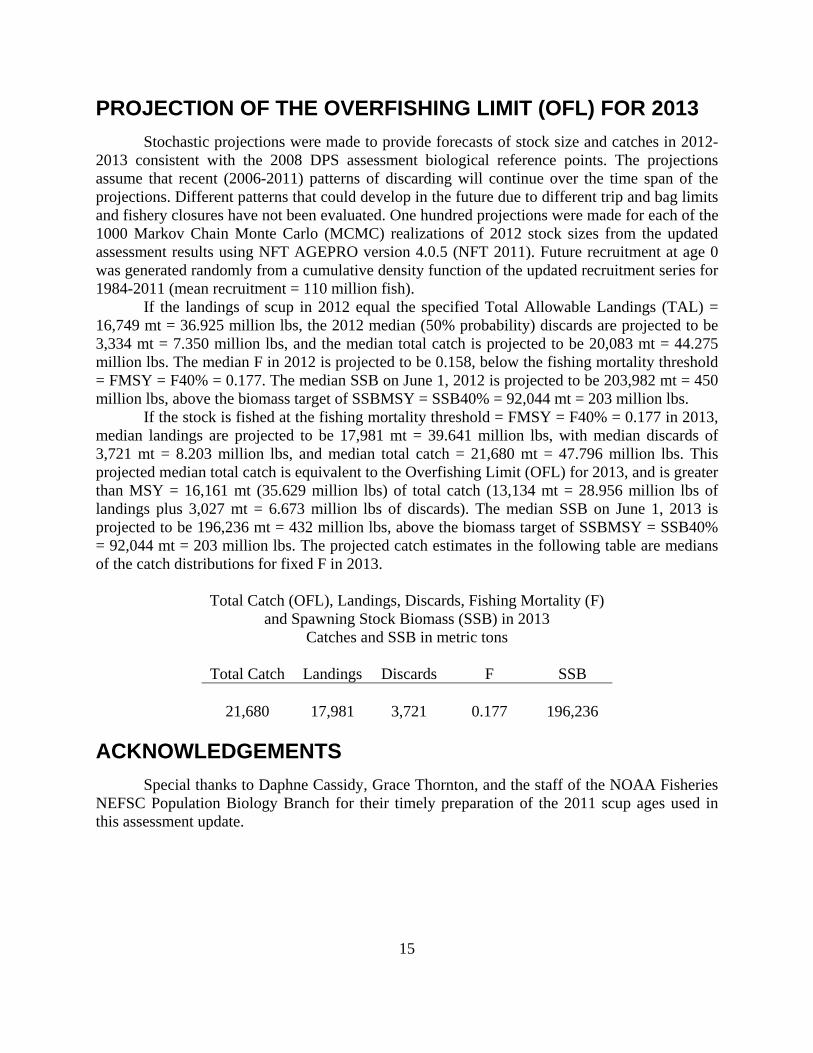
3,334 mt = 7.350 million lbs, and the median total catch is projected to be 20,083 mt = 44.275 million lbs. The median F in 2012 is projected to be 0.158, below the fishing mortality threshold = FMSY = F40% = 0.177. The median SSB on June 1, 2012 is projected to be 203,982 mt = 450 million lbs, above the biomass target of SSBMSY = SSB40% = 92,044 mt = 203 million lbs. If the stock is fished at the fishing mortality threshold = FMSY = F40% = 0.177 in 2013, median landings are projected to be 17,981 mt = 39.641 million lbs, with median discards of 3,721 mt = 8.203 million lbs, and median total catch = 21,680 mt = 47.796 million lbs. This projected median total catch is equivalent to the Overfishing Limit (OFL) for 2013, and is greater than MSY = 16,161 mt (35.629 million lbs) of total catch (13,134 mt = 28.956 million lbs of landings plus 3,027 mt = 6.673 million lbs of discards). The median SSB on June 1, 2013 is projected to be 196,236 mt = 432 million lbs, above the biomass target of SSBMSY = SSB40% = 92,044 mt = 203 million lbs. The projected catch estimates in the following table are medians of the catch distributions for fixed F in 2013.
Total Catch (OFL), Landings, Discards, Fishing Mortality (F) and Spawning Stock Biomass (SSB) in 2013
Catches and SSB in metric tons
Total Catch Landings Discards F SSB
21,680 17,981 3,721 0.177 196,236
1
BACKGROUND
Biology Scup (Stenotomus chrysops) is a schooling continental shelf species of the Northwest
Atlantic that is distributed primarily between Cape Cod and Cape Hatteras (Morse 1978). Scup undertake extensive migrations between coastal waters in summer and offshore waters in winter. Scup migrate north and inshore to spawn in spring, with larger fish (age 2 and older) tending to arrive in spring first, followed by smaller fish (Neville and Talbot 1964; Sisson 1974). Larger scup are found during the summer near the mouth of large bays and in the ocean within 20-fathoms (120 feet = 37 meters), and often inhabit rough bottom areas. Smaller scup are more likely to be found in shallow, smooth bottom areas of bays during summer (Morse 1978). Scup migrate south and offshore in the fall as the water temperature decreases, arriving in offshore wintering areas by December (Hamer 1970; Morse 1978).
Spawning occurs from May through August and peaks in June. About 50% of age-2 scup are sexually mature (about 17 cm total length; Morse 1978), while nearly all scup of age 3 and older are mature. Scup reach a maximum fork length of at least 41 cm and a maximum age of at least 14 years, with a likely maximum of 20 years (Dery and Rearden 1979). The largest and oldest scup sampled in Northeast Fisheries Science Center (NEFSC) surveys (1973, 1976, 1978) were fish 38-41 cm (fork length) and 14 years old. The largest and oldest scup in NEFSC commercial fishery samples (1974) was 40 cm (fork length) and 14 years old. The instantaneous natural mortality rate (M) for scup has been assumed to be 0.20 (Crecco et al. 1981, Simpson et al. 1990) in this and all previous stock assessments.
Fishery Management The Mid-Atlantic Fishery Management Council (MAFMC) and Atlantic States Marine
Fisheries Commission (ASMFC) jointly manage scup under Amendment 8 (1997) to the Scup, Scup, and Black Sea Bass Fishery Management Plan (FMP). The assessment and management unit includes all scup from Cape Hatteras, NC north to the US-Canada border. Tagging studies (e.g., Neville and Talbot 1964; Cogswell 1960, 1961; Hamer 1970, 1979) have indicated the possibility of two stocks of scup, one in Southern New England waters and another extending south from New Jersey waters. However, the lack of definitive locations for tag return data coupled with distributional data from the NEFSC bottom trawl surveys supports the concept of a single unit stock (Mayo 1982).
Amendment 8 to the FMP established a recovery plan for scup under which exploitation rates were to be reduced to 47% (F=0.72) during 1997-1999, to 33% (F=0.45) during 2000-2001, and to 21% (F=0.26) during 2002-2007. These goals were to be attained through implementation of a Total Allowable Catch (TAC) that included a commercial quota and a recreational harvest limit, commercial fishery minimum net mesh, trap vent and fish sizes and closed areas, and recreational fishery minimum fish sizes, possession limits, and closed seasons.
Amendment 12 (1998) to the FMP established a biomass threshold (a proxy for one-half BMSY) for scup based on the three-year moving average of the NEFSC spring bottom trawl survey index of SSB during 1977-1979, which was perceived to be a period when the stock was near one-half BMSY. The scup stock was considered to be overfished when the SSB index fell below a value of 2.77 SSB kg per tow. Amendment 12 defined overfishing for scup to occur
2
when the fishing mortality rate exceeded the threshold fishing mortality of Fmax = 0.26 (as a proxy for FMSY).
Broad scale Gear Restricted Areas (GRAs) for scup were implemented in November 2000 under the framework provisions of the FMP to reduce discards of scup in the small mesh fisheries for Loligo squid and silver hake. Two Northern Areas off Long Island were implemented for November through January, while a Southern Area off the mid-Atlantic coast was implemented for January through April. The size and boundaries of the GRAs were modified in late 2000 and again in 2005 in response to commercial fishing industry recommendations.
Amendment 14 (2007) to the FMP defined the biomass target and implemented a stock rebuilding plan for scup. The stock was to fully rebuild to the biomass target by January 1, 2015. The proxy for BMSY was two times the 3-year moving average of the NEFSC spring index of SSB during 1977-1979 noted earlier, or 2*2.77 = 5.54 SSB kg per tow. A target fishing mortality rate of F = 0.10 was to be applied in each year of a 7 year rebuilding period beginning in 2008. A TAC of 4,491 mt = 9.901 million lbs and corresponding Total Allowable Landings (TAL) of 3,329 mt = 7.339 million lbs were established for 2008 to achieve the target F.
The current overfished and overfishing definitions are based on revisions to the FMP through Framework 7 (2007) and use the values established in Amendments 12 (1998) and 14 (2007) as follows:
The maximum fishing mortality threshold for each of the species under the FMP is defined as FMSY (or a reasonable proxy thereof) as a function of productive capacity, and based upon the best scientific information consistent with National Standards 1 and 2. Specifically, FMSY is the fishing mortality rate associated with MSY. The maximum fishing mortality threshold (FMSY) or a reasonable proxy may be defined as a function of (but not limited to): total stock biomass, spawning stock biomass, total egg production, and may include males, females, both, or combinations and ratios thereof which provide the best measure of productive capacity for each of the species managed under the FMP. Exceeding the established fishing mortality threshold constitutes overfishing as defined by the Magnuson-Stevens Act.
The minimum stock size threshold for each of the species under the FMP is defined as one-half BMSY (or a reasonable proxy thereof) as a function of productive capacity, and based upon the best scientific information consistent with National Standards 1 and 2. The minimum stock size threshold (one-half BMSY) or a reasonable proxy may be defined as a function of (but not limited to): total stock biomass, spawning stock biomass, total egg production, and may include males, females, both, or combinations and ratios thereof which provide the best measure of productive capacity for each of the species managed under the FMP. The minimum stock size threshold is the level of productive capacity associated with the relevant one-half MSY level. Should the measure of productive capacity for the stock or stock complex fall below this minimum threshold, the stock or stock complex is considered overfished. The target for rebuilding is specified as BMSY (or reasonable proxy thereof) at the level of productive capacity associated with the relevant MSY level, under the same definition of productive capacity as specified for the minimum stock size threshold.
Stock Assessment A peer-reviewed assessment including an analytical population model was accepted in
1995 by SAW 19 (NEFSC 1995). The assessment featured a virtual population analysis (VPA)
3
modeled in the ADAPT framework (Conser and Powers 1990), with commercial and recreational landings and discards at age estimates, and with state and NEFSC abundance indices used for calibration. The 1995 SAW 19 assessment indicated that F in 1993 was 1.3, and SSB was 4,600 mt = 10.141 million lbs. A yield per recruit (YPR) analysis indicated that Fmax = 0.236.
The VPA was updated through 1996 and reviewed by the 1997 SAW 25 (NEFSC 1997), but due to concerns over the low intensity of fishery length sampling in the 1990s, uncertainty about the magnitude of commercial discards in the late 1990s, and the ongoing high variability and imprecision of survey indices, the VPA was not accepted as a basis for management decisions. Assessment conclusions were therefore based primarily on trends in NEFSC and state agency survey indices and catch curve analyses using those survey data. The 1997 SAW 25 was able to conclude that in 1996 scup were over-exploited and near record low abundance levels.
The scup assessment was next updated through 1997 and reviewed by the 1998 SAW 27 (NEFSC 1998). Several configurations of a surplus production model (ASPIC; Prager 1994) were reviewed in addition to an updated VPA, but like the VPA, the production model results were not accepted due to concerns over the validity of the input fishery and survey data. An updated YPR analysis was accepted and indicated that Fmax = 0.26. The 1998 SAW 27 concluded that a VPA or other analytical model formulation for scup would not be feasible until the quality of the input data, particularly the precision of discard estimates, was significantly improved and that scup was over exploited and at a low biomass level.
The 1998 SAW 27 Panel recommended the scup assessment be based on the long-term time series of NEFSC trawl survey indices and fishery catches. The Panel noted that commercial landings were sustained at about 19,000 mt = 41.888 million lbs annually during the mid-1950s to mid-1960s, and concluded that the stock was likely near BMSY during that period (Figure 1). The nearest subsequent peak in NEFSC survey indices occurred in the late 1970s. Commercial and total fishery catches in the late 1970s were about one-half of those in the 1950s to 1960s, and so the late 1970s were identified as a period when the stock was likely to have been near one-half of BMSY. The Panel considered the NEFSC spring survey series to be most representative of SSB, since older ages were better represented in the age structure than in the NEFSC fall survey or other state agency surveys. The 1998 SAW 27 Panel recommended that the three-year moving average of the NEFSC spring bottom trawl survey index of SSB during 1977-1979 (2.77 SSB kg per tow) be used as the proxy biomass threshold (one-half BMSY) and that Fmax = 0.26 be used as the proxy fishing mortality threshold (FMSY). Those recommendations were subsequently adopted for the biological reference points in Amendment 12 to the FMP.
The scup assessment was next updated through 1999 and reviewed by the 2000 SAW 31 (NEFSC 2000). The assessment continued to be based on trends in research survey indices and fishery catches and indicated that the stock was overfished and that overfishing was occurring. The stock assessment was reviewed again by the 2002 SAW 35 and included fishery data through 2001 (NEFSC 2002). The assessment was again based on trends in research survey indices and fishery catches, but indicated that the stock was no longer overfished, although the 2002 SAW 35 Panel concluded that stock status with respect to the overfishing definition could not be evaluated due to the uncertainty of F estimates derived from research survey catch curve calculations. The 2002 SAW 35 Panel found sufficient evidence to conclude that the relative exploitation rates had declined in recent years and that survey observations indicated strong recruitment and some rebuilding of age structure.
4
During 2002-2008, the status of the stock was evaluated by the MAFMC Monitoring Committee using trends in research survey indices and fishery catches. A relative exploitation index based on the annual total fishery landings and the NEFSC spring three-year average SSB index was used as a proxy for F to monitor status with respect to overfishing and provide guidance to the specification of the annual TAC. A projection of the NEFSC spring survey SSB index using assumptions about maturity, partial recruitment to the survey, and the level of future recruitment as indexed by the NEFSC spring survey at age 1 was used in Amendment 14 to the FMP to forecast stock rebuilding and set the F target for 2008-2105. An update to the status monitoring metrics was completed in 2008 to aid in the specification of fishery regulations for 2009. The update indicated that while the stock was overfished in 2007, the exploitation rate was at about the F target, suggesting that overfishing was not occurring in 2007. However, the stock rebuilding progress was slower than forecast by the Amendment 14 projection, with the NEFSC spring 2007 SSB index (three-year average = 1.16 kg per tow) at only 56% of the projected 2007 index (2.08 kg per tow). The most recent peer review of the scup assessment was conducted by the 2008 Northeast Data Poor Stocks (DPS) Peer Review Panel (NEFSC 2009), which accepted an Age Structured Assessment Program (ASAP) statistical catch at age (SCAA) model (NFT 2008) as the basis for biological reference points and status determination, with fishery and survey catch data through 2007. The new model of scup population dynamics was expected to provide a more stable tool for monitoring stock status and specifying annual fishery regulations than the previous single index-based model. The assessment indicated that the stock was not overfished and overfishing was not occurring in 2008, relative to the revised biological reference points. Fishing mortality was estimated to have decreased rapidly after 1994, with F in 2007 = 0.054. With greatly improved recruitment and relatively low fishing mortality rates since 1998, SSB was estimated to have steadily increased to about 119,300 mt = 263 million lbs in 2007. There was no consistent retrospective pattern in F, SSB, or recruitment evident in the 2008 assessment model. Following the 2008 DPS stock assessment, the NMFS declared scup to be officially rebuilt in 2009. This 2012 assessment update uses the same model configuration as the 2008 DPS (NEFSC 2009) benchmark and 2009-2011 assessment updates (Terceiro 2009, 2010, 2011). The updated population model includes with fishery and survey catch information through 2011. The 2012 evaluation of stock status is made with respect to the 2008 DPS biological reference points.
COMMERCIAL FISHERY LANDINGS
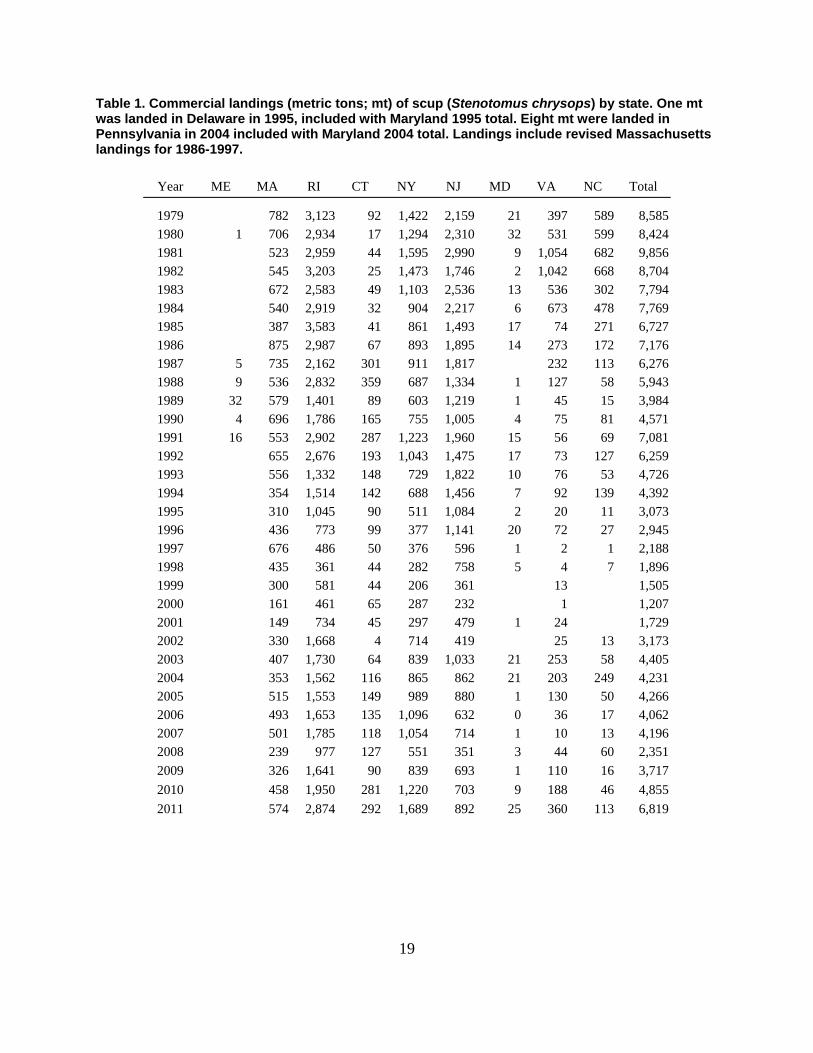
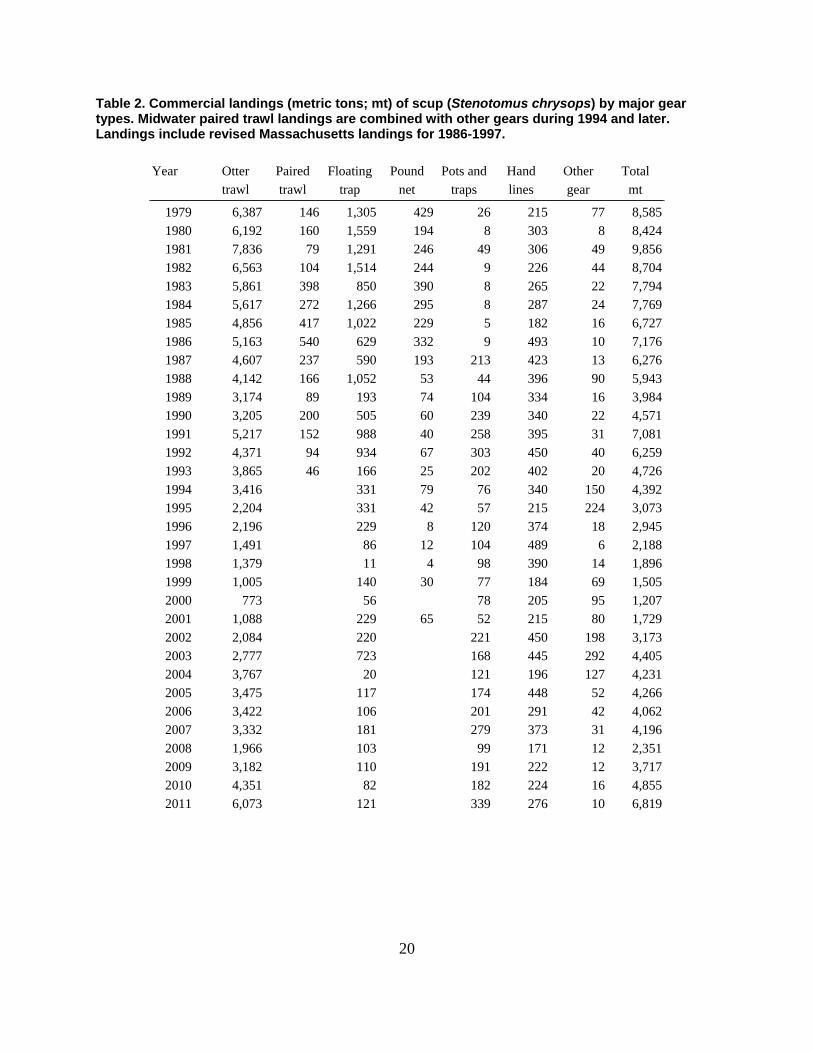
United States total commercial landings averaged over 18,000 mt per year from 1950 to 1965, peaking at over 22,000 mt in 1960, and then decreased to less than 10,000 mt per year in the late 1960s. Landings fluctuated between about 5,000 and 10,000 mt from 1970 to the early 1990s and then decreased to about 1,200 mt in 2000, less than 6% of the peak observed in 1960. Commercial landings have since increased to average about 4,000 mt during 2003-2011 (Figure 1). Reported 2011 landings in the commercial fishery were 6,819 mt = 15.033 million lbs, about 73% of the commercial quota. About eighty percent of the commercial landings of scup since 1979-2011 were in Rhode Island (38%), New Jersey (26%), and New York (16%; Table 1). The otter trawl is the principal commercial fishing gear, accounting for about 75% of the total catch since 1979 (Table 2). The remainder of the commercial landings is taken by floating trap (11%)
5
and hand lines (7%), with paired trawl, pound nets, and pots and traps each contributing between 1 and 4%.
COMMERCIAL FISHERY DISCARDS
The NEFSC Fishery Observer Program has collected information on landings and discards in the commercial fishery since 1989. Northeast Region (NER; ME-VA) discard estimates were raised to account for North Carolina landings. A discard mortality rate of 100% was assumed because there are no published estimates of scup discard mortality rates. This assumption is based on limited observations and is a point of contention between scientists and fishermen. Previous peer reviews of the assessment have recommended that research be conducted to better characterize the discard mortality rate of scup in different gear types in order to more accurately quantify the absolute magnitude of scup discard mortality (NEFSC 1995, 1997, 1998, 2000, 2002, 2009). Quantifying discards from the commercial fishery is necessary for a reliable scup assessment, but low sample sizes in the past have resulted in uncertain estimates. Despite the uncertainty of the discard data, recent peer review panels have concluded that commercial discarding of scup has been high during most of the last 20 years, generally approaching or exceeding the commercial landings. Since the implementation of the GRAs in 2000, estimated discards have averaged 35%-40% of the total commercial catch.
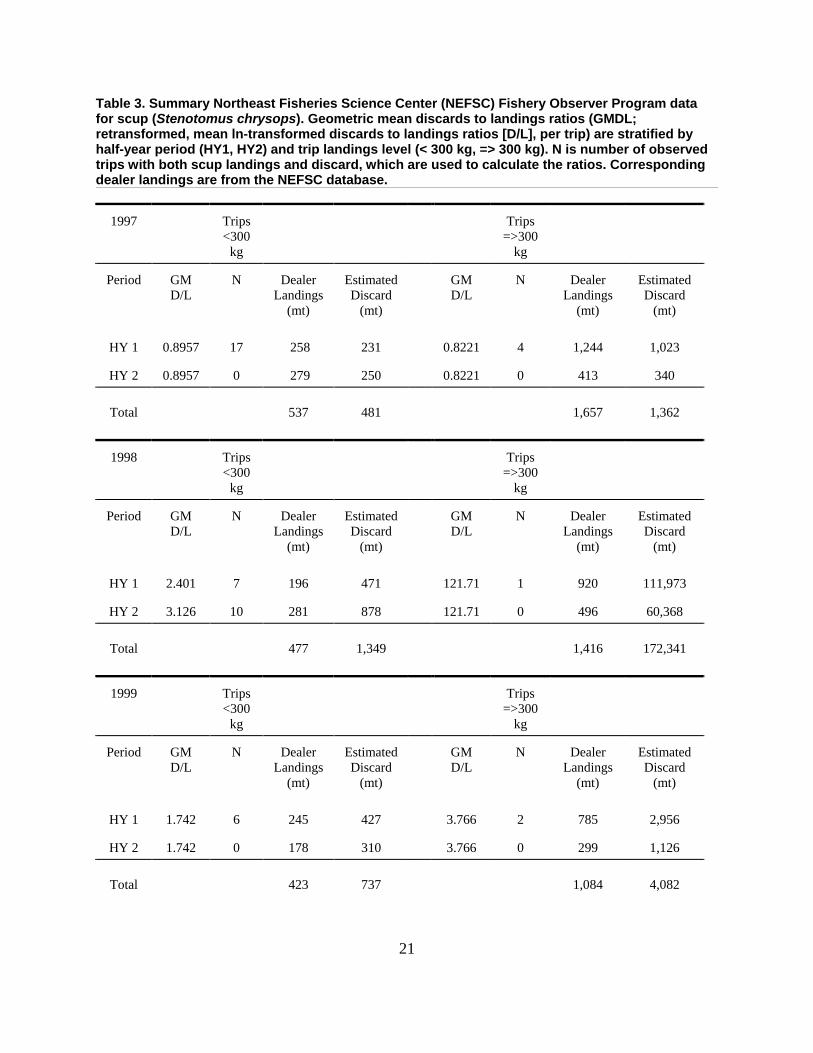
Commercial discards for scup are estimated using geometric mean discards to landings (GMDL) ratios. Ratios of discards to landings are stratified by landings level (for trip landings < 300 kg (661 lbs), the bycatch fishery; or => 300 kg, the directed fishery) and half-year and multiplied by corresponding observed scup landings from the NEFSC Dealer Report database to provide estimates of scup discards. Geometric mean rates (re-transformed, uncorrected, mean ln-transformed Discards to Landings per trip) are used because the distributions of landings, discards and the ratio of discards to landings on a per-trip basis in the scup fishery are highly variable and positively skewed. Observed trips with both scup landings and discard were used to calculate per trip discard to landings ratios. Only trips with both non-zero landings and discards could be used for this approach to avoid division by zero. The number of trawl gear trips used to calculate the geometric mean discard-to-landings ratios (GMDL) by half year for 1997-2008 ranged from 1 to 104 for trips < 300 kg and from 1 to 35 for trips =>300 kg, with the best sampling occurring since 2003. No trawl gear trips were available for half year two in 1997 and 1999 for trips < 300 kg and for half year two in 1997-2001 for trips => 300 kg. The ratio calculated for half year one was used to estimate discards for half year two when no trawl gear trips were available in half year two. The ratios ranged from 0.03 in 2004 (half year two, trips => 300 kg) to 121.71 in 1998 (half year one, trips => 300 kg; Table 3).
The large 1998 directed fishery ratio and subsequent very high annual discard estimate (111,973 mt) was based on a single trawl gear trip. About 93% of the discard from that trip was attributable to a single tow in which an estimated 68.2 mt (150,000 lbs.) of scup were captured. This tow was not lifted from the water and the captain of the vessel estimated the weight of the catch. There has been debate concerning the validity of the catch weight estimate and whether or not it was representative of other vessels or trips in the fishery. However, the observation was reported by a trained NEFSC observer and was therefore included in the initial calculation of the estimate of scup discards (Table 3). Peer reviews of the assessment have since concluded that the
6
1998 estimate (173,690 mt) is infeasible, and it has been replaced by the mean of the 1997 and 1999 estimates (3,331 mt; Table 4).
RECREATIONAL FISHERY CATCH
Scup is the object of a major recreational fishery, with the greatest proportion of catches taken in the states of Massachusetts, Rhode Island, Connecticut and New York. Estimates of the recreational catch in numbers were obtained from the NMFS Marine Recreational Fishery Statistics Survey (MRFSS) for 1981-2011, and from the NMFS Marine Recreational Information Program (MRIP) for 2004-2011. These estimates were available for three categories: type A - fish landed and available for sampling, type B1 - fish landed but not available for sampling and type B2 - fish caught and released. The estimated recreational landings (types A and B1) in weight during 1981-2011 as estimated by the MRFSS averaged about 2,000 mt per year (Table 5). MRFSS estimated 2011 landings in the recreational rod-and-reel fishery were 1,593 mt = 3.512 million lbs, about 61% of the recreational harvest limit. Since 1981, the recreational landings have averaged 33% of the commercial and recreational landings total.
The commercial fishery VTR system provides an alternative set of reported recreational landings by the party/charter boat sector. A comparison of VTR reports and MRFSS estimates indicates that MRFSS estimates were on average about 50% higher over the 1995-2011 period, ranging from a factor of 0.34 in 1998 to 2.43 in 2009 (Table 6). It is unclear if this is due mainly to under-reporting of party/charter boat recreational landings in the VTR system, or a systematic positive bias of MRFSS landings estimates for the party/charter boat sector.
The estimated recreational live discard in weight during 1984-2011 ranged from 39 mt in 1999 to a high of 2,031 mt in 2010, averaging about 600 mt per year (Table 7). The weight of discards has been directly calculated only for those years (1984 and later) for which recreational catch at age has been compiled. In compilations of total fishery catch for earlier years, the recreational discards was assumed to be approximately 2% of the estimated recreational landings, based on the mean discard percentage for 1984-1996, the time period with catch at age estimates before the implementation of the FMP. The discard mortality rate in the recreational fishery has been reported to range from 0-15% (Howell and Simpson 1985) and from 0-14% (pers. comm, Williams E., University of Rhode Island, Department of Fisheries and Aquaculture. November 1, 1994). Howell and Simpson (1985) found mortality rates were positively correlated with size, due mainly to the tendency for larger fish to take the hook deep in the esophagus or gills. Williams more clearly demonstrated increased mortality with depth of hook location, as well as handling time, but found no association with fish size. Based on these studies, a discard mortality rate in the recreational fishery of 15% has been used in this and previous assessments, resulting in a time series average discard mortality of about 100 mt per year.
MARINE RECREATIONAL INFORMATION PROGRAM ESTIMATES OF RECREATIONAL FISHERY CATCH
The NMFS Marine Recreational Fishery Statistics Survey (MRFSS) was replaced by the Marine Recreational Information Program (MRIP) in 2012 to provide improved recreational fishing statistics. The MRIP implemented a new statistical method for calculating recreational catch estimates, with many survey elements related to both data collection and analysis updated
7
and refined to address issues such as data gaps, bias, consistency, accuracy, and timeliness. As part of the implementation of the MRIP, recreational fishery catch estimates for 2004-2011 have been directly replaced by those using the MRIP estimation methods. For earlier years, a constant “ratio of means” of the MRFSS and MRIP estimates has been used to adjust the recreational catch estimates (Tables 5, 7). For the recreational fishery harvest number (catch types A + B1), the largest change was for the commonwealth of MA, with a cumulative 2004-2011 increase of about 4 million fish, about +67% and also the largest cumulative percentage increase amongst the states. The largest absolute decrease was for the state of RI with a cumulative 2004-2011 decrease of about 289,000 fish, or about -7%. The state of MD had the largest cumulative percentage decrease at -67%; however, MD’s cumulative harvest (now about 3,600 fish) is only 0.1% of the coastal total. Over all states, the cumulative harvest in numbers increased by about 5.3 million fish (about +19%), ranging from a decrease of 174,000 fish in 2007 (-5%) to an increase of 2.5 million fish in 2004 (+52%; Table 8). Therefore, for the years 1963-2003 recreational harvest numbers were increased by 19% for this assessment update. For the recreational fishery harvest weight (catch types A + B1, mt), the most important change was for the commonwealth of MA with a cumulative 2004-2011 increase of about 1,713 mt, or about +67%. The state of DE had the largest cumulative percentage increase at +112%; however, DE’s cumulative harvest (now about 4 mt) is less than 0.1% of the coastal total. The largest absolute decrease was for the state of RI with a cumulative 2004-2011 decrease of about 108 mt, about -6%. The state of MD had the largest cumulative percentage decrease at -30%, a cumulative decrease of about 1 mt. Over all states, the cumulative harvest in weight (mt; metric tons) increased by about 2,433 mt (about +18%), ranging from a decrease of 122 mt in 2008 (-7%) to an increase of 1,356 mt fish in 2004 (+71%; Table 9). Therefore, for the years 1963-2003 recreational harvest weight was increased by 18% for this assessment update (Tables 5, 21, 24). For the recreational fishery live releases in numbers (catch type B2), the largest change was for the commonwealth of MA, with a cumulative 2004-2011 increase of about 3.1 million fish, about +38% and also the largest cumulative percentage increase amongst the states. The largest absolute decrease was for the state of NJ with a cumulative 2004-2011 decrease of about 410,000 fish, or about -12%. The state of MD had the largest cumulative percentage decrease at -47%, a cumulative decrease of about 45,000 million fish. Over all states, the cumulative live release in numbers increased by about 4.5 million fish (about +11%), ranging from a decrease of 239,000 fish in 2008 (-3%) to an increase of 1.7 million fish in 2004 (+36%; Table 10). Therefore, for the years 1963-2003 recreational live release and discard mortality estimates were increased by 11% for this assessment update (Tables 7, 21, 24).
COMMERCIAL FISHERY LANDINGS AT LENGTH AND AGE
The NER commercial fishery length frequency sampling is summarized in Table 11. Annual sampling intensity has varied from 18 to 687 mt per 100 lengths, with sampling exceeding the informal threshold criterion of 200 mt per 100 lengths since 1995. For this assessment, commercial fishery landings at age beginning in 1984 have been updated through 2011, with samples generally pooled by market category (pins/small, medium, large/mix, jumbo, and unclassified) and by half-year (January-June, July-December); samples were pooled on a
8
quarterly basis (e.g., January-March) since 2004. Estimates of commercial fishery landings at age (Figure 2) and mean weights at age are presented in Tables 12-13.
COMMERCIAL FISHERY DISCARDS AT LENGTH AND AGE
The intensity of length sampling of discarded scup from the NEFSC Fishery Observer Program declined in 1992-1995 relative to 1989-1991 (Table 14). Sampling intensity ranged from 489 to 335 mt per 100 lengths sampled in 1992-1995, failing to meet the informal criterion of 200 mt per 100 lengths. Sampling intensity improved to 100 mt per 100 lengths in 1996, but then declined to over 200 mt per 100 lengths in 1997-1999. Sampling intensity has generally met the 200 mt per 100 lengths threshold since 2000. The mean weight of the discard was estimated from length frequency data using a length-weight equation, total numbers discarded were then estimated by dividing total weight by mean weight, and numbers at length were then calculated from the length-frequency distribution. Discards at length were aged using a combination of commercial and survey age-length keys, with discards at age dominated by fish aged 0, 1, or 2, depending on the year under consideration. Estimates of commercial fishery discards at age (Figure 3) and mean weights at age are presented in Tables 15-16.
RECREATIONAL FISHERY LANDINGS AT LENGTH AND AGE
For the recreational fishery, length sampling intensity has varied from 45 to 471 mt per 100 lengths. Sampling in all years except 1984 during 1981-1987 failed to meet the informal criterion of 200 mt per 100 lengths, but since 1988 the criterion has been met except for 1999-2000 (Table 5). Numbers at length for recreational landings were determined from recreational fishery length samples pooled by half-years (January-June; July-December) over all regions and fishing modes, and were converted to numbers at age by applying half-year age-length keys constructed from NEFSC commercial and survey samples. Age-length keys from spring surveys and first and second quarter commercial samples were applied to numbers at length from the first half of the year, while age-length keys from fall surveys and third and fourth quarter commercial samples were applied to numbers at length from the second half of the year. Estimates of recreational fishery landings at age (Figure 4) and mean weights at age are presented in Tables 17-18.
RECREATIONAL FISHERY DISCARDS AT LENGTH AND AGE
No length frequency samples of the scup discard were collected under the MRFSS program before 2005, so recreational discards were assumed to be fish aged 0 and 1, in the same relative proportions and with the same mean weight as the landed catch less than state regulated minimum fish sizes. An inspection of discard length frequency samples from the New York recreational fishery for 1989-1991 indicated that this assumption was reasonable. Since 2005, the MRFSS/MRIP For-Hire Survey discard samples have been used in concert with the MRFSS/MRIP sub-legal landed lengths to characterize the length frequency of the recreational discard. The informal sampling criterion of 200 mt per 100 lengths has been consistently met since 2007 (Table 7). Numbers at length were converted to numbers at age by applying half-year (January-June; July-December) age-length keys constructed from NEFSC commercial and survey samples. As noted earlier, a 15% discard mortality rate is assumed. Estimates of
9
recreational fishery discards at age (Figure 5) and mean weights at age are presented in Tables 19-20.
TOTAL FISHERY CATCH
Total commercial and recreational landings in 2011 were 8,451 mt = 18.631 million lbs and total commercial and recreational discards were 2,086 mt = 4.599 million lbs, for a total catch in 2011 of 10,537 mt = 23.230 million lbs (Table 21). Estimates of the total fishery catch at age and mean weights at age for 1984-2011 (the time series is limited by the availability of sampled fishery ages) are presented in Tables 22-23. An extended time series of the total catch of scup has been estimated to provide an historical perspective of the exploitation of scup in the years before fishery aging data were available (Table 24). These estimates include commercial and recreational landings and discards. The recreational fishery catch for 2004-2011 has been estimated using the MRIP methods. For earlier years, a constant “ratio of means” of the MRFSS and MRIP estimates has been used to adjust the recreational catch estimates.
The catches before 1981 are the least reliable due to uncertainty about a) the magnitude of domestic commercial fishery discards, b) the magnitude of the distant water fleet (DWF) catch and c) the uncertainty of assumptions made to estimate the recreational catch (50% reduction from interpolations made in Mayo 1982 for 1960-1978; recreational discards assumed to be 2% of the adjusted recreational landings). For years in which no commercial fishery observer data were collected (prior to 1989), commercial discards were estimated using the mean of landings to discards ratios for 1989-2001.
RESEARCH SURVEY INDICES OF ABUNDANCE
Northeast Fisheries Science Center The NEFSC spring and fall bottom trawl surveys provide long time series of fishery-independent indices for scup. The NEFSC spring and fall surveys are conducted annually during March-May and September-November, ranging from just south of Cape Hatteras, NC to Canadian waters. NEFSC spring and fall abundance and biomass indices for scup exhibit considerable inter-annual variability (Table 25, Figure 6). NEFSC spring survey catches are characterized mainly by scup of ages 1 and 2 (Figure 7), while the fall survey often captures large numbers of age 0 and 1 fish (Figure 8). The Fisheries Survey Vessel (FSV) Albatross IV (ALB) was replaced in spring 2009 by the FSV Henry B. Bigelow (HBB) as the main platform for NEFSC research surveys, including the spring and fall bottom trawl surveys. The size, towing power, and fishing gear characteristics of the HBB are significantly different from the ALB, resulting in different fishing power and therefore different survey catchability. Calibration experiments to estimate these differences were conducted during 2008 (Brown 2009), and the results of those experiments were peer reviewed by a Panel of three non-NMFS scientists during the summer of 2009 (Anonymous 2009, Miller et al. 2010). The terms of reference for the Panel were to review and evaluate the suite of statistical methods used to derive calibration factors by species before they were applied in a stock assessment context. Following the advice of the August 2009 Peer Review (Anonymous 2009), the methods proposed in Miller et al. (2010), and the precedents set in peer-reviews of stock assessments for haddock (Van Eeckhaute and Brooks 2010), yellowtail flounder
10
(Legault et al. 2010), silver and red hake (NEFSC 2011a), and winter flounder (NEFSC 2011b), aggregate and length-based calibration factors were used to convert 2009-2011 spring and fall HBB survey catch number and weight indices to ALB equivalents for use in this stock assessment update (Tables 26-28; Figure 6). The NEFSC survey indices sometimes appear to mainly reflect the availability of scup to the survey, rather than true abundance, making it difficult to interpret large inter-annual changes in the indices. For example, the 2002 spring biomass index was about twice the second highest spring index, which was observed in 1977 (Figure 6). The spring numeric abundance indices are similar; the 2002 index is the highest observed in the series and about twice the 1970 index. These dramatic increases were evident across all ages in the estimated 2002 spring numbers at age (Table 29; Figure 7). However, the previous fall survey estimates of numbers at age in 2001 had not reflected relatively large values from which the corresponding 2002 spring numbers at age might have been expected to derive (Table 30, Figure 8) nor did they subsequently translate to exceptional indices of biomass in fall 2002 or spring 2003. Spring survey biomass and abundance indices decreased subsequent to 2002, but are still above the low values of the late 1990s. Fall survey abundance and biomass, although highly variable, have about doubled since the late 1990s.
The NEFSC winter survey was started in 1992 primarily as a flatfish survey, was conducted during February, and ranged from Cape Hatteras, NC to the southwestern part of Georges Bank. The winter survey 2002 abundance and biomass indices were, like the spring survey, the largest of the time series (Table 31, Figure 6). Similar to the spring estimates, numbers at age estimated for the 2002 winter survey were also exceptionally large (Table 32, Figure 9). Winter survey abundance and biomass decreased subsequent to 2002, but were still above the low values of the late 1990s. The winter trawl series ended in 2007.
The large differences in the absolute magnitude of NEFSC survey catches of ages 0-2 compared to those of fish at ages 3 and older suggests a substantial difference in survey selection at age between these two aggregate age groups. In the 2008 DPS assessment (NEFSC 2009), aggregate biomass indices retracted to the lengths of fish ages 0-2 were constructed for calibration of those ages in the population model (maximum length of 22 cm in the winter, 20 cm in the spring, and 23 cm in the fall series). The 2009-2011 HBB values for these aggregate indices have also been converted to ALB equivalents using length calibration factors (Table 33).
Massachusetts Division of Marine Fisheries The Massachusetts Division of Marine Fisheries (MADMF) has conducted spring and
fall bottom trawl surveys of Massachusetts territorial waters in May and September since 1978. Survey coverage extends from the New Hampshire to Rhode Island boundaries and seaward to three nautical miles, including Cape Cod Bay and Nantucket Sound. The study area is stratified into geographic zones based on depth and area. The MADMF spring survey catches are characterized mainly by scup of ages 1 and 2, while the fall survey often captures large numbers of age 0 fish. The spring biomass and abundance indices decreased sharply from a high in the early 1980s to relatively low levels through the 1990s, and have since exhibited a variable but increasing trend (Table 34, Figure 10). The MADMF fall abundance index can include large numbers of age 0 fish and therefore can be more variable as it reflects inter-annual variance in recruitment. The fall biomass index exhibits an increasing trend since the mid 1990s (Table 34, Figure 10).
11
Rhode Island Division of Fish and Wildlife The Rhode Island Division of Fish and Wildlife (RIDFW) has conducted spring and fall
bottom trawl surveys based on a stratified random sampling design since 1979. Three major fishing grounds are considered in the spatial stratification, including Narragansett Bay, Rhode Island Sound, and Block Island Sound. Stations are either fixed or randomly selected for each stratum. The RIDFW spring survey mainly catches scup of ages 1 and 2. The spring index shows relatively low scup abundance and biomass through 1999 followed by a steep increase during 2000-2002, in common with the NEFSC and MADMF indices, and high variability since then (Table 35; Figure 11). The RIDFW fall survey is dominated by age 0 scup, and the fall indices show a general increase to a 1993 peak, followed by a steep decline until 1998, and a steady increase since then. The fall biomass series reached a time series peak in 2011 (Figure 11).
The RIDFW implemented a ventless trap survey in cooperation with commercial fishermen beginning in 2005. The cooperative trap survey has a fixed station format, and survey catches are expressed as catch per trap soak hour. The index of age 0 scup from the trap indicates strong recruitment in 2007 and 2010, while the aggregate index of scup abundance has increased steadily since 2005 (Table 36; Figures 11-12). The RIDFW cooperative trap survey data have not yet been included in the calibration of the assessment population model.
Connecticut Department of Environmental Protection The Connecticut Department of Environmental Protection (CTDEP) trawl survey
program was initiated in May 1984 and encompasses both New York and Connecticut waters of Long Island Sound. The stratified random design survey is conducted in the spring (April-June) and fall (September-October). The CTDEP spring index indicates relatively low abundance through most of the survey period, but has increased substantially since 1999 (Table 37, Figure 13). The CTDEP fall survey, which often catches large numbers of age-0 scup, indicates that recruitment was relatively stable during most of the survey period, but the aggregate fall indices have also increased substantially since 1999. (Table 38, Figures 12-13) Due to vessel engine failure, a complete fall survey was not conducted in 2010. The age compositions of the CTDEP spring and fall surveys generally include a higher proportion of age 2 and older fish than the other state or NEFSC surveys (Figures 14-15).
New York Department of Environmental Conservation The New York Department of Environmental Conservation (NYDEC) initiated a small
mesh trawl survey in 1985 to collect fisheries-independent data on the age and size composition of scup in local waters. This survey is conducted in the Peconic Bays, the estuarine waters which lie between the north and south forks of eastern Long Island. The NYDEC survey provides age 0, 1, and 2+ indices of scup abundance. The age 0 indices are generally low over the survey period, with peaks in 2000, 2002, 2003, 2006, and 2007 that may indicate recruitment of strong cohorts in those years (Table 39, Figure 12). In the early years of the survey there often has not been a strong correspondence between the age 0 indices and age 1 and 2+ indices in the following years (Figure 16).
12
New Jersey Bureau of Marine Fisheries The New Jersey Bureau of Marine Fisheries (NJBMF) conducts a stratified random
bottom trawl survey of New Jersey coastal waters from Ambrose Channel south to Cape Henlopen Channel. Latitudinal strata boundaries correspond to those in the NEFSC trawl survey; longitudinal boundaries correspond to the 30, 60, and 90 foot isobaths. Each survey includes two tows per stratum plus one additional tow in each of nine larger strata for a total of 39 tows. The NJBMF survey indices exhibit variable patterns over the early part of the time series. The biomass index reached a minimum in 1996 and then generally increased, peaking in 2007 (Table 39; Figure 17).
University of Rhode Island Graduate School of Oceanography
University of Rhode Island Graduate School of Oceanography (URIGSO) has conducted a standardized, two-station trawl survey in Narragansett Bay and Rhode Island Sound since the 1950s, with consistent sampling since 1963. Irregular length-frequency samples for scup indicate that most of the survey catch is of fish from ages 0 to 2. The aggregate numbers-based index reached a peak in the late 1970s, was relatively low during the late 1990s, and has since generally increased. The 2009 index was the second highest of the time series, after the 1976 and 1989 indices (Table 40, Figure 18).
Virginia Institute of Marine Science Juvenile Fish Trawl Survey
The Virginia Institute of Marine Science (VIMS) has conducted a juvenile fish trawl survey in lower Chesapeake Bay during June-September since 1988. The VIMS age-0 scup indices show a general decline in recruitment from relatively high levels with peaks in the late 1980s to early 1990s, to relatively low levels from the late 1990s to early 2000s, and the indication of several recent strong year classes (Table 39, Figure 12).
Chesapeake Bay Multispecies Monitoring and Assessment Program Trawl Survey
The VIMS Chesapeake Bay Multispecies Monitoring and Assessment Program (ChesMMAP) trawl survey is designed to support stock assessment activities at both a single and multispecies scale. While no single gear or monitoring program can collect all of the data necessary for quantitative assessments, ChesMMAP was designed to fill data gaps by maximizing the biological and ecological data collected for several recreationally and commercially important species in the bay. Total abundance and biomass indices composed mainly of age 0 and 1 fish are available since 2002, and suggest strongest recruitment in 2007 and 2010 (Table 41, Figure 19).
Northeast Area Monitoring and Assessment Program Trawl Survey The VIMS Northeast Area Monitoring and Assessment Program (NEAMAP) industry-
cooperative survey was started in fall 2007, providing research survey samples in the spring and fall seasons along the Atlantic coast from Rhode Island to North Carolina, in depths of 20-90 feet
13
(9-43 meters). The NEAMAP survey data have not yet been included in the calibration of the assessment population model (Table 42, Figure 19).
2011 UPDATED FISHING MORTALITY RATE AND STOCK SIZE ESTIMATES
Fishing mortality rates and stock sizes were estimated using the ASAP SCAA model (NFT 2008a). The catch at age, mean weight at age, maturity at age, and survey index calibration time series were input as in the 2008 DPS and 2009-2011 assessment updates (NEFSC 2009, Terceiro 2009, 2010, 2011). Winter, spring, and mid-year survey indices and all survey recruitment (age-0) indices were compared to population numbers of the same age at the beginning of the same year. Fall survey indices were compared to population numbers one year older at the beginning of the next year. Lognormal error distributions were assumed for the total catch in weight, research survey catch at age calibration indices, internal Beverton-Holt stock-recruitment relationship and parameters, selectivity parameters, annual fishing mortality parameters, survey catchability parameters, and estimated stock numbers at age. A multinomial distribution was assumed for fishery catch at age. Additional model settings including specification of likelihood component emphasis factors (lambdas), size of the deviation factors expressed as standard deviations and penalty functions for extreme fishing mortality estimates were left at the consensus values set in the 2008 DPS assessment.
Summary estimates, estimated January 1 stock size at age in numbers, and estimated fishing mortality (F) at age from the updated model for 1984-2011 (the years with input fishery catches at age) are provided in Tables 43-45. Spawning stock biomass decreased from about 100,000 mt in 1963 to about 50,000 mt in 1969, then increased to about 75,000 mt during the late 1970s. SSB declined through the 1980s and early 1990s to less than 5,000 mt in the mid-1990s. With greatly improved recruitment and low fishing mortality rates since 1998, SSB increased to about greater than 100,000 mt = 220 million lbs since 2004. SSB was estimated to be 190,424 mt = 420 million lbs in 2011 (Figures 20-21). There is a 50% probability that SSB in 2011 was between 185,000 and 198,000 mt (408 and 436 million lbs; Figure 22). Fishing mortality calculated from the average of the currently fully recruited ages (2-7+) varied between F = 0.1 and F = 0.3 during the 1960s and 1970s. Fishing mortality increased during the 1980s and early 1990s, peaking at about F = 1.0 in the mid-1990s. Fishing mortality decreased after 1994, falling to less than F = 0.1 since 2004, with F in 2011 = 0.034 (Figure 23). There is a 50% probability that F in 2010 was between 0.026 and 0.042 (Figure 24). Recruitment at age 0 averaged 92 million fish during 1963-1983, the period in which recruitment estimates are influenced mainly by the assessment model stock-recruitment relationship. Since 1984, recruitment estimates from the model are influenced mainly by the fishery and survey catches at age, and averaged 110 million fish during 1984-2011. The 1999, 2000, and 2008 year classes are estimated to be the largest of the time series, at 207, 226, and 215 million age 0 fish. After below average recruitment in 2009 and 2010, the 2011 year class is estimated to be above average at 154 million age 0 fish (Figures 20-21).
There is no consistent internal retrospective pattern in F, SSB, or recruitment evident in the 2012 updated assessment model (Figures 25-27). A between-assessment comparison provides another measure of assessment uncertainty due to changes in model estimates. The 2012 assessment estimates of SSB and F are intermediate with respect to the 2008 DPSWG
14
assessment and 2009 update for the same years, and are very similar to those from 2010 and 2011 updates. The 2012 assessment estimates of the size of the 2007 through 2010 year classes are in general larger compared to the 2011 assessment (Figures 28-30).
2008 DPS ASSESSMENT BIOLOGICAL REFERENCE POINTS
The 2008 DPS Peer Review Panel accepted the ASAP SCAA model results as the basis for biological reference points and status determination for scup (NEFSC 2009). Reference points were calculated using the non-parametric yield and SSB per recruit/long-term projection approach adopted for summer flounder (NEFSC 2008a) and the New England groundfish stocks (NEFSC 2008b). In the yield and SSB per recruit calculations, the most recent five year averages were used for mean weights and fishery partial recruitment pattern. For the estimation of MSY and SSBMSY, the cumulative distribution function of the 1984-2007 recruitments (corresponding to the period of input fishery catches at age) was re-sampled to provide future recruitment estimates (mean = 117 million age 0 fish). The 2008 DPS Peer Review Panel recommended F40% as the proxy for FMSY, and the corresponding SSBF40% as the proxy for SSBMSY. The F40% proxy for FMSY = 0.177, the proxy estimate for SSBMSY = SSB40% = 92,044 mt = 202.922 million lbs, and the proxy estimate for MSY = MSY40% = 16,161 mt = 35.629 million lbs (13,134 mt = 28.956 million lbs of landings and 3,027 mt = 6.673 million lbs of discards).
2011 UPDATED STOCK STATUS
The scup stock was not overfished and overfishing was not occurring in 2011 relative to the biological reference points established in the 2008 Northeast Data Poor Stocks (DPS) assessment. The fishing mortality rate (F) was estimated to be 0.034 in 2011, below the fishing mortality threshold reference point = FMSY = F40% = 0.177. Spawning Stock Biomass was estimated to be 190,424 metric tons (mt) = 420 million lbs in 2011, above the biomass target reference point = SSBMSY = SSB40% = 92,044 mt = 203 million lbs (Figure 31).
ASSESSMENT UNCERTAINTY CONSIDERATIONS
The 2012 assessment indicates that the stock was well above the biomass target and being fished at well below the fishing mortality threshold in 2011. The high level of 2011 stock abundance is the result of historically low fishing mortality rates and historically high levels of recruitment since the late 1990s. The MSY proxy in terms of total catch is 16,161 mt (35.628 million lbs), with total landings of 13,134 mt (28.956 million lbs) and total discards of 3,027 mt (6.673 million lbs). Total fishery catch is estimated to have averaged about 34,000 mt (~75 million lbs) during 1960-1965, while reported commercial landings alone averaged about 19,000 mt (~42 million lbs) in that period (Table 24). Therefore, the MSY estimate appears feasible given historical evidence from the fishery. The 2008 DPS Peer Review Panel (NEFSC 2009) advised that a gradual increase in the ABC toward the MSY level would facilitate an evaluation of the performance of the new assessment model and reference points in monitoring stock status, while reducing the risk to the stock due to rapidly increased catch.
15
PROJECTION OF THE OVERFISHING LIMIT (OFL) FOR 2013
Stochastic projections were made to provide forecasts of stock size and catches in 2012-2013 consistent with the 2008 DPS assessment biological reference points. The projections assume that recent (2006-2011) patterns of discarding will continue over the time span of the projections. Different patterns that could develop in the future due to different trip and bag limits and fishery closures have not been evaluated. One hundred projections were made for each of the 1000 Markov Chain Monte Carlo (MCMC) realizations of 2012 stock sizes from the updated assessment results using NFT AGEPRO version 4.0.5 (NFT 2011). Future recruitment at age 0 was generated randomly from a cumulative density function of the updated recruitment series for 1984-2011 (mean recruitment = 110 million fish). If the landings of scup in 2012 equal the specified Total Allowable Landings (TAL) = 16,749 mt = 36.925 million lbs, the 2012 median (50% probability) discards are projected to be 3,334 mt = 7.350 million lbs, and the median total catch is projected to be 20,083 mt = 44.275 million lbs. The median F in 2012 is projected to be 0.158, below the fishing mortality threshold = FMSY = F40% = 0.177. The median SSB on June 1, 2012 is projected to be 203,982 mt = 450 million lbs, above the biomass target of SSBMSY = SSB40% = 92,044 mt = 203 million lbs. If the stock is fished at the fishing mortality threshold = FMSY = F40% = 0.177 in 2013, median landings are projected to be 17,981 mt = 39.641 million lbs, with median discards of 3,721 mt = 8.203 million lbs, and median total catch = 21,680 mt = 47.796 million lbs. This projected median total catch is equivalent to the Overfishing Limit (OFL) for 2013, and is greater than MSY = 16,161 mt (35.629 million lbs) of total catch (13,134 mt = 28.956 million lbs of landings plus 3,027 mt = 6.673 million lbs of discards). The median SSB on June 1, 2013 is projected to be 196,236 mt = 432 million lbs, above the biomass target of SSBMSY = SSB40% = 92,044 mt = 203 million lbs. The projected catch estimates in the following table are medians of the catch distributions for fixed F in 2013.
Total Catch (OFL), Landings, Discards, Fishing Mortality (F) and Spawning Stock Biomass (SSB) in 2013
Catches and SSB in metric tons
Total Catch Landings Discards F SSB
21,680 17,981 3,721 0.177 196,236
ACKNOWLEDGEMENTS
Special thanks to Daphne Cassidy, Grace Thornton, and the staff of the NOAA Fisheries NEFSC Population Biology Branch for their timely preparation of the 2011 scup ages used in this assessment update.
16
REFERENCES CITED Anonymous. 2009. Independent Panel review of the NMFS Vessel Calibration analyses for FSV
Henry B. Bigelow and R/V Albatross IV. August 11-14, 2009. Chair’s Consensus report. 10 p.
Brown, R. 2009. Design and field data collection to compare the relative catchabilities of
multispecies bottom trawl surveys conducted on the NOAA ship Albatross IV and the FSV Henry B. Bigelow. NEFSC Bottom Trawl Survey Calibration Peer Review Working Paper. Northeast Fisheries Science Center, Woods Hole, MA. 19 p.
Cogswell SJ. 1960. Summary of tagging operations, July 1, 1959 through June 30, 1960. US Bur.
Comm. Fish. Woods Hole Laboratory. Lab Ref No. 60-1. Cogswell SJ. 1961. Summary of tagging operations, July 1, 1960 through June 30, 1961. US Bur.
Comm. Fish. Woods Hole Laboratory. Lab Ref No. 61-12. Conser RJ, Powers JE. 1990. Extension of the ADAPT VPA tuning method designed to facilitate
assessment work on tuna and swordfish stocks. ICCAT Coll Vol Sci Pap 32:461-477. Crecco V, Maltezos G, Howell-Heller P. 1981. Population dynamics and stock assessment of the
scup, (Stenotomus chrysops), from New England waters. Conn Dept Environ Protect. Mar. Fish. Completion Rep. No. 3-328-R-2 CT, 62 p.
Dery L, Rearden C. 1979. Report of the state-federal scup (Stenotomus chrysops) age and growth
workshop. National Marine Fisheries Service, Northeast Fisheries Center, Woods Hole Laboratory Lab Ref Doc. 79-57.
Hamer PE. 1970. Studies of the scup, (Stenotomus chrysops), in the Middle Atlantic Bight. NJ
Div. Fish Game and Shellfish. Misc Rep No. 5M. 14 p. Hamer PE. 1979. Studies of the scup, (Stenotomus chrysops), in the Middle Atlantic Bight. NJ
Div. Fish Game and Shellfish. Misc Rep No. 18M. 67 p. Howell PT, Simpson DG. 1985. A study of marine recreational fisheries in Connecticut. March
1, 1981 - February 28, 1984. CTDEP, Fed Aid to Sport Fish Restoration F54R. Final Rep. 60 p.
Legault CM, Alade L, Stone HH. 2010. Assessment of Georges Bank yellowtail flounder for
2010. TRAC Reference Document 2010/06. 97 p. Mayo RK. 1982. An assessment of the scup, (Stenotomus chrysops) (L.), population in the
Southern New England and Middle Atlantic regions. NMFS NEFC, Woods Hole Lab. Ref Doc No. 82-46. 60 p.
17
Miller TJ, Das C, Politis PJ, Miller AS, Lucey SM, Legault CM, Brown RW, Rago PJ. 2010.
Estimation of Albatross IV to Henry B. Bigelow calibration factors. Northeast Fisheries Science Center Ref Doc. 10-05. 233 p.
Morse WW. 1978. Biological and fisheries data on scup, (Stenotomus chrysops) (Linnaeus).
NMFS NEFC. Sandy Hook Lab Tech Ser Rep. No 12. 41 p. NEFSC. 1995. Report of the 19th Northeast Regional Stock Assessment Workshop (19th SAW):
Stock Assessment Review Committee (SARC) consensus summary of assessments. Northeast Fish Sci Cent Ref Doc. 95-08: 221 p.
NEFSC. 1997. Report of the 25th Northeast Regional Stock Assessment Workshop (25th SAW):
Stock Assessment Review Committee (SARC) consensus summary of assessments. Northeast Fish Sci Cent Ref Doc. 97-14: 143 p.
NEFSC. 1998. Report of the 27th Northeast Regional Stock Assessment Workshop (27th SAW).
Stock Assessment Review Committee (SARC) consensus summary of assessments. Northeast Fish Sci Cent Ref Doc. 98-15: 350 p.
NEFSC. 2000. Report of the 31st Northeast Regional Stock Assessment Workshop (31st SAW).
Stock Assessment Review Committee (SARC) consensus summary of assessments. Northeast Fish Sci Cent Ref Doc. 00-15: 400 p.
NEFSC. 2002. Report of the 35th Northeast Regional Stock Assessment Workshop (35th SAW).
Stock Assessment Review Committee (SARC) consensus summary of assessments. Northeast Fish Sci Cent Ref Doc. 02-14: 259 p.
NEFSC. 2008a. 47th Northeast Regional Stock Assessment Workshop (47th SAW) Assessment
Report & Appendixes. by Northeast Fisheries Science Center. CRD 08-12. 339 p. NEFSC. 2008b. Assessment of 19 Northeast Groundfish Stocks through 2007: Report of the 3rd
Groundfish Assessment Review Meeting (GARM III). Northeast Fisheries Science Center (NEFSC) Woods Hole, Massachusetts. August 4-8, 2008. NEFSC. CRD 08-15. 867 p.
NEFSC 2009. The Northeast Data Poor Stocks Working Group Report, December 8-12, 2008
Meeting. Part A. Skate species complex, Deep sea red crab, Atlantic wolfish, Scup, and Black sea bass. US Dept Commerce, Northeast Fish Sci Cent Ref Doc. 09-02; 496 p.
Northeast Fisheries Science Center (NEFSC) 2011a. 51st Northeast Regional Stock Assessment
Workshop (51st SAW) Assessment Report. US Dept Commerce, Northeast Fish Sci Cent Ref Doc. 11-02, 856 p.
18
Northeast Fisheries Science Center (NEFSC) 2011b. 52nd Northeast Regional Stock Assessment Workshop (52nd SAW) Assessment Summary Report. US Dept Commerce, Northeast Fish Sci Cent Ref Doc. 11-11, 51 p.
Neville WC, Talbot GB. 1964. The fishery for scup with special reference to fluctuations in yield
and their courses. US Fish Wildl Serv. Spec Sci Rep - Fish. No 459. 61 p. NFT 2008. NOAA Fisheries Toolbox (NFT) version 3.0. ASAP version 2.0.20. [Internet address
http://nft.nefsc.noaa.gov]. NFT 2011. NOAA Fisheries Toolbox (NFT) version 3.0. AGEPRO version 4.0.5.
[Internetaddress http://nft.nefsc.noaa.gov]. Prager MH. 1994. A suite of extensions to a non-equilibrium surplus production model. Fish
Bull US. 92:374-389. Simpson DG, Howell PT, Johnson MW. 1990. Section 2 Job 6: Marine finfish survey in State of
Connecticut D.E.P., A study of marine recreational fisheries in Connecticut, 1984-1988. CTDEP Fed Aid to Sport Fish Restoration. F54R Final Rep. 265 p.
Sisson RT. 1974. The growth and movement of scup (Stenotomus chrysops) in Narragansett Bay,
RI and along the Atlantic coast. RI Division of Fish and Wildlife Completion Report. 3-138-R-3. 21 p.
Terceiro M. 2009. Stock assessment of scup for 2009. US Dept. Commerce, Northeast FishSci
Cent Ref Doc. 09-18. 82 p. Terceiro M. 2010. Stock assessment of scup for 2010. US Dept. Commerce, Northeast FishSci
Cent Ref Doc. 10-16. 86 p. Terceiro M. 2011. Stock assessment of scup for 2011. US Dept. Commerce, Northeast FishSci
Cent Ref Doc. 11-21. 98 p. Van Eeckhaute L, Brooks EN. 2010. Assessment of Eastern Georges Bank Haddock for 2010.
TRAC Reference Document - 2010/05. 104 p.
19
Table 1. Commercial landings (metric tons; mt) of scup (Stenotomus chrysops) by state. One mt was landed in Delaware in 1995, included with Maryland 1995 total. Eight mt were landed in Pennsylvania in 2004 included with Maryland 2004 total. Landings include revised Massachusetts landings for 1986-1997.
Year
ME
MA
RI CT NY NJ MD VA
NC
Total
1979
782
3,123 92 1,422 2,159 21 397
589
8,585
1980
1
706
2,934 17 1,294 2,310 32 531
599
8,424 1981
523
2,959 44 1,595 2,990 9 1,054
682
9,856
1982
545
3,203 25 1,473 1,746 2 1,042
668
8,704
1983
672
2,583 49 1,103 2,536 13 536
302
7,794
1984
540
2,919 32 904 2,217 6 673
478
7,769
1985
387
3,583 41 861 1,493 17 74
271
6,727
1986
875
2,987 67 893 1,895 14 273
172
7,176
1987
5
735
2,162 301 911 1,817 232
113
6,276 1988
9
536
2,832 359 687 1,334 1 127
58
5,943
1989
32
579
1,401 89 603 1,219 1 45
15
3,984 1990
4
696
1,786 165 755 1,005 4 75
81
4,571
1991
16
553
2,902 287 1,223 1,960 15 56
69
7,081 1992
655
2,676 193 1,043 1,475 17 73
127
6,259
1993
556
1,332 148 729 1,822 10 76
53
4,726
1994
354
1,514 142 688 1,456 7 92
139
4,392
1995
310
1,045 90 511 1,084 2 20
11
3,073
1996
436
773 99 377 1,141 20 72
27
2,945
1997
676
486 50 376 596 1 2
1
2,188
1998
435
361 44 282 758 5 4
7
1,896
1999
300
581 44 206 361 13
1,505 2000
161
461 65 287 232 1
1,207 2001
149
734 45 297 479 1 24
1,729 2002
330
1,668 4 714 419 25
13
3,173
2003
407
1,730 64 839 1,033 21 253
58
4,405
2004
353
1,562 116 865 862 21 203
249
4,231
2005
515
1,553 149 989 880 1 130
50
4,266
2006
493
1,653 135 1,096 632 0 36
17
4,062
2007
501
1,785 118 1,054 714 1 10
13
4,196
2008
239
977 127 551 351 3 44
60
2,351 2009
326
1,641 90 839 693 1 110
16
3,717 2010
458
1,950 281 1,220 703 9 188
46
4,855 2011
574
2,874 292 1,689 892 25 360
113
6,819
20
Table 2. Commercial landings (metric tons; mt) of scup (Stenotomus chrysops) by major gear types. Midwater paired trawl landings are combined with other gears during 1994 and later. Landings include revised Massachusetts landings for 1986-1997.
Year
Otter
Paired Floating Pound Pots and Hand Other
Total
trawl
trawl
trap net traps lines gear
mt
1979
6,387
146
1,305 429 26 215 77
8,585 1980
6,192
160
1,559 194 8 303 8
8,424
1981
7,836
79
1,291 246 49 306 49
9,856 1982
6,563
104
1,514 244 9 226 44
8,704
1983
5,861
398
850 390 8 265 22
7,794 1984
5,617
272
1,266 295 8 287 24
7,769
1985
4,856
417
1,022 229 5 182 16
6,727 1986
5,163
540
629 332 9 493 10
7,176
1987
4,607
237
590 193 213 423 13
6,276 1988
4,142
166
1,052 53 44 396 90
5,943
1989
3,174
89
193 74 104 334 16
3,984 1990
3,205
200
505 60 239 340 22
4,571
1991
5,217
152
988 40 258 395 31
7,081 1992
4,371
94
934 67 303 450 40
6,259
1993
3,865
46
166 25 202 402 20
4,726 1994
3,416
331 79 76 340 150
4,392
1995
2,204
331 42 57 215 224
3,073
1996
2,196
229 8 120 374 18
2,945
1997
1,491
86 12 104 489 6
2,188
1998
1,379
11 4 98 390 14
1,896
1999
1,005
140 30 77 184 69
1,505
2000
773
56 78 205 95
1,207
2001
1,088
229 65 52 215 80
1,729
2002
2,084
220 221 450 198
3,173
2003
2,777
723 168 445 292
4,405
2004
3,767
20 121 196 127
4,231
2005
3,475
117 174 448 52
4,266
2006
3,422
106 201 291 42
4,062
2007
3,332
181 279 373 31
4,196
2008
1,966
103 99 171 12
2,351
2009
3,182
110 191 222 12
3,717
2010
4,351
82 182 224 16
4,855
2011
6,073
121 339 276 10
6,819
21
Table 3. Summary Northeast Fisheries Science Center (NEFSC) Fishery Observer Program data for scup (Stenotomus chrysops). Geometric mean discards to landings ratios (GMDL; retransformed, mean ln-transformed discards to landings ratios [D/L], per trip) are stratified by half-year period (HY1, HY2) and trip landings level (< 300 kg, => 300 kg). N is number of observed trips with both scup landings and discard, which are used to calculate the ratios. Corresponding dealer landings are from the NEFSC database.
1997
Trips <300
kg
Trips
=>300 kg
Period
GM D/L
N
Dealer
Landings (mt)
Estimated Discard
(mt)
GM D/L
N Dealer Landings
(mt)
Estimated Discard
(mt) HY 1
0.8957
17
258 231 0.8221 4 1,244
1,023
HY 2
0.8957
0
279 250 0.8221 0 413
340
Total
537 481 1,657
1,362
1998
Trips <300
kg
Trips
=>300 kg
Period
GM D/L
N
Dealer
Landings (mt)
Estimated Discard
(mt)
GM D/L
N Dealer Landings
(mt)
Estimated Discard
(mt) HY 1
2.401
7
196 471 121.71 1 920
111,973
HY 2
3.126
10
281 878 121.71 0 496
60,368
Total
477 1,349 1,416
172,341
1999
Trips <300
kg
Trips
=>300 kg
Period
GM D/L
N
Dealer
Landings (mt)
Estimated Discard
(mt)
GM D/L
N Dealer Landings
(mt)
Estimated Discard
(mt) HY 1
1.742
6
245 427 3.766 2 785
2,956
HY 2
1.742
0
178 310 3.766 0 299
1,126
Total
423 737 1,084
4,082

22
Table 3, continued. Summary Northeast Fisheries Science Center (NEFSC) Fishery Observer Program data for scup (Stenotomus chrysops). Geometric mean discards to landings ratios (GMDL; retransformed, mean ln-transformed discards to landings ratios [D/L], per trip) are stratified by half-year period (HY1, HY2) and trip landings level (< 300 kg, => 300 kg). N is number of observed trips with both scup landings and discard, which are used to calculate the ratios. Corresponding dealer landings are from the NEFSC database.
2000
Trips <300
kg
Trips
=>300 kg
Period
GM D/L
N
Dealer
Landings (mt)
Estimated Discard
(mt)
GM D/L
N Dealer Landings
(mt)
Estimated Discard
(mt) HY 1
4.5818
13
196 898 0.6018 2 655
394
HY 2
3.5001
1
292 1,022 0.6018 0 63
38
Total
14
488 1,920 2 718
432
2001
Trips <300
kg
Trips
=>300 kg
Period
GM D/L
N
Dealer
Landings (mt)
Estimated Discard
(mt)
GM D/L
N Dealer Landings
(mt)
Estimated Discard
(mt) HY 1
0.8916
10
180 160 0.9185 4 1,013
930
HY 2
0.4606
2
307 141 0.9185 0 290
266
Total
14
487 302 4 1,303
1,197
2002
Trips <300
kg
Trips
=>300 kg
Period
GM D/L
N
Dealer
Landings (mt)
Estimated Discard
(mt)
GM D/L
N Dealer Landings
(mt)
Estimated Discard
(mt) HY 1
2.6088
11
423 1,104 0.0653 2 1,484
97
HY 2
3.4522
12
829 2,862 3.6028 3 437
1,574
Total
23
1,252 3,965 5 1,921
1,671

23
Table 3, continued. Summary Northeast Fisheries Science Center (NEFSC) Fishery Observer Program data for scup (Stenotomus chrysops). Geometric mean discards to landings ratios (GMDL; retransformed, mean ln-transformed discards to landings ratios [D/L], per trip) are stratified by half-year period (HY1, HY2) and trip landings level (< 300 kg, => 300 kg). N is number of observed trips with both scup landings and discard, which are used to calculate the ratios. Corresponding dealer landings are from the NEFSC database.
2003
Trips <300
kg
Trips
=>300 kg
Period
GM D/L
N
Dealer
Landings (mt)
Estimated Discard
(mt)
GM D/L
N Dealer Landings
(mt)
Estimated Discard
(mt) HY 1
0.1371
9
315 43 0.2560 2 2,473
633
HY 2
1.4299
4
921 1,317 0.2304 5 696
160
Total
13
1,236 1,360 7 3,169
793
2004
Trips <300
kg
Trips
=>300 kg
Period
GM D/L
N
Dealer
Landings (mt)
Estimated Discard
(mt)
GM D/L
N Dealer Landings
(mt)
Estimated Discard
(mt) HY 1
0.3370
40
344 116 0.1685 25 2,353
396
HY 2
0.4200
64
868 365 0.0309 10 550
17
Total
104
1,212 480 35 2,903
413
2005
Trips <300
kg
Trips
=>300 kg
Period
GM D/L
N
Dealer
Landings (mt)
Estimated Discard
(mt)
GM D/L
N Dealer Landings
(mt)
Estimated Discard
(mt) HY 1
0.7354
31
292 215 0.0732 7 2,390
175
HY 2
0.2740
67
850 233 0.0563 2 694
39
Total
98
1,142 448 9 3,084
214
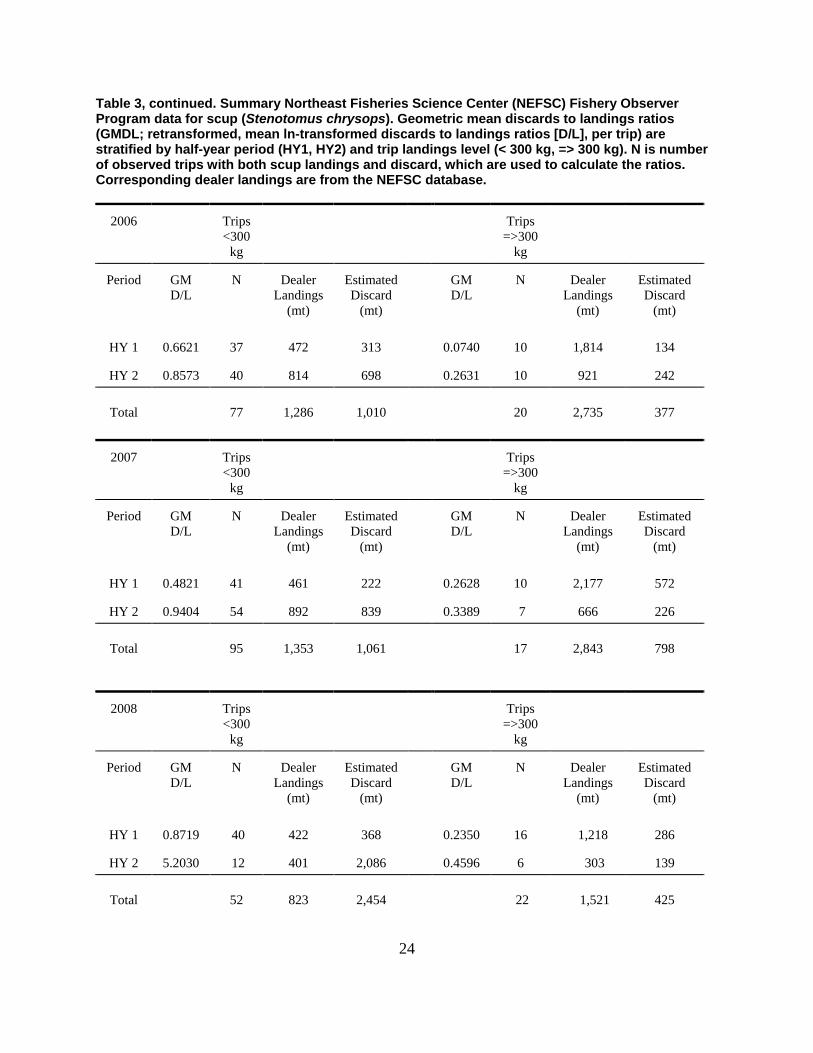
24
Table 3, continued. Summary Northeast Fisheries Science Center (NEFSC) Fishery Observer Program data for scup (Stenotomus chrysops). Geometric mean discards to landings ratios (GMDL; retransformed, mean ln-transformed discards to landings ratios [D/L], per trip) are stratified by half-year period (HY1, HY2) and trip landings level (< 300 kg, => 300 kg). N is number of observed trips with both scup landings and discard, which are used to calculate the ratios. Corresponding dealer landings are from the NEFSC database.
2006
Trips <300
kg
Trips
=>300 kg
Period
GM D/L
N
Dealer
Landings (mt)
Estimated Discard
(mt)
GM D/L
N Dealer Landings
(mt)
Estimated Discard
(mt) HY 1
0.6621
37
472 313 0.0740 10 1,814
134
HY 2
0.8573
40
814 698 0.2631 10 921
242
Total
77
1,286 1,010 20 2,735
377
2007
Trips <300
kg
Trips
=>300 kg
Period
GM D/L
N
Dealer
Landings (mt)
Estimated Discard
(mt)
GM D/L
N Dealer Landings
(mt)
Estimated Discard
(mt) HY 1
0.4821
41
461 222 0.2628 10 2,177
572
HY 2
0.9404
54
892 839 0.3389 7 666
226
Total
95
1,353 1,061 17 2,843
798
2008
Trips <300
kg
Trips
=>300 kg
Period
GM D/L
N
Dealer
Landings (mt)
Estimated Discard
(mt)
GM D/L
N Dealer Landings
(mt)
Estimated Discard
(mt) HY 1
0.8719
40
422 368 0.2350 16 1,218
286
HY 2
5.2030
12
401 2,086 0.4596 6 303
139
Total
52
823 2,454 22 1,521
425
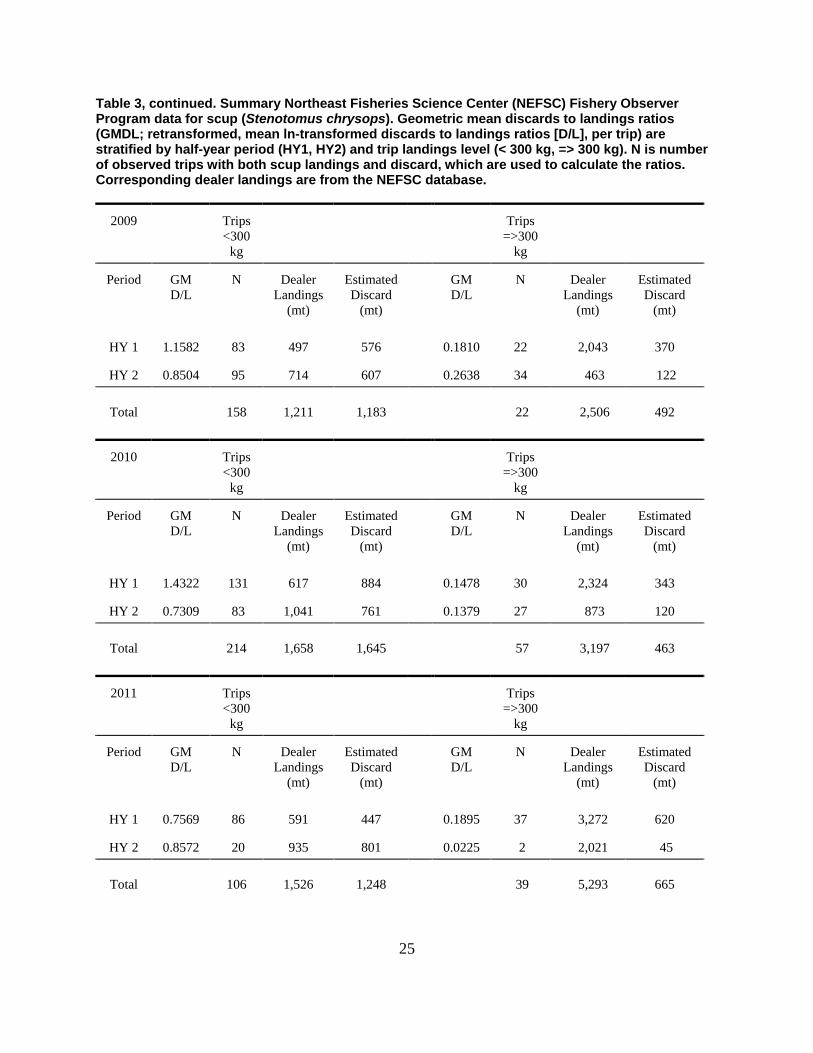
25
Table 3, continued. Summary Northeast Fisheries Science Center (NEFSC) Fishery Observer Program data for scup (Stenotomus chrysops). Geometric mean discards to landings ratios (GMDL; retransformed, mean ln-transformed discards to landings ratios [D/L], per trip) are stratified by half-year period (HY1, HY2) and trip landings level (< 300 kg, => 300 kg). N is number of observed trips with both scup landings and discard, which are used to calculate the ratios. Corresponding dealer landings are from the NEFSC database.
2009
Trips <300
kg
Trips
=>300 kg
Period
GM D/L
N
Dealer
Landings (mt)
Estimated Discard
(mt)
GM D/L
N Dealer Landings
(mt)
Estimated Discard
(mt) HY 1
1.1582
83
497 576 0.1810 22 2,043
370
HY 2
0.8504
95
714 607 0.2638 34 463
122
Total
158
1,211 1,183 22 2,506
492
2010
Trips <300
kg
Trips
=>300 kg
Period
GM D/L
N
Dealer
Landings (mt)
Estimated Discard
(mt)
GM D/L
N Dealer Landings
(mt)
Estimated Discard
(mt) HY 1
1.4322
131
617 884 0.1478 30 2,324
343
HY 2
0.7309
83
1,041 761 0.1379 27 873
120
Total
214
1,658 1,645 57 3,197
463
2011
Trips <300
kg
Trips
=>300 kg
Period
GM D/L
N
Dealer
Landings (mt)
Estimated Discard
(mt)
GM D/L
N Dealer Landings
(mt)
Estimated Discard
(mt) HY 1
0.7569
86
591 447 0.1895 37 3,272
620
HY 2
0.8572
20
935 801 0.0225 2 2,021
45
Total
106
1,526 1,248 39 5,293
665
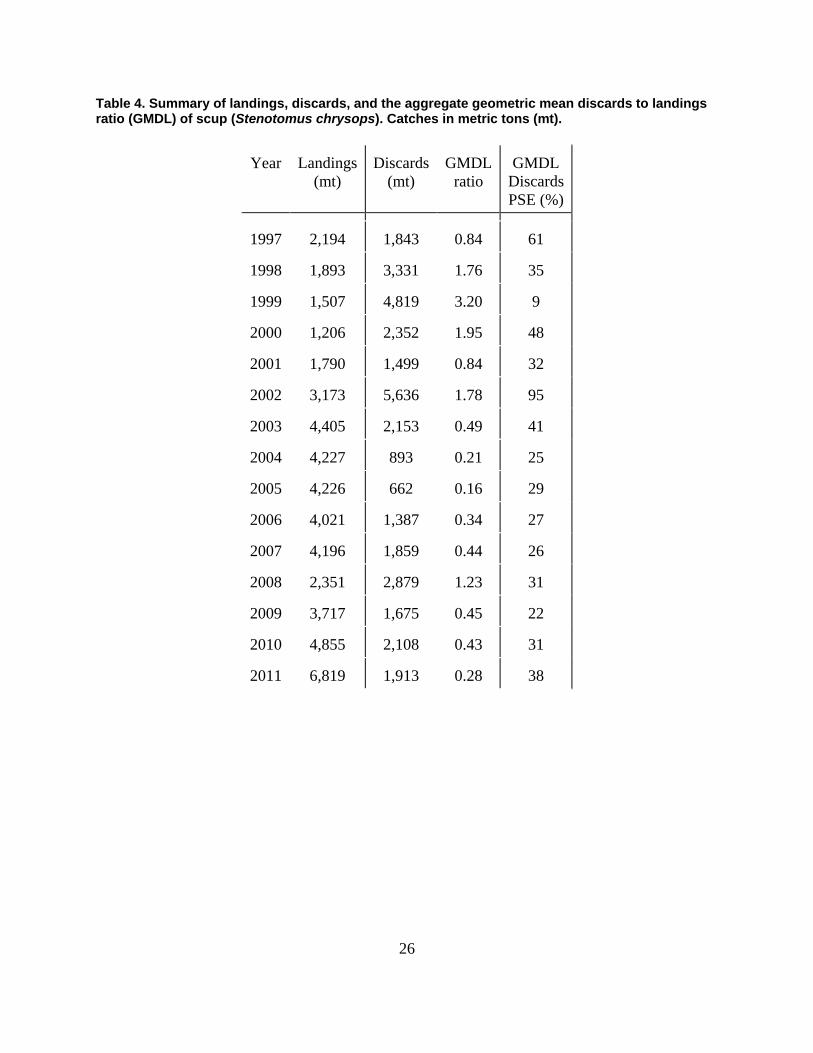
26
Table 4. Summary of landings, discards, and the aggregate geometric mean discards to landings ratio (GMDL) of scup (Stenotomus chrysops). Catches in metric tons (mt).
Year
Landings
(mt) Discards
(mt) GMDL
ratio GMDL
Discards PSE (%)
1997
2,194 1,843 0.84 61
1998
1,893 3,331 1.76 35
1999
1,507 4,819 3.20 9
2000
1,206 2,352 1.95 48
2001
1,790 1,499 0.84 32
2002
3,173 5,636 1.78 95
2003
4,405 2,153 0.49 41
2004
4,227 893 0.21 25
2005
4,226 662 0.16 29
2006
4,021 1,387 0.34 27
2007
4,196 1,859 0.44 26
2008
2,351 2,879 1.23 31
2009
3,717 1,675 0.45 22
2010
4,855 2,108 0.43 31
2011
6,819 1,913 0.28 38
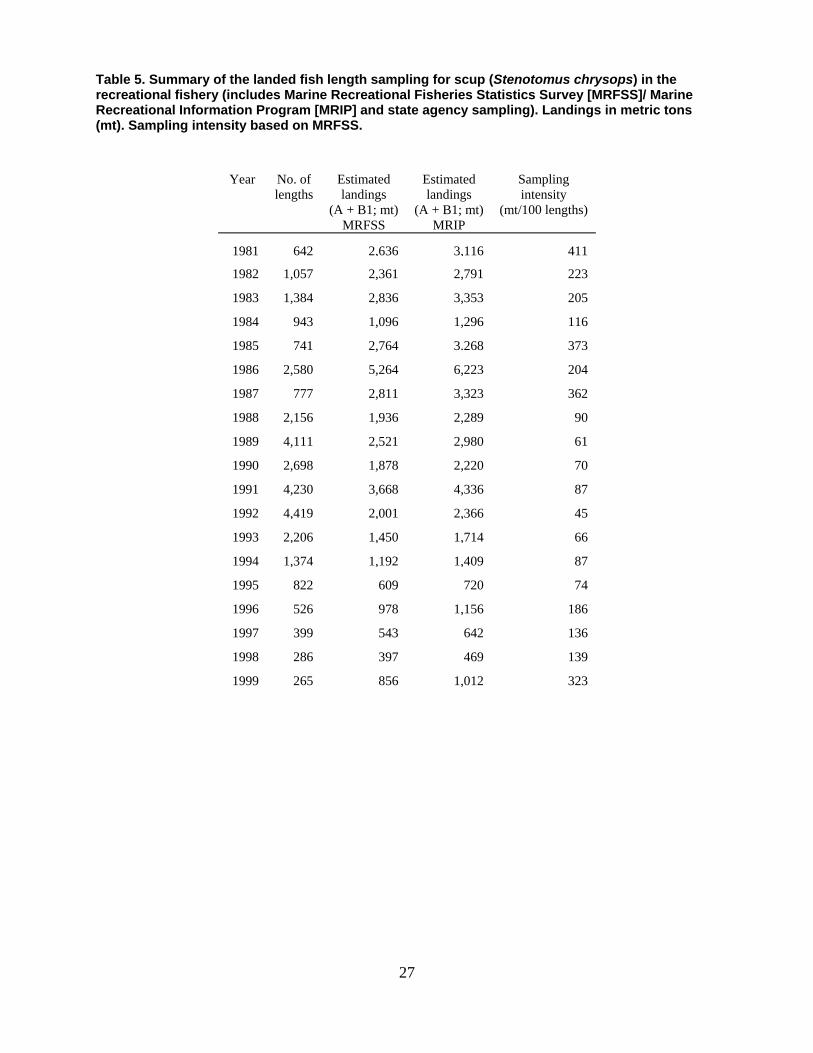
27
Table 5. Summary of the landed fish length sampling for scup (Stenotomus chrysops) in the recreational fishery (includes Marine Recreational Fisheries Statistics Survey [MRFSS]/ Marine Recreational Information Program [MRIP] and state agency sampling). Landings in metric tons (mt). Sampling intensity based on MRFSS.
Year
No. of lengths
Estimated landings
(A + B1; mt) MRFSS
Estimated landings
(A + B1; mt) MRIP
Sampling intensity
(mt/100 lengths)
1981
642 2,636 3,116
411
1982
1,057 2,361 2,791
223
1983
1,384 2,836 3,353
205
1984
943 1,096 1,296
116
1985
741 2,764 3.268
373
1986
2,580 5,264 6,223
204
1987
777 2,811 3,323
362
1988
2,156 1,936 2,289
90
1989
4,111 2,521 2,980
61
1990
2,698 1,878 2,220
70
1991
4,230 3,668 4,336
87
1992
4,419 2,001 2,366
45
1993
2,206 1,450 1,714
66
1994
1,374 1,192 1,409
87
1995
822 609 720
74
1996
526 978 1,156
186
1997
399 543 642
136
1998
286 397 469
139
1999
265 856 1,012
323

28
Table 5, continued. Summary of the landed fish length sampling for scup (Stenotomus chrysops) in the recreational fishery (includes Marine Recreational Fisheries Statistics Survey [MRFSS]/ Marine Recreational Information Program [MRIP] and state agency sampling). Landings in metric tons (mt). Sampling intensity based on MRFSS.
Year
No. of lengths
Estimated landings
(A + B1; mt) MRFSS
Estimated landings
(A + B1; mt) MRIP
Sampling intensity (mt/100 lengths)
2000 524 2,469 2,919
471
2001 1,038 1,933 2,285
186
2002 1,006 1,644 1,944
163
2003 2,508 3,848 4,549
153
2004 1,802 1,923 3,278
107
2005 1,794 1,153 1,215
64
2006 2,217 1,334 1,681
60
2007 2,262 1,655 2,085
73
2008 2,426 1,834 1,713
76
2009 2,269 1,334 1,462
59
2010 2,710 2,516 2,715
93
2011 2,412 1,601 1,632
66
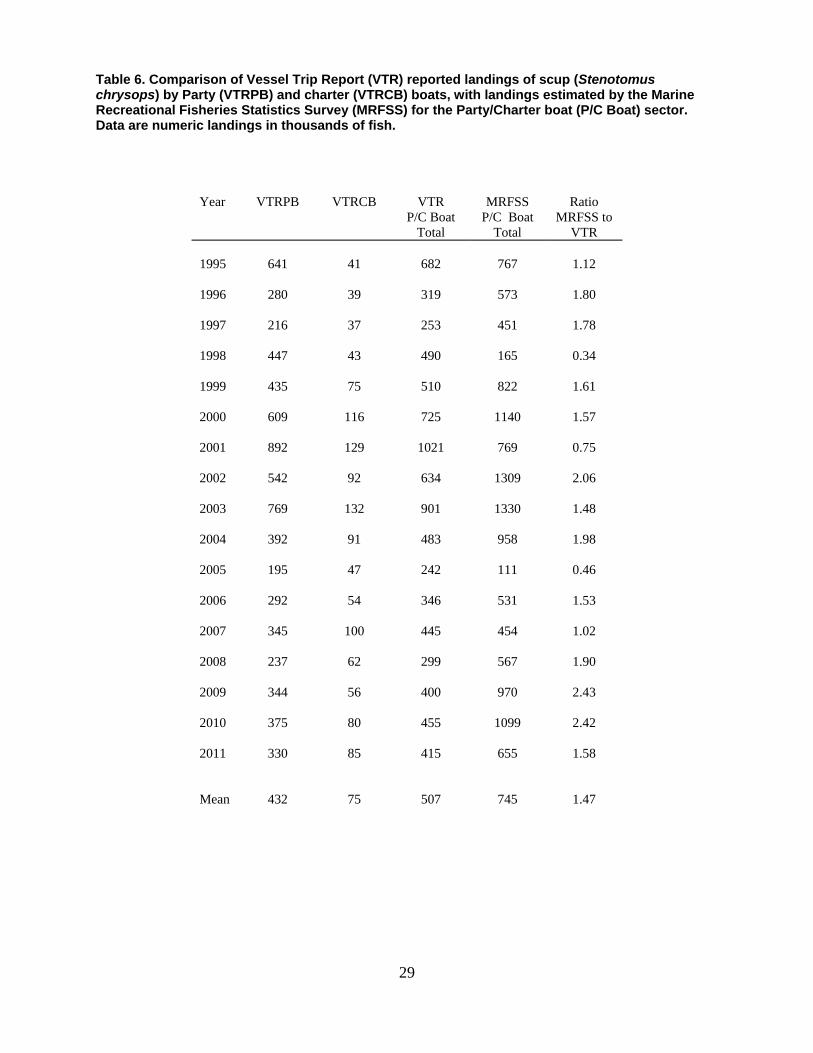
29
Table 6. Comparison of Vessel Trip Report (VTR) reported landings of scup (Stenotomus chrysops) by Party (VTRPB) and charter (VTRCB) boats, with landings estimated by the Marine Recreational Fisheries Statistics Survey (MRFSS) for the Party/Charter boat (P/C Boat) sector. Data are numeric landings in thousands of fish.
Year
VTRPB
VTRCB
VTR
P/C Boat Total
MRFSS
P/C Boat Total
Ratio
MRFSS to VTR
1995
641
41
682
767
1.12
1996
280
39
319
573
1.80
1997
216
37
253
451
1.78
1998
447
43
490
165
0.34
1999
435
75
510
822
1.61
2000
609
116
725
1140
1.57
2001
892
129
1021
769
0.75
2002
542
92
634
1309
2.06
2003
769
132
901
1330
1.48
2004
392
91
483
958
1.98
2005
195
47
242
111
0.46
2006
292
54
346
531
1.53
2007
345
100
445
454
1.02
2008
237
62
299
567
1.90
2009
344
56
400
970
2.43
2010
375
80
455
1099
2.42
2011
330
85
415
655
1.58
Mean
432
75
507
745
1.47
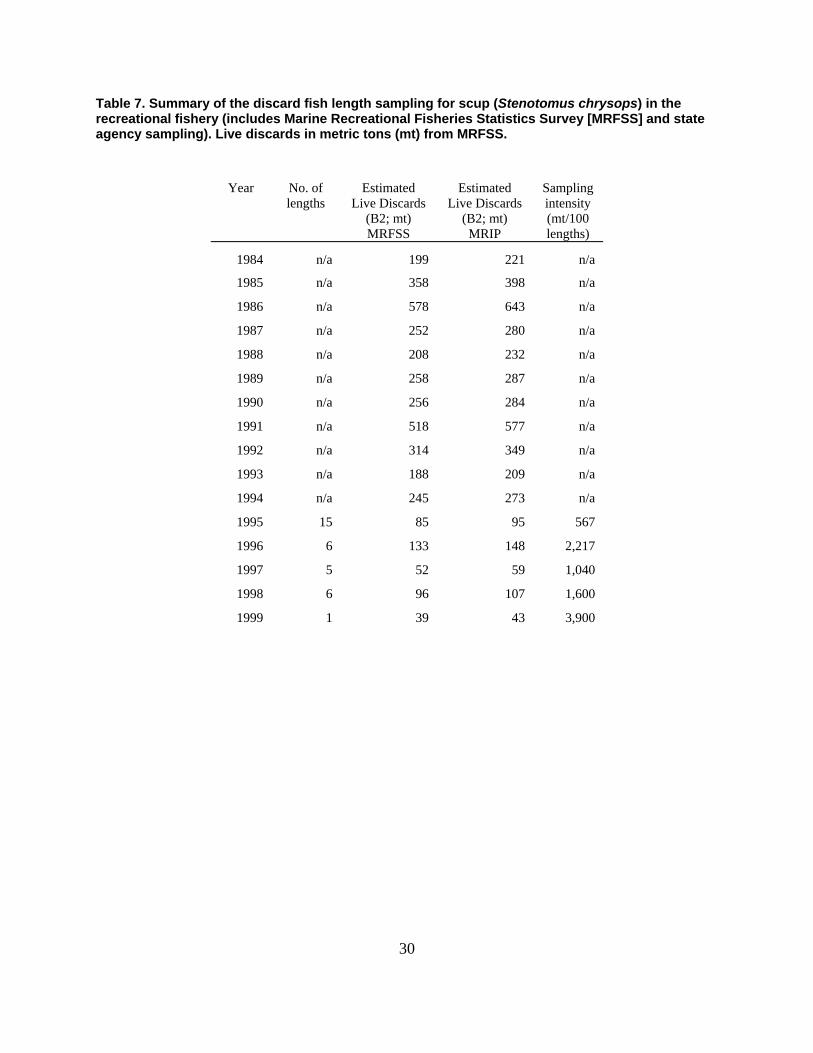
30
Table 7. Summary of the discard fish length sampling for scup (Stenotomus chrysops) in the recreational fishery (includes Marine Recreational Fisheries Statistics Survey [MRFSS] and state agency sampling). Live discards in metric tons (mt) from MRFSS.
Year
No. of lengths
Estimated Live Discards
(B2; mt) MRFSS
Estimated Live Discards
(B2; mt) MRIP
Sampling intensity (mt/100 lengths)
1984 n/a 199 221
n/a
1985 n/a 358 398
n/a
1986 n/a 578 643
n/a
1987 n/a 252 280
n/a
1988 n/a 208 232
n/a
1989 n/a 258 287
n/a
1990 n/a 256 284
n/a
1991 n/a 518 577
n/a
1992 n/a 314 349
n/a
1993 n/a 188 209
n/a
1994 n/a 245 273
n/a
1995 15 85 95
567
1996 6 133 148
2,217
1997 5 52 59
1,040
1998 6 96 107
1,600
1999 1 39 43
3,900
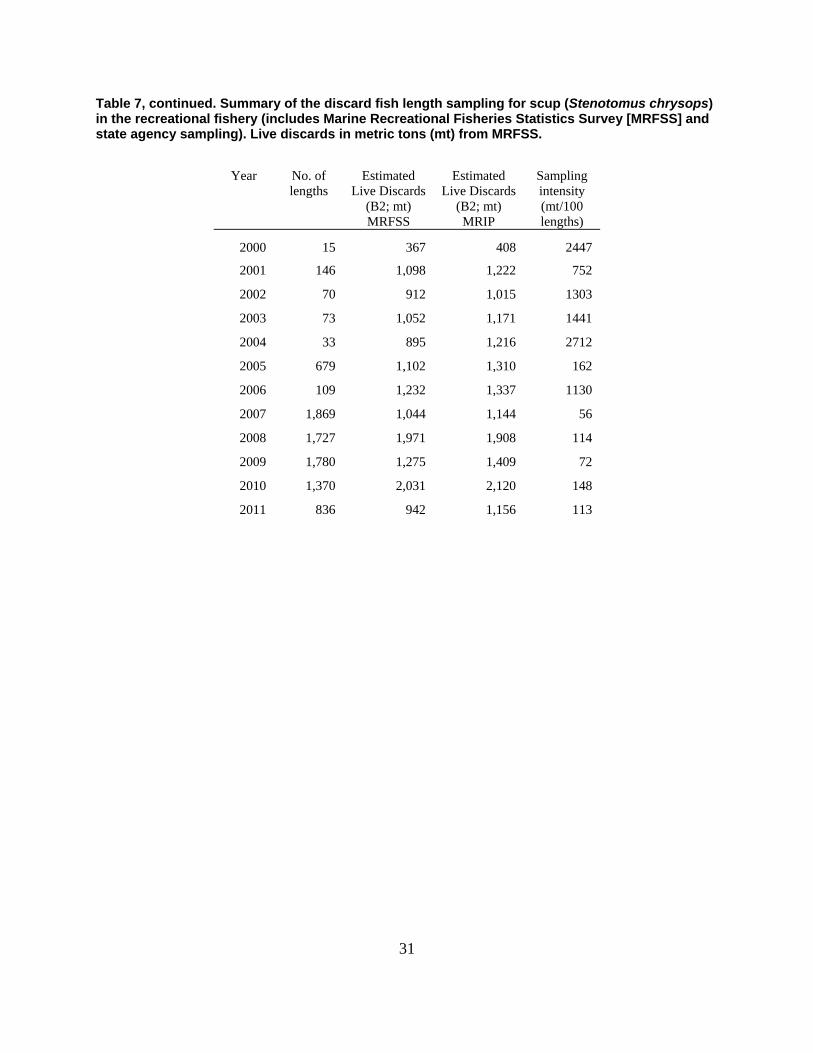
31
Table 7, continued. Summary of the discard fish length sampling for scup (Stenotomus chrysops) in the recreational fishery (includes Marine Recreational Fisheries Statistics Survey [MRFSS] and state agency sampling). Live discards in metric tons (mt) from MRFSS.
Year
No. of lengths
Estimated Live Discards
(B2; mt) MRFSS
Estimated Live Discards
(B2; mt) MRIP
Sampling intensity (mt/100 lengths)
2000 15 367 408
2447
2001 146 1,098 1,222
752
2002 70 912 1,015
1303
2003 73 1,052 1,171
1441
2004 33 895 1,216
2712
2005 679 1,102 1,310
162
2006 109 1,232 1,337
1130
2007 1,869 1,044 1,144
56
2008 1,727 1,971 1,908
114
2009 1,780 1,275 1,409
72
2010 1,370 2,031 2,120
148
2011 836 942 1,156
113

32
Table 8. TOP: Estimated total landings (catch types A + B1, number) of scup (Stenotomus chrysops) by recreational fishermen as estimated by the Marine Recreational Information Program (MRIP). Proportional Standard Error (PSE) is for the TOTAL landings estimate. BOTTOM: Percentage difference in estimated total landings (catch types A + B1, number) of scup by recreational fishermen as estimated by the Marine Recreational Fisheries Statistics Survey (MRSSS) and MRIP ([MRIP-MRFSS]/MRFSS). Positive value indicates MRIP estimate is larger. MRIP Estimates are currently available only for 2004-2011. STATE 2004 2005 2006 2007 2008 2009 2010 2011 CT 1,072,232 508,296 532,362 925,236 549,083 288,702 1,087,681 1,071,802 DE 518 3,870 319 2,365 1,338 821 0 50 MD 1,095 1,832 226 305 104 32 18 0 MA 3,312,973 656,524 424,968 1,769,960 761,612 1,069,275 925,222 1,011,190 NJ 60,141 118,667 327,202 99,320 87,186 174,809 739,901 41,825 NY 1,876,973 859,156 1,677,998 1,596,391 1,450,860 1,460,314 1,990,340 496,635 NC 1,710 3,714 14,444 5,268 13,843 3,989 7,580 26,257 RI 816,894 430,747 470,286 353,450 632,839 139,576 398,178 405,423 VA 10,999 8,507 0 586 3,920 527 5,284 7,500 TOTAL 7,153,535 2,591,313 3,447,806 4,752,881 3,500,785 3,138,045 5,154,203 3,060,683 PSE (%) 13 17 20 22 13 14 12 13
STATE 2004 2005 2006 2007 2008 2009 2010 2011 TOTAL CT 90% -30% 3% 34% -18% 26% 8% 36% 16% DE -65% 1% -50% 30% 27% -15% 134% -6% MD -83% 8% -49% 16% -20% 0% -31% -100% -61% MA 119% 65% 35% 143% 15% 38% 10% 39% 67% NJ -48% -5% 31% -11% -34% -38% 34% -22% 2% NY 19% 25% 31% 0% -10% 11% 7% -33% 7% NC -13% 9% 17% -7% -33% 37% 49% -12% -6% RI -10% -3% 10% -22% 11% -19% -9% -23% -7% VA 26% 82% -27% 42% -75% 22% -51% -4% TOTAL 52% 8% 23% 32% -5% 13% 9% 6% 19%
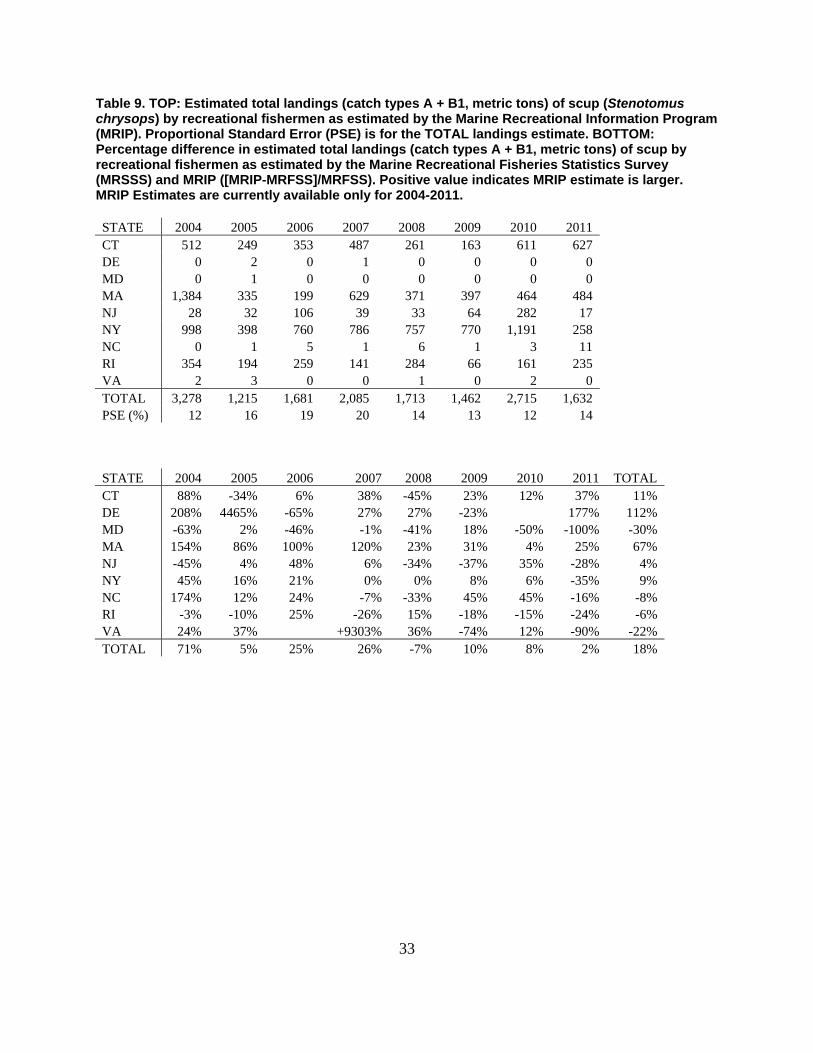
33
Table 9. TOP: Estimated total landings (catch types A + B1, metric tons) of scup (Stenotomus chrysops) by recreational fishermen as estimated by the Marine Recreational Information Program (MRIP). Proportional Standard Error (PSE) is for the TOTAL landings estimate. BOTTOM: Percentage difference in estimated total landings (catch types A + B1, metric tons) of scup by recreational fishermen as estimated by the Marine Recreational Fisheries Statistics Survey (MRSSS) and MRIP ([MRIP-MRFSS]/MRFSS). Positive value indicates MRIP estimate is larger. MRIP Estimates are currently available only for 2004-2011. STATE 2004 2005 2006 2007 2008 2009 2010 2011 CT 512 249 353 487 261 163 611 627 DE 0 2 0 1 0 0 0 0 MD 0 1 0 0 0 0 0 0 MA 1,384 335 199 629 371 397 464 484 NJ 28 32 106 39 33 64 282 17 NY 998 398 760 786 757 770 1,191 258 NC 0 1 5 1 6 1 3 11 RI 354 194 259 141 284 66 161 235 VA 2 3 0 0 1 0 2 0 TOTAL 3,278 1,215 1,681 2,085 1,713 1,462 2,715 1,632 PSE (%) 12 16 19 20 14 13 12 14
STATE 2004 2005 2006 2007 2008 2009 2010 2011 TOTAL CT 88% -34% 6% 38% -45% 23% 12% 37% 11% DE 208% 4465% -65% 27% 27% -23% 177% 112% MD -63% 2% -46% -1% -41% 18% -50% -100% -30% MA 154% 86% 100% 120% 23% 31% 4% 25% 67% NJ -45% 4% 48% 6% -34% -37% 35% -28% 4% NY 45% 16% 21% 0% 0% 8% 6% -35% 9% NC 174% 12% 24% -7% -33% 45% 45% -16% -8% RI -3% -10% 25% -26% 15% -18% -15% -24% -6% VA 24% 37% +9303% 36% -74% 12% -90% -22% TOTAL 71% 5% 25% 26% -7% 10% 8% 2% 18%
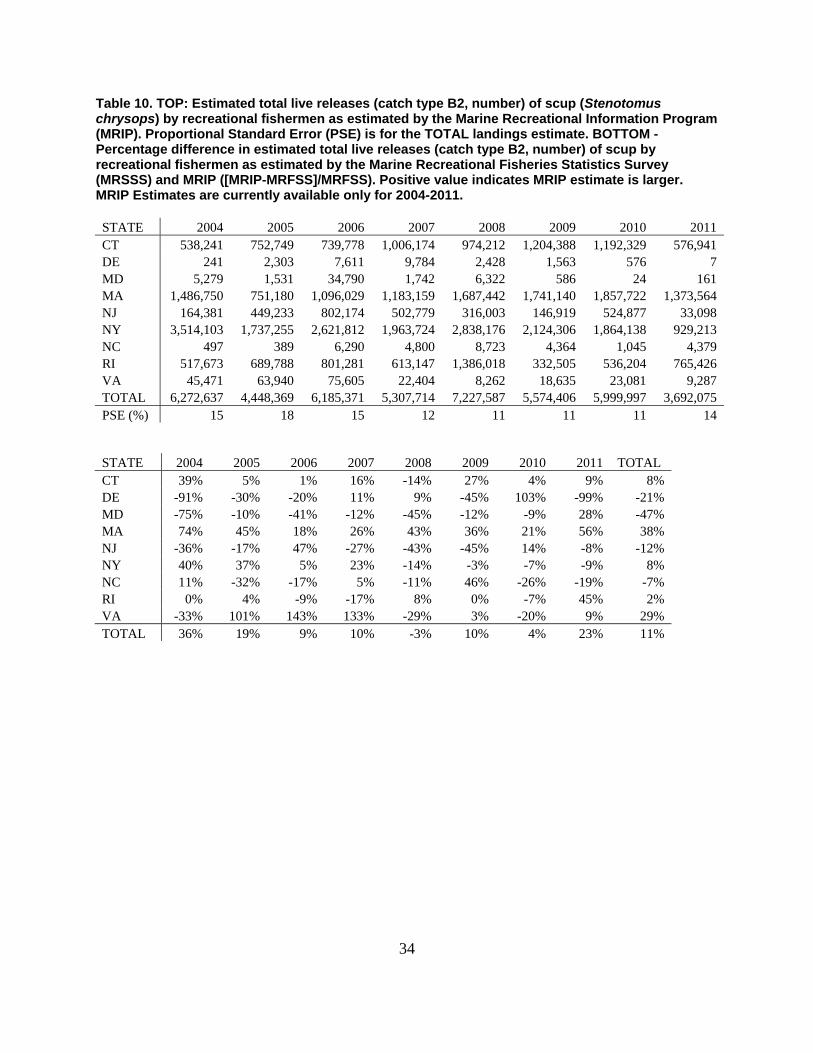
34
Table 10. TOP: Estimated total live releases (catch type B2, number) of scup (Stenotomus chrysops) by recreational fishermen as estimated by the Marine Recreational Information Program (MRIP). Proportional Standard Error (PSE) is for the TOTAL landings estimate. BOTTOM - Percentage difference in estimated total live releases (catch type B2, number) of scup by recreational fishermen as estimated by the Marine Recreational Fisheries Statistics Survey (MRSSS) and MRIP ([MRIP-MRFSS]/MRFSS). Positive value indicates MRIP estimate is larger. MRIP Estimates are currently available only for 2004-2011. STATE 2004 2005 2006 2007 2008 2009 2010 2011 CT 538,241 752,749 739,778 1,006,174 974,212 1,204,388 1,192,329 576,941 DE 241 2,303 7,611 9,784 2,428 1,563 576 7 MD 5,279 1,531 34,790 1,742 6,322 586 24 161 MA 1,486,750 751,180 1,096,029 1,183,159 1,687,442 1,741,140 1,857,722 1,373,564 NJ 164,381 449,233 802,174 502,779 316,003 146,919 524,877 33,098 NY 3,514,103 1,737,255 2,621,812 1,963,724 2,838,176 2,124,306 1,864,138 929,213 NC 497 389 6,290 4,800 8,723 4,364 1,045 4,379 RI 517,673 689,788 801,281 613,147 1,386,018 332,505 536,204 765,426 VA 45,471 63,940 75,605 22,404 8,262 18,635 23,081 9,287 TOTAL 6,272,637 4,448,369 6,185,371 5,307,714 7,227,587 5,574,406 5,999,997 3,692,075 PSE (%) 15 18 15 12 11 11 11 14
STATE 2004 2005 2006 2007 2008 2009 2010 2011 TOTAL CT 39% 5% 1% 16% -14% 27% 4% 9% 8% DE -91% -30% -20% 11% 9% -45% 103% -99% -21% MD -75% -10% -41% -12% -45% -12% -9% 28% -47% MA 74% 45% 18% 26% 43% 36% 21% 56% 38% NJ -36% -17% 47% -27% -43% -45% 14% -8% -12% NY 40% 37% 5% 23% -14% -3% -7% -9% 8% NC 11% -32% -17% 5% -11% 46% -26% -19% -7% RI 0% 4% -9% -17% 8% 0% -7% 45% 2% VA -33% 101% 143% 133% -29% 3% -20% 9% 29% TOTAL 36% 19% 9% 10% -3% 10% 4% 23% 11%
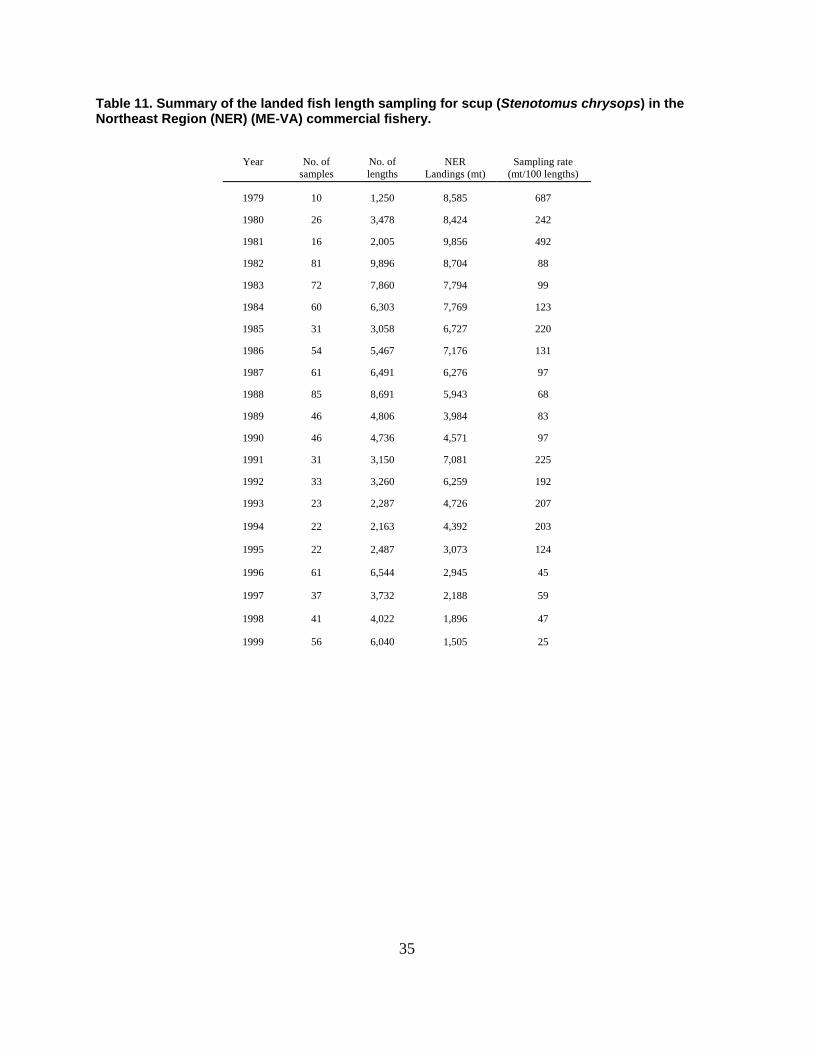
35
Table 11. Summary of the landed fish length sampling for scup (Stenotomus chrysops) in the Northeast Region (NER) (ME-VA) commercial fishery.
Year
No. of
samples No. of lengths
NER Landings (mt)
Sampling rate (mt/100 lengths)
1979
10 1,250 8,585 687
1980
26 3,478 8,424 242
1981
16 2,005 9,856 492
1982
81 9,896 8,704 88
1983
72 7,860 7,794 99
1984
60 6,303 7,769 123
1985
31 3,058 6,727 220
1986
54 5,467 7,176 131
1987
61 6,491 6,276 97
1988
85 8,691 5,943 68
1989
46 4,806 3,984 83
1990
46 4,736 4,571 97
1991
31 3,150 7,081 225
1992
33 3,260 6,259 192
1993
23 2,287 4,726 207
1994
22 2,163 4,392 203
1995
22 2,487 3,073 124
1996
61 6,544 2,945 45
1997
37 3,732 2,188 59
1998
41 4,022 1,896 47
1999
56 6,040 1,505 25
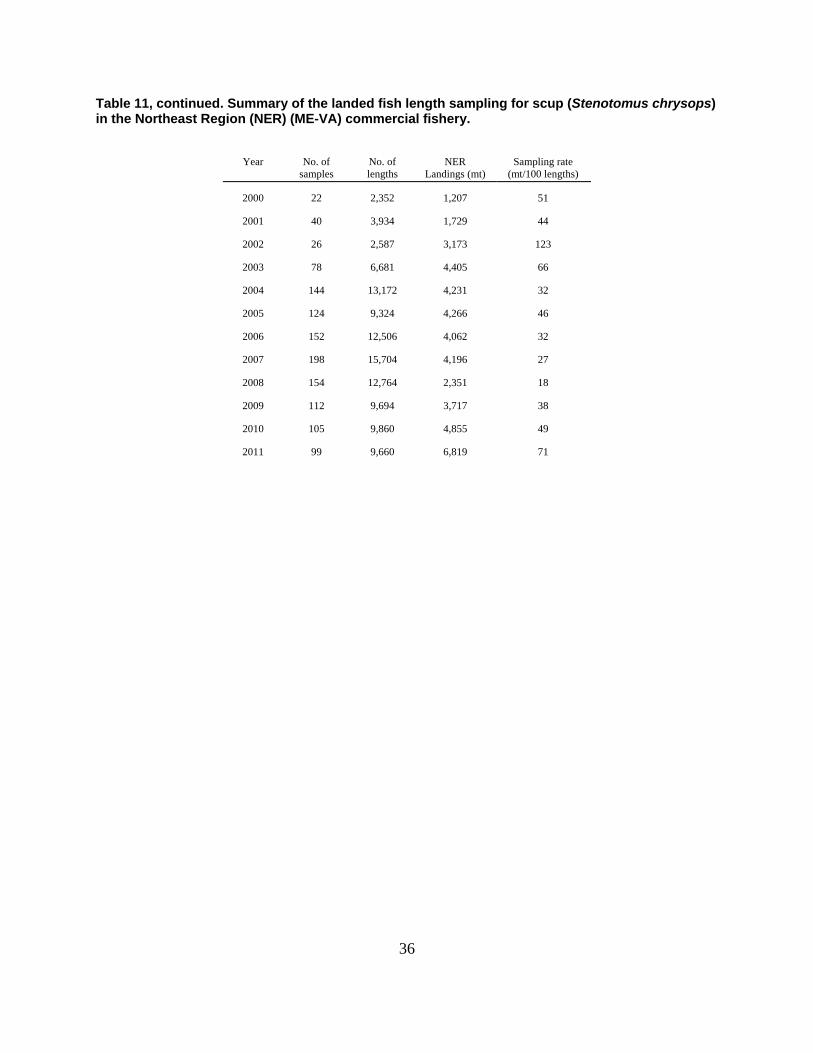
36
Table 11, continued. Summary of the landed fish length sampling for scup (Stenotomus chrysops) in the Northeast Region (NER) (ME-VA) commercial fishery.
Year
No. of
samples No. of lengths
NER Landings (mt)
Sampling rate (mt/100 lengths)
2000
22 2,352 1,207 51
2001
40 3,934 1,729 44
2002
26 2,587 3,173 123
2003
78 6,681 4,405 66
2004
144 13,172 4,231 32
2005
124 9,324 4,266 46
2006
152 12,506 4,062 32
2007
198 15,704 4,196 27
2008
154 12,764 2,351 18
2009
112 9,694 3,717 38
2010
105 9,860 4,855 49
2011
99 9,660 6,819 71
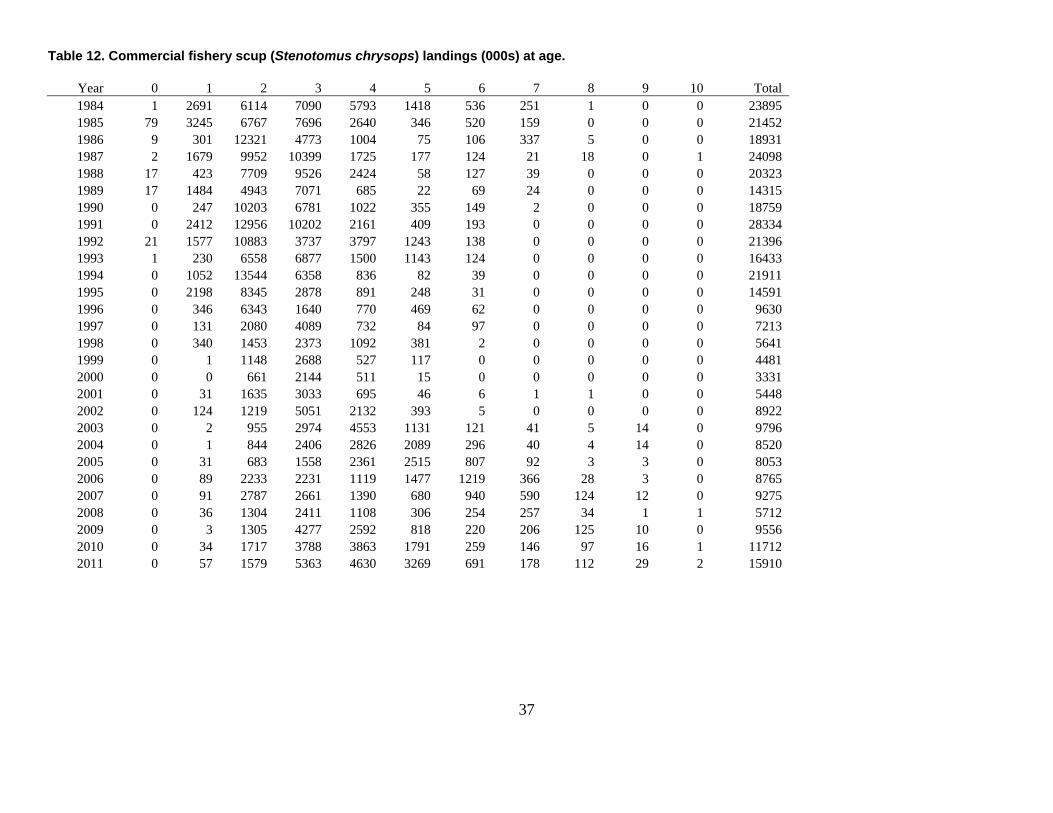
37
Table 12. Commercial fishery scup (Stenotomus chrysops) landings (000s) at age.
Year 0 1 2 3 4 5 6 7 8 9 10 Total 1984 1 2691 6114 7090 5793 1418 536 251 1 0 0 23895 1985 79 3245 6767 7696 2640 346 520 159 0 0 0 21452 1986 9 301 12321 4773 1004 75 106 337 5 0 0 18931 1987 2 1679 9952 10399 1725 177 124 21 18 0 1 24098 1988 17 423 7709 9526 2424 58 127 39 0 0 0 20323 1989 17 1484 4943 7071 685 22 69 24 0 0 0 14315 1990 0 247 10203 6781 1022 355 149 2 0 0 0 18759 1991 0 2412 12956 10202 2161 409 193 0 0 0 0 28334 1992 21 1577 10883 3737 3797 1243 138 0 0 0 0 21396 1993 1 230 6558 6877 1500 1143 124 0 0 0 0 16433 1994 0 1052 13544 6358 836 82 39 0 0 0 0 21911 1995 0 2198 8345 2878 891 248 31 0 0 0 0 14591 1996 0 346 6343 1640 770 469 62 0 0 0 0 9630 1997 0 131 2080 4089 732 84 97 0 0 0 0 7213 1998 0 340 1453 2373 1092 381 2 0 0 0 0 5641 1999 0 1 1148 2688 527 117 0 0 0 0 0 4481 2000 0 0 661 2144 511 15 0 0 0 0 0 3331 2001 0 31 1635 3033 695 46 6 1 1 0 0 5448 2002 0 124 1219 5051 2132 393 5 0 0 0 0 8922 2003 0 2 955 2974 4553 1131 121 41 5 14 0 9796 2004 0 1 844 2406 2826 2089 296 40 4 14 0 8520 2005 0 31 683 1558 2361 2515 807 92 3 3 0 8053 2006 0 89 2233 2231 1119 1477 1219 366 28 3 0 8765 2007 0 91 2787 2661 1390 680 940 590 124 12 0 9275 2008 0 36 1304 2411 1108 306 254 257 34 1 1 5712 2009 0 3 1305 4277 2592 818 220 206 125 10 0 9556 2010 0 34 1717 3788 3863 1791 259 146 97 16 1 11712 2011 0 57 1579 5363 4630 3269 691 178 112 29 2 15910
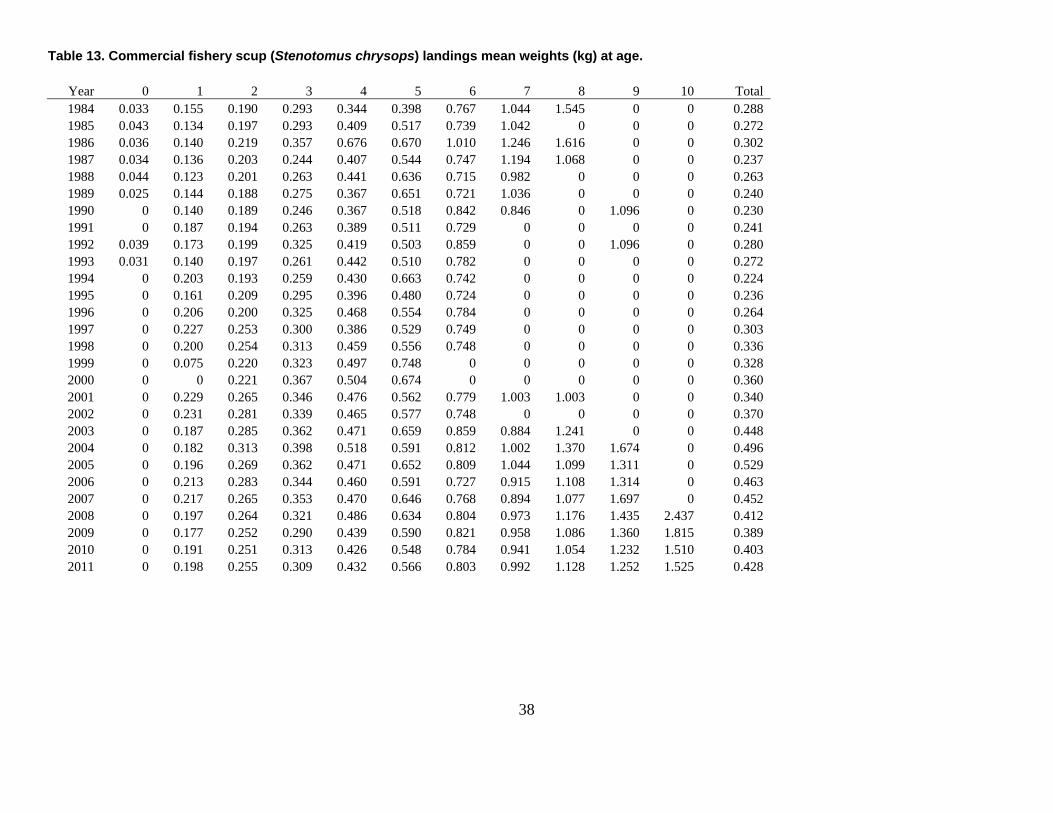
38
Table 13. Commercial fishery scup (Stenotomus chrysops) landings mean weights (kg) at age.
Year 0 1 2 3 4 5 6 7 8 9 10 Total 1984 0.033 0.155 0.190 0.293 0.344 0.398 0.767 1.044 1.545 0 0 0.288 1985 0.043 0.134 0.197 0.293 0.409 0.517 0.739 1.042 0 0 0 0.272 1986 0.036 0.140 0.219 0.357 0.676 0.670 1.010 1.246 1.616 0 0 0.302 1987 0.034 0.136 0.203 0.244 0.407 0.544 0.747 1.194 1.068 0 0 0.237 1988 0.044 0.123 0.201 0.263 0.441 0.636 0.715 0.982 0 0 0 0.263 1989 0.025 0.144 0.188 0.275 0.367 0.651 0.721 1.036 0 0 0 0.240 1990 0 0.140 0.189 0.246 0.367 0.518 0.842 0.846 0 1.096 0 0.230 1991 0 0.187 0.194 0.263 0.389 0.511 0.729 0 0 0 0 0.241 1992 0.039 0.173 0.199 0.325 0.419 0.503 0.859 0 0 1.096 0 0.280 1993 0.031 0.140 0.197 0.261 0.442 0.510 0.782 0 0 0 0 0.272 1994 0 0.203 0.193 0.259 0.430 0.663 0.742 0 0 0 0 0.224 1995 0 0.161 0.209 0.295 0.396 0.480 0.724 0 0 0 0 0.236 1996 0 0.206 0.200 0.325 0.468 0.554 0.784 0 0 0 0 0.264 1997 0 0.227 0.253 0.300 0.386 0.529 0.749 0 0 0 0 0.303 1998 0 0.200 0.254 0.313 0.459 0.556 0.748 0 0 0 0 0.336 1999 0 0.075 0.220 0.323 0.497 0.748 0 0 0 0 0 0.328 2000 0 0 0.221 0.367 0.504 0.674 0 0 0 0 0 0.360 2001 0 0.229 0.265 0.346 0.476 0.562 0.779 1.003 1.003 0 0 0.340 2002 0 0.231 0.281 0.339 0.465 0.577 0.748 0 0 0 0 0.370 2003 0 0.187 0.285 0.362 0.471 0.659 0.859 0.884 1.241 0 0 0.448 2004 0 0.182 0.313 0.398 0.518 0.591 0.812 1.002 1.370 1.674 0 0.496 2005 0 0.196 0.269 0.362 0.471 0.652 0.809 1.044 1.099 1.311 0 0.529 2006 0 0.213 0.283 0.344 0.460 0.591 0.727 0.915 1.108 1.314 0 0.463 2007 0 0.217 0.265 0.353 0.470 0.646 0.768 0.894 1.077 1.697 0 0.452 2008 0 0.197 0.264 0.321 0.486 0.634 0.804 0.973 1.176 1.435 2.437 0.412 2009 0 0.177 0.252 0.290 0.439 0.590 0.821 0.958 1.086 1.360 1.815 0.389 2010 0 0.191 0.251 0.313 0.426 0.548 0.784 0.941 1.054 1.232 1.510 0.403 2011 0 0.198 0.255 0.309 0.432 0.566 0.803 0.992 1.128 1.252 1.525 0.428
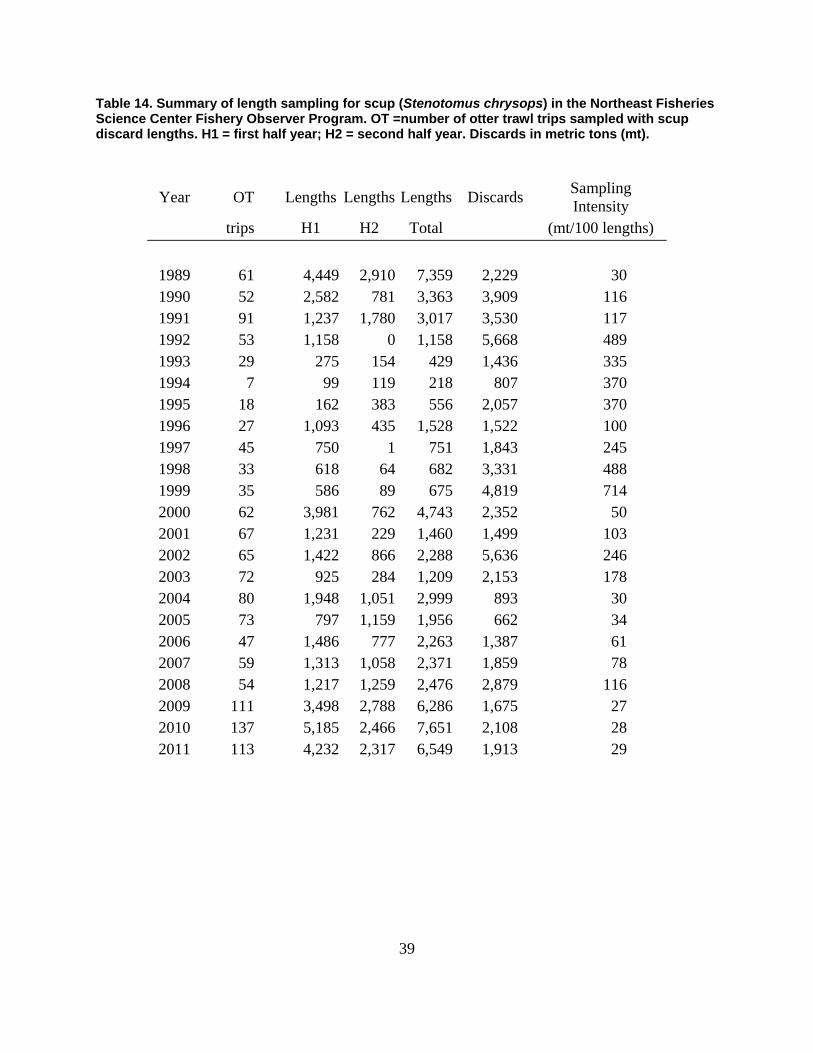
39
Table 14. Summary of length sampling for scup (Stenotomus chrysops) in the Northeast Fisheries Science Center Fishery Observer Program. OT =number of otter trawl trips sampled with scup discard lengths. H1 = first half year; H2 = second half year. Discards in metric tons (mt).
Year
OT
Lengths Lengths Lengths Discards
Sampling Intensity
trips
H1 H2 Total
(mt/100 lengths)
1989
61
4,449 2,910 7,359 2,229 30
1990
52
2,582 781 3,363 3,909 116
1991
91
1,237 1,780 3,017 3,530 117
1992
53
1,158 0 1,158 5,668 489
1993
29
275 154 429 1,436 335
1994
7
99 119 218 807 370
1995
18
162 383 556 2,057 370
1996
27
1,093 435 1,528 1,522 100
1997
45
750 1 751 1,843 245
1998
33
618 64 682 3,331 488
1999
35
586 89 675 4,819 714
2000
62
3,981 762 4,743 2,352 50
2001
67
1,231 229 1,460 1,499 103
2002
65
1,422 866 2,288 5,636 246
2003
72
925 284 1,209 2,153 178
2004
80
1,948 1,051 2,999 893 30
2005
73
797 1,159 1,956 662 34
2006
47
1,486 777 2,263 1,387 61
2007
59
1,313 1,058 2,371 1,859 78
2008
54
1,217 1,259 2,476 2,879 116
2009
111
3,498 2,788 6,286 1,675 27
2010
137
5,185 2,466 7,651 2,108 28
2011
113
4,232 2,317 6,549 1,913 29
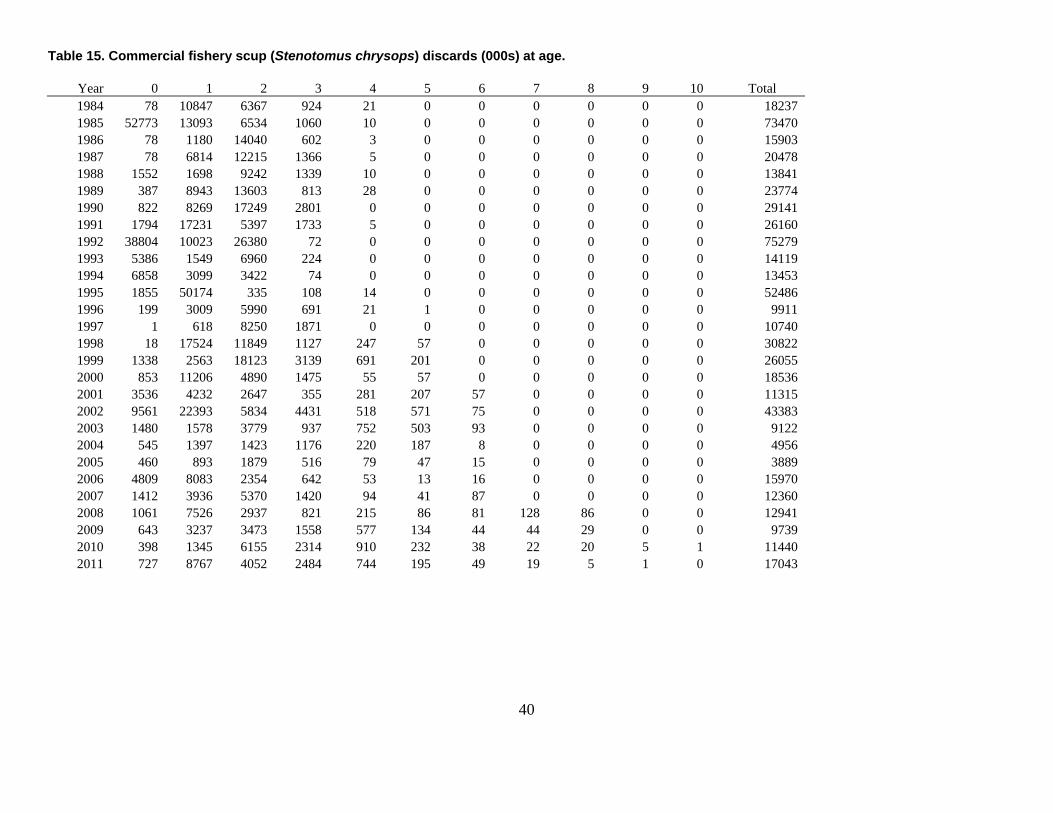
40
Table 15. Commercial fishery scup (Stenotomus chrysops) discards (000s) at age.
Year 0 1 2 3 4 5 6 7 8 9 10 Total 1984 78 10847 6367 924 21 0 0 0 0 0 0 18237 1985 52773 13093 6534 1060 10 0 0 0 0 0 0 73470 1986 78 1180 14040 602 3 0 0 0 0 0 0 15903 1987 78 6814 12215 1366 5 0 0 0 0 0 0 20478 1988 1552 1698 9242 1339 10 0 0 0 0 0 0 13841 1989 387 8943 13603 813 28 0 0 0 0 0 0 23774 1990 822 8269 17249 2801 0 0 0 0 0 0 0 29141 1991 1794 17231 5397 1733 5 0 0 0 0 0 0 26160 1992 38804 10023 26380 72 0 0 0 0 0 0 0 75279 1993 5386 1549 6960 224 0 0 0 0 0 0 0 14119 1994 6858 3099 3422 74 0 0 0 0 0 0 0 13453 1995 1855 50174 335 108 14 0 0 0 0 0 0 52486 1996 199 3009 5990 691 21 1 0 0 0 0 0 9911 1997 1 618 8250 1871 0 0 0 0 0 0 0 10740 1998 18 17524 11849 1127 247 57 0 0 0 0 0 30822 1999 1338 2563 18123 3139 691 201 0 0 0 0 0 26055 2000 853 11206 4890 1475 55 57 0 0 0 0 0 18536 2001 3536 4232 2647 355 281 207 57 0 0 0 0 11315 2002 9561 22393 5834 4431 518 571 75 0 0 0 0 43383 2003 1480 1578 3779 937 752 503 93 0 0 0 0 9122 2004 545 1397 1423 1176 220 187 8 0 0 0 0 4956 2005 460 893 1879 516 79 47 15 0 0 0 0 3889 2006 4809 8083 2354 642 53 13 16 0 0 0 0 15970 2007 1412 3936 5370 1420 94 41 87 0 0 0 0 12360 2008 1061 7526 2937 821 215 86 81 128 86 0 0 12941 2009 643 3237 3473 1558 577 134 44 44 29 0 0 9739 2010 398 1345 6155 2314 910 232 38 22 20 5 1 11440 2011 727 8767 4052 2484 744 195 49 19 5 1 0 17043
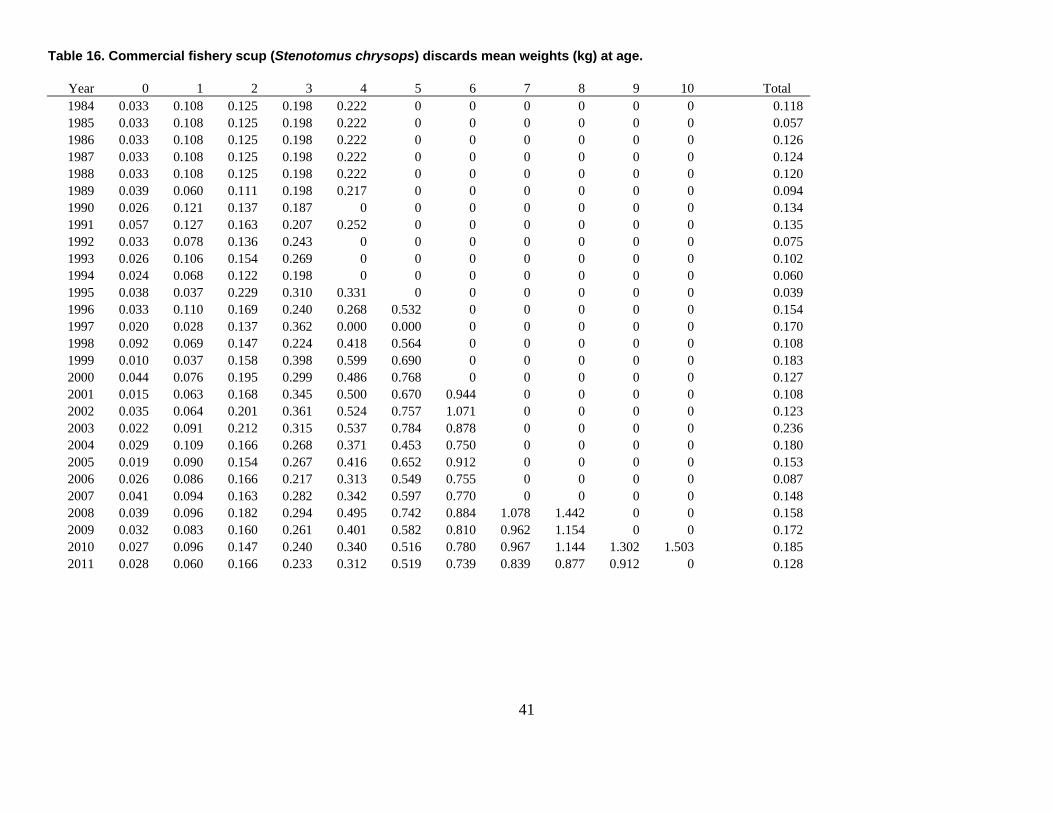
41
Table 16. Commercial fishery scup (Stenotomus chrysops) discards mean weights (kg) at age.
Year 0 1 2 3 4 5 6 7 8 9 10 Total 1984 0.033 0.108 0.125 0.198 0.222 0 0 0 0 0 0 0.118 1985 0.033 0.108 0.125 0.198 0.222 0 0 0 0 0 0 0.057 1986 0.033 0.108 0.125 0.198 0.222 0 0 0 0 0 0 0.126 1987 0.033 0.108 0.125 0.198 0.222 0 0 0 0 0 0 0.124 1988 0.033 0.108 0.125 0.198 0.222 0 0 0 0 0 0 0.120 1989 0.039 0.060 0.111 0.198 0.217 0 0 0 0 0 0 0.094 1990 0.026 0.121 0.137 0.187 0 0 0 0 0 0 0 0.134 1991 0.057 0.127 0.163 0.207 0.252 0 0 0 0 0 0 0.135 1992 0.033 0.078 0.136 0.243 0 0 0 0 0 0 0 0.075 1993 0.026 0.106 0.154 0.269 0 0 0 0 0 0 0 0.102 1994 0.024 0.068 0.122 0.198 0 0 0 0 0 0 0 0.060 1995 0.038 0.037 0.229 0.310 0.331 0 0 0 0 0 0 0.039 1996 0.033 0.110 0.169 0.240 0.268 0.532 0 0 0 0 0 0.154 1997 0.020 0.028 0.137 0.362 0.000 0.000 0 0 0 0 0 0.170 1998 0.092 0.069 0.147 0.224 0.418 0.564 0 0 0 0 0 0.108 1999 0.010 0.037 0.158 0.398 0.599 0.690 0 0 0 0 0 0.183 2000 0.044 0.076 0.195 0.299 0.486 0.768 0 0 0 0 0 0.127 2001 0.015 0.063 0.168 0.345 0.500 0.670 0.944 0 0 0 0 0.108 2002 0.035 0.064 0.201 0.361 0.524 0.757 1.071 0 0 0 0 0.123 2003 0.022 0.091 0.212 0.315 0.537 0.784 0.878 0 0 0 0 0.236 2004 0.029 0.109 0.166 0.268 0.371 0.453 0.750 0 0 0 0 0.180 2005 0.019 0.090 0.154 0.267 0.416 0.652 0.912 0 0 0 0 0.153 2006 0.026 0.086 0.166 0.217 0.313 0.549 0.755 0 0 0 0 0.087 2007 0.041 0.094 0.163 0.282 0.342 0.597 0.770 0 0 0 0 0.148 2008 0.039 0.096 0.182 0.294 0.495 0.742 0.884 1.078 1.442 0 0 0.158 2009 0.032 0.083 0.160 0.261 0.401 0.582 0.810 0.962 1.154 0 0 0.172 2010 0.027 0.096 0.147 0.240 0.340 0.516 0.780 0.967 1.144 1.302 1.503 0.185 2011 0.028 0.060 0.166 0.233 0.312 0.519 0.739 0.839 0.877 0.912 0 0.128
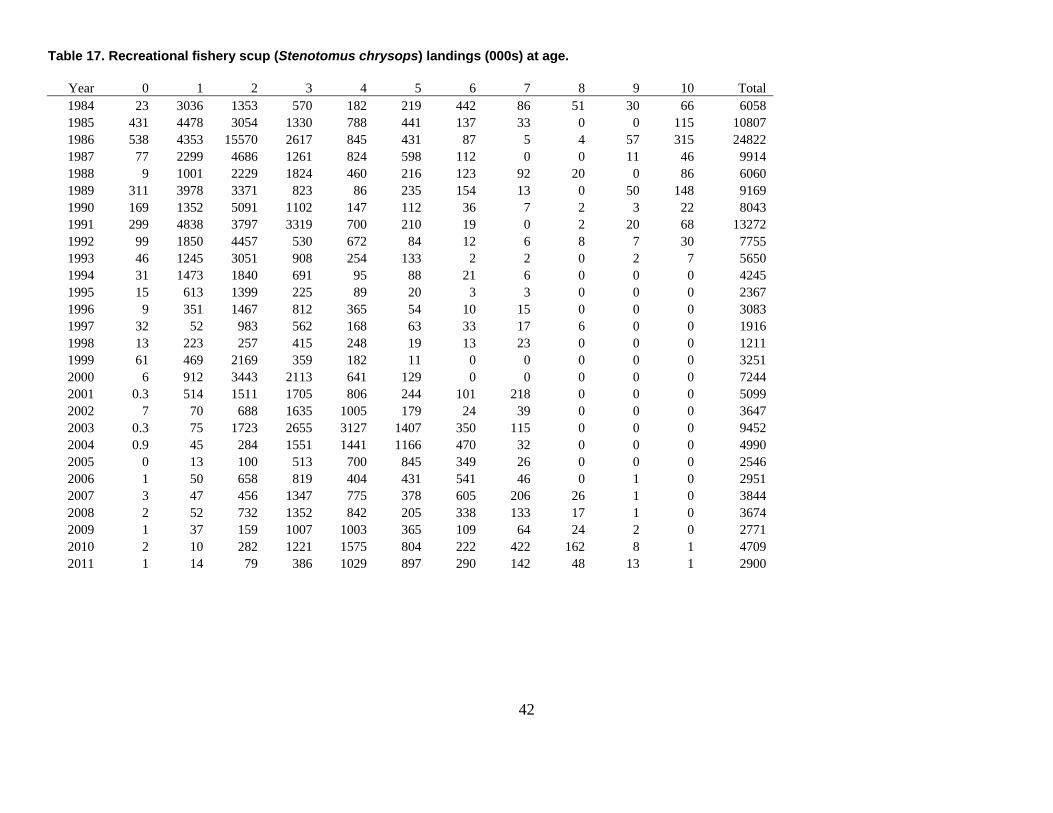
42
Table 17. Recreational fishery scup (Stenotomus chrysops) landings (000s) at age.
Year 0 1 2 3 4 5 6 7 8 9 10 Total 1984 23 3036 1353 570 182 219 442 86 51 30 66 6058 1985 431 4478 3054 1330 788 441 137 33 0 0 115 10807 1986 538 4353 15570 2617 845 431 87 5 4 57 315 24822 1987 77 2299 4686 1261 824 598 112 0 0 11 46 9914 1988 9 1001 2229 1824 460 216 123 92 20 0 86 6060 1989 311 3978 3371 823 86 235 154 13 0 50 148 9169 1990 169 1352 5091 1102 147 112 36 7 2 3 22 8043 1991 299 4838 3797 3319 700 210 19 0 2 20 68 13272 1992 99 1850 4457 530 672 84 12 6 8 7 30 7755 1993 46 1245 3051 908 254 133 2 2 0 2 7 5650 1994 31 1473 1840 691 95 88 21 6 0 0 0 4245 1995 15 613 1399 225 89 20 3 3 0 0 0 2367 1996 9 351 1467 812 365 54 10 15 0 0 0 3083 1997 32 52 983 562 168 63 33 17 6 0 0 1916 1998 13 223 257 415 248 19 13 23 0 0 0 1211 1999 61 469 2169 359 182 11 0 0 0 0 0 3251 2000 6 912 3443 2113 641 129 0 0 0 0 0 7244 2001 0.3 514 1511 1705 806 244 101 218 0 0 0 5099 2002 7 70 688 1635 1005 179 24 39 0 0 0 3647 2003 0.3 75 1723 2655 3127 1407 350 115 0 0 0 9452 2004 0.9 45 284 1551 1441 1166 470 32 0 0 0 4990 2005 0 13 100 513 700 845 349 26 0 0 0 2546 2006 1 50 658 819 404 431 541 46 0 1 0 2951 2007 3 47 456 1347 775 378 605 206 26 1 0 3844 2008 2 52 732 1352 842 205 338 133 17 1 0 3674 2009 1 37 159 1007 1003 365 109 64 24 2 0 2771 2010 2 10 282 1221 1575 804 222 422 162 8 1 4709 2011 1 14 79 386 1029 897 290 142 48 13 1 2900
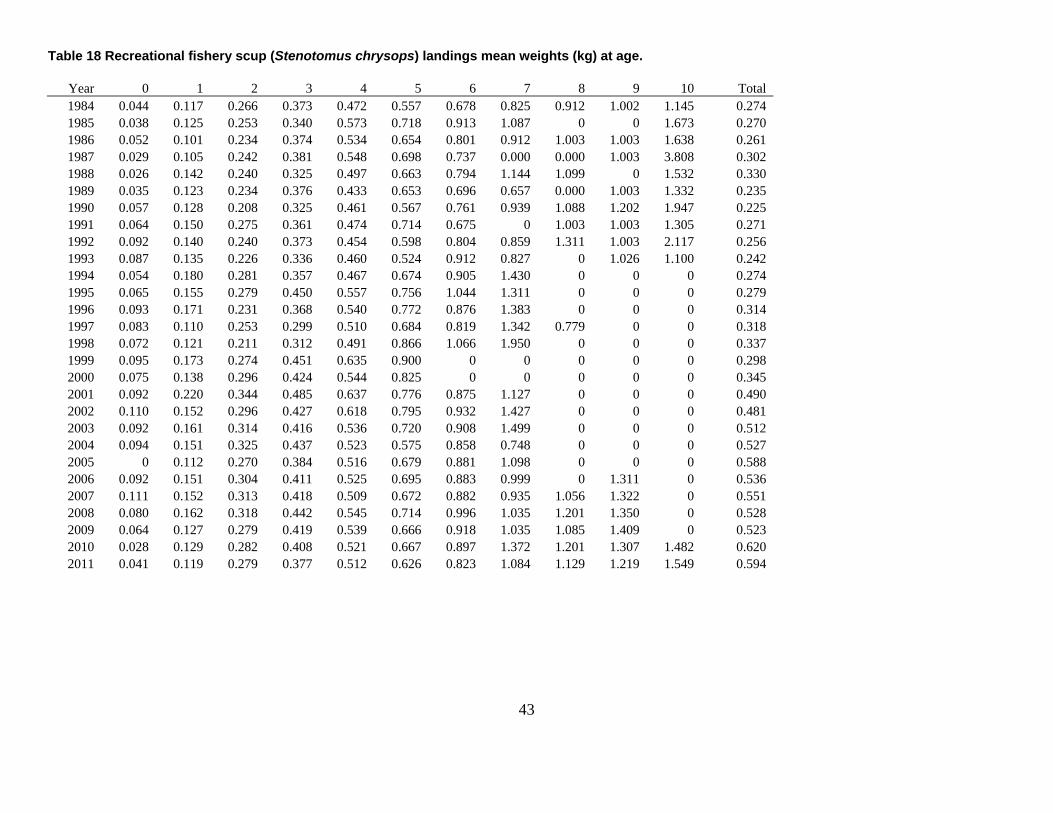
43
Table 18 Recreational fishery scup (Stenotomus chrysops) landings mean weights (kg) at age.
Year 0 1 2 3 4 5 6 7 8 9 10 Total 1984 0.044 0.117 0.266 0.373 0.472 0.557 0.678 0.825 0.912 1.002 1.145 0.274 1985 0.038 0.125 0.253 0.340 0.573 0.718 0.913 1.087 0 0 1.673 0.270 1986 0.052 0.101 0.234 0.374 0.534 0.654 0.801 0.912 1.003 1.003 1.638 0.261 1987 0.029 0.105 0.242 0.381 0.548 0.698 0.737 0.000 0.000 1.003 3.808 0.302 1988 0.026 0.142 0.240 0.325 0.497 0.663 0.794 1.144 1.099 0 1.532 0.330 1989 0.035 0.123 0.234 0.376 0.433 0.653 0.696 0.657 0.000 1.003 1.332 0.235 1990 0.057 0.128 0.208 0.325 0.461 0.567 0.761 0.939 1.088 1.202 1.947 0.225 1991 0.064 0.150 0.275 0.361 0.474 0.714 0.675 0 1.003 1.003 1.305 0.271 1992 0.092 0.140 0.240 0.373 0.454 0.598 0.804 0.859 1.311 1.003 2.117 0.256 1993 0.087 0.135 0.226 0.336 0.460 0.524 0.912 0.827 0 1.026 1.100 0.242 1994 0.054 0.180 0.281 0.357 0.467 0.674 0.905 1.430 0 0 0 0.274 1995 0.065 0.155 0.279 0.450 0.557 0.756 1.044 1.311 0 0 0 0.279 1996 0.093 0.171 0.231 0.368 0.540 0.772 0.876 1.383 0 0 0 0.314 1997 0.083 0.110 0.253 0.299 0.510 0.684 0.819 1.342 0.779 0 0 0.318 1998 0.072 0.121 0.211 0.312 0.491 0.866 1.066 1.950 0 0 0 0.337 1999 0.095 0.173 0.274 0.451 0.635 0.900 0 0 0 0 0 0.298 2000 0.075 0.138 0.296 0.424 0.544 0.825 0 0 0 0 0 0.345 2001 0.092 0.220 0.344 0.485 0.637 0.776 0.875 1.127 0 0 0 0.490 2002 0.110 0.152 0.296 0.427 0.618 0.795 0.932 1.427 0 0 0 0.481 2003 0.092 0.161 0.314 0.416 0.536 0.720 0.908 1.499 0 0 0 0.512 2004 0.094 0.151 0.325 0.437 0.523 0.575 0.858 0.748 0 0 0 0.527 2005 0 0.112 0.270 0.384 0.516 0.679 0.881 1.098 0 0 0 0.588 2006 0.092 0.151 0.304 0.411 0.525 0.695 0.883 0.999 0 1.311 0 0.536 2007 0.111 0.152 0.313 0.418 0.509 0.672 0.882 0.935 1.056 1.322 0 0.551 2008 0.080 0.162 0.318 0.442 0.545 0.714 0.996 1.035 1.201 1.350 0 0.528 2009 0.064 0.127 0.279 0.419 0.539 0.666 0.918 1.035 1.085 1.409 0 0.523 2010 0.028 0.129 0.282 0.408 0.521 0.667 0.897 1.372 1.201 1.307 1.482 0.620 2011 0.041 0.119 0.279 0.377 0.512 0.626 0.823 1.084 1.129 1.219 1.549 0.594
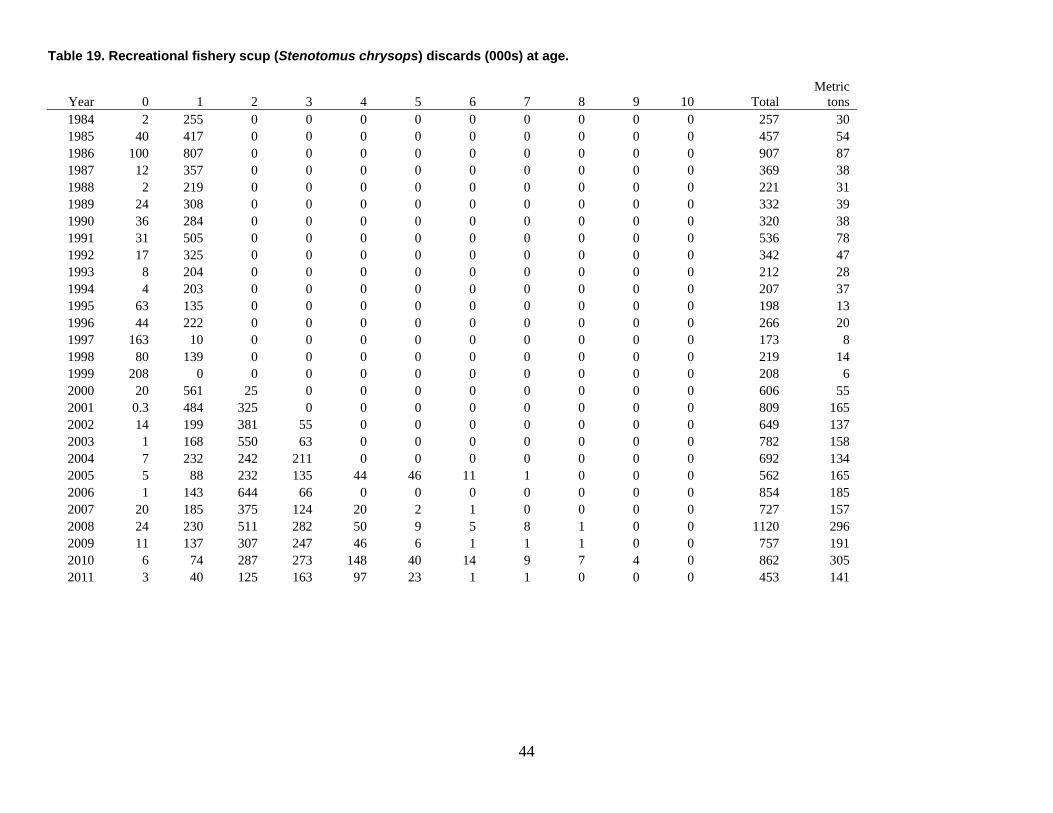
44
Table 19. Recreational fishery scup (Stenotomus chrysops) discards (000s) at age.
Year 0 1 2 3 4 5 6 7 8 9 10 Total Metric
tons 1984 2 255 0 0 0 0 0 0 0 0 0 257 30 1985 40 417 0 0 0 0 0 0 0 0 0 457 54 1986 100 807 0 0 0 0 0 0 0 0 0 907 87 1987 12 357 0 0 0 0 0 0 0 0 0 369 38 1988 2 219 0 0 0 0 0 0 0 0 0 221 31 1989 24 308 0 0 0 0 0 0 0 0 0 332 39 1990 36 284 0 0 0 0 0 0 0 0 0 320 38 1991 31 505 0 0 0 0 0 0 0 0 0 536 78 1992 17 325 0 0 0 0 0 0 0 0 0 342 47 1993 8 204 0 0 0 0 0 0 0 0 0 212 28 1994 4 203 0 0 0 0 0 0 0 0 0 207 37 1995 63 135 0 0 0 0 0 0 0 0 0 198 13 1996 44 222 0 0 0 0 0 0 0 0 0 266 20 1997 163 10 0 0 0 0 0 0 0 0 0 173 8 1998 80 139 0 0 0 0 0 0 0 0 0 219 14 1999 208 0 0 0 0 0 0 0 0 0 0 208 6 2000 20 561 25 0 0 0 0 0 0 0 0 606 55 2001 0.3 484 325 0 0 0 0 0 0 0 0 809 165 2002 14 199 381 55 0 0 0 0 0 0 0 649 137 2003 1 168 550 63 0 0 0 0 0 0 0 782 158 2004 7 232 242 211 0 0 0 0 0 0 0 692 134 2005 5 88 232 135 44 46 11 1 0 0 0 562 165 2006 1 143 644 66 0 0 0 0 0 0 0 854 185 2007 20 185 375 124 20 2 1 0 0 0 0 727 157 2008 24 230 511 282 50 9 5 8 1 0 0 1120 296 2009 11 137 307 247 46 6 1 1 1 0 0 757 191 2010 6 74 287 273 148 40 14 9 7 4 0 862 305 2011 3 40 125 163 97 23 1 1 0 0 0 453 141
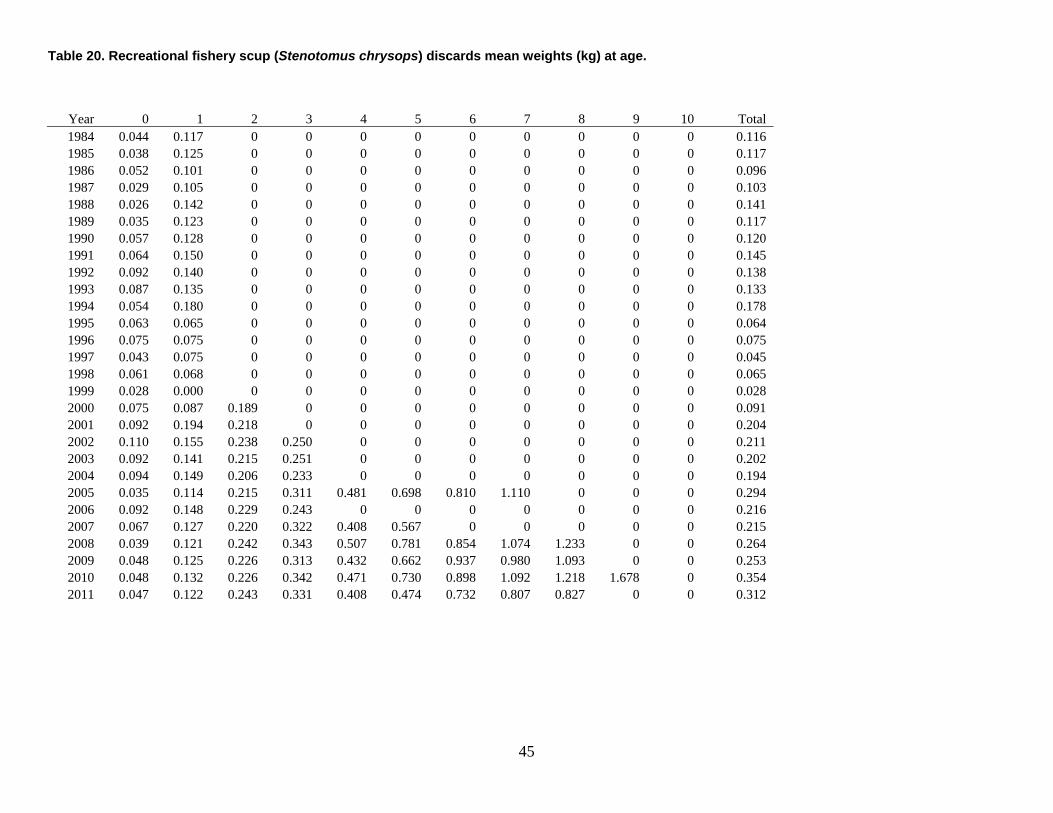
45
Table 20. Recreational fishery scup (Stenotomus chrysops) discards mean weights (kg) at age.
Year 0 1 2 3 4 5 6 7 8 9 10 Total 1984 0.044 0.117 0 0 0 0 0 0 0 0 0 0.116 1985 0.038 0.125 0 0 0 0 0 0 0 0 0 0.117 1986 0.052 0.101 0 0 0 0 0 0 0 0 0 0.096 1987 0.029 0.105 0 0 0 0 0 0 0 0 0 0.103 1988 0.026 0.142 0 0 0 0 0 0 0 0 0 0.141 1989 0.035 0.123 0 0 0 0 0 0 0 0 0 0.117 1990 0.057 0.128 0 0 0 0 0 0 0 0 0 0.120 1991 0.064 0.150 0 0 0 0 0 0 0 0 0 0.145 1992 0.092 0.140 0 0 0 0 0 0 0 0 0 0.138 1993 0.087 0.135 0 0 0 0 0 0 0 0 0 0.133 1994 0.054 0.180 0 0 0 0 0 0 0 0 0 0.178 1995 0.063 0.065 0 0 0 0 0 0 0 0 0 0.064 1996 0.075 0.075 0 0 0 0 0 0 0 0 0 0.075 1997 0.043 0.075 0 0 0 0 0 0 0 0 0 0.045 1998 0.061 0.068 0 0 0 0 0 0 0 0 0 0.065 1999 0.028 0.000 0 0 0 0 0 0 0 0 0 0.028 2000 0.075 0.087 0.189 0 0 0 0 0 0 0 0 0.091 2001 0.092 0.194 0.218 0 0 0 0 0 0 0 0 0.204 2002 0.110 0.155 0.238 0.250 0 0 0 0 0 0 0 0.211 2003 0.092 0.141 0.215 0.251 0 0 0 0 0 0 0 0.202 2004 0.094 0.149 0.206 0.233 0 0 0 0 0 0 0 0.194 2005 0.035 0.114 0.215 0.311 0.481 0.698 0.810 1.110 0 0 0 0.294 2006 0.092 0.148 0.229 0.243 0 0 0 0 0 0 0 0.216 2007 0.067 0.127 0.220 0.322 0.408 0.567 0 0 0 0 0 0.215 2008 0.039 0.121 0.242 0.343 0.507 0.781 0.854 1.074 1.233 0 0 0.264 2009 0.048 0.125 0.226 0.313 0.432 0.662 0.937 0.980 1.093 0 0 0.253 2010 0.048 0.132 0.226 0.342 0.471 0.730 0.898 1.092 1.218 1.678 0 0.354 2011 0.047 0.122 0.243 0.331 0.408 0.474 0.732 0.807 0.827 0 0 0.312
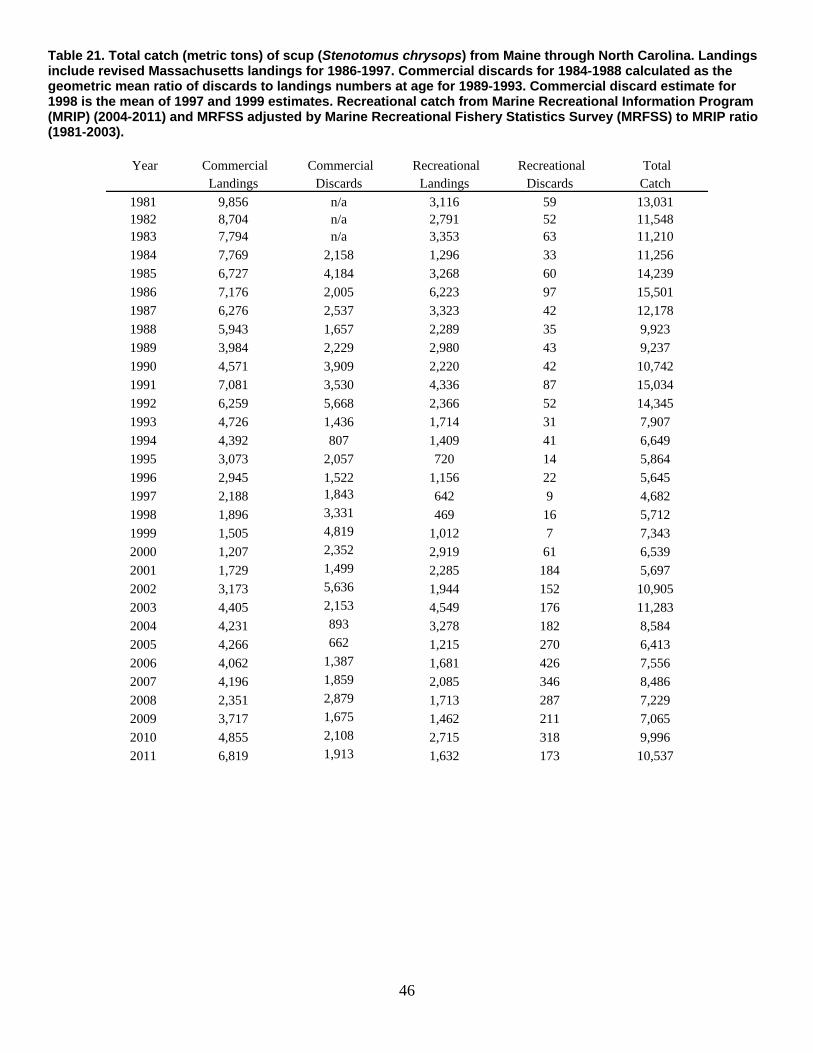
46
Table 21. Total catch (metric tons) of scup (Stenotomus chrysops) from Maine through North Carolina. Landings include revised Massachusetts landings for 1986-1997. Commercial discards for 1984-1988 calculated as the geometric mean ratio of discards to landings numbers at age for 1989-1993. Commercial discard estimate for 1998 is the mean of 1997 and 1999 estimates. Recreational catch from Marine Recreational Information Program (MRIP) (2004-2011) and MRFSS adjusted by Marine Recreational Fishery Statistics Survey (MRFSS) to MRIP ratio (1981-2003).
Year Commercial Commercial Recreational Recreational Total Landings Discards Landings Discards Catch
1981 9,856 n/a 3,116 59 13,031 1982 8,704 n/a 2,791 52 11,548 1983 7,794 n/a 3,353 63 11,210
1984 7,769 2,158 1,296 33 11,256
1985 6,727 4,184 3,268 60 14,239
1986 7,176 2,005 6,223 97 15,501
1987 6,276 2,537 3,323 42 12,178
1988 5,943 1,657 2,289 35 9,923
1989 3,984 2,229 2,980 43 9,237
1990 4,571 3,909 2,220 42 10,742
1991 7,081 3,530 4,336 87 15,034
1992 6,259 5,668 2,366 52 14,345
1993 4,726 1,436 1,714 31 7,907
1994 4,392 807 1,409 41 6,649
1995 3,073 2,057 720 14 5,864
1996 2,945 1,522 1,156 22 5,645
1997 2,188 1,843 642 9 4,682
1998 1,896 3,331 469 16 5,712
1999 1,505 4,819 1,012 7 7,343
2000 1,207 2,352 2,919 61 6,539
2001 1,729 1,499 2,285 184 5,697
2002 3,173 5,636 1,944 152 10,905
2003 4,405 2,153 4,549 176 11,283
2004 4,231 893 3,278 182 8,584
2005 4,266 662 1,215 270 6,413
2006 4,062 1,387 1,681 426 7,556
2007 4,196 1,859 2,085 346 8,486
2008 2,351 2,879 1,713 287 7,229
2009 3,717 1,675 1,462 211 7,065
2010 4,855 2,108 2,715 318 9,996
2011 6,819 1,913 1,632 173 10,537
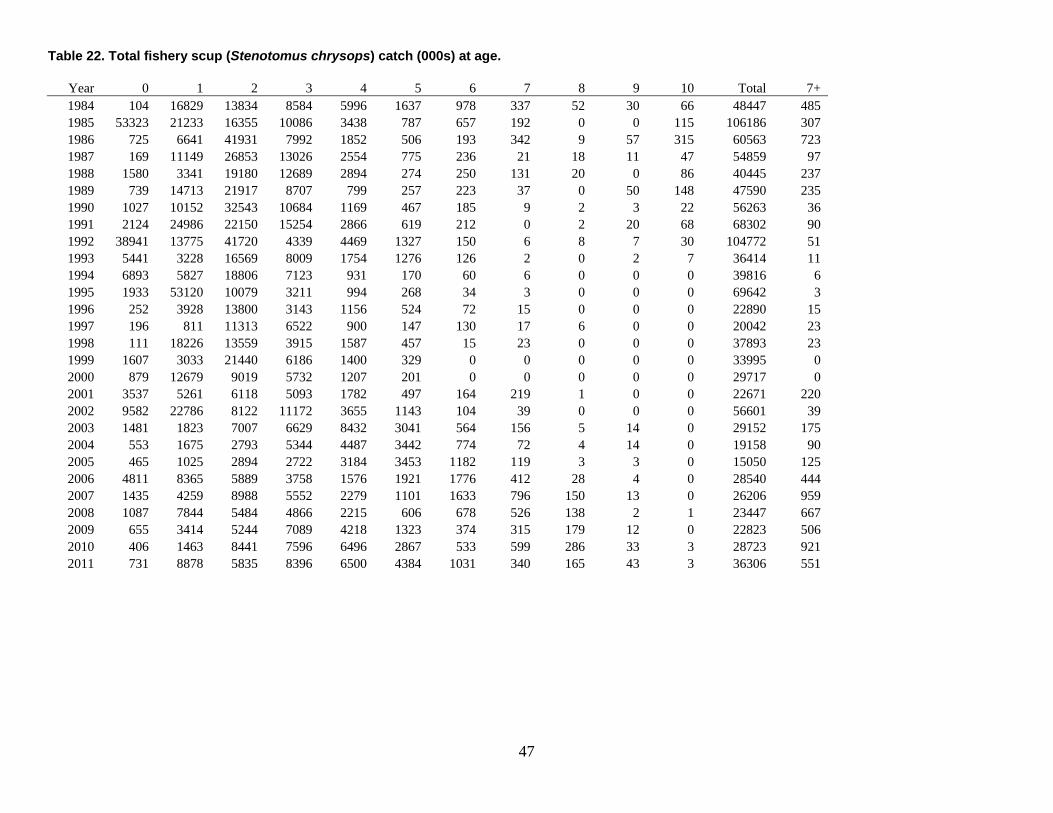
47
Table 22. Total fishery scup (Stenotomus chrysops) catch (000s) at age.
Year 0 1 2 3 4 5 6 7 8 9 10 Total 7+ 1984 104 16829 13834 8584 5996 1637 978 337 52 30 66 48447 485 1985 53323 21233 16355 10086 3438 787 657 192 0 0 115 106186 307 1986 725 6641 41931 7992 1852 506 193 342 9 57 315 60563 723 1987 169 11149 26853 13026 2554 775 236 21 18 11 47 54859 97 1988 1580 3341 19180 12689 2894 274 250 131 20 0 86 40445 237 1989 739 14713 21917 8707 799 257 223 37 0 50 148 47590 235 1990 1027 10152 32543 10684 1169 467 185 9 2 3 22 56263 36 1991 2124 24986 22150 15254 2866 619 212 0 2 20 68 68302 90 1992 38941 13775 41720 4339 4469 1327 150 6 8 7 30 104772 51 1993 5441 3228 16569 8009 1754 1276 126 2 0 2 7 36414 11 1994 6893 5827 18806 7123 931 170 60 6 0 0 0 39816 6 1995 1933 53120 10079 3211 994 268 34 3 0 0 0 69642 3 1996 252 3928 13800 3143 1156 524 72 15 0 0 0 22890 15 1997 196 811 11313 6522 900 147 130 17 6 0 0 20042 23 1998 111 18226 13559 3915 1587 457 15 23 0 0 0 37893 23 1999 1607 3033 21440 6186 1400 329 0 0 0 0 0 33995 0 2000 879 12679 9019 5732 1207 201 0 0 0 0 0 29717 0 2001 3537 5261 6118 5093 1782 497 164 219 1 0 0 22671 220 2002 9582 22786 8122 11172 3655 1143 104 39 0 0 0 56601 39 2003 1481 1823 7007 6629 8432 3041 564 156 5 14 0 29152 175 2004 553 1675 2793 5344 4487 3442 774 72 4 14 0 19158 90 2005 465 1025 2894 2722 3184 3453 1182 119 3 3 0 15050 125 2006 4811 8365 5889 3758 1576 1921 1776 412 28 4 0 28540 444 2007 1435 4259 8988 5552 2279 1101 1633 796 150 13 0 26206 959 2008 1087 7844 5484 4866 2215 606 678 526 138 2 1 23447 667 2009 655 3414 5244 7089 4218 1323 374 315 179 12 0 22823 506 2010 406 1463 8441 7596 6496 2867 533 599 286 33 3 28723 921 2011 731 8878 5835 8396 6500 4384 1031 340 165 43 3 36306 551
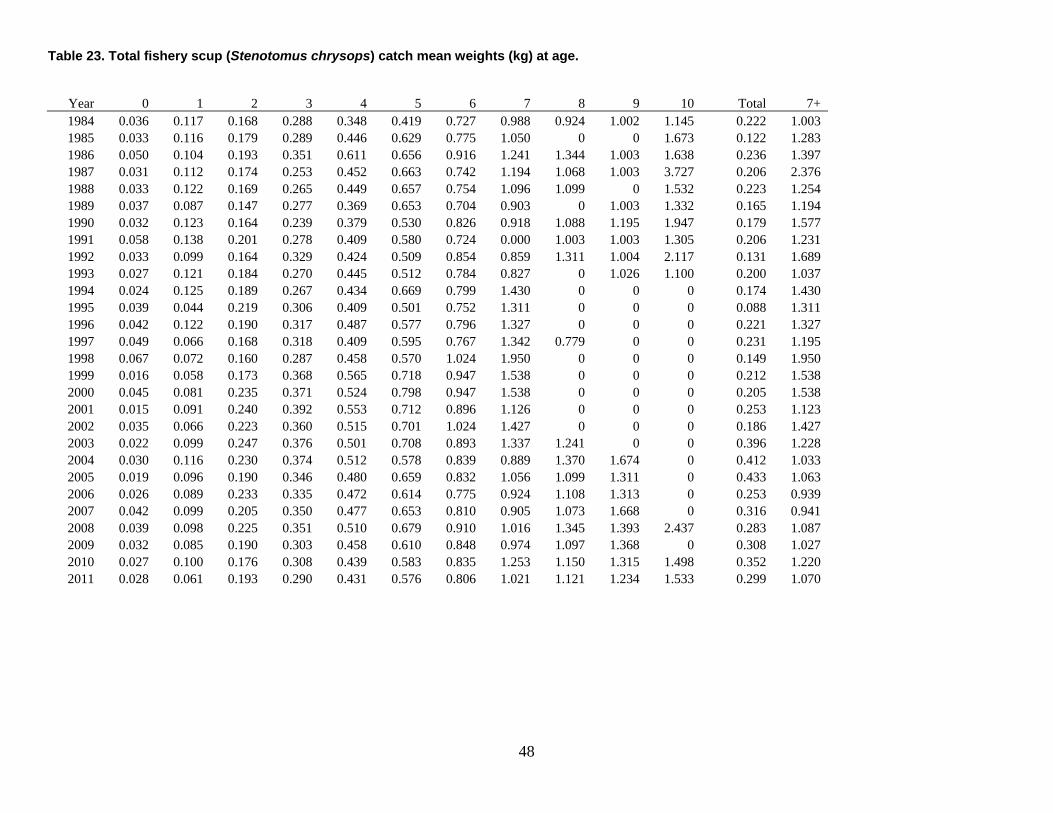
48
Table 23. Total fishery scup (Stenotomus chrysops) catch mean weights (kg) at age.
Year 0 1 2 3 4 5 6 7 8 9 10 Total 7+ 1984 0.036 0.117 0.168 0.288 0.348 0.419 0.727 0.988 0.924 1.002 1.145 0.222 1.003 1985 0.033 0.116 0.179 0.289 0.446 0.629 0.775 1.050 0 0 1.673 0.122 1.283 1986 0.050 0.104 0.193 0.351 0.611 0.656 0.916 1.241 1.344 1.003 1.638 0.236 1.397 1987 0.031 0.112 0.174 0.253 0.452 0.663 0.742 1.194 1.068 1.003 3.727 0.206 2.376 1988 0.033 0.122 0.169 0.265 0.449 0.657 0.754 1.096 1.099 0 1.532 0.223 1.254 1989 0.037 0.087 0.147 0.277 0.369 0.653 0.704 0.903 0 1.003 1.332 0.165 1.194 1990 0.032 0.123 0.164 0.239 0.379 0.530 0.826 0.918 1.088 1.195 1.947 0.179 1.577 1991 0.058 0.138 0.201 0.278 0.409 0.580 0.724 0.000 1.003 1.003 1.305 0.206 1.231 1992 0.033 0.099 0.164 0.329 0.424 0.509 0.854 0.859 1.311 1.004 2.117 0.131 1.689 1993 0.027 0.121 0.184 0.270 0.445 0.512 0.784 0.827 0 1.026 1.100 0.200 1.037 1994 0.024 0.125 0.189 0.267 0.434 0.669 0.799 1.430 0 0 0 0.174 1.430 1995 0.039 0.044 0.219 0.306 0.409 0.501 0.752 1.311 0 0 0 0.088 1.311 1996 0.042 0.122 0.190 0.317 0.487 0.577 0.796 1.327 0 0 0 0.221 1.327 1997 0.049 0.066 0.168 0.318 0.409 0.595 0.767 1.342 0.779 0 0 0.231 1.195 1998 0.067 0.072 0.160 0.287 0.458 0.570 1.024 1.950 0 0 0 0.149 1.950 1999 0.016 0.058 0.173 0.368 0.565 0.718 0.947 1.538 0 0 0 0.212 1.538 2000 0.045 0.081 0.235 0.371 0.524 0.798 0.947 1.538 0 0 0 0.205 1.538 2001 0.015 0.091 0.240 0.392 0.553 0.712 0.896 1.126 0 0 0 0.253 1.123 2002 0.035 0.066 0.223 0.360 0.515 0.701 1.024 1.427 0 0 0 0.186 1.427 2003 0.022 0.099 0.247 0.376 0.501 0.708 0.893 1.337 1.241 0 0 0.396 1.228 2004 0.030 0.116 0.230 0.374 0.512 0.578 0.839 0.889 1.370 1.674 0 0.412 1.033 2005 0.019 0.096 0.190 0.346 0.480 0.659 0.832 1.056 1.099 1.311 0 0.433 1.063 2006 0.026 0.089 0.233 0.335 0.472 0.614 0.775 0.924 1.108 1.313 0 0.253 0.939 2007 0.042 0.099 0.205 0.350 0.477 0.653 0.810 0.905 1.073 1.668 0 0.316 0.941 2008 0.039 0.098 0.225 0.351 0.510 0.679 0.910 1.016 1.345 1.393 2.437 0.283 1.087 2009 0.032 0.085 0.190 0.303 0.458 0.610 0.848 0.974 1.097 1.368 0 0.308 1.027 2010 0.027 0.100 0.176 0.308 0.439 0.583 0.835 1.253 1.150 1.315 1.498 0.352 1.220 2011 0.028 0.061 0.193 0.290 0.431 0.576 0.806 1.021 1.121 1.234 1.533 0.299 1.070
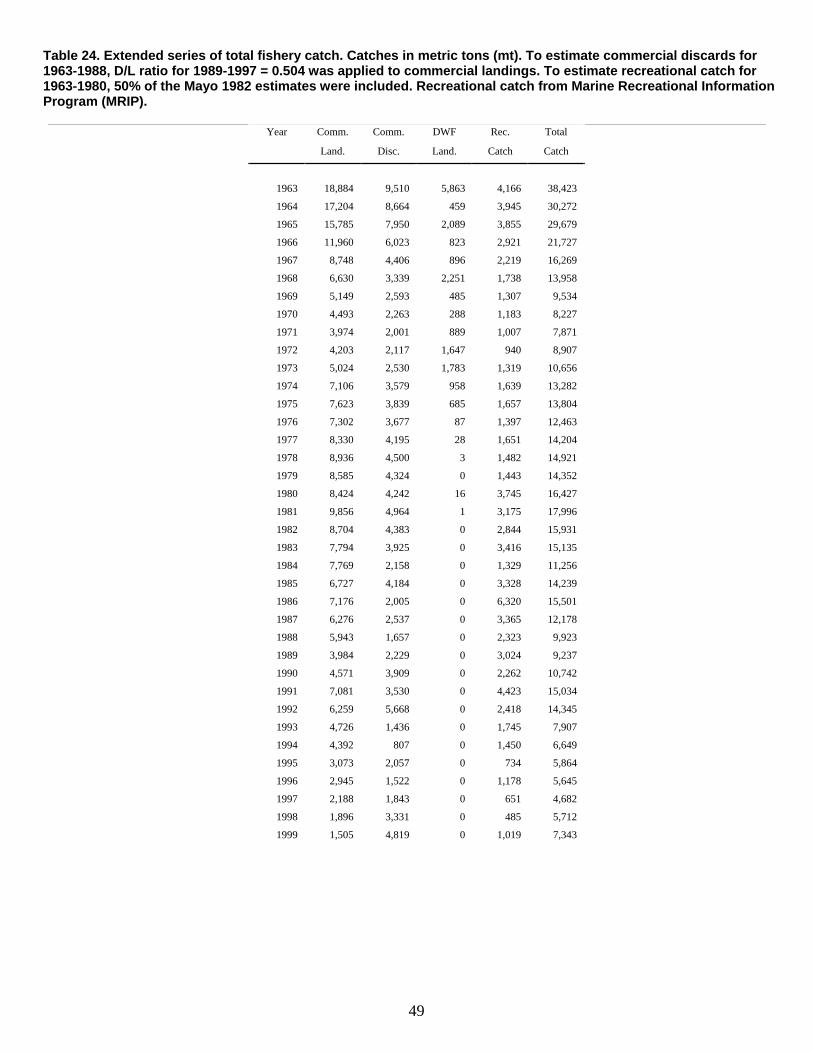
49
Table 24. Extended series of total fishery catch. Catches in metric tons (mt). To estimate commercial discards for 1963-1988, D/L ratio for 1989-1997 = 0.504 was applied to commercial landings. To estimate recreational catch for 1963-1980, 50% of the Mayo 1982 estimates were included. Recreational catch from Marine Recreational Information Program (MRIP).
Year Comm. Comm. DWF Rec. Total
Land. Disc. Land. Catch Catch
1963 18,884 9,510 5,863 4,166 38,423
1964 17,204 8,664 459 3,945 30,272
1965 15,785 7,950 2,089 3,855 29,679
1966 11,960 6,023 823 2,921 21,727
1967 8,748 4,406 896 2,219 16,269
1968 6,630 3,339 2,251 1,738 13,958
1969 5,149 2,593 485 1,307 9,534
1970 4,493 2,263 288 1,183 8,227
1971 3,974 2,001 889 1,007 7,871
1972 4,203 2,117 1,647 940 8,907
1973 5,024 2,530 1,783 1,319 10,656
1974 7,106 3,579 958 1,639 13,282
1975 7,623 3,839 685 1,657 13,804
1976 7,302 3,677 87 1,397 12,463
1977 8,330 4,195 28 1,651 14,204
1978 8,936 4,500 3 1,482 14,921
1979 8,585 4,324 0 1,443 14,352
1980 8,424 4,242 16 3,745 16,427
1981 9,856 4,964 1 3,175 17,996
1982 8,704 4,383 0 2,844 15,931
1983 7,794 3,925 0 3,416 15,135
1984 7,769 2,158 0 1,329 11,256
1985 6,727 4,184 0 3,328 14,239
1986 7,176 2,005 0 6,320 15,501
1987 6,276 2,537 0 3,365 12,178
1988 5,943 1,657 0 2,323 9,923
1989 3,984 2,229 0 3,024 9,237
1990 4,571 3,909 0 2,262 10,742
1991 7,081 3,530 0 4,423 15,034
1992 6,259 5,668 0 2,418 14,345
1993 4,726 1,436 0 1,745 7,907
1994 4,392 807 0 1,450 6,649
1995 3,073 2,057 0 734 5,864
1996 2,945 1,522 0 1,178 5,645
1997 2,188 1,843 0 651 4,682
1998 1,896 3,331 0 485 5,712
1999 1,505 4,819 0 1,019 7,343
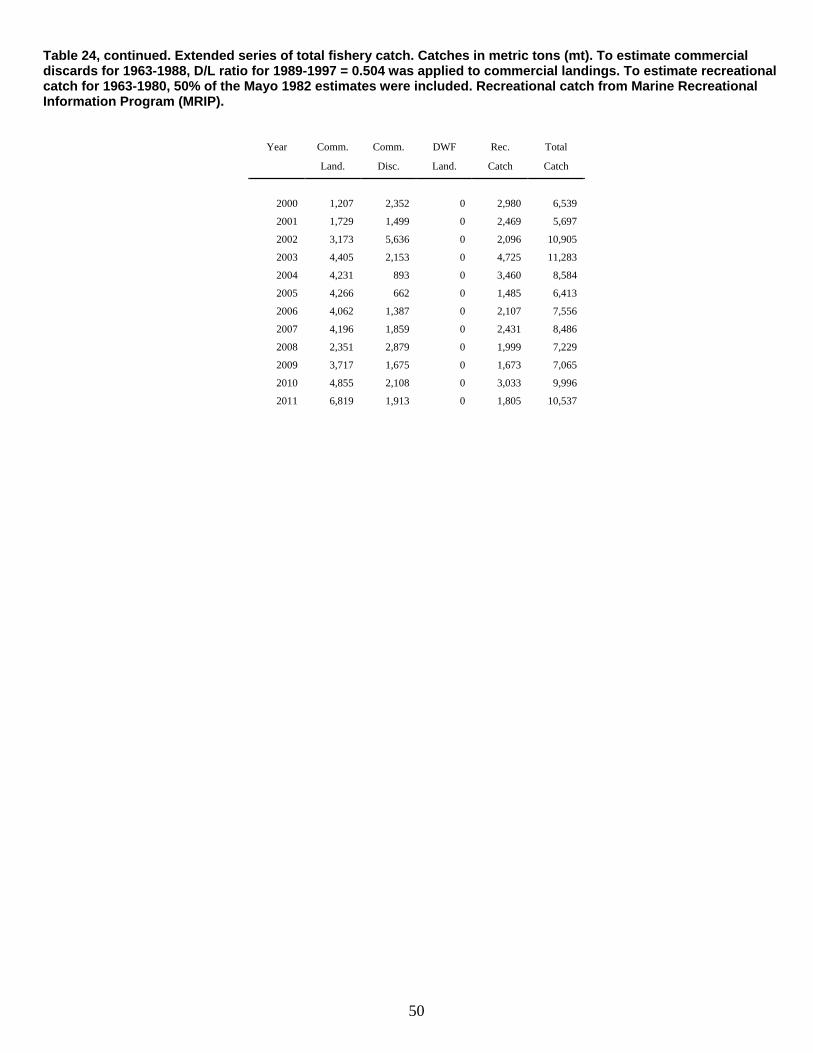
50
Table 24, continued. Extended series of total fishery catch. Catches in metric tons (mt). To estimate commercial discards for 1963-1988, D/L ratio for 1989-1997 = 0.504 was applied to commercial landings. To estimate recreational catch for 1963-1980, 50% of the Mayo 1982 estimates were included. Recreational catch from Marine Recreational Information Program (MRIP).
Year Comm. Comm. DWF Rec. Total
Land. Disc. Land. Catch Catch
2000 1,207 2,352 0 2,980 6,539
2001 1,729 1,499 0 2,469 5,697
2002 3,173 5,636 0 2,096 10,905
2003 4,405 2,153 0 4,725 11,283
2004 4,231 893 0 3,460 8,584
2005 4,266 662 0 1,485 6,413
2006 4,062 1,387 0 2,107 7,556
2007 4,196 1,859 0 2,431 8,486
2008 2,351 2,879 0 1,999 7,229
2009 3,717 1,675 0 1,673 7,065
2010 4,855 2,108 0 3,033 9,996
2011 6,819 1,913 0 1,805 10,537
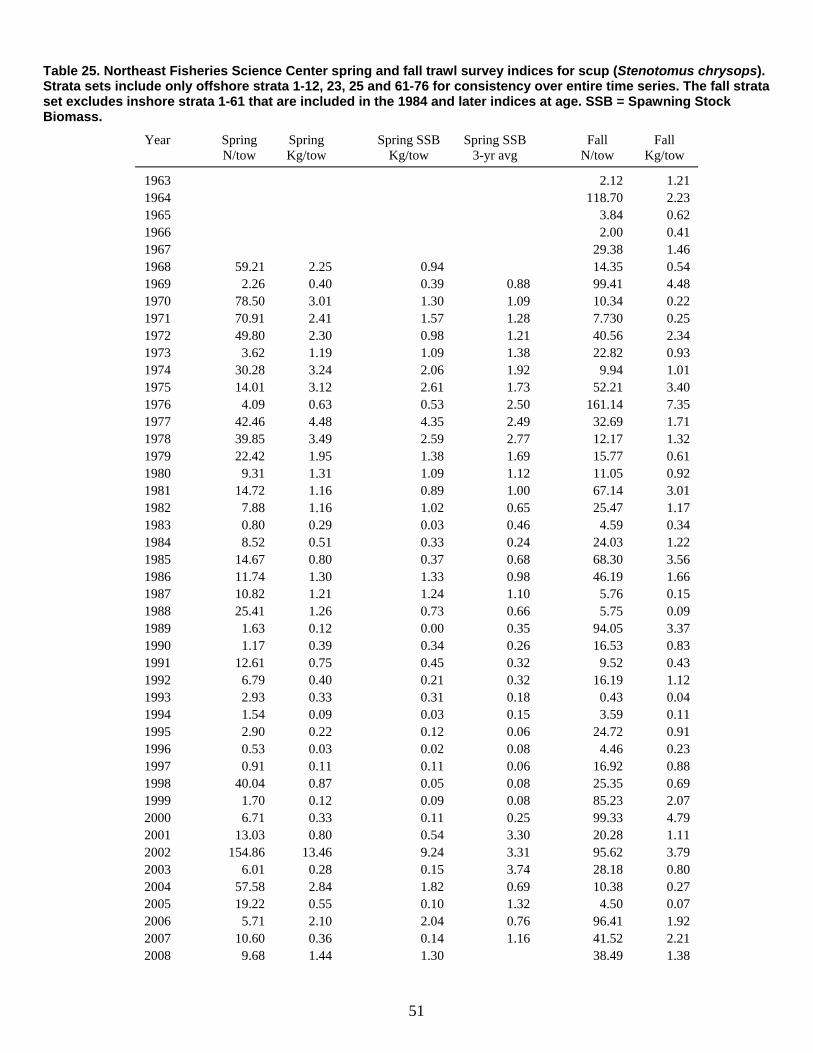
51
Table 25. Northeast Fisheries Science Center spring and fall trawl survey indices for scup (Stenotomus chrysops). Strata sets include only offshore strata 1-12, 23, 25 and 61-76 for consistency over entire time series. The fall strata set excludes inshore strata 1-61 that are included in the 1984 and later indices at age. SSB = Spawning Stock Biomass.
Year
Spring N/tow
Spring Kg/tow
Spring SSB Kg/tow
Spring SSB 3-yr avg
Fall N/tow
Fall
Kg/tow
1963 2.12 1.21 1964 118.70 2.23 1965 3.84 0.62 1966 2.00 0.41 1967 29.38 1.46 1968 59.21 2.25 0.94 14.35 0.54 1969 2.26 0.40 0.39 0.88 99.41 4.48 1970 78.50 3.01 1.30 1.09 10.34 0.22 1971 70.91 2.41 1.57 1.28 7.730 0.25 1972 49.80 2.30 0.98 1.21 40.56 2.34 1973 3.62 1.19 1.09 1.38 22.82 0.93 1974 30.28 3.24 2.06 1.92 9.94 1.01 1975 14.01 3.12 2.61 1.73 52.21 3.40 1976 4.09 0.63 0.53 2.50 161.14 7.35 1977 42.46 4.48 4.35 2.49 32.69 1.71 1978 39.85 3.49 2.59 2.77 12.17 1.32 1979 22.42 1.95 1.38 1.69 15.77 0.61 1980 9.31 1.31 1.09 1.12 11.05 0.92 1981 14.72 1.16 0.89 1.00 67.14 3.01 1982 7.88 1.16 1.02 0.65 25.47 1.17 1983 0.80 0.29 0.03 0.46 4.59 0.34 1984 8.52 0.51 0.33 0.24 24.03 1.22 1985 14.67 0.80 0.37 0.68 68.30 3.56 1986 11.74 1.30 1.33 0.98 46.19 1.66 1987 10.82 1.21 1.24 1.10 5.76 0.15 1988 25.41 1.26 0.73 0.66 5.75 0.09 1989 1.63 0.12 0.00 0.35 94.05 3.37 1990 1.17 0.39 0.34 0.26 16.53 0.83 1991 12.61 0.75 0.45 0.32 9.52 0.43 1992 6.79 0.40 0.21 0.32 16.19 1.12 1993 2.93 0.33 0.31 0.18 0.43 0.04 1994 1.54 0.09 0.03 0.15 3.59 0.11 1995 2.90 0.22 0.12 0.06 24.72 0.91 1996 0.53 0.03 0.02 0.08 4.46 0.23 1997 0.91 0.11 0.11 0.06 16.92 0.88 1998 40.04 0.87 0.05 0.08 25.35 0.69 1999 1.70 0.12 0.09 0.08 85.23 2.07 2000 6.71 0.33 0.11 0.25 99.33 4.79 2001 13.03 0.80 0.54 3.30 20.28 1.11 2002 154.86 13.46 9.24 3.31 95.62 3.79 2003 6.01 0.28 0.15 3.74 28.18 0.80 2004 57.58 2.84 1.82 0.69 10.38 0.27 2005 19.22 0.55 0.10 1.32 4.50 0.07 2006 5.71 2.10 2.04 0.76 96.41 1.92 2007 10.60 0.36 0.14 1.16 41.52 2.21 2008 9.68 1.44 1.30 38.49 1.38
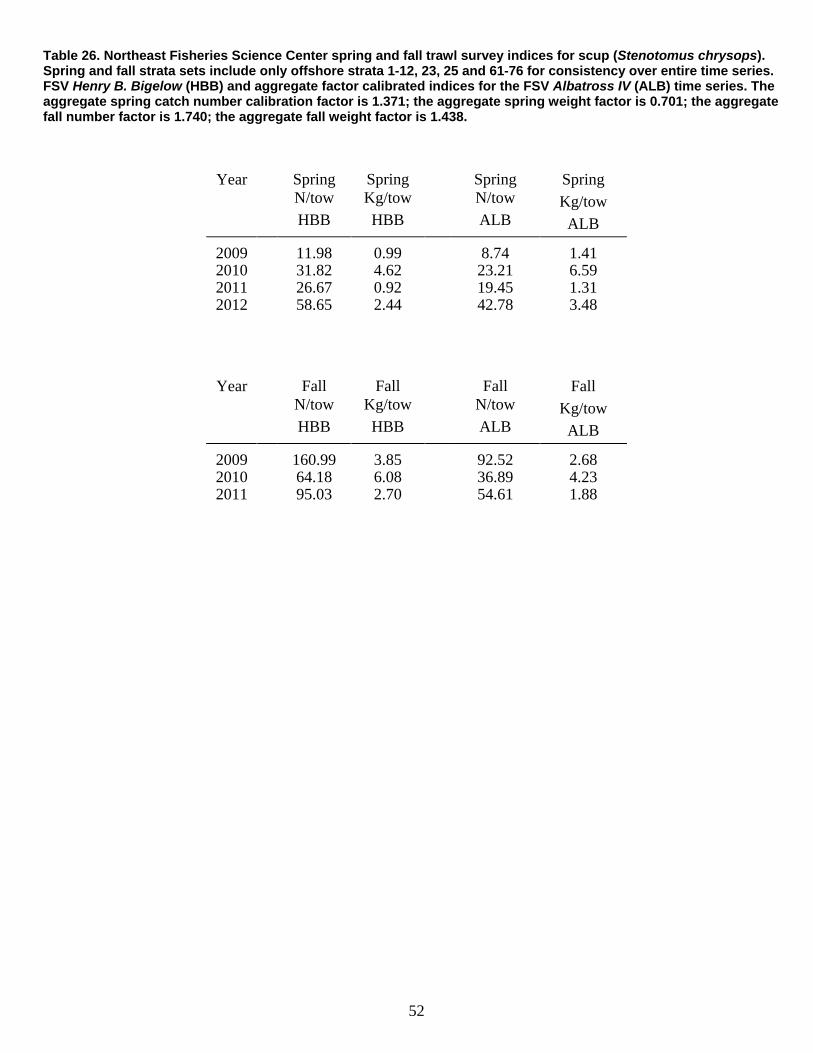
52
Table 26. Northeast Fisheries Science Center spring and fall trawl survey indices for scup (Stenotomus chrysops). Spring and fall strata sets include only offshore strata 1-12, 23, 25 and 61-76 for consistency over entire time series. FSV Henry B. Bigelow (HBB) and aggregate factor calibrated indices for the FSV Albatross IV (ALB) time series. The aggregate spring catch number calibration factor is 1.371; the aggregate spring weight factor is 0.701; the aggregate fall number factor is 1.740; the aggregate fall weight factor is 1.438.
Year
Spring N/tow
HBB
Spring Kg/tow
HBB
Spring N/tow
ALB
Spring
Kg/tow
ALB
2009 11.98 0.99 8.74 1.41 2010 31.82 4.62 23.21 6.59 2011 26.67 0.92 19.45 1.31 2012 58.65 2.44 42.78 3.48
Year
Fall
N/tow
HBB
Fall Kg/tow
HBB
Fall N/tow
ALB
Fall
Kg/tow
ALB
2009 160.99 3.85 92.52 2.68 2010 64.18 6.08 36.89 4.23 2011 95.03 2.70 54.61 1.88
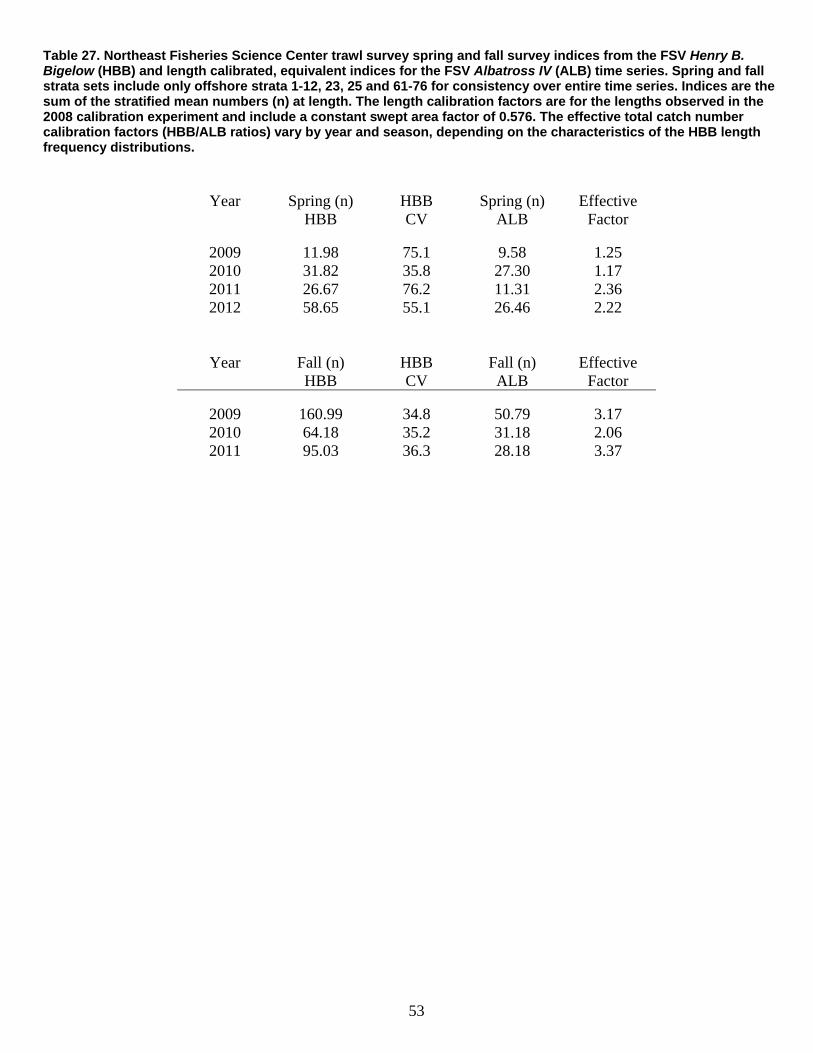
53
Table 27. Northeast Fisheries Science Center trawl survey spring and fall survey indices from the FSV Henry B. Bigelow (HBB) and length calibrated, equivalent indices for the FSV Albatross IV (ALB) time series. Spring and fall strata sets include only offshore strata 1-12, 23, 25 and 61-76 for consistency over entire time series. Indices are the sum of the stratified mean numbers (n) at length. The length calibration factors are for the lengths observed in the 2008 calibration experiment and include a constant swept area factor of 0.576. The effective total catch number calibration factors (HBB/ALB ratios) vary by year and season, depending on the characteristics of the HBB length frequency distributions.
Year Spring (n) HBB
HBB CV
Spring (n) ALB
Effective Factor
2009 11.98 75.1 9.58 1.25 2010 31.82 35.8 27.30 1.17 2011 26.67 76.2 11.31 2.36 2012 58.65 55.1 26.46 2.22
Year Fall (n) HBB
HBB CV
Fall (n) ALB
Effective Factor
2009 160.99 34.8 50.79 3.17 2010 64.18 35.2 31.18 2.06 2011 95.03 36.3 28.18 3.37
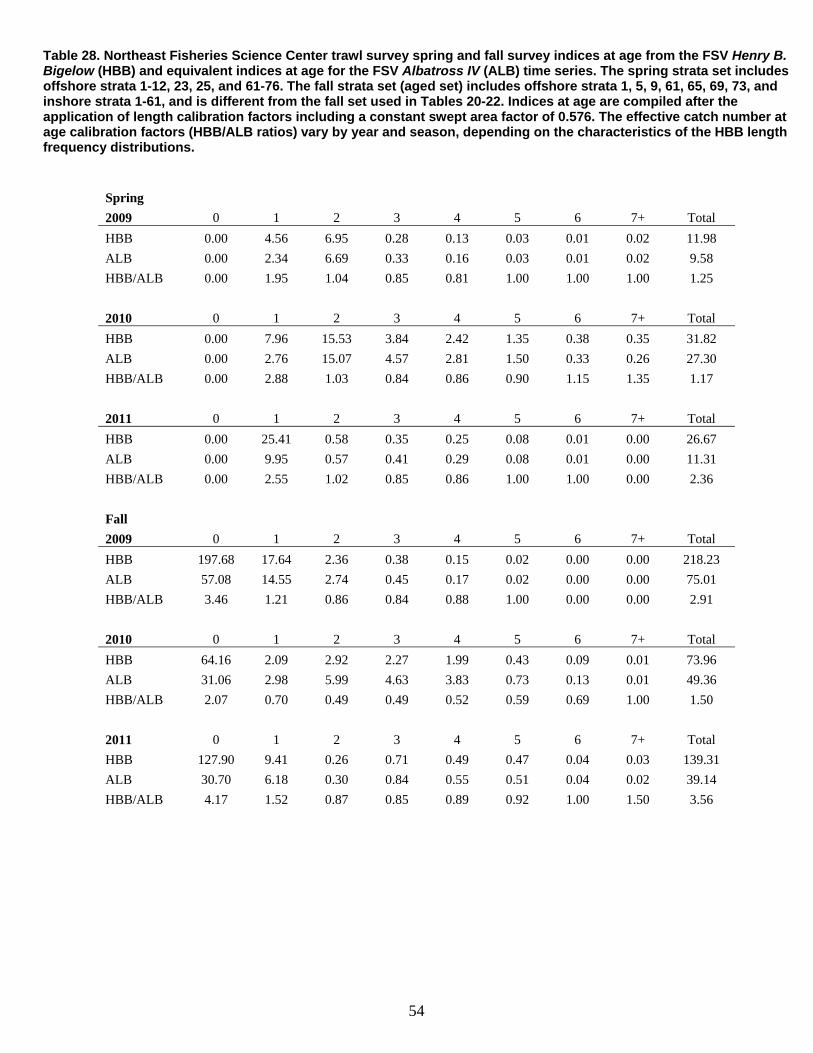
54
Table 28. Northeast Fisheries Science Center trawl survey spring and fall survey indices at age from the FSV Henry B. Bigelow (HBB) and equivalent indices at age for the FSV Albatross IV (ALB) time series. The spring strata set includes offshore strata 1-12, 23, 25, and 61-76. The fall strata set (aged set) includes offshore strata 1, 5, 9, 61, 65, 69, 73, and inshore strata 1-61, and is different from the fall set used in Tables 20-22. Indices at age are compiled after the application of length calibration factors including a constant swept area factor of 0.576. The effective catch number at age calibration factors (HBB/ALB ratios) vary by year and season, depending on the characteristics of the HBB length frequency distributions.
Spring
2009 0 1 2 3 4 5 6 7+ Total
HBB 0.00 4.56 6.95 0.28 0.13 0.03 0.01 0.02 11.98
ALB 0.00 2.34 6.69 0.33 0.16 0.03 0.01 0.02 9.58
HBB/ALB 0.00 1.95 1.04 0.85 0.81 1.00 1.00 1.00 1.25
2010 0 1 2 3 4 5 6 7+ Total
HBB 0.00 7.96 15.53 3.84 2.42 1.35 0.38 0.35 31.82
ALB 0.00 2.76 15.07 4.57 2.81 1.50 0.33 0.26 27.30
HBB/ALB 0.00 2.88 1.03 0.84 0.86 0.90 1.15 1.35 1.17
2011 0 1 2 3 4 5 6 7+ Total
HBB 0.00 25.41 0.58 0.35 0.25 0.08 0.01 0.00 26.67
ALB 0.00 9.95 0.57 0.41 0.29 0.08 0.01 0.00 11.31
HBB/ALB 0.00 2.55 1.02 0.85 0.86 1.00 1.00 0.00 2.36
Fall
2009 0 1 2 3 4 5 6 7+ Total
HBB 197.68 17.64 2.36 0.38 0.15 0.02 0.00 0.00 218.23
ALB 57.08 14.55 2.74 0.45 0.17 0.02 0.00 0.00 75.01
HBB/ALB 3.46 1.21 0.86 0.84 0.88 1.00 0.00 0.00 2.91
2010 0 1 2 3 4 5 6 7+ Total
HBB 64.16 2.09 2.92 2.27 1.99 0.43 0.09 0.01 73.96
ALB 31.06 2.98 5.99 4.63 3.83 0.73 0.13 0.01 49.36
HBB/ALB 2.07 0.70 0.49 0.49 0.52 0.59 0.69 1.00 1.50
2011 0 1 2 3 4 5 6 7+ Total
HBB 127.90 9.41 0.26 0.71 0.49 0.47 0.04 0.03 139.31
ALB 30.70 6.18 0.30 0.84 0.55 0.51 0.04 0.02 39.14
HBB/ALB 4.17 1.52 0.87 0.85 0.89 0.92 1.00 1.50 3.56
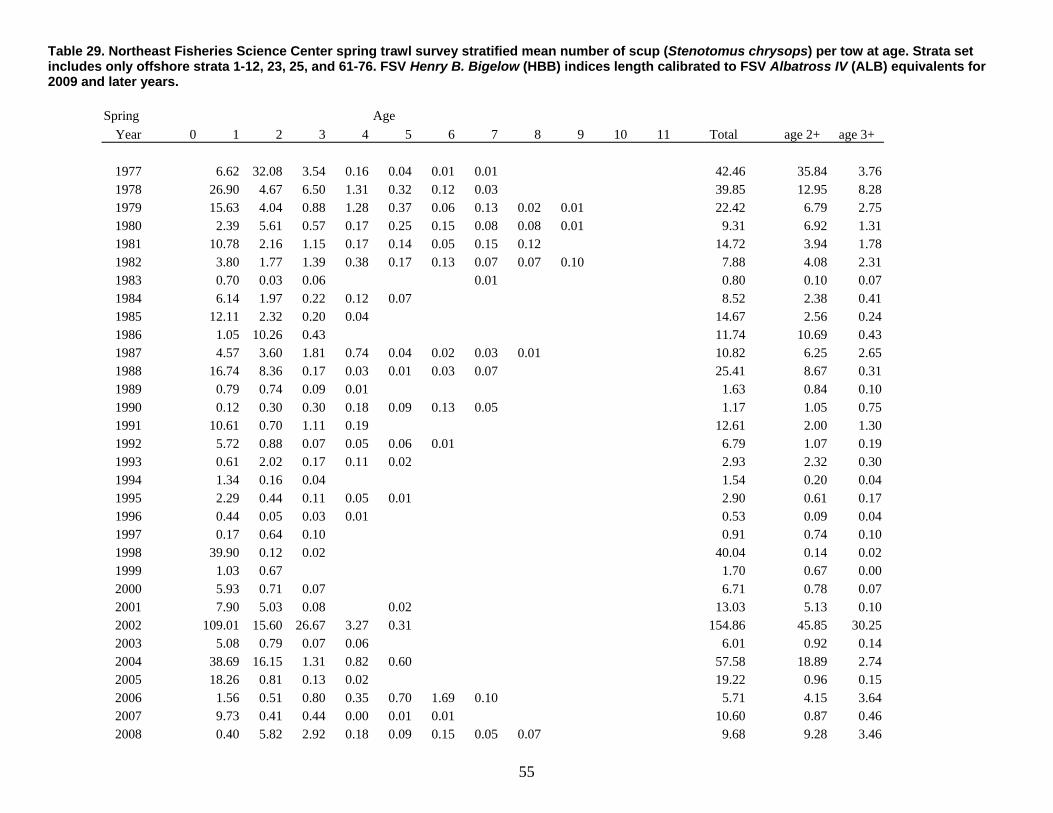
55
Table 29. Northeast Fisheries Science Center spring trawl survey stratified mean number of scup (Stenotomus chrysops) per tow at age. Strata set includes only offshore strata 1-12, 23, 25, and 61-76. FSV Henry B. Bigelow (HBB) indices length calibrated to FSV Albatross IV (ALB) equivalents for 2009 and later years.
Spring
Age
Year
0
1
2
3 4 5 6 7 8 9 10
11 Total age 2+ age 3+
1977
6.62
32.08
3.54 0.16 0.04 0.01 0.01
42.46 35.84 3.76 1978
26.90
4.67
6.50 1.31 0.32 0.12 0.03
39.85 12.95 8.28 1979
15.63
4.04
0.88 1.28 0.37 0.06 0.13 0.02 0.01
22.42 6.79 2.75 1980
2.39
5.61
0.57 0.17 0.25 0.15 0.08 0.08 0.01
9.31 6.92 1.31 1981
10.78
2.16
1.15 0.17 0.14 0.05 0.15 0.12
14.72 3.94 1.78 1982
3.80
1.77
1.39 0.38 0.17 0.13 0.07 0.07 0.10
7.88 4.08 2.31 1983
0.70
0.03
0.06 0.01
0.80 0.10 0.07 1984
6.14
1.97
0.22 0.12 0.07
8.52 2.38 0.41 1985
12.11
2.32
0.20 0.04
14.67 2.56 0.24 1986
1.05
10.26
0.43
11.74 10.69 0.43 1987
4.57
3.60
1.81 0.74 0.04 0.02 0.03 0.01
10.82 6.25 2.65 1988
16.74
8.36
0.17 0.03 0.01 0.03 0.07
25.41 8.67 0.31 1989
0.79
0.74
0.09 0.01
1.63 0.84 0.10 1990
0.12
0.30
0.30 0.18 0.09 0.13 0.05
1.17 1.05 0.75 1991
10.61
0.70
1.11 0.19
12.61 2.00 1.30 1992
5.72
0.88
0.07 0.05 0.06 0.01
6.79 1.07 0.19 1993
0.61
2.02
0.17 0.11 0.02
2.93 2.32 0.30 1994
1.34
0.16
0.04
1.54 0.20 0.04 1995
2.29
0.44
0.11 0.05 0.01
2.90 0.61 0.17 1996
0.44
0.05
0.03 0.01
0.53 0.09 0.04 1997
0.17
0.64
0.10
0.91 0.74 0.10 1998
39.90
0.12
0.02
40.04 0.14 0.02 1999
1.03
0.67
1.70 0.67 0.00 2000
5.93
0.71
0.07
6.71 0.78 0.07 2001
7.90
5.03
0.08 0.02
13.03 5.13 0.10 2002
109.01
15.60
26.67 3.27 0.31
154.86 45.85 30.25
2003
5.08
0.79
0.07 0.06
6.01 0.92 0.14 2004
38.69
16.15
1.31 0.82 0.60
57.58 18.89 2.74 2005
18.26
0.81
0.13 0.02
19.22 0.96 0.15 2006
1.56
0.51
0.80 0.35 0.70 1.69 0.10
5.71 4.15 3.64 2007
9.73
0.41
0.44 0.00 0.01 0.01
10.60 0.87 0.46 2008
0.40
5.82
2.92 0.18 0.09 0.15 0.05 0.07
9.68 9.28 3.46
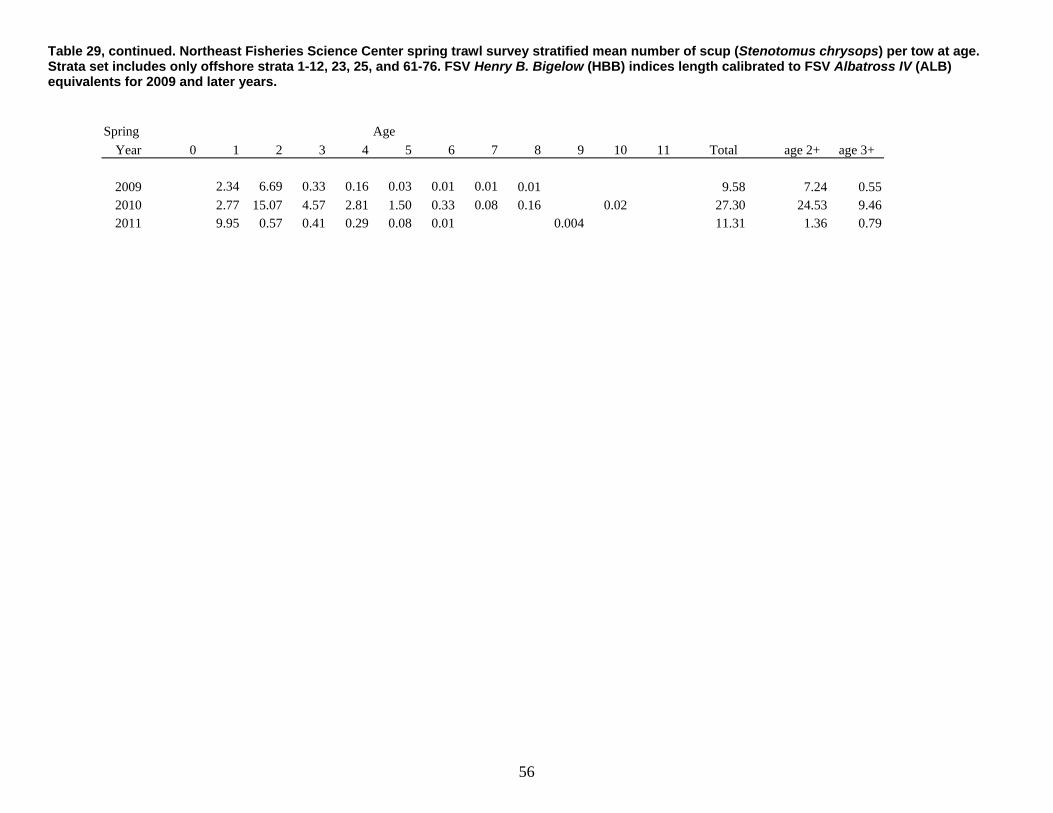
56
Table 29, continued. Northeast Fisheries Science Center spring trawl survey stratified mean number of scup (Stenotomus chrysops) per tow at age. Strata set includes only offshore strata 1-12, 23, 25, and 61-76. FSV Henry B. Bigelow (HBB) indices length calibrated to FSV Albatross IV (ALB) equivalents for 2009 and later years.
Spring
Age
Year
0
1
2
3 4 5 6 7 8 9 10
11 Total age 2+ age 3+
2009
2.34 6.69 0.33 0.16 0.03 0.01 0.01 0.01
9.58 7.24 0.55 2010
2.77
15.07
4.57 2.81 1.50 0.33 0.08 0.16 0.02
27.30 24.53 9.46 2011
9.95
0.57
0.41 0.29 0.08 0.01 0.004
11.31 1.36 0.79
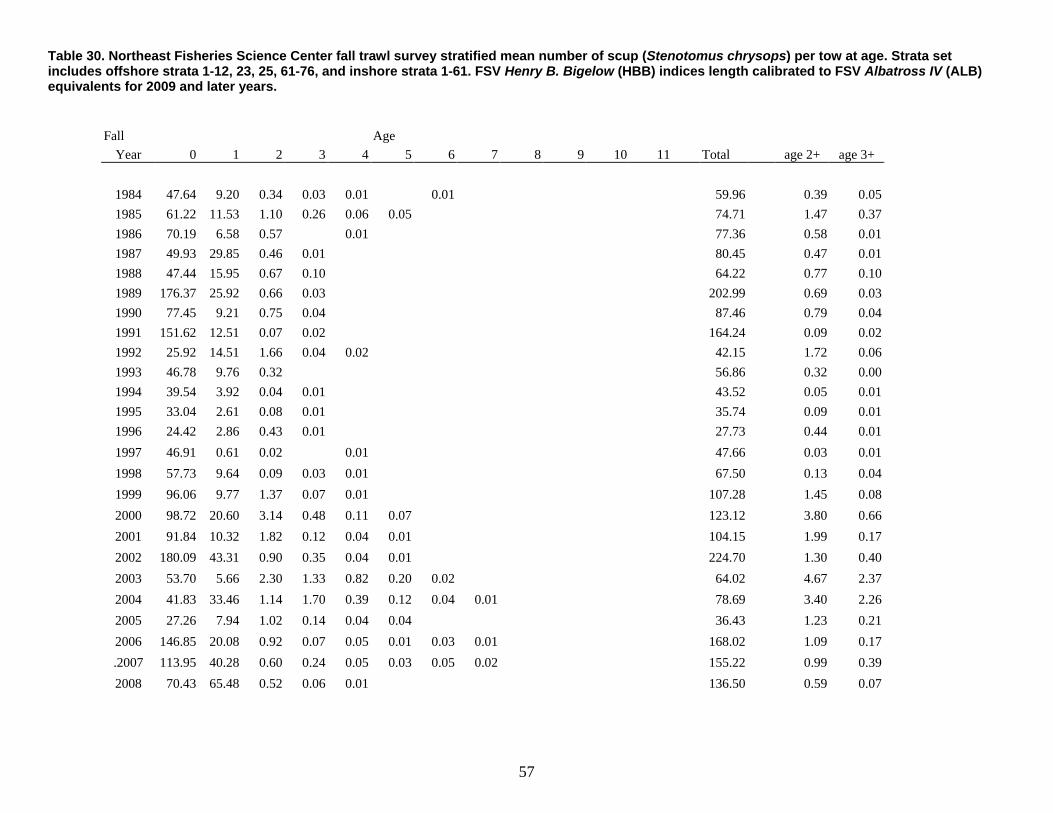
57
Table 30. Northeast Fisheries Science Center fall trawl survey stratified mean number of scup (Stenotomus chrysops) per tow at age. Strata set includes offshore strata 1-12, 23, 25, 61-76, and inshore strata 1-61. FSV Henry B. Bigelow (HBB) indices length calibrated to FSV Albatross IV (ALB) equivalents for 2009 and later years.
Fall
Age
Year
0
1
2
3 4 5 6 7 8 9 10
11 Total age 2+ age 3+
1984
47.64
9.20
0.34
0.03 0.01 0.01
59.96 0.39 0.05
1985
61.22
11.53
1.10
0.26 0.06 0.05
74.71 1.47 0.37 1986
70.19
6.58
0.57
0.01
77.36 0.58 0.01
1987
49.93
29.85
0.46
0.01
80.45 0.47 0.01 1988
47.44
15.95
0.67
0.10
64.22 0.77 0.10
1989 176.37
25.92
0.66
0.03
202.99 0.69 0.03
1990
77.45
9.21
0.75
0.04
87.46 0.79 0.04 1991
151.62
12.51
0.07
0.02
164.24 0.09 0.02
1992
25.92
14.51
1.66
0.04 0.02
42.15 1.72 0.06 1993
46.78
9.76
0.32
56.86 0.32 0.00
1994
39.54
3.92
0.04
0.01
43.52 0.05 0.01 1995
33.04
2.61
0.08
0.01
35.74 0.09 0.01
1996
24.42
2.86
0.43
0.01
27.73 0.44 0.01
1997
46.91
0.61
0.02
0.01
47.66 0.03 0.01
1998
57.73
9.64
0.09
0.03 0.01
67.50 0.13 0.04
1999
96.06
9.77
1.37
0.07 0.01
107.28 1.45 0.08
2000
98.72
20.60
3.14
0.48 0.11 0.07
123.12 3.80 0.66
2001
91.84
10.32
1.82
0.12 0.04 0.01
104.15 1.99 0.17
2002 180.09
43.31
0.90
0.35 0.04 0.01
224.70 1.30 0.40
2003
53.70
5.66
2.30
1.33 0.82 0.20 0.02
64.02 4.67 2.37
2004
41.83
33.46
1.14
1.70 0.39 0.12 0.04 0.01
78.69 3.40 2.26
2005
27.26
7.94
1.02
0.14 0.04 0.04
36.43 1.23 0.21
2006
146.85
20.08
0.92
0.07 0.05 0.01 0.03 0.01
168.02 1.09 0.17
.2007
113.95
40.28
0.60
0.24 0.05 0.03 0.05 0.02
155.22 0.99 0.39
2008
70.43
65.48
0.52
0.06 0.01
136.50 0.59 0.07
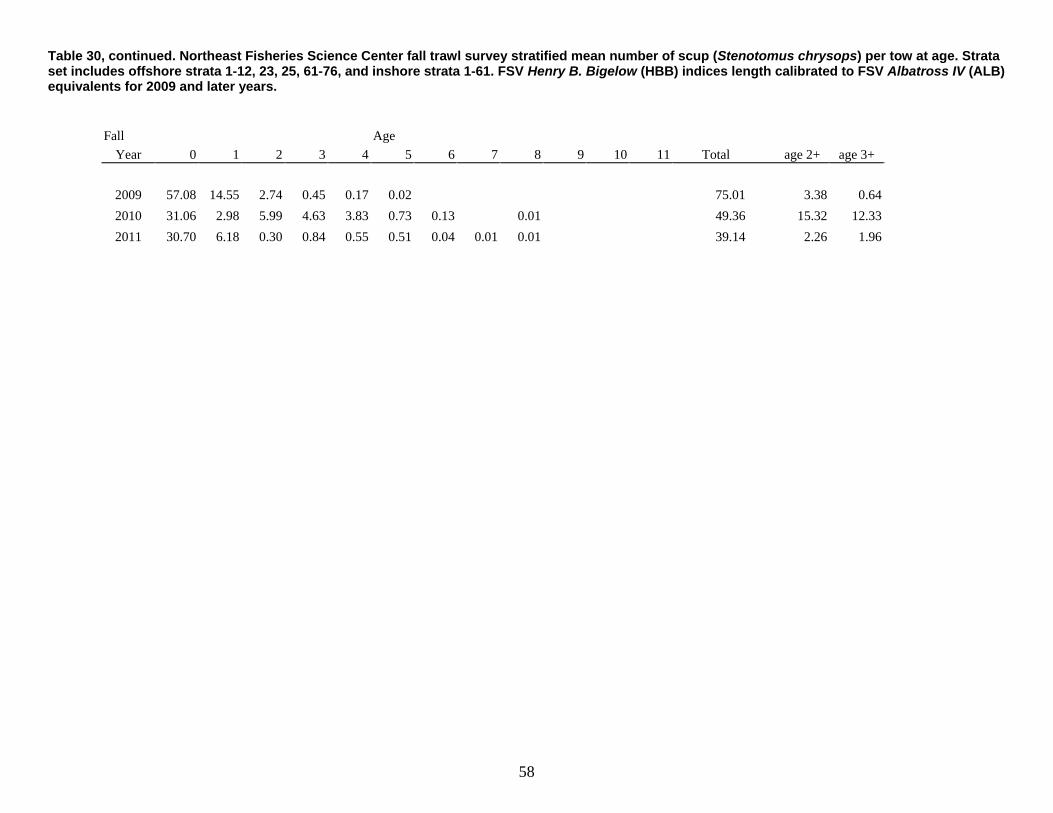
58
Table 30, continued. Northeast Fisheries Science Center fall trawl survey stratified mean number of scup (Stenotomus chrysops) per tow at age. Strata set includes offshore strata 1-12, 23, 25, 61-76, and inshore strata 1-61. FSV Henry B. Bigelow (HBB) indices length calibrated to FSV Albatross IV (ALB) equivalents for 2009 and later years.
Fall
Age
Year
0
1
2
3 4 5 6 7 8 9 10
11 Total age 2+ age 3+
2009
57.08
14.55
2.74
0.45 0.17 0.02
75.01 3.38 0.64
2010
31.06
2.98
5.99
4.63 3.83 0.73 0.13 0.01
49.36 15.32 12.33
2011
30.70
6.18
0.30
0.84 0.55 0.51 0.04 0.01 0.01
39.14 2.26 1.96
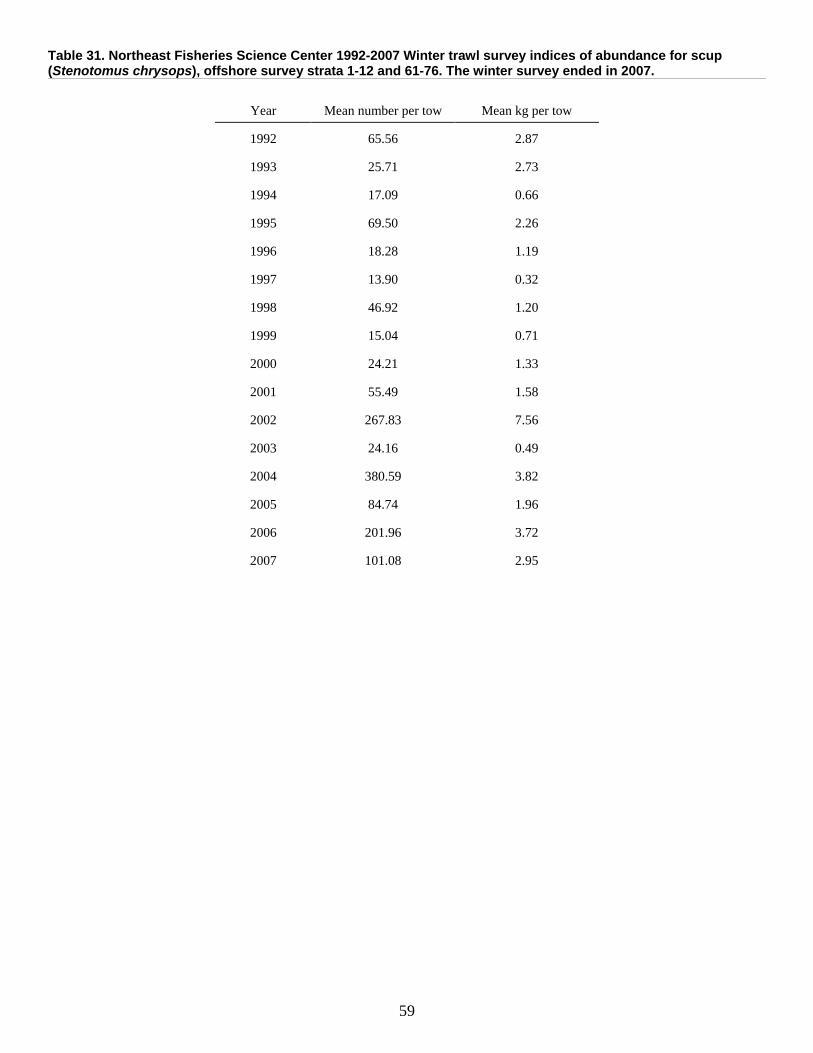
59
Table 31. Northeast Fisheries Science Center 1992-2007 Winter trawl survey indices of abundance for scup (Stenotomus chrysops), offshore survey strata 1-12 and 61-76. The winter survey ended in 2007.
Year
Mean number per tow Mean kg per tow
1992
65.56 2.87
1993
25.71 2.73
1994
17.09 0.66
1995
69.50 2.26
1996
18.28 1.19
1997
13.90 0.32
1998
46.92 1.20
1999
15.04 0.71
2000
24.21 1.33
2001
55.49 1.58
2002
267.83 7.56
2003
24.16 0.49
2004
380.59 3.82
2005
84.74 1.96
2006
201.96 3.72
2007
101.08 2.95
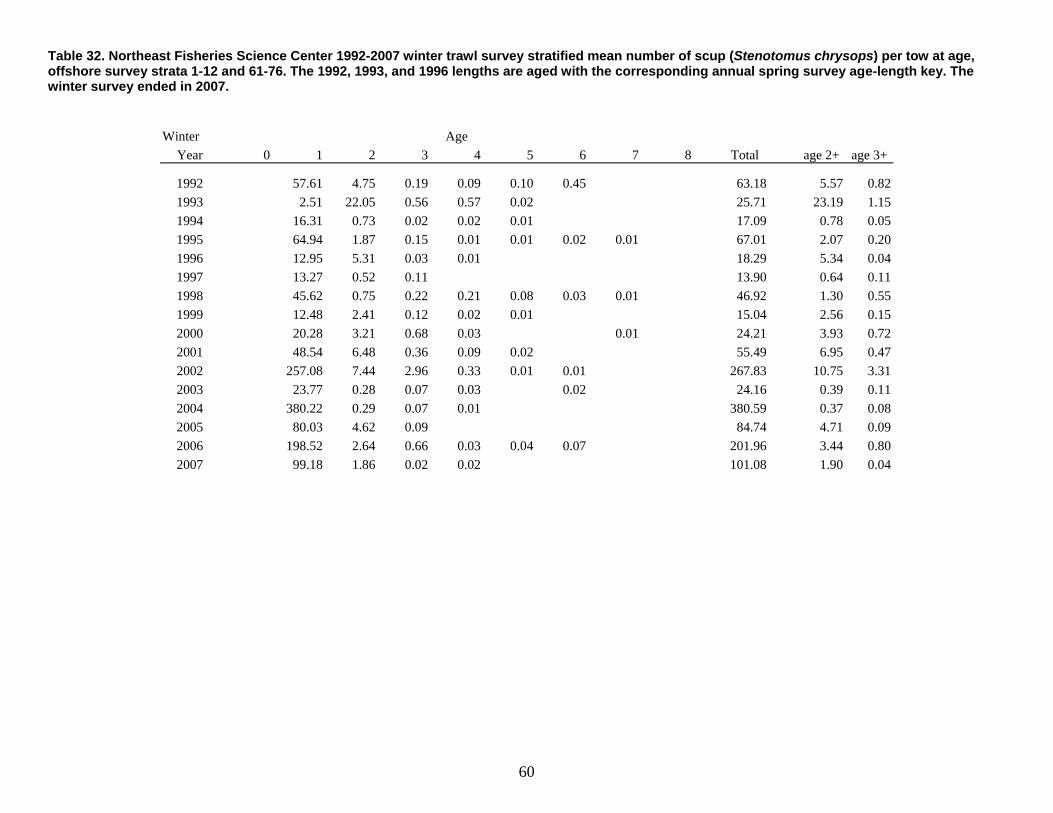
60
Table 32. Northeast Fisheries Science Center 1992-2007 winter trawl survey stratified mean number of scup (Stenotomus chrysops) per tow at age, offshore survey strata 1-12 and 61-76. The 1992, 1993, and 1996 lengths are aged with the corresponding annual spring survey age-length key. The winter survey ended in 2007.
Winter
Age
Year
0
1 2 3 4 5 6 7
8 Total age 2+ age 3+
1992
57.61 4.75 0.19 0.09 0.10 0.45
63.18 5.57 0.82 1993
2.51 22.05 0.56 0.57 0.02
25.71 23.19 1.15 1994
16.31 0.73 0.02 0.02 0.01
17.09 0.78 0.05 1995
64.94 1.87 0.15 0.01 0.01 0.02 0.01
67.01 2.07 0.20 1996
12.95 5.31 0.03 0.01
18.29 5.34 0.04 1997
13.27 0.52 0.11
13.90 0.64 0.11 1998
45.62 0.75 0.22 0.21 0.08 0.03 0.01
46.92 1.30 0.55 1999
12.48 2.41 0.12 0.02 0.01
15.04 2.56 0.15 2000
20.28 3.21 0.68 0.03 0.01
24.21 3.93 0.72 2001
48.54 6.48 0.36 0.09 0.02
55.49 6.95 0.47 2002
257.08 7.44 2.96 0.33 0.01 0.01
267.83 10.75 3.31 2003
23.77 0.28 0.07 0.03 0.02
24.16 0.39 0.11 2004
380.22 0.29 0.07 0.01
380.59 0.37 0.08 2005
80.03 4.62 0.09
84.74 4.71 0.09 2006
198.52 2.64 0.66 0.03 0.04 0.07
201.96 3.44 0.80 2007
99.18 1.86 0.02 0.02
101.08 1.90 0.04
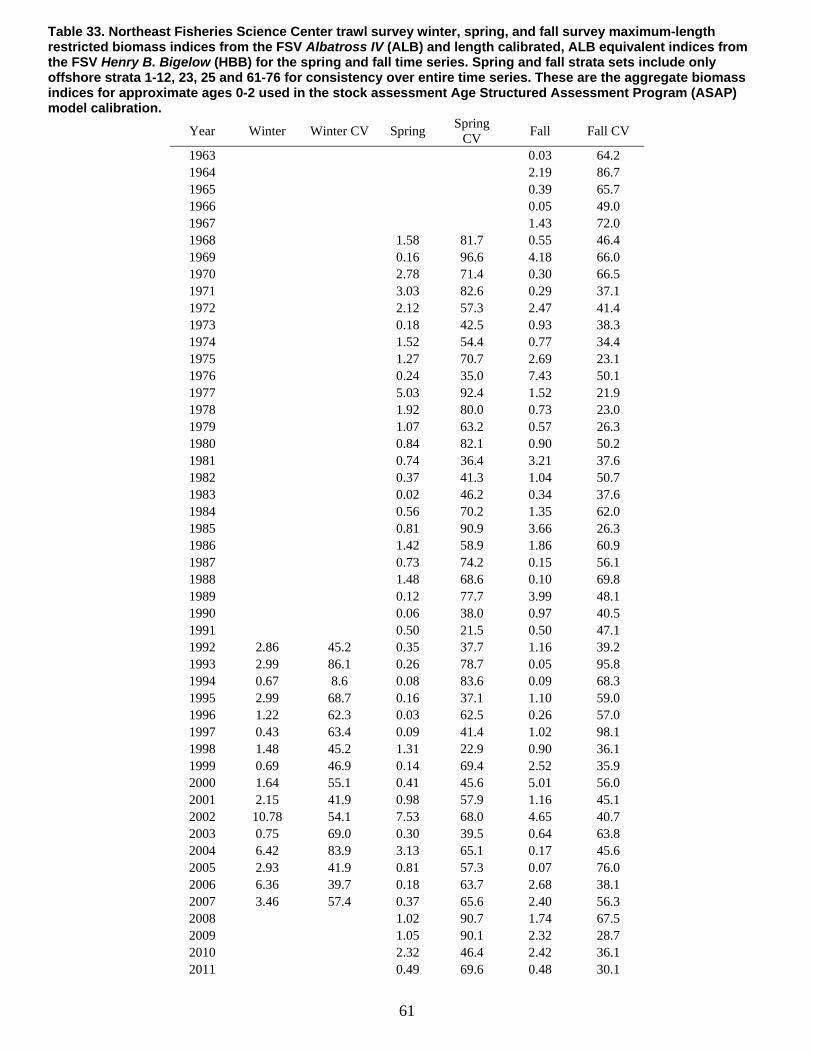
61
Table 33. Northeast Fisheries Science Center trawl survey winter, spring, and fall survey maximum-length restricted biomass indices from the FSV Albatross IV (ALB) and length calibrated, ALB equivalent indices from the FSV Henry B. Bigelow (HBB) for the spring and fall time series. Spring and fall strata sets include only offshore strata 1-12, 23, 25 and 61-76 for consistency over entire time series. These are the aggregate biomass indices for approximate ages 0-2 used in the stock assessment Age Structured Assessment Program (ASAP) model calibration.
Year Winter Winter CV Spring Spring
CV Fall Fall CV
1963 0.03 64.2 1964 2.19 86.7 1965 0.39 65.7 1966 0.05 49.0 1967 1.43 72.0 1968 1.58 81.7 0.55 46.4 1969 0.16 96.6 4.18 66.0 1970 2.78 71.4 0.30 66.5 1971 3.03 82.6 0.29 37.1 1972 2.12 57.3 2.47 41.4 1973 0.18 42.5 0.93 38.3 1974 1.52 54.4 0.77 34.4 1975 1.27 70.7 2.69 23.1 1976 0.24 35.0 7.43 50.1 1977 5.03 92.4 1.52 21.9 1978 1.92 80.0 0.73 23.0 1979 1.07 63.2 0.57 26.3 1980 0.84 82.1 0.90 50.2 1981 0.74 36.4 3.21 37.6 1982 0.37 41.3 1.04 50.7 1983 0.02 46.2 0.34 37.6 1984 0.56 70.2 1.35 62.0 1985 0.81 90.9 3.66 26.3 1986 1.42 58.9 1.86 60.9 1987 0.73 74.2 0.15 56.1 1988 1.48 68.6 0.10 69.8 1989 0.12 77.7 3.99 48.1 1990 0.06 38.0 0.97 40.5 1991 0.50 21.5 0.50 47.1 1992 2.86 45.2 0.35 37.7 1.16 39.2 1993 2.99 86.1 0.26 78.7 0.05 95.8 1994 0.67 8.6 0.08 83.6 0.09 68.3 1995 2.99 68.7 0.16 37.1 1.10 59.0 1996 1.22 62.3 0.03 62.5 0.26 57.0 1997 0.43 63.4 0.09 41.4 1.02 98.1 1998 1.48 45.2 1.31 22.9 0.90 36.1 1999 0.69 46.9 0.14 69.4 2.52 35.9 2000 1.64 55.1 0.41 45.6 5.01 56.0 2001 2.15 41.9 0.98 57.9 1.16 45.1 2002 10.78 54.1 7.53 68.0 4.65 40.7 2003 0.75 69.0 0.30 39.5 0.64 63.8 2004 6.42 83.9 3.13 65.1 0.17 45.6 2005 2.93 41.9 0.81 57.3 0.07 76.0 2006 6.36 39.7 0.18 63.7 2.68 38.1 2007 3.46 57.4 0.37 65.6 2.40 56.3 2008 1.02 90.7 1.74 67.5 2009 1.05 90.1 2.32 28.7 2010 2.32 46.4 2.42 36.1 2011 0.49 69.6 0.48 30.1
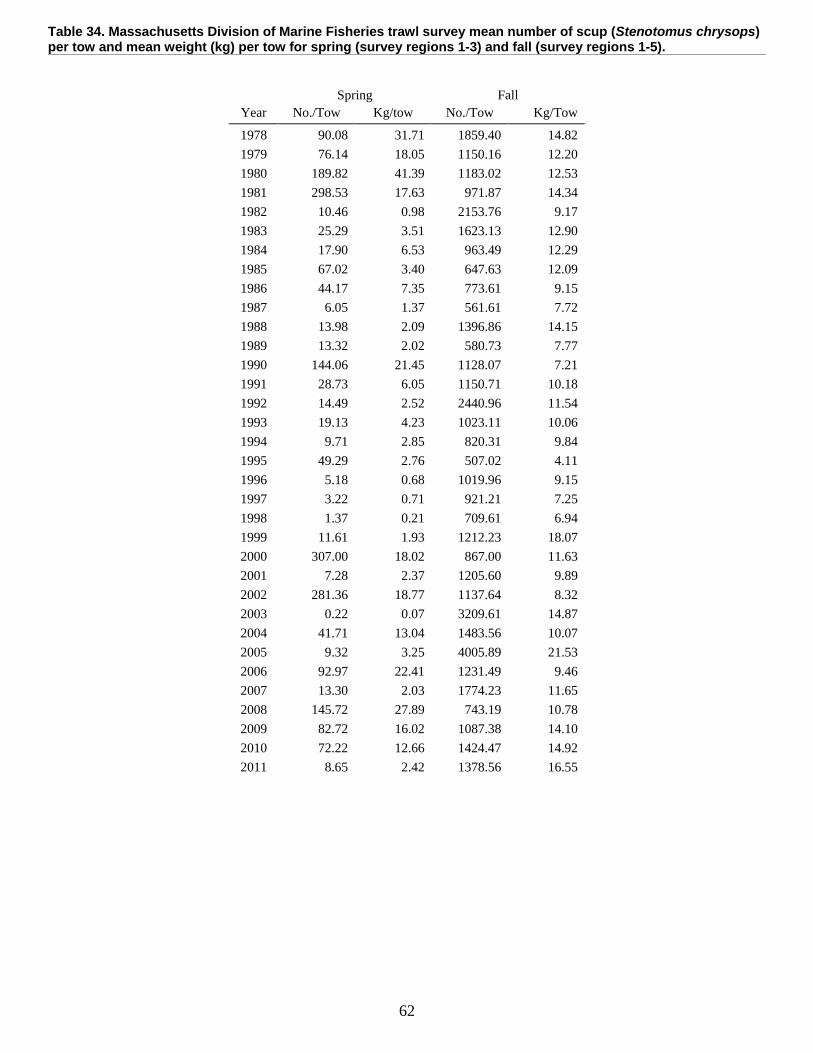
62
Table 34. Massachusetts Division of Marine Fisheries trawl survey mean number of scup (Stenotomus chrysops) per tow and mean weight (kg) per tow for spring (survey regions 1-3) and fall (survey regions 1-5).
Spring Fall Year
No./Tow Kg/tow No./Tow Kg/Tow
1978 90.08 31.71 1859.40 14.82
1979 76.14 18.05 1150.16 12.20
1980 189.82 41.39 1183.02 12.53
1981 298.53 17.63 971.87 14.34
1982 10.46 0.98 2153.76 9.17
1983 25.29 3.51 1623.13 12.90
1984 17.90 6.53 963.49 12.29
1985 67.02 3.40 647.63 12.09
1986 44.17 7.35 773.61 9.15
1987 6.05 1.37 561.61 7.72
1988 13.98 2.09 1396.86 14.15
1989 13.32 2.02 580.73 7.77
1990 144.06 21.45 1128.07 7.21
1991 28.73 6.05 1150.71 10.18
1992 14.49 2.52 2440.96 11.54
1993 19.13 4.23 1023.11 10.06
1994 9.71 2.85 820.31 9.84
1995 49.29 2.76 507.02 4.11
1996 5.18 0.68 1019.96 9.15
1997 3.22 0.71 921.21 7.25
1998 1.37 0.21 709.61 6.94
1999 11.61 1.93 1212.23 18.07
2000 307.00 18.02 867.00 11.63
2001 7.28 2.37 1205.60 9.89
2002 281.36 18.77 1137.64 8.32
2003 0.22 0.07 3209.61 14.87
2004 41.71 13.04 1483.56 10.07
2005 9.32 3.25 4005.89 21.53
2006 92.97 22.41 1231.49 9.46
2007 13.30 2.03 1774.23 11.65
2008 145.72 27.89 743.19 10.78
2009 82.72 16.02 1087.38 14.10
2010 72.22 12.66 1424.47 14.92
2011 8.65 2.42 1378.56 16.55
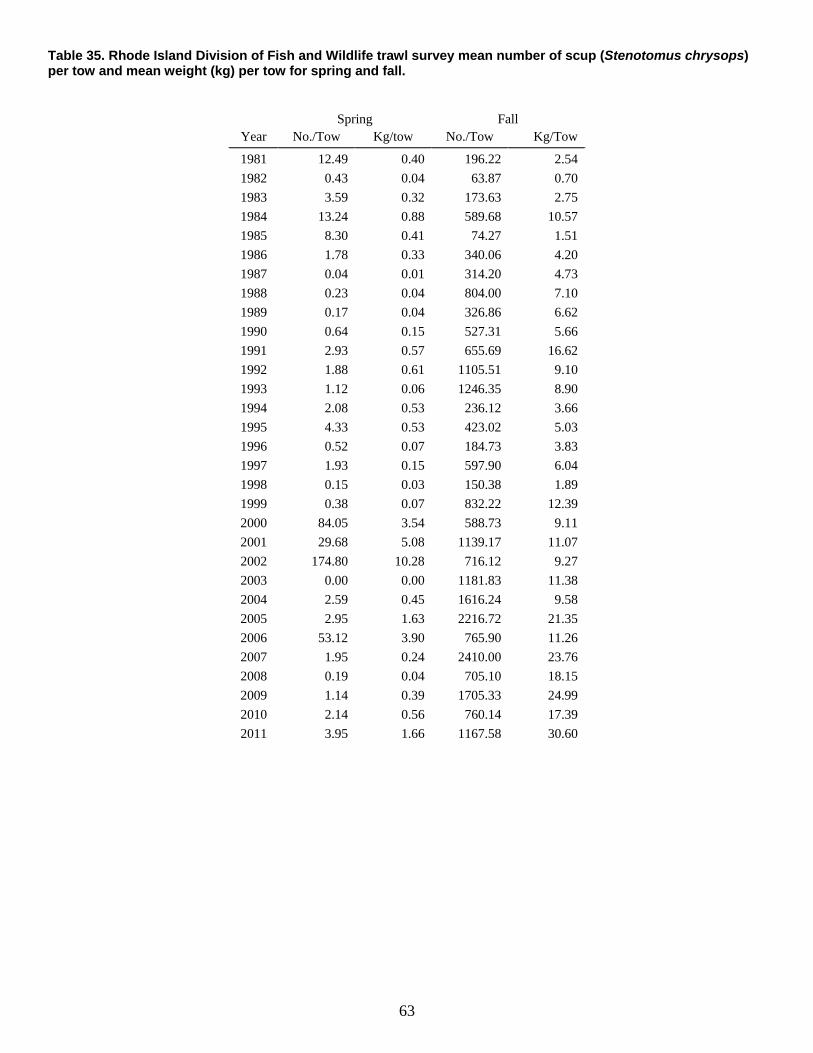
63
Table 35. Rhode Island Division of Fish and Wildlife trawl survey mean number of scup (Stenotomus chrysops) per tow and mean weight (kg) per tow for spring and fall.
Spring Fall Year
No./Tow Kg/tow No./Tow Kg/Tow
1981 12.49 0.40 196.22 2.54
1982 0.43 0.04 63.87 0.70
1983 3.59 0.32 173.63 2.75
1984 13.24 0.88 589.68 10.57
1985 8.30 0.41 74.27 1.51
1986 1.78 0.33 340.06 4.20
1987 0.04 0.01 314.20 4.73
1988 0.23 0.04 804.00 7.10
1989 0.17 0.04 326.86 6.62
1990 0.64 0.15 527.31 5.66
1991 2.93 0.57 655.69 16.62
1992 1.88 0.61 1105.51 9.10
1993 1.12 0.06 1246.35 8.90
1994 2.08 0.53 236.12 3.66
1995 4.33 0.53 423.02 5.03
1996 0.52 0.07 184.73 3.83
1997 1.93 0.15 597.90 6.04
1998 0.15 0.03 150.38 1.89
1999 0.38 0.07 832.22 12.39
2000 84.05 3.54 588.73 9.11
2001 29.68 5.08 1139.17 11.07
2002 174.80 10.28 716.12 9.27
2003 0.00 0.00 1181.83 11.38
2004 2.59 0.45 1616.24 9.58
2005 2.95 1.63 2216.72 21.35
2006 53.12 3.90 765.90 11.26
2007 1.95 0.24 2410.00 23.76
2008 0.19 0.04 705.10 18.15
2009 1.14 0.39 1705.33 24.99
2010 2.14 0.56 760.14 17.39
2011 3.95 1.66 1167.58 30.60
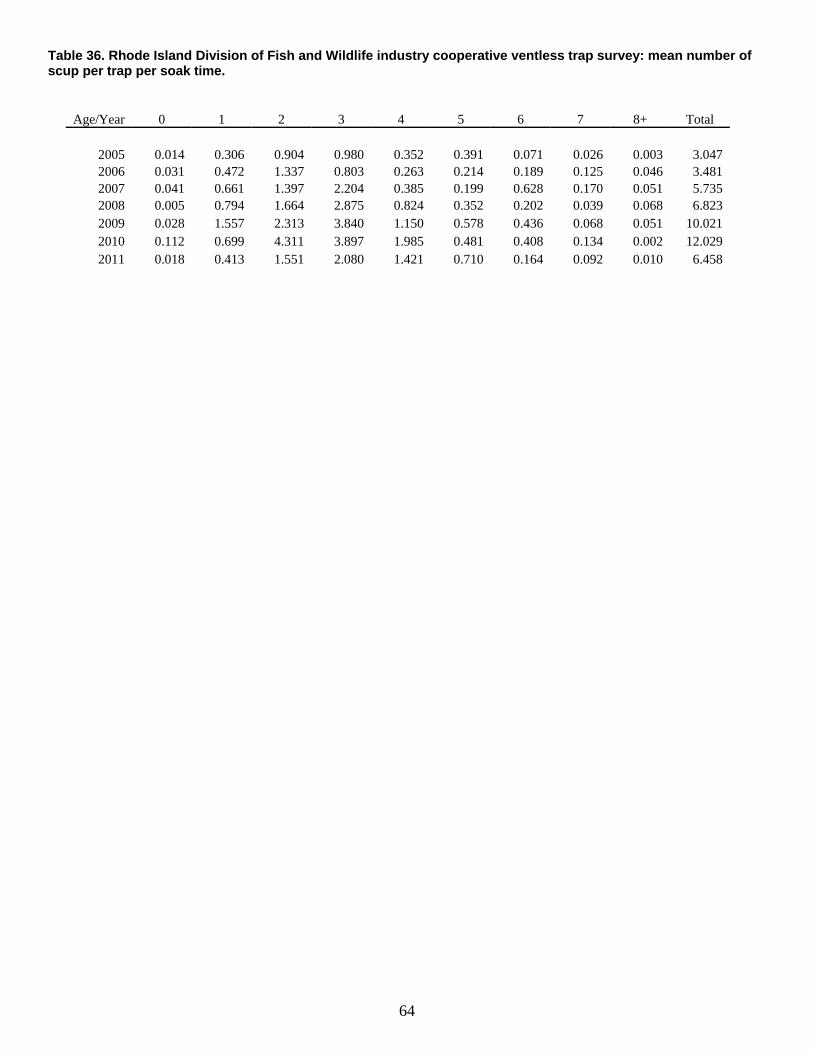
64
Table 36. Rhode Island Division of Fish and Wildlife industry cooperative ventless trap survey: mean number of scup per trap per soak time.
Age/Year 0 1 2 3 4 5 6 7 8+ Total
2005 0.014 0.306 0.904 0.980 0.352 0.391 0.071 0.026 0.003 3.047 2006 0.031 0.472 1.337 0.803 0.263 0.214 0.189 0.125 0.046 3.481 2007 0.041 0.661 1.397 2.204 0.385 0.199 0.628 0.170 0.051 5.735 2008 0.005 0.794 1.664 2.875 0.824 0.352 0.202 0.039 0.068 6.823 2009 0.028 1.557 2.313 3.840 1.150 0.578 0.436 0.068 0.051 10.021 2010 0.112 0.699 4.311 3.897 1.985 0.481 0.408 0.134 0.002 12.029 2011 0.018 0.413 1.551 2.080 1.421 0.710 0.164 0.092 0.010 6.458
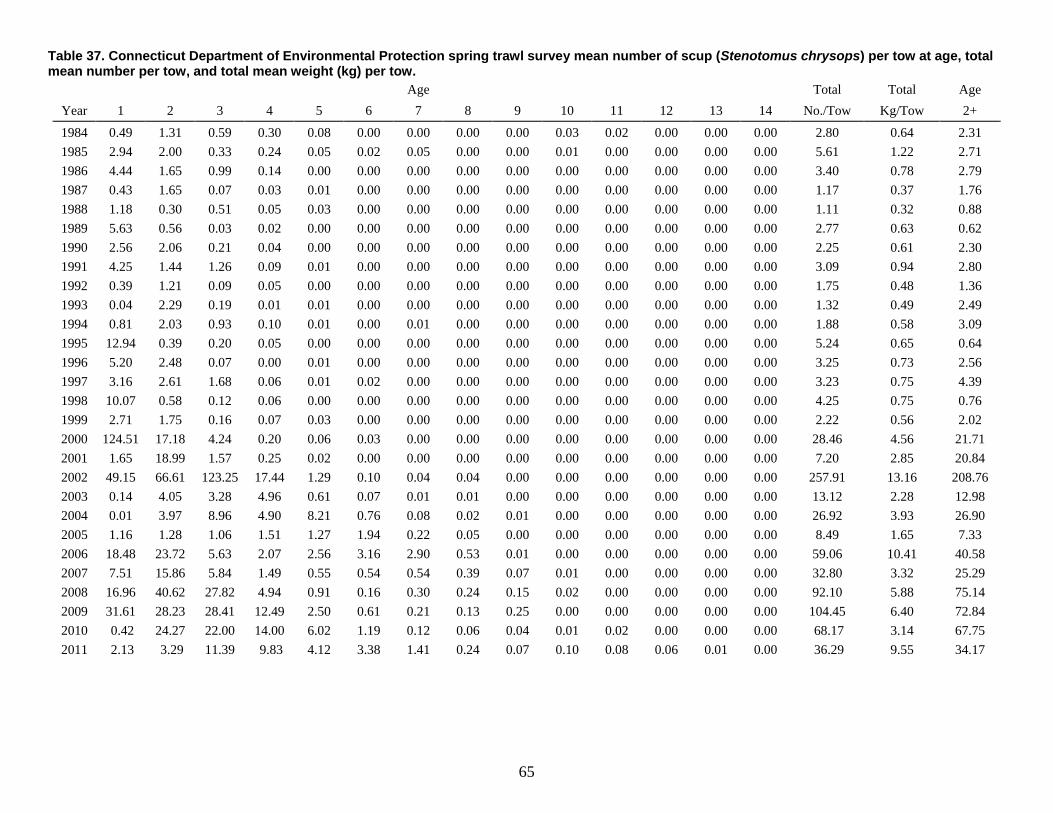
65
Table 37. Connecticut Department of Environmental Protection spring trawl survey mean number of scup (Stenotomus chrysops) per tow at age, total mean number per tow, and total mean weight (kg) per tow.
Age
Total Total Age Year
1
2
3
4
5 6 7 8 9 10 11
12 13 14 No./Tow Kg/Tow 2+
1984
0.49
1.31
0.59
0.30
0.08 0.00 0.00 0.00 0.00 0.03 0.02
0.00 0.00 0.00 2.80 0.64 2.31
1985
2.94
2.00
0.33
0.24
0.05 0.02 0.05 0.00 0.00 0.01 0.00
0.00 0.00 0.00 5.61 1.22 2.71 1986
4.44
1.65
0.99
0.14
0.00 0.00 0.00 0.00 0.00 0.00 0.00
0.00 0.00 0.00 3.40 0.78 2.79
1987
0.43
1.65
0.07
0.03
0.01 0.00 0.00 0.00 0.00 0.00 0.00
0.00 0.00 0.00 1.17 0.37 1.76 1988
1.18
0.30
0.51
0.05
0.03 0.00 0.00 0.00 0.00 0.00 0.00
0.00 0.00 0.00 1.11 0.32 0.88
1989
5.63
0.56
0.03
0.02
0.00 0.00 0.00 0.00 0.00 0.00 0.00
0.00 0.00 0.00 2.77 0.63 0.62 1990
2.56
2.06
0.21
0.04
0.00 0.00 0.00 0.00 0.00 0.00 0.00
0.00 0.00 0.00 2.25 0.61 2.30
1991
4.25
1.44
1.26
0.09
0.01 0.00 0.00 0.00 0.00 0.00 0.00
0.00 0.00 0.00 3.09 0.94 2.80 1992
0.39
1.21
0.09
0.05
0.00 0.00 0.00 0.00 0.00 0.00 0.00
0.00 0.00 0.00 1.75 0.48 1.36
1993
0.04
2.29
0.19
0.01
0.01 0.00 0.00 0.00 0.00 0.00 0.00
0.00 0.00 0.00 1.32 0.49 2.49 1994
0.81
2.03
0.93
0.10
0.01 0.00 0.01 0.00 0.00 0.00 0.00
0.00 0.00 0.00 1.88 0.58 3.09
1995 12.94
0.39
0.20
0.05
0.00 0.00 0.00 0.00 0.00 0.00 0.00
0.00 0.00 0.00 5.24 0.65 0.64
1996
5.20
2.48
0.07
0.00
0.01 0.00 0.00 0.00 0.00 0.00 0.00
0.00 0.00 0.00 3.25 0.73 2.56 1997
3.16
2.61
1.68
0.06
0.01 0.02 0.00 0.00 0.00 0.00 0.00
0.00 0.00 0.00 3.23 0.75 4.39
1998 10.07
0.58
0.12
0.06
0.00 0.00 0.00 0.00 0.00 0.00 0.00
0.00 0.00 0.00 4.25 0.75 0.76
1999
2.71
1.75
0.16
0.07
0.03 0.00 0.00 0.00 0.00 0.00 0.00
0.00 0.00 0.00 2.22 0.56 2.02 2000
124.51
17.18
4.24
0.20
0.06 0.03 0.00 0.00 0.00 0.00 0.00
0.00 0.00 0.00 28.46 4.56 21.71
2001
1.65 18.99
1.57
0.25
0.02 0.00 0.00 0.00 0.00 0.00 0.00
0.00 0.00 0.00 7.20 2.85 20.84
2002 49.15
66.61
123.25
17.44
1.29 0.10 0.04 0.04 0.00 0.00 0.00
0.00 0.00 0.00 257.91 13.16 208.76
2003
0.14
4.05
3.28
4.96
0.61 0.07 0.01 0.01 0.00 0.00 0.00
0.00 0.00 0.00 13.12 2.28 12.98 2004
0.01
3.97
8.96
4.90
8.21 0.76 0.08 0.02 0.01 0.00 0.00
0.00 0.00 0.00 26.92 3.93 26.90
2005
1.16
1.28
1.06
1.51
1.27 1.94 0.22 0.05 0.00 0.00 0.00
0.00 0.00 0.00 8.49 1.65 7.33 2006
18.48
23.72
5.63
2.07
2.56 3.16 2.90 0.53 0.01 0.00 0.00
0.00 0.00 0.00 59.06 10.41 40.58
2007
7.51 15.86
5.84
1.49
0.55 0.54 0.54 0.39 0.07 0.01 0.00
0.00 0.00 0.00 32.80 3.32 25.29
2008 16.96
40.62
27.82
4.94
0.91 0.16 0.30 0.24 0.15 0.02 0.00
0.00 0.00 0.00 92.10 5.88 75.14
2009 31.61
28.23
28.41
12.49
2.50 0.61 0.21 0.13 0.25 0.00 0.00
0.00 0.00 0.00 104.45 6.40 72.84
2010 0.42
24.27
22.00
14.00
6.02 1.19 0.12 0.06 0.04 0.01 0.02
0.00 0.00 0.00 68.17 3.14 67.75
2011 2.13
3.29
11.39
9.83
4.12 3.38 1.41 0.24 0.07 0.10 0.08
0.06 0.01 0.00 36.29 9.55 34.17
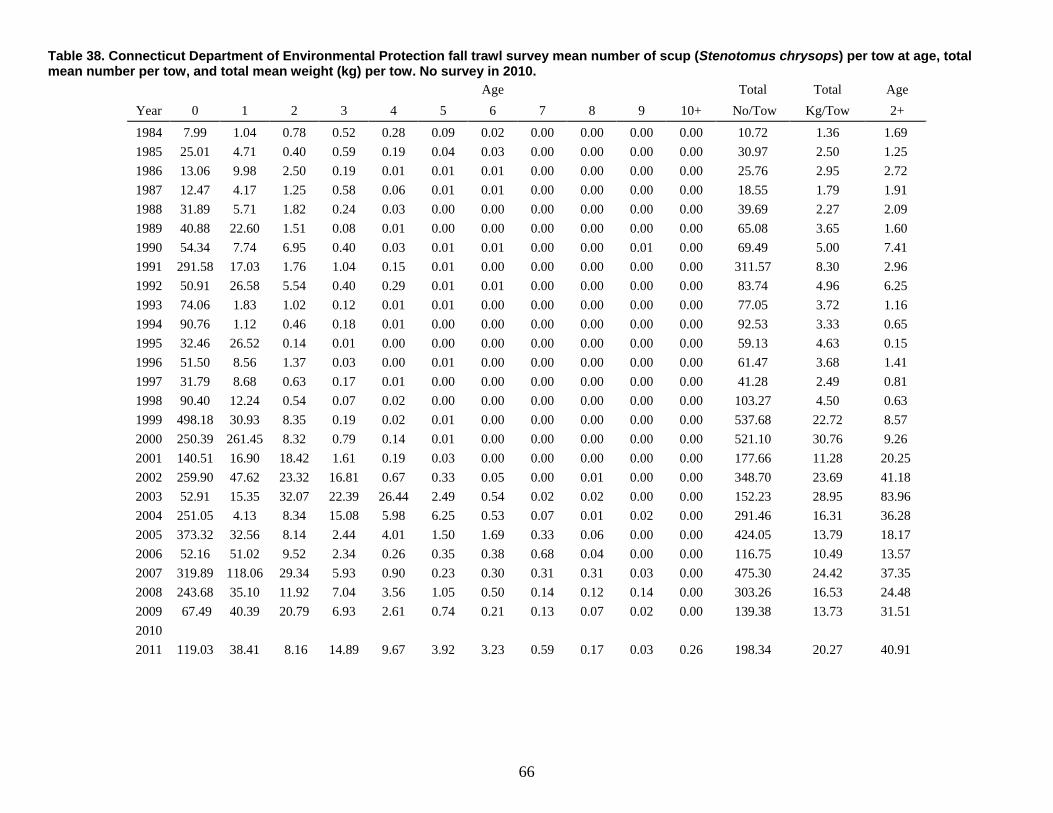
66
Table 38. Connecticut Department of Environmental Protection fall trawl survey mean number of scup (Stenotomus chrysops) per tow at age, total mean number per tow, and total mean weight (kg) per tow. No survey in 2010.
Age
Total Total Age Year
0
1
2
3 4 5 6 7 8
9 10+ No/Tow Kg/Tow 2+
1984
7.99
1.04
0.78
0.52 0.28 0.09 0.02 0.00 0.00
0.00 0.00 10.72 1.36 1.69
1985 25.01
4.71
0.40
0.59 0.19 0.04 0.03 0.00 0.00
0.00 0.00 30.97 2.50 1.25
1986 13.06
9.98
2.50
0.19 0.01 0.01 0.01 0.00 0.00
0.00 0.00 25.76 2.95 2.72
1987 12.47
4.17
1.25
0.58 0.06 0.01 0.01 0.00 0.00
0.00 0.00 18.55 1.79 1.91
1988 31.89
5.71
1.82
0.24 0.03 0.00 0.00 0.00 0.00
0.00 0.00 39.69 2.27 2.09
1989 40.88
22.60
1.51
0.08 0.01 0.00 0.00 0.00 0.00
0.00 0.00 65.08 3.65 1.60
1990 54.34
7.74
6.95
0.40 0.03 0.01 0.01 0.00 0.00
0.01 0.00 69.49 5.00 7.41
1991 291.58
17.03
1.76
1.04 0.15 0.01 0.00 0.00 0.00
0.00 0.00 311.57 8.30 2.96
1992 50.91
26.58
5.54
0.40 0.29 0.01 0.01 0.00 0.00
0.00 0.00 83.74 4.96 6.25
1993 74.06
1.83
1.02
0.12 0.01 0.01 0.00 0.00 0.00
0.00 0.00 77.05 3.72 1.16
1994 90.76
1.12
0.46
0.18 0.01 0.00 0.00 0.00 0.00
0.00 0.00 92.53 3.33 0.65
1995 32.46
26.52
0.14
0.01 0.00 0.00 0.00 0.00 0.00
0.00 0.00 59.13 4.63 0.15
1996 51.50
8.56
1.37
0.03 0.00 0.01 0.00 0.00 0.00
0.00 0.00 61.47 3.68 1.41
1997 31.79
8.68
0.63
0.17 0.01 0.00 0.00 0.00 0.00
0.00 0.00 41.28 2.49 0.81
1998 90.40
12.24
0.54
0.07 0.02 0.00 0.00 0.00 0.00
0.00 0.00 103.27 4.50 0.63
1999 498.18
30.93
8.35
0.19 0.02 0.01 0.00 0.00 0.00
0.00 0.00 537.68 22.72 8.57
2000 250.39
261.45
8.32
0.79 0.14 0.01 0.00 0.00 0.00
0.00 0.00 521.10 30.76 9.26
2001 140.51
16.90
18.42
1.61 0.19 0.03 0.00 0.00 0.00
0.00 0.00 177.66 11.28 20.25
2002 259.90
47.62
23.32
16.81 0.67 0.33 0.05 0.00 0.01
0.00 0.00 348.70 23.69 41.18
2003 52.91
15.35
32.07
22.39 26.44 2.49 0.54 0.02 0.02
0.00 0.00 152.23 28.95 83.96
2004 251.05
4.13
8.34
15.08 5.98 6.25 0.53 0.07 0.01
0.02 0.00 291.46 16.31 36.28
2005 373.32
32.56
8.14
2.44 4.01 1.50 1.69 0.33 0.06
0.00 0.00 424.05 13.79 18.17
2006 52.16
51.02
9.52
2.34 0.26 0.35 0.38 0.68 0.04
0.00 0.00 116.75 10.49 13.57
2007 319.89
118.06
29.34
5.93 0.90 0.23 0.30 0.31 0.31
0.03 0.00 475.30 24.42 37.35
2008 243.68
35.10
11.92
7.04 3.56 1.05 0.50 0.14 0.12
0.14 0.00 303.26 16.53 24.48
2009 67.49
40.39
20.79
6.93 2.61 0.74 0.21 0.13 0.07
0.02 0.00 139.38 13.73 31.51
2010 2011
119.03
38.41
8.16
14.89 9.67 3.92 3.23 0.59 0.17
0.03 0.26 198.34 20.27 40.91
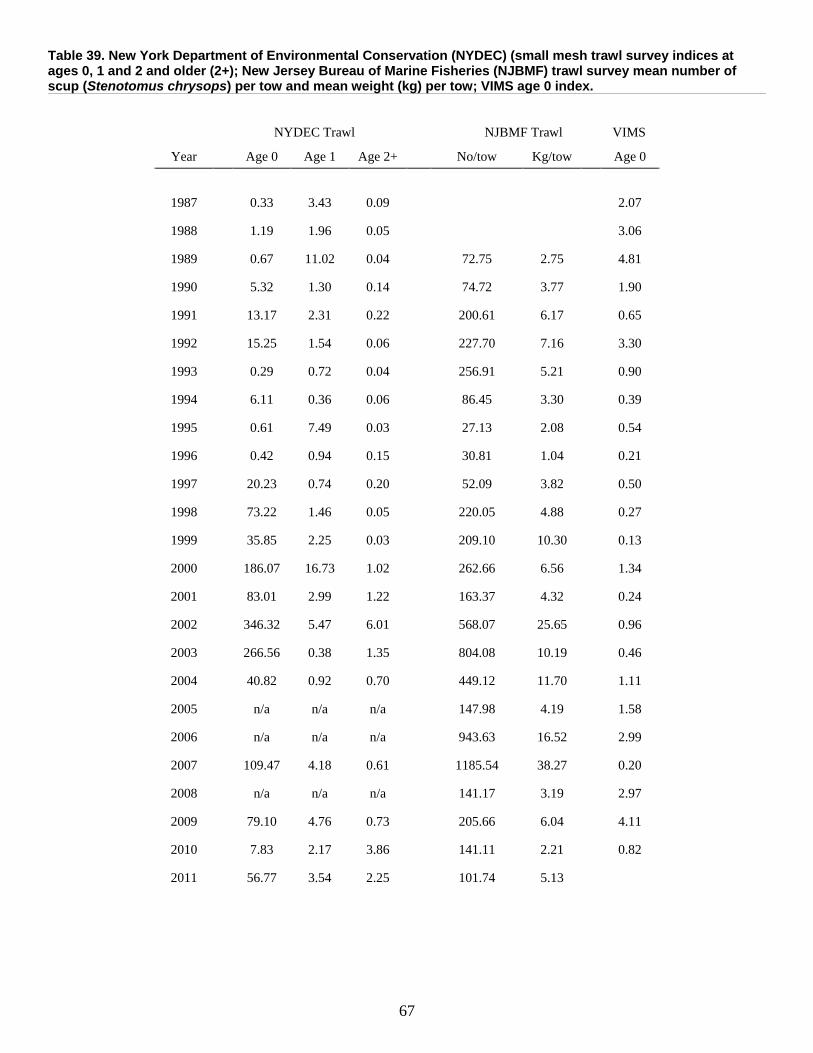
67
Table 39. New York Department of Environmental Conservation (NYDEC) (small mesh trawl survey indices at ages 0, 1 and 2 and older (2+); New Jersey Bureau of Marine Fisheries (NJBMF) trawl survey mean number of scup (Stenotomus chrysops) per tow and mean weight (kg) per tow; VIMS age 0 index.
NYDEC Trawl NJBMF Trawl VIMS
Year
Age 0
Age 1 Age 2+ No/tow Kg/tow
Age 0
1987
0.33
3.43 0.09
2.07
1988
1.19
1.96 0.05
3.06
1989
0.67
11.02 0.04 72.75 2.75
4.81
1990
5.32
1.30 0.14 74.72 3.77
1.90
1991
13.17
2.31 0.22 200.61 6.17
0.65
1992
15.25
1.54 0.06 227.70 7.16
3.30
1993
0.29
0.72 0.04 256.91 5.21
0.90
1994
6.11
0.36 0.06 86.45 3.30
0.39
1995
0.61
7.49 0.03 27.13 2.08
0.54
1996
0.42
0.94 0.15 30.81 1.04
0.21
1997
20.23
0.74 0.20 52.09 3.82
0.50
1998
73.22
1.46 0.05 220.05 4.88
0.27
1999
35.85
2.25 0.03 209.10 10.30
0.13
2000
186.07
16.73 1.02 262.66 6.56
1.34
2001
83.01
2.99 1.22 163.37 4.32
0.24
2002
346.32
5.47 6.01 568.07 25.65
0.96
2003
266.56
0.38 1.35 804.08 10.19
0.46
2004
40.82
0.92 0.70 449.12 11.70
1.11
2005
n/a
n/a n/a 147.98 4.19
1.58
2006
n/a
n/a n/a 943.63 16.52
2.99
2007
109.47
4.18 0.61 1185.54 38.27
0.20
2008
n/a
n/a n/a 141.17 3.19
2.97
2009
79.10
4.76 0.73 205.66 6.04
4.11
2010
7.83
2.17 3.86 141.11 2.21
0.82
2011
56.77
3.54 2.25 101.74 5.13
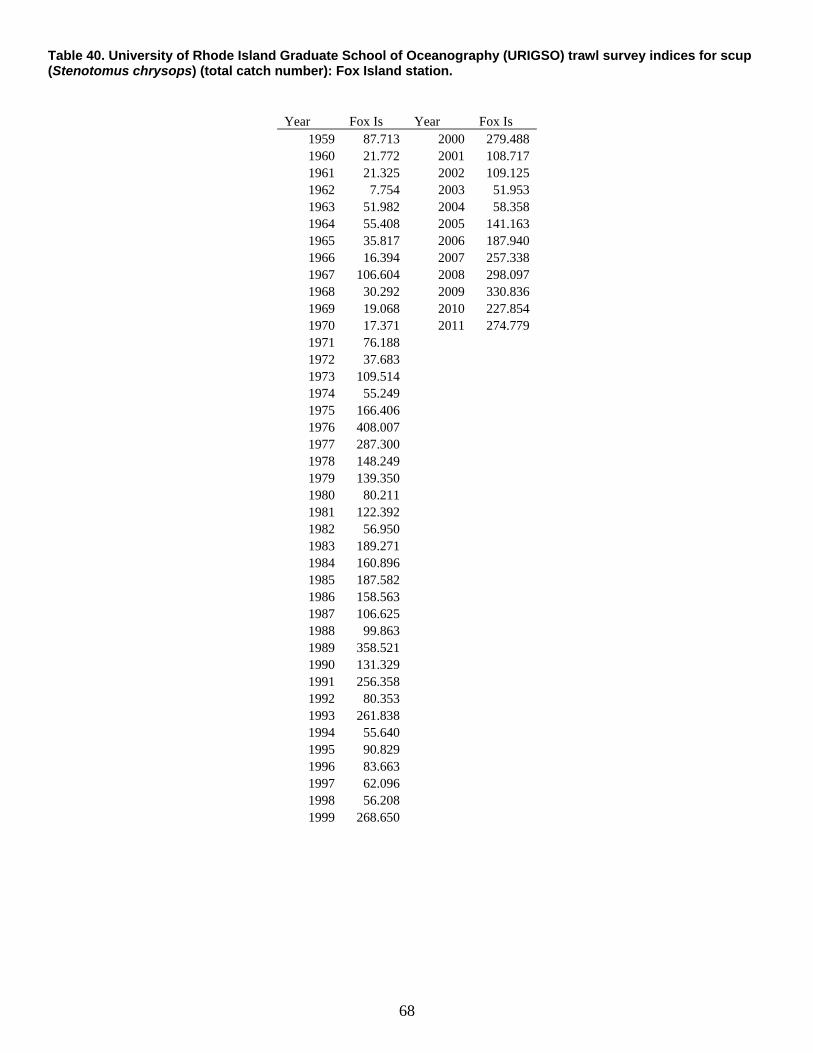
68
Table 40. University of Rhode Island Graduate School of Oceanography (URIGSO) trawl survey indices for scup (Stenotomus chrysops) (total catch number): Fox Island station.
Year Fox Is Year Fox Is 1959 87.713 2000 279.488 1960 21.772 2001 108.717 1961 21.325 2002 109.125 1962 7.754 2003 51.953 1963 51.982 2004 58.358 1964 55.408 2005 141.163 1965 35.817 2006 187.940 1966 16.394 2007 257.338 1967 106.604 2008 298.097 1968 30.292 2009 330.836 1969 19.068 2010 227.854 1970 17.371 2011 274.779 1971 76.188 1972 37.683 1973 109.514 1974 55.249 1975 166.406 1976 408.007 1977 287.300 1978 148.249 1979 139.350 1980 80.211 1981 122.392 1982 56.950 1983 189.271 1984 160.896 1985 187.582 1986 158.563 1987 106.625 1988 99.863 1989 358.521 1990 131.329 1991 256.358 1992 80.353 1993 261.838 1994 55.640 1995 90.829 1996 83.663 1997 62.096 1998 56.208 1999 268.650
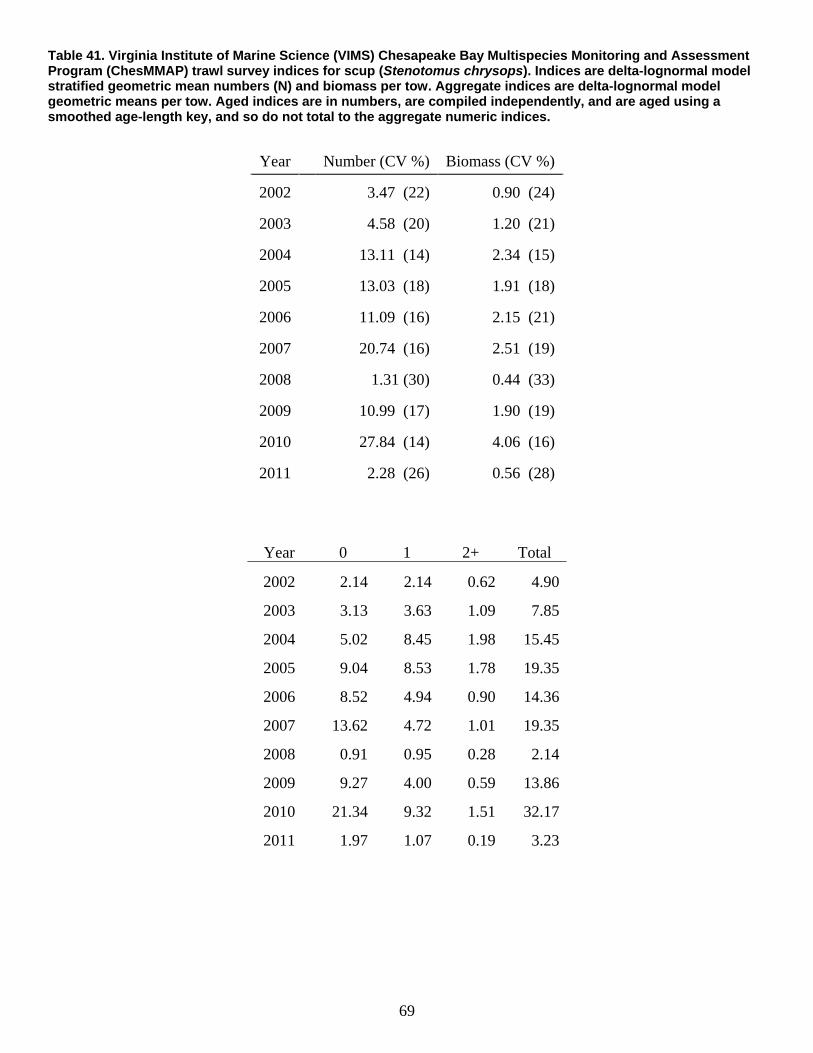
69
Table 41. Virginia Institute of Marine Science (VIMS) Chesapeake Bay Multispecies Monitoring and Assessment Program (ChesMMAP) trawl survey indices for scup (Stenotomus chrysops). Indices are delta-lognormal model stratified geometric mean numbers (N) and biomass per tow. Aggregate indices are delta-lognormal model geometric means per tow. Aged indices are in numbers, are compiled independently, and are aged using a smoothed age-length key, and so do not total to the aggregate numeric indices.
Year
Number (CV %) Biomass (CV %)
2002
3.47 (22) 0.90 (24)
2003
4.58 (20) 1.20 (21)
2004
13.11 (14) 2.34 (15)
2005
13.03 (18) 1.91 (18)
2006
11.09 (16) 2.15 (21)
2007
20.74 (16) 2.51 (19)
2008
1.31 (30) 0.44 (33)
2009
10.99 (17) 1.90 (19)
2010
27.84 (14) 4.06 (16)
2011
2.28 (26) 0.56 (28)
Year 0 1 2+ Total
2002 2.14 2.14 0.62 4.90
2003 3.13 3.63 1.09 7.85
2004 5.02 8.45 1.98 15.45
2005 9.04 8.53 1.78 19.35
2006 8.52 4.94 0.90 14.36
2007 13.62 4.72 1.01 19.35
2008 0.91 0.95 0.28 2.14
2009 9.27 4.00 0.59 13.86
2010 21.34 9.32 1.51 32.17
2011 1.97 1.07 0.19 3.23
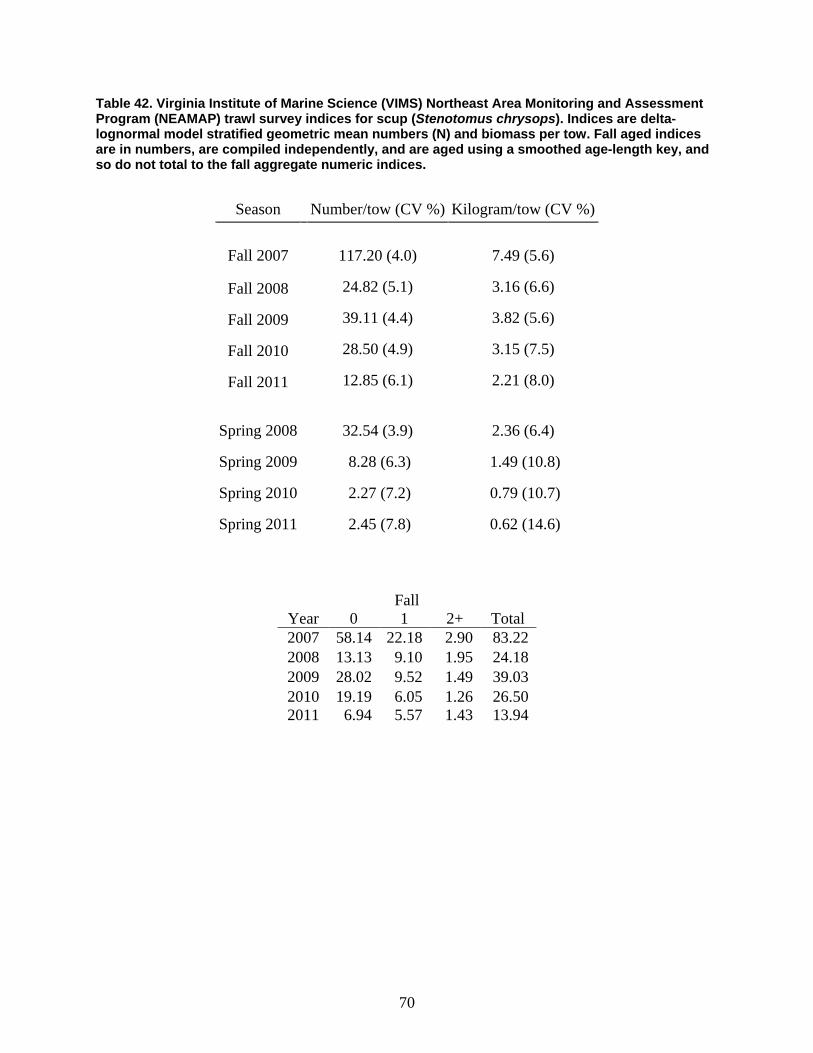
70
Table 42. Virginia Institute of Marine Science (VIMS) Northeast Area Monitoring and Assessment Program (NEAMAP) trawl survey indices for scup (Stenotomus chrysops). Indices are delta-lognormal model stratified geometric mean numbers (N) and biomass per tow. Fall aged indices are in numbers, are compiled independently, and are aged using a smoothed age-length key, and so do not total to the fall aggregate numeric indices.
Season
Number/tow (CV %) Kilogram/tow (CV %)
Fall 2007 117.20 (4.0) 7.49 (5.6)
Fall 2008 24.82 (5.1) 3.16 (6.6)
Fall 2009 39.11 (4.4) 3.82 (5.6)
Fall 2010 28.50 (4.9) 3.15 (7.5)
Fall 2011 12.85 (6.1) 2.21 (8.0)
Spring 2008 32.54 (3.9) 2.36 (6.4)
Spring 2009 8.28 (6.3) 1.49 (10.8)
Spring 2010 2.27 (7.2) 0.79 (10.7)
Spring 2011 2.45 (7.8) 0.62 (14.6)
Fall
Year 0 1 2+ Total 2007 58.14 22.18 2.90 83.222008 13.13 9.10 1.95 24.182009 28.02 9.52 1.49 39.032010 19.19 6.05 1.26 26.502011 6.94 5.57 1.43 13.94
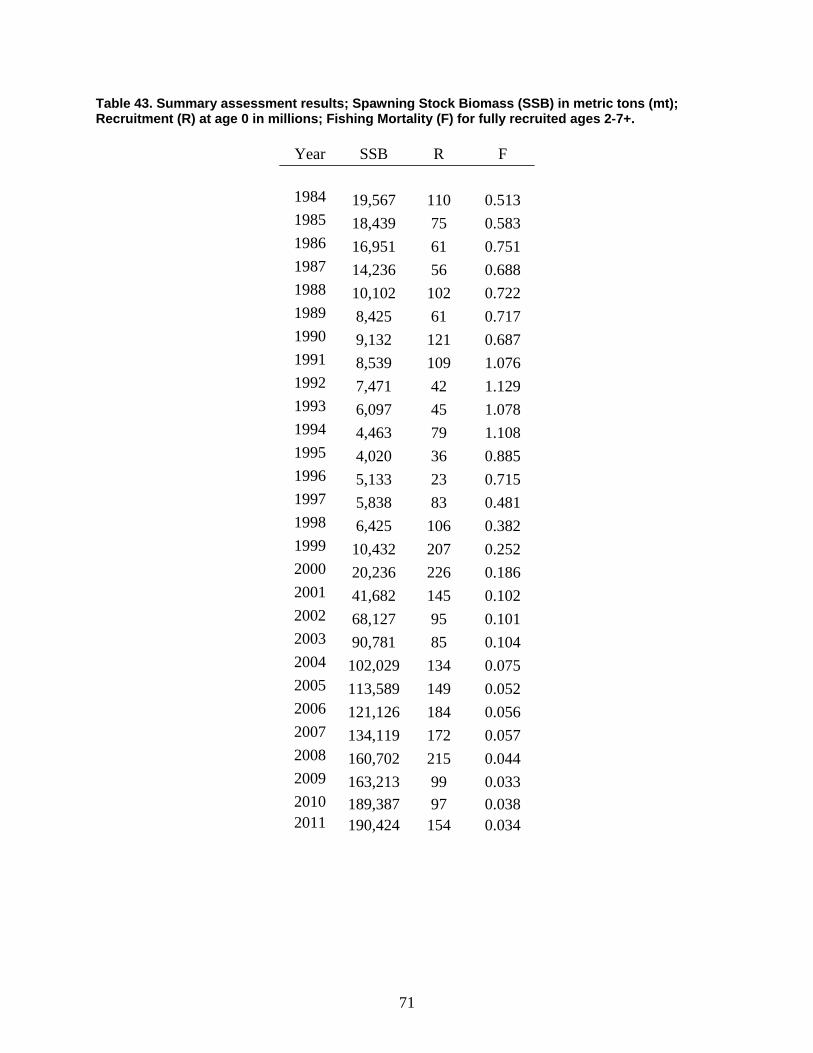
71
Table 43. Summary assessment results; Spawning Stock Biomass (SSB) in metric tons (mt); Recruitment (R) at age 0 in millions; Fishing Mortality (F) for fully recruited ages 2-7+.
Year SSB R F
1984 19,567 110 0.513 1985 18,439 75 0.583 1986 16,951 61 0.751 1987 14,236 56 0.688 1988 10,102 102 0.722 1989 8,425 61 0.717 1990 9,132 121 0.687 1991 8,539 109 1.076 1992 7,471 42 1.129 1993 6,097 45 1.078 1994 4,463 79 1.108 1995 4,020 36 0.885 1996 5,133 23 0.715 1997 5,838 83 0.481 1998 6,425 106 0.382 1999 10,432 207 0.252 2000 20,236 226 0.186 2001 41,682 145 0.102 2002 68,127 95 0.101 2003 90,781 85 0.104 2004 102,029 134 0.075 2005 113,589 149 0.052 2006 121,126 184 0.056 2007 134,119 172 0.057 2008 160,702 215 0.044 2009 163,213 99 0.033 2010 189,387 97 0.038 2011 190,424 154 0.034
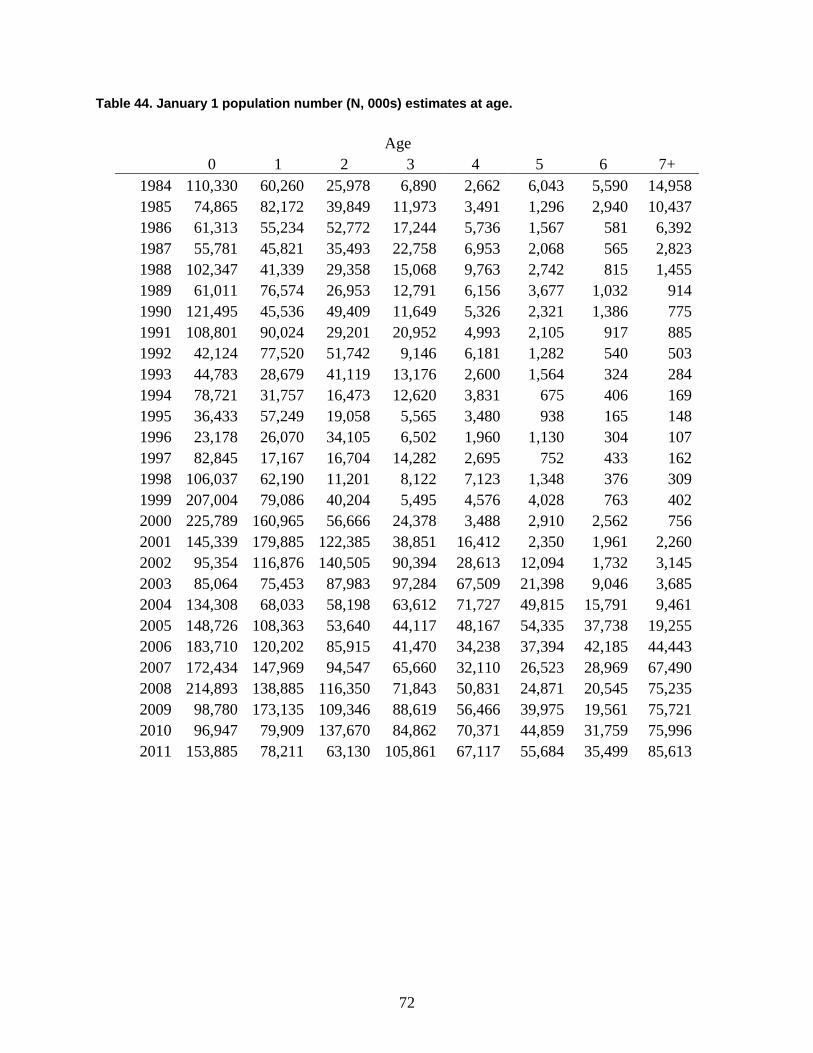
72
Table 44. January 1 population number (N, 000s) estimates at age.
Age
0 1 2 3 4 5 6 7+ 1984 110,330 60,260 25,978 6,890 2,662 6,043 5,590 14,9581985 74,865 82,172 39,849 11,973 3,491 1,296 2,940 10,4371986 61,313 55,234 52,772 17,244 5,736 1,567 581 6,3921987 55,781 45,821 35,493 22,758 6,953 2,068 565 2,8231988 102,347 41,339 29,358 15,068 9,763 2,742 815 1,4551989 61,011 76,574 26,953 12,791 6,156 3,677 1,032 9141990 121,495 45,536 49,409 11,649 5,326 2,321 1,386 7751991 108,801 90,024 29,201 20,952 4,993 2,105 917 8851992 42,124 77,520 51,742 9,146 6,181 1,282 540 5031993 44,783 28,679 41,119 13,176 2,600 1,564 324 2841994 78,721 31,757 16,473 12,620 3,831 675 406 1691995 36,433 57,249 19,058 5,565 3,480 938 165 1481996 23,178 26,070 34,105 6,502 1,960 1,130 304 1071997 82,845 17,167 16,704 14,282 2,695 752 433 1621998 106,037 62,190 11,201 8,122 7,123 1,348 376 3091999 207,004 79,086 40,204 5,495 4,576 4,028 763 4022000 225,789 160,965 56,666 24,378 3,488 2,910 2,562 7562001 145,339 179,885 122,385 38,851 16,412 2,350 1,961 2,2602002 95,354 116,876 140,505 90,394 28,613 12,094 1,732 3,1452003 85,064 75,453 87,983 97,284 67,509 21,398 9,046 3,6852004 134,308 68,033 58,198 63,612 71,727 49,815 15,791 9,4612005 148,726 108,363 53,640 44,117 48,167 54,335 37,738 19,2552006 183,710 120,202 85,915 41,470 34,238 37,394 42,185 44,4432007 172,434 147,969 94,547 65,660 32,110 26,523 28,969 67,4902008 214,893 138,885 116,350 71,843 50,831 24,871 20,545 75,2352009 98,780 173,135 109,346 88,619 56,466 39,975 19,561 75,7212010 96,947 79,909 137,670 84,862 70,371 44,859 31,759 75,9962011 153,885 78,211 63,130 105,861 67,117 55,684 35,499 85,613
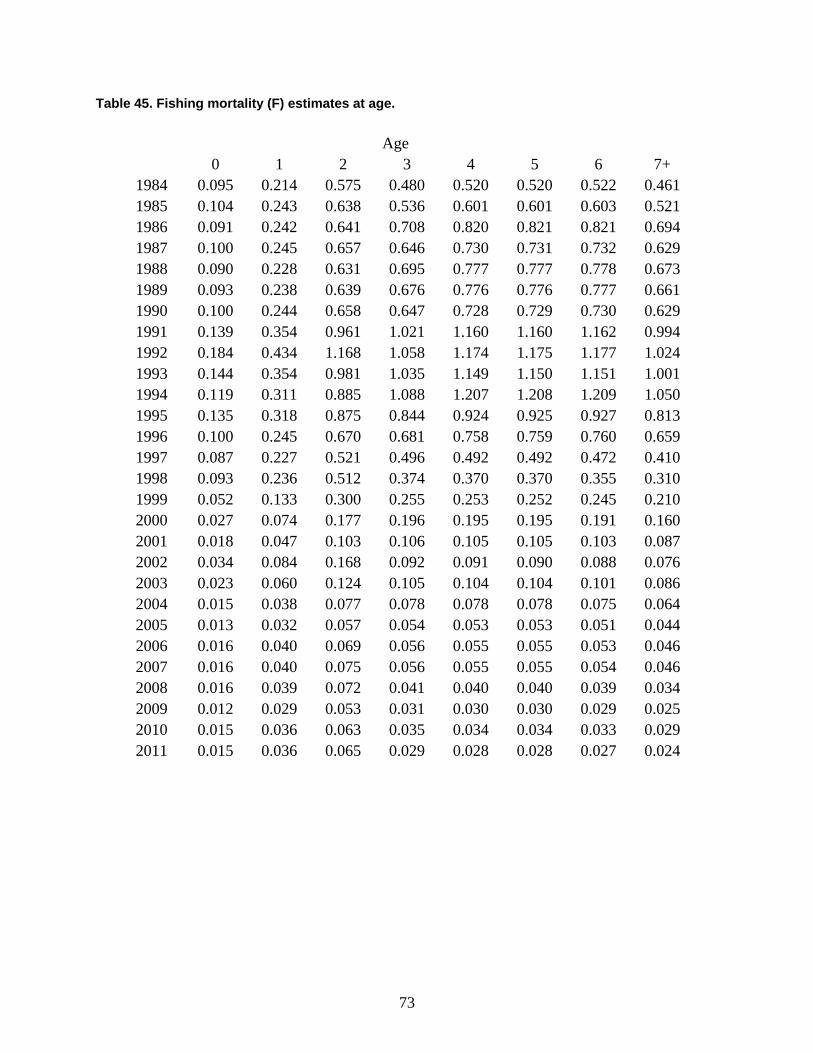
73
Table 45. Fishing mortality (F) estimates at age.
Age
0 1 2 3 4 5 6 7+ 1984 0.095 0.214 0.575 0.480 0.520 0.520 0.522 0.461 1985 0.104 0.243 0.638 0.536 0.601 0.601 0.603 0.521 1986 0.091 0.242 0.641 0.708 0.820 0.821 0.821 0.694 1987 0.100 0.245 0.657 0.646 0.730 0.731 0.732 0.629 1988 0.090 0.228 0.631 0.695 0.777 0.777 0.778 0.673 1989 0.093 0.238 0.639 0.676 0.776 0.776 0.777 0.661 1990 0.100 0.244 0.658 0.647 0.728 0.729 0.730 0.629 1991 0.139 0.354 0.961 1.021 1.160 1.160 1.162 0.994 1992 0.184 0.434 1.168 1.058 1.174 1.175 1.177 1.024 1993 0.144 0.354 0.981 1.035 1.149 1.150 1.151 1.001 1994 0.119 0.311 0.885 1.088 1.207 1.208 1.209 1.050 1995 0.135 0.318 0.875 0.844 0.924 0.925 0.927 0.813 1996 0.100 0.245 0.670 0.681 0.758 0.759 0.760 0.659 1997 0.087 0.227 0.521 0.496 0.492 0.492 0.472 0.410 1998 0.093 0.236 0.512 0.374 0.370 0.370 0.355 0.310 1999 0.052 0.133 0.300 0.255 0.253 0.252 0.245 0.210 2000 0.027 0.074 0.177 0.196 0.195 0.195 0.191 0.160 2001 0.018 0.047 0.103 0.106 0.105 0.105 0.103 0.087 2002 0.034 0.084 0.168 0.092 0.091 0.090 0.088 0.076 2003 0.023 0.060 0.124 0.105 0.104 0.104 0.101 0.086 2004 0.015 0.038 0.077 0.078 0.078 0.078 0.075 0.064 2005 0.013 0.032 0.057 0.054 0.053 0.053 0.051 0.044 2006 0.016 0.040 0.069 0.056 0.055 0.055 0.053 0.046 2007 0.016 0.040 0.075 0.056 0.055 0.055 0.054 0.046 2008 0.016 0.039 0.072 0.041 0.040 0.040 0.039 0.034 2009 0.012 0.029 0.053 0.031 0.030 0.030 0.029 0.025 2010 0.015 0.036 0.063 0.035 0.034 0.034 0.033 0.029 2011 0.015 0.036 0.065 0.029 0.028 0.028 0.027 0.024
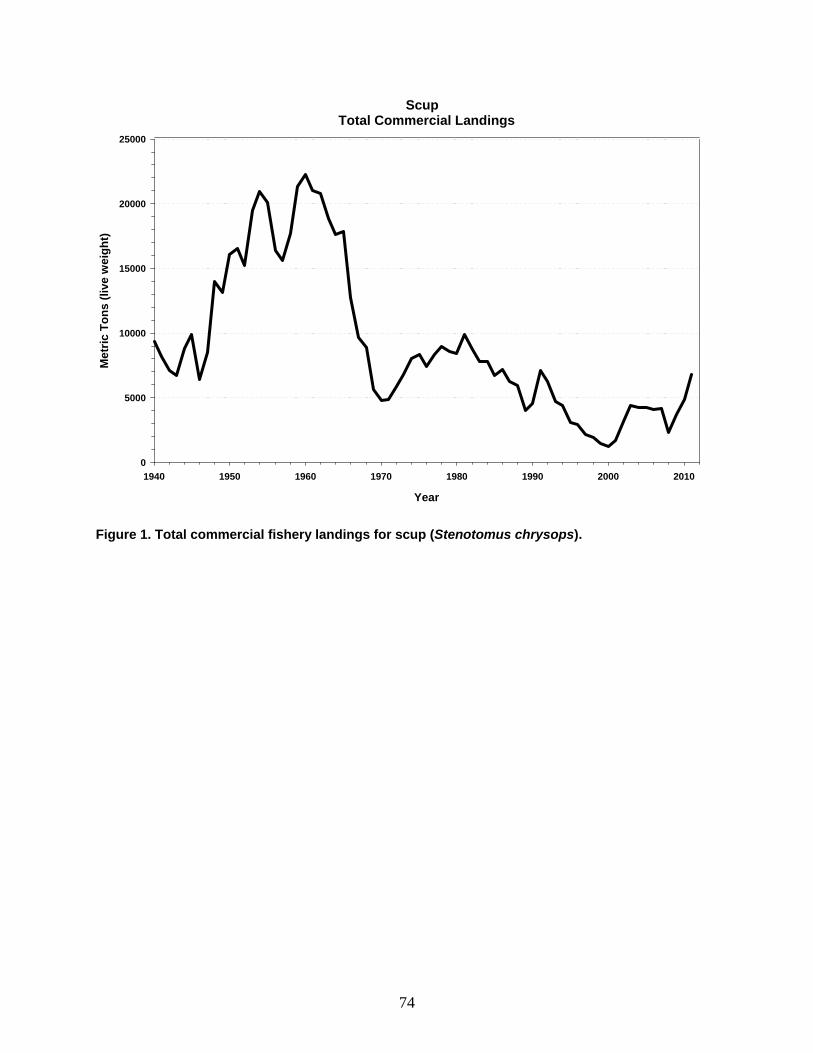
74
ScupTotal Commercial Landings
Year
1940 1950 1960 1970 1980 1990 2000 2010
Met
ric
To
ns
(liv
e w
eig
ht)
0
5000
10000
15000
20000
25000
Figure 1. Total commercial fishery landings for scup (Stenotomus chrysops).
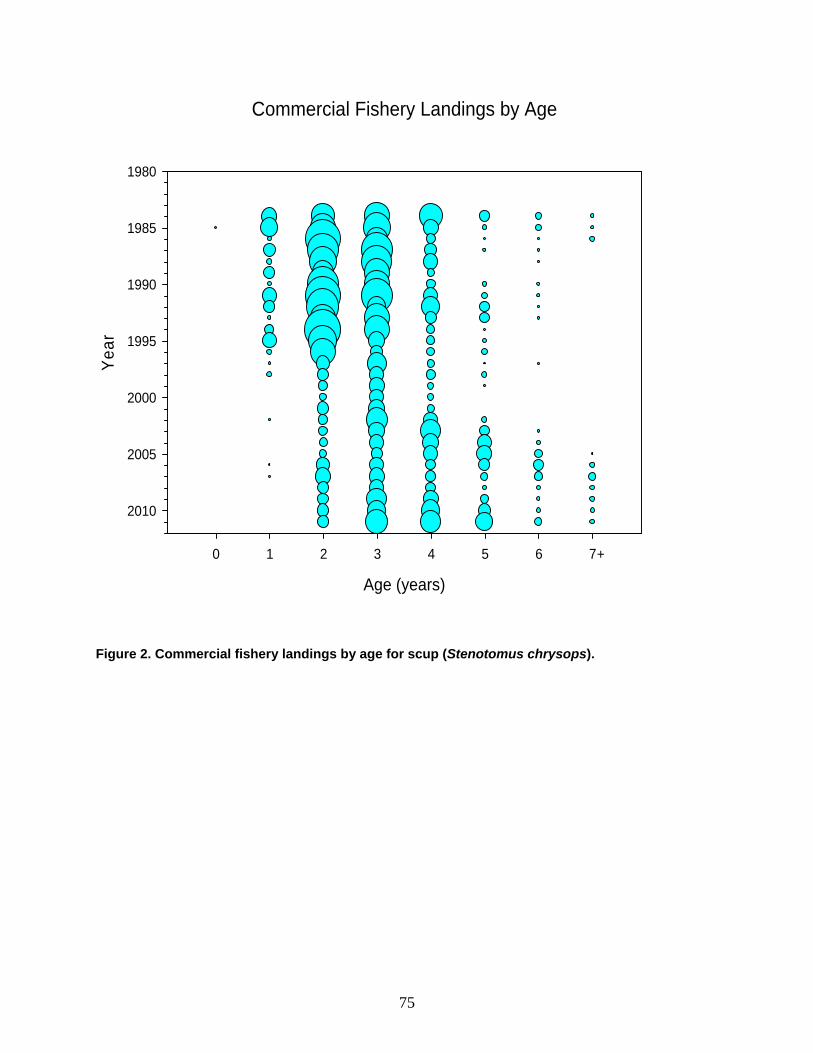
75
Commercial Fishery Landings by Age
Age (years)
0 1 2 3 4 5 6 7
Yea
r
1980
1985
1990
1995
2000
2005
2010
+
Figure 2. Commercial fishery landings by age for scup (Stenotomus chrysops).
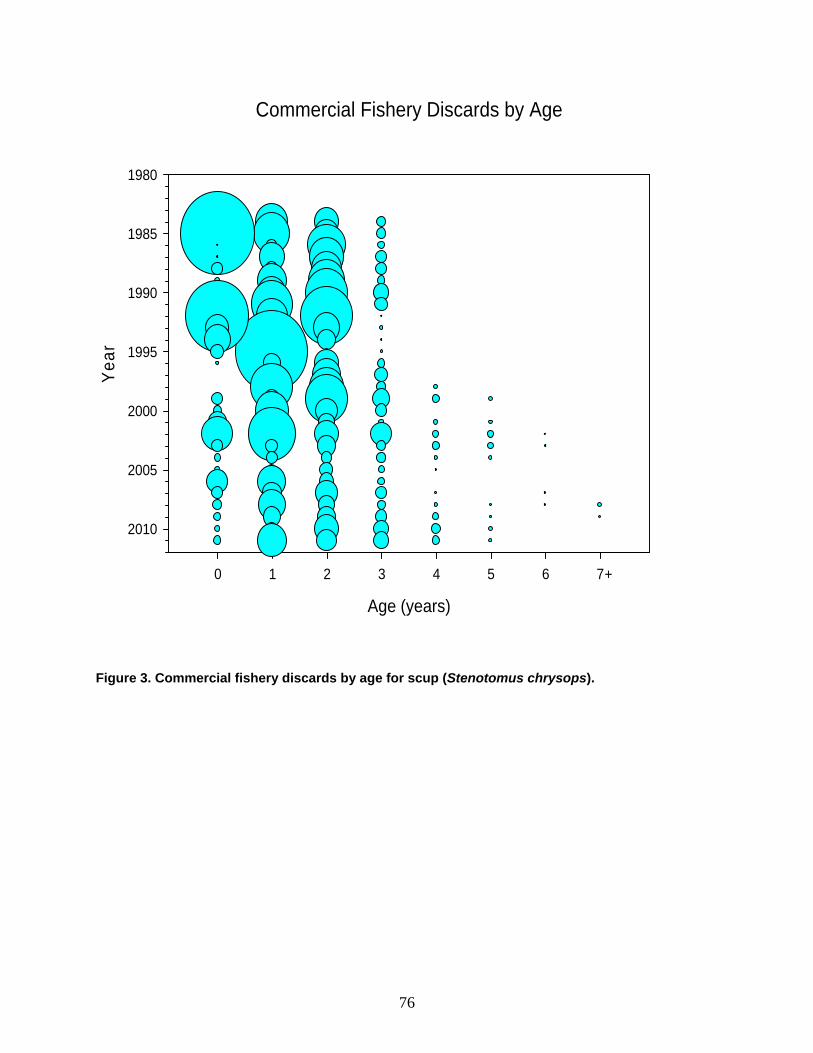
76
Commercial Fishery Discards by Age
Age (years)
0 1 2 3 4 5 6 7
Yea
r
1980
1985
1990
1995
2000
2005
2010
+
Figure 3. Commercial fishery discards by age for scup (Stenotomus chrysops).
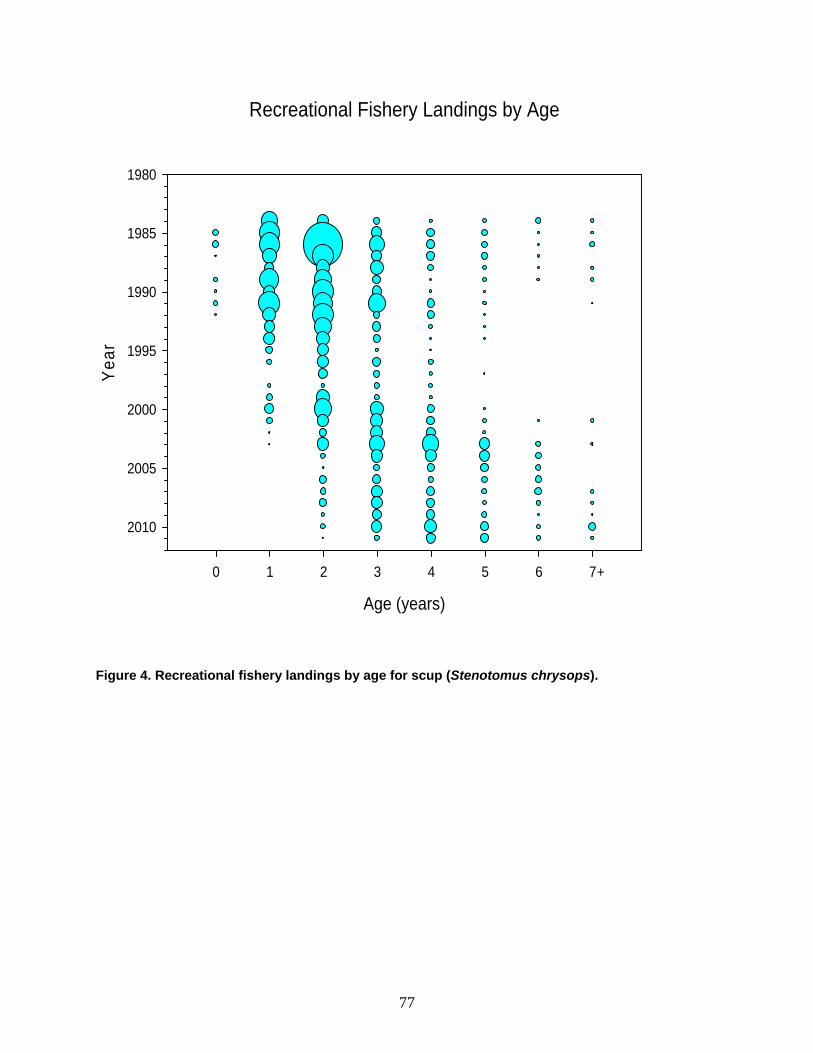
77
Recreational Fishery Landings by Age
Age (years)
0 1 2 3 4 5 6 7
Yea
r
1980
1985
1990
1995
2000
2005
2010
+
Figure 4. Recreational fishery landings by age for scup (Stenotomus chrysops).
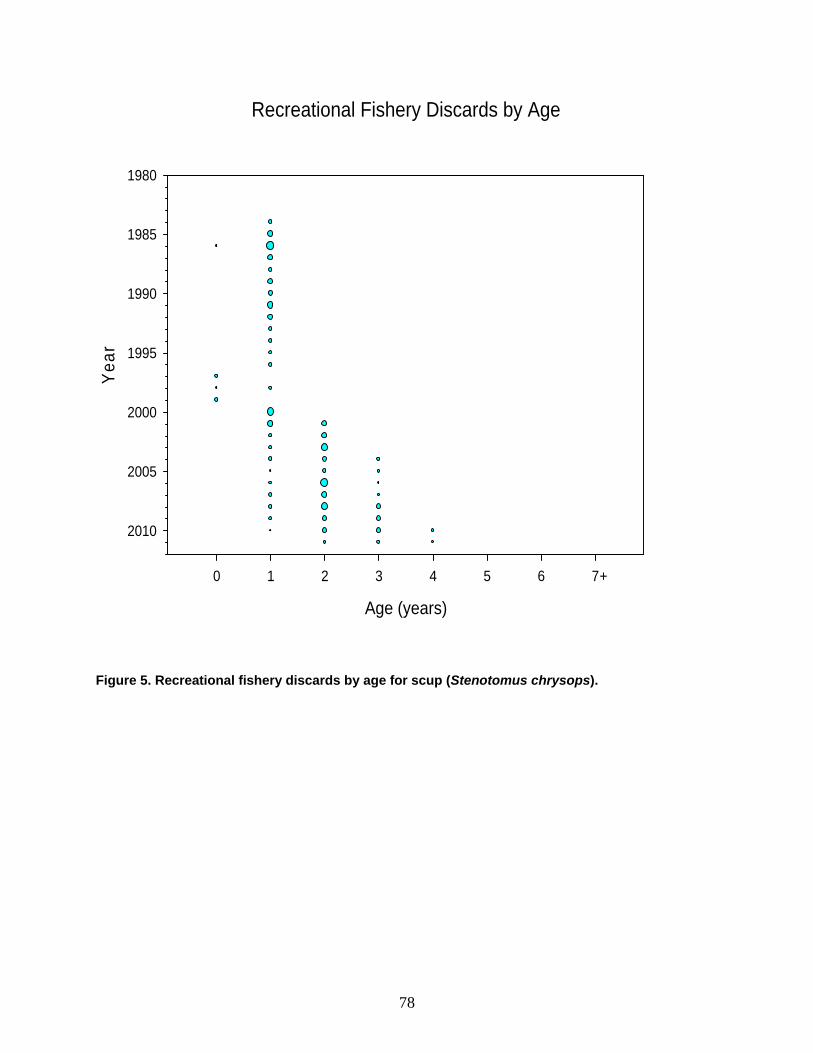
78
Recreational Fishery Discards by Age
Age (years)
0 1 2 3 4 5 6 7
Yea
r
1980
1985
1990
1995
2000
2005
2010
+
Figure 5. Recreational fishery discards by age for scup (Stenotomus chrysops).
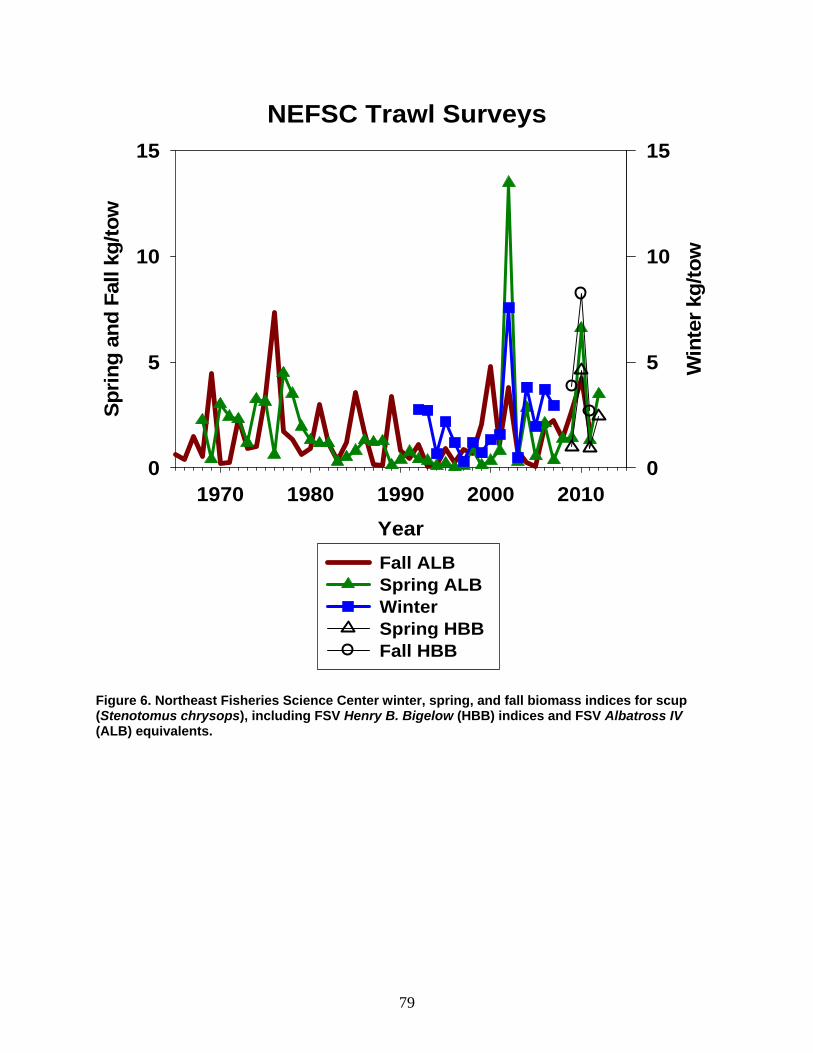
79
NEFSC Trawl Surveys
Year
1970 1980 1990 2000 2010
Sp
rin
g a
nd
Fal
l kg
/to
w
0
5
10
15
Win
ter
kg/t
ow
0
5
10
15
Fall ALB Spring ALB Winter Spring HBB Fall HBB
Figure 6. Northeast Fisheries Science Center winter, spring, and fall biomass indices for scup (Stenotomus chrysops), including FSV Henry B. Bigelow (HBB) indices and FSV Albatross IV (ALB) equivalents.
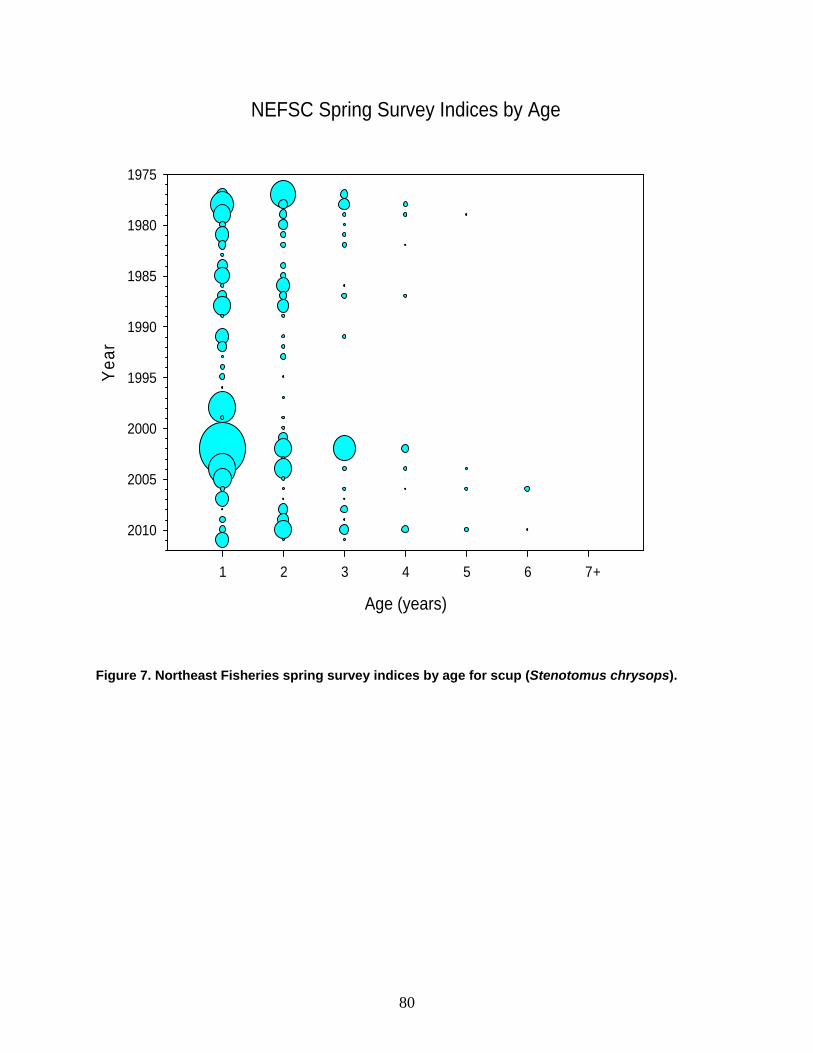
80
NEFSC Spring Survey Indices by Age
Age (years)
1 2 3 4 5 6 7
Yea
r
1975
1980
1985
1990
1995
2000
2005
2010
+
Figure 7. Northeast Fisheries spring survey indices by age for scup (Stenotomus chrysops).
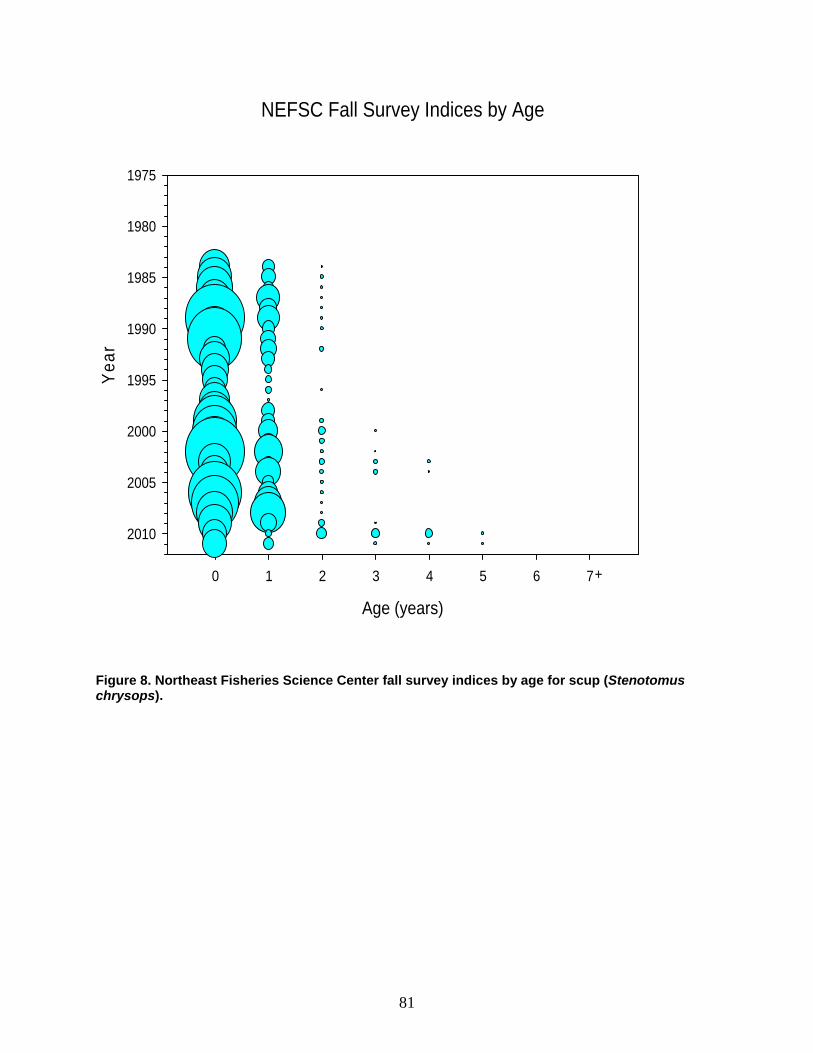
81
NEFSC Fall Survey Indices by Age
Age (years)
0 1 2 3 4 5 6 7
Yea
r
1975
1980
1985
1990
1995
2000
2005
2010
+
Figure 8. Northeast Fisheries Science Center fall survey indices by age for scup (Stenotomus chrysops).

82
NEFSC Winter Survey Indices by Age
Age (years)
1 2 3 4 5 6 7
Yea
r
1975
1980
1985
1990
1995
2000
2005
2010
+
Figure 9. Northeast Fisheries Science Center winter survey indices by age for scup (Stenotomus chrysops).
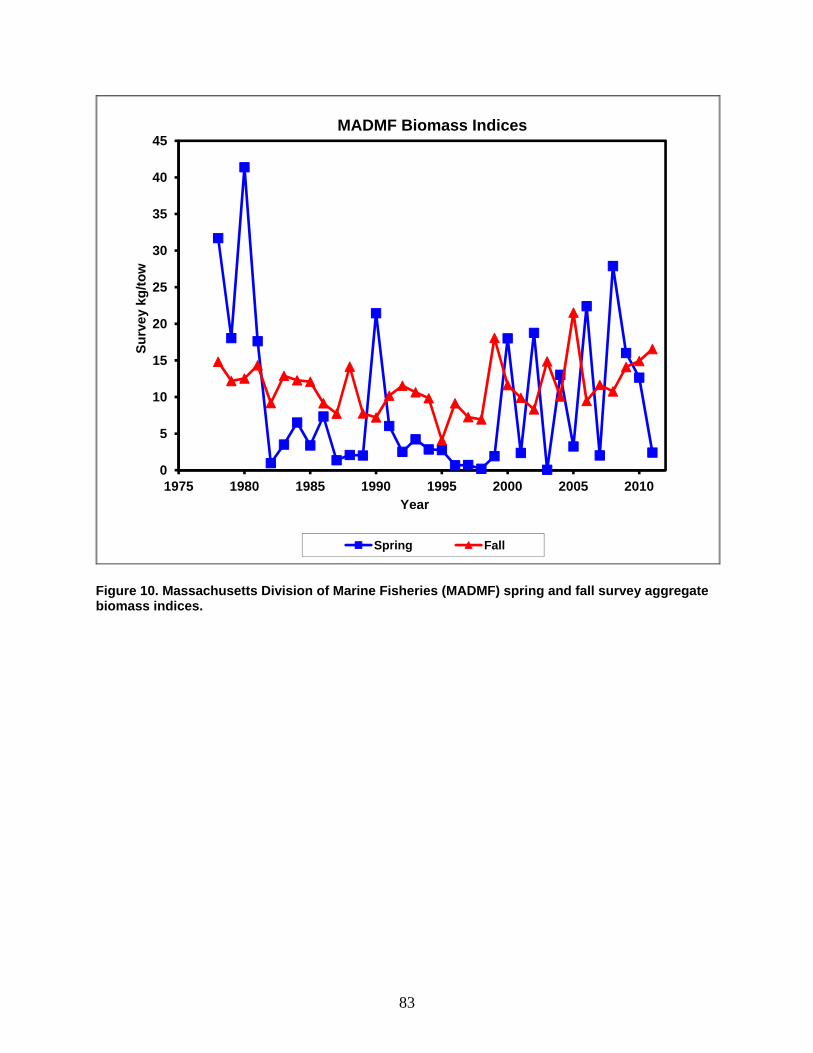
83
Figure 10. Massachusetts Division of Marine Fisheries (MADMF) spring and fall survey aggregate biomass indices.
0
5
10
15
20
25
30
35
40
45
1975 1980 1985 1990 1995 2000 2005 2010
Su
rvey
kg
/to
w
Year
MADMF Biomass Indices
Spring Fall
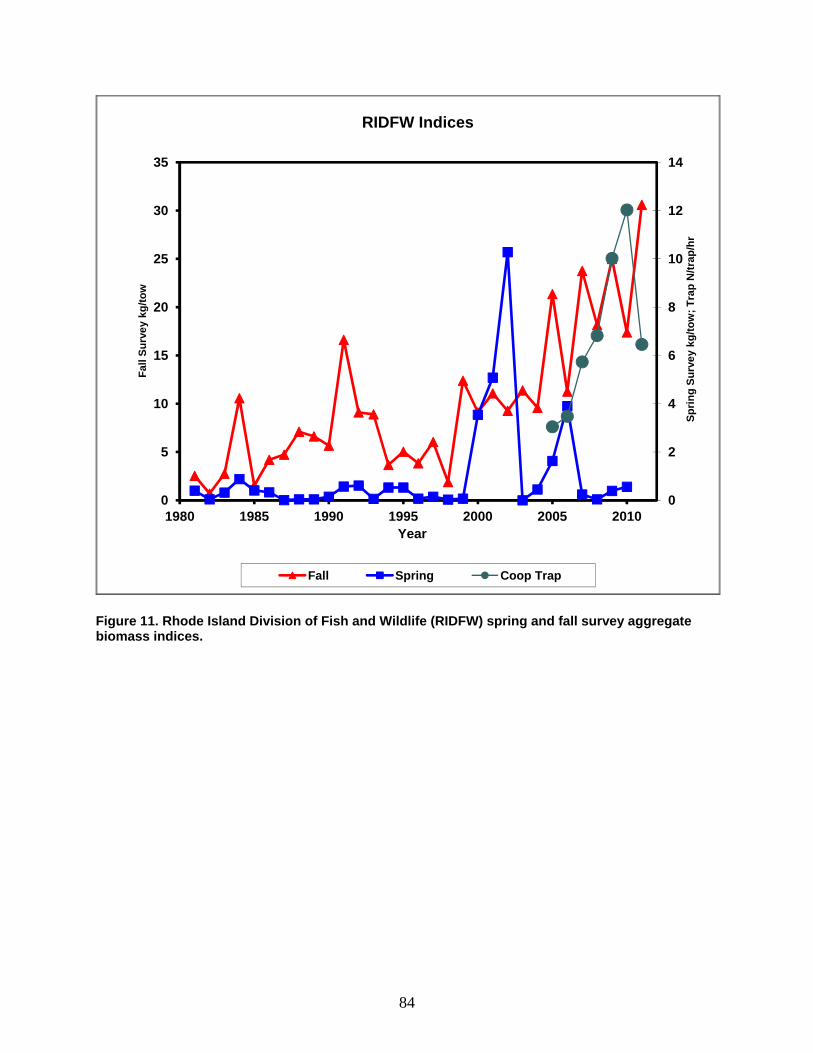
84
Figure 11. Rhode Island Division of Fish and Wildlife (RIDFW) spring and fall survey aggregate biomass indices.
0
2
4
6
8
10
12
14
0
5
10
15
20
25
30
35
1980 1985 1990 1995 2000 2005 2010
Sp
rin
g S
urv
ey
kg/t
ow
; T
rap
N/t
rap
/hr
Fal
l Su
rve
y kg
/to
w
Year
RIDFW Indices
Fall Spring Coop Trap
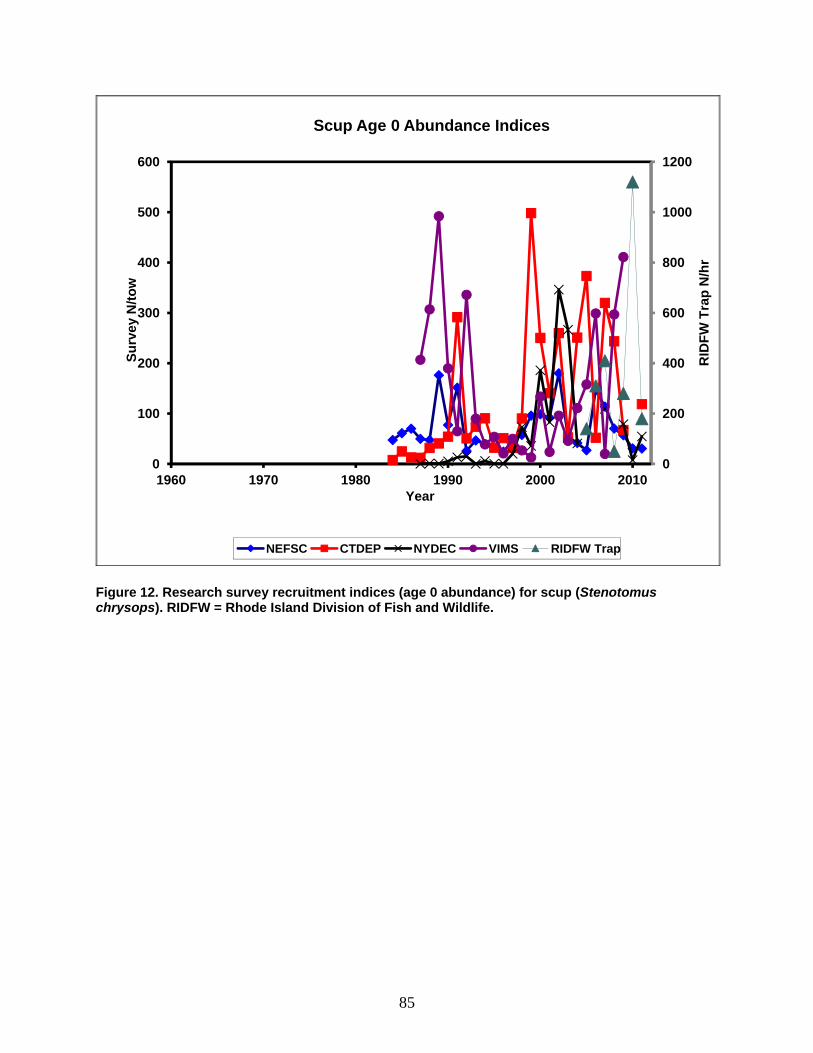
85
Figure 12. Research survey recruitment indices (age 0 abundance) for scup (Stenotomus chrysops). RIDFW = Rhode Island Division of Fish and Wildlife.
0
200
400
600
800
1000
1200
0
100
200
300
400
500
600
1960 1970 1980 1990 2000 2010
RID
FW
Tra
p N
/hr
Su
rvey
N/t
ow
Year
Scup Age 0 Abundance Indices
NEFSC CTDEP NYDEC VIMS RIDFW Trap
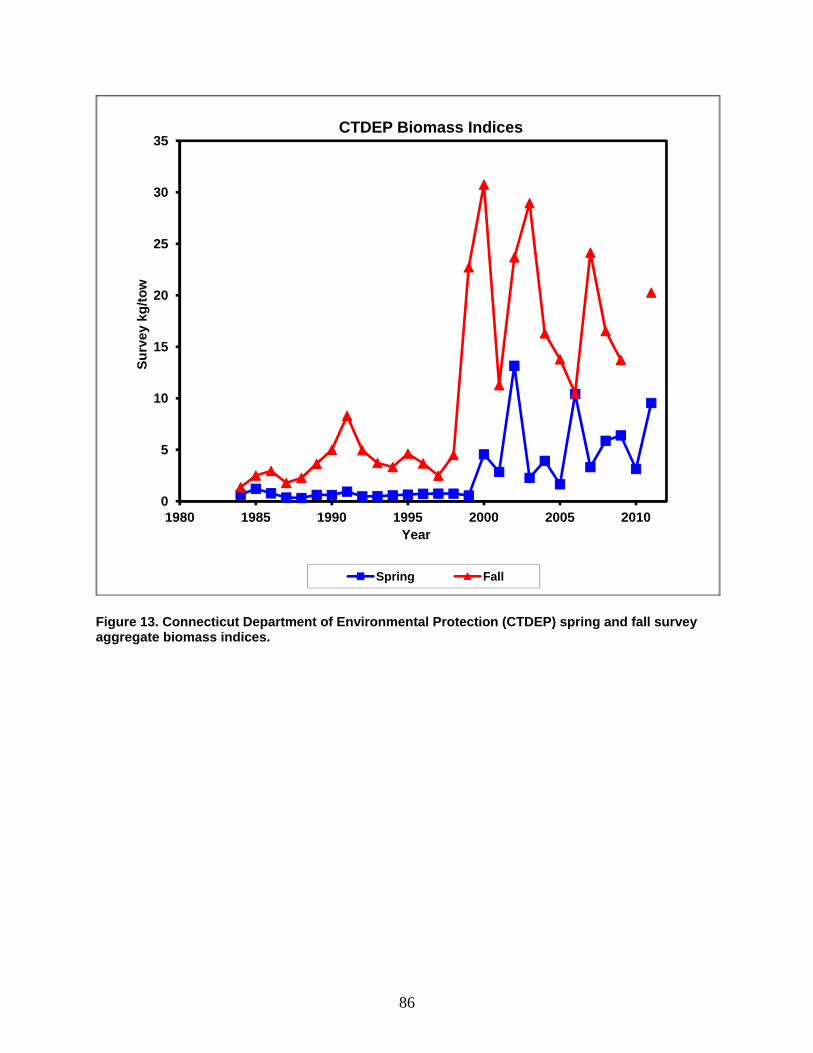
86
Figure 13. Connecticut Department of Environmental Protection (CTDEP) spring and fall survey aggregate biomass indices.
0
5
10
15
20
25
30
35
1980 1985 1990 1995 2000 2005 2010
Su
rvey
kg
/to
w
Year
CTDEP Biomass Indices
Spring Fall
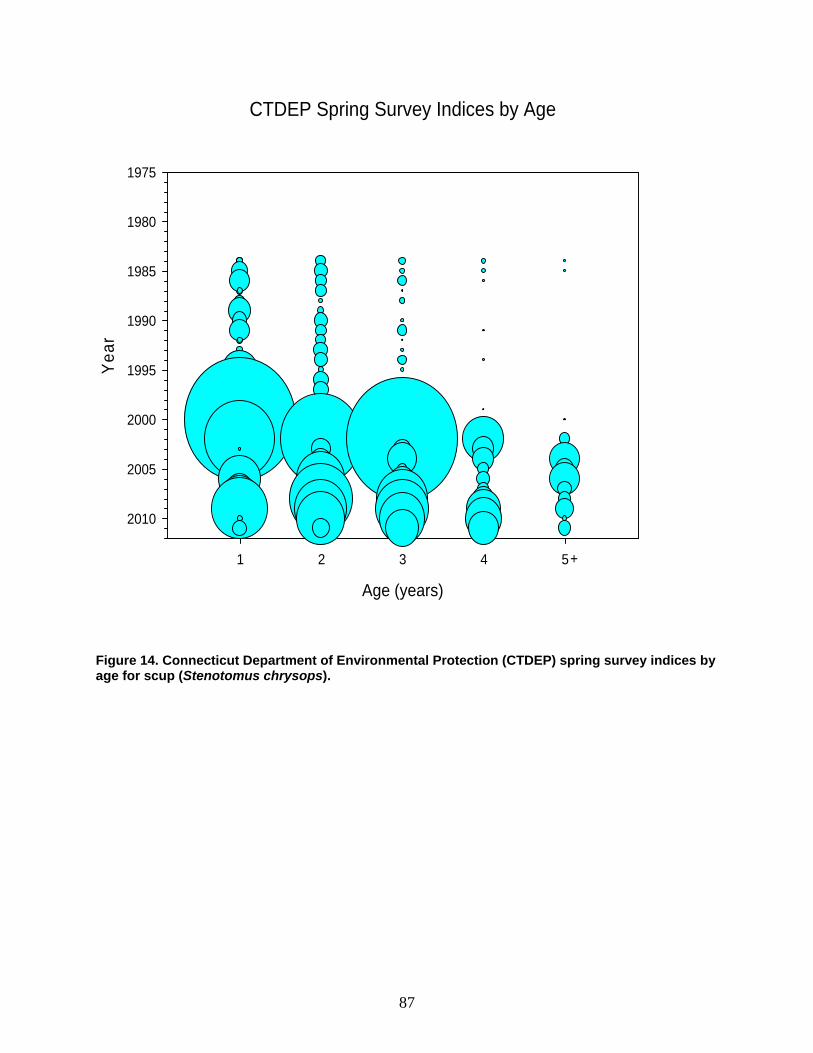
87
CTDEP Spring Survey Indices by Age
Age (years)
1 2 3 4 5
Yea
r
1975
1980
1985
1990
1995
2000
2005
2010
+
Figure 14. Connecticut Department of Environmental Protection (CTDEP) spring survey indices by age for scup (Stenotomus chrysops).
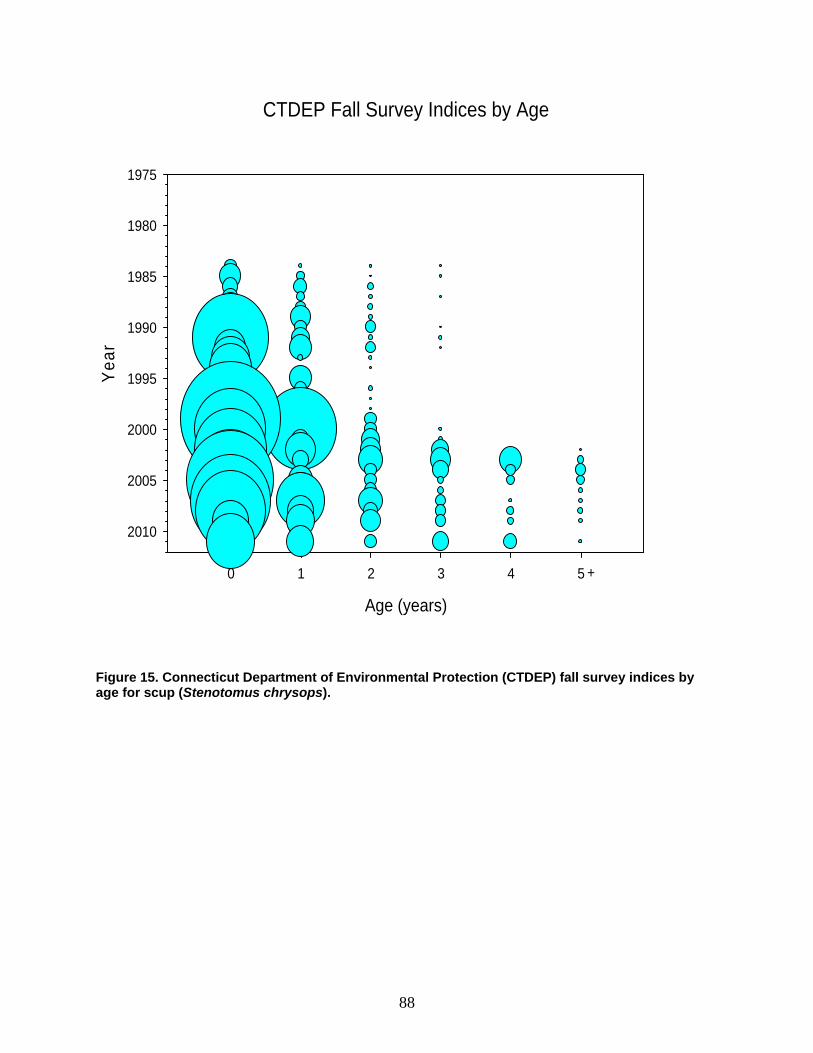
88
CTDEP Fall Survey Indices by Age
Age (years)
0 1 2 3 4 5
Ye
ar
1975
1980
1985
1990
1995
2000
2005
2010
+
Figure 15. Connecticut Department of Environmental Protection (CTDEP) fall survey indices by age for scup (Stenotomus chrysops).
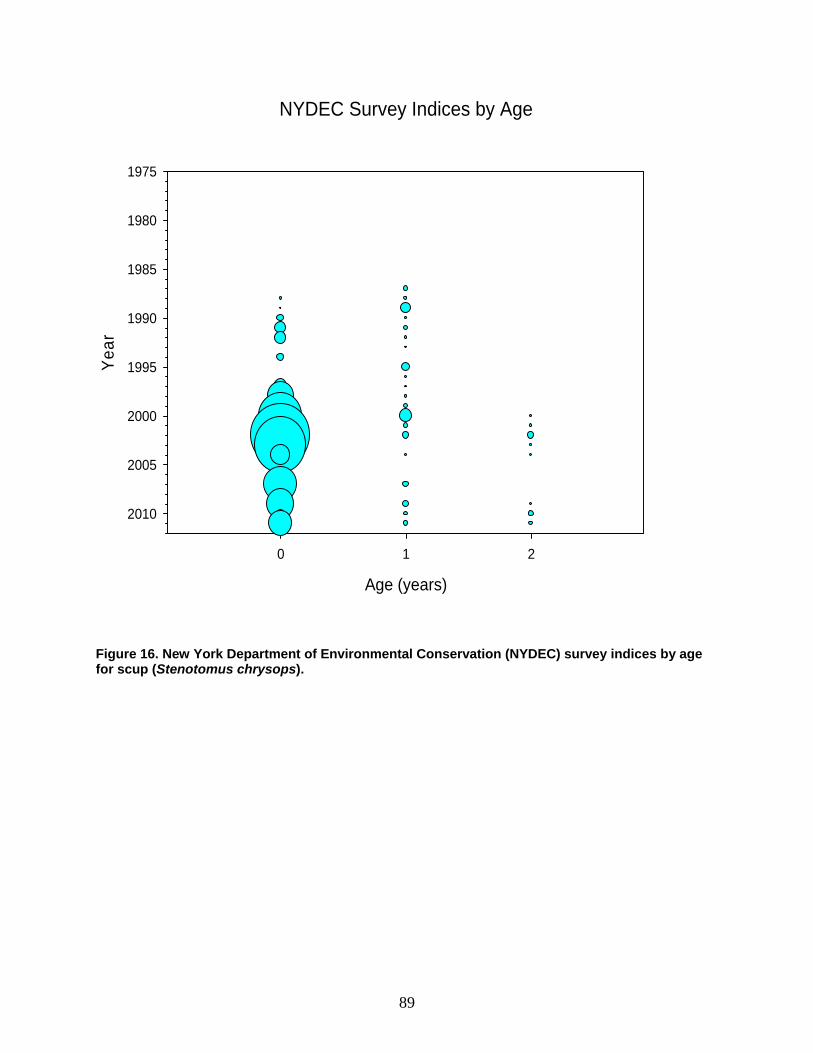
89
NYDEC Survey Indices by Age
Age (years)
0 1 2
Yea
r
1975
1980
1985
1990
1995
2000
2005
2010
Figure 16. New York Department of Environmental Conservation (NYDEC) survey indices by age for scup (Stenotomus chrysops).
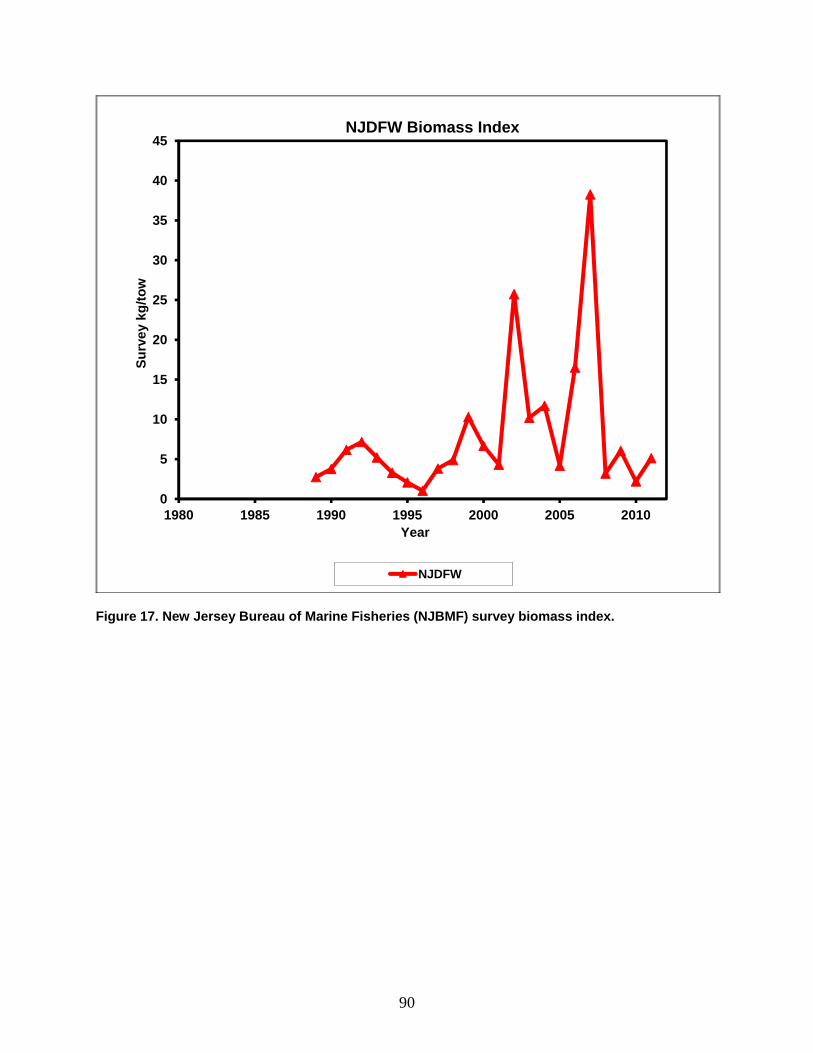
90
Figure 17. New Jersey Bureau of Marine Fisheries (NJBMF) survey biomass index.
0
5
10
15
20
25
30
35
40
45
1980 1985 1990 1995 2000 2005 2010
Su
rvey
kg
/to
w
Year
NJDFW Biomass Index
NJDFW
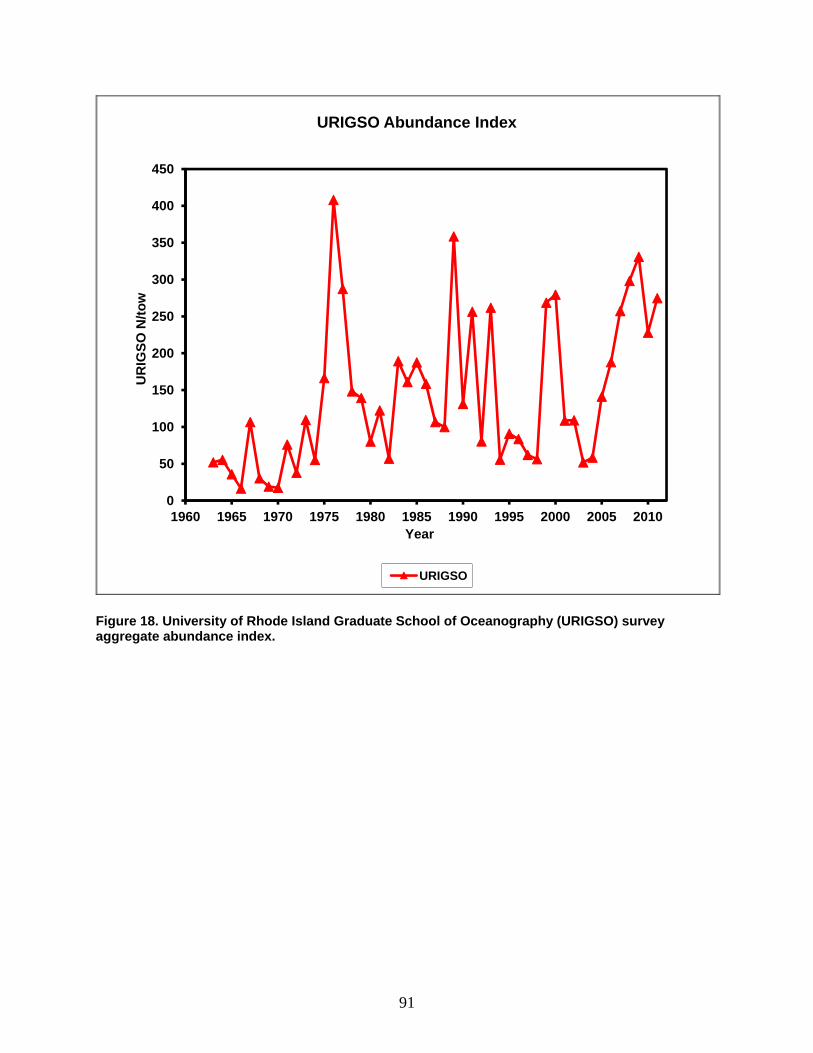
91
Figure 18. University of Rhode Island Graduate School of Oceanography (URIGSO) survey aggregate abundance index.
0
50
100
150
200
250
300
350
400
450
1960 1965 1970 1975 1980 1985 1990 1995 2000 2005 2010
UR
IGS
O N
/to
w
Year
URIGSO Abundance Index
URIGSO
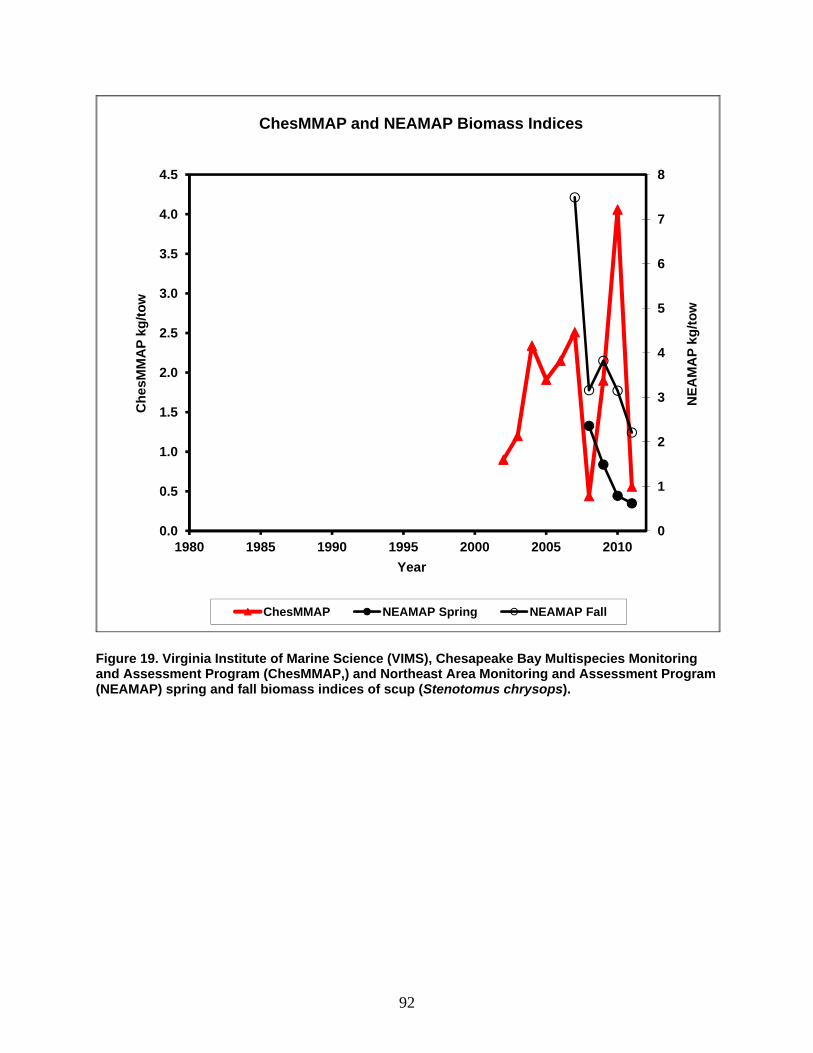
92
Figure 19. Virginia Institute of Marine Science (VIMS), Chesapeake Bay Multispecies Monitoring and Assessment Program (ChesMMAP,) and Northeast Area Monitoring and Assessment Program (NEAMAP) spring and fall biomass indices of scup (Stenotomus chrysops).
0
1
2
3
4
5
6
7
8
0.0
0.5
1.0
1.5
2.0
2.5
3.0
3.5
4.0
4.5
1980 1985 1990 1995 2000 2005 2010
NE
AM
AP
kg
/to
w
Ch
esM
MA
P k
g/t
ow
Year
ChesMMAP and NEAMAP Biomass Indices
ChesMMAP NEAMAP Spring NEAMAP Fall
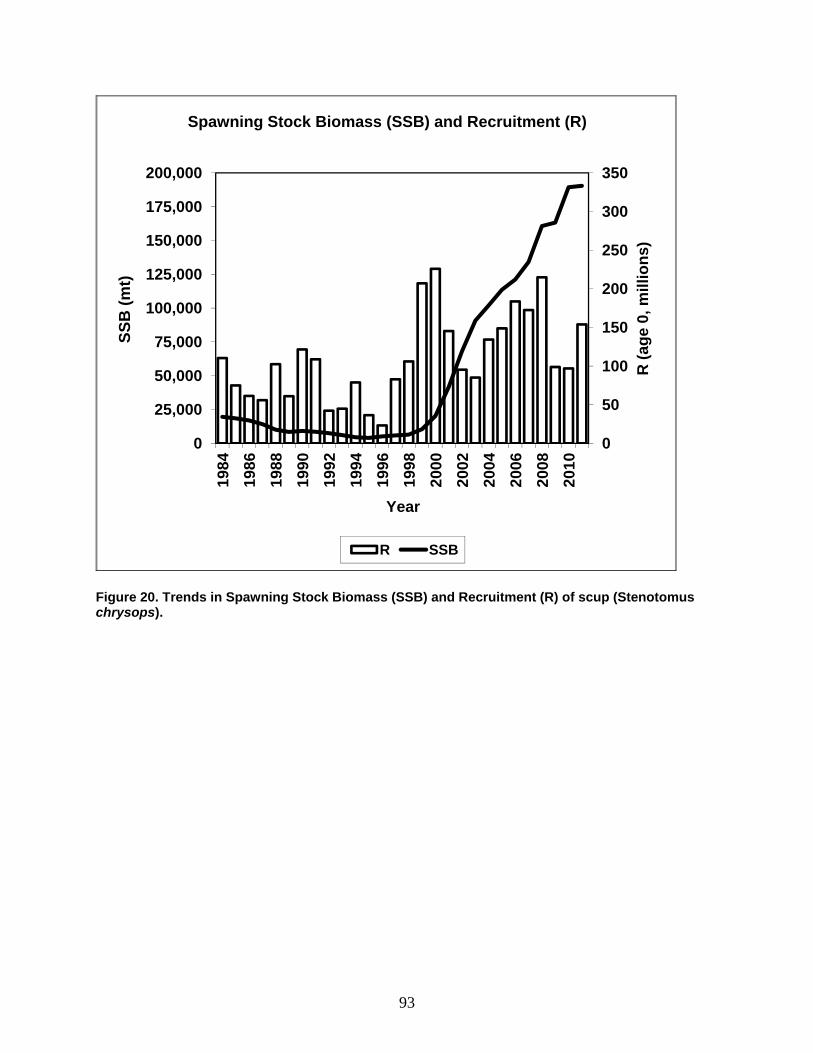
93
Figure 20. Trends in Spawning Stock Biomass (SSB) and Recruitment (R) of scup (Stenotomus chrysops).
0
50
100
150
200
250
300
350
0
25,000
50,000
75,000
100,000
125,000
150,000
175,000
200,000
1984
1986
1988
1990
1992
1994
1996
1998
2000
2002
2004
2006
2008
2010
R (
age
0, m
illio
ns)
SS
B (
mt)
Year
Spawning Stock Biomass (SSB) and Recruitment (R)
R SSB
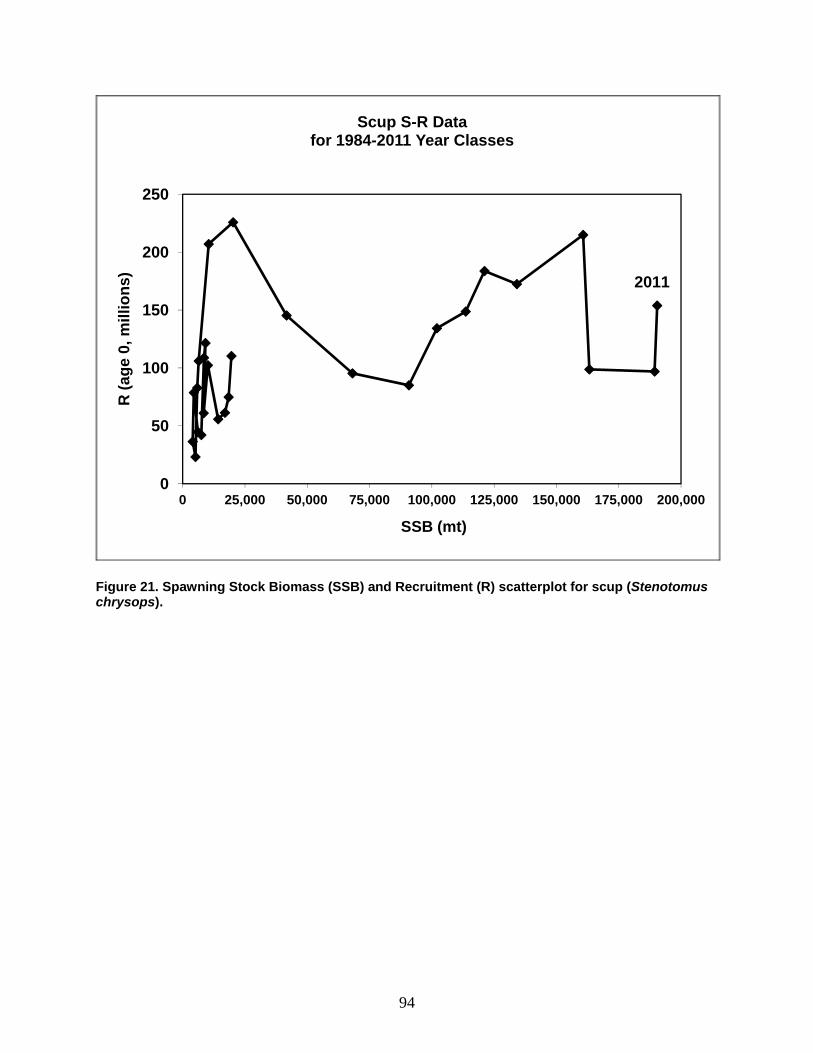
94
Figure 21. Spawning Stock Biomass (SSB) and Recruitment (R) scatterplot for scup (Stenotomus chrysops).
0
50
100
150
200
250
0 25,000 50,000 75,000 100,000 125,000 150,000 175,000 200,000
R (
age
0, m
illio
ns)
SSB (mt)
Scup S-R Datafor 1984-2011 Year Classes
2011
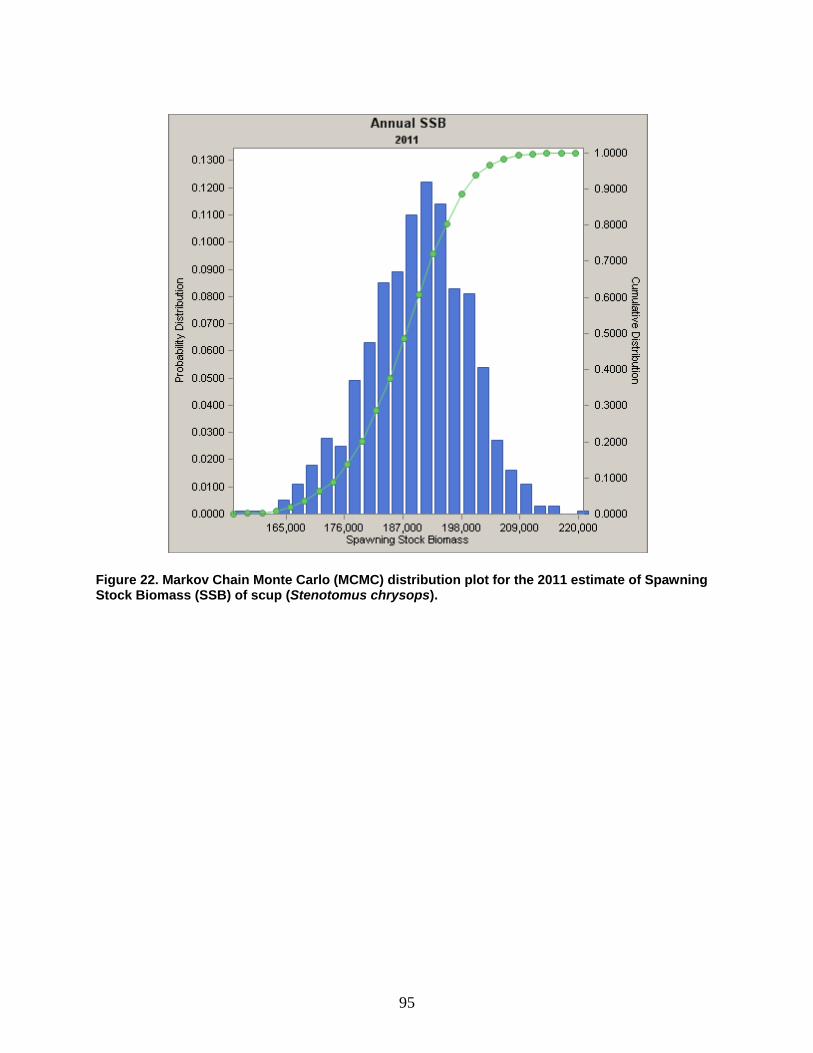
95
Figure 22. Markov Chain Monte Carlo (MCMC) distribution plot for the 2011 estimate of Spawning Stock Biomass (SSB) of scup (Stenotomus chrysops).
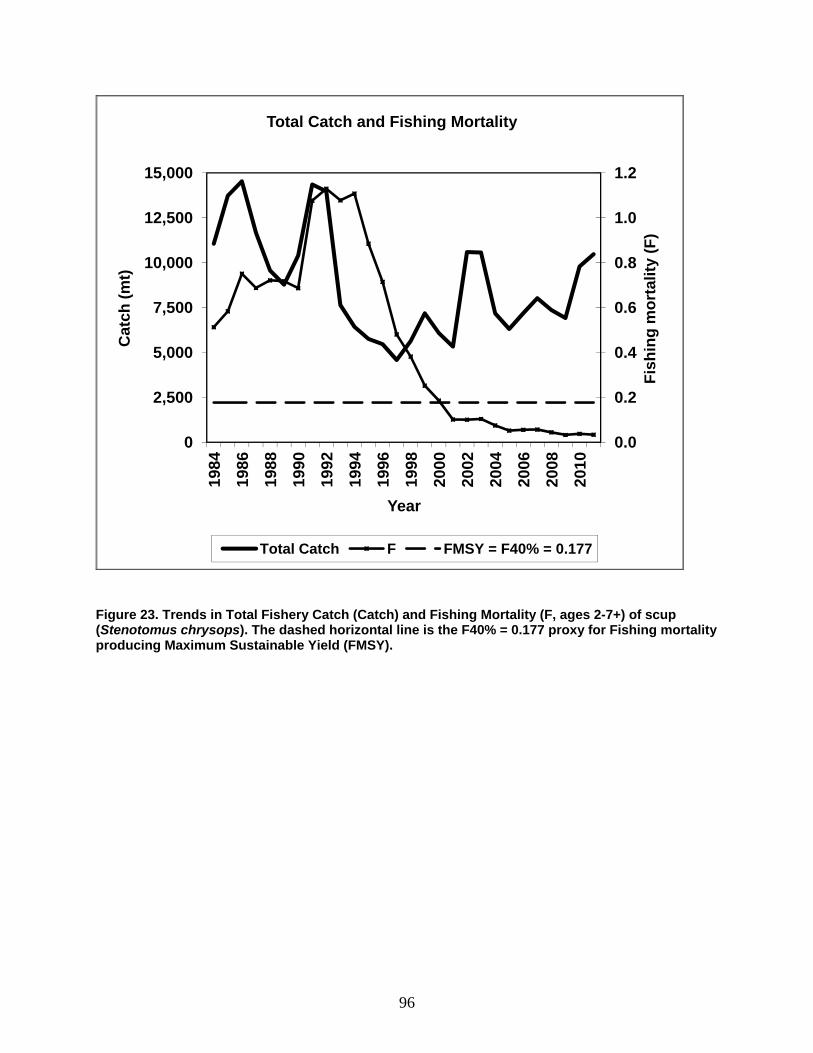
96
Figure 23. Trends in Total Fishery Catch (Catch) and Fishing Mortality (F, ages 2-7+) of scup (Stenotomus chrysops). The dashed horizontal line is the F40% = 0.177 proxy for Fishing mortality producing Maximum Sustainable Yield (FMSY).
0.0
0.2
0.4
0.6
0.8
1.0
1.2
0
2,500
5,000
7,500
10,000
12,500
15,000
1984
1986
1988
1990
1992
1994
1996
1998
2000
2002
2004
2006
2008
2010
Fis
hin
g m
ort
alit
y (F
)
Cat
ch (
mt)
Year
Total Catch and Fishing Mortality
Total Catch F FMSY = F40% = 0.177
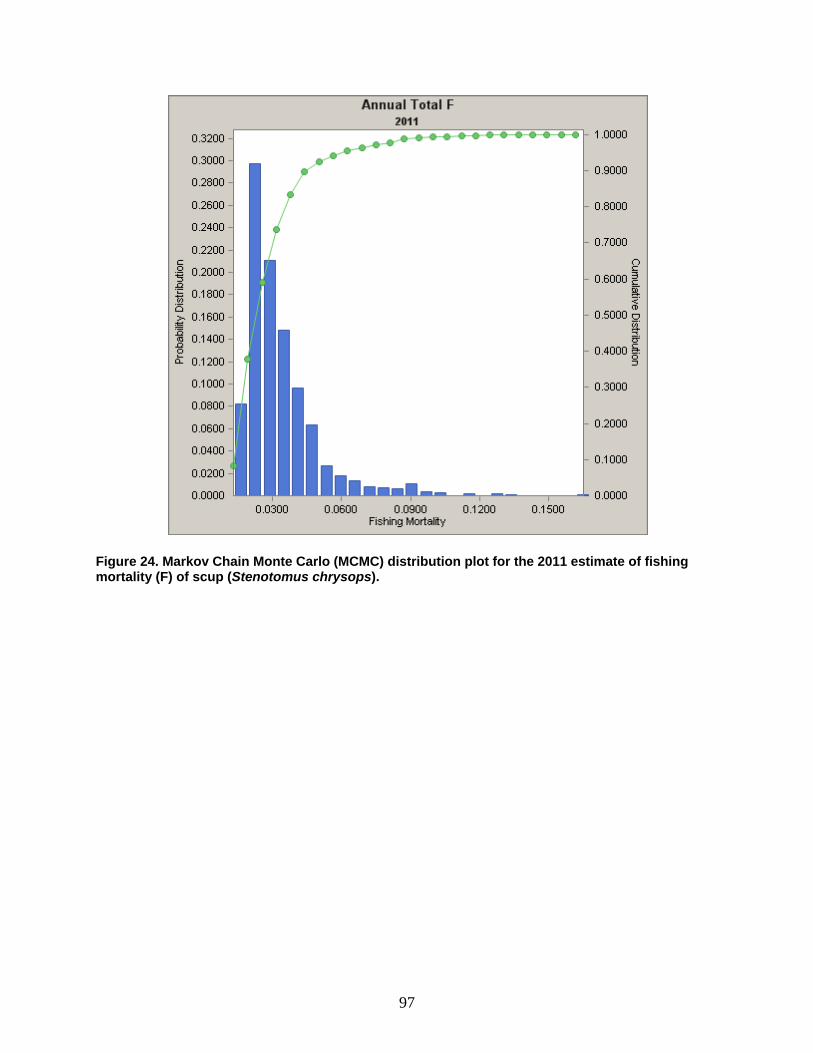
97
Figure 24. Markov Chain Monte Carlo (MCMC) distribution plot for the 2011 estimate of fishing mortality (F) of scup (Stenotomus chrysops).
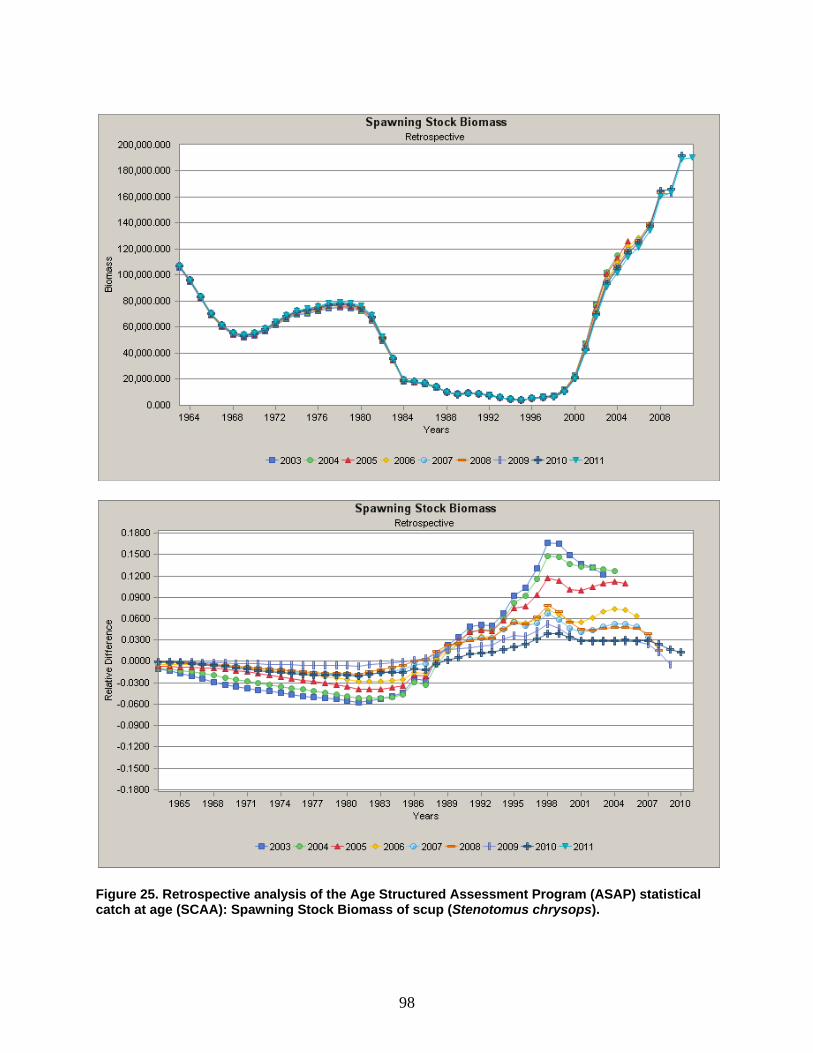
98
Figure 25. Retrospective analysis of the Age Structured Assessment Program (ASAP) statistical catch at age (SCAA): Spawning Stock Biomass of scup (Stenotomus chrysops).
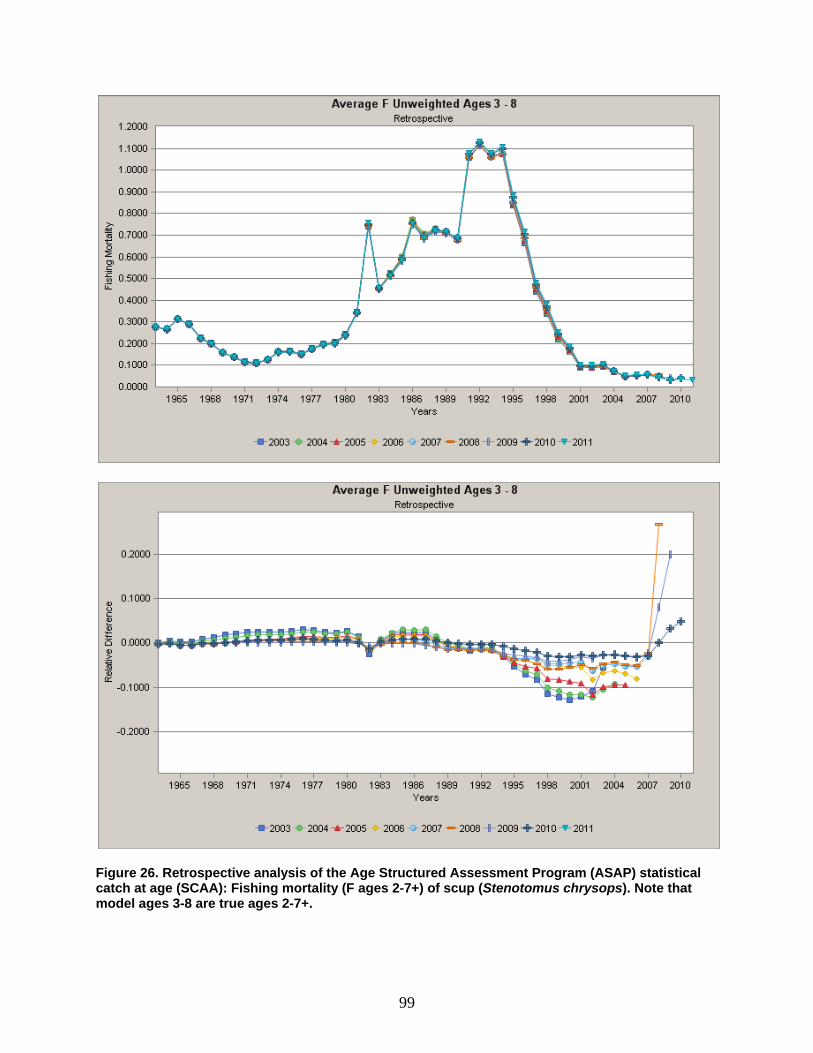
99
Figure 26. Retrospective analysis of the Age Structured Assessment Program (ASAP) statistical catch at age (SCAA): Fishing mortality (F ages 2-7+) of scup (Stenotomus chrysops). Note that model ages 3-8 are true ages 2-7+.
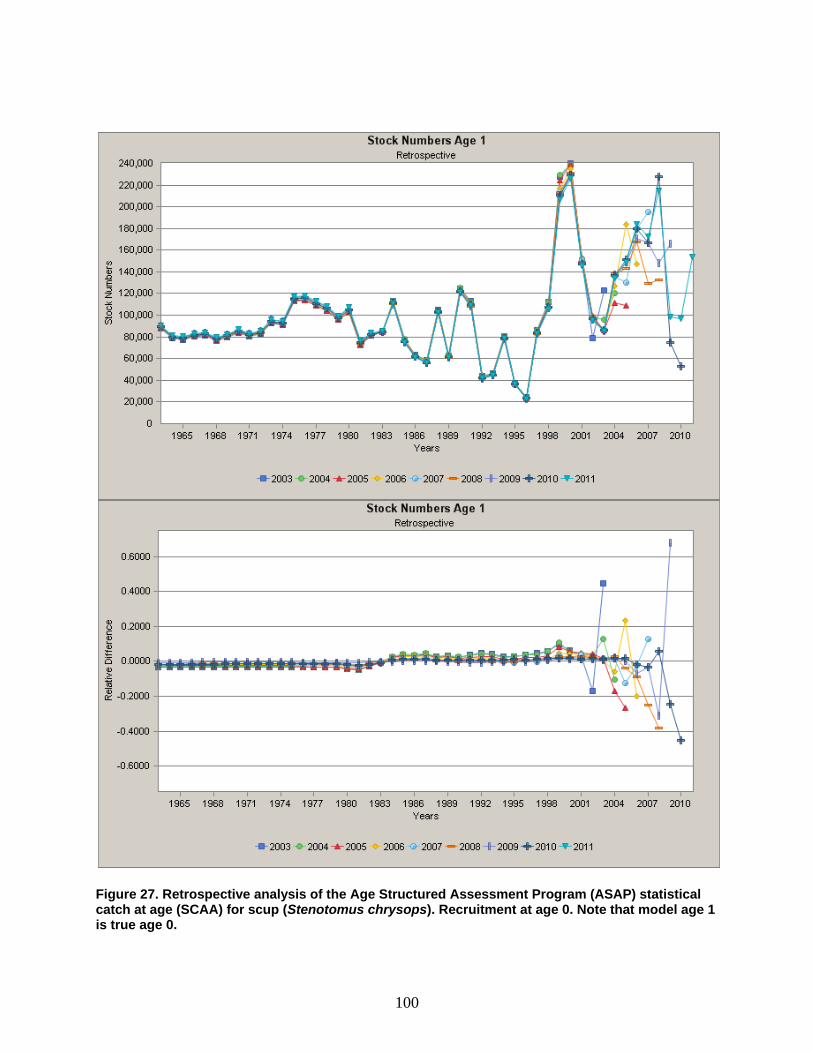
100
Figure 27. Retrospective analysis of the Age Structured Assessment Program (ASAP) statistical catch at age (SCAA) for scup (Stenotomus chrysops). Recruitment at age 0. Note that model age 1 is true age 0.
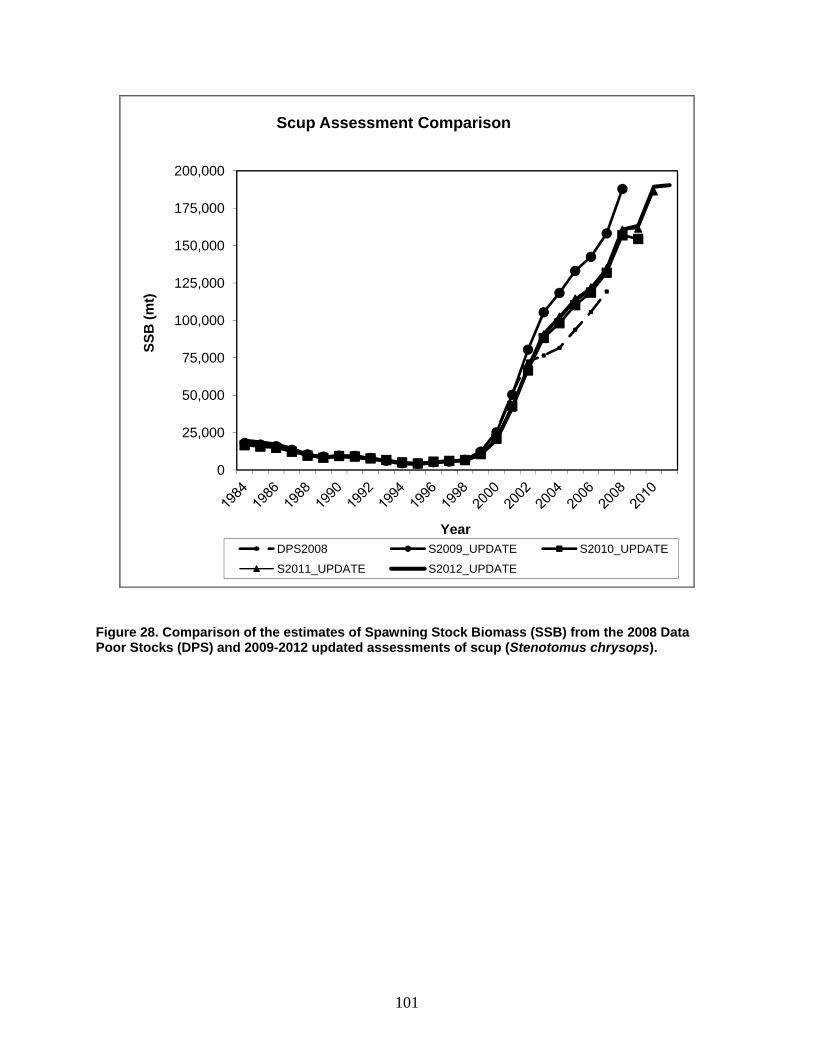
101
Figure 28. Comparison of the estimates of Spawning Stock Biomass (SSB) from the 2008 Data Poor Stocks (DPS) and 2009-2012 updated assessments of scup (Stenotomus chrysops).
0
25,000
50,000
75,000
100,000
125,000
150,000
175,000
200,000
SS
B (
mt)
Year
Scup Assessment Comparison
DPS2008 S2009_UPDATE S2010_UPDATE
S2011_UPDATE S2012_UPDATE
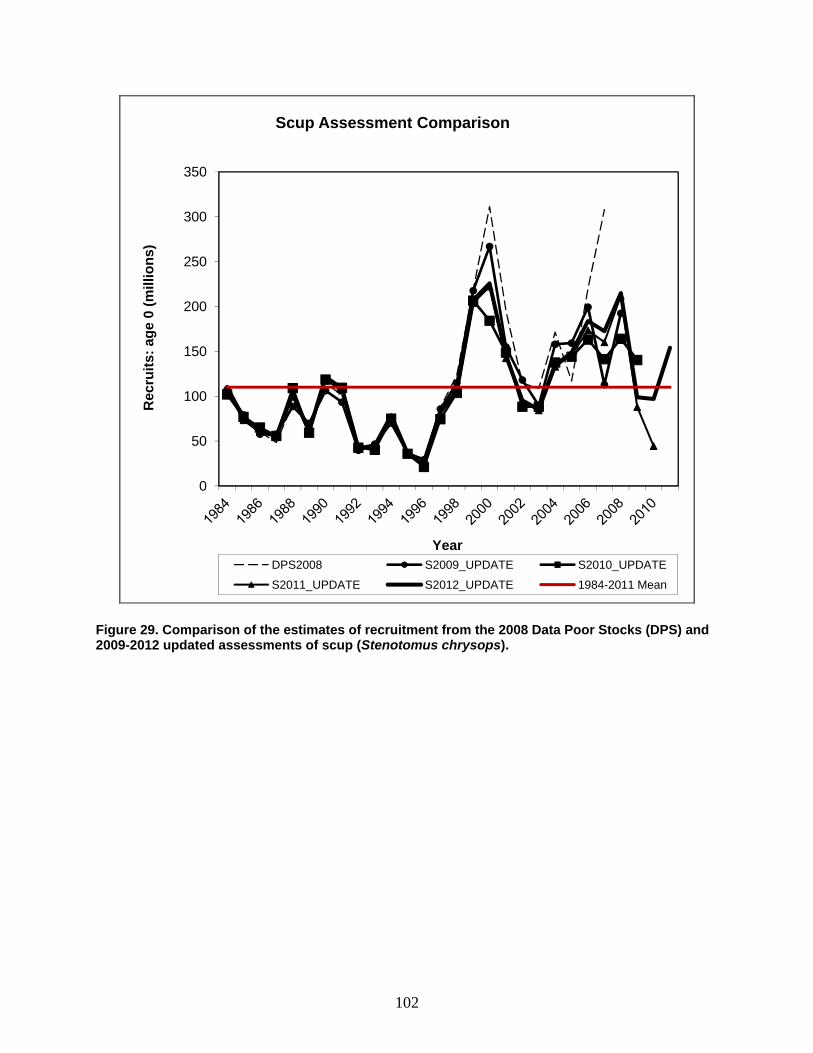
102
Figure 29. Comparison of the estimates of recruitment from the 2008 Data Poor Stocks (DPS) and 2009-2012 updated assessments of scup (Stenotomus chrysops).
0
50
100
150
200
250
300
350
Rec
ruit
s: a
ge
0 (m
illio
ns)
Year
Scup Assessment Comparison
DPS2008 S2009_UPDATE S2010_UPDATE
S2011_UPDATE S2012_UPDATE 1984-2011 Mean
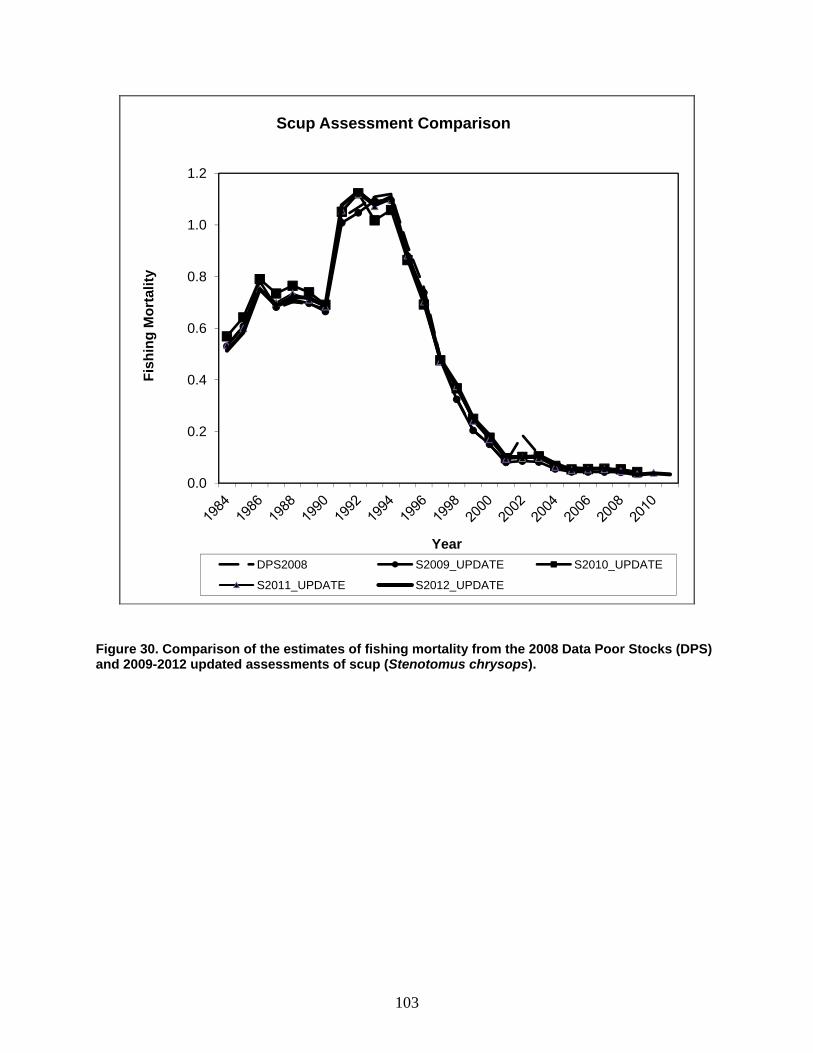
103
Figure 30. Comparison of the estimates of fishing mortality from the 2008 Data Poor Stocks (DPS) and 2009-2012 updated assessments of scup (Stenotomus chrysops).
0.0
0.2
0.4
0.6
0.8
1.0
1.2
Fis
hin
g M
ort
alit
y
Year
Scup Assessment Comparison
DPS2008 S2009_UPDATE S2010_UPDATE
S2011_UPDATE S2012_UPDATE
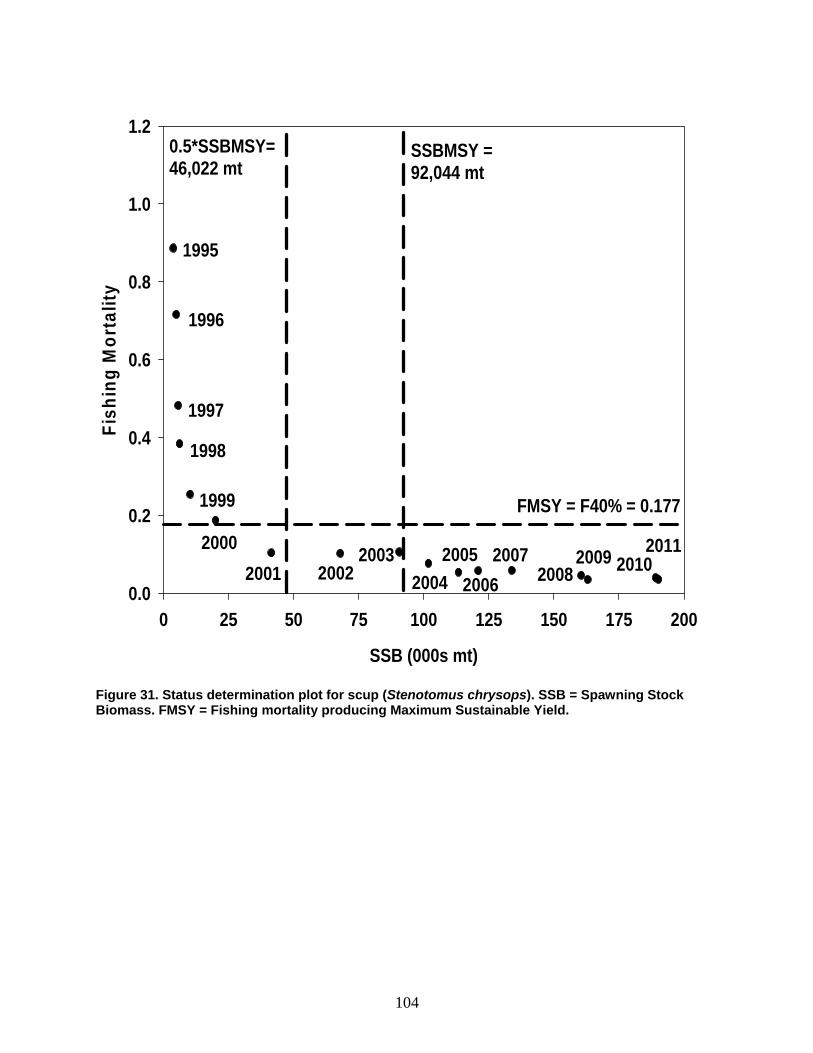
104
SSB (000s mt)
0 25 50 75 100 125 150 175 200
Fis
hin
g M
ort
alit
y
0.0
0.2
0.4
0.6
0.8
1.0
1.2
FMSY = F40% = 0.177
0.5*SSBMSY= 46,022 mt
SSBMSY = 92,044 mt
1996
1997
1998
1999
2000
2001 20022003
2004
2005
2006
2007 2009
1995
2008 20102011
Figure 31. Status determination plot for scup (Stenotomus chrysops). SSB = Spawning Stock Biomass. FMSY = Fishing mortality producing Maximum Sustainable Yield.
Procedures for Issuing Manuscriptsin the
Northeast Fisheries Science Center Reference Document (CRD) Series
Clearance All manuscripts submitted for issuance as CRDs must have cleared the NEFSC’s manuscript/abstract/webpage review process. If any author is not a federal employee, he/she will be required to sign an “NEFSC Release-of-Copyright Form.” If your manuscript includes material from another work which has been copyrighted, then you will need to work with the NEFSC’s Editorial Office to arrange for permission to use that material by securing release signatures on the “NEFSC Use-of-Copyrighted-Work Permission Form.” For more information, NEFSC authors should see the NEFSC’s online publication policy manual, “Manu-script/abstract/webpage preparation, review, and dis-semination: NEFSC author’s guide to policy, process, and procedure,” located in the Publications/Manuscript Review section of the NEFSC intranet page.
Organization Manuscripts must have an abstract and table of contents, and (if applicable) lists of figures and tables. As much as possible, use traditional scientific manu-script organization for sections: “Introduction,” “Study Area” and/or ”Experimental Apparatus,” “Methods,” “Results,” “Discussion,” “Conclusions,” “Acknowl-edgments,” and “Literature/References Cited.”
Style The CRD series is obligated to conform with the style contained in the current edition of the United States Government Printing Office Style Manual. That style manual is silent on many aspects of scientific manuscripts. The CRD series relies more on the CSE Style Manual. Manuscripts should be prepared to conform with these style manuals. The CRD series uses the American Fisheries Soci-ety’s guides to names of fishes, mollusks, and decapod
crustaceans, the Society for Marine Mammalogy’s guide to names of marine mammals, the Biosciences Information Service’s guide to serial title abbreviations, and the ISO’s (International Standardization Organiza-tion) guide to statistical terms. For in-text citation, use the name-date system. A special effort should be made to ensure that all neces-sary bibliographic information is included in the list of cited works. Personal communications must include date, full name, and full mailing address of the con-tact.
Preparation Once your document has cleared the review pro-cess, the Editorial Office will contact you with publica-tion needs – for example, revised text (if necessary) and separate digital figures and tables if they are embedded in the document. Materials may be submitted to the Editorial Office as files on zip disks or CDs, email attachments, or intranet downloads. Text files should be in Microsoft Word, tables may be in Word or Excel, and graphics files may be in a variety of formats (JPG, GIF, Excel, PowerPoint, etc.).
Production and Distribution The Editorial Office will perform a copy-edit of the document and may request further revisions. The Editorial Office will develop the inside and outside front covers, the inside and outside back covers, and the title and bibliographic control pages of the docu-ment. Once both the PDF (print) and Web versions of the CRD are ready, the Editorial Office will contact you to review both versions and submit corrections or changes before the document is posted online. A number of organizations and individuals in the Northeast Region will be notified by e-mail of the availability of the document online.
Research Communications BranchNortheast Fisheries Science Center
National Marine Fisheries Service, NOAA166 Water St.
Woods Hole, MA 02543-1026
Publications and Reportsof the
Northeast Fisheries Science CenterThe mission of NOAA’s National Marine Fisheries Service (NMFS) is “stewardship of living marine resources for the benefit of the nation through their science-based conservation and management and promotion of the health of their environment.” As the research arm of the NMFS’s Northeast Region, the Northeast Fisheries Science Center (NEFSC) supports the NMFS mission by “conducting ecosystem-based research and assess-ments of living marine resources, with a focus on the Northeast Shelf, to promote the recovery and long-term sustainability of these resources and to generate social and economic opportunities and benefits from their use.” Results of NEFSC research are largely reported in primary scientific media (e.g., anonymously-peer-reviewed scientific journals). However, to assist itself in providing data, information, and advice to its constituents, the NEFSC occasionally releases its results in its own media. Currently, there are three such media:
NOAA Technical Memorandum NMFS-NE -- This series is issued irregularly. The series typically includes: data reports of long-term field or lab studies of important species or habitats; synthesis reports for important species or habitats; annual reports of overall assessment or monitoring programs; manuals describing program-wide surveying or experimental techniques; literature surveys of important species or habitat topics; proceedings and collected papers of scientific meetings; and indexed and/or annotated bibliographies. All issues receive internal scientific review and most issues receive technical and copy editing.
Northeast Fisheries Science Center Reference Document -- This series is issued irregularly. The series typically includes: data reports on field and lab studies; progress reports on experiments, monitoring, and assessments; background papers for, collected abstracts of, and/or summary reports of scientific meetings; and simple bibliographies. Issues receive internal scientific review and most issues receive copy editing.
Resource Survey Report (formerly Fishermen’s Report) -- This information report is a regularly-issued, quick-turnaround report on the distribution and relative abundance of selected living marine resources as derived from each of the NEFSC’s periodic research ves-sel surveys of the Northeast’s continental shelf. This report undergoes internal review, but receives no technical or copy editing.
TO OBTAIN A COPY of a NOAA Technical Memorandum NMFS-NE or a Northeast Fisheries Science Center Reference Document, either contact the NEFSC Editorial Office (166 Water St., Woods Hole, MA 02543-1026; 508-495-2350) or consult the NEFSC webpage on “Reports and Publications” (http://www.nefsc.noaa.gov/nefsc/publications/). To access Resource Survey Report, consult the Ecosystem Surveys Branch webpage (http://www.nefsc.noaa.gov/femad/ecosurvey/mainpage/).
ANY USE OF TRADE OR BRAND NAMES IN ANY NEFSC PUBLICATION OR REPORT DOES NOT IMPLY ENDORSE-MENT.
MEDIA MAIL