stochastic gene expression - duke...
TRANSCRIPT
CHAPTER 8
The Biology of Genetic Dominance, edited by Reiner A. Veitia. ©2004 Eurekah.com.
Stochastic Gene Expression:Dominance, Thresholds and Boundaries
H. Frederik Nijhout
Abstract
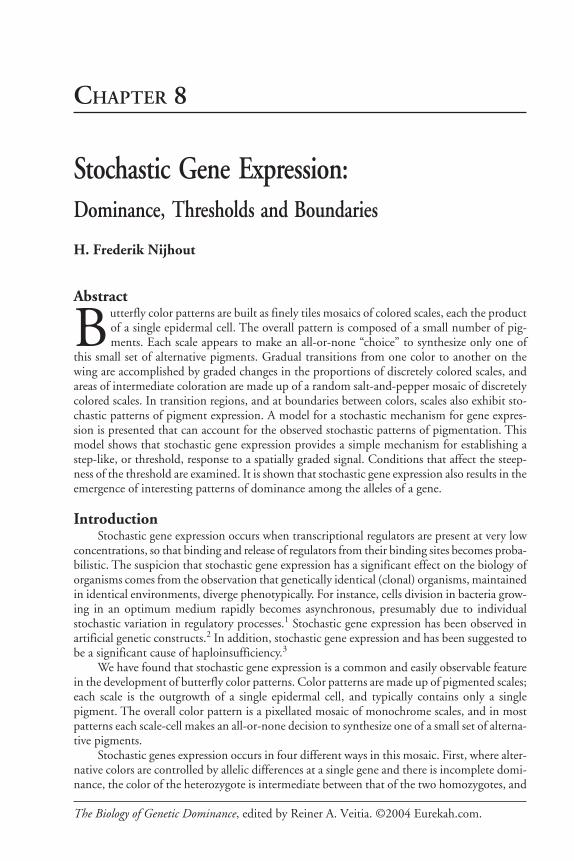
Butterfly color patterns are built as finely tiles mosaics of colored scales, each the productof a single epidermal cell. The overall pattern is composed of a small number of pig-ments. Each scale appears to make an all-or-none “choice” to synthesize only one of
this small set of alternative pigments. Gradual transitions from one color to another on thewing are accomplished by graded changes in the proportions of discretely colored scales, andareas of intermediate coloration are made up of a random salt-and-pepper mosaic of discretelycolored scales. In transition regions, and at boundaries between colors, scales also exhibit sto-chastic patterns of pigment expression. A model for a stochastic mechanism for gene expres-sion is presented that can account for the observed stochastic patterns of pigmentation. Thismodel shows that stochastic gene expression provides a simple mechanism for establishing astep-like, or threshold, response to a spatially graded signal. Conditions that affect the steep-ness of the threshold are examined. It is shown that stochastic gene expression also results in theemergence of interesting patterns of dominance among the alleles of a gene.
IntroductionStochastic gene expression occurs when transcriptional regulators are present at very low
concentrations, so that binding and release of regulators from their binding sites becomes proba-bilistic. The suspicion that stochastic gene expression has a significant effect on the biology oforganisms comes from the observation that genetically identical (clonal) organisms, maintainedin identical environments, diverge phenotypically. For instance, cells division in bacteria grow-ing in an optimum medium rapidly becomes asynchronous, presumably due to individualstochastic variation in regulatory processes.1 Stochastic gene expression has been observed inartificial genetic constructs.2 In addition, stochastic gene expression and has been suggested tobe a significant cause of haploinsufficiency.3
We have found that stochastic gene expression is a common and easily observable featurein the development of butterfly color patterns. Color patterns are made up of pigmented scales;each scale is the outgrowth of a single epidermal cell, and typically contains only a singlepigment. The overall color pattern is a pixellated mosaic of monochrome scales, and in mostpatterns each scale-cell makes an all-or-none decision to synthesize one of a small set of alterna-tive pigments.
Stochastic genes expression occurs in four different ways in this mosaic. First, where alter-native colors are controlled by allelic differences at a single gene and there is incomplete domi-nance, the color of the heterozygote is intermediate between that of the two homozygotes, and
The Biology of Genetic Dominance2
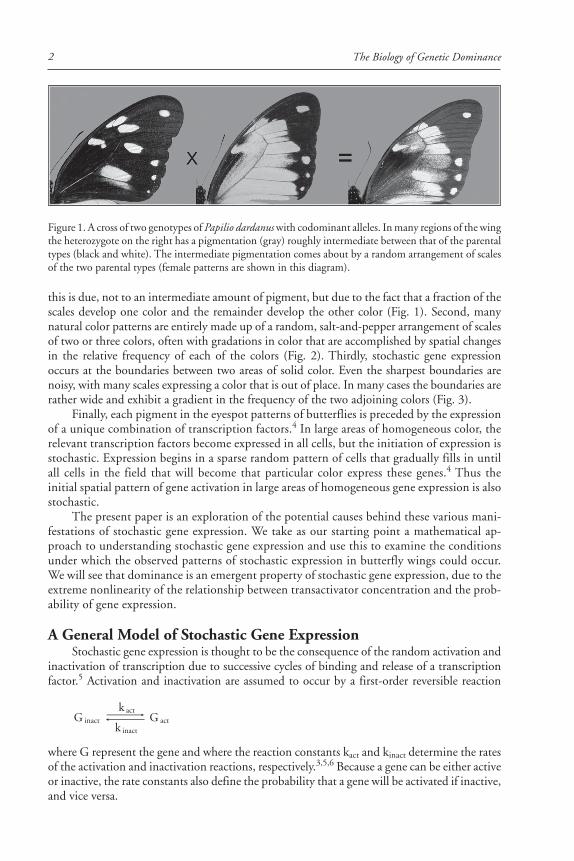
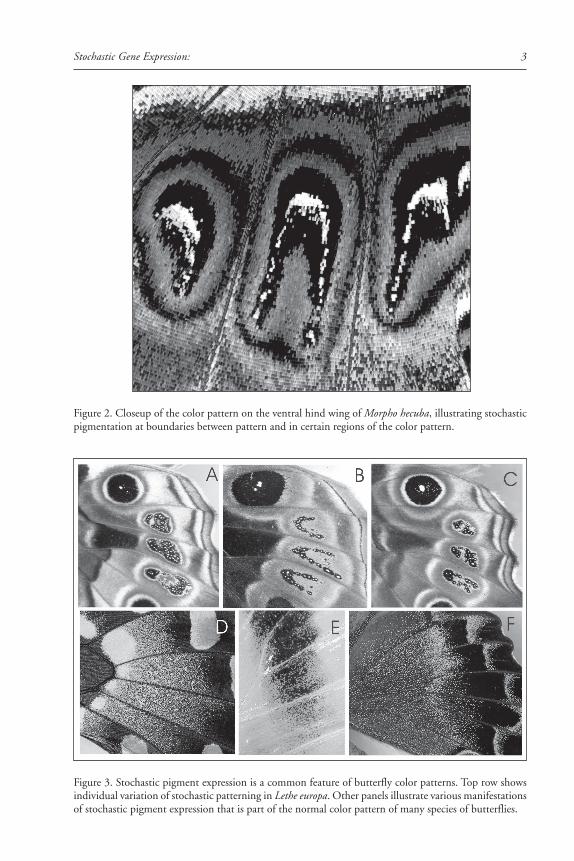
this is due, not to an intermediate amount of pigment, but due to the fact that a fraction of thescales develop one color and the remainder develop the other color (Fig. 1). Second, manynatural color patterns are entirely made up of a random, salt-and-pepper arrangement of scalesof two or three colors, often with gradations in color that are accomplished by spatial changesin the relative frequency of each of the colors (Fig. 2). Thirdly, stochastic gene expressionoccurs at the boundaries between two areas of solid color. Even the sharpest boundaries arenoisy, with many scales expressing a color that is out of place. In many cases the boundaries arerather wide and exhibit a gradient in the frequency of the two adjoining colors (Fig. 3).
Finally, each pigment in the eyespot patterns of butterflies is preceded by the expressionof a unique combination of transcription factors.4 In large areas of homogeneous color, therelevant transcription factors become expressed in all cells, but the initiation of expression isstochastic. Expression begins in a sparse random pattern of cells that gradually fills in untilall cells in the field that will become that particular color express these genes.4 Thus theinitial spatial pattern of gene activation in large areas of homogeneous gene expression is alsostochastic.
The present paper is an exploration of the potential causes behind these various mani-festations of stochastic gene expression. We take as our starting point a mathematical ap-proach to understanding stochastic gene expression and use this to examine the conditionsunder which the observed patterns of stochastic expression in butterfly wings could occur.We will see that dominance is an emergent property of stochastic gene expression, due to theextreme nonlinearity of the relationship between transactivator concentration and the prob-ability of gene expression.
A General Model of Stochastic Gene ExpressionStochastic gene expression is thought to be the consequence of the random activation and
inactivation of transcription due to successive cycles of binding and release of a transcriptionfactor.5 Activation and inactivation are assumed to occur by a first-order reversible reaction
G
k
k Ginact
act
inact act
where G represent the gene and where the reaction constants kact and kinact determine the ratesof the activation and inactivation reactions, respectively.3,5,6 Because a gene can be either activeor inactive, the rate constants also define the probability that a gene will be activated if inactive,and vice versa.
Figure 1. A cross of two genotypes of Papilio dardanus with codominant alleles. In many regions of the wingthe heterozygote on the right has a pigmentation (gray) roughly intermediate between that of the parentaltypes (black and white). The intermediate pigmentation comes about by a random arrangement of scalesof the two parental types (female patterns are shown in this diagram).
3Stochastic Gene Expression:
Figure 3. Stochastic pigment expression is a common feature of butterfly color patterns. Top row showsindividual variation of stochastic patterning in Lethe europa. Other panels illustrate various manifestationsof stochastic pigment expression that is part of the normal color pattern of many species of butterflies.
Figure 2. Closeup of the color pattern on the ventral hind wing of Morpho hecuba, illustrating stochasticpigmentation at boundaries between pattern and in certain regions of the color pattern.
The Biology of Genetic Dominance4
If the probability of gene activation is uniform overt time, then the time between activa-tion events will have an exponential distribution given by the probability density function
f(t) = e-t/b/b, (1)
and the probability that an event has occurred is given by cumulative density function
F(t)= 1- e-t/b, (2)
where b is the mean time between events. Among the properties of an exponential distribu-tion is that the standard deviation is the same as the mean, and the median time betweenevents is the half-time of the reaction: t1/2 = ln2*b = 0.693*b. If gene activation occurs as afirst-order reaction
G
k G , so that dG /dt = k * Ginact
act act act act inact (3)
then kact = 1/b. The rate constant for the activation reaction thus defines the half-time of geneactivation. For example, if kact = 10-4 sec-1, then t1/2 = 6930 seconds: about 2 hours. The halftime of activation is the average time required for half of the genes in a sample to be comeactivated, or, in the case of single cells, the average time required for one of the two alleles of agene to become activated. For all simulations reported here time is in arbitrary units (t), rateconstants (ks) are in units of t-1. The value of G can be either 0 (Ginact) or 1 (Gact), and theprobability of the 0 → 1 switch is kact = 1/b = k1. The effective value of the rate constant isproportional to ploidy. Thus a diploid has two copies of the gene and thus is able to producetwice as much product in a given period of time. So diploidy can be modeled by doubling thevalue of kact (assuming both alleles respond identically to the activator) and the consequencesfor the exponential distribution can be deduced from equation.1
A gene becomes inactivated by (1) the removal of a transcriptional activator, or by (2) thebinding of a transcriptional inhibitor. Like gene activation, these two kinds of inactivationevents can also be stochastic. The effects of the two types of inactivation events are presumablyindependent of each other, so we assume that kinact is the sum of the stochastic rate of removalof the transcriptional activator and the stochastic rate of binding of a transcriptional inhibitor(kinact = kact-off + kinh-on). The fraction of time a gene is active is given by kact/(kact+kinact). Thisratio also gives the fraction of cells in which a gene is active at any given time.
We follow ref. 3 in assuming that the activated gene produces a gene product (P) via afirst-order mechanism, and that this product decays at a rate proportional to its concentration:
dP/dt = k3*Gact – k4*P. (4)
In diploid individuals two genes (G1 and G2) contribute independently to the synthesis ofproduct, so the rate becomes
dP/dt = k3*(G1act + G2act) – k4*P. (5)
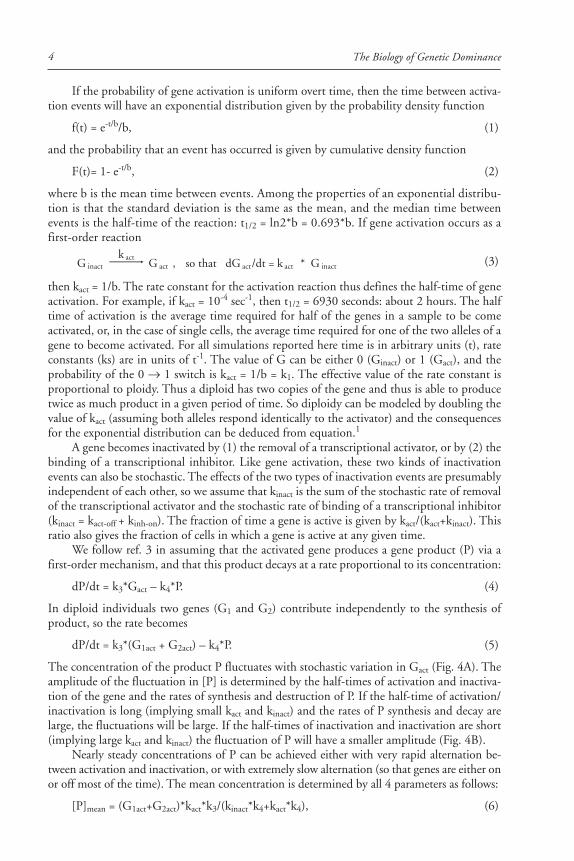
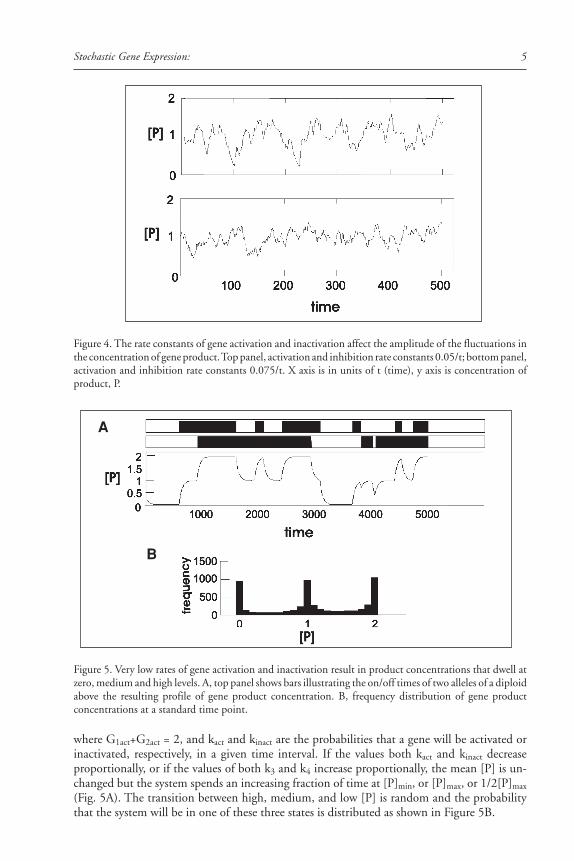
The concentration of the product P fluctuates with stochastic variation in Gact (Fig. 4A). Theamplitude of the fluctuation in [P] is determined by the half-times of activation and inactiva-tion of the gene and the rates of synthesis and destruction of P. If the half-time of activation/inactivation is long (implying small kact and kinact) and the rates of P synthesis and decay arelarge, the fluctuations will be large. If the half-times of inactivation and inactivation are short(implying large kact and kinact) the fluctuation of P will have a smaller amplitude (Fig. 4B).
Nearly steady concentrations of P can be achieved either with very rapid alternation be-tween activation and inactivation, or with extremely slow alternation (so that genes are either onor off most of the time). The mean concentration is determined by all 4 parameters as follows:
[P]mean = (G1act+G2act)*kact*k3/(kinact*k4+kact*k4), (6)
5Stochastic Gene Expression:
Figure 4. The rate constants of gene activation and inactivation affect the amplitude of the fluctuations inthe concentration of gene product. Top panel, activation and inhibition rate constants 0.05/t; bottom panel,activation and inhibition rate constants 0.075/t. X axis is in units of t (time), y axis is concentration ofproduct, P.
where G1act+G2act = 2, and kact and kinact are the probabilities that a gene will be activated orinactivated, respectively, in a given time interval. If the values both kact and kinact decreaseproportionally, or if the values of both k3 and k4 increase proportionally, the mean [P] is un-changed but the system spends an increasing fraction of time at [P]min, or [P]max, or 1/2[P]max
(Fig. 5A). The transition between high, medium, and low [P] is random and the probabilitythat the system will be in one of these three states is distributed as shown in Figure 5B.
A
B
Figure 5. Very low rates of gene activation and inactivation result in product concentrations that dwell atzero, medium and high levels. A, top panel shows bars illustrating the on/off times of two alleles of a diploidabove the resulting profile of gene product concentration. B, frequency distribution of gene productconcentrations at a standard time point.
The Biology of Genetic Dominance6
Stabilizing Gene ExpressionWe are concerned with two patterns of stochastic gene expression. The first one is in the
stochastic initiation of gene expression in a field where gene expression will eventually becomehomogeneous in all cells. The second is stochastic gene activation that leads to a salt-and-pepperpattern of two alternative stable states of gene expression in different cells (Fig. 2). In both casesit is necessary to turn a randomly fluctuating level of P into a stable state of gene expression thatis spatially either homogeneous or heterogeneous. In the case of color patterns, the level of Pmust unambiguously specify one or another pigment synthesis pathway, so there must be atime point in development when the state of a gene becomes fixed.
One way of stabilizing initially stochastic expression is if the state of gene activation is“read” at a specific point in time, so that the state at that time (active or inactive) becomesfixed. A simple and possibly common way to do this is if [P] activates a process that makesfurther fluctuation in [P] irrelevant. P could, for instance, be a transcription factor that acti-vates another gene with a more stable activation kinetics. Such a mechanism would require thatthe response to P behave as a threshold, so that P has no effect below the threshold concentra-tion, and a full activating effect above the threshold. The value of the threshold would thendetermine the fraction of cells that express the phenotype specified by high levels of P. Forinstance, if the threshold is below the range of fluctuation of [P], all cells will express thephenotype, and if the threshold is above the range of fluctuation of [P], none will. A thresholdwithin the range of variation in [P] will results in a random expression of alternative pheno-types in different cells. In this scenario, the mechanism that controls the threshold effectivelycontrols the degree of stochasticity of the final pattern.
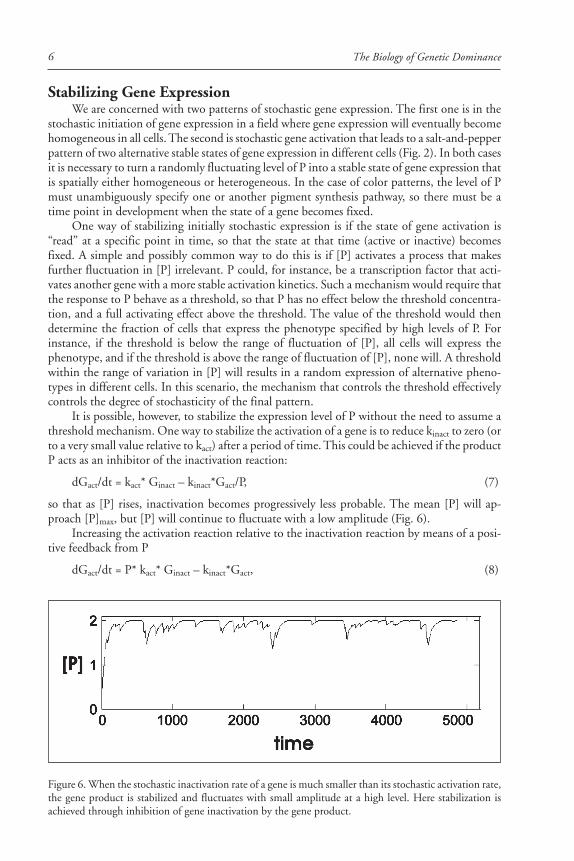
It is possible, however, to stabilize the expression level of P without the need to assume athreshold mechanism. One way to stabilize the activation of a gene is to reduce kinact to zero (orto a very small value relative to kact) after a period of time. This could be achieved if the productP acts as an inhibitor of the inactivation reaction:
dGact/dt = kact* Ginact – kinact*Gact/P, (7)
so that as [P] rises, inactivation becomes progressively less probable. The mean [P] will ap-proach [P]max, but [P] will continue to fluctuate with a low amplitude (Fig. 6).
Increasing the activation reaction relative to the inactivation reaction by means of a posi-tive feedback from P
dGact/dt = P* kact* Ginact – kinact*Gact, (8)
Figure 6. When the stochastic inactivation rate of a gene is much smaller than its stochastic activation rate,the gene product is stabilized and fluctuates with small amplitude at a high level. Here stabilization isachieved through inhibition of gene inactivation by the gene product.
7Stochastic Gene Expression:
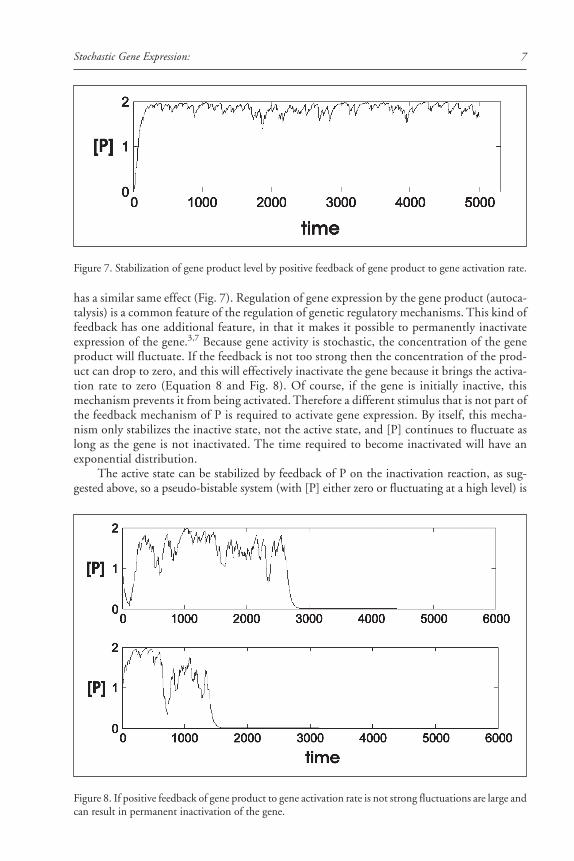
has a similar same effect (Fig. 7). Regulation of gene expression by the gene product (autoca-talysis) is a common feature of the regulation of genetic regulatory mechanisms. This kind offeedback has one additional feature, in that it makes it possible to permanently inactivateexpression of the gene.3,7 Because gene activity is stochastic, the concentration of the geneproduct will fluctuate. If the feedback is not too strong then the concentration of the prod-uct can drop to zero, and this will effectively inactivate the gene because it brings the activa-tion rate to zero (Equation 8 and Fig. 8). Of course, if the gene is initially inactive, thismechanism prevents it from being activated. Therefore a different stimulus that is not part ofthe feedback mechanism of P is required to activate gene expression. By itself, this mecha-nism only stabilizes the inactive state, not the active state, and [P] continues to fluctuate aslong as the gene is not inactivated. The time required to become inactivated will have anexponential distribution.
The active state can be stabilized by feedback of P on the inactivation reaction, as sug-gested above, so a pseudo-bistable system (with [P] either zero or fluctuating at a high level) is
Figure 8. If positive feedback of gene product to gene activation rate is not strong fluctuations are large andcan result in permanent inactivation of the gene.
Figure 7. Stabilization of gene product level by positive feedback of gene product to gene activation rate.
The Biology of Genetic Dominance8
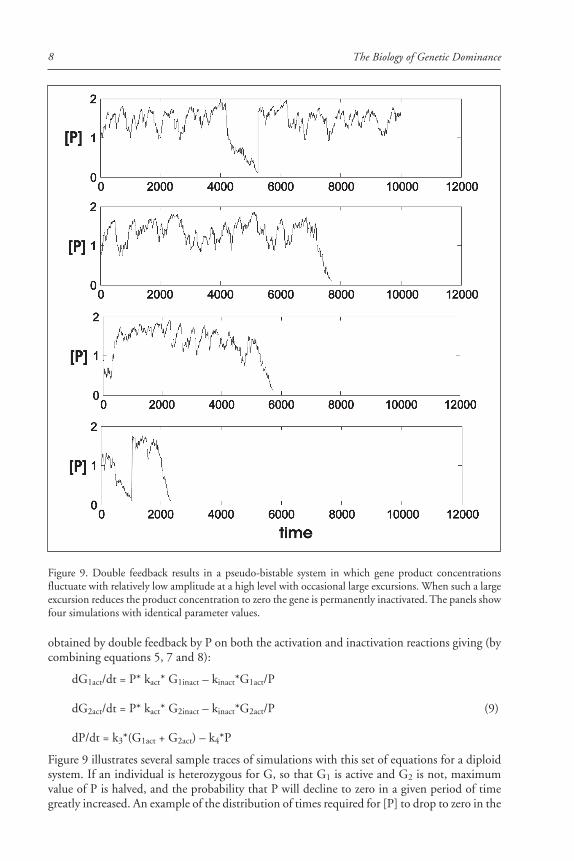
obtained by double feedback by P on both the activation and inactivation reactions giving (bycombining equations 5, 7 and 8):
dG1act/dt = P* kact* G1inact – kinact*G1act/P
dG2act/dt = P* kact* G2inact – kinact*G2act/P (9)
dP/dt = k3*(G1act + G2act) – k4*P
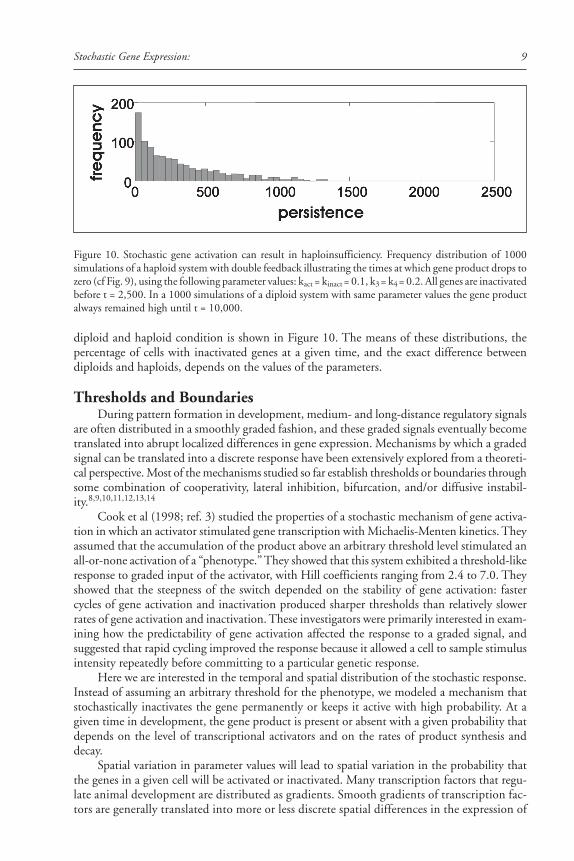
Figure 9 illustrates several sample traces of simulations with this set of equations for a diploidsystem. If an individual is heterozygous for G, so that G1 is active and G2 is not, maximumvalue of P is halved, and the probability that P will decline to zero in a given period of timegreatly increased. An example of the distribution of times required for [P] to drop to zero in the
Figure 9. Double feedback results in a pseudo-bistable system in which gene product concentrationsfluctuate with relatively low amplitude at a high level with occasional large excursions. When such a largeexcursion reduces the product concentration to zero the gene is permanently inactivated. The panels showfour simulations with identical parameter values.
9Stochastic Gene Expression:
diploid and haploid condition is shown in Figure 10. The means of these distributions, thepercentage of cells with inactivated genes at a given time, and the exact difference betweendiploids and haploids, depends on the values of the parameters.
Thresholds and BoundariesDuring pattern formation in development, medium- and long-distance regulatory signals
are often distributed in a smoothly graded fashion, and these graded signals eventually becometranslated into abrupt localized differences in gene expression. Mechanisms by which a gradedsignal can be translated into a discrete response have been extensively explored from a theoreti-cal perspective. Most of the mechanisms studied so far establish thresholds or boundaries throughsome combination of cooperativity, lateral inhibition, bifurcation, and/or diffusive instabil-ity.8,9,10,11,12,13,14
Cook et al (1998; ref. 3) studied the properties of a stochastic mechanism of gene activa-tion in which an activator stimulated gene transcription with Michaelis-Menten kinetics. Theyassumed that the accumulation of the product above an arbitrary threshold level stimulated anall-or-none activation of a “phenotype.” They showed that this system exhibited a threshold-likeresponse to graded input of the activator, with Hill coefficients ranging from 2.4 to 7.0. Theyshowed that the steepness of the switch depended on the stability of gene activation: fastercycles of gene activation and inactivation produced sharper thresholds than relatively slowerrates of gene activation and inactivation. These investigators were primarily interested in exam-ining how the predictability of gene activation affected the response to a graded signal, andsuggested that rapid cycling improved the response because it allowed a cell to sample stimulusintensity repeatedly before committing to a particular genetic response.
Here we are interested in the temporal and spatial distribution of the stochastic response.Instead of assuming an arbitrary threshold for the phenotype, we modeled a mechanism thatstochastically inactivates the gene permanently or keeps it active with high probability. At agiven time in development, the gene product is present or absent with a given probability thatdepends on the level of transcriptional activators and on the rates of product synthesis anddecay.
Spatial variation in parameter values will lead to spatial variation in the probability thatthe genes in a given cell will be activated or inactivated. Many transcription factors that regu-late animal development are distributed as gradients. Smooth gradients of transcription fac-tors are generally translated into more or less discrete spatial differences in the expression of
Figure 10. Stochastic gene activation can result in haploinsufficiency. Frequency distribution of 1000simulations of a haploid system with double feedback illustrating the times at which gene product drops tozero (cf Fig. 9), using the following parameter values: kact = kinact = 0.1, k3 = k4 = 0.2. All genes are inactivatedbefore t = 2,500. In a 1000 simulations of a diploid system with same parameter values the gene productalways remained high until t = 10,000.
The Biology of Genetic Dominance10
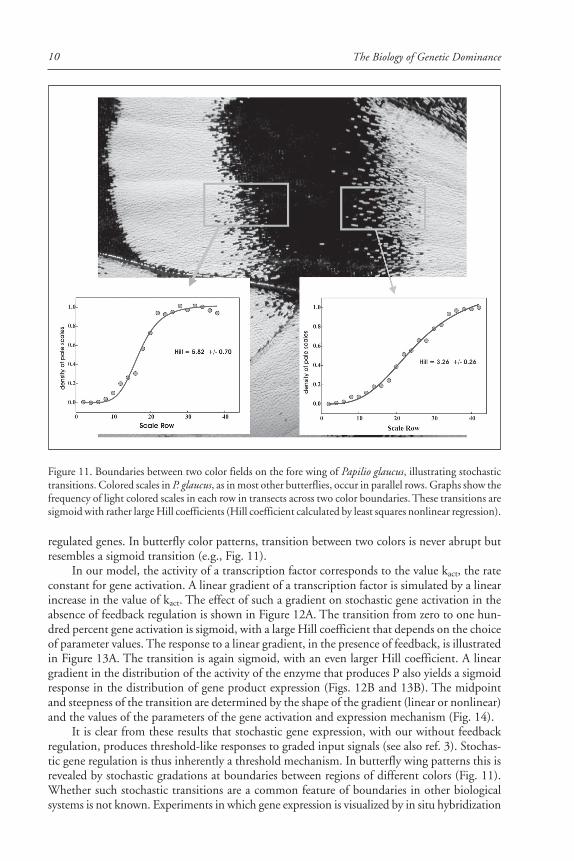
regulated genes. In butterfly color patterns, transition between two colors is never abrupt butresembles a sigmoid transition (e.g., Fig. 11).
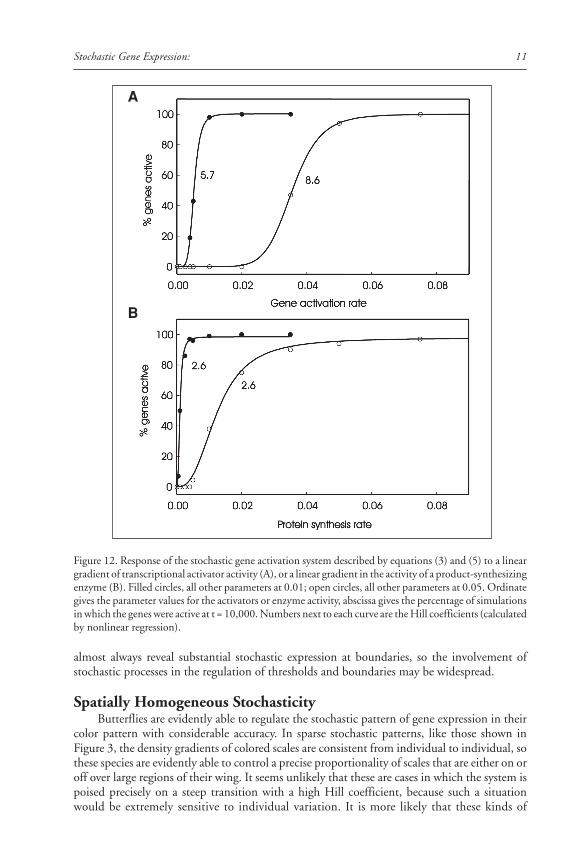
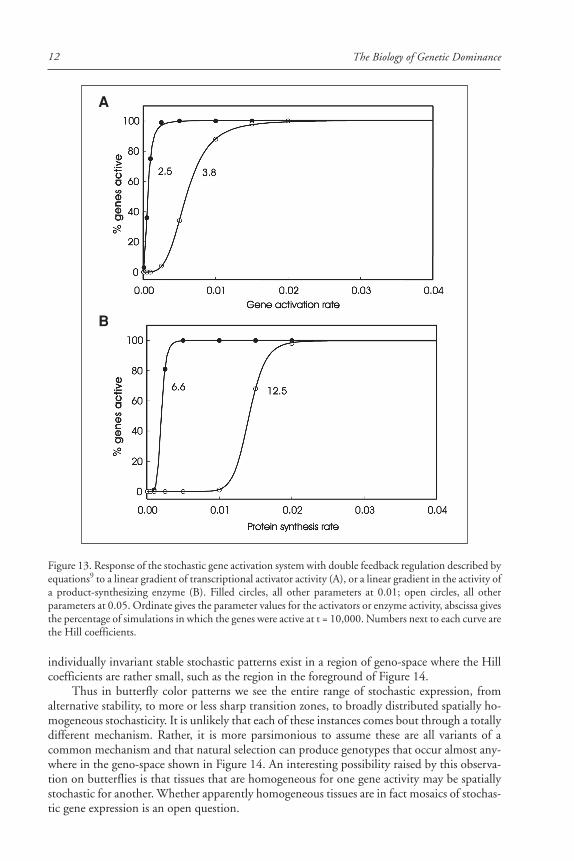
In our model, the activity of a transcription factor corresponds to the value kact, the rateconstant for gene activation. A linear gradient of a transcription factor is simulated by a linearincrease in the value of kact. The effect of such a gradient on stochastic gene activation in theabsence of feedback regulation is shown in Figure 12A. The transition from zero to one hun-dred percent gene activation is sigmoid, with a large Hill coefficient that depends on the choiceof parameter values. The response to a linear gradient, in the presence of feedback, is illustratedin Figure 13A. The transition is again sigmoid, with an even larger Hill coefficient. A lineargradient in the distribution of the activity of the enzyme that produces P also yields a sigmoidresponse in the distribution of gene product expression (Figs. 12B and 13B). The midpointand steepness of the transition are determined by the shape of the gradient (linear or nonlinear)and the values of the parameters of the gene activation and expression mechanism (Fig. 14).
It is clear from these results that stochastic gene expression, with our without feedbackregulation, produces threshold-like responses to graded input signals (see also ref. 3). Stochas-tic gene regulation is thus inherently a threshold mechanism. In butterfly wing patterns this isrevealed by stochastic gradations at boundaries between regions of different colors (Fig. 11).Whether such stochastic transitions are a common feature of boundaries in other biologicalsystems is not known. Experiments in which gene expression is visualized by in situ hybridization
Figure 11. Boundaries between two color fields on the fore wing of Papilio glaucus, illustrating stochastictransitions. Colored scales in P. glaucus, as in most other butterflies, occur in parallel rows. Graphs show thefrequency of light colored scales in each row in transects across two color boundaries. These transitions aresigmoid with rather large Hill coefficients (Hill coefficient calculated by least squares nonlinear regression).
11Stochastic Gene Expression:
almost always reveal substantial stochastic expression at boundaries, so the involvement ofstochastic processes in the regulation of thresholds and boundaries may be widespread.
Spatially Homogeneous StochasticityButterflies are evidently able to regulate the stochastic pattern of gene expression in their
color pattern with considerable accuracy. In sparse stochastic patterns, like those shown inFigure 3, the density gradients of colored scales are consistent from individual to individual, sothese species are evidently able to control a precise proportionality of scales that are either on oroff over large regions of their wing. It seems unlikely that these are cases in which the system ispoised precisely on a steep transition with a high Hill coefficient, because such a situationwould be extremely sensitive to individual variation. It is more likely that these kinds of
A
B
Figure 12. Response of the stochastic gene activation system described by equations (3) and (5) to a lineargradient of transcriptional activator activity (A), or a linear gradient in the activity of a product-synthesizingenzyme (B). Filled circles, all other parameters at 0.01; open circles, all other parameters at 0.05. Ordinategives the parameter values for the activators or enzyme activity, abscissa gives the percentage of simulationsin which the genes were active at t = 10,000. Numbers next to each curve are the Hill coefficients (calculatedby nonlinear regression).
The Biology of Genetic Dominance12
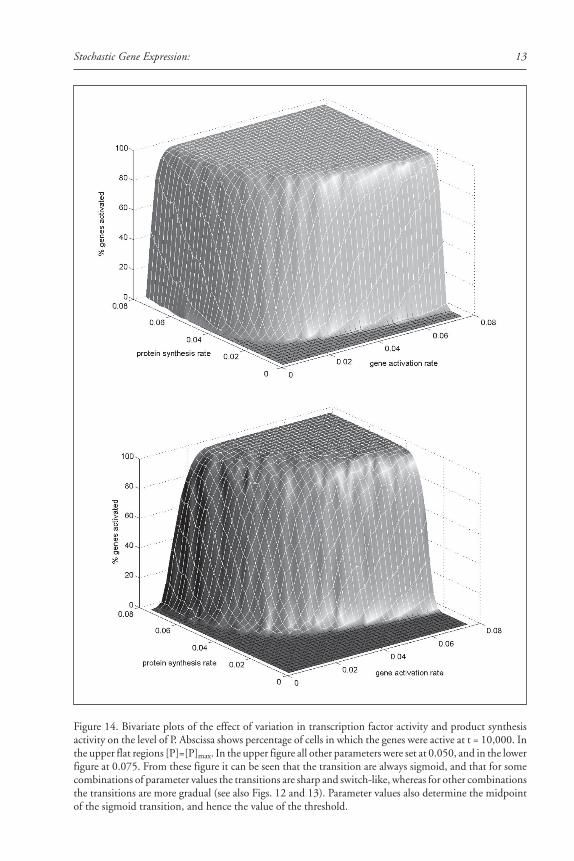
individually invariant stable stochastic patterns exist in a region of geno-space where the Hillcoefficients are rather small, such as the region in the foreground of Figure 14.
Thus in butterfly color patterns we see the entire range of stochastic expression, fromalternative stability, to more or less sharp transition zones, to broadly distributed spatially ho-mogeneous stochasticity. It is unlikely that each of these instances comes bout through a totallydifferent mechanism. Rather, it is more parsimonious to assume these are all variants of acommon mechanism and that natural selection can produce genotypes that occur almost any-where in the geno-space shown in Figure 14. An interesting possibility raised by this observa-tion on butterflies is that tissues that are homogeneous for one gene activity may be spatiallystochastic for another. Whether apparently homogeneous tissues are in fact mosaics of stochas-tic gene expression is an open question.
A
B
Figure 13. Response of the stochastic gene activation system with double feedback regulation described byequations9 to a linear gradient of transcriptional activator activity (A), or a linear gradient in the activity ofa product-synthesizing enzyme (B). Filled circles, all other parameters at 0.01; open circles, all otherparameters at 0.05. Ordinate gives the parameter values for the activators or enzyme activity, abscissa givesthe percentage of simulations in which the genes were active at t = 10,000. Numbers next to each curve arethe Hill coefficients.
13Stochastic Gene Expression:
Figure 14. Bivariate plots of the effect of variation in transcription factor activity and product synthesisactivity on the level of P. Abscissa shows percentage of cells in which the genes were active at t = 10,000. Inthe upper flat regions [P]=[P]max. In the upper figure all other parameters were set at 0.050, and in the lowerfigure at 0.075. From these figure it can be seen that the transition are always sigmoid, and that for somecombinations of parameter values the transitions are sharp and switch-like, whereas for other combinationsthe transitions are more gradual (see also Figs. 12 and 13). Parameter values also determine the midpointof the sigmoid transition, and hence the value of the threshold.
The Biology of Genetic Dominance14
DominanceDominance is an emergent property of the mechanism by which a gene affects the value
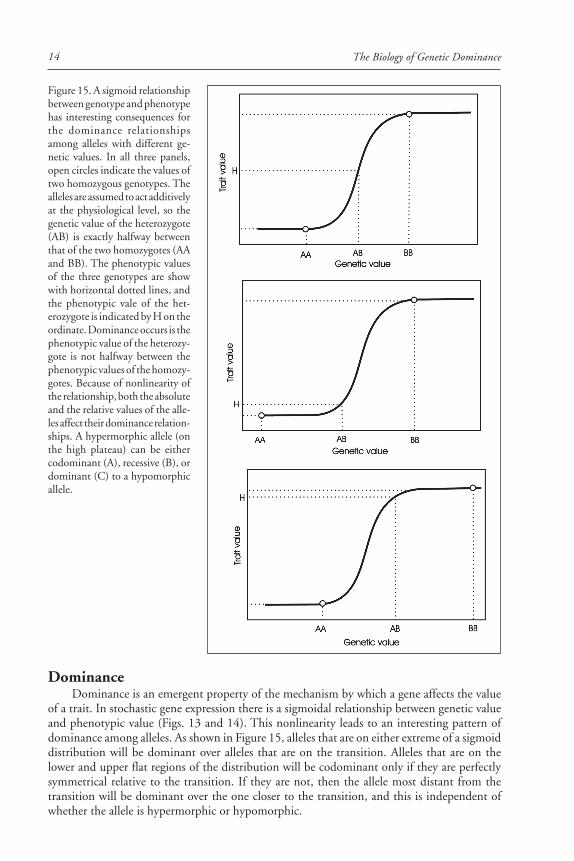
of a trait. In stochastic gene expression there is a sigmoidal relationship between genetic valueand phenotypic value (Figs. 13 and 14). This nonlinearity leads to an interesting pattern ofdominance among alleles. As shown in Figure 15, alleles that are on either extreme of a sigmoiddistribution will be dominant over alleles that are on the transition. Alleles that are on thelower and upper flat regions of the distribution will be codominant only if they are perfectlysymmetrical relative to the transition. If they are not, then the allele most distant from thetransition will be dominant over the one closer to the transition, and this is independent ofwhether the allele is hypermorphic or hypomorphic.
Figure 15. A sigmoid relationshipbetween genotype and phenotypehas interesting consequences forthe dominance relationshipsamong alleles with different ge-netic values. In all three panels,open circles indicate the values oftwo homozygous genotypes. Thealleles are assumed to act additivelyat the physiological level, so thegenetic value of the heterozygote(AB) is exactly halfway betweenthat of the two homozygotes (AAand BB). The phenotypic valuesof the three genotypes are showwith horizontal dotted lines, andthe phenotypic vale of the het-erozygote is indicated by H on theordinate. Dominance occurs is thephenotypic value of the heterozy-gote is not halfway between thephenotypic values of the homozy-gotes. Because of nonlinearity ofthe relationship, both the absoluteand the relative values of the alle-les affect their dominance relation-ships. A hypermorphic allele (onthe high plateau) can be eithercodominant (A), recessive (B), ordominant (C) to a hypomorphicallele.
15Stochastic Gene Expression:
Haploinsufficiency in the presence of a null-allele occurs if the remaining ‘active’ allele hasa value that is less than twice the value of the transition midpoint. As can be seen in Figure 14,the value of this midpoint depends on the other genes in the system, so haploinsufficiency is aproperty of the entire genotype.
Evolution of dominance can occur either by mutational changes in the target gene or bychanges in the genetic background.15 Mutational changes can be represented by the generationof new allelic values along the curve that describes the relationship between genotype andphenotype (e.g., Fig. 15). Changes in the genetic background, by contrast, change the shape ofthe genotype-phenotype curved, in effect changing the slope and inflection point of the sig-moid (for instance the shapes of the curves parallel to the x-axis depend on their position alongthe y axis in Fig. 14; here the gene represented by the y axis provides the genetic background forthe gene represented by the x axis, and vice versa).
Alleles that are located the high or low plateaus of Figure 15 are not under selection,because their variation does not contribute to phenotypic variation. It is unlikely, therefore,that selection on alleles of the focal gene will contribute significantly to the evolution of domi-nance of that gene, particularly in regions where the transition between the low and highplateaus is very sharp. It is thus more likely that evolution of dominance in systems that aregoverned by stochastic gene expression occurs by evolution of the genetic background.
References1. McAdams HH, Arkin A. Stochastic mechanisms in gene expression. Proc Natl Acad Sci USA 1997;
94:814-819.2. Elowitz MB, Levine AJ, Siggia ED et al. Stochastic gene expression in a single cell. Science 2002;
297:1183-1186.3. Cook DL, Gerber AN, Tapscott SJ. Modeling stochastic gene expression: Implications for
haploinsufficiency. Proc Natl Acad Sci USA 1998; 95:15641-15646.4. Brunetti C, Paddock S, Carroll S. The generation and diversification of butterfly eyespot color
patterns. Curr Biol 2001; 11:1578–1585.5. Ko MSH. Induction mechanisms of a single gene molecule: Stochastic or deterministic? BioEssays
1992; 14:341-346.6. Ko MSH. A stochastic model for gene induction. J Theoret Biol 1991; 153:181-194.7. Kepler TB, Elston TC. Stochasticity in transcriptional regulation: Origins, consequences, and math-
ematical representations. Biophys J 2001; 81:3116-3136.8. Turing AM. The chemical basis of morphogenesis. Ser B, London: Phil Trans Roy Soc, 1952;
237:37-72.9. Lewis J, Slack JMW, Wolpert L. Thresholds in development. J Theor Biol 1977; 65:579-590.
10. Meinhardt H. Models of Biological Pattern Formation. London: Academic Press, 1982.11. Meinhardt H. Models for positional signaling with applications to the dorsoventral patterning of
insects and segregation into different cell types. Development 1989; (Suppl):169-180.12. Meinhardt H. Organizers and axes formation as a self-organizing process. Int J Dev Biol 2001;
45:177-188.13. Oster GF. Lateral inhibition models of developmental processes. Math Biosci 1988; 90:265-286.14. Murray JD. Mathematical Biology. New York: Springer-Verlag, 1989.15. Gilchrist MA, Nijhout HF. Nonlinear developmental processes as sources of dominance. Genetics
2001; 159:423-432.