stifel technology conference - february 2015
TRANSCRIPT
Stifel Technology, Internet & Media Conf.
Germain Lamonde Chairman, President & CEO February 10, 2015
2 © 2015 EXFO Inc. All rights reserved.
Certain statements in this presentation, or given in response to your questions, may constitute forward-looking statements within the meaning of the Securities Act of 1934. The Private Securities Litigation Reform Act of 1995 provides “safe-harbors” for such forward-looking statements and we intend that any forward-looking statements made today be subject to the safe harbors. We caution you that any forward-looking statements are just predictions. They are not guarantees of future performance and involve risks and uncertainties. Actual results may differ materially from those projected in forward-looking statements and we invite you to review the company’s most recent filings with the Securities and Exchange Commission or Canadian securities commissions for a discussion of the factors at risk. These forward-looking statements speak only as of the date of this presentation and, unless required by law or applicable regulations, we will not be reviewing or updating the material that is contained herein.
Annual financial data in this presentation is prepared in accordance with international financial reporting standards (IFRS) and Canadian generally accepted accounting principles (GAAP). Quarterly financial data is prepared in accordance with IFRS. For a reconciliation of adjusted EBITDA to net earnings, refer to the Q1 2015 press release or the “Non-IFRS Measures” section on EXFO’s website.
All amounts in millions of US dollars, except otherwise noted.
Forward-Looking Statements
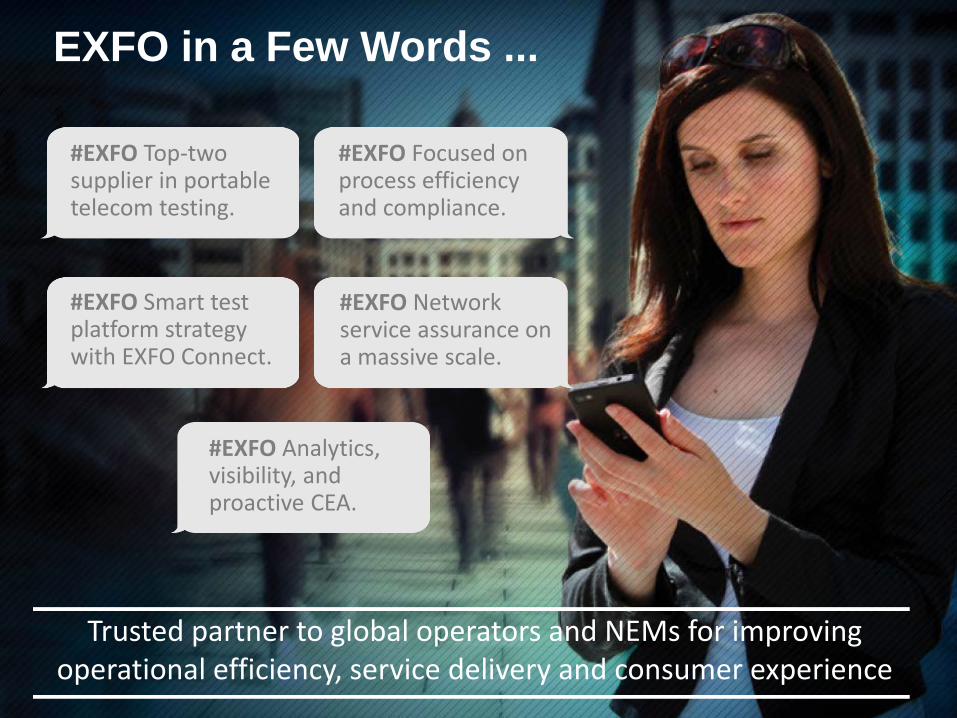
Trusted partner to global operators and NEMs for improving operational efficiency, service delivery and consumer experience
EXFO in a Few Words ...
#EXFO Top-two supplier in portable telecom testing.
#EXFO Network service assurance on a massive scale.
#EXFO Analytics, visibility, and proactive CEA.
#EXFO Smart test platform strategy with EXFO Connect.
#EXFO Focused on process efficiency and compliance.
4 © 2015 EXFO Inc. All rights reserved.
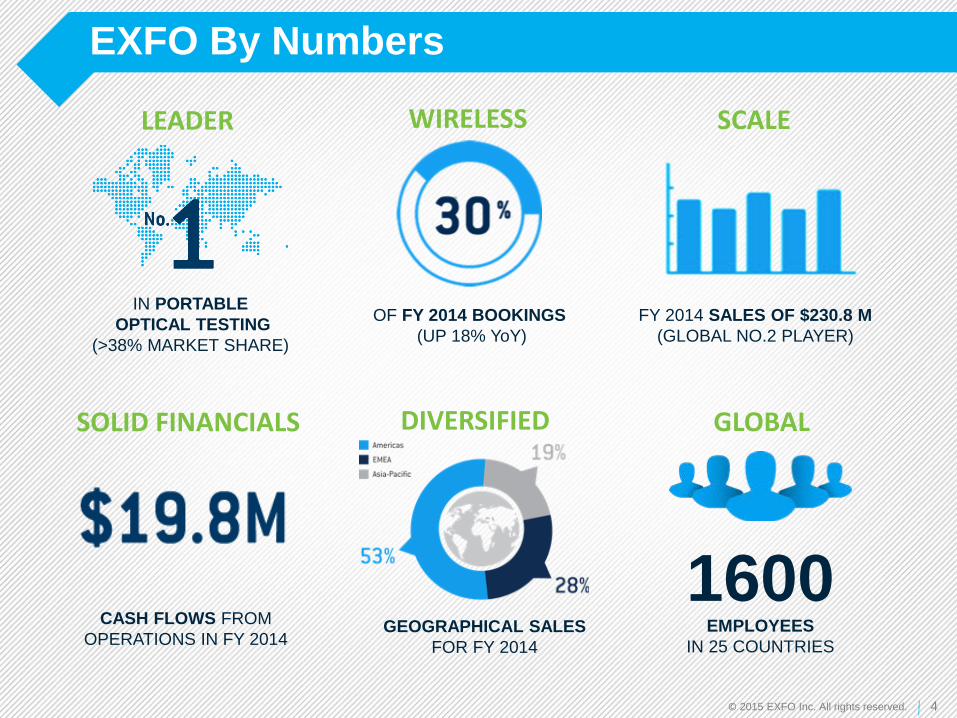
EXFO By Numbers
IN PORTABLE OPTICAL TESTING
(>38% MARKET SHARE)
LEADER
FY 2014 SALES OF $230.8 M (GLOBAL NO.2 PLAYER)
SCALE
CASH FLOWS FROM OPERATIONS IN FY 2014
SOLID FINANCIALS
GEOGRAPHICAL SALES FOR FY 2014
DIVERSIFIED
1600 EMPLOYEES
IN 25 COUNTRIES
GLOBAL
OF FY 2014 BOOKINGS (UP 18% YoY)
WIRELESS
5 © 2014 EXFO Inc. All rights reserved.
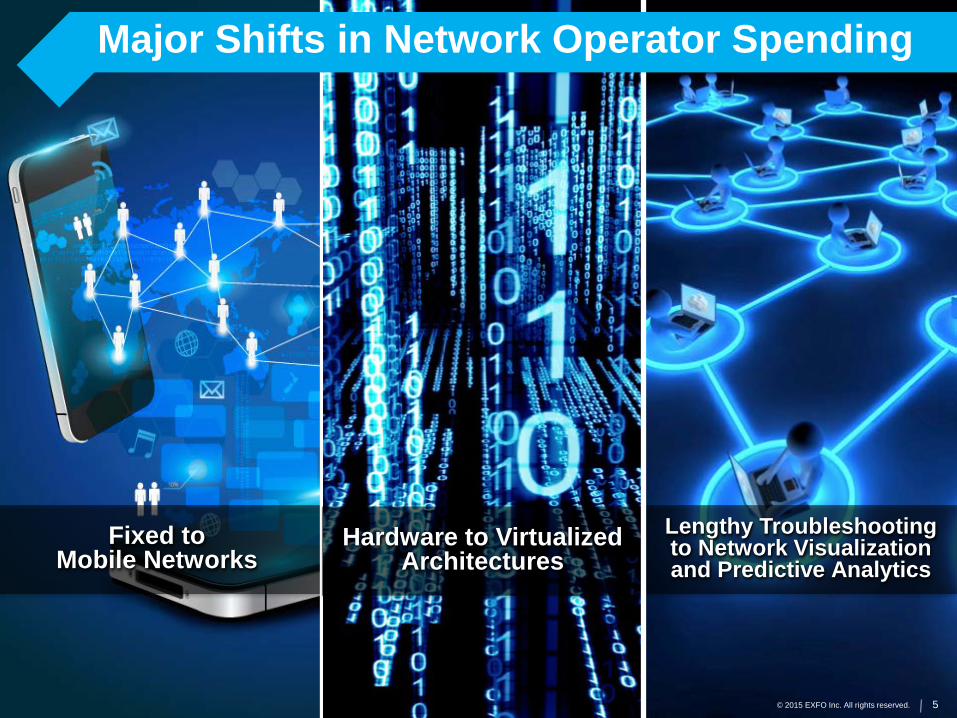
Lengthy Troubleshooting to Network Visualization and Predictive Analytics
Fixed to Mobile Networks
Hardware to Virtualized Architectures
5 © 2015 EXFO Inc. All rights reserved.
Major Shifts in Network Operator Spending
6 © 2015 EXFO Inc. All rights reserved.
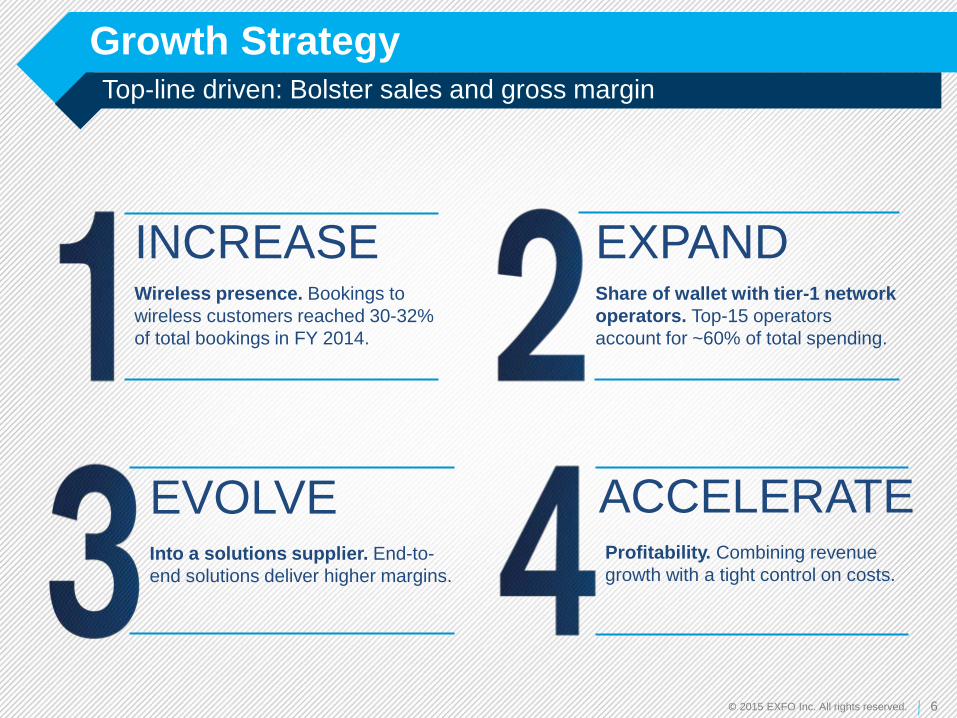
Growth Strategy Top-line driven: Bolster sales and gross margin
INCREASE Wireless presence. Bookings to wireless customers reached 30-32% of total bookings in FY 2014.
EVOLVE Into a solutions supplier. End-to-end solutions deliver higher margins.
ACCELERATE Profitability. Combining revenue growth with a tight control on costs.
EXPAND Share of wallet with tier-1 network operators. Top-15 operators account for ~60% of total spending.
7 © 2015 EXFO Inc. All rights reserved.
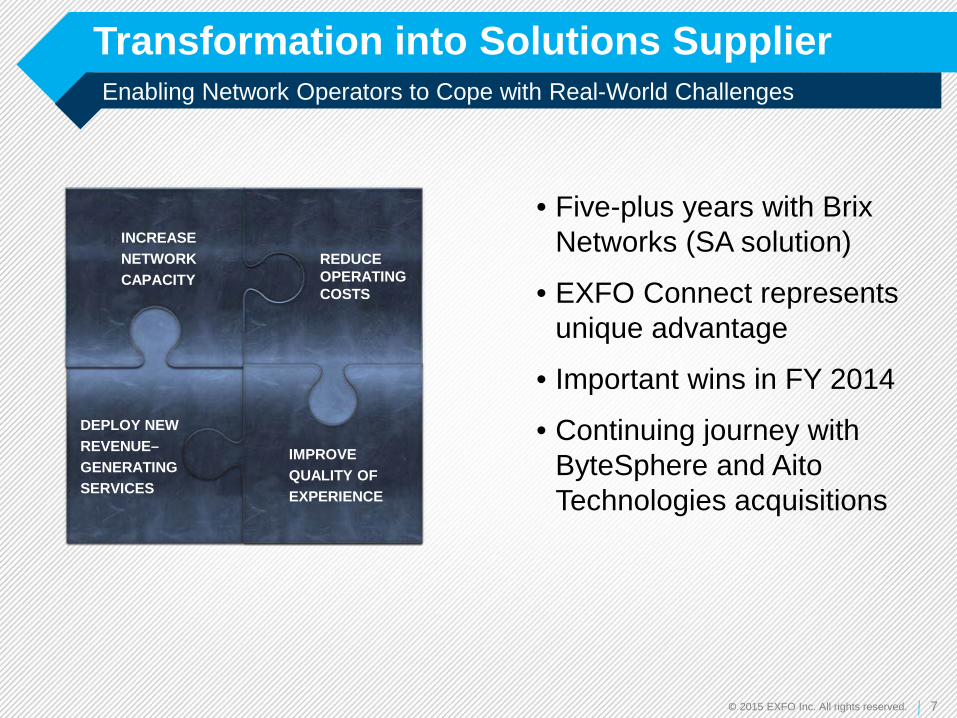
Transformation into Solutions Supplier Enabling Network Operators to Cope with Real-World Challenges
• Five-plus years with Brix Networks (SA solution)
• EXFO Connect represents unique advantage
• Important wins in FY 2014
• Continuing journey with ByteSphere and Aito Technologies acquisitions
DEPLOY NEW REVENUE–GENERATING SERVICES
INCREASE NETWORK CAPACITY
REDUCE OPERATING COSTS
IMPROVE QUALITY OF EXPERIENCE

8 © 2015 EXFO Inc. All rights reserved.
Intelligent Platforms
Contextual Analytics EXFO Connect
Service & Network Assurance
Leveraging Key Assets
9 © 2015 EXFO Inc. All rights reserved. PR
OTO
COL
(Wire
less
, Ser
v. A
ssur
ance
, Tr
ansp
ort &
Dat
acom
)
PHYS
ICAL
(O
ptic
al &
Acc
ess)
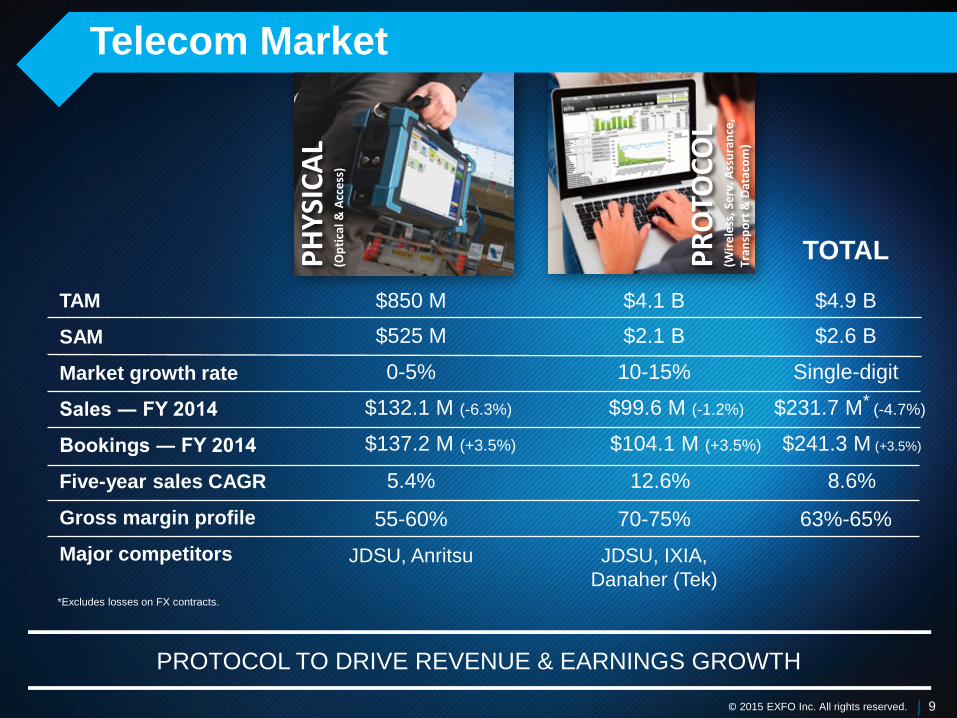
Telecom Market
TAM
SAM
Major competitors
Bookings ― FY 2014
Five-year sales CAGR
Market growth rate
Sales ― FY 2014
Gross margin profile
$850 M $525 M
JDSU, Anritsu
$137.2 M (+3.5%)
5.4%
0-5%
$132.1 M (-6.3%)
55-60%
$4.1 B $2.1 B
JDSU, IXIA, Danaher (Tek)
$104.1 M (+3.5%)
12.6%
10-15%
$99.6 M (-1.2%)
70-75%
PROTOCOL TO DRIVE REVENUE & EARNINGS GROWTH
*Excludes losses on FX contracts.
$4.9 B $2.6 B
$241.3 M (+3.5%)
8.6%
Single-digit
$231.7 M* (-4.7%)
63%-65%
TOTAL

10 © 2015 EXFO Inc. All rights reserved.
Physical-Layer Solutions
COPPER ACCESS › Most advanced product portfolio for
high-speed copper links › MaxTester secured contract wins
with several tier-1 operators › Supports pair bonding & vectoring
(100 Mb/s)
PORTABLE OPTICAL › No. 1 player with >38% market share › Market dominance in OTDR testing › Key differentiator: iOLM software › Market leader in dispersion testing › Unmatched product breadth & depth
11 © 2015 EXFO Inc. All rights reserved.
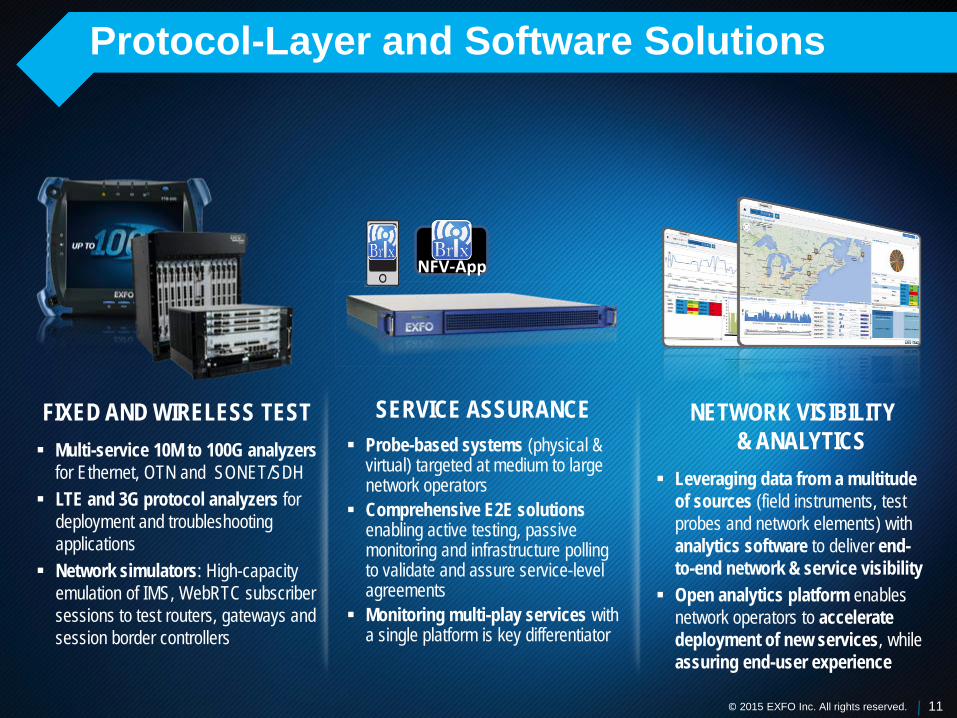
Protocol-Layer and Software Solutions
SERVICE ASSURANCE Probe-based systems (physical &
virtual) targeted at medium to large network operators
Comprehensive E2E solutions enabling active testing, passive monitoring and infrastructure polling to validate and assure service-level agreements
Monitoring multi-play services with a single platform is key differentiator
NETWORK VISIBILITY & ANALYTICS
Leveraging data from a multitude of sources (field instruments, test probes and network elements) with analytics software to deliver end-to-end network & service visibility
Open analytics platform enables network operators to accelerate deployment of new services, while assuring end-user experience
FIXED AND WIRELESS TEST Multi-service 10M to 100G analyzers
for Ethernet, OTN and SONET/SDH LTE and 3G protocol analyzers for
deployment and troubleshooting applications
Network simulators: High-capacity emulation of IMS, WebRTC subscriber sessions to test routers, gateways and session border controllers
NFV-App
12 © 2014 EXFO Inc. All rights reserved.
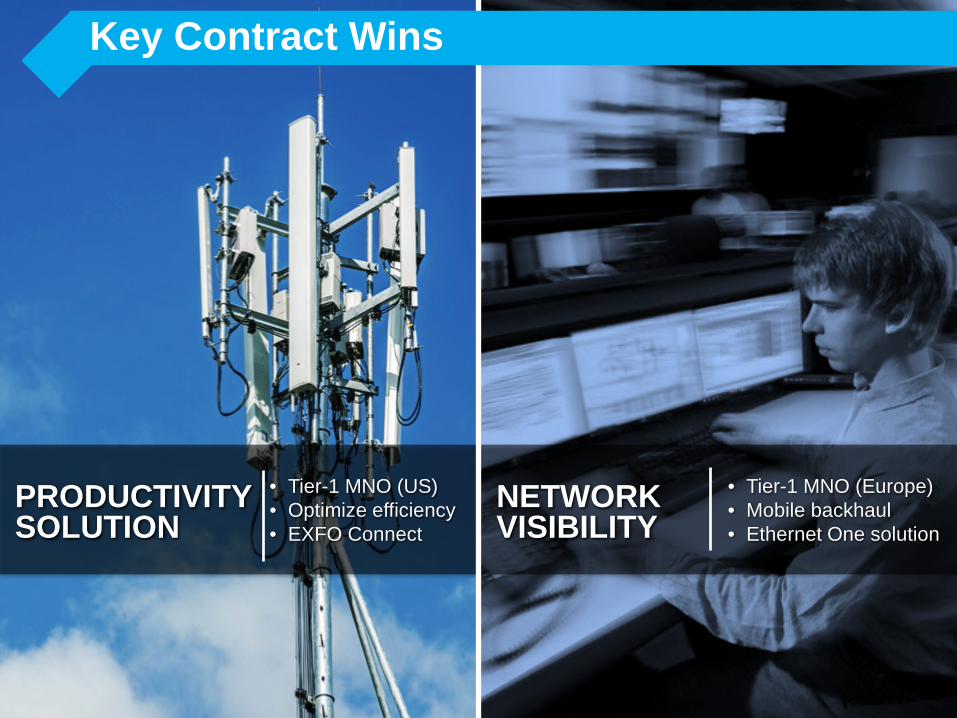
Key Contract Wins
• Tier-1 MNO (US) • Optimize efficiency • EXFO Connect
NETWORK VISIBILITY
• Tier-1 MNO (Europe) • Mobile backhaul • Ethernet One solution
PRODUCTIVITY SOLUTION
13 © 2015 EXFO Inc. All rights reserved.
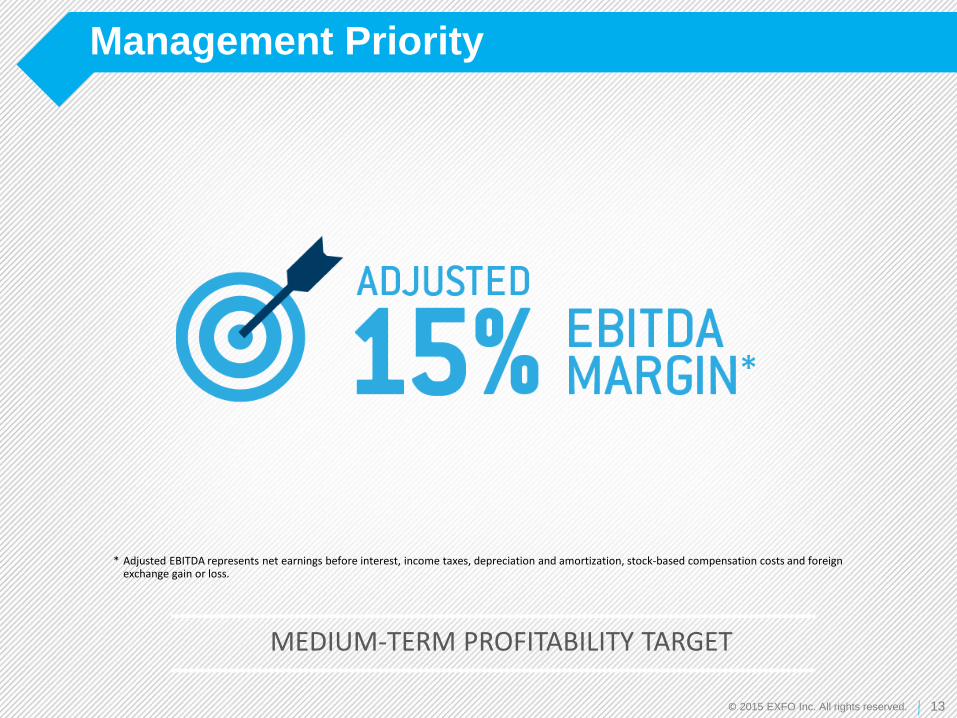
Management Priority
* Adjusted EBITDA represents net earnings before interest, income taxes, depreciation and amortization, stock-based compensation costs and foreign exchange gain or loss.
MEDIUM-TERM PROFITABILITY TARGET
14 © 2015 EXFO Inc. All rights reserved.
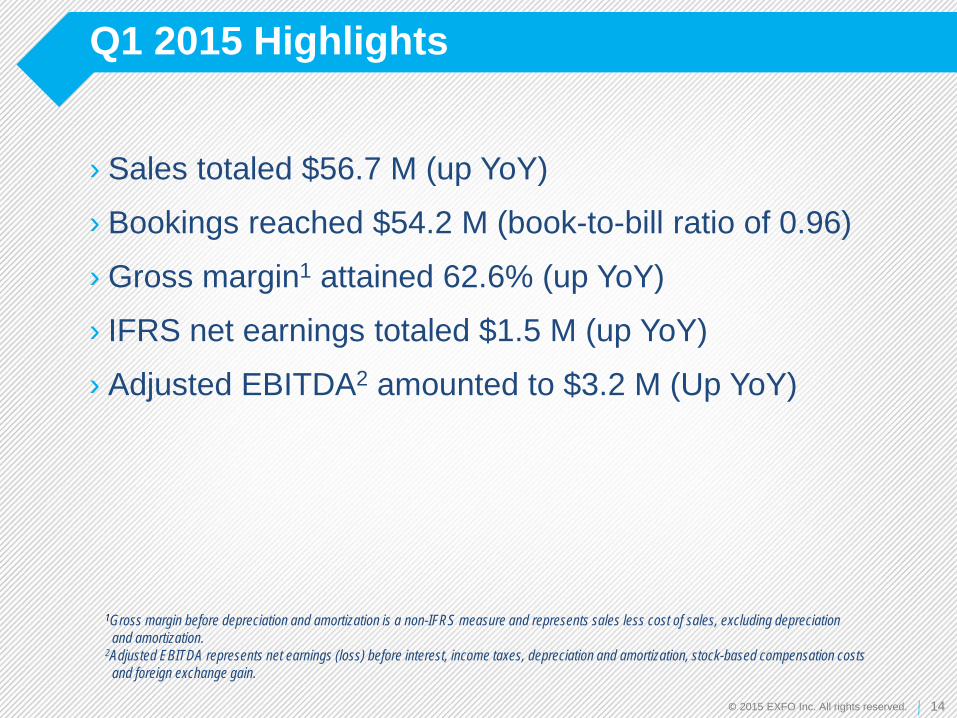
Q1 2015 Highlights
› Sales totaled $56.7 M (up YoY)
› Bookings reached $54.2 M (book-to-bill ratio of 0.96)
› Gross margin1 attained 62.6% (up YoY)
› IFRS net earnings totaled $1.5 M (up YoY)
› Adjusted EBITDA2 amounted to $3.2 M (Up YoY)
1Gross margin before depreciation and amortization is a non-IFRS measure and represents sales less cost of sales, excluding depreciation and amortization. 2Adjusted EBITDA represents net earnings (loss) before interest, income taxes, depreciation and amortization, stock-based compensation costs and foreign exchange gain.
15 © 2015 EXFO Inc. All rights reserved.
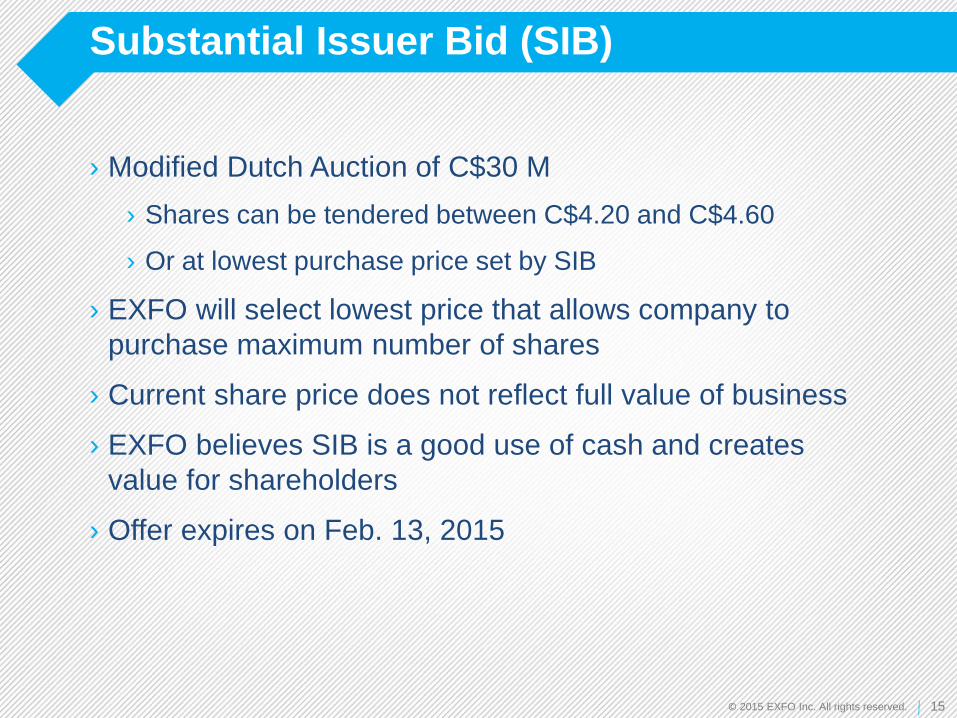
Substantial Issuer Bid (SIB)
› Modified Dutch Auction of C$30 M › Shares can be tendered between C$4.20 and C$4.60
› Or at lowest purchase price set by SIB
› EXFO will select lowest price that allows company to purchase maximum number of shares
› Current share price does not reflect full value of business
› EXFO believes SIB is a good use of cash and creates value for shareholders
› Offer expires on Feb. 13, 2015
16 © 2015 EXFO Inc. All rights reserved.
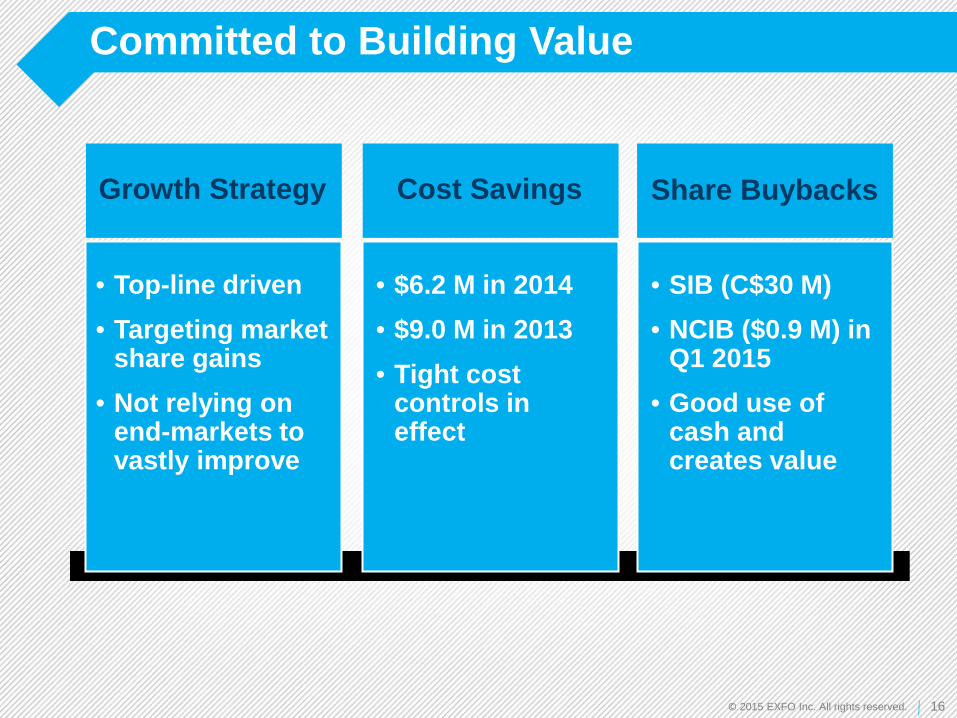
Committed to Building Value
Growth Strategy
• Top-line driven • Targeting market
share gains • Not relying on
end-markets to vastly improve
Cost Savings Share Buybacks
• $6.2 M in 2014 • $9.0 M in 2013 • Tight cost
controls in effect
• SIB (C$30 M) • NCIB ($0.9 M) in
Q1 2015 • Good use of
cash and creates value
17 © 2015 EXFO Inc. All rights reserved.
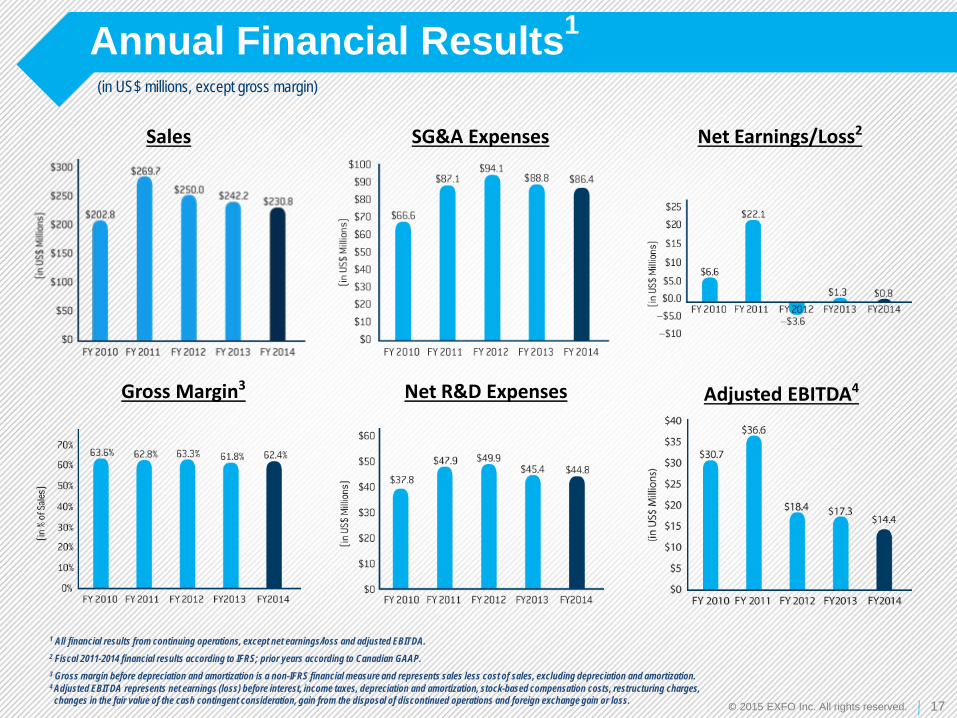
Annual Financial Results1 (in US$ millions, except gross margin)
1 All financial results from continuing operations, except net earnings/loss and adjusted EBITDA. 2 Fiscal 2011-2014 financial results according to IFRS; prior years according to Canadian GAAP. 3 Gross margin before depreciation and amortization is a non-IFRS financial measure and represents sales less cost of sales, excluding depreciation and amortization. 4 Adjusted EBITDA represents net earnings (loss) before interest, income taxes, depreciation and amortization, stock-based compensation costs, restructuring charges, changes in the fair value of the cash contingent consideration, gain from the disposal of discontinued operations and foreign exchange gain or loss.
Sales
Gross Margin3 Net R&D Expenses Adjusted EBITDA4
Net Earnings/Loss2 SG&A Expenses
18 © 2015 EXFO Inc. All rights reserved.
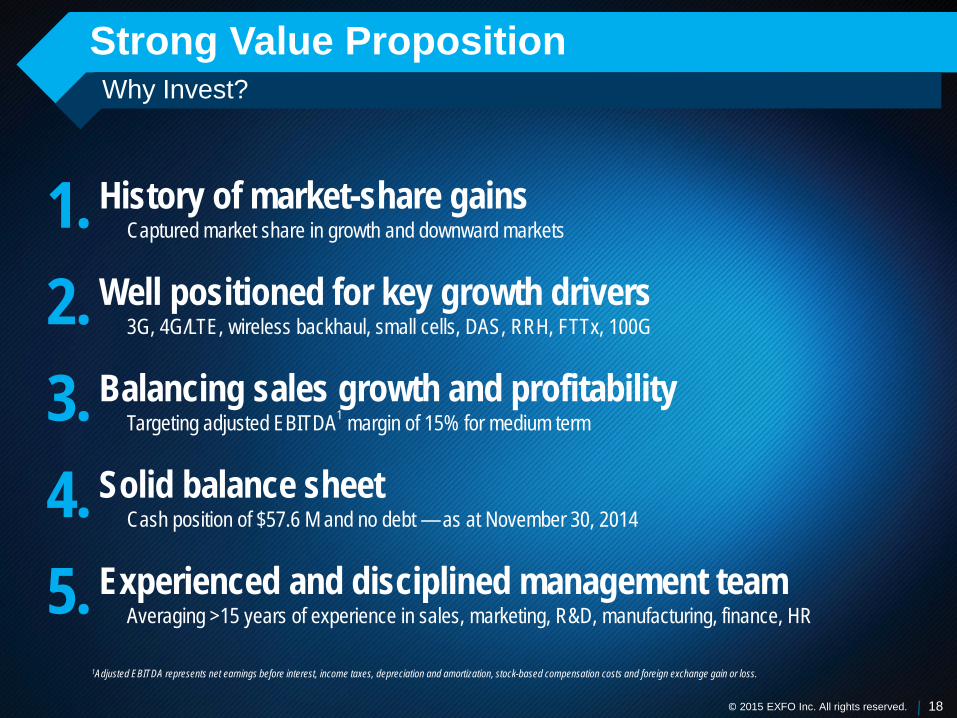
Strong Value Proposition Why Invest?
1. History of market-share gains Captured market share in growth and downward markets
2. Well positioned for key growth drivers 3G, 4G/LTE, wireless backhaul, small cells, DAS, RRH, FTTx, 100G
3. Balancing sales growth and profitability Targeting adjusted EBITDA1 margin of 15% for medium term
4. Solid balance sheet Cash position of $57.6 M and no debt — as at November 30, 2014
5. Experienced and disciplined management team Averaging >15 years of experience in sales, marketing, R&D, manufacturing, finance, HR
1Adjusted EBITDA represents net earnings before interest, income taxes, depreciation and amortization, stock-based compensation costs and foreign exchange gain or loss.