steady-state and maximum chlorophyll fluorescence...
TRANSCRIPT

Steady-State and Maximum ChlorophyllFluorescence Responses to Water Stressin Grapevine Leaves:A New Remote Sensing System
Jaume Flexas,* Jean-Marie Briantais,† Zoran Cerovic,† Hipolito Medrano,*and Ismael Moya†
A new fluorimeter built at Orsay allowed us to mea- gressed, thus serving as a good indicator of plant waterstatus. (3) A simple fluorescence parameter, Fs, accu-sure at a distance of up to 6 m both the steady-state andrately reflected the plant physiological state. Over thethe maximum chlorophyll fluorescence. This instrumentrange of light intensities used in this study, this parame-has been applied continuously during 17 days of waterter changed in parallel with irradiance in well-wateredstress development to follow the chlorophyll fluorescenceplants. With increasing water stress, Fs changed in oppo-parameters of a potted grapevine. Gas-exchange rates forsite direction to irradiance changes. The response of FsH2O and CO2 and chlorophyll fluorescence parameters ofto rapid changes in irradiance was fast (within seconds).the same leaf were recorded concurrently. It was shownThe potential of this parameter for remote sensing of wa-that: (1) Under well-watered conditions, before noon, ater stress is discussed. Elsevier Science Inc., 2000correlation was found between net photosynthetic rate
and the rate of electron transport calculated from fluores-cence measurements. After several hours of high light ex-
INTRODUCTIONposure, CO2 assimilation (A) started to decrease morethan the rate of electron transport (ETR). Under drought The interest of chlorophyll fluorescence as a useful signalconditions, the above-mentioned correspondence was lost: reflecting plant photochemistry has been widely re-when A almost vanished due to high stomatal closure, the viewed (Bolhar-Nordenkampf et al., 1989; Krause andETR was still about 50% of the control value. It is sug- Weis, 1991; Schreiber et al., 1994; Lichtenthaler, 1996).gested that under these conditions, the ratio of photores- This is a nondestructive and nonintrusive signal, easy topiration to CO2 assimilation increased. (2) Light response use for many purposes in laboratory and fieldwork. Forof the quantum yield of ETR became increasingly differ- these reasons efforts have been made to relate chloro-ent between morning and afternoon as water stress pro- phyll fluorescence parameters, mainly the electron trans-
port rate from PS II (ETR), with actual rates of CO2 as-similation (Edwards and Baker, 1993; Genty et al., 1989;
* Instituto Mediterraneo de Estudios Avanzados—Universitat de Harbinson et al., 1989; Oquist and Chow, 1992; Schin-les Illes Balears (UIB-CSIC), Departament de Biologia Ambiental,dler and Lichtenthaler, 1996; Valentini et al., 1995; WeisCarretera Valldemossa Km. 7,5, 07071 Palma de Mallorca, Baleares,
Spain and Berry, 1987). The results have shown good agree-† Laboratoire pour l’Utilisation du Rayonnement Electromag- ment between CO2 assimilation and ETR in C4 plants,netique (LURE), Centre Universitaire Paris-Sud, B.P. 34, 91898 Orsay
but not as good agreement in C3 plants, due to the con-Cedex, Francetribution of other processes to electron use.Address correspondence to J. Flexas, Instituto Mediterraneo de
Estudios Avanzados—Universitat de les Illes Balears (UIB-CSIC), De- Photorespiration and the Mehler reaction are thepartament de Biologia Ambiental, Carretera Valldemossa Km. 7,5, main processes related to the imbalance between CO207071 Palma de Mallorca, Baleares, Spain. E-mail [email protected]
Received 20 September 1999; revised 28 January 2000. assimilation and ETR. The first consists of the oxygen-
REMOTE SENS. ENVIRON. 73:283–297 (2000)Elsevier Science Inc., 2000 0034-4257/00/$–see front matter655 Avenue of the Americas, New York, NY 10010 PII S0034-4257(00)00104-8

284 Flexas et al.
ation of ribulose-1,5-bisphosphate by Rubisco, which, ac- pulse amplitude modulation fluorimeter (FIPAM) andgas-exchange rates with a CO2/H2O porometer (LI-6400,cording to the enzyme properties, is likely to increase
when CO2 availability in the chloroplast is reduced, as Li-Cor Inc., Lincoln, NE, USA) were performed contin-uously (night and day) during the 17 days of a droughtoccurs under water stress due to stomatal closure. The
photorespiratory pathway itself consumes only about half cycle. Some experiments with artificial light were per-formed to complete the study.of the NADPH synthesized by the chloroplastic electron
transport chain in respect to the consumption by CO2 as-similation. However, this cycle, which evolves one mole-
MATERIAL AND METHODScule of CO2 per each two molecules of O2 reduced, isalways coupled to CO2 assimilation through the recycling Plant Materialof the evolved CO2. Both processes together represent a One-year-old plants of Vitis vinifera (L.) cultivar Ca-combined cycle, the C2-C3 cycle that according to a bernet Sauvignon were grown in a greenhouse at Orsaysteady-state biochemical model recently presented (Ta- (vicinity of Paris, France), under natural light and tem-keba and Kozaki, 1998) is able to maintain about 75% of perature conditions in small pots (0.5 L) with horticul-maximum ETR in a situation in which no net CO2 assim- tural substrate. Pots were covered with aluminum foil toilation is observed (that is, only by internally recycling avoid soil water evaporation, and periodically irrigated tothe CO2 evolved by the photorespiratory pathway). The maintain them at field capacity until the onset of mea-Mehler reaction consists of a direct reduction of O2 by surements, which were performed during the summer ofthe electron transport chain at the ferredoxin level 1996. The last fully expanded leaf of the main shoot was(Asada, 1999). Both processes increase under water used for measurements.stress as a consequence of reduced CO2 availability inthe chloroplast, which increases the ratio O2/CO2, andboth have been suggested many times as important elec- Environmental Conditionstron consumers under water stress (Cornic and Briantais,
Measurements were performed under natural greenhouse1991; Flexas et al., 1999a; Flexas et al., 1999b; Flexas etconditions during the summer. Air and leaf temperatureal., 1999c; Osmond et al., 1997; Wingler et al., 1999),(inside and outside the Li-6400 chamber) were continu-and their importance in water-stressed grapevines hasously recorded using thermocouples coupled both to thebeen recently demonstrated (Flexas et al., 1999c).FIPAM (measurements every 30 s) and to the Li-6400Despite these difficulties with C3 plants, chlorophyll(measurements every 5 minutes). Photosynthetic Photonfluorescence has been shown to be an interesting tool forFlux Density (PPFD) was also recorded on the leaf sur-plant stress detection (Cecchi et al., 1994; Cerovic et al.,face with a quantum meter coupled to the Li-6400.1996; Gunther et al., 1994; Moya et al., 1992; Moya et
Environmental heterogeneity was present during theal., 1995). The potential of fluorosensing water stress hasexperiment, with sunny and cloudy days, as well as sunnybeen reported recently for several plants includingand cloudy intervals within the same day. The iron glass-grapevines using parameters other than ETR, such as thehouse structure also caused a temporally unavoidablechlorophyll fluorescence mean lifetime (Cerovic et al.,light interception that shaded the leaf for short periods1996; Schmuck et al., 1992) or nonphotochemical quench-during the diurnal time courses, which caused disconti-ing of chlorophyll fluorescence (Flexas et al., 1998;nuities in the profile of light interception by the leaf.Flexas et al., 1999a; Flexas et al., 1999b; Schultz, 1997).These sudden discontinuities served to aid observation ofMoreover, it has been noticed that water stress inducesthe rapid response of photosynthesis to changes in themarked effects on the daily pattern of steady-state chlo-light environment. About 1,200 lmol photon m22 s21
rophyll fluorescence (Fs) (Cerovic et al., 1996; Flexas etPPFD were recorded at midday sunny peaks duringal., 1999a; Flexas et al., 1999b; Rosema et al., 1998).sunny days. Air temperature inside the greenhouse var-The aims of the present work were:ied between 158C and 208C during the night and dawn,
1. To test the capacity of the new fluorimeter devel- to peaks of 308C to 358C at midday (data not shown).oped at the LURE (Orsay, France) by I. Moyafor measuring at a distance of 0.5 m to 6 m boththe steady state and the maximum chlorophyll flu- Plant Water Statusorescence in vivo. Water stress was induced by withholding watering. Daily
2. To test the utility of several chlorophyll fluores- water loss was followed by successive pot weighing dur-cence parameters for plant water stress detection, ing the experiment. Leaf discs were taken periodicallypaying special attention to the time resolution and from leaves similar to those used for photosynthetic mea-spatial correlation of Fs changes to light over a surements. The samples were taken always in the earlyrange of values of the plant water status. morning to avoid differences in water content due to wa-
ter loss during the day. The leaf water deficit (LWD)Simultaneous measurements of chlorophyll fluores-cence with the newly constructed frequency-induced was estimated from disc fresh weight and the weight of

Fluorescence Responses to Water Stress 285
the same discs after 24 h in distilled water at 48C (full by specially designed electronics locked to the frequencyof excitation pulses, which make the pulsed response in-turgor), as follows: LWD5(turgid weight2fresh weight)/
turgid weight. sensitive to continuous illumination even under condi-tions that saturate fluorescence. Two signals are obtainedin parallel: a fluorescence signal (Fs) and a continuoussignal (Rcont), which is proportional to the ambient lightChlorophyll Fluorescence Measurementsreflected by the leaf that passes through the detectionA new fluorimeter was designed and built at LURE (Or-filter. It has been observed that Rcont is proportional tosay, France) by I. Moya, with the aim of continuouslythe PPFD intensity. Under our experimental conditions,recording fluorescence parameters (Fs and Fm) duringchanges in the incident light due to solar position in-several days, at a distance from the leaf sufficient toduced only minor decorrelation between Rcont andavoid any interference with the natural illumination ofPPFD. Therefore, after calibration, Rcont can be usedthe leaf. This distance was 0.6 m in our particular ex-to follow changes in PPFD. The fact that Rcont and Fsperiment.originate from exactly the same leaf area enables a pre-The FIPAM fluorimeter is based on fluorescence ex-cise correlation between these two signals.citation by a laser diode (635 nm, 10 mW, SDL Inc.).
The instrument is controlled by a computer with aThe beam is modulated at different frequencies withspecially designed program, which allows continuousconstant amplitude and duration (2 ls) and focused onmeasurement over several days. Every second the Fs andthe leaf by a microscope objective, from distances adjust-Rcont signals are measured together with the air, leaf,able in the range of 0.5 m to 6 m, depending on thedetector, and laser temperatures. Corrections were ap-laser source. The resulting spot has a rectangular shapeplied to make the experiments insensitive to temperatureof 0.5 mm by 4 mm at a distance of 1 m. The new con-changes of the instrument. The mean of 30 measure-cept of saturating the fluorescence yield by increasingments is calculated every 30 s. The zero of the fluores-the frequency of modulation makes a bridge between thecence signal is measured for each cycle by triggering thePAM technique, widely applied among plant physiolo-measurement in the absence of the excitation pulse. Thisgists (Schreiber, 1983) and other LIDAR systems capa-value is automatically subtracted from the fluorescenceble of detecting chlorophyll fluorescence at distancessignal. Thus, the Fs value is free of any electronic drift.greater than 10 m, but restricted to measuring the sta-This is of particular importance since the experimenttionary fluorescence level (Fs). We have already used thelasted for several days.FIPAM fluorimeter at distances of about 6 m using a
In this experiment the frequency of Fm measure-100-mW laser diode (Philips CQL 822/D, Eindhoven,ments was initially set to one measurement each 10 min-The Netherlands) instead of the 10-mW one used in theutes. The same procedure was used to measure Fv/Fmpresent work. The market availability of high-power laserand DF/Fm9. We refer to Fv/Fm when measurementsdiodes and other solid-state, high frequency modulationare taken by night (i.e., all photochemical quenching re-lasers, which can be used for chlorophyll excitation, islaxed) and to DF/Fm9 (Genty et al., 1989) when mea-growing very fast. There is no doubt that remote sensingsurements were taken in the presence of actinic lightmeasurements with the FIPAM method over distances(i.e., after dawn). Since DF/Fm9 represents the quantumhigher than 10 m will be feasible in the near future.yield of PSII photochemistry, the electron transport rateWith our system, the basal fluorescence value whenfrom PSII was calculated by multiplying DF/Fm9 by inci-all photosystems are closed—that is, at complete dark-dent PPFD. The result is expressed in relative units be-ness (Fo), as well as at the steady-state chlorophyll fluo-cause it considers neither the leaf absorbance nor therescence emission under a given irradiance (Fs)—arefactor of PSI-PSII excitation distribution. Most workersmeasured with a frequency of only 1 Hz, which corre-accept this parameter as a good estimate of the linearsponds to an average intensity of 0.05 lmol photons m22
electron transport from PSII (Bilger et al., 1995; Cornics21. At this frequency no actinic effect is observed evenand Briantais, 1991; Flexas et al., 1999a; Flexas et al.,in complete darkness. Maximum fluorescence when all1999b; Flexas et al., 1999c; Genty et al. , 1989; Krall andcenters are closed, both in darkness (Fm) or under aEdwards, 1992), although it has been recently suggestedgiven irradiance (Fm9), are induced by increasing thethat this does not hold under CO2-limited photosynthesisfrequency to 100 kHz. Under these conditions, the aver-and high irradiance (Rosema et al., 1998).age intensity ranges between 2,000 and 10,000 lmol m22
s21, depending on focusing. We ensure that actual maxi-mum chlorophyll fluorescence has been reached by re-
Gas-Exchange Parameterscording the complete induction kinetics, with a time res-olution of 10 ms (not shown). The leaf fluorescence is The photosynthetic performance (both fluorescence and
gas exchange) of a single leaf was followed during the 17collected by a 15-cm Frenel lens and focused on a PINphotodiode (Hamamatsu S3590) after passing through a days of the experiment to avoid any effect due to plant
or leaf variability. The Li-6400 chamber was placed in ahigh-pass filter (Schott RG665). The signal is processed

286 Flexas et al.
experiment was to confirm the results obtained pre-viously in the absence of Fm quenching induced duringthe night by excessive frequency of saturating pulses.The frequency of saturation pulses was decreased to onepulse each 20 minutes and laser focus was slightlychanged. Again, plants were grown under greenhouselight and temperature conditions and irrigated periodi-cally to maintain the soil at field capacity, and waterstress was induced by withholding watering. Leaf waterdeficit was estimated as described above.
For measurements, plants were dark-adapted for 2hours in a dark room. The temperature was maintainedconstant at 258C throughout the experiment. The artifi-cial diurnal cycle on a single leaf was provided by a250-W slide projector whose light intensity was varied
Figure 1. Decreases in pot weight during the studied pe- using a rotating dimmer coupled to a stepping motor.riod, showing pot water loss by the plant (experiment with
The motor was controlled by a program run on a Hew-natural light). Numbers indicate the day of the month,lett Packard 9816 computer. The light beam was filteredwhich correspond to 3 days represented in the following
figures. through a 2-cm layer of a copper sulphate solution (1 M)to minimize spectral changes when varying light inten-sity. A different plant was used for each diurnal cycle,way that the natural position of the leaf was not modi-during which gas-exchange and chlorophyll fluorescencefied. CO2 concentration of air flowing through the systemmeasurements were performed as described above.was maintained constant at about 360 lmol mol21. The
“Autolog” setting of the instrument was used to recordthe parameters every 5 minutes. The ability of the FI- RESULTSPAM to measure at a distance enabled fluorescence
Leaf Water Statusmeasurements on the same area of the leaf through theFigure 1 shows the decrease in soil water content (esti-transparent window of the Li-6400 chamber. No differ-
ences were observed between leaf temperature inside mated as pot weight loss) during the water stress devel-and outside the chamber. opment. Water loss was due only to plant transpiration,
as the pots were covered with aluminum foil to preventExperiments with Artificial Light evaporation from the soil surface. The progressive reduc-
tion of the slope of weight decrease revealed that leavesOne year later (summer 1997), the same plants weretransferred to larger pots (3 L). The aim of this second adjusted their transpiration rate gradually in response to
Table 1. Changes in Leaf Parameters During Drought Developmenta
LWD (%) A/g ETR/ADay Sunlight (61.5%) (615%) (615%)
5/08/96 S 5.1 not m. not m.8/08/96 S 5.8 103.3 (130) not m.9/08/96 S 7.6 101.5 (147.1) 13.5 (33.4)
10/08/96 C not m. 116.7 (136.4) 12 (13.1)11/08/96 S not m. 123.8 (99.6) 15 (20.8)12/08/96 C not m. 116.6 (184) 16.4 (20.4)13/08/96 S not m. 155.8 (143.5) 18.7 (26.1)14/08/96 S not m. 249.0 (193.3) 22.1 (37.9)15/08/96 S not m. 293.5 (437.5) 38.7 (104.8)16/08/96 S 10.0 366.7 (1125.5) not m.17/08/96 S 10.0 437.5 (4500.0) 154.8 (82)25/06/97 S 5.9 75.0 (66.5) 6.8 (13.3)
5/07/97 S 10.7 1095.9 (n.s.) 221.7 (n.s.)
a Leaf water deficit (LWD, mean for three replicates), water use efficiency, and the ratio ofelectron transport to CO2 assimilation at 200 lmol photon m22 s21 (A/g in lmol CO2 lmolH2O21; ETR/A in lmol electrons lmol CO21
2 , assuming a leaf absorptance of 0.84 and equaldistribution of energy between the two photosystems). Values in brackets represent afternoondata. Sunlight (S), sunny days, up to 800 lmol photon m22 s21 or more; cloudy days (C), lessthan 500 lmol photon m22 s21.
not m.5not measured; n.s.5nonsignificant because of the low and scattered values of bothA and g (see Fib. 8b).

Fluorescence Responses to Water Stress 287
Figure 2. Diurnal time course of chlorophyll fluorescence and gas-exchange under irrigation conditions on a sunny day (9 Au-gust 1996). (A) Chlorophyll fluorescence. Dots represent values of Fm and Fm9. Continuous line represents values of Fo andFs. The spikes of Fo during the night are due to incomplete reopening of closed centres during the 30 seconds after a satu-rating pulse. (B) Variable fluorescence, Fv/Fm and DF/Fm9 (dots). The dotted line is the PPFD measured with the FIPAM.(C) Relative electron transport rate (ETR) estimated from chlorophyll fluorescence measurements (continuous thin line), rateof CO2 assimilation (A) measured by gas exchange (continuous thick line) and PPFD measured with the internal quantummeter of the gas-exchange analyzer chamber (dotted line). (D) The relationship between DF/Fm9 and PPFD, replotted fromFig. 2B. Solid triangles are morning data and empty circles are afternoon data.
soil water availability. Recorded diurnal time courses of a substantial decrease in Fv/Fm (Fig. 2B). The origin ofleaf transpiration and stomatal conductance confirmed these phenomena, present in most of the recorded cyclesthis adjustment (data not shown). As can be seen (Table (see Figs. 3 and 4), seems to be the repetition of saturat-1), the studied range of LWD (from 5 to 10%) was far ing pulses in the same leaf area during the whole night.from the 30% known to cause strong reductions in pho- During the morning, the Fs pattern followed quite welltosynthetic capacity (Cornic, 1994). The 1997 LWD that of PPFD, but this relationship was not completelyvalues were within the range of the 1996 experiment maintained during the afternoon. The relationship be-(Table 1). tween DF/Fm9 and irradiance during the day (Fig. 2D)
shows that for any given irradiance, values correspondingto the morning were similar to those of the afternoon.
Effects of Water Stress on the Diurnal Time Only points corresponding to the dawn showed a differ-Course of Chlorophyll Fluorescence and Gas ent pattern. The diurnal time course of electron trans-Exchange (Experiment with Natural Light) port rate (Fig. 2C) followed the diurnal pattern of irradi-
ance. The rate of CO2 assimilation also followed theFigures 2A and 2B show the diurnal pattern of chloro-same pattern during the morning (Fig. 2C). However,phyll fluorescence parameters under irrigated conditionsfrom midday on, a progressive decrease in CO2 assimila-during a sunny day. Through the night, a marked de-
crease of Fm and a slight increase in Fo (Fig. 2A) caused tion was recorded and was not accompanied by concomi-
288 Flexas et al.
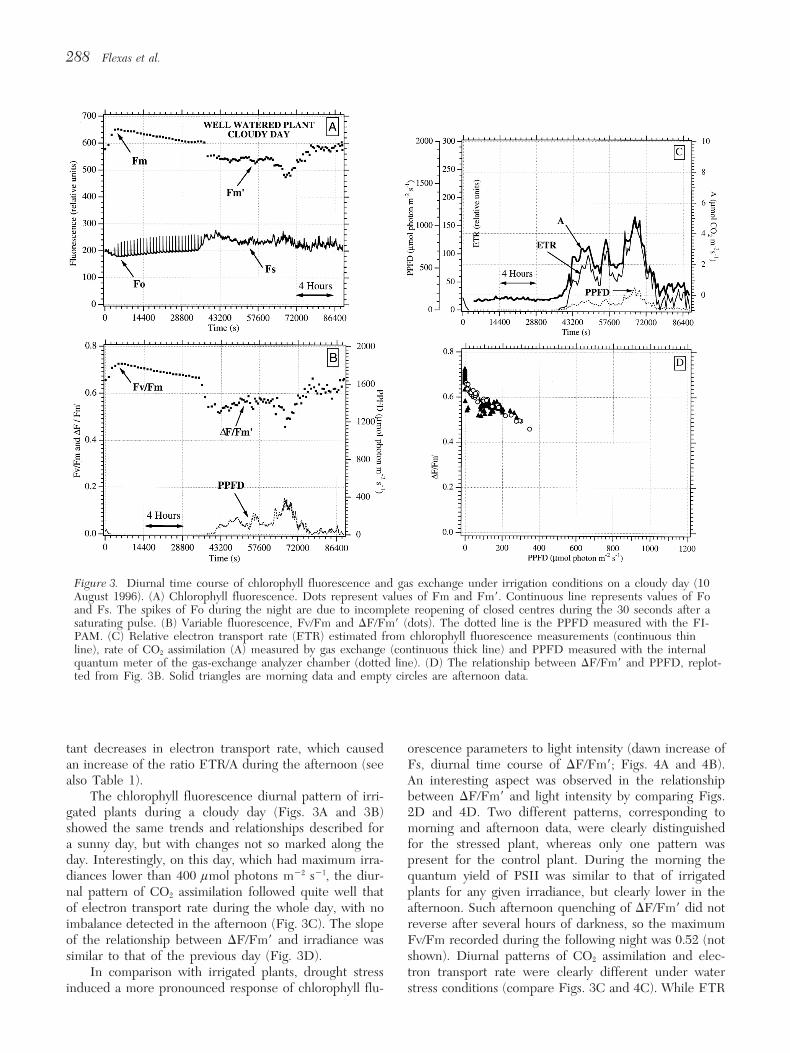
Figure 3. Diurnal time course of chlorophyll fluorescence and gas exchange under irrigation conditions on a cloudy day (10August 1996). (A) Chlorophyll fluorescence. Dots represent values of Fm and Fm9. Continuous line represents values of Foand Fs. The spikes of Fo during the night are due to incomplete reopening of closed centres during the 30 seconds after asaturating pulse. (B) Variable fluorescence, Fv/Fm and DF/Fm9 (dots). The dotted line is the PPFD measured with the FI-PAM. (C) Relative electron transport rate (ETR) estimated from chlorophyll fluorescence measurements (continuous thinline), rate of CO2 assimilation (A) measured by gas exchange (continuous thick line) and PPFD measured with the internalquantum meter of the gas-exchange analyzer chamber (dotted line). (D) The relationship between DF/Fm9 and PPFD, replot-ted from Fig. 3B. Solid triangles are morning data and empty circles are afternoon data.
tant decreases in electron transport rate, which caused orescence parameters to light intensity (dawn increase ofFs, diurnal time course of DF/Fm9; Figs. 4A and 4B).an increase of the ratio ETR/A during the afternoon (see
also Table 1). An interesting aspect was observed in the relationshipbetween DF/Fm9 and light intensity by comparing Figs.The chlorophyll fluorescence diurnal pattern of irri-
gated plants during a cloudy day (Figs. 3A and 3B) 2D and 4D. Two different patterns, corresponding tomorning and afternoon data, were clearly distinguishedshowed the same trends and relationships described for
a sunny day, but with changes not so marked along the for the stressed plant, whereas only one pattern waspresent for the control plant. During the morning theday. Interestingly, on this day, which had maximum irra-
diances lower than 400 lmol photons m22 s21, the diur- quantum yield of PSII was similar to that of irrigatedplants for any given irradiance, but clearly lower in thenal pattern of CO2 assimilation followed quite well that
of electron transport rate during the whole day, with no afternoon. Such afternoon quenching of DF/Fm9 did notreverse after several hours of darkness, so the maximumimbalance detected in the afternoon (Fig. 3C). The slope
of the relationship between DF/Fm9 and irradiance was Fv/Fm recorded during the following night was 0.52 (notshown). Diurnal patterns of CO2 assimilation and elec-similar to that of the previous day (Fig. 3D).
In comparison with irrigated plants, drought stress tron transport rate were clearly different under waterstress conditions (compare Figs. 3C and 4C). While ETRinduced a more pronounced response of chlorophyll flu-

Fluorescence Responses to Water Stress 289
Figure 4. Diurnal time course of chlorophyll fluorescence and gas exchange under drought conditions on a sunny day (17 Au-gust 1996). (A) Chlorophyll fluorescence. Dots represent values of Fm and Fm9. Continuous line represents values of Fo andFs. The spikes of Fo during the night are due to incomplete reopening of closed centres during the 30 seconds after a satu-rating pulse. (B) Variable fluorescence, Fv/Fm and DF/Fm9 (dots). Dotted line is the PPFD measured with the FIPAM. (C)Relative electron transport rate (ETR) estimated from chlorophyll fluorescence measurements (continuous thin line), rate ofCO2 assimilation (A) measured by gas exchange (continuous thick line) and PPFD measured with the internal quantum meterof the gas-exchange analyzer chamber (dotted line). (D) The relationship between DF/Fm9 and PPFD, replotted from (B).Solid triangles are morning data and empty circles are afternoon data.
followed the diurnal pattern of irradiance, CO2 assimila- a negative correlation was found even at low light inten-sities (Fig. 5C).tion was almost absent during most of the day, due to
complete stomatal closure only 3 hours after dawn (plotnot shown). Effects of Progressive Soil Drying along the Days
In water-stressed plants the diurnal time course of on Stomatal Conductance, CO2 Assimilation,Fs showed an opposite pattern to that of well-watered and Electron Transport Rateconditions; that is, it showed an inverse correlation with Progressive soil drying was accompanied by different de-PPFD. Figure 5 shows details (periods of 4 hours) of grees of reduction in A, g, and ETR (Figs. 6A and 6B).drought-associated change in the Fs response to PPFD Average values of these parameters were obtained fromfor three different days after withholding water. It is measurements taken at 200 lmol photon m22 s21 for theclear that under irrigated conditions, there was a positive full period of water stress development. This PPFD wascorrelation between Fs and irradiance, in spite of the chosen because it is present both on sunny and cloudylarge variations in irradiance (Fig. 5A). However, only 5 days. Stomatal closure was an early response to soil dry-days later, under a mild water stress, this pattern had ing, accompanied by a concomitant decrease of CO2 as-changed. The positive correlation was maintained at low similation. However, CO2 assimilation showed a slightlylight intensities (below 250 lmol photons m22 s21), but lower decrease, and therefore the intrinsic water use effi-at high light intensities there was an inverse correlation ciency (A/g) progressively increased with water stress (Fig.
6 and Table 1). Such increases were high when takenbetween the two parameters (Fig. 5B). Three days later,

290 Flexas et al.
Experiment with Artificial LightThe “diurnal” cycles performed with artificial light weremade to verify the above results under controlled condi-tions, avoiding frequent changes in incident light intensityover the leaf, as well as large variations of temperature. Inaddition, we could check that the Fv/Fm quenching en-dured by oversaturating pulses during the night did notaffect the dependence of other fluorescence parameterson water stress. Figure 7A shows the diurnal time courseof Fs and Fm for a well-irrigated plant. Both Fo and Fmvalues remained constant during the night, and thus Fv/Fm was stable (Fig. 7B). It is interesting to note thatsimilar to the experiment performed with natural light,Fs increased suddenly at dawn, when light intensity wasless than 10 lmol photon m22 s21, but to a much lowerextent than in the previous experiment. Also, this effectwas reversed in a shorter time. The quenching of Fmobserved at dawn was much lower than in the previousexperiment, and its duration was much shorter. The diur-nal time course of Fs followed that of PPFD (Fig. 7A).Again, under water stress conditions, this pattern was in-verted (not shown).
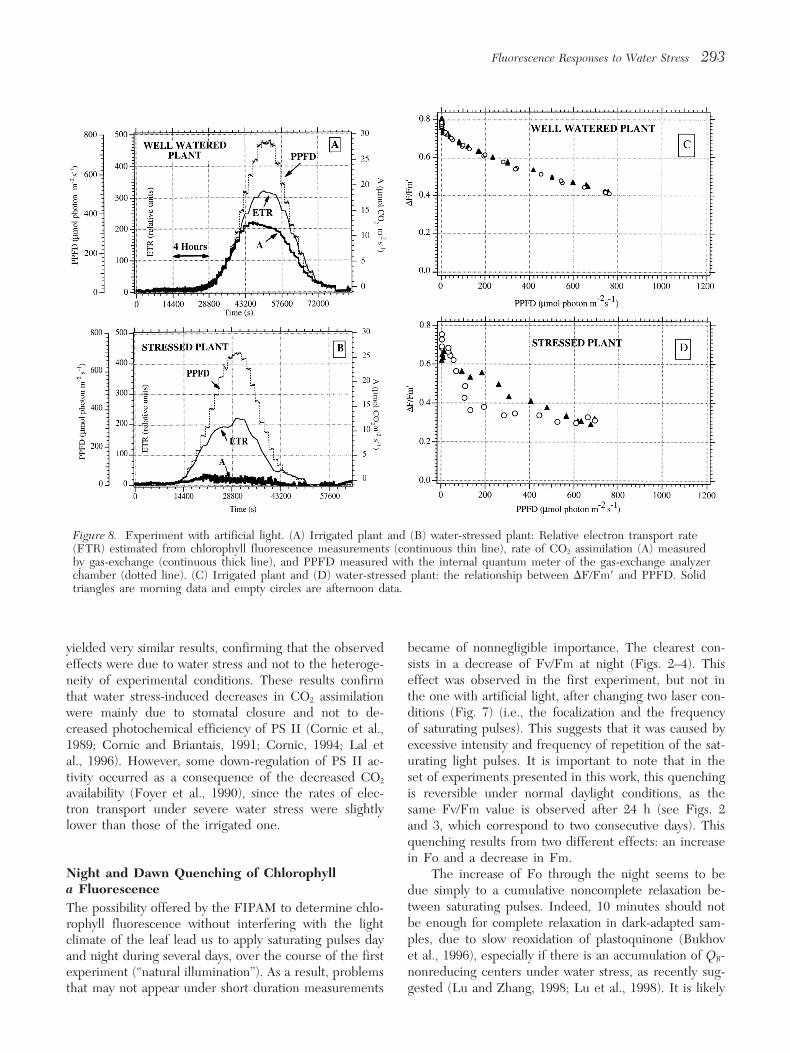
Figure 8A shows the diurnal time course of CO2 as-similation and electron transport rate for irrigated plants.A good coincidence was observed between both parame-ters during the morning. At higher light intensities (mid-day), electron transport continued to rise until the mid-day light peak, while CO2 assimilation reached its maximumvalue at about 500 lmol photon m22 s21. The decorrela-tion is larger during the afternoon, as noticed in the ex-periment with natural light.
When the plant reached a water deficit similar toFigure 5. The relation between Fs (continuous line) andPPFD (dotted line). Detail of 4-hour periods. (A) Well- that of the experiment with natural light, CO2 assimila-watered plant, corresponding to 9 August 1996. (B) Mild tion was almost completely absent (Fig. 8B), in accor-water stress situation, 14 August 1996. (C) Severe water
dance with an almost complete stomatal closure (notstress situation, 17 August 1996.shown). Electron transport rate, however, was still main-tained at about 50% to 60% of control values (Fig. 8B).
The plot of DF/Fm9 against light intensity showedfrom morning data (from values around 100 under well- that the afternoon data coincide with those of the morn-watered conditions, to more than 400 under drought). ing in the well-watered plant (Fig. 8C). For the stressedFor the afternoon data, taking into account the standard plants, however, DF/Fm9 was lower in the afternoon thanerror, such increases were similar up to the fourteenth in the morning for the same light intensity, as in the ex-day, and were larger thereafter. This is due to the well- periment with natural light. Moreover, at high light in-known effect of water stress on midday stomatal closure
tensities, DF/Fm9 values were lower than for irrigated(Chaves, 1991). Electron transport rate oscillated within aplant (Fig. 8D).narrow range of values during the period. Only the values
corresponding to the afternoon of the last days of thedrought cycle decreased clearly. A progressive increase in DISCUSSIONthe ratio ETR/A was observed with soil drying (Fig. 6
Water Stress Effects on Leaf Photosynthesisand Table 1). Moreover, afternoon values were higherIt is shown that under well-watered conditions, ETR, A,than morning values even in well-watered plants, proba-and g followed the diurnal time course of PPFD duringbly due to increased photorespiration after midday sto-the whole morning. During the afternoon, however,matal closure (Flexas et al., 1999a). Only on day 17 didthere was a consistent decrease in A that matched a de-a decrease of the ratio occur in the afternoon. This iscrease in g. It is well established that even for irrigatedprobably a consequence of photoinhibition under such
drastic conditions, as already discussed. plants some degree of water stress is achieved at midday,

Fluorescence Responses to Water Stress 291
Figure 6. Averaged values6standard error of electrontransport rate (ETR, solid circles), CO2 assimilation (A,empty squares) and stomatal conductance (g, solidsquares) at 200 lmol photon m22 s21 during the daysof water stress development. This PPFD was chosen toinclude comparable data of both sunny and cloudydays: (A) represents morning data; (B) represents after-noon data.
as a consequence of excess atmosphere water demand Vicia faba and Hordeum vulgare (Lal et al., 1996), aswell as for grapevines (Flexas et al., 1998; Flexas et al.,(Chaves, 1991). Down-regulation of A by photosynthate
accumulation has also been claimed to take place (Az- 1999a) and has been associated with relative increases inphotorespiration and/or Mehler reaction rates, whichcon-Bieto, 1983), although it has been reported by Chau-
mont et al. (1994) and Downton et al. (1987) that such might help to maintain PSII stability under conditions ofdrought and excess light (Kozaki and Takeba, 1996; Parkan accumulation does not occur in grapevines. Under our
experimental conditions, an evaporative demand ex- et al., 1996; Takeba and Kozaki, 1998). The results givenhere show that when net CO2 assimilation is close to zeroceeding the water flux into the leaf seems to be the
cause of the decrease in g and A. This is in agreement under severe water stress, ETR is still about 75% of con-trol values (see Fig. 6A). This is exactly the percentagewith the observed decreases in g, concomitant to an in-
crease of A/g during the afternoon, and also such an af- of maintained ETR expected at the compensation point,that is, when the only CO2 assimilation corresponds toternoon depression did not appear in cloudy days, when
leaf-to-air vapor pressure deficit had been lower during recycling of internally produced CO2, with no net ex-change between the leaf and the atmosphere (Takebathe morning.
Even when decreases in A were measured, ETR re- and Kozaki, 1998). These results, together with theproven importance of both photorespiration and themained unaltered. Such an imbalance between electron
transport rate and CO2 assimilation as a response to wa- Mehler reaction as electron consumers in chilled and wa-ter-stressed grapevines (Flexas et al., 1999c), makes uster stress has already been reported for the C3 plants

292 Flexas et al.
Figure 7. Diurnal time courses of chlorophyllfluorescence and gas exchange under irrigationconditions. Experiment with artificial light. (A)Chlorophyll fluorescence. Dots represent valuesof Fm and Fm9. Continuous line represents val-ues of Fo and Fs. (B) Variable fluorescence, Fv/Fm and DF/Fm9 (dots). Dotted line is thePPFD measured with the FIPAM.
assume that the ETR calculation is quite accurate even antais (1991), electron transport to O2 should be rela-under water stress, in contrast to that suggested by Ro- tively increased during the desiccation of the leaf. Thissema et al. (1998). An important implication of this is alternative sink for electrons should be large enough tothat the imbalance between A and ETR is due to real, maintain high rates of electron transport during most ofphysiological events, and not to an invalidation of the the day. In the afternoon, a slight decrease of ETR wasGenty model (Genty et al., 1989) for PSII photochemis- observed. By contrast to what happened under irrigatedtry under water stress. Thus, it will not be possible to esti- conditions, such an increase in electron transport to O2
mate actual CO2 assimilation from ETR measurements. was not able to protect leaves from photoinhibition dur-Under water stress, almost all measured parameters ing drought stress, as witnessed by only partial recovery
showed marked decreases throughout the day. Especially of the afternoon quenching during the night. This is con-remarkable was the decline in g, which reached values sistent with recent reports of Brestic et al. (1995). How-near zero only a few hours after dawn. Also, a large de- ever, photoinhibitory effects did not appear until the af-cline in A was found, but the ratio A/g increased dramat- ternoon, whereas photosynthesis was almost totallyically. In addition ETR/A strongly increased as a conse- inhibited since early morning, indicating that electronquence of the low reduction in ETR. These results transport to oxygen could help mitigate the damage ofconfirm that water stress does not cause important inhi- photosystem II at least during a large part of the daybition of the photochemical mechanism (Cornic et al. (Kozaki and Takeba, 1996; Park et al., 1996).
In general, the experiment with artificial light1989; Genty et al., 1987). According to Cornic and Bri-
Fluorescence Responses to Water Stress 293
Figure 8. Experiment with artificial light. (A) Irrigated plant and (B) water-stressed plant: Relative electron transport rate(ETR) estimated from chlorophyll fluorescence measurements (continuous thin line), rate of CO2 assimilation (A) measuredby gas-exchange (continuous thick line), and PPFD measured with the internal quantum meter of the gas-exchange analyzerchamber (dotted line). (C) Irrigated plant and (D) water-stressed plant: the relationship between DF/Fm9 and PPFD. Solidtriangles are morning data and empty circles are afternoon data.
became of nonnegligible importance. The clearest con-yielded very similar results, confirming that the observedsists in a decrease of Fv/Fm at night (Figs. 2–4). Thiseffects were due to water stress and not to the heteroge-effect was observed in the first experiment, but not inneity of experimental conditions. These results confirmthe one with artificial light, after changing two laser con-that water stress-induced decreases in CO2 assimilationditions (Fig. 7) (i.e., the focalization and the frequencywere mainly due to stomatal closure and not to de-of saturating pulses). This suggests that it was caused bycreased photochemical efficiency of PS II (Cornic et al.,excessive intensity and frequency of repetition of the sat-1989; Cornic and Briantais, 1991; Cornic, 1994; Lal eturating light pulses. It is important to note that in theal., 1996). However, some down-regulation of PS II ac-set of experiments presented in this work, this quenchingtivity occurred as a consequence of the decreased CO2
availability (Foyer et al., 1990), since the rates of elec- is reversible under normal daylight conditions, as thetron transport under severe water stress were slightly same Fv/Fm value is observed after 24 h (see Figs. 2lower than those of the irrigated one. and 3, which correspond to two consecutive days). This
quenching results from two different effects: an increasein Fo and a decrease in Fm.
Night and Dawn Quenching of Chlorophyll The increase of Fo through the night seems to bea Fluorescence due simply to a cumulative noncomplete relaxation be-
tween saturating pulses. Indeed, 10 minutes should notThe possibility offered by the FIPAM to determine chlo-be enough for complete relaxation in dark-adapted sam-rophyll fluorescence without interfering with the lightples, due to slow reoxidation of plastoquinone (Bukhovclimate of the leaf lead us to apply saturating pulses dayet al., 1996), especially if there is an accumulation of QB-and night during several days, over the course of the firstnonreducing centers under water stress, as recently sug-experiment (“natural illumination”). As a result, problems
that may not appear under short duration measurements gested (Lu and Zhang, 1998; Lu et al., 1998). It is likely
294 Flexas et al.
that the height of the “comb” effect of night reduction sity, and the diurnal pattern of steady-state chlorophyllof Fo could be an indicator of the relative abundance of fluorescence (Fs). We assume that these two approachesQB-nonreducing centers. Also, there was an increase of can be useful tools for water stress assessment, althoughFs at dawn because of a lack of activation of photosyn- it remains to be tested if other stresses would lead tothetic enzymes after several hours darkness (Figs. 2–4). similar results.
A decrease of Fm through the night was also ob- Under irrigation conditions the relationship betweenserved, as well as soon after dawn. As a result the DF/ DF/Fm9 and light intensity showed low scatter, and bothFm9 curve exhibited a sort of “hole” during ca. 1 hour morning and afternoon points fitted the same relation-to 2 hours at the beginning of the day (Figs. 2–4). This ship. When water stress was present, the points corre-phenomenon could be tentatively related to a State12 sponding to morning measurements fitted a curve clearlyState2 transition (that is, a disconnection of a part of different from that for afternoon data. For the same lightPSII antennas that are transported and coupled to PSI intensity, the values of DF/Fm9 measured in the after-reaction centers), as suggested under similar conditions noon were lower than those in the morning, indicatingto those encountered here (Bukhov et al., 1996). down-regulation of PS II efficiency after a large period
In addition to those effects, the Fo level tended to under excess light. When water stress became more pro-increase through the days of continuous recording on the nounced, this difference increased. All these characteris-same part of the leaf, together with a progressive de- tics contribute to qualify the relationships between DF/crease of the maximum Fv/Fm achieved during the night Fm9 and light intensity as a robust tool for water stress(not shown). detection.
We have recently studied these phenomena using The diurnal response of Fs to light intensity couldseveral plant species, and we have confirmed that they also be a sensitive indicator of water deficit. The inversewere entirely due to excessive frequency of saturating correlation between Fs and light intensity is a character-pulses (Apostol et al., 1999). In any case, it is important istic signal of water stress, which can be related to ato stress that although these effects lowered the Fv/Fm strong increase of the nonphotochemical quenchingto a value of only 0.6 after 15 days of continuous re- (Cerovic et al., 1996; Flexas et al., 1998). Although thiscording over the same leaf, they did not change the main
behavior of Fs under water stress has been reported ear-photosynthetic responses to water stress, as demon-lier (Cerovic et al., 1996; Flexas et al., 1999a; Flexas etstrated by the similarity of results between the first ex-al., 1999b; Rosema et al., 1998), here we show (thanksperiment and the second one, as well as previous resultsto the ability of FIPAM to measure Fs and PPFD from(Flexas et al., 1998; Flexas et al., 1999a).the same leaf area and every second) that the responseof Fs to sudden changes in PPFD takes place in seconds,so the light response of Fs should be an accurate andThe Importance of Fluorescence Parameters forsimple signal to detect water stress that can be used evenWater Stress Assessmentin cloudy days or with heterogeneous structures such asThe present results show that it is not possible to esti-those of the glasshouse used here.mate the rate of CO2 assimilation from chlorophyll fluo-
To illustrate the correlation between Fs and PPFDrescence measurements in grapevines, at least in the ab-even during short periods of light variation (several min-sence of complementary approaches. A similar conclusionutes), we have depicted such a correlation with data fromhas been recently pointed out by Rosema et al. (1998).Figs. 5a and 5c (Fig. 9). We have chosen data from mo-Even in irrigated plants there was an impairment be-notonous light transitions since the changes at hightween electron transport and CO2 assimilation, consistentPPFD are too rapid and cause high hysteresis. The dif-with previous reports (Flexas et al., 1998; Flexas et al.,ferent response of well-watered and water-stressed plant1999a; Lal et al., 1996), which is likely due to an increaseis quite clear. It is shown that under water stress, therein alternative ways for electron consumption, such asis a saturation of the minimum value of Fs above 400photorespiration during the afternoon, and not to an in-lmol m22 s21. This may coincide with the saturation ofcorrect determination of PSII ETR, as suggested by Ro-nonphotochemical quenching. Under irrigation, withsema et al. (1998). In drought plants there was a general-these particular plants and conditions, the relationshipized lack of relationship between these two parameters.between Fs and PPFD is poor above 600 lmol m22 s21,In spite of these results, chlorophyll fluorescence as-due to the slow development of a high nonphotochemi-sessment can be a very useful tool for stress detection,cal quenching (not shown in Fig. 9). However, in field-especially with instruments that allow a continuous re-grown plants, this relationship is clear at much highercording under natural light conditions, such as the FI-PPFD values (Flexas et al., 1999a). This technique is es-PAM tested here. Some fluorescence parameters clearlypecially easy to use with the FIPAM fluorimeter, whichreflect plant water status, and we will focus on two of
them: the relationship between DF/Fm9 and light inten- allows the measuring of Fs in a same leaf continuously

Fluorescence Responses to Water Stress 295
tion and Science (MEC) and Beca de Investigacion of UIB forJF. JF wishes to thanks Miguel Mansilla, from the EducationDepartment of Govern Balear, for administrative help duringhis PSS. We are indebted to Prof. G. Cornic and his researchgroup for the use of their gas-exchange analyser and to Dr. Na-thalie Ollat (INRA-Bourdeaux) for providing the grapevineplants. Language corrections by Dr. E. Descals are gratefullyacknowledged.
REFERENCES
Apostol, S. L., Briantais, J.-M., and Moya, I. (1999), Photoinhi-bition of pea leaves by accumulation of over-saturating lightpulses in darkness. In Proceedings of the XIth InternationalFigure 9. Typical response of Fs to PPFD during a lightCongress on Photosynthesis (G. Garab, Ed.), Kluwer Aca-to shade variation of several minutes duration. Data aredemic Publishers, Dordrecht pp. 2127–2130.shown for a well-watered plant (triangles, corresponding
Asada, K. (1999), The water-water cycle in chloroplasts: Scav-to data from Fig. 5a) and a water-stressed plant (circles,corresponding to data from Fig. 5c). enging of active oxygen and dissipation of excess photons.
Annu. Rev. Plant Physiol. Plant Mol. Biol. 50:601–639.Azcon-Bieto, J. (1983), Inhibition of photosynthesis by carbohy-
drates in wheat leaves. Plant Physiol. 73:681–686.Bilger, W., Schreiber, U., and Bock, M. (1995), Determinationand at a distance during long periods without interfering
of the quantum efficiency of photosystem II and of non-with leaf physiology.photochemical quenching of chlorophyll fluorescence in thefield. Oecologia 102:425–432.
Bolhar-Nordenkampf, H. R., Long, S. P., Baker, N. R., Oquist,G., Schreiber, U., and Lechner, E. G. (1989), ChlorophyllCONCLUSIONSfluorescence as a probe of the photosynthetic competence
The present work shows that the new technique dis- of leaves in the field: A review of current instrumentation.cussed here is a very useful tool for remote sensing of Funct. Ecol. 3:497–514.vegetation stress. Brestic, M., Cornic, G., Fryer, M. J., and Baker, N. R. (1995),
The present results confirm and extend previous Does photorespiration protect the photosynthetic apparatusin French bean leaves from photoinhibition during droughtwork by Cerovic et al. (1996) and Flexas et al. (1999a).stress? Planta 196:450–457.The interest of Fs response to light as a putative indica-
Bukhov, N. G., Wiese, C., Neimanis, S., and Heber, U. (1996),tor of water stress is shown again. This idea has alsoControl of photosystem II in spinach leaves by continuousbeen proposed by Rosema et al. (1998).light and by light pulses given in the dark. Photosynth.In addition, this work presents novel aspects in re-Res. 50:181–191.spect to our previous work: Cecchi, G., Mazzinghi, P., Pantani, L., Valentini, R., Tirelli, D.,and De Angelis, P. (1994), Remote sensing of chlorophyll a1. The possibility of measuring Fm at distance hasfluorescence of vegetation canopies: 1. Near and far fieldbeen shown for the first time thanks to the newmeasurement techniques. Remote Sens. Environ. 47:18–28.concept of saturating fluorescence by changing
Cerovic, Z. G., Goulas, Y., Gorbunov, M., Briantais, J.-M., Ca-the frequency of the excitation source.menen, L., and Moya, I. (1996), Fluorosensing of water2. Fs and PPFD are obtained from the same leafstress in plants: Diurnal changes of the mean lifetime andpiece with this new instrument. This has allowed yield of chlorophyll fluorescence, measured simultaneously
us to resolve rapid variations (within seconds) of and at distance with a c-LIDAR and a modified PAM-fluo-Fs in response to sudden changes of incident rimeter, in maize, sugar beet and Kalanchoe. Remote Sens.light. Such variations are shown to be a simple Environ. 58:311–321.and rapid way to detect the dominant type of Chaumont, M., Morot-Gaudry, J.-F., and Foyer, C. (1994),quenching regulating leaf photochemistry, which Seasonal and diurnal changes in photosynthesis and carbon
partitioning in Vitis vinifera leaves in vines with and withoutis a sensitive indicator of plant stress.fruit. J. Exp. Bot. 45(278):1235–1243.
Chaves, M. M. (1991), Effects of water deficits on carbon as-similation. J. Exp. Bot. 42(234):1–16.
This work has benefited from DG XII—European CommunityCornic, G. (1994), Drought stress and high light effects on leafTMR-LSF Programme, and is part of LURE Projects BF037-
photosynthesis. In Photoinhibition of Photosynthesis: From96, BF028-97, and BF026-98 and CICYT Projects AGF94-0687Molecular Mechanisms to the Field (N. R. Baker, J. R. Bow-and AGF97-1180 of the Plan Nacional (Spain). Financial sup-yer, Eds.), Bios Scientific Publishers, Oxford, pp. 297–313.port from CNRS (GDR 1536) is gratefully acknowledged, as
well as Beca de Colaboracion of the Spanish Ministry of Educa- Cornic, G., and Briantais, J. M. (1991), Partitioning of electron

296 Flexas et al.
flow between CO2 and O2 reduction in a C3 leaf (Phaseolus CO2 fixation and carboxylation capacity. Photosynth. Res.49:57–69.vulgaris L.) at different CO2 concentrations and during
drought stress. Planta 183:178–184. Lichtenthaler, H. K. (1996), Vegetation stress: An introductionto the stress concept in plants. J. Plant Physiol. 148:4–14.Cornic, G., Le Gouallec, J.-L., Briantais, J. M., and Hodges,
M. (1989), Effect of dehydration and high light on photo- Lu, C., and Zhang, J. (1998), Effects of water stress on photo-synthesis, chlorophyll fluorescence and photoinhibition insynthesis of two C3 plants (Phaseolus vulgaris L. and Elatos-
tema repens (Lour.) Hall f.). Planta 177:84–90. wheat plants. Aust. J. Plant Physiol. 25:883–892.Lu, C., Zhang, J., and Vonshak, A. (1998), Inhibition of theDownton, W. J. S., Grant, W. J. R., and Loveys, B. R. (1987),
Diurnal changes in the photosynthesis of field-grown grape quantum yield of PS II electron transport in Spirulina plat-ensis by osmotic stress may be explained mainly by an in-vines. New Phytol. 105:71–80.
Edwards, G. E., and Baker, N. R. (1993), Can CO2 assimilation crease in the proportion of the QB-non-reducing PS II reac-tion centres. Aust. J. Plant Physiol. 25:689–694.in maize leaves be predicted accurately from chlorophyll
fluorescence analyses? Photosynthesis Res. 37:89–102. Moya, I., Goulas, Y., Morales, F., Camenen, L., Guyot, G., andSchmuck, G. (1995), Remote sensing of time-resolved chlo-Flexas, J., Escalona, J. M., and Medrano, H. (1998), Down-reg-
ulation of photosynthesis by drought stress under field rophyll fluorescence and back-scattering of the laser excita-tion by the vegetation. EARSeL Adv. Remote Sens. 3:188–conditions in grapevine leaves. Aust. J. Plant Physiol. 25:
893–900. 197.Moya, I., Guyot, G., and Goulas, Y. (1992), Remotely sensedFlexas, J., Escalona, J. M., and Medrano, H. (1999a), Water
stress induces different levels of photosynthesis and electron blue and red fluorescence emission for monitoring vegeta-tion. ISPRS J. Photogram. Remote Sens. 47:205–231.transport rate regulations in grapevines. Plant Cell Envi-
ron. 22:39–48. Oquist, G., and Chow, W. S. (1992), On the relationship be-tween the quantum yield of Photosystem II electron trans-Flexas, J., Escalona, J. M., Cifre, J., and Medrano, H. (1999b),
Water stress effects on variations of steady-state chlorophyll port, as determined by chlorophyll fluorescence and thequantum yield of CO2-dependent O2 evolution. Photosynth.fluorescence (Fs) in response to light. In Proceedings of the
XIth International Congress on Photosynthesis (G. Garab, Res. 33:51–62.Osmond, C. B., Maxwell, K., Bjorkman, O., Badger, M., andEd.), Kluwer Academic Publishers, Dordrecht, pp. 2589–
2592. Leegood, R. (1997), Too many photons: Photorespiration,photoinhibition and photooxidation. Trends Plant Sci.Flexas, J., Badger, M., Chow, W. S., Medrano, H., and Os-
mond, C. B. (1999c), Analysis of the relative increase in 4:119–121.Park, Y.-I., Chow, W. S., Osmond, C. B., and Anderson, J. M.photosynthetic O2 uptake when photosynthesis in grapevine
leaves is inhibited following low night temperatures and/or (1996), Electron transport to oxygen mitigates against thephotoinactivation of Photosystem II in vivo. Photosynth.water stress. Plant Physiol. 121:1–10.
Foyer, C., Furbank, R., Harbinson, J., and Horton, P. (1990), Res. 50:23–32.Rosema, A., Snel, J. F. H., Zahn, H., Buurmeijer, W. F., andThe mechanisms contributing to photosynthetic control of
electron transport by carbon assimilation in leaves. Pho- Van Hove, L. W. A. (1998), The relation between laser-induced chlorophyll fluorescence and photosynthesis. Re-tosynth. Res. 25:83–100.
Genty, B., Briantais, J. M., and Baker, N. R. (1989), The rela- mote Sens. Environ. 65:143–154.Schindler, C., and Lichtenthaler, H. K. (1996), Photosynthetictionship between the quantum yield of photosynthetic elec-
tron transport and quenching of chlorophyll fluorescence. CO2 assimilation, chlorophyll fluorescence and zeaxanthinaccumulation in field grown maple trees in the course of aBiochim. Biophys. Acta 990:87–92.
Genty, B., Briantais, J.-M., and Vieira da Silva, J. B. (1987), sunny and a cloudy day. J. Plant Physiol. 148:399–412.Schmuck, G., Moya, I., Pedrini, A., van der Linde, D., Lichten-Effects of drought on primary photosynthetic processes of
cotton leaves. Plant Physiol. 83:360–364. thaler, H. K., Stober, F., Schindler, C., and Goulas, Y.(1992), Chlorophyll fluorescence lifetime determination ofGunther, K. P., Dahn, H.-G., and Ludeker, W. (1994), Remote
sensing vegetation status by laser-induced fluorescence. Re- waterstressed C3- and C4-plants. Rad. Environ. Bioph. 31:141–151.mote Sens. Environ. 47:10–17.
Harbinson, J., Genty, B., and Baker, N. R. (1989), Relationship Schreiber, U. (1983), Chlorophyll fluorescence yield changes asa tool in plant physiology. I. The measuring system. Pho-between the quantum efficiencies of photosystems I and II
in pea leaves. Plant Physiol. 90:1029–1034. tosynth. Res. 4:361–373.Schreiber, U., Bilger, W., and Neubauer, C. (1994), Chloro-Kozaki, A., and Takeba, G. (1996), Photorespiration protects C3
plants from photooxidation. Nature 384:557–560. phyll fluorescence as a nonintrusive indicator for rapid as-sessment of in vivo photosynthesis. In Ecophysiology of Pho-Krall, J. P., and Edwards, G. E. (1992) Relationship between
photosystem II activity and CO2 fixation in leaves. Physiol. tosynthesis (E-D. Schulze, M. M. Caldwell, Eds.), Springer-Verlag, Berlin, pp. 49–70.Plantarum 86:180–187.
Krause, G. H., and Weis, E. (1991) Chlorophyll fluorescence Schultz, H. R. (1997), Water relations and photosynthetic re-sponses of two grapevine cultivars of different geographicaland photosynthesis: The Basics. Annu. Rev. Plant Physiol.
Plant Mol. Biol. 42:313–349. origin during water stress. Acta Hortic. 427:251–266.Takeba, G., and Kozaki, A. (1998), Photorespiration is an es-Lal, A., Ku, M. S. B., and Edwards, G. E. (1996), Analysis of
inhibition of photosynthesis due to water stress in the C3 sential mechanism for the protection of C3 plants from pho-tooxidation. In Stress Responses of Photosynthetic Organ-species Hordeum vulgare and Vicia faba: Electron transport,

Fluorescence Responses to Water Stress 297
isms (K. Satoh, N. Murata, Eds.), Elsevier Science B.V., tosystem II in relation to “energy”-dependent quenching ofThe Netherlands, pp. 15–36. chlorophyll fluorescence. Biochim. Biophys. Acta 894:198–
Valentini, R., Epron, D., De Angelis, P., Matteucci, G., and 208.Dreyer, E. (1995), In situ estimation of net CO2 assimila- Wingler, A., Quick, W. P., Bungard, R. A., Bailey, K. J., Lea,tion, photosynthetic electron flow and photorespiration in P. J., and Leegood, R. C. (1999), The role of photorespira-Turkey oak (Quercus cerris L.) leaves: Diurnal cycles under tion during drought stress: An analysis utilising barley mu-different levels of water supply. Plant Cell Environ. 18: tants with reduced activities of photorespiratory enzymes.631–640. Plant Cell Environ. 22:361–373.
Weis, E., and Berry, J. A. (1987), Quantum efficiency of pho-