status report on nox controls - · pdf filestatus report on nox controls for gas turbines...
TRANSCRIPT

Status Report on NOx Controls
for
Gas Turbines Cement Kilns
Industrial Boilers Internal Combustion Engines
Technologies & Cost Effectiveness
December 2000

ii
Members of Northeast States for Coordinated Air Use Management
Carmine DiBattista, Bureau ChiefConnecticut Department of Environmental Protection, Bureau of Air Management
James P. Brooks, Bureau DirectorMaine Department of Environmental Protection, Bureau of Air Quality
Nancy L. Seidman, Deputy Director of Air ProgramsMassachusetts Department of Environmental Protection, Bureau of Waste Prevention
Kenneth A. Colburn, DirectorNew Hampshire Department of Environmental Services, Air Resources Division
John C. Elston, AdministratorNew Jersey Department of Environmental Protection, Office of Air Quality Management
Robert R. Warland, DirectorNew York Department of Environmental Conservation, Division of Air Resources
Stephen Majkut, ChiefRhode Island Department of Environmental Management, Office of Air Resources
Richard A. Valentinetti, DirectorVermont Department of Environmental Conservation, Air Pollution Control Division
Jason Grumet, Executive DirectorNortheast States for Coordinated Air Use Management

Status Report on NOx Controlsfor
Gas TurbinesCement Kilns
Industrial BoilersInternal Combustion Engines
Technologies & Cost Effectiveness
December 2000
Project DirectorPraveen K. Amar, Ph.D., P.E.
Director, Science and Policy, NESCAUM
Prepared by:James Staudt, Ph.D.
Andover Technology PartnersNorth Andover, MA 01845
www.andovertechnology.com
NESCAUMNortheast States for Coordinated Air Use Management
129 Portland Street, Boston, MA 02114www.nescaum.org

ii
Status Report on NOx for Industrial Boilers, GasTurbines, Internal Combustion Engines and CementKilns; Control Technologies and Cost EffectivenessProject Director
Praveen Amar, NESCAUM
Principal InvestigatorJames Staudt, Andover Technology Partners
Technical EditorIngrid Ulbrich, NESCAUM
Administrative Support
Karen Fadely, Lisa Fishbone, NESCAUM

iii
Acknowledgements
Preparation of this report was funded by the Office of Atmospheric Programs andthe Office of Air Quality Planning and Standards of the United States EnvironmentalProtection Agency.
The effort was managed by the Northeast States for Coordinated Air UseManagement (NESCAUM). Andover Technology Partners was the prime contractor toNESCAUM.
A unique feature of this report is a collection of case studies (Chapter IV) of real-world experience with NOx control technologies. The case studies outline recentindustrial sector (non-electricity generating sector) experience with control technologiesin the United States. This chapter was prepared in cooperation with operators ofindustrial facilities that are utilizing a number of NOx control technologies for industrialboilers, gas turbines, internal combustion engines, and cement kilns. These companiesundertook a substantial level of effort in providing the operating and cost information oncontrol technologies that was the basis for the preliminary version of case studies,prepared by Andover Technology Partners. The preliminary case studies were thenreviewed and approved by the industrial operators before inclusion of final versions inthis report. Without their assistance, this important aspect of the report would not havebeen possible.
This report was reviewed by the members of Stationary Source and PermitsCommittee of NESCAUM, key technical staff from other states in the Ozone TransportRegion, and staff from the U.S. Environmental Protection Agency.

iv

v
Table of Contents
Acknowledgements
I. Executive Summary................................................................................................................ I-1A. Report Objectives and Organization ...................................................................................... I-1B. NOx Control Technologies and Cost Effectiveness............................................................... I-2B.1 Industrial Boilers ................................................................................................................ I-2B.2 Gas Turbines ...................................................................................................................... I-4B.3 Internal Combustion Engines ............................................................................................. I-5B.4 Cement Kilns...................................................................................................................... I-6
C. Case Studies ........................................................................................................................... I-7
II. NOx Control Technologies..................................................................................................II-1A. Industrial Boilers ................................................................................................................... II-1A.1 Primary Methods of Controlling NOx in Industrial Boilers ............................................. II-2A.2 Secondary Methods of Controlling NOx in Industrial Boilers ......................................... II-4
B. Gas Turbines ....................................................................................................................... II-12B.1 Primary Methods of Controlling NOx from Gas Turbines ............................................. II-12B.2 Secondary Methods of Controlling NOx from Gas Turbines ......................................... II-17
C. Internal Combustion (IC) Engines ...................................................................................... II-21C.1 Primary Methods of Controlling NOx from IC Engines................................................. II-21C.2 Secondary Methods of Controlling NOx from IC Engines............................................. II-22
D. Cement Kilns....................................................................................................................... II-25D.1 Primary Methods of Controlling NOx from Cement Kilns............................................. II-28D.2 Secondary Methods of Controlling NOx from Cement Kilns......................................... II-34D.3 Combination of Technologies ......................................................................................... II-37
E. Summary ............................................................................................................................. II-37F. References ........................................................................................................................... II-38
III. Technology Costs ................................................................................................................ III-1A. Costs of Control ...................................................................................................................III-1A.1 Cost Data ..........................................................................................................................III-1
B. General Methodology...........................................................................................................III-2B.1 Components of Cost .........................................................................................................III-3B.2 Cost Analysis....................................................................................................................III-5
C. Industrial Boilers ..................................................................................................................III-7C.1 Cost Effectiveness of Primary Methods of Controlling NOx from Industrial Boilers.....III-7C.2 Cost Effectiveness of Secondary Methods of Controlling NOx from Industrial
Boilers ............................................................................................................................III-10D. Gas Turbines ......................................................................................................................III-15D.1 Cost Effectiveness of Primary Methods of Controlling NOx from Gas Turbines .........III-15D.2 Cost Effectiveness of Secondary Methods of Controlling NOx from Gas Turbines .....III-21

vi
E. Internal Combustion (IC) Engines .....................................................................................III-26E.1 Cost Effectiveness of Primary Methods of Controlling NOx from IC Engines.............III-26E.2 Cost Effectiveness of Secondary Methods of Controlling NOx from IC Engines.........III-30
F. Cement Kilns......................................................................................................................III-32F.1 Cost Effectiveness of Primary Methods of Controlling NOx from Cement Kilns ........III-33F.2 Cost Effectiveness of Secondary Methods of Controlling NOx from Cement Kilns ....III-37
G. Summary ............................................................................................................................III-39H. References ..........................................................................................................................III-40
IV. Case Studies ......................................................................................................................... IV-1A. Introduction ..........................................................................................................................IV-1B. Industrial Boiler Case Studies ..............................................................................................IV-2B.1 Case Study BLR-1, Minergy Corp, Neenah, Wisconsin..................................................IV-2B.2 Case Study BLR-2, International Paper, Jay, Maine........................................................IV-3B.3 Case Study BLR-3, Chevron Process Heater Equipped with SCR, El Segundo,
California..........................................................................................................................IV-4B.4 Case Study BLR-4, Sauder Woodworking, Archbold, Ohio ...........................................IV-6B.5 Case Study BLR-5, Michigan State University, TB Simon Power Plant, Unit #4,
East Lansing, Michigan....................................................................................................IV-8B.6 Case Study BLR-6, Temple Inland Corp. Shippenville, Pennsylvania..........................IV-10B.7 Case Study BLR-7, Fort James Corporation, Green Bay, Wisconsin............................IV-12B.8 Case Study BLR-8: Eastman Kodak Boiler #15, Micronized Coal Reburn,
Rochester, New York .....................................................................................................IV-13B.9 Case Study BLR-9: Eastman Kodak Boilers #41, 42, 43. Gas Reburn, Rochester,
New York .......................................................................................................................IV-15C. Gas Turbine Case Studies ..................................................................................................IV-19C.1 Case Study GT-1, Duke Energy, Cromwell, Connecticut..............................................IV-19C.2 Case Study GT-2, Duke Energy, Southeast, New York.................................................IV-23C.3 Case Study GT-3, Duke Energy, Stony Point, New York .............................................IV-27C.4 Case Study GT-4 Kern River and Sycamore Cogeneration Projects, Bakersfield,California................................................................................................................................IV-31C.5 Case Study GT-5 PG&E Generating, Manchester Street Station, Providence,
Rhode Island...................................................................................................................IV-33C.6 Case Study GT-6 PG&E Generating, Pittsfield Generating Plant, Pittsfield,
Massachusetts.................................................................................................................IV-34C.7 Case Study GT-7, Tennessee Gas Pipeline, Lockport, New York.................................IV-36
D. Internal Combustion Engine Case Studies .........................................................................IV-39D.1 Case Study IC-1, SYCOM Enterprises, Linden, New Jersey ........................................IV-39D.2 Case Study IC-2, Duke Energy, Stony Point, New York...............................................IV-40D.3 Case Study IC-3, Duke Energy, Burrillville, Rhode Island ...........................................IV-42D.4 Case Study IC-4, Duke Energy, Cromwell, Connecticut ...............................................IV-45D.5 Case Study IC-5, NORESCO, Plymouth Cogeneration, Plymouth, New Hampshire ...IV-48D.6 Case Study IC-6, Tennessee Gas Pipeline, Mercer, Pennsylvania.................................IV-49D.7 Case Study IC-7, Tennessee Gas Pipeline, Syracuse, New York ..................................IV-52

vii
D.8 Case Study IC-8, Tennessee Gas Pipeline, Coudersport, Pennsylvania ........................IV-54E. Cement Kiln Case Studies..................................................................................................IV-56E.1 Case Study CK-1, California Portland Cement, Colton, California...............................IV-56E.2 Case Study CK-2, Texas Industries, Inc., Midlothian, Texas ........................................IV-57E.3 Case Study CK-3, Blue Circle Cement, Atlanta, Georgia .............................................IV-59E.4 Case Study CK-4, Ash Grove Cement, Foreman, Arkansas.........................................IV-60
Appendixes: Worksheets for Economic Analysis ................................................................. IV-1Boiler Worksheets ........................................................................................................................IV-2Gas Turbine Worksheets ............................................................................................................IV-18Reciprocating Internal Combustion Engine Worksheets ...........................................................IV-34Cement Kiln Worksheets ...........................................................................................................IV-46

viii
List of FiguresFigure II-1: SNCR Applied to a Boiler ............................................................................................ II-6Figure II-2: Selective Catalytic Reduction ...................................................................................... II-9Figure II-3: Conventional Gas Reburning...................................................................................... II-10Figure II-4: Fuel-Lean Gas Reburning........................................................................................... II-11Figure II-5: Electro-Catalytic Oxidation Technology.................................................................... II-12Figure II-6: Comparison of a Lean Premixed Combustor and a Conventional Combustor .......... II-13Figure II-7: Solar Turbines’ SoLoNOxTM DLN and Standard Combustor with Conventional
Combustion Technology ........................................................................................................ II-16Figure II-8: Schematic of a Catalytic Gas Turbine Combustor .................................................... II-17Figure II-9: SCR Installation on Combined Cycle Gas Turbine ................................................... II-18Figure II-10: Low-Temperature SCR Installed on a Combined Cycle Gas Turbine ..................... II-19Figure II-11: A Diagram of SCONOxTM and SCOSOxTM ............................................................ II-20Figure II-12: Pre Chamber Low Emission Combustion Retrofit .................................................. II-23Figure II-13: Urea SCR System (ARISTM 2000) for IC Engines .................................................. II-25Figure II-14. Simplified Sketch of a Rotary Kiln........................................................................... II-26Figure II-15: A Precalciner Cement Kiln with Five-Stage Cyclonic Preheater/Precalciner ......... II-27Figure II-16: NOx Emissions for Various Cement Kiln Types ..................................................... II-28Figure II-17a: Frequency of NOx Values on Cement Kiln with Mid-Kiln Tire Injection (Without
Mixing Air) ............................................................................................................................ II-30Figure II-17b Frequency of NOx Values for the Cement Kiln with Mid-Kiln Tire Injection in Figure
II-17a (With Mixing Air) ....................................................................................................... II-31Figure II-18: A Preheater Kiln Adding Steel Slag For CemStar ................................................... II-32Figure II-19a: Base Case Testing (without CemStar) - NOx versus Burn-Zone Temperature45 ... II-33Figure II-19b: CemStar Testing - NOx versus Burn Zone Temperature ....................................... II-33Figure II-20a: NOx Emissions at Ash Grove Cement After Process Control
(from Case Study CK-4) ......................................................................................................... II-35Figure II-20b: NOx Emissions Histogram at Ash Grove Cement Before Process Control
(from Case Study CK-4) ......................................................................................................... II-35Figure II-21: Biosolids Injection Process Equipment on a Precalciner Kiln ................................ II-37Figure III-1: Cost Effectiveness ($/ton of NOx reduced) of Reducing NOx from a 75 MW Turbine
by DLN Retrofit of Turbine Originally Equipped with Water Injection ...............................III-19Figure III-2: Capital Cost of Gas Turbine Exhaust Treatment NOx Reduction Technologies
(Refs. 9 and 14) ......................................................................................................................III-22Figure III-3: Cubic Meters of SCR Catalyst for Turbine with HRSG (Ref. 16)...........................III-23Figure IV-1: Nitrogen Oxide Emission Burning Tires vs. Not-Burning Tires .............................IV-63Figure IV-2: Effect of Tires and Process Control on NOx Emissions ..........................................IV-64

ix
List of TablesTable II-1 Industrial Boiler Firing Configurations and Typical Primary Fuels ............................... II-1Table II-2: Statistics Regarding Low-NOx Air Register Burner Performance for Boilers Over ~250
MMBTU/hr,............................................................................................................................... II-4Table II-3a: Performance of Industrial Boiler Types Equipped with Urea SNCR ........................ II-7Table II-3b: Performance of Industrial Boiler Types Equipped with Ammonia SNCR ................ II-7Table II-4a: NOx Performance of Solar Industrial Gas Turbines with SoLoNOxTM Dry Low NOx
Combustor .............................................................................................................................. II-14Table II-4b: NOx Performance of Large Gas Turbines with Dry Low NOx ................................ II-15Table II-5: Summary of Cement Kiln Process Types in U.S. ....................................................... II-26Table II-6: NOx Reduction at Cement Kilns Using Mid-Kiln Technology .................................. II-30Table II-7: NOx Reduction Performance of Urea SNCR on Precalciner Cement Kilns .............. II-36Table III-1: Assumptions for Pro Forma Economic Analysis.........................................................III-4Table III-3a: Cost Effectiveness for NOx Reduction with LNB on a 350 MMBTU/hr Coal-Fired
Boiler with Capital Cost of $5,000/MMBTU/hr (36% NOx ReductionFrom 0.60 lb/MMBTU)............................................................................................................III-8
Table III-3b: Cost Effectiveness for NOx Reduction with LNB on a 350 MMBTU/hr Coal-FiredBoiler with Capital Cost of $5,000/MMBTU/hr (25% NOx ReductionFrom 0.60 lb/MMBTU)............................................................................................................III-8
Table III-4a: Cost Effectiveness for NOx Reduction with LNB on One Gas-Fired 350 MMBTU/hrBoiler........................................................................................................................................III-9
Table III-4b: Cost Effectiveness for NOx Reduction Through Minor Modifications on One 350MMBTU/hr Boiler ...................................................................................................................III-9
Table III-5: Cost Effectiveness for Burner Modification on Two Oil-Fired 680 MMBTU/hr Boilers..................................................................................................................................................III-9
Table III-6: Reported Cost of Urea SNCR for Wood-Fired Power Boilers .................................III-10Table III-7: Cost Effectiveness for SNCR NOx Reduction on a 350 MMBTU/hr Boiler............III-11Table III-8a: Cost Effectiveness for SCR NOx Reduction on a 350 MMBTU/hr Coal-Fired Boiler -
80% NOx Reduction from 0.45 lb/MMBTU and Capital Cost of $10,000/MMBTU/hr.......III-12Table III-8b: Cost Effectiveness for SCR NOx Reduction on a 350 MMBTU/hr Coal-Fired Boiler -
80% NOx Reduction from 0.45 lb/MMBTU and Capital Cost of $15,000/MMBTU/hr.......III-12Table III-9a: Cost Effectiveness for SCR NOx Reduction on a 350 MMBTU/hr Gas-Fired
Boiler......................................................................................................................................III-13Table III-10a: Cost Effectiveness of NOx Reduction by Conventional Gas Reburn, Assuming 55%
NOx Reduction from 0.45 lb/MMBTU, 20% Gas Injection, and $0.75/MMBTU IncrementalFuel Cost for Gas....................................................................................................................III-14
Table III-10b: Same as 3.10a, Except $1.00/MMBTU Incremental Fuel Cost for Gas................III-14Table III-11a: Cost Effectiveness of NOx Reduction by FLGR, Assuming 35% NOx Reduction
from 0.45 lb/MMBTU, 6% Gas Injection, and $0.75/MMBTU Incremental Fuel Cost forGas..........................................................................................................................................III-14
Table III-11b: Same as 3.11a, Except $1.00/MMBTU Incremental Fuel Cost for Gas................III-14Table III-12a: Cost Effectiveness of NOx Reduction by AEFLGR, Assuming 60% NOx Reduction
from 0.45 lb/MMBTU, 6% Gas Injection, NSR=1.2 and $0.75/MMBTU Incremental Fuel Costfor Gas. ...................................................................................................................................III-15
Table III-12b: Same as III-12a, Except $1.00/MMBTU Incremental Fuel Cost for Gas. ............III-15

x
Table III-13. Cost Effectiveness ($/ton) for Two Solar Centaur (7000 hp each) Retrofit with DLNfor Reducing NOx from 135 to 50 ppm (63% reduction) ......................................................III-17
Table III-14. Cost Effectiveness ($/ton) for Retrofit of Two Solar Mars (2x13,000 hp)..............III-17Table III-15. Cost Effectiveness for 75 MW GE Turbine Retrofit with DLN from Conventional
Combustion, Reduction from 154 ppm to 15 ppm (90% reduction)......................................III-18Table III-16. Cost Effectiveness for 75 MW Turbine Retrofit with DLN from Water Injection,
Reduction from 42 ppm to 15 ppm ........................................................................................III-18Table III-17a: Estimated Cost Effectiveness for Diluent Injection on Twenty-Four 21-MW Peaking
Turbines. Reduction from 125 ppm to 50 ppm (gas firing) ..................................................III-20Table III-17b: Estimated Cost Effectiveness for Diluent Injection on Twenty-Four 21-MW Peaking
Turbines. Reduction from 180 ppm to 50 ppm (distillate oil firing).....................................III-21Table III-18a: Cost Effectiveness for SCR Retrofit on Simple Cycle 75 MW Gas Turbine with
Baseline NOx of 154 ppm and Controlled to 15 ppm (90% Control)....................................III-24Table III-18b: Cost Effectiveness for SCR Retrofit on Simple Cycle 75 MW Gas Turbine with
Baseline NOx of 42 ppm and Controlled to 7 ppm (83% Control)........................................III-24Table III-18c: Cost Effectiveness for SCR Retrofit on Simple Cycle 75 MW Gas Turbine with
Baseline NOx of 15 ppm and Controlled to 3 ppm (80% Control)........................................III-24Table III-18d: Cost Effectiveness for SCR retrofit on Simple Cycle 7000 hp (~5 MW) Gas Turbine
with Baseline NOx of 142 ppm and Controlled to 15 ppm (89% Control) ...........................III-24Table III-18e: Cost Effectiveness for SCR retrofit on Simple Cycle 7000 hp (~5 MW) Gas Turbine
with Baseline NOx of 42 ppm and Controlled to 5 ppm (88% Control) ...............................III-24Table III-19a: Cost Effectiveness for Conventional SCR on Combined Cycle 75 MW Gas Turbine
with Baseline NOx of 154 ppm and Controlled to 15 ppm....................................................III-25Table III-19b: Cost Effectiveness for Conventional SCR on Combined Cycle 75 MW Gas Turbine
with Baseline NOx of 42 ppm and Controlled to 7 ppm........................................................III-26Table III-19c: Cost Effectiveness for Conventional SCR on Combined Cycle 75 MW Gas Turbine
with Baseline NOx of 15 ppm and Controlled to 3 ppm........................................................III-26Table III-19d: Cost Effectiveness for Conventional SCR on Combined Cycle 7000 hp (~5 MW) Gas
Turbine with Baseline NOx of 142 ppm and Controlled to 15 ppm......................................III-26Table III-19e: Cost Effectiveness for Conventional SCR on Combined Cycle 7000 hp (~5 MW) Gas
Turbine with Baseline NOx of 42 ppm and Controlled to 5 ppm..........................................III-26Table III-20: Experience and Costs of Ignition Timing Retard (Case Study IC-6) ......................III-27Table III-21: Estimated Cost Effectiveness ($/ton of NOx removed) for Ignition Timing Retard on
six 1,100 HP Engines from 10 gm/hp-hr to 9 gm/hp-hr (10% Reduction) ............................III-27Table III-22: Estimated Cost Effectiveness ($/ton of NOx removed) for Injection Timing Retard on
six 1,100 HP Engines from 10 gm/hp-hr to 7.5 gm/hp-hr (25% Reduction) .........................III-28Table III-23: Estimated Cost Effectiveness ($/ton of NOx removed) for High Energy Ignition/A-F
Ratio Adjustment on four 2,500 HP engines from 15 to 7 gm/hp-hr (53% Reduction) ........III-28Table III-24: Cost Effectiveness for two 3,400 HP IC Gas Engines (low speed) Equipped with Low-
Emission Combustion Technology - 77% NOx reduction from 13 gm/hp-hr .......................III-29Table III-25: Cost Effectiveness for Four 2,500 HP IC Gas Engines (medium speed) Equipped with
Low-Emission Combustion technology - 80% NOx Reduction from 15 gm/hp-hr ..............III-29Table III-26: Cost Effectiveness for Four 2,500 HP IC Dual-Fuel Engines Equipped with Low-
Emission Combustion Technology - 80% NOx Reduction from 15 gm/hp-hr......................III-29Table III-27a: Cost Effectiveness for Three 3130 HP Diesel Engines Equipped with SCR
Technology - 90% NOx Reduction from 10 gm/hp-hr ..........................................................III-31

xi
Table III-27b: Cost Effectiveness for Three 3130 HP Gas-Fired Engines Equipped with SCRTechnology - 90% NOx Reduction from 10 gm/hp-hr ..........................................................III-31
Table III-27c: Cost Effectiveness for One 1800 HP Diesel Engine Equipped with SCR Technology -90% NOx Reduction from 10 gm/hp-hr.................................................................................III-31
Table III-27d: Cost Effectiveness for One 1800 HP Gas-Fired Engine Equipped with SCRTechnology - 90% NOx Reduction from 10 gm/hp-hr ..........................................................III-31
Table III-28a: Cost Effectiveness for One 1971 HP Diesel Engine Equipped with Mobile-SourceDerivative SCR NOx Reduction System Technology - 75% NOx Reduction from7.62 gm/hp-hr .........................................................................................................................III-32
Table III-28b: Cost Effectiveness for One 1971 HP Diesel Engine Equipped with Mobile-SourceDerivative SCR NOx Reduction System Technology - 75% NOx Reduction from15 gm/hp-hr ............................................................................................................................III-32
Table III-29a: Cost Effectiveness of Indirect Firing and Mid Kiln Tire Firing on Long-Dry Kiln -49% Reduction from 5.0 lb/ton Clinker on Two 96 Ton/hr. Kilns ........................................III-34
Table III-29b: Cost Effectiveness of Indirect Firing and Mid Kiln Tire Firing on Long-Dry Kiln -49% Reduction from 5.0 lb/ton Clinker on Two 96 Ton/hr. Kilns ........................................III-34
Table III-29c: Cost Effectiveness of Indirect Firing and Mid Kiln Tire Firing on Long-Dry Kiln -49% Reduction from 5.0 lb/ton Clinker on Two 96 Ton/hr. Kilns ........................................III-34
Table III-30a: Cost Effectiveness of Mid Kiln Tire Firing on Long-Dry Kiln - 20% Reduction from5.0 lb/ton Clinker on Two 40 Ton/hr Kilns............................................................................III-35
Table III-30b: Cost Effectiveness of Mid Kiln Tire Firing on Long-Dry Kiln - 20% Reduction from5.0 lb/ton Clinker on Two 40 Ton/hr Kilns............................................................................III-36
Table III-30c: Cost Effectiveness of Mid Kiln Tire Firing on Long-Dry Kiln - 20% Reduction from5.0 lb/ton Clinker on Two 40 TPH Kilns ...............................................................................III-36
Table III-31a: Cost Effectiveness of CemStar - 20% Reduction from 200 lb NOx/hr/kiln (800 pphtotal) on Four 40-Ton/hr Wet Process Kilns, Net Clinker Value = $15/ton ..........................III-37
Table III-31b: Cost Effectiveness of CemStar - 20% Reduction from 200 lb NOx/hr/kiln (800 pphtotal) on Four 40-Ton/hr Wet Process Kilns, Net Clinker Value = $30/ton ..........................III-37
Table III-31c: Cost Effectiveness of CemStar - 20% Reduction from 200 lb NOx/hr/kiln (800 pphtotal) on Four 40-Ton/hr Wet Process Kilns, Net Clinker Value = $50/ton ..........................III-38
Table III-32: Reported Approximate Capital Cost for Urea SNCR System on a PrecalcinerKiln ........................................................................................................................................III-38
Table III-33: Cost Effectiveness of SNCR on 150 Ton/hr Precalciner Kiln, 45% NOx Reduction(from 700 lb/hr to 385 lb/hr) ..................................................................................................III-38

xii

I-1
I. Executive Summary
This Northeast States for Coordinated Air Use Management (NESCAUM) report evaluatesvarious control technologies and their cost effectiveness in reducing emissions of oxides of nitrogen(NOx) from four major source categories: industrial boilers, gas turbines, stationary internalcombustion engines, and cement kilns. As a group, these sources emit substantial amounts of NOxin the United States, and for this reason, have been identified by the U.S. Environmental ProtectionAgency (EPA) and many state and local regulatory agencies as potential sources for NOx controls.In the recent past, control of NOx emissions has been required to reduce both the ground-level ozone(NOx and volatile organic compounds are two major precursors to the formation of ground-levelozone) and acid deposition. Additionally, NOx emissions contribute to the air pollution problems offine particles and regional haze (visibility degradation), and to ecological problems includingeutrophication of marine bays and estuaries. Further NOx reductions may be necessary to addressthese environmental problems in addition to the current focus on ground-level ozone and aciddeposition.
A unique feature of this technology assessment report is the detailed description of casestudies of actual facilities that are currently using various NOx control technologies for the foursource categories. The case studies provide valuable real-world information on applicability, cost,performance, and reliability of technologies used. This information was useful in determiningapplicability and cost effectiveness of available control technologies to the four source categories. Itis important to note that the conclusions drawn in this study regarding technical and economicfeasibility of various control technologies are therefore grounded in “real-world data.”
A. Report Objectives and Organization
This report identifies and evaluates NOx control technologies that have been commerciallyapplied to the source categories of interest and, based on field experience, assesses the feasibility andcost-effectiveness of applying these technologies to many existing sources that are currentlyuncontrolled. Case studies were undertaken for actual installations of NOx reduction technologieson many sources, and detailed write-ups were prepared in cooperation with the users of thetechnologies. The users provided all of the information and approved the written descriptions of thecase studies (Chapter IV). Therefore, these case studies represent the user's view of theperformance, reliability, and cost of technologies.
In this report, cost effectiveness is measured in dollars per ton of NOx removed ($/ton), andin the case of cement kilns, in terms of dollars per unit of product ($/ton of clinker) as well as indollars per ton of NOx removed. Cost effectiveness is calculated for both annual and seasonalcontrols (seasonal controls are for the five-month ozone season from May 1 to September 30).Whenever available and appropriate, case study information was used as the basis for the costanalysis.
This report is organized into four chapters. Following this Executive Summary, Chapter IIprovides a technical description of control technologies that are commercially available. Chapter IIalso provides a brief background on those technologies that are rapidly emerging, but are not yet

I-2
well established. Chapter III deals with the estimates of costs associated with the application ofcommercially available technologies, including detailed cost effectiveness numbers in $/ton, as afunction of fuel use, capacity factors, and size of the units. Finally, Chapter IV presents twenty-eightcase studies of field experience (both operating and cost information) with control technologiesdescribed in Chapter II. The cost effectiveness calculations of Chapter III incorporate the fieldexperience of case studies where appropriate.
The following section discusses the most significant findings with regard to the technologiesand costs for each source category. The concluding section of the Executive Summary (section C)outlines major findings from case studies experience.
B. NOx Control Technologies and Cost Effectiveness
Estimates of cost effectiveness are made for both annual and seasonal NOx control scenarios.In the case of seasonal control, it is assumed that the technology is secured ("turned off"), if feasible,outside of the ozone season to save on the cost of reagents or more expensive fuel. This type ofseasonal operation is possible for many secondary control technologies such as Selective Non-Catalytic Reduction (SNCR) or gas reburn. However, most primary control technologies, such asLow-NOx Burners, provide NOx reductions all year. When calculating cost effectiveness on aseasonal control basis, no credit is taken for the NOx reductions outside of the ozone season, sincethese reductions are not required under current regulations. It should be noted that some states in theNortheast have recently adopted or are seriously considering the adoption of year-round NOxcontrols to address other environmental problems such as acid deposition and regional haze.Calculations of cost effectiveness for annual controls are based on the assumption that NOxreductions occur on year-round operation.
B.1 Industrial Boilers
For industrial boilers, combustion and post-combustion controls are reviewed. Low-NOxBurners (LNB), overfire air (OFA), Selective Non-Catalytic Reduction (SNCR), Selective Catalyticreduction (SCR), and reburn technology have been used with industrial boilers.
Decisions to use overfire air should be made on a case-by-case basis. Industrial boilers firingpulverized coal that use Low-NOx Burners without overfire air should be capable of meeting NOxlevels similar to those of utility boilers using similar equipment. Some industrial boilers are notcapable of using overfire air and deep combustion staging, although the case studies discuss fourboilers that use overfire air as part of a reburning system. For pulverized coal boilers, annualreductions on the order of 30% can be achieved with Low-NOx Burners at an estimated cost of lessthan $2,000/ton, even at a capacity factori as low as 45%.
i Capacity factor is a term used frequently in this report to describe the level of operation of the piece of equipment inrelation to what the equipment is capable of. Capacity factor is usually expressed as a decimal fraction or a percentage.A capacity factor of 100% (or 1.0) indicates that the equipment is operated at full production capacity for the entire year(8,760 operating hours at full output per year). A capacity factor of 50% (or 0.50) indicates that the equipment isoperated at a production level equivalent to 50% production capacity for the full year. For example, a 10 MW turbine-generator with a capacity factor of 65% (or 0.65) produces 10 x 8,760 x 0.65 = 56,940 MWhr in one year. While it is

I-3
Low-NOx Burners were able to control to a median NOx level of 0.10 lb/MMBTU forindustrial boilers firing natural gas, with the substantial majority (over 80%) of these boilerscontrolling to below 0.15 lb/MMBTU. Boilers equipped with Low-NOx Burners firing number sixfuel oil had a median control level of 0.35 lb NOx/MMBTU, with variable performance probablydue to the variable nitrogen content of the fuel. Annual NOx reductions with LNBs can be achievedfrom oil- and gas-fired industrial boilers at an estimated cost effectiveness of about $2,000/ton orless for moderate to high capacity factors (65 to 85%) units.
SNCR appears to be well suited for use with industrial boilers. SNCR is very widely used onindustrial boilers, particularly those firing solid fuels, and achieves NOx reductions of over 50% onaverage. In boilers firing pulverized coal, NOx reductions with SNCR are likely to be similar tothose from utility boilers with SNCR – on the order of 35%. NOx reductions from a boiler firingpulverized coal and equipped with SNCR are estimated to cost in the range of $1,300 to $1,800/tonfor annual control and from $2,000 to $3,000/ton for seasonal controls.
While SCR has seen limited use in the United States on industrial boilers firing solid fuel,there are no technical reasons to believe that SCR cannot be used in these applications. SubstantialNOx reductions up to 90% and greater, as achieved with SCR on electric utility boilers, would beexpected for pulverized coal-fired industrial boilers. At moderate to high capacity factors, thereductions from industrial boilers are estimated to cost below $2,000/ton NOx for annual controls.For seasonal controls at moderate to high capacity factors, the range of cost effectiveness varies from$3,000 to $5,000 per ton of NOx. SCR on gas-fired boilers is estimated to provide reductions for$2,000/ton on an annual basis for boilers of about 350 MMBTU/hr size that operate at high capacityfactors. Under similar conditions, gas-fired boilers of 100 MMBTU/hr rating can be retrofitted withSCR to provide NOx reductions below $3,400/ton.
Gas and coal reburn technologies are operating on some industrial boilers in the U.S. and areproviding NOx reductions on the order of 50% or more. Combinations of gas reburn with SNCRoffer the potential for even higher NOx reduction – 60% or more. Both conventional gas reburn andfuel-lean gas reburn are expected to be more applicable to industrial boilers than is coal reburn. Gasreburn technologies are estimated to provide NOx reductions under $2,000/ton, even for seasonalcontrols in some cases. For example, Amine-Enhanced Fuel-Lean Gas Reburn is expected toprovide NOx reductions of about 60% on a seasonal basis for about $2,000/ton or less, assuming anincremental cost of natural gas of up to $1.00/MMBTU over coal and a capacity factor of 65% ormore. The cost-effectiveness values of these technologies, as expected, are sensitive to the price ofnatural gas relative to the price of coal.
Emerging technologies, such as Electro-Catalytic Oxidation and Ozone Injection offer thepotential for high NOx reduction, as well as reduction of the emissions of other pollutants. Becausethere is much less experience with these technologies, available cost information is limited.Therefore, cost analysis was not performed for these technologies.
acknowledged that equipment production output is usually not at a constant level over the entire year, for the purpose ofthe calculations in this report this simplifying assumption is made.

I-4
B.2 Gas Turbines
There have been some important developments in gas turbine NOx control technology, butwell-established technologies continue to play an important role in reduction of NOx. Dry LowNOx (DLN), catalytic combustion, and some new post-combustion methods are making their wayinto the control technology market, while water or steam injection and SCR continue to be importanttechnologies for reducing NOx from gas turbines.
Many turbine manufacturers can convert or replace conventional combustors on existingturbines with DLN combustors. DLN combustion retrofits have been made possible by recentdevelopments in gas turbine combustor technology. DLN technology offers the potential forsubstantial reduction of NOx from turbines firing natural gas or other low-nitrogen fuels, as well asimproved engine performance when compared to wet controls (water or steam injection). Forturbines under about 15 MW in size, NOx emissions of 25 ppm can be guaranteed for new turbinesand emissions below 42 ppm can be guaranteed for retrofitted turbines. For large turbines (75 MWand higher in size), controlled NOx emission levels of as low as 9 ppm have been guaranteed, evenfor retrofits.
DLN capital costs vary with the size of the turbine and the specifics of the particular turbinebeing retrofitted. Baseline NOx level will significantly affect the estimate of cost per ton of NOxreduced. Using expected baseline NOx emissions levels provided by the turbine manufacturers andretrofit costs expected to be typical of most applications, retrofit of Dry Low NOx on industrialturbines (about 3 to 10 MW) originally equipped with conventional combustion control is estimatedto provide NOx reductions under $2,000/ton for annual controls with high capacity factors and at ahigher cost for seasonal controls. For larger turbines (~75 MW), cost was estimated to be wellbelow $1,000/ton for nearly all conditions, and only a few hundred dollars per ton of NOx reducedwhen the turbine was operated at a high capacity factor (~0.85). Calculations show that a DLNretrofit of a large turbine originally equipped with water injection could pay for itself largely fromthe improved turbine efficiency. If actual baseline turbine emissions are lower than the expectedbaseline emissions used in these calculations, the cost of reducing NOx (in $/ton) will be higher.DLN typically has lower carbon monoxide (CO) and volatile organic compounds (VOC) emissionsthan water injection.
Water injection and steam injection are two well-established technologies that can offercontrolled NOx emission levels below 42 ppm in many cases. Because water or steam injectiontechnologies frequently have lower capital cost than DLN but higher variable costs, thesetechnologies can be more attractive for peaking turbines or other turbines that operate infrequently.It was estimated that water injection installed on peaking units that operate 200 hours to 400 hours inthe summer would reduce NOx at a cost of about $2,500/ton to about $7,000/ton, depending uponthe number of operating hours and the fuel used (gas or distillate oil). It is notable that these NOxreductions typically occur on hot summer days when the value of electrical power and theenvironmental benefit of NOx reductions (to reduce ground-level ozone) are both high.
SCR continues to be the most widely used post-combustion technology for gas turbines.Catalyst technology developments have made SCR viable over a wider temperature range. Thismakes SCR a viable control option in situations that were difficult in the past, such as simple-cycle

I-5
turbines that may now benefit from high-temperature SCR and combined-cycle turbines with ductburners that may now benefit from low-temperature SCR.
The cost of NOx reduction with SCR varies considerably according to application, turbinesize, and the type of SCR technology that is appropriate for the application. As in the case of theDLN cost estimates, expected baseline NOx emissions levels provided by the turbine manufacturerswere used as a basis for cost calculations. Conventional SCR on a large (~75MW) combined-cycleturbine with high capacity factors was estimated to cost about $440/ton for annual controls and$870/ton for seasonal controls, for turbines equipped with conventional combustion technology(baseline NOx emissions of 154 ppm). For turbines with lower baseline NOx emissions (such asthose equipped with DLN combustors having baseline NOx emissions of 15 ppm), the cost per tonof additional NOx removed was estimated to be greater, ranging from about $3,700/ton (annualcontrol, high capacity factor) to over $13,000/ton (seasonal controls, low capacity factor). Onsmaller turbines (~5 MW), the cost of conventional SCR is estimated to be as low as $1,300/ton(with annual control and conventional combustion technology having baseline NOx emissions of142 ppm). Seasonal controls for smaller turbines are estimated at over $15,000/ton of NOx removedat a low capacity factor (45%) with baseline NOx emissions of 42 ppm.
For installations that may be better suited for high- or low-temperature SCR variants, such assimple-cycle turbines (high-temperature SCR) or combined-cycle turbines with limited space (low-temperature SCR), the cost of SCR is somewhat higher than for conventional SCR on a combined-cycle plant. The analysis of this report found that a 75 MW turbine at a high capacity factor andequipped with conventional combustion technology (baseline NOx emissions of 154 ppm) can becontrolled annually with high- or low-temperature SCR for about $550/ton and for about $1,200/tonseasonally. As with conventional SCR, turbines with lower baseline NOx emissions (such as thoseequipped with DLN combustors) showed a higher cost per ton of NOx reduction. The estimated costof NOx reduction for a 75 MW turbine with baseline NOx emissions of 15 ppm ranges from$5,170/ton (annual controls, high capacity factor of 85%) to as high as $20,000/ton (seasonalcontrols, low capacity factor of 45%). On smaller turbines (~5MW), the cost for high- or low-temperature SCR is estimated to be as low as $2,000/ton with annual control and conventionalcombustion technology (baseline NOx emissions of 142 ppm). Cost is estimated to range from$6,750/ton (annual controls, high capacity factor of 85%) to about $27,000/ton (seasonal controls,low capacity factor of 45%) with baseline NOx emissions of 42 ppm.
Emerging combustion technologies (such as catalytic combustion) and post-combustiontechnologies (such as SCONOx) offer the potential for very low NOx emission levels. Becausethere is much less experience with these technologies, available cost information is limited.Therefore, cost analysis was not performed for these technologies.
B.3 Internal Combustion Engines
Several control technologies are available for internal combustion (IC) engines, having awide range of complexity, cost and performance.
Some in-cylinder methods offer low to moderate NOx reductions at costs well below$1,000/ton. These include injection timing retard, ignition timing retard, and air/fuel ratioadjustment (with or without high-energy ignition). These methods are widely available, and NOx

I-6
performance will vary from one engine design to another. However, fuel efficiency can suffer as aresult of these methods and emissions of products of incomplete combustion can increase.
Spark-ignited engines that can be retrofitted with Low-Emission Combustion (LEC)technology can potentially achieve significant NOx reductions (80 to 90%). LEC technology can beexpensive to retrofit on some engines, and it may not be available from all engine manufacturers. Forlarge, low-speed engines, LEC technology is estimated to provide annual NOx reductions of about80% at under $1,000/ton under most conditions. LEC technology is estimated to be more costeffective on smaller, medium-speed engines (under $500/ton for annual control under mostconditions). It is estimated to be somewhat more expensive for dual-fuel engines (annual control ata capacity factor of 65% is estimated to cost under $1,000/ton).
SCR is the only commercially available choice for post-combustion control of diesel andlean-burn spark-ignition engines. Experience in the U.S. with SCR on these engines is growing,especially for diesel engines. SCR has been applied to approximately 30 diesel engines and to anequivalent number of constant-load lean burn IC engines. Experience with SCR on variable-loadengines is limited. In analysis using data from case studies, it was estimated that SCR providesannual NOx reductions of as high as 90% at a cost below $1,000/ton in all cases, except for very lowcapacity factors (~10%), and it provides seasonal reductions at a cost of under $1,000/ton forengines operating at high capacity factors (typically, 65% or greater).
Recent developments from the application of urea-SCR on mobile sources (diesel trucks)offer the possibility of reducing the size and capital cost of SCR systems for stationary IC engines.This new technology, developed from efforts to apply SCR to mobile diesel engines, appears tomake it possible to achieve much more cost-effective NOx reduction on stationary IC engines thatoperate for only a few hundreds of hours a year. NOx reduction of about 75% is estimated to bepossible for under $2,000/ton even for seasonal controls of some stationary IC that operate only afew hundred hours each ozone season. Seasonal control at a cost of under $1,000/ton is estimated tobe achievable for most applications with capacity factor greater than 45%.
B.4 Cement Kilns
Several methods are utilized to control NOx emissions from cement kilns.
Automated process control has been shown to lower NOx emissions by moderate amounts,through overall efficiency improvements that reduce the firing requirement in the kiln and byreducing kiln variability, which minimizes periodic NOx emission spikes. Estimates of costeffectiveness were not made for automated process control due to the lack of availability of data andwide differences that exist between kilns. However, the use of automated process control isexpected to improve overall facility operations and is being adopted at cement kilns for its economicbenefits.
Low-NOx Burners have been successfully used in the primary burn zone and especially inthe precalciner kilns. Combustion techniques were estimated to provide NOx reduction at a cost-effectiveness value of under $1,000/ton (annual control, high capacity factor).

I-7
CemStarSM is a process that involves adding steel slag to the kiln, offering moderate levels ofNOx reduction by reducing the required burn zone heat input. CemStarSM is currently being used atseveral cement plants for its original purpose of increasing production capacity. The technology alsoreduces total NOx emissions by about 20% or more. Because of the increased production,CemStarSM provides an overall economic benefit while reducing total NOx emissions.
Mid-kiln firing of tires provides moderate reductions of NOx emissions while reducing fuelcosts and providing an additional revenue stream from receipt of tire tipping fees. Several cementkilns currently employ this technology because of its economic benefits.
Biosolids injection technology can offer significant reductions on some precalciner kilns.There is one biosolids injection plant in the U.S. Biosolids injection offers the potential for tippingfees, but this technology may not be applicable on a wide variety of kilns. Mainly precalciner kilnswith sufficient excess fan capacity may be able to use this technology.
SNCR technology has the potential to offer significant reductions on some precalciner kilns.SNCR has been tested on at least one facility in the U.S. However, SNCR is being used in numerouscement kilns in Europe. In situations where SNCR is technically feasible, NOx reductions areestimated to cost under $1,000/ton, even for seasonal control with capacity factors of about 65% ormore.
Many of the control methods discussed in this report for application on cement kilns can becombined. For example, mid-kiln firing and Low-NOx Burners were combined in one case study toprovide total NOx reduction of about 50%. It is possible that CemStarSM and process controls couldbe combined with these technologies for additional reduction and capacity improvement. In somecases it may be feasible to use SNCR in combination with other controls for cement kilns.
C. Case Studies
For all of the case studies, the utilized technologies met the guarantees. In most cases, reliability ofcontrol technology to reduce NOx emissions was very good. The few cases where reliability waslow (as represented by high lost operating hours) were the result of problems that have since beencorrected and are not expected to persist. Therefore, based on the experience of the users in the casestudies, future users of the technology are not expected to face reliability problems. For example,some early experience with Dry Low NOx technology on industrial turbines found performance tobe unstable during certain transient situations. Some early users experienced frequent tripping oftheir turbines. Efforts by the turbine manufacturers to improve the Dry Low NOx system controlshave overcome the problem, and it should not be a problem for future users.
For industrial boilers, all of the technologies have been demonstrated to have high reliability.A few minor issues were reported, however. There was one instance of tube failure from ureaimpingement, but the user is correcting the problem with the technology supplier. In another casestudy plugging of equipment was reported; this is believed to be due to the user's choice of a reagentthat does not meet the technology supplier's specifications. Notably, none of the users of SNCR orSCR reported problems normally associated with high ammonia slip, such as ammonium saltdeposits on boiler surfaces.

I-8
In view of the very limited experience in the U.S. with SCR on IC engines, the highreliability experienced by users in the two case studies is a very positive and promising finding.
For cement kilns, the technologies that were evaluated showed no adverse impact onreliability. In one case study the operator reported that they expect the use of indirect firing toimprove kiln reliability. Moreover, cement kiln operators are implementing technologies that bothimprove facility economics and reduce NOx emissions by moderate amounts.
II-1
II. NOx Control Technologies
There are four general source categories addressed in this effort: industrial boilers, gasturbines, internal combustion (IC) engines, and cement kilns. Within these four general categories,there are variations in design based on fuel and application. The different variations in each sourcecategory are discussed briefly, as they can influence the applicability of a specific controltechnology. The control technologies that are commercially available for application are then brieflydescribed for each category. Considering the wide variety of source types addressed in this report,there are potentially a wide variety of NOx reduction technologies available. While this reportaddresses a number of widely available technology options, technologies that are not currently wellestablished or widely available are only briefly mentioned. Specifically, technologies that have notat least been demonstrated at a commercial scale are not considered in this report.
For those applications and technologies that are addressed in this report, a summary of theimportant aspects of the application and a brief discussion of the technologies is provided. Readerswith an interest in exploring the technical issues in a more comprehensive manner are directed toother sources that are referenced in this report.
A. Industrial Boilers
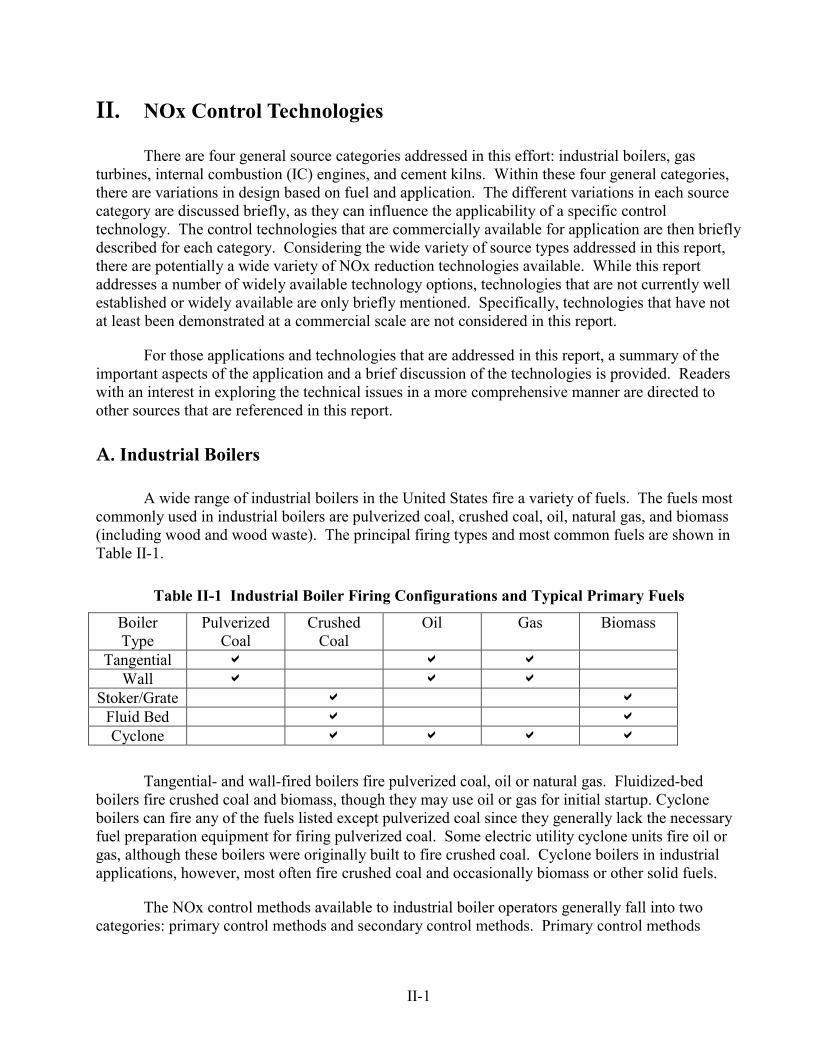
A wide range of industrial boilers in the United States fire a variety of fuels. The fuels mostcommonly used in industrial boilers are pulverized coal, crushed coal, oil, natural gas, and biomass(including wood and wood waste). The principal firing types and most common fuels are shown inTable II-1.
Table II-1 Industrial Boiler Firing Configurations and Typical Primary Fuels
BoilerType
PulverizedCoal
CrushedCoal
Oil Gas Biomass
Tangential a a aWall a a a
Stoker/Grate a aFluid Bed a aCyclone a a a a
Tangential- and wall-fired boilers fire pulverized coal, oil or natural gas. Fluidized-bedboilers fire crushed coal and biomass, though they may use oil or gas for initial startup. Cycloneboilers can fire any of the fuels listed except pulverized coal since they generally lack the necessaryfuel preparation equipment for firing pulverized coal. Some electric utility cyclone units fire oil orgas, although these boilers were originally built to fire crushed coal. Cyclone boilers in industrialapplications, however, most often fire crushed coal and occasionally biomass or other solid fuels.
The NOx control methods available to industrial boiler operators generally fall into twocategories: primary control methods and secondary control methods. Primary control methods

II-2
minimize the generation of NOx itself in the primary combustion zone. Secondary control methodsreduce the NOx originally formed in the primary combustion zone.
A.1 Primary Methods of Controlling NOx in Industrial Boilers
These methods include the use of Low-NOx Burners (LNBs), Overfire Air and/or StagedCombustion, and Flue Gas Recirculation. A related method is combustion tempering, in whichwater is injected into high-temperature regions of the flame.1 These methods have been explored indetail by others, and Reference 2 provides a good overview of the subject. All of these methodsoperate on the basic principles of controlling fuel/air stoichiometry and flame temperature to lowerNOx generation.
Because of the wide variety of industrial boiler types, firing configurations and fuels, a widerange of controlled NOx levels are achieved in practice. Wall- and tangentially- fired boilers tend tobe most amenable to the use of Low-NOx Burners, although other primary methods (overfire air,flue-gas recirculation, gas co-firing, etc.) have been used with success on other furnace types.Because of the smaller size of industrial boilers, permitting less separation, overfire air is rarelyused. Some have argued that the operating characteristics of industrial boilers make it more difficultto lower the furnace oxygen levels (known as low excess-air) and apply staged combustion as ameans to reduce NOx. 2, 3 Proponents of this argument suggest that industrial boilers have highlyvariable load characteristics that make combustion controls at low excess-air conditions unworkable.They also note that the size of an industrial boiler makes the length of the Low-NOx Burner flametoo long and that there is insufficient room in the boiler for overfire air.
On the other hand, Low-NOx Burners and Overfire Air have been successfully applied tomany industrial boilers. Reference 2 lists about 400 Low-NOx Burners installed by one supplieralone, along with their guarantee levels. Chapter IV describes four boilers at Kodak Park (CaseStudies BLR-8 and BLR-9) which are using overfire air with reburning, showing that the successachievable in applying primary controls on industrial boilers is determined by the uniquecharacteristics of the facility and the knowledge and skill of the individuals implementing thetechnology. Despite the differences in facilities, there is a broad selection of primary controlmethods that may be used at specific units.
For any specific furnace type, the fuel nitrogen, the furnace volumetric heat release rate, andthe use of preheated air limit the potential NOx reductions for primary controls. Other furnaceconstraints may limit the performance of some technologies as well. Fuel nitrogen content is theprimary reason that coal produces much higher NOx than oil or gas. Coal typically requires higherexcess oxygen levels than oil or gas, providing oxygen for thermal NOx production. The nitrogencontent of coal, about 1% to 1.5%, is often double that of residual (No. 6) oil, although nitrogen inresidual oil can vary from 0.10% to 0.60%. This range in fuel nitrogen has been a particularproblem for boilers firing No. 6 fuel oil, leading to NOx emissions that may vary from 40 ppm to310 ppm4 and makes it difficult to get predictable reductions from Low-NOx Burners with this fuel.While manufacturers have successfully found ways to reduce thermal NOx production, reducingfuel-NOx requires deep staging in order to first pyrolize the fuel and then release the fuel-boundnitrogen in a reducing atmosphere. While staged combustion is typically performed with Low-NOxBurners, deep staging requires more furnace volume than most industrial boilers offer.

II-3
Furnace volumetric heat release rate, the degree of air preheat, and the excess oxygen leveldetermine, to a large degree, the combustion gas temperature and the thermal NOx generated. In-furnace NOx reduction methods are less effective on high heat release and high preheat furnacesbecause of the difficulty in overcoming the thermal NOx component. Although undesirable,reducing the boiler load can be used as a means of addressing this issue if primary and secondarymethods prove technically or economically less feasible.
Table II-2 shows a statistical summary of the guaranteed performance of one particularmanufacturer's Low-NOx Burners as reported in Reference 2. Actual performance is typicallybetter. It is interesting to note the standard deviation for both the gaseous fuel and No. 6 fuel oil.For the gas-fired applications, the variation is due to different burner conditions, such as furnacevolumetric heat input, preheat level, and different burner designs. For example, flue gasrecirculation may be used in some cases for lower NOx operation. In any event, emissions wellbelow 0.15 lb/MMBTU appear quite achievable with natural gas, probably for well over 80% of gas-fired boilers. In fact, half of the applications reported NOx below 0.10 lb/MMBTU. In the case ofNo. 6 fuel oil, NOx levels below 0.45 lb/MMBTU appear achievable for about 80% or more of thepopulation and below 0.35 lb/MMBTU for half of the population. However, it appears that someboilers would find it difficult to achieve below this level of NOx control. This is largely because offuel nitrogen, preheat, and heat release rate. Also, considering that the information summarized inTable II.2 is for burners sold before 1994, performance for more recent applications should be better.
In addition to increasing the temperature of the combustion air, air-preheat increases airvelocity at the burner, making a stable flame more difficult to maintain than otherwise. Reference 5describes the use of low-NOx retrofit technology at industrial boilers firing No. 6 fuel oil withnitrogen content in the range of 0.2-0.4% (by weight). The boilers with preheated air had an initialNOx level at full load in the range of 0.70 to 0.80 lb/MMBTU. In this case, NOx was reduced toabout 0.40 to 0.50 lb/MMBTU with the low-NOx boiler retrofit. The other boilers that did not havepreheated air had an initial NOx level of 0.35 lb/MMBTU, and the NOx emissions from these boilerswere reduced to 0.26-0.27 lb/MMBTU. While there are other differences between these boilersbeside air-preheat, the use of air-preheat has a significant effect on achievable NOx emissions.Reference 8 lists an application of the use of deep staging and separated overfire air at a Long IslandLighting power station to achieve NOx levels of 0.14 lb/MMBTU or less with No. 6 fuel oil.However, this form of combustion control is unlikely to be applicable to most industrial boilers sincea large furnace and overfire air are needed to implement deep staging. Generally, the range of NOxemissions achievable on industrial boilers firing No. 6 fuel oil can vary substantially.

II-4
Table II-2: Statistics Regarding Low-NOx Air Register Burner Performance for Boilers Over~250 MMBTU/hrii,iii
Natural Gas/Refinery Gas(lb NOx/MMBTU)
No. 6 Fuel Oil(lb NOx/MMBTU)
Mean Emissions 0.11 0.37Median Emissions 0.10 0.35
Population Standard Deviation 0.050 0.094Minimum Emissions 0.05 0.23Maximum Emissions 0.20 0.55
Analysis based on data from Reference 2 Appendix C.
Combustion Tempering, also known as Water Injection, is a technique that involves injectionof water into the high-temperature and high-oxygen regions of the flame to suppress thermal NOxformation. This approach has been used on electric utility boilers as well as industrial andcommercial boilers.6,7 Its effectiveness will vary from one unit to another and will depend on fuelsused; however, low to moderate reductions in the range of 15% to 30% should be expected. Thismethod will, generally, be more effective on gas-fired units than units firing No. 6 fuel oil becausethis method reduces thermal NOx but not fuel NOx. For cyclone boilers that generate high levels ofthermal NOx, reductions of 22% have been demonstrated and higher reductions are possible.1 Inmost cases, other combustion techniques are attempted first because this approach adversely affectsboiler efficiency. Efficiency losses of up to 1% are possible, but lower efficiency losses are typical.
A.2 Secondary Methods of Controlling NOx in Industrial Boilers
Secondary control methods reduce the NOx already formed in the primary combustion zone.They include Selective Non-Catalytic Reduction (SNCR), Selective Catalytic Reduction (SCR) andReburning. These technologies have been applied on a wide range of utility boilers.8 Reference 8contains a comprehensive discussion of these technologies. Summary discussions follow below.
ii Notes for tables II-2, II-3a, and II-3b: The mean is the arithmetic average of all of the NOx values or reductions reported. The median value is calculated such that 50% of the reported values are higher and 50% are
lower than the median. When a population is influenced by a small number of unusually high orlow values such that the distribution is somewhat skewed (as in Table 2.2), the median ispreferable to the mean as a measure for the population.
The Standard Error of Mean is the measure of the uncertainty in using the sample mean toestimate the mean of a large population. When it is small relative to the mean, the mean is agood measure of the population.
Population Standard Deviation is a measure of dispersion of a large population. Minimum is the minimum value reported. Maximum is the maximum value reported.iii The nitrogen content of the No. 6 fuel oil was not available.

II-5
Selective Non-Catalytic Reduction (SNCR)SNCR reduces NOx through a reaction between urea or ammonia and NOx in the furnace
region (at temperatures of about 1600ºF to 2200ºF) to produce nitrogen and water. Figure II-1shows the general scheme for urea SNCR. Aqueous urea, typically 50% by weight, is pumped in aconcentrated form through metering pumps or valves to the injection zones in the furnace. Multipleinjection zones, each of which may be composed of several injectors, are often needed to addressboiler load changes. Dilution water is typically added in order to match the total liquid flow rate tothe proper flow rate for the injectors. Ammonia SNCR works similarly, except that the ammoniacan be injected in either a gaseous form or as an aqueous solution.
SNCR technology has been used on hundreds of industrial boilers firing a wide range offuels, including coal, oil, gas, biomass, and municipal waste. The principal determinants of theapplicability and achievable performance of SNCR are access for injection of reagent, propertemperature, adequate residence time, and initial NOx level. Because of the wide range of boilertypes among the industrial boiler population, the level of reduction possible through application ofSNCR varies widely - from under 20% to over 60%. SNCR tends to become less effective at lowerbaseline levels of uncontrolled NOx. For this reason, many gas-fired units find other approachessuch as Low-NOx Burners or SCR more effective. Nevertheless, in some cases SNCR may beeffective even on gas-fired units.
The broad applicability of SNCR is illustrated in Tables II.3a and II.3b, which show the typesof non-electric utility boilers or process heaters that have been equipped with SNCR and theassociated range of NOx reductions. The information in these tables is representative of theperformance of SNCR for lowering NOx from industrial units. In addition to showing the averageNOx reduction for the facilities, an estimate of the population standard deviation and other statisticswere calculated.iv An evaluation of the performance of urea SNCR technology on electric utilityunits firing mostly coal and, in some cases, firing oil, showed average NOx reductions of about 39%with an estimated population standard deviation of 16% using a sample of 22 units.9 NOxreductions on utility boilers with this technology are, therefore, significantly less than the NOxreductions for any of the industrial units identified above. The data for industrial boilers indicatethat 50% or higher (in some cases, much higher) NOx reduction can be achieved on the majority ofthe industrial boilers. SNCR technology, therefore, seems to be especially well suited for manyindustrial boilers. It is worth noting that while urea appears to be clearly preferred over ammonia asa reagent for utility SNCR systems (none of the currently operating U.S. utility SNCR systems useammonia), both urea and ammonia appear to have fairly broad applications in industrial units. Bothreagents achieve, on average, over 50% NOx reduction on industrial units. The choice in reagentdepends on the specifics of the industrial application.
iv The population standard deviation is an indication of the dispersion of performance throughout the entire boilerpopulation. The standard error of the mean is an indication of the potential difference between the sample mean (whichis used to estimate the mean of the entire population) and the population mean. Statistically, there is less than a 5%chance that the population mean is more than two times the standard error of the mean from the sample mean. Forexample, if the sample mean is 50% and the standard error of the mean is 3%, there is a 95% chance that the actualpopulation mean is between 44% and 56%. So, a small standard error of the mean relative to the mean gives confidencein the mean as a measure for the population.

II-6
Figure II-1: SNCR Applied to a Boiler
Concerns expressed by users regarding the operation of SNCR technology have beenprimarily directed at the control of ammonia slip and the potential for adverse side effects.Ammonia “slip” refers to the unreacted ammonia that is present in small quantities in the exhaustgases. Ammonia can react with sulfur compounds to form deposits on heat exchange surfaces.Ammonia may contaminate fly ash, or it may contribute to a white plume formed from reaction ofammonia with chlorine that may be present in the fuel. Although early experience with SNCRshowed that ammonia slip could be a problem, extensive experience with hundreds of facilities hasshown that properly designed and operated SNCR systems can control ammonia slip veryeffectively. Difficulties with ammonia slip are extremely rare.8 A more comprehensive discussionon SNCR and ammonia slip can be found in Reference 8.
Reagent meteringand controls
Reagentinjection
CombustionZone Urea or
ammoniastorage
Gas flow

II-7
Table II-3a: Performance of Industrial Boiler Types Equipped with Urea SNCR 9
Independe-nt PowerProducers
Pulp/Paper Refining Industrial SteelIndustry
Mean NOxReduction
51% 52% 57% 53% 74%
Standard Errorof Mean
1.9% 2.4% 3.6% 2.8% 6.2%
Population StandardDeviation
8.3% 7.9% 14.0% 9.7% 20.5%
Minimum 35% 35% 34% 40% 30%Maximum 70% 62% 74% 70% 90%
Number of Facilities 19 11 15 12 11Fuels Biomass,
Wood,Coal
Wood waste,wood, pulp,
oil, blackliquor
Refined Gas,Petroleum
Coke,Natural Gas
Coal,No. 6 Fuel
Oil
Coal,Natural
Gas
Table II-3b: Performance of Industrial Boiler Types Equipped with Ammonia SNCR 10
Stoker Stoker CirculatingFluidized Bed or
Bubbling Bed
Industrial RefineryHeaters
Average NOxReduction
61.7% 57.5% 78.3% 57.7% 58.75%
Standard Errorof Mean
2.2 % 3.1% 0.81% 3.5% 3.35%
Population StandardDeviation
7.3% 8.8% 2.1% 11.7% 9.5%
Minimum 57% 46% 76% 30% 43%Maximum 78% 75% 80% 75% 70%
Number of Facilities 11 8 7 11 8Fuels Coal Biomass Coal, Biomass Gas, Oil Refinery Gas,
Natural Gas,Oil
Selective Catalytic Reduction (SCR)The SCR process (Figure II-2) employs a similar chemical reaction as SNCR, except that the
reaction occurs at a much lower temperature (around 650º-700ºF) and requires a catalyst. At theselow temperatures, SCR is capable of achieving very high NOx reductions, sometimes in excess of90%. SCR, however, is more expensive to install than SNCR. Additionally, the catalyst needs to bereplaced periodically because of its sensitivity to impurities in the gas stream. In the case of coal-fired boilers, catalysts have been developed that can tolerate coal impurities and provide reasonablecatalyst lifetimes (typically, in the range of 14,000-24,000 operating hours before replacing a portion

II-8
- about 1/4 to 1/3 - of the total catalyst loading). 8 For cleaner fuels such as natural gas, catalystslose their activity at a much slower rate, permitting longer times between replacement of catalyst. InGermany and Japan there is extensive SCR experience with industrial boilers firing oil, offeringevidence of the applicability of the technology on oil applications firing high-vanadium, high-sulfuroil.8
SCR catalysts are available in three general temperature-range categories. ConventionalSCR Catalysts operate at a temperature range of about 600ºF to 800ºF. They are typically used forboilers and are the focus of this section. High-temperature SCR catalysts operate in the temperaturerange of 800ºF to 1,000ºF, and are primarily designed for high temperatures associated with theexhaust gases of simple-cycle gas turbines. They are discussed later in Section B.2. Low-temperature SCR catalysts (250ºF to 500ºF) have been designed for use in a variety of applications,including industrial boilers and combined-cycle gas turbines firing relatively clean fuels. Thesesystems offer the advantage of being able to simplify installation by reducing the degree of boiler orsystem integration necessary to incorporate the SCR catalyst reactor into the facility. The supplier ofthe technology, KTI, reported fifteen commercial systems installed and two on order at the time ofthis writing, in addition to the conventional SCR applications listed by Institute of Clean AirCompanies (ICAC).11,12
SCR has been extensively used to control NOx from hundreds of utility and industrial boilersin Japan and Germany, and several coal and gas-fired utility boilers in the United States. The ICACreported twelve industrial boilers operating with SCR in the U.S., all firing natural gas or refinerygas (except one boiler firing wood waste).12 Fifteen refinery process heaters were also identified.SCR is considered technically feasible for nearly all types of industrial boilers.
The principal technical concerns expressed by industry regarding SCR deal primarily withammonia slip and catalyst deactivation. Ammonia slip from an SCR system is the same as for anSNCR system. However, ammonia slip from an SCR system is much easier to control to low levelsthan for SNCR. Problems with ammonia slip from SCR systems are extremely rare.8 Catalystdeactivation occurs as a result of impurities in the gas stream that can produce blinding deposits orpoisoning of the catalyst material. Although catalyst deactivation occurs, the rate of catalystdeactivation has not proven to be a problem for coals and certainly not for natural gas. Anoutstanding issue remains regarding the use of low-sulfur, high-calcium western coals with SCR.These coals are unique to the U.S. and there is no experience with SCR on facilities firing thesecoals. Catalyst suppliers agree that these coals can produce deposits that deactivate the catalyst, butone supplier states that the rate of catalyst deactivation is expected to be within an acceptable rangefor commercial use.13 Commercial experience with these coals on electric utility boilers that haverecently commenced operation with SCR will shed more light on this question.

II-9
Figure II-2: Selective Catalytic Reduction 14
ReburningReburning operates by creating a fuel-rich reducing region downstream of the primary
combustion zone that reduces the NOx formed in the primary combustion zone. Several types ofreburning systems can be used with industrial boilers, including conventional reburning, Fuel-LeanGas Reburning (FLGR), Amine-Enhanced FLGR (AEFLGR), and Methane DeNOx. In the case ofconventional reburning, a burn-out zone is necessary downstream of the reburn zone because theentire reburn zone is made fuel rich, requiring completion air to avoid high emissions of products ofincomplete combustion (Figure II-3). For Fuel-Lean Gas Reburning (FLGR), a downstream burnoutzone is not needed (Figure II-4). Most experience with reburning is on electric utility boilers usingnatural gas as the reburn fuel, although there are industrial boilers that employ the technology.8Coal-fired industrial boilers at Kodak Park in Rochester (New York) are equipped with conventionalreburning. Three boilers on the site are equipped with gas reburning and one boiler is equipped withmicronized coal reburning. NOx reductions of over 50% have been achieved from the gas reburningsystems, and the micronized coal reburning system achieves over 50% reduction at full load andlower reductions at part load (Case Study BLR-9, Chapter IV). Although reburning may not bewidely applicable to industrial boilers, it is commercially employed on industrial boilers at KodakPark and is probably applicable to many other industrial boilers.
Fuel-Lean Gas Reburning (FLGR) has been demonstrated or applied commercially to severalelectric utility boilers, including roof-fired boilers, wall-fired boilers, tangentially-fired boilers,cyclone boilers, and turbo furnaces. It typically is capable of about 30% to 40% NOx reduction onmost facilities and the level of NOx reduction normally becomes limited by increased emissions of

II-10
CO. Unlike conventional gas reburning, which typically requires 15% to over 20% of the furnaceheat input to be in the reburn zone, FLGR requires typically only 4% to about 7% of the heat inputfrom natural gas. This makes FLGR much less costly to operate. Moreover, FLGR does not requireoverfire air, which adds expense to a conventional gas reburn system and may also preventapplication of conventional reburn to some small boilers. Hence, there may be some industrialboilers that can benefit from FLGR technology but not from conventional reburn.
FLGR and SNCR can be used as separate systems or can be integrated to create an AmineEnhanced (AEFLGR) system. AEFLGR is being used commercially on coal-fired utility boilers toproduce NOx reductions of 60% (on average) and up to 70%.15
Methane DeNOx is another technology that uses the principals of reburning and is applicableto grate- and stoker-fired boilers. Natural gas and recirculated flue gas are injected above the grateto form a reducing zone while overfire air above the gas ports burns out the combustibles. MethaneDeNOx is in operation on four boilers at a Cogentrix facility near Richmond, VA. 16
Although any fuel can potentially be used for the reburn fuel, natural gas is preferred becauseit burns more easily than coal or oil and also because it results in zero fuel-NOx emissions. The maindisadvantage of natural gas as a reburn fuel is that it is typically more expensive than coal, and it isnot available at all locations. Coal has been used in the U.S. as a reburning fuel on one of the Kodakcyclone boilers; however, coal reburn systems tend to require more expensive equipment than gasreburn systems.
Figure II-3: Conventional Gas Reburning
The primary technical concerns expressed by industry regarding these technologies areimpacts on boiler tube corrosion, and impacts on unburned carbon (also known as Loss Of Ignition,

II-11
or LOI) and CO emissions. Experience with numerous long-term demonstration programs andcommercial plants indicates that reburning does not accelerate boiler tube corrosion.8 Increased COemissions and LOI tend to limit the level of NOx reduction achievable. Commercial reburningsystems have been installed and are currently operating on utility and industrial boilers whilemaintaining CO and LOI within acceptable levels. 8
Electro-Catalytic Oxidation (ECO)Electro-Catalytic Oxidation is an emerging technology for reduction of NOx and other
pollutants. In the ECO process, NOx and other pollutants (SO2, mercury, and VOCs) are oxidized ina dielectric barrier discharge reactor located immediately after the electrostatic precipitator (ESP)and prior to a wet ESP. Since NOx is oxidized to nitric acid, it is readily removed from gases by thewet ESP. SO2 is similarly converted to sulfuric acid and removed. The ECO process is shownschematically in Figure II-5. It is being field tested on a coal fired utility boiler in Ohio.
Low-Temperature Oxidation using OzoneLow-temperature oxidation using ozone is another emerging technology that operates by
oxidizing NOx and SO2 to acids and then removing the acids out in a wet scrubber. Ozone used inthe process is produced on site. The technology has been tested on a coal-fired electric utility boilerand is being tested on a gas-fired industrial boiler. In both cases the technology has beendemonstrated to reduce NOx to below 2 ppm.17
Figure II-4: Fuel-Lean Gas Reburning

II-12
Figure II-5: Electro-Catalytic Oxidation Technology18
B. Gas Turbines
Gas turbines fire gaseous fuels (natural gas, waste gas, landfill gas, etc.) and/or distillate oil.Gas turbines use primary (or in-combustor) methods that minimize the production of NOx in the gasturbine combustor and secondary control methods that reduce the NOx that has been formed.Reference 19 provides a comprehensive overview of these technologies. A brief summary follows.
B.1 Primary Methods of Controlling NOx from Gas Turbines
Dry Low NOx (DLN)DLN is a gas-turbine combustion technology that enables gas-turbine combustors to produce
low NOx emission levels without diluents (such as water or steam) or catalysts. Some suppliersoffer combustors on new turbines that are capable of NOx emissions under 9 ppmdv (parts permillion dry volume basis) at 15% oxygen when firing natural gas.19, 20 DLN technology utilizes alean, premixed flame as opposed to a turbulent diffusion flame, therefore typically requiring the useof natural gas. Other fuels that can be premixed might be used, although use of fuels other than gasis rare. Since fuel oil cannot be easily premixed, it is not typically suitable as a DLN fuel. Turbulentdiffusion flames are common for boilers and for gas turbines that do not utilize DLN technology.Figure II-6 compares a DLN (lean-premixed) combustor to a conventional gas turbine combustor.As indicated in the figure, in a lean, premixed combustor, the fuel and air are premixed prior to

II-13
entering the combustion zone. With a lean, premixed flame, the contribution of promptv and thermalNOx can be much lower than for a turbulent diffusion flame. The contribution of fuel NOx isminimized through the use of low-nitrogen fuels, such as natural gas. Achieving low NOx across thefull load range requires a sophisticated combustor design, often with variable operating modes inorder to maintain flame stability. Not all turbine designs can accommodate a DLN combustor.However, most turbine suppliers have developed the ability to retrofit the existing turbines in thefield.
There has been a learning curve in the field implementation of this technology. Because DryLow NOx combustor technology operates under conditions that are much closer to the flammabilitylimit than the conventional combustor technology, there is a significant risk of flame instability. Infact, some early experience with this technology found that flameouts were frequent under varyingweather or load conditions (see case studies in Chapter IV). However, manufacturers havedeveloped improved electronic turbine controls that have addressed this problem. Some earlyexperience also found combustor liners failing after only about 5,000 hours (see case studies),compared to over 20,000 hour lifetime for conventional technology. Again, the turbinemanufacturers have addressed this problem by improving the lifetime of the DLN combustor linersto a lifetime similar to, and in some cases longer than, that of conventional combustion technology.
Solar Turbine Company reports that they have retrofitted about 50 turbines with theirSoLoNOxTM Dry Low NOx technology, with achieved reductions shown in Table II-4a. Currenttechnology from this manufacturer achieves 25 ppm.21 Additionally, over 500 new turbines fromthis manufacturer are operating with DLN technology.
Figure II-6: Comparison of a Lean Premixed Combustor and a Conventional Combustor 21
v There are three types of NOx formation: Fuel NOx, generated by oxidation of fuel nitrogen; Thermal NOx, generatedfrom direct oxidation of nitrogen in the combustion air; and Prompt NOx, generated by oxidation of HCN intermediatesformed in the combustion air by nitrogen fixation to hydrocarbon radicals in fuel-rich combustion zones.

II-14
Table II-4a: NOx Performance of Solar Industrial Gas Turbines with SoLoNOxTM Dry LowNOx Combustor 22
Turbine Model Power(MW)
Pre-ControlEmissions
(ppm)
Post-ControlEmissions
(ppm)*
% Reduction
Mars 100 10 240 42 83%Mars 90 9 178 42 76%
Taurus 60 5.25 143 42 71%Centaur 50 3.5 105 42 60%Centaur 40 3 130 42 68%
* These are results from retrofit installations only. Current DLN technology from thismanufacturer can achieve 25 ppm on new turbines
Other turbine suppliers, such as Allison, also offer DLN technology on their products inthis size range
Solar manufactures gas turbines up to about 16 MW in size. Even lower NOx levels arepossible with DLN technology on larger gas turbines available from other suppliers. New andretrofit turbines in the larger, power plant sizes (over 50 MW) have been retrofitted to below 9 ppmof NOx. Table II-4b below lists larger turbines that are available with DLN or can be retrofittedwith DLN.
A DLN retrofit, however, is not appropriate for all situations. Figure II-7 shows a turbinecomparing a DLN combustor to a standard combustor. The DLN combustor is typically larger thana conventional combustor and may not fit on some older turbines. In some cases it may beeconomically more attractive to replace the old turbine with a new one due to the extent of themodifications necessary to convert the existing turbine. DLN combustors also can have more limitedoperating ranges than conventional combustors. Turbines likely to experience frequent and rapidload changes may experience a brief spike in NOx emissions with DLN technology. If these turbinesmust also comply with hourly average NOx emission requirements, DLN may not be the bestapproach. Moreover, some turbines require the use of distillate fuel during some periods. The NOxreduction benefit of DLN is achievable with fuels that can be premixed and are low in fuel nitrogencontent, such as natural gas. Therefore, turbines that must maintain low NOx levels while operatingon fuel oil may find other technologies more appropriate. Nevertheless, despite these considerationsthat can limit the applicability of DLN technology, DLN retrofit technology is available for themajority of turbine types.
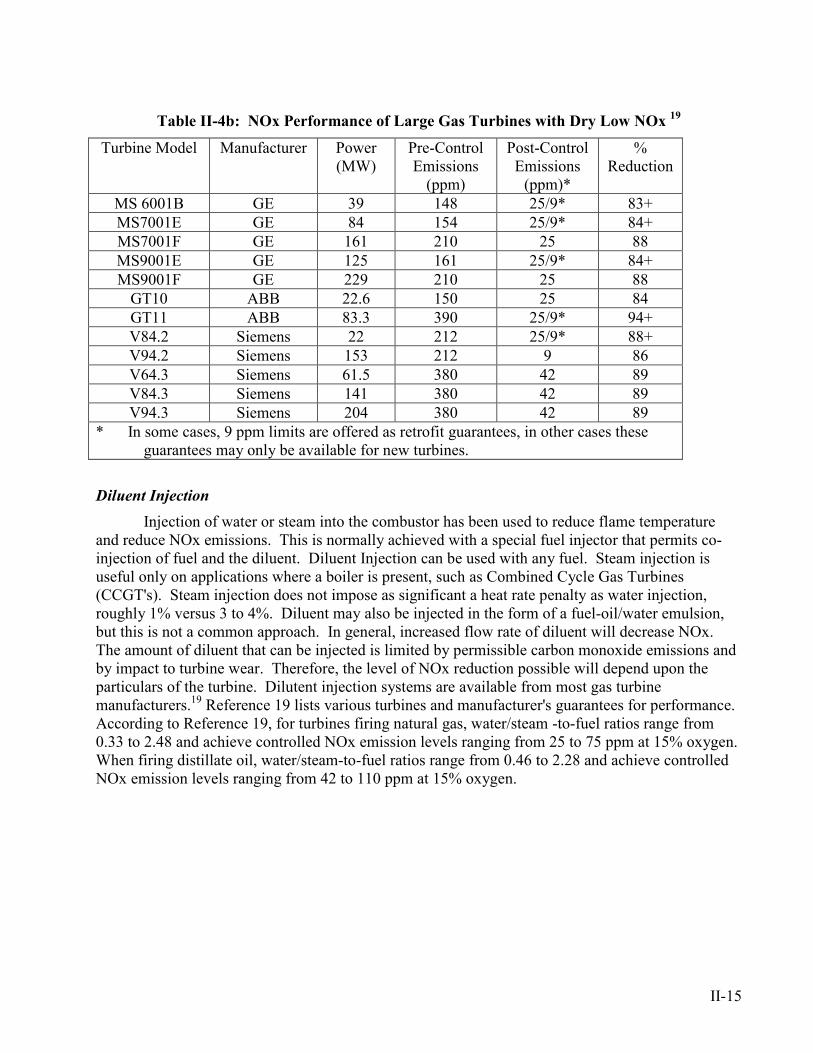
II-15
Table II-4b: NOx Performance of Large Gas Turbines with Dry Low NOx 19
Turbine Model Manufacturer Power(MW)
Pre-ControlEmissions
(ppm)
Post-ControlEmissions
(ppm)*
%Reduction
MS 6001B GE 39 148 25/9* 83+MS7001E GE 84 154 25/9* 84+MS7001F GE 161 210 25 88MS9001E GE 125 161 25/9* 84+MS9001F GE 229 210 25 88
GT10 ABB 22.6 150 25 84GT11 ABB 83.3 390 25/9* 94+V84.2 Siemens 22 212 25/9* 88+V94.2 Siemens 153 212 9 86V64.3 Siemens 61.5 380 42 89V84.3 Siemens 141 380 42 89V94.3 Siemens 204 380 42 89
* In some cases, 9 ppm limits are offered as retrofit guarantees, in other cases theseguarantees may only be available for new turbines.
Diluent InjectionInjection of water or steam into the combustor has been used to reduce flame temperature
and reduce NOx emissions. This is normally achieved with a special fuel injector that permits co-injection of fuel and the diluent. Diluent Injection can be used with any fuel. Steam injection isuseful only on applications where a boiler is present, such as Combined Cycle Gas Turbines(CCGT's). Steam injection does not impose as significant a heat rate penalty as water injection,roughly 1% versus 3 to 4%. Diluent may also be injected in the form of a fuel-oil/water emulsion,but this is not a common approach. In general, increased flow rate of diluent will decrease NOx.The amount of diluent that can be injected is limited by permissible carbon monoxide emissions andby impact to turbine wear. Therefore, the level of NOx reduction possible will depend upon theparticulars of the turbine. Dilutent injection systems are available from most gas turbinemanufacturers.19 Reference 19 lists various turbines and manufacturer's guarantees for performance.According to Reference 19, for turbines firing natural gas, water/steam -to-fuel ratios range from0.33 to 2.48 and achieve controlled NOx emission levels ranging from 25 to 75 ppm at 15% oxygen.When firing distillate oil, water/steam-to-fuel ratios range from 0.46 to 2.28 and achieve controlledNOx emission levels ranging from 42 to 110 ppm at 15% oxygen.

II-16
Figure II-7: Solar Turbines’ SoLoNOxTM DLN and Standard Combustor with ConventionalCombustion Technology 21
A benefit of diluent injection is an increase in turbine power output that results from thehigher mass flow through the turbine. This increase in power is generally of the order of a fewpercent. Depending upon the capabilities of the generator, compressor, or other device being drivenby the turbine and the capability of turbine auxiliaries, this additional power may or may not beuseful. Counter to the power benefit, diluent injection adversely impacts the efficiency of the gasturbine and increases wear on the turbine and combustor. Moreover, the consumption of water canbe very high for a large turbine, sometimes more than double the fuel flow rate. Such high waterusage may pose problems for the local water supply and is an added expense. However, where verylow NOx levels are required while firing fuel oil or for peaking turbines, diluent injection may be atechnically more appropriate technology choice than DLN. Additionally, due to the lower capitalcost of diluent injection, it may be an economically more attractive approach than DLN for turbineapplications that only operate for a few hours per year.
Simple-cycle turbines require high-purity water and can therefore be somewhat moreexpensive to retrofit with this technology than combined-cycle turbines. Combined-cycle powerplants generally have water treatment on site to service the boiler but simple cycle facilities do notnormally have water treatment on site.
Catalytic CombustionCatalytic Combustion is an emerging technology that may evolve as a retrofit technology for
existing turbines, and is expected to be developed for new turbines in coming years. Catalyticcombustion reduces NOx formed from the combustion process by reducing the combustion

II-17
temperature to reduce thermal NOx. Figure II-8 presents a schematic of a catalytic gas turbinecombustor. The technology has been demonstrated on small gas turbines (about 5 MW). Accordingto Catalytica, a developer of catalytic combustion who has business relationships with severalturbine manufacturers, this technology has been demonstrated to achieve 3 ppm NOx on a 1.5 MWKawasaki gas turbine. A NOx level of 3.3 ppm was achieved on a General Electric Frame 9 teststand. 23 These results show that this technology appears to be capable of achieving NOx levelscomparable to those achievable when commercially available combustor methods, such as diluentinjection or Dry Low NOx, are used in combination with post-combustion methods (such as SCR).
Figure II-8: Schematic of a Catalytic Gas Turbine Combustor 24
B.2 Secondary Methods of Controlling NOx from Gas Turbines
As noted earlier, secondary control methods reduce NOx originally formed in the primarycombustion zone. Two methods to accomplish this are described below.
Selective Catalytic Reduction (SCR)SCR is the exhaust treatment technology most widely used on gas turbines. It is being
required on many new gas turbine installations, especially those that are equipped with HeatRecovery Steam Generators (HRSG). SCR operates no differently on gas turbines than on boilers,as was described in Section A.2. Gas turbines equipped with SCR have been guaranteed to 2 ppmNOx.
There are over 150 commercial installations of SCR on gas turbines in the United States,12
nearly all on Combined-Cycle Gas Turbine (CCGT) plants. On combined cycle plants, the catalystis normally installed in a cavity within the HRSG (Figure II-9), which is designed to provide theproper gas temperature and flow through the catalyst. For simple cycle applications, the SCR isinstalled at the turbine exhaust. Although standard turbine exhaust temperature is usually higherthan most conventional catalysts will permit, some catalyst suppliers have developed catalysts that

II-18
can perform in the environment of the high-temperature simple-cycle turbine exhaust. These "High-Temperature" SCR applications require expanded, internally insulated ductwork to act as thetransition region from the turbine exhaust to the stack.25 Although the large majority of gas turbineSCR installations are on combined cycle plants, there are a small number of SCR installations onsimple cycle plants or upstream of the HRSG. For example, three Solar Centaur Type H simplecycle gas turbines, each rated at 5,500 hp, are equipped with high-temperature SCR at the SouthernCalifornia Gas Company, Wheeler Ridge Station in Valencia, CA.26
Figure II-9: SCR Installation on Combined Cycle Gas Turbine 27
For many situations, low-temperature SCR offers the potential for a simpler installation thana conventional SCR. Rather than requiring an HRSG with a cavity, the catalyst reactor can beinstalled at the tail end of the system, as in Figure II-10. Although Figure II-10 shows an HRSGwith a cavity for a catalyst, with the low-temperature catalyst, a simpler HRSG design would bepossible. This low-temperature catalyst, which was developed by a division of Shell Oil Company,is sometimes referred to as the "Shell DeNOx System," or SDS. In the event that the facility had anexisting HRSG without a cavity, the low-temperature SCR could be installed without any need tomodify the HRSG. Moreover, there are other benefits with this approach, such as increased distancebetween the duct burner and the SCR catalyst. This allows improved duct burner firing, permittinghigher steam production rates.

II-19
Figure II-10: Low-Temperature SCR Installed on a Combined Cycle Gas Turbine(Also known as the “Shell DeNOx System” (or SDS, as it is labeled in the Figure), this SCR
was developed by a division of Shell Oil Company.27)
In principle, SCR can be used downstream of any form of primary control technology toproduce extremely low levels of NOx, but some obstacles do exist. Diluent steam or water injectioncan be used in the combustor to reduce NOx formation, but the moisture can somewhat inhibit theSCR reaction and will increase the gas flow rate. Therefore, when using diluent injection incombination with SCR to achieve low NOx levels, SCR suppliers must account for the effects of thehigh water content of the exhaust gas. In some situations this may result in higher ammonia slip,shorter catalyst lifetimes, or may require larger catalyst volumes.
A great deal of attention has recently been focused on ammonia slip. Allowable ammoniaslip varies by application and also by facility permit requirements, but is rarely more than 10 ppm,and typically much less. Ammonia slip limitations and guarantees are frequently of the order of 2ppm or less. The catalyst volume, catalyst lifetime, and maximum allowable ammonia slip at theend of the SCR life can be varied based upon the control requirements and economic tradeoffs. Innormal operations, ammonia slip from an SCR system is very low - typically well below 1 ppm - forthe first several years of SCR operation. Generally, the ammonia slip will begin to approach aguarantee level only after the catalyst activity deteriorates somewhat, usually after several years. Forclean fuel applications such as natural gas, many years (often six or more) typically pass before thecatalyst activity is diminished to a point where the ammonia slip begins to approach the guaranteelevel.

II-20
SCONOxTM
SCONOxTM is an emerging catalytic sorbent technology that has recently been offered forcommercial use. The principal advantage of SCONOx over SCR is that it does not require the use orstorage of ammonia. With SCONOx, NOx is oxidized in the presence of a platinum-based catalystand the resulting NO2 is adsorbed onto a potassium carbonate sorbent. The sorbent must beregenerated periodically with hydrogen from an on-site hydrogen reformer that consumes steam andnatural gas (methane). The sorbent and catalyst also need periodic replacement. SCOSOx (alsosupplied by the vendor and required to remove SO2 to avoid poisoning the catalyst used inSCONOx)) removes SO2 in the same manner as SCONOx (oxidation-adsorption-regeneration) andis normally used upstream of the SCONOx system. This is because even natural gas has smallquantities of SO2 that would poison the downstream SCONOx catalyst. The SCOSOx portion of thesystem must be regenerated in a similar manner as the SCONOx system. By-products fromregenerating the SCONOx and SCOSOx sorbents are ducted downstream of the system. SCONOxalso oxidizes carbon monoxide to carbon dioxide.
The system is installed as a bed of sorbent/catalyst (Figure II-11). A system of louvers andpiping allows portions of the bed to oxidize and adsorb pollutants and other portions of the bed toundergo regeneration.
SCONOx has two current installations. The demonstration of this technology at acommercial scale was on a gas turbine in Vernon, CA (established as Lowest Achievable EmissionRate (LAER) by EPA Region 9, San Francisco). The developer reported that the technologyachieved NOx emissions to below 2 ppm NOx (a reduction of over 90%). The owner of this facility,Sun Law Federal Cogeneration, is also affiliated with the developer of the technology, Goal LineTechnologies. The second application of this technology on a commercial scale was on a ~5 MWgas turbine installed in Andover, Massachusetts, and operations commenced in summer of 1999.28
Because of the limited experience with SCONOX relative to other available technologies, there isonly limited information available on actual experience with catalyst or sorbent life, the use ofconsumables (such as steam and gas) or overall reliability.
Figure II-11: A Diagram of SCONOxTM and SCOSOxTM 28

II-21
Although SCONOx has been applied only to gas turbines, it is expected that the technologywill be applicable to other clean-fuel applications such as gas-fired boilers. Products of dieselengine combustion have been shown to deteriorate the catalyst by sulfur masking during tests.29
Therefore, SCONOx may not be applicable to systems firing fuels other than natural gas or veryhigh-quality distillate fuel oil that is very low in sulfur.
C. Internal Combustion (IC) Engines
Internal Combustion Engines are generally of two types: Compression Ignition (CI, orDiesel) or Spark Ignition (SI). CI engines typically fire fuel oil while SI engines are fueled withgaseous or volatile liquid fuels, such as gasoline. Whereas all CI engines fire in a fuel-lean mode, SIengines can operate under fuel-lean conditions or under stoichiometric to slightly fuel-richconditions. Most large SI engines (over about 1,000 hp) are of the fuel-lean type and therefore are ofgreater interest than the smaller SI engines that are generally not major sources of NOx. Rich-burnstationary IC engines are most common at natural gas production facilities.
NOx reduction from IC engines is possible with either in-cylinder methods or exhausttreatment methods. Primary, or in-cylinder methods, minimize the amount of NOx formed itself.Exhaust treatment methods reduce the NOx originally formed in the cylinder.
C.1 Primary Methods of Controlling NOx from IC Engines
Primary methods of controlling NOx involve controlling the combustion process in thecylinder to minimize NOx formation. They involve controlling or modifying the combustion thatoccurs in the cylinder, and include injection/ignition timing retard, air/fuel ratio changes, and a LowEmission Combustion (LEC) retrofit using a pre chamber.
Injection Timing RetardFor CI engines, retarding the injection timing by about 4 degrees can reduce NOx by 15-
30%. With this retard, the fuel ignites entirely during expansion rather than igniting initially duringcompression and then mostly igniting during expansion. This results in lower combustiontemperature and lower thermal NOx, but also in increased fuel consumption. Moreover, someengines may have problems with high CO and soot emissions as a result of these changes. Themodification for injection timing retard can be performed with a very low capital cost, and may alsorequire a few hours of a mechanics time. Often some additional hardware or testing is recommended,bringing the total cost to a few thousand dollars. However, this adjustment is not possible on allengines.
Ignition Timing RetardIgnition timing retard is applicable to SI engines and works on the same principle as injection
timing retard. NOx reductions from ignition timing retard are similar to those achieved frominjection timing retard, and modifications can be performed with very low capital costs and a fewhours of a mechanics time. Again, some additional hardware or testing is recommended, bringingthe total cost to a few thousand dollars. SI engines, however, are generally more sensitive to timingretard than CI engines, and they will have more operational problems when it is employed.
II-22
Therefore the level of NOx reduction achievable for SI engines can be more limited than for CIengines.
Air/Fuel Ratio ChangesNOx formation from a spark-ignited engine is highest when the mixture is slightly fuel-lean.
Richer or leaner mixtures will result in lower NOx. Fuel-lean mixtures are preferred to fuel-richmixtures because fuel consumption is reduced and hydrocarbon emissions are less likely to be aproblem. However, leaner mixtures are more prone to misfire. A richer mixture, on the other hand,will often require the addition of an exhaust treatment technology because of the higher hydrocarbonemissions that are likely to result. Leaning the mixture is normally performed in combination withignition system improvements, such as high-energy ignition (increasing spark voltage) to avoidmisfiring problems. Leaning is also frequently done in combination with Low Emission CombustionRetrofits (described below) to enhance NOx reduction from that technology. An air/fuel ratiochange can normally be done at a modest cost because it requires an engine adjustment, andoccasionally a limited amount of additional hardware.
Low Emission Combustion (LEC) RetrofitThis method can in principle be used on all spark-ignition engines, but some manufacturers
may not offer it. LEC enhances the effectiveness of the air/fuel ratio method previously discussedby enabling much deeper leaning without the other adverse effects associated with lean mixtures.On large engines this method is typically employed by relocating the spark plug to a pre chamberwhere the mixture is somewhat richer than in the cylinder. This early sparking avoids problemsassociated with ignition and misfiring that can result from leaning the mixture. This methodnormally requires a significant modification to the engine heads. The extent of the modificationswill depend largely on the particular engine and the manufacturer of the LEC Retrofit kit. Figure II-12 shows a LEC retrofit kit from Waukesha Engine Company.
According to Reference 30, large, stationary spark-ignition engines usually achieve 80% NOxreduction through a LEC Retrofit. A NOx emission level of 125 ppm (at 15% oxygen) is anachievable exhaust NOx value, and Reference 30 considers LEC Retrofit a Reasonably AvailableControl Technology (RACT) for large spark-ignition engines in California.
C.2 Secondary Methods of Controlling NOx from IC Engines
Exhaust treatments from lean-burn IC engines are less common than for gas turbines. Thismay be because IC engines are usually smaller in total output than turbines. Few IC engines exceed10,000 HP, with most engines of interest in the range from few hundreds to few thousands ofhorsepower. Turbines, on the other hand, can have outputs that exceed 100 MW (133,000 HP).

II-23
Figure II-12: Pre Chamber Low Emission Combustion Retrofit 30
Selective Catalytic Reduction (SCR)SCR is the only commercially proven secondary NOx reduction method for lean-burn gas
engines and diesel engines. It has not been used widely, however, because of general preference forin-cylinder methods (in-cylinder methods, however, result in lower level of NOx reductions).Reference 12 lists seven IC (gas or diesel) engine facilities comprising 29 engines equipped withSCR. Some installations (17 engines in all) have been in operation since 1992. NOx reductions onthese systems are reported to range from 80 to 95%. Engines with highly variable duty cycles mayface challenges with SCR use. Variable duty cycles result in exhaust temperatures that may falloutside the ideal catalyst temperature and result in variable NOx emission that requirecorrespondingly variable ammonia flow rates. Reference 31 argues that applying SCR to lean-burnengines firing natural gas, particularly those used for natural gas transmission, is technicallyinappropriate. According to Reference 31, in a survey of pipeline engines that use NOx control,only 2 of 599 lean-burn gas-transmission engines surveyed use SCR (both in California). And,according to Reference 31, most of the difficulty in using this technology is associated with thevariable operating conditions of these engines, which pose control difficulties for the SCR systemand also increases the risk of lube oil residuals masking the catalyst.
Beyond its high level of achievable NOx reduction, SCR offers some advantages over somein-cylinder methods of controlling NOx from IC engines. First, SCR imposes a relatively smallefficiency penalty on an engine (on the order of 0.5%) compared to penalties of a few percent andsubstantially less level of NOx control from in-cylinder methods such as timing retard. Moreover,some of the in-cylinder methods can increase the emissions of other pollutants, such as unburned

II-24
hydrocarbons, CO, and in the case of diesel engines, soot. Finally, SCR is generally less expensivethan LEC Retrofits.
Larger combustion systems such as gas turbines or boilers have primarily used catalysts ofceramic monolith or ceramic-coated steel. Due to their smaller size, IC engines also use metalwashcoat catalysts. These catalysts tend to be much more expensive per cubic foot than ceramicmonolith catalysts, but have much more catalytic activity per cubic foot, making the net cost aboutthe same as for the other catalyst types. Metal washcoat catalysts are effective with natural gas ordiesels using distillate fuel oil, but are unsuitable for dusty abrasive gases, such as those formed fromburning coal. Finally, metal washcoat catalysts can withstand engine backfires more effectively thanceramic monolith catalysts
Because SCR technology was, to a large extent, originally developed for facilities such asboilers and gas turbines, SCR technology on IC engines has relied on controls and injectionhardware originally developed for these larger applications. This mismatch has resulted in fairlyhigh cost of SCR relative to the system size for IC engines. Recent efforts, however, in SCRdevelopment for mobile sources (diesel trucks) have focused on simplifying the control and injectionhardware for SCR applications to stationary IC engines, offering the potential for much more cost-effective application of this control technology to stationary IC engines.
Figure II-13 shows a technology developed by Clean Diesel Technologies, Inc. to reduce thecost of applying SCR to IC engines, especially diesel engines. The system takes signals from theengine such as load, exhaust pressure, inlet manifold pressure, etc., and injects an appropriateamount of aqueous urea reagent into the exhaust manifold upstream of the exhaust catalyst. Flow ofurea is controlled by pulsing the fuel, which recirculates in a constant pressure recirculation loop.The urea injector has a very similar design to a fuel injector.
NOx emissions are not directly measured by the control system, so it is necessary to firstcarefully characterize the engine emissions relative to the monitored parameters. The quality of theengine performance map that is needed is dependent upon the level of required NOx reduction.Therefore, in order to retrofit this technology onto an existing engine, it is necessary to performsome testing and data gathering to generate this engine performance map. In cases where the engineperformance is not highly reliable or repeatable, such as for an old or poorly maintained engine,lower reductions may be achievable. For example, only a 75% NOx reduction may be achievablefrom an old engine and a higher 90% reduction from a new engine, depending on the relative qualityof the performance map.
The SCR technology shown in Figure II-13 was originally developed for mobile source(diesel trucks) applications, using urea as a reagent. The first commercial application of thistechnology on a U.S. stationary source was on a lubricant test engine at the development facilities ofa major U.S. oil company.32 In this application, both diesel- and gas-fired engines were equippedwith this technology, achieving 82% and 92% reductions, respectively.

II-25
Figure II-13: Urea SCR System (ARISTM 2000) for IC Engines 33
Case study IC-1 (Chapter IV) uses SCR with controls that rely on engine parameters forreducing NOx. The engine parameter controls make continuous measurements of NOx emissionsunnecessary. This control system (from another supplier) also requires engine mapping. However,unlike the system shown in Figure II-13, it utilizes conventional ammonia injection technology.
D. Cement Kilns
Concrete is a combination of Portland Cement, sand, and gravel. They key component ofPortland Cement is clinker, a material produced by heating limestone to temperatures over 2,650ºF,requiring combustion temperatures of about 3,000ºF. These high temperatures are normallyachieved in a rotary kiln, as shown in Figure II-14. Feed material is added at the elevated end of therotating, refractory-lined, cylindrical kiln and the feed gradually tumbles to the high-temperature endof the kiln and the main combustion zone, sometimes referred to as the "Burn Zone." The tilteddesign of the cement kiln allows gravity to assist the motion of the clinker material while hot exhaustgases move upward and exit at the elevated end of the kiln.

II-26
Figure II-14. Simplified Sketch of a Rotary Kiln
Cement Kilns fall into four general process categories, as identified in Table II-5. Preheaterkilns preheat and partially calcine feed material in a series of cyclones or grates prior to admittingthe feed to the rotary kiln. This additional heat supplements the heat in the exhaust from the kiln.The calcined feed then enters the rotary kiln at about 1,500ºF to 1,650ºF. Precalciner kilns, on theother hand, utilize a burner in a separate vessel along with a series of cyclones or grates to preheatand calcine the feed. Preheater and precalciner kilns are more energy efficient than long wet or longdry kilns and also typically have greater capacity. Figure II-15 shows a precalciner kiln equippedwith five cyclonic preheaters. A preheater kiln is similar, but fuel is not added and there is no burneron the cyclonic preheater portion. Prehearters could also be replaced with suspension preheaters, butthese are less common. Long wet and long dry kilns do not have preheaters and have much longerrotary kilns, with wet process kilns being the longest - normally several hundred feet long.
Table II-5: Summary of Cement Kiln Process Types in U.S. 34
Kiln Type Number of Kilns Total AnnualUS Capacity
(1,000 metric tons)
Average Per-KilnAnnual Capacity
(1,000 metric tons)Wet Kilns 70 20,797 297
Long Dry Kilns 66 16,933 256Preheater Kilns 37 15,148 409
Precalciner Kilns 27 23,774 880Total 200 77,652 388 (avg.)
Raw material, ormaterial fromprecalciner
ClinkerOut
Flame –the "Burn Zone"
Exhaust Gasesto Precalcinerand Gas
Fuel andAir In

II-27
Coal is the fuel of choice in cement kilns, primarily because of its low cost, but also becausethe coal ash contributes somewhat to the product. In 1997, 82% of the fuel used in cement kilns wascoal, 4% was natural gas, and 14% were other fuels, mainly combustible waste (industrial waste,tires, sewage sludge, etc.). Fuel nitrogen therefore contributes a small but significant amount to thetotal NOx for nearly all cement kiln applications. However, as will be discussed in Section D.1,despite coal’s higher nitrogen content, this fuel usually results in lower NOx than natural gas whenburned in the primary burn zone despite its higher nitrogen content.
Thermal NOx dominates fuel NOx in cement kilns. At the high temperatures required in theBurn Zone, nitrogen and oxygen in air combine to form NOx, regardless of the source of heat. Thethermodynamic equilibrium NOx level at 3,000ºF and 1% oxygen is about 1,500 ppm. The heatinput required for cement kilns, however, can vary with the characteristics of the local raw feed.Cement kilns process local limestone deposits, and the mineral’s characteristics will vary betweenlocations and may even vary at a particular location. Limestone’s mineral properties affect the levelof heating necessary to process the material, and thereby affect the level of NOx produced. Changesin residence time and other kiln adjustments can also decrease NOx concentrations, thus, two kilnsof similar design may produce different NOx emissions. Finally, NOx emissions vary across kilntypes. Long wet kilns tend to have the highest heat input per ton of clinker (typically, about 6MMBTU per ton), while long dry kilns use somewhat less heat (about 4.5 MMBTU per ton), andpreheater and precalciner kilns use even less heat, and these kilns create correspondingly variablelevels of thermal NOx (Figure II-16). This variability in NOx emissions from kilns provides achallenge to control NOx emissions from cement kilns. 39
Figure II-15: A Precalciner Cement Kiln with Five-Stage Cyclonic Preheater/Precalciner 35
Since 1973, the amount of annual clinker capacity in the U.S. and Canada has remainedrelatively stable at about 75,000-80,000 tons, with most new capacity coming from kilns of the dryprocess type. In response to demand for cement, the industry is adding new capacity at this time.Between 1973 and 1997, the average capacity per kiln increased from about 170,000 metric tons peryear to 388,000 metric tons per year, corresponding to a reduction of the total number of kilns from

II-28
nearly 450 small kilns to 200 larger kilns.36 Many of these larger kilns employ precalciner kilnsbecause they are the newest technology, have the largest capacity, and are more efficient than theolder technologies. If past trends continue, many of the existing wet kilns and long dry kilns areexpected to be replaced with precalciner kilns.
Recent years have seen Portland Cement plant capacity stretched by high demand, makingtechnologies that can increase capacity without increased capital expenditures very attractive. Theindustry is therefore developing technologies that improve facility’s outputs or reduce their operatingcosts. Conveniently, some of these technologies also offer the potential to reduce NOx emissions.
D.1 Primary Methods of Controlling NOx from Cement Kilns
The quality of clinker produced in a kiln varies with characteristics of the combustion;therefore primary controls need to be selected carefully. Dry Low NOx, for example, has seenvaried levels of success. The main firing zone of the kiln requires very high temperatures and is notcompatible with the lower flame temperature used by DLN to reduce NOx. Low excess air and airstaging are problematic control options for kilns because the kilns need an oxidizing environmentnot provided by those techniques. Despite these problems, indirect firing in combination with aLow-NOx Burner has been successfully used in some facilities, including California PortlandCement (Case Study CK-1 in Chapter IV). Low-NOx combustion methods can be used in theprecalciner because high temperatures are not required in that part of the process.
Figure II-16: NOx Emissions for Various Cement Kiln Types37
SP is Suspension Preheater kilns
Switching to a lower nitrogen fuel may not reduce NOx emissions. In fact, switching fromcoal to natural gas will rarely help to reduce NOx emissions and will likely cause NOx emissions toincrease. The luminous flame of a coal burner is more effective in heating the solid material than arelatively transparent natural gas flame, requiring less total heat when firing coal. The furnace gastemperature, therefore, is lower for a coal flame than for a natural gas flame for the same solid
II-29
material throughput. Hence, less thermal NOx is generated when firing coal, and the lower nitrogencontent of natural gas does not make up for the higher thermal NOx in the natural gas flame. Naturalgas fuel may be useful in reducing NOx from precalciner kilns, however, because the temperature inthe precalciner is much lower, reducing the impact of thermal NOx.
Lo- NOx Burners (LNBs) with Indirect FiringIndirect firing is a method that permits use of LNBs in the primary kiln burning zone. When
indirect firing is used, pulverized coal is fed to and collected in a particulate matter collection system(a cyclone separator that exhausts gas through a fabric filter). The pulverized coal is thentemporarily stored in a bin or hopper, where it is fed to the burner. This method allows less primaryair to be used in the burner than with a direct-fired coal mill, resulting in less thermal NOx.
LNBs can be used when indirect firing is employed. When implementing indirect firing withLNBs, other process improvements are often implemented, such as better process controls.Reference 39 mentions that 20%-30% NOx reductions can be achieved from the use of indirectfiring with LNBs and associated process modifications. Indirect firing is used in Case Study CK-1(Chapter IV).
Low-NOx PrecalcinersPrecalciner kilns can employ LNBs because the temperature in the precalciner is low enough
to reduce thermal NOx. Since roughly 60% of the fuel burned in a precalciner kiln is fired in theprecalciner, NOx reductions can be substantial. All new precalciner kilns are equipped with Low-NOx Burners in the precalciner. Low-NOx precalciners have been shown to reduce NOx by 30%-40% compared to conventional precalciners .38 This reduction is from the precalciner-generatedNOx, not for the entire kiln.
Mid-Kiln FiringMid-kiln firing entails injecting a fuel, usually tires, mid-way through long dry and long wet
kilns. This method has been shown to reduce NOx by about 30% with mid-kiln heat inputcomprising about 20% of the total heat input.39 Reference 40 provides results of tests of mid-kilnfiring on several kilns as summarized in Table II-6. The average NOx reduction for these kilns isabout 27%. Mid-kiln firing reduces the heat needed, and therefore the thermal NOx produced, in theprimary burn zone. Fuel NOx will also be reduced because tires and other mid-kiln fuels have lownitrogen contents. Nitrogen content in tires is roughly one fifth that of coal on a mass basis, whileheating value on a mass basis is similar.41 Coal can be used as a mid-kiln firing fuel, but tires arepreferable because they provide a revenue source when kiln operators are paid a tipping fee fortaking whole tires. Other revenue-generating fuels could potentially be used as well.42
The mid-kiln combustion process can be sensitive and must be controlled properly.Reference 42 describes the results of a trial burn of a mid-kiln firing system where about 10%reduction in NOx was achieved, but CO emissions increased from about 50% to about 75% overbaseline levels. Results have typically been better than this, and the addition of mixing air(discussed below) will address potential increases in CO emissions. Mixing air injected between thetire injection point and the feed inlet (the gas exit) makes it possible to address concerns regardingCO emissions and make further reductions in NOx. This technique is similar to overfire air onboilers, introducing the fuel to reduce NOx further with much less risk of high CO emissions.

II-30
Mixing air generally permits better combustion control and more consistent (and, generally lower)NOx emissions. Figures II-17a and II-17b show the effects of mixing air in reducing the variabilityof NOx, eliminating the highest values and resulting in an overall lower average NOx level.
Table II-6: NOx Reduction at Cement Kilns Using Mid-Kiln Technology 40
Initial NOx (ppm) 936 1372 1342 1359 565 513Final NOx (ppm) 790 994 600 883 488 456
% Reduction 16% 28% 55% 35% 14% 11%
Mid-kiln firing can be combined with other approaches, such as indirect firing. Case studyCK-1 in Chapter IV discusses the use of mid-kiln firing in combination with indirect firing toachieve combined NOx reductions of nearly 50%. In case study CK-1, it was determined that mid-kiln firing reduced facility production by 10% with a tire addition rate equivalent to a 12% (BTUbasis) fuel substitution rate. It is uncertain at this time if the reduced production experienced at theCalifornia Portland Cement should be considered typical.
Figure II-17a: Frequency of NOx Values on Cement Kiln with Mid-Kiln Tire Injection(Without Mixing Air) 40

II-31
Figure II-17b Frequency of NOx Values for the Cement Kiln with Mid-Kiln Tire Injection inFigure II-17a (With Mixing Air) 40
CemStarSM
Another approach that has been proven effective in reducing NOx is the patented CemStarSM
process, originally developed and sold as a method to increase production of clinker from existingkilns while minimizing capital expenditures.43, 44 In the CemStar process, steel or blast furnace slagis introduced as feed material into the kiln. The slag is generally added at the inlet to the rotary kiln(typically after the precalciner or preheater), regardless of kiln type, as shown in Figure II-18. Unlikenormal cement materials, which require significant processing to achieve adequate grain size, theslag need only be crushed to 3/4 to 1-1/2 inch pieces. Minimal processing is necessary because theslag has a low melting temperature and its chemical nature is very similar to the desired clinker.Minimal slag processing permits the equipment for the CemStar to be inexpensive and also reducesenergy consumption per unit of clinker produced. Moreover, the CemStar process can beimplemented on a kiln quickly with minimal impact to facility operations. The equipment needed ismostly material handling equipment as shown on the left in Figure II-18.
Because CemStar provides minerals (such as iron from the steel slag) that are normallyprovided by other mineral sources such as shale or clay, it is often best to reformulate the kiln feedwhen implementing CemStar. It may be possible to eliminate the use of mineralizers altogether andreduce the number of raw material components.
The advantages of CemStar approach are many: energy input can be reduced, NOx emissions(both lbs/hr and lbs/ton of clinker) can be reduced, and kiln capacity can be increased. Since thesteel slag more closely resembles the desired kiln product than do the normal raw materials, kilns

II-32
with CemStar require less intense firing and allow for a significant reduction of peak burn-zonetemperature. The lower burn zone temperature results in less thermal NOx generation. NOxreduction may be expected to be in the range of 20% or more for most kilns. If initial, uncontrolledNOx is high due to thermal NOx, CemStar is likely to provide reductions on the order of 40%-50%.Figures II-19a and II-19b show the results of testing with baseline conditions and CemStar,respectively. A 20% reduction in NOx resulted from CemStar, corresponding with a reduction inaverage burn-zone temperature of over 200°F.45 Kiln capacity is increased because each ton of steelslag added to the kiln results in about a ton of additional production, though the precise amount ofadditional kiln production is dependent on the mineral characteristics of the local raw material. Thiscapacity increase is the reason that many facility owners may initially choose to use CemStar.
Figure II-18: A Preheater Kiln Adding Steel Slag For CemStar 46
ROTARYKILN
PREHEATERTOWER
WEIGHFEEDER
Steel Slagbeing fedto the kiln
Where theslag entersthe kiln
CLINKER EXITSHERE

II-33
Figure II-19a: Base Case Testing (without CemStar) - NOx versus Burn-Zone Temperature45
Figure II-19b: CemStar Testing - NOx versus Burn Zone Temperature45
Base Case 7/21 to 8/4
0
50
100
150
200
250
300
350
400
450
2300 2400 2500 2600 2700 2800 2900
T2, deg F
NO
x, p
ph
Average Temp = 2618 FAverage NOx = 206 pph
CemStar 8/19 to 9/3
0
100
200
300
400
500
600
2000 2100 2200 2300 2400 2500 2600 2700
T2, deg F
NO
x pp
h
Average Temp = 2409 FAverage NOx = 167 pph

II-34
A side benefit to CemStar is reduced CO2 emissions. CemStar reduces the amount oflimestone that must be calcined per ton of clinker. For each ton of slag that replaces an equivalentamount of limestone (on a calcium basis), 0.512 tons less CO2 will be emitted.
TXI, the developer of CemStar, reports that more than 10 plants are equipped with thetechnology at this writing. Case Study CK-2 (Chapter IV) discusses one application of CemStar ona long-wet process kiln.
Process OptimizationOne final method for reducing NOx emissions from cement kilns is process optimization. In
principal, any effort that reduces the amount of fuel being fired to produce clinker will result in areduction in NOx generation. In practice, process optimization often entails the use of advancedcomputer controls and instrumentation. Many of the primary NOx control technologies describedare implemented along with process optimization to take advantage of their combined effects and toimprove overall facility operation. NOx reductions reported in the previous sections were generallyattributed to the changed combustion process (for example, mid-kiln firing). Combined reductionswere achieved in case study CK-4, Ash Grove Cement (Chapter IV). Figures II-20a and II-20b,from case study CK-4, show a 55% reduction in average NOx emissions - from 845 lb/hr to 383lb/hr - achieved largely by reducing the variability of the process with a computer-automatedoptimization system. Mid-kiln firing provided additional NOx reduction, for an overall NOxemission reduction of 59% from controls.
D.2 Secondary Methods of Controlling NOx from Cement Kilns
In addition to methods designed to reduce the NOx that is generated by combustion in thekiln, there are methods that can reduce the NOx after it is formed. These methods appear to workbest on precalciner kilns. It should also be noted that these secondary control measures can be usedin addition to methods used to minimize the NOx generated in the rotary kiln for greater combinedNOx reduction.
Selective Non-Catalytic Reduction (SNCR)SNCR has been tested in the U.S. on precalciner kilns and is planned for commercial use in othercountries.9, 47 Experience is limited to only a few units worldwide, but some tests have reportedsignificant reductions. Table II-7 lists commercial installations of urea SNCR on precalciner kilnsand the results of some demonstration programs. Effective operation of SNCR requires availabilityof a section of kiln with the proper temperature and residence time characteristics for goodreduction. The specifics of the installation will determine the level of reduction that is possible. It isunlikely that SNCR can be used effectively on many long kilns (wet or dry) because of the need foraccess to the proper temperature region for injecting urea or ammonia reagent. However on someprecalciner kilns the access to the proper temperature zone is good. In one demonstration of ureaSNCR on a precalciner kiln, over 80% NOx reduction was achieved.35 Commercial systems areexpected to deliver 25% to about 50% NOx reduction on some units overseas (see Table II-7). Asnoted earlier, the specifics of the kiln design determine the level of reduction that may be possiblethrough the use of SNCR.

II-35
Figure II-20a: NOx Emissions at Ash Grove Cement After Process Control (from Case StudyCK-4)
Figure II-20b: NOx Emissions Histogram at Ash Grove Cement Before Process Control (fromCase Study CK-4)
0
100
200
300
400
500
600
700
800
900
1000
50 110
170
230
290
350
410
470
530
590
650
710
770
830
890
950
1010
1070
1130
1190
1250
1310
1370
1430
1490
NOx (Pounds per Hour)
Nor
mal
ized
Fre
quen
cy D
istri
butio
n of
NO
x
0%
10%
20%
30%
40%
50%
60%
70%
80%
90%
100%
FrequencyCumulative %
Average Baseline 845 #/hr
0
100
200
300
400
500
600
700
800
900
1000
50 110
170
230
290
350
410
470
530
590
650
710
770
830
890
950
1010
1070
1130
1190
1250
1310
1370
1430
1490
NOx (Pounds per Hour)
Nor
mal
ized
Fre
quen
cy D
istri
butio
n of
NO
x
0%
10%
20%
30%
40%
50%
60%
70%
80%
90%
100%
FrequencyCumulative %
Average w/o Burning Tires 383 #/hr

II-36
Biosolids Injection (BSI)BSI is a technology that was developed in the 1990's by the cement industry for NOx
reduction in precalciner and preheater kilns. BSI adds dewatered sewage sludge to the mixingchamber of the calciner, as shown in Figure II-21. The dewatered biosolids provide a source ofammonia, producing an SNCR reaction to reduce NOx. At a Mitsubishi Cement Kiln in California,BSI provided about 50% reduction in NOx from about 250 ppm (at 12% oxygen) to 120-125 ppm (at12% oxygen). BSI has the additional benefit of offering a potential revenue stream because manycommunities are willing to pay a tipping fee for accepting biosolids. BSI technology may requiresignificant capital equipment expenditures, however. The material handling equipment needed andthe moisture in the dewatered biosolids is sufficient to strain the capacity of the fans of manyexisting facilities. It appears that biosolids injection may be an effective approach for NOxreduction, but it will depend on the specifics of the kiln.
Table II-7: NOx Reduction Performance of Urea SNCR on Precalciner Cement Kilns 9
COMPANY /LOCATION UNIT
TYPESIZE
(MMBtu/hr)NOX BASELINE(ppm, lb/MMBtu)
Reduction(%)
AMMONIA SLIP,(ppm)
Ash GroveCementSeattle, WA(Demo)
CementKiln/
Precalciner
160 tonssolids/hr
350-600 lb/hr >80 < 10
Korean CementDong YangCement, Korea(Demo)
NewSuspension
Calciner
na 1.27 lb/MMBtu 45 na
Taiwan CementUnits #3, #5, 
CementKiln/
Pre-calciner
260697658
1.29 lb/MMBtu1.58 lb/MMBtu0.92 lb/MMBtu
504525
151515
Wulfrath CementGermany(Demo)
CementKiln
140 1000 mg/Nm3500 ppm
90 na
Selective Catalytic Reduction (SCR)This technology has not been applied to cement kilns in the U.S. Although, in principal,
SCR can be used on cement kilns, the SCR reactor must be installed after gas cleaning devices andwill require reheating of the gas to achieve the proper temperature for the reaction. A "high-dust"SCR installation, used for most boilers equipped with SCR, may not be possible because of the highcalcium content of the dust in cement kilns, which may contribute to deposits that can rapidly reducecatalyst activity. Therefore, this technology is unlikely to be used in the near future to achieve NOxreduction from existing cement kiln facilities. This technology would more likely be used on newcement kiln facilities rather than existing facilities. In fact, Reference 11 shows low-temperatureSCRs on calciner kilns installed in Pittsburgh, CA in 1996. Experience at these calciner kilns maybe useful for cement industry applications.

II-37
Figure II-21: Biosolids Injection Process Equipment on a Precalciner Kiln 48
D.3 Combination of Technologies
It is not uncommon to combine combustion technologies with post-combustion technologiesfor other source types, and this could be done for cement kilns in some cases. It is also possible tocombine multiple combustion technologies on cement kilns. For example, California PortlandCement, in Case Study CK-1, combines indirect firing and mid-kiln firing to reduce NOx by acombined amount approaching 50%. It is also reasonable to expect that CemStar might be combinedwith a combustion technology such as mid-kiln firing to provide combined benefits. The exactamount of reduction will depend upon the regulatory requirements and technical limitations. Insome cases the NOx reductions may not be additive.
E. Summary
In this chapter the various commercially available NOx reduction technologies for industrialboilers, gas turbines, IC engines, and cement kilns were explored. In addition, several emergingtechnologies that have significant near-term commercial potential were discussed. Any of thesetechnologies may play an increasing role in reducing NOx emissions from existing sources. In thenext chapter the cost effectiveness of those technologies with significant commercial experience willbe evaluated. Finally in Chapter IV, case studies will be presented of actual projects where thesetechnologies have been employed. These case studies are the key feature of this report in that theyprovide "real world" technical and cost input to the calculations of cost effectiveness in Chapter III.

II-38
F. References 1 Marx, P. and Barton, C. "Combustion Tempering Demonstration on a Cyclone Unit for NOxControl." EPRI/DOE/EPA Combined Utility Air Pollution Control Symposium. Washington, DC:August 25-29, 1997.2 U.S. Environmental Protection Agency. Alternative Control Techniques Document - NOxEmissions from Industrial/Commercial/Institutional (ICI) Boilers. EPA-453/R-94-022, March1994.3 National Council for Air and Stream Improvement. A Review of NOx Emission Control Strategiesfor Industrial Boilers, Kraft Recovery Furnaces and Lime Kilns. Comments submitted in response toEPA’s SIP call., 19994 Acurex Environmental Corporation. Fuel Oil Nitrogen Effect on NOx Emissions and ControlledLevels. Prepared for Northeast States for Coordinated Air Use Management. April 19, 19945 Conti, A.V. and Hersh, S. "Emissions Reductions and Operations Benefits Derived from Low CostCombustion Hardware Modifications." ASME/EPRI International Joint Power GenerationConference and Exposition. Houston, TX: October 14-16, 1996.6 Pickering, R. “Developing Flexible Least-Cost Plans for NOx Compliance: PSNH’s Experiencesin Implementing SCR and SNCR Technology.” New NOx Regulations and Power Generation inCompetitive Markets. Washington, D.C.: November 3-5, 1999.7 Colannino, J. “NOx Reduction Technologies for Boilers”, Council of Industrial Boiler Owners’Eighth Annual NOx Control Conference. Philadelphia, PA: March 7-8, 1995.8 NESCAUM-MARAMA. Status Report on NOx: Control Strategies and Cost Effectiveness forUtility Boilers. Boston, MA: June, 1998.9 Fuel Tech NOxOUT Experience List. March, 1999, Naperville, Illinois10 Institute of Clean Air Companies. White Paper: Selective Non-Catalytic Reduction (SNCR) forControlling NOx Emissions., Washington, DC, May, 1997.11 Shell DeNOx System Reference List. Provided to the author by KTI. Concord, CA: April, 1998.12 Institute of Clean Air Companies. White Paper on Selective Catalytic Reduction (SCR) Control ofNOx Emissions. Washington, DC, November, 1997.13 Pritchard, S., Hellard, D. and Cochran, J. "Catalyst Design Experience for 640 MW CycloneBoiler Fired with 100% PRB Fuel." EPRI-DOE-EPA Combined Utility Air Pollution ControlSymposium: The MEGA Symposium. Atlanta, GA: August 16-20, 1999.14 Figure provided to the author by Kat Treff of Siemens Corp. Washington, D.C.: June, 1997.15 Gomez, A.F., Huhmann, A.L., Schrecengost, R.A., Pratapas, J.M., and Johnson, R.A. "CostEffective NOx Reduction with Amine Enhanced Fuel-lean Gas Reburn At Public Service Electric& Gas Mercer Station." ICAC Forum 1998. Raleigh-Durham, NC: March, 1998.16 Sommerlad, R.E., Pratapas, J.M, and Chan, I. "Gas-Based NOx Control Technologies, An Updateon Development and Commercialization." CIBO Ninth Annual NOx Control Conference. Hartford,CT: March 11-12, 1996.

II-39
17 Anderson, Skelley, Goren, and Cavello. "A Low Temperature Oxidation System for the Controlof NOx Emissions Using Ozone Injection." ICAC Forum 1998. Durham, NC: March, 1998.18 Zero Emission Technology. “Electro-Catalytic Oxidation Technical Overview.” PersonalCommunication, June 18, 1999.19 U.S. Environmental Protection Agency. “EPA Alternative Control Techniques Document - - NOxEmissions from Stationary Gas Turbines.” EPA-453/R-93-007, January, 1993.20 Chalfin, J. and Schorr, M. "NOx Control Approaching Zero for Gas Turbines - Is It Worth ThePrice?" Power Gen 1998. Orlando, FL: December 10, 1998.21 Rawlins, D.C. "SoLoNOx Combustion System Update." Solar Turbines TurbomachineryTechnology Seminar. TTS082/395, 1995.22 Leslie Witherspoon of Solar Turbines. Letter to the author. May 11, 1999.23 Catalytic Combustion Systems, "XONON It works at 3 ppm." December 1, 1998.24 Smith, K.O. "Advanced Combustion Systems." Solar Turbines Turbomachinery TechnologySeminar. TTS120/398/2M25 Mike Gregory of Peerless Manufacturing Company. Letter to the author. November 16, 1999.26 Krishnan Ramamurthy, Pennsylvania Department of Environmental Protection. Comments on thereport, February 13, 2000.27 Gas Turbine World, "Low-temperature SCR Expedites Plant Retrofits for NOx Reduction,”July/August, 1997.28 Goal Line Technologies. Presentation to Northeast States for Coordinated Air Use ManagementStationary Source Committee, Northampton, Mass, February 10, 1999.29 Cutshaw, T.R., Reyes, B.E. and Wagner, G.J. "Development of Ultra-Low Emission Controls forGas Turbines." ICAC Forum 2000. Roslyn, VA: March 23-24, 2000.30 State of California Air Resources Board. CAPCOA/ARB Proposed Determination of ReasonablyAvailable Control Technology and Best Available Retrofit Control Technology for StationaryInternal Combustion Engines (DRAFT). Sacramento, Ca, December, 1997.31 Coerr Environmental Corporation and Radian International, LLC. "Technical Issues Related tothe Potential Use of Selective Catalytic Reduction (SCR) to Reduce NOx Emissions from NaturalGas-Fired Lean Burn Engines." Prepared for the Gas Research Institute, November 9, 1998.32 Johnson Matthey. "Mobil Reduces NOx Emissions by 82% and 92% from Diesel and Natural GasTest Engines Using Johnson Matthey Urea SCR (Selective Catalytic Reduction) System." Pressrelease. December 6, 1999.33 Clean Diesel Technologies, Inc. Product Bulletin: “NOxOUT SCR NOx Control Technology &The ARIS 2000 Injection System,” 199934 Garth Hawkins, P.E. of the Portland Cement Association. Letter to the author. May 10, 1999.35 Sun, W.H., Bisnett, M.J., et al. "Reduction of NOx Emissions from Cement Kiln/Calciner throughthe Use of the NOxOUT Process." International Specialty Conference on Waste Combustion in

II-40
Boilers and Industrial Furnaces. Air and Waste Management Association. Kansas City, MO: April21, 1994.36 Portland Cement Association. U.S. and Canadian Portland Cement Industry: Plant InformationSummary, December 31, 1997.37 U.S. Environmental Protection Agency. “Alternative Control Techniques Document -- NOxEmissions from Cement Manufacturing.” EPA453/R-94-004, March, 1994.38 Young, G. L. and von Seebach, M. "NOx Variability Emission and Control from Portland CementKilns." Proceedings of the 34th International Cement Seminar, December 6-9, 199839 Portland Cement Association. "Report on NOx Formation and Variability in Portland CementKiln Systems Potential Control Techniques and Their Feasibility and Cost Effectiveness." PCAR&D Serial No. 2227, December, 1998.40 Eric Hansen of Ash Grove Cement. Letter to author. January 17, 2000.41 Schrama, H., Blumenthal, M., and Weatherhead, E. C. "A Survey of Tire Burning Technology forthe Cement Industry." IEEE Cement Industry Technical Conference. San Juan, Puerto Rico: June4-9, 1995.42 Stillwater, M.A. and Wahlquist, C.J. "Building a Successful Tire Derived Fuel Program."Proceedings of the 34th International Cement Seminar. December 6-9, 1998, Salt Lake City, UT.43 Young, R.D. "Method and Apparatus for Using Steel Slag in Cement Clinker Production." U.S.Patent No. 5,421,880. Issued June 6, 1995.44 Young, R.D. "Method and Apparatus for Using Blast-Furnace Slag in Cement ClinkerProduction." U.S. Patent No. 5,494,515. Issued February 27, 1996.45 Greg Mayes of Texas Industries, Inc. Letter to author. February, 2000.46 Texas Industries, Inc. Marketing Presentation, June 9, 1999.47 Steuch, H.E., Hille, J., Sun, W.H., Bisnett, M.J, and Kirk, D.W. "Reduction of NOx Emissionsfrom a Dry Process Preheater Kiln with Calciner Through the Use of the NOxOUT Process."Portland Cement Association Meeting of the General Technical Committee. Seattle, WA:September 18-21, 1994.48 Biggs, H.O. "BioSolids Injection Technology: an Innovation in Cement Kiln NOx Control."Proceedings of the 31st International Cement Seminar. TP 881 .I5, 1995.

III-1
III. Technology Costs
The decision to use a particular control technology on a facility is largely an economic one,once the technically feasible approaches and regulatory requirements have been identified.Operators of facilities will always choose the approach that meets their needs for control whileminimizing the expected cost of control. Therefore, an understanding of cost effectiveness ofdifferent approaches for NOx control is essential to understanding how the technologies might bedeployed. This chapter addresses the economics of applying various NOx control technologies tothe sources of interest.
This chapter builds upon the information in Chapter II and estimates the costs of applyingestablished NOx reduction technologies on existing facilities. The chapter describes the methodsused to estimate lifetime costs of implementing NOx controls, and presents the results of the costeffectiveness analysis for industrial boilers, gas turbines, internal combustion engines, and cementkilns.
A. Costs of Control
The analyses preformed for this report and the results presented are intended to berepresentative of many situations that are likely to be encountered by potential users of NOxreduction technology, but do not include the entire universe of applications that may be encountered.The situations addressed in this report are typical, and though there will be situations that are notaddressed in this document, it is expected that these will be only a small fraction of applications.The analyses of this section assume that the technology selected is technically appropriate for itsapplication. Due to the wide range of applications within some source categories, it is possible that,for any particular application, some technologies identified in this report may not be appropriate, or,for a particular actual situation, the technology might be uneconomical due to special circumstances.In order to estimate the cost effectiveness of controlling NOx from a source category with a specifictechnology, it is necessary to assume that the technology selected is feasible.
Cost analysis was only performed for technologies where commercial installations exist andthere was enough data available to estimate cost effectiveness with some reliability. Therefore,technologies that are identified in Chapter II as "emerging" were not analyzed for cost because thereis not enough data available to produce reliable estimates for these technologies at this time.
A.1 Cost Data
Industrial users of NOx reduction technology are generally less likely to publish articles ortechnical papers on their experience with NOx control technology than are electricity generatingutilities, leading to much less publicly available data on cost and performance of NOx reductiontechnology from industrial users than from electric utility boilers. Although actual data from casestudies and technology users was relied on heavily, in some cases it was necessary to rely onadditional sources. In this respect, the analysis in this report is slightly different than that inReference 1, which relied almost exclusively on information from case studies and other user-

III-2
provided information. In this study it was necessary to assemble information from technologysuppliers and users, and from documents published by EPA, state, and local regulatory agencies.
Information gathered in case studies was the primary basis for estimating costs, when thisdata was available. When case study information was not available, cost information from othersources was used. The case study information on capital cost generally corresponded well with thecost information from other sources. Additionally, the case studies provided valuable informationabout what these users actually budgeted for fixed Operating and Maintenance (O&M) costs.
In contrast to capital cost data, variable operating cost information (reagent costs,incremental fuel cost, etc.) can generally be estimated with good accuracy using existing data andengineering calculations of reagent consumption, catalyst consumption, fuel use, etc. This methodwas used in this report.
B. General Methodology
In this chapter, two general approaches will be used to estimate cost effectiveness. Thesetwo approaches will be shown to be consistent for assessing cost-effectiveness of different controlapproaches. The results of calculations presented later in the chapter are averages of the approaches.The first method projects a detailed pro forma cash flow over the project life. The second methodmakes an annualized base-year estimate (with 1999 as the base year). The base-year estimatemethod is, of course, much simpler to use. Combined use of both methods incorporates thefollowing benefits: 1) the pro forma method is more flexible, it provides a richer amount ofinformation, and can be used to address a much wider range of economic assumptions; 2) the pro-forma method shows the cost of controlling NOx with and without the effect of taxes, which can bea significant factor; and 3) the consistency of the two methods in determining cost-effectiveness ofcontrols on a before-tax basis provides greater confidence in both methods. Costs will be estimatedusing a “Constant Dollar” approach. The base year for the constant dollar approach was chosen tobe 1999.
In order to perform the pro-forma analysis, it is first necessary to make a reasonable estimateof inflation to predict escalation of costs. Inflation is difficult to predict with certainty, but its effectson long-term projects are so significant that it must be considered.vi Despite the uncertaintyregarding the actual future rate of inflation, it is possible to estimate current or anticipated futureinflation. The nominal yield on 3-month treasuries averaged about 2.1% above the rate of inflationfrom 1976 until 1985, and during this period the yield on 3-month treasuries ranged from 3.33% to8.11%.2 At the time of this writing, the yield on 3-month treasuries is about 4.75%.3 This impliesan expected near-term rate of inflation of about 2.6%. Although inflation over the life of a project islikely to differ from the current near-term inflation rate, it is impossible to predict how it will differ.
vi For example, an average inflation rate of 2.6% will cause prices in ten years to appear 30% higher.An annual inflation rate of 5% will cause prices in ten years to appear over 60% higher. Theinflation rate will vary over time, which makes estimating inflation difficult. Annual inflation rateaveraged 1.3% from 1953 to 1965, averaged 9.2% from 1973 to 1981, and averaged 3.6% from 1982to 1995.2 Inflation since 1995 has been extremely low, but it is uncertain if this trend will continuein the coming years.

III-3
Moreover, inflation in the early years of the project has the greatest effect on the overall projecteconomics. For the cost estimates in this report, a near-term inflation rate of 2.6% is assumed for thepro-forma analysis.
It is important to note that if costs are estimated for the purpose of capital budgeting for aspecific year in the near term (within the next five years, for example), a "Current Dollar" approachwould be used to estimate cost and the nominal dollars required in the budget for a particular year.
B.1 Components of Cost
The costs of employing a technology include the capital cost associated with placing thetechnology in service, lost production due to down time while the technology is installed, and thefixed and variable operating and maintenance costs associated with using the technology.
The capital cost of a project is determined by the cost of the equipment, materials, shipping,labor and other costs associated with placing the system in service. It is often necessary to fund thecapital purchase with funds "borrowed" from lenders and shareholders, who each require a fairreturn on the money they provide. These two considerations determine the financing costs.Moreover, taxes (property and income), insurance, and depreciation all impact the cash-flow effectsof employing a piece of equipment. It is not possible to explore every possible mode of financing inthis report, but reasonable assumptions can be made (Table III-1). These assumptions were used todetermine the Weighted Average Cost of Capital (WACC). For more information about WACC, seeReference 4.
The values in Table III-1 reflect an anticipated average for most U.S. companies likely toinstall NOx reduction equipment (utilities, large corporations, and medium sized companies). Ingeneral, electric utility and other projects financed by large, well-capitalized companies will tend tohave lower debt costs, higher proportion financed with debt (lower proportion financed with equity),and longer project economic life than the facilities examined in this report.
Other studies1,5,6,7,17 have used a simple payment equation for addressing the costs of capital.As shown later in this chapter, this normally provides a sufficiently accurate estimate for costeffectiveness in terms of $/ton of NOx reduced. However, some previous studies have receivedcritical comments regarding this treatment of costs and financing, calling such treatment toosimplistic.1 To address these concerns, the base year approach was combined with the pro formamethod. The "base year" approach is consistent with the methods in EPA's Alternative ControlTechniques (ACT) documents.5,6,7,17, Whether using the simpler approach or the more robustapproach, the results in this study were shown to be reasonably close, typically well within 10%,unless the reported values were small. For smaller values, (less than $500/ton of NOx removed), theresults of the two analyses sometimes differed by as much as $100/ton, but usually by much less.The results of cost-effectiveness calculations reported in the tables and figures in this chapter are theaverage of both approaches, unless noted otherwise.

III-4
Table III-1: Assumptions for Pro Forma Economic Analysis
Cost of Debt 7.5%Fraction of Debt Financing 40%
Cost of Equity 15%Fraction of Equity Financing 60%
Project Economic Life 15 yearsDepreciation for Tax Purposes MACRSvii
MACRS Class 10 yearProperty Taxes ($/1,000) $15viiiix
Insurance Negligibleviii
Income Tax Rate 35%Inflation rate 2.6%
Cost of material and labor used over the life of the program will vary as the costs of thoseitems increase (or sometimes decrease). In most cases they will increase. For the sake of thisanalysis, it is assumed that all material and labor that make up annual expenditures for operation andmaintenance of the system will increase in cost with the general level of inflation. Of course, inreality some items will increase in cost more and some less than the rate of inflation. But, for thisanalysis the simplifying assumption is that the general rate of inflation will be a reasonable estimatefor the increase in cost for all items.
The capital costs for various retrofit projects included in this report were determined fromreported costs in published references and as estimated from information in the case studies ofChapter IV. Cost analysis is only performed for those technologies where there is sufficientexperience such that reliable data is available to estimate cost. Therefore, there is no cost analysisfor emerging technologies in this report.
The operating and maintenance costs of the technology are determined by the cost ofadditional materials, (fuel, reagent, catalyst, replacement parts, etc.) and labor associated withowning and operating the technology. Published references (cited where appropriate later in thischapter) and case study information are used to determine the value for each of the components ofoperating and maintenance costs. Table III-2 lists assumed cost of certain consumables that willimpact operating cost.
vii MACRS is an accelerated method of depreciation accepted by the IRS for tax purposes.viii
ix Property taxes are determined by local law and, as discussed in Reference 8, frequently are not applied tocapital improvements associated with air pollution reduction. They are included in this analysis forconservatism. In Reference 8, increased insurance costs were shown to be negligible for this type of analysis.

III-5
Table III-2: Cost of Operating ConsumablesCoal $1.50 /MMBTU
Natural Gas $2.25 /MMBTUDistillate Fuel Oil $5.00/MMBTU
Ammonia (aqueous) $360 /ton (active agent)Urea (50% by weight aqueous solution) $0.95/gallonSCR Catalyst (except metal washcoat) $10,000-$14,000/m3
It is recognized that the cost of these operating consumables will vary from time to timeand from location to location; however, it is not possible to explore every possiblesituation in this report. These values are suggested to be representative of a large numberof facilities in the U.S.
B.2 Cost Analysis
The current dollar cash flow impacts of the NOx reduction technology, including operatingconsumables, maintenance, property taxes and effects of depreciation, are projected in a MicrosoftExcel Worksheet. These are adjusted for tax effects because it is assumed that the business hasearnings that are subject to income taxes and the company earnings and taxes payable will beimpacted by the project. To this is added an annualized capital charge that is determined to be equalto a payment at the company's Weighted Average Cost of Capital (WACC) over the project lifetime.As is normally done in project analysis, the cash flows are estimated as if the hardware andinstallation was an all-cash acquisition. The cost of financing is captured in the annualized capitalcharge (the WACC or discount rate). However, in the worksheets (see Appendix A) that weregenerated the actual cash flows inclusive of financing effects were shown as well, based on thefinancing assumptions that were made. The financing cash flow projections (specifically, debtinterest and principal) are shown for information purposes only, and these numbers do not contributeto the end result of the analysis (the cost-effectiveness in $/ton of NOx removed). The financingcash flows projected in future years do not figure into the cost-effectiveness analysis since,consistent with common project analysis methods, the purchase is treated as an all-cash transactionwith financing at the WACC. An annual capital charge, determined by the total capital cost andWACC, is applied each year which does figure into the $/ton cost estimate. Future operating andmaintenance cash flows are discounted at the rate of inflation, assumed to be 2.6%/year, to produceconstant dollar values.
Because the analyses of References 1, 5, 6, 7, 17 show results on a before tax basis, the Excelworksheet (Appendix A) also shows the results before taxes. It is notable that the after-tax costs willbe less than the before tax costs because for most companies the tax bill will be reduced as a resultof reduced before-tax income. Depreciation, a non-cash expense, has a very large effect on reducingthe tax bill. The operating and maintenance expenses are offset somewhat by reduced income taxes.A less significant effect that is incorporated into the analysis is the effect of interest payments inreducing the tax bill. This is why there are two WACC's shown in the spreadsheet. One includes theeffect of taxes on effectively reducing debt expense and the resulting annual capital charge, and theother doesn't. The "After Taxes" analysis includes this effect on debt and the "Before Taxes"analysis does not. Because the results of most other studies have been presented on a before-tax

III-6
basis, the before-tax results of this study should be used for comparison against the results of otherstudies. All results presented in this chapter and in other parts of the report are on a before-tax basis.After-tax results can be seen on the sample worksheets in Appendix A. The worksheets show thatwhen the effects of taxes are included, the costs can be much less.
Comments Regarding Net Present Value AnalysisFor most capital purchases a Net Present Value (NPV) analysis, which discounts all future
cash flows, is generally performed by a company. A traditional NPV analysis was not performed inthis study because of uncertainty regarding the appropriate discount rate. WACC is typically used asthe discount rate for future cash flows in NPV analysis. However, the proper discount rate for anNPV analysis on NOx reduction technology should be somewhat less than the WACC. This isbecause the costs of reducing NOx can be predicted with much more certainty than customerpayments and other cash flows that have a greater impact on business risk than the cost ofcontrolling NOx. So, while the WACC is appropriate for determining the cost of financing thecapital cost of a NOx reduction system (providers of debt or equity capital need to be compensatedat a fair rate), WACC is not appropriate for discounting the future cash flows associated with theNOx reduction system. An NPV analysis using WACC as the discount rate would underestimate thetrue cost of controlling NOx. Furthermore, many industrial companies (especially utilities) evaluatethese projects on a revenue requirement basis (revenue required to cover all costs, including capitalrecovery), which is similar to the analysis that was performed in this study. Revenue requirementmethods apply a Capital Recovery Factor (CRF) to the initial capital cost to determine an annualizedcapital recovery cost. This is effectively what was done for this analysis. In the analysis performedin this report, future cash flows were discounted at the rate of inflation. It could be argued that therate of return determined by long-term treasury bonds would be a better choice for discount rate offuture operating costs because it would incorporate the cost of money as well as inflation. But, theinflation rate was assumed because of simplicity and conservatism.
Comparison with the Approach in EPA's Alternative Control Technique (ACT) DocumentsAs noted earlier, a very simple "base year" (1999) analysis using a CRF calculated in the
same manner as in the appropriate EPA ACT document (Refs.5, 6, 7, 17) is shown in the worksheet.This is to ensure that the results are comparable to those of the ACT documents. In nearly all casesthe results for $/ton of NOx (before-tax basis) are within about 10% of the approach of the ACTdocument when economic assumptions are similar (project life, etc.). A benefit of performing bothanalyses (simple, as in the ACT document, and more robust as done in this report) is that the ACTresults are shown to be reasonably consistent with the results of the more robust approach. Resultswere almost always within the greater of 10% or $100/ton of one another and more often muchcloser.
Cost Effectiveness of Seasonal versus Annual ControlsGround-level ozone formation is primarily a seasonal concern (May 1 - September 30), and
regulations relating to NOx emissions for the purpose of controlling ground-level ozone formationoften focus on making reductions over a five-month period when ozone formation is of greatestconcern. (It should be noted that a number of states in the Northeast have either adopted or arecurrently seriously considering year-round controls of NOx emissions for additional benefits towardsreductions of acid deposition, improvement in visibility, reductions in fine particle concentrations,and other environmental benefits.) Some technologies can be secured ("turned off") outside of the

III-7
ozone season if the reductions provided by that technology are not currently required to comply withozone regulations. This way the operators of the source will incur less cost than if they operated theNOx reduction technology for the entire year.
SNCR and gas reburn are technologies that lend themselves well for operation in this mannerbecause most of the cost of use is associated with reagent consumption or additional fuel cost. Onthe other hand, some technologies may only be operated such that they provide continuousreductions year round. Generally, they cannot be turned off. Combustion technologies, such asLow-NOx Burners and Dry Low NOx fall into this category. Although the off-season reductionshave many environmental benefits noted above, they do not figure into the economic decision of theoperator if the operator is not required under current regulations to make those reductions.Therefore, if the operator installs the technology solely for the purpose of obtaining ozone-seasonreductions, it is reasonable that only ozone season NOx reductions should be used in the calculationof cost effectiveness, as was done in the recent EPA's cost analysis for the “NOx SIP (StateImplementation Plan) Call” action. For this reason, in calculations for cost effectiveness in thischapter, values are shown for both annual reductions and ozone-season reductions for alltechnologies, even if the technology provides NOx reductions year round. In cases where thetechnology may not be operated outside of the ozone-season, it is assumed that the variableoperating costs (costs associated with urea, ammonia, natural gas, etc.) are zero outside of the ozoneseason. For SCR, it is assumed that the catalyst continues to be degraded in proportion to the annualoperation of the facility, not just when ammonia is being injected for the purpose of NOx reduction.
C. Industrial Boilers
C.1 Cost Effectiveness of Primary Methods of Controlling NOx from Industrial Boilers
Cost effectiveness of primary control methods is driven primarily by the capital cost of thecontrols, the effectiveness of the controls in reducing NOx, the uncontrolled NOx level, and thecapacity factor of the boiler. Since this study is directed primarily at major sources, smallcommercial boilers that operate intermittently are of less interest than larger, field-erected units usedby large industrial users that operate at higher capacity factors. This study evaluates costeffectiveness of various control technologies at three (low, medium, and high) capacity factors of45%, 65% and 85%, overlapping the range of 33% to 80% considered in Reference 5.
Unfortunately, few of the case studies described in this report provided additional insight tothe cost effectiveness of NOx control for industrial boilers using combustion controls. It is thereforenecessary to rely heavily on published data. Reference 5 forms the basis for the costs in thisanalysis, with other references cited when used. The capital costs of controls are from Reference 5,or from the case studies as available, though it is recognized that performance and cost will varysomewhat from one facility to another. The initial baseline level will vary as well, which willsignificantly impact the cost effectiveness.
Table III-3a shows cost effectiveness on an annual and seasonal basis for installation of Low-NOx Burners to achieve NOx reduction from 0.60 lb/MMBTU to 0.38 lb/MMBTU (a 60% NOxreduction) on a coal fired boiler as a function of capacity factor. Table III-3b shows the results ofsimilar calculations for identical conditions, with NOx reduced to only 0.45 lb/MMBTU (a 25%

III-8
reduction). Experience with electric generating units has shown that NOx levels well below 0.50lb/MMBTU are typical with LNBs and sometimes NOx levels approaching 0.30 lb/MMBTU arepossible on wall- and tangential-fired units, so assuming an approximate control level in the range of0.40 lb/MMBTU for industrial boilers is reasonable. Application of low NOx combustiontechnology can adversely impact boiler efficiency, but these effects are difficult to predict andgenerally have a minor impact on cost. Therefore, these effects are ignored for the purpose of thisanalysis.
As shown in the tables, NOx reduction is possible on an annual basis for under $2,000/ton ofNOx removed for all conditions, and under $1,000/ ton in some cases. For seasonal controls, costper ton of NOx reduction is higher by a factor of about two.
The analyses for both tables assume a capital cost of about $5,000/MMBTU/hr, which isclose to the assumed value in Reference 5. In cases where the cost is higher or lower than$5000/MMBTU/hr, the cost effectiveness is scaled in proportion to the capital cost. For example, ifthe capital cost is actually $6,000/MMBTU/hr, the cost effectiveness (in $/ton) is increasedproportionately by 20%. Similarly, if capital cost is only $2,500/MMBTU/hr, then the costeffectiveness (in $/ton) should be reduced by half.
Table III-3a: Cost Effectiveness for NOx Reduction with LNB on a 350 MMBTU/hrCoal-Fired Boiler with Capital Cost of $5,000/MMBTU/hr (36% NOx Reduction
From 0.60 lb/MMBTU)
Capacity FactorTime Periodof Control 0.45 0.65 0.85Seasonal $3,308 $2,290 $1,751Annual $1,378 $954 $730
Table III-3b: Cost Effectiveness for NOx Reduction with LNB on a 350 MMBTU/hrCoal-Fired Boiler with Capital Cost of $5,000/MMBTU/hr (25% NOx Reduction
From 0.60 lb/MMBTU)
Capacity FactorTime Periodof Control 0.45 0.65 0.85Seasonal $4,763 $3,298 $2,522Annual $1,985 $1,374 $1,051
Table III-4a shows the cost effectiveness of a gas-fired Low -NOx Burner retrofit capable of50% reduction from 0.20 lb/MMBTU with a capital cost of ~$5,000/MMBTU/hr for a field-erectedfacility. Note that for the seasonal analysis, credit is taken only for those reductions during the 5-month ozone season, even though NOx reductions occur year round. In this case annual NOxreductions are possible for under $2,000/ton, while seasonal control is more expensive.
Other, less expensive approaches for reducing NOx may be possible, such as “Burners Out ofService,” simple modification of existing hardware, or modification of swirlers, fuel guns, etc. Ananalysis was performed for modifications that would cost only $300/MMBTU/hr but achieve only asmall NOx reduction of 25%. As shown in Table III-4b, modification of existing hardware or

III-9
otherwise less expensive equipment may reduce NOx, making NOx reductions possible for under$1,000/ton under all circumstances evaluated. Even if NOx reductions were much less (say, only10%), NOx reductions would still be well below $1,000/ton, annually and under $2,000/ton,seasonally.
As noted in Chapter II Section A.1, fuel nitrogen content of No. 6 fuel oil can vary from 0.1to 0.6%, which will significantly impact the effectiveness of Low-NOx Burners when firing residualfuel oil. In Case Study BLR-2 (Chapter IV), a NOx reduction of 10% was achieved with a totalcapital cost of only $30,000 through simple burner modifications. These boilers had a fairly highfuel nitrogen level of 0.46%, limiting the ability to lower NOx with LNBs. Table III-5 shows theresults of cost calculations for this application.
Table III-4a: Cost Effectiveness for NOx Reduction with LNB on One Gas-Fired350 MMBTU/hr Boiler
50% NOx reduction from 0.20 lb/MMBTU and Capital Cost of $5,000/MMBTU/hrCapacity FactorTime Period of
Control 0.45 0.65 0.85Seasonal $7,145 $4,946 $3,783Annual $2,977 $2,061 $1,576
Table III-4b: Cost Effectiveness for NOx Reduction Through Minor Modificationson One 350 MMBTU/hr Boiler
25% NOx reduction from 0.20 lb/MMBTU and Capital Cost of $300/MMBTU/hrCapacity FactorTime Period of
Control 0.45 0.65 0.85Seasonal $857 $594 $454Annual $357 $247 $189
Table III-5: Cost Effectiveness for Burner Modification on Two Oil-Fired 680MMBTU/hr Boilers
10% NOx reduction from 0.43 lb/MMBTU and Capital Cost of $30,000, or$22/MMBTU/hr
(Case Study BLR-2)Capacity FactorTime Period of
Control 0.45 0.65 0.85Seasonal $72 $50 $38Annual $30 $21 $16

III-10
C.2 Cost Effectiveness of Secondary Methods of Controlling NOx from Industrial Boilers
Selective Non-Catalytic Reduction (SNCR)The costs of SNCR for an industrial boiler will depend, in part, on boiler type, fuel, reagent,
and operating mode. Some boilers, because of their size and higher furnace temperatures, lendthemselves better to urea use than to ammonia use. Urea's temperature window is slightly higherand broader than that of ammonia, and urea is easier to distribute in large furnaces. The cost ofammonia systems is sometimes greater due to the more sophisticated injection systems that arerequired.1 For the sake of conservatism, the analysis in this program will be for urea-based systems.In some cases this will result in a slightly higher cost per ton of NOx removed than for an ammoniasystem. However, this analysis does not include the additional cost of safety precautions that may benecessary when using ammonia reagent.
For boilers of about 250 MMBTU/hr or more, capital cost is expected to vary from about$500,000 to $1,000,000 for urea SNCR technology. Table III-6 shows the cost of variouscommercial urea SNCR systems. For ammonia SNCR, the capital cost may be less for fluidized-bedor bubbling-bed boilers. However, this equipment cost advantage may be offset by safety provisionssometimes necessary when using ammonia. Such safety provisions are determined by localgovernment authorities and can vary widely from one location to another.
Minergy Corporation, in Neenah, Wisconsin (Case Study BLR-1, Chapter IV), reported acapital cost of $500,000 to $750,000 for its 350 MMBTU/hr facility. Using an average cost of$625,000 and adding $150,000 for the cost of installation, a total cost of $775,000 was used for thisanalysis. For a 15-year project life, 5-month ozone season control, and a capacity factor of 65%, thecost of NOx reduction over the project life is estimated to be about $2,450/ton of NOx removed. Forannual control the cost effectiveness would be about $1470/ton of NOx removed. Table III-7 showsthe effect of capacity factor on cost effectiveness of NOx reductions
Table III-6: Reported Cost of Urea SNCR for Wood-Fired Power Boilers 8
Size,MMBTU/hr
BoilerType
CapitalCost
EstimatedAnnual
Operating Cost
BaselineNOx
NOxReduction
900 Grate-FiredBiomass
$1.1 M $230 K 235 ppm 50%
475 CombustionEngineering
Stoker
$700K $54 K 0.47lb/MMBTU
60%
300 Riley Stoker $600K $40K 0.25lb/MMBTU
30-50%
245 Front-FiredFiber Waste
$390K $58 K 370 ppm 50%
Capital cost shown includes equipment, engineering, and commissioning, butnot installation. Installation typically adds about 20% to 30% to the cost.

III-11
Table III-7: Cost Effectiveness for SNCR NOx Reduction on a 350 MMBTU/hrBoiler
35% NOx reduction from 0.45 lb/MMBTU (Case Study BLR-1)Capacity FactorTime Period of
Control 0.45 0.65 0.85Seasonal $3,303 $2,518 $2,101Annual $1,814 $1,470 $1,300
Selective Catalytic Reduction (SCR)There have been relatively few SCR systems installed in the U.S. on industrial boilers or
process heaters firing fuels other than natural gas or refinery gas. Since there are currently no coal-fired industrial boilers in the U.S. that have been retrofitted with SCR, it is necessary to estimatecosts from what is known about electric generating SCR retrofits on coal-fired boilers. Reference 1demonstrated that there is a pronounced economy of scale for SCR on coal-fired boilers, whichmakes SCR more expensive per unit of boiler heat input (or facility output) on a small boiler than alarge one. However, on sufficiently small applications, the SCR reactor and controls can be shopfabricated in a modular form. This may reduce the amount of field erection and engineeringresulting in lower costs. Operating costs (ammonia and catalyst) can generally be estimated with ahigh level of certainty once the boiler characteristics are known.
Since SCR application to a coal-fired boiler is most likely to provide cost-effective NOxreductions, an example of a coal-fired application is used to estimate costs. As noted above, sincethere are no coal-fired industrial boilers in the U.S. that have been retrofitted with SCR, it isnecessary to project costs from what is known about electric utility SCR retrofits on coal-firedboilers. Costs are calculated for NOx reduction on a 350 MMBTU/hr boiler at an estimated capitalcost range of $10,000/MMBTU/hr to $15,000/MMBTU/hr. This range is reasonable if costexperience with utility boilers is extrapolated to smaller industrial boilers, with $10,000/MMBTU/hrnear the high end of the capital cost of a utility boiler of about 100 MW size (1,000 MMBTU/hr).Given the greater economies of scale for utility boilers compared to industrial boilers, we assumethat SCR capital cost for an industrial boiler will be higher on a $/MMBTU/hr basis than for a utilityboiler.
The SCR applications for an industrial boiler in the U.S. are on relatively clean applications.Even the SCR in Case Study BLR-4 (Chapter IV), a 57 MMBTU/hr wood-fired facility at SauderWoodworking, is downstream of a hot-side ESP (electrostatic precipitator) that removes most dust inthe exhaust stream. In this case study, the cost of the catalyst, catalyst reactor, ammonia flowcontrol, ammonia injection grid, and engineering was about $450,000. Additional costs includeinstallation labor and materials, the anhydrous ammonia storage tank, and startup.9 Adding 25% forthe hardware and labor to install the SCR and to provide an ammonia storage tank yields a cost ofunder $9,500/MMBTU/hr for this 57 MMBTU/hr application. SCR capital costs tend to exhibiteconomies of scale and a 350 MMBTU/hr boiler firing relatively clean fuel would likely cost wellbelow $9,500/MMBTU/hr, probably around $5,000-$6,000/MMBTU/hr. This is consistent withutility boiler experience, which found that SCR on clean fuel applications would cost under half theprice of SCR on coal applications of similar output. This is also consistent with the cost of reduction

III-12
as reported by a technology supplier of a urea SCR system of $7,500/MMBTU/hr for a 100MMBTU/hr gas-fired boiler.8
Table III-8a shows the cost effectiveness of SCR on a 350 MMBTU/hr industrial boiler foran 80% NOx reduction from 0.45 lb/MMBTU while assuming a capital cost of $10,000/MMBTU/hr.In this case, SCR can control NOx for under $2,000/ton on an annual basis for most capacity factorsof interest. Another analysis is performed for a more expensive SCR, at $15,000/MMBT/hr (TableIII-8b). In this case, SCR on higher capacity factor boilers (over 65%) can provide NOx reduction ata cost of under $2,000/ton on an annual basis. In both cases the cost effectiveness in $/ton is over$3,000/ton under most circumstances when control is only on a seasonal basis.
Table III-8a: Cost Effectiveness for SCR NOx Reduction on a 350 MMBTU/hr Coal-Fired Boiler - 80% NOx Reduction from 0.45 lb/MMBTU and Capital Cost of
$10,000/MMBTU/hr
Capacity FactorTime Period ofControl 0.45 0.65 0.85
Seasonal $5,046 $3,677 $2,953Annual $2,179 $1,609 $1,307
Table III-8b: Cost Effectiveness for SCR NOx Reduction on a 350 MMBTU/hr Coal-Fired Boiler - 80% NOx Reduction from 0.45 lb/MMBTU and Capital Cost of
$15,000/MMBTU/hr
Capacity FactorTime Period ofControl 0.45 0.65 0.85
Seasonal $7,030 $5,051 $4,004Annual $3,006 $2,181 $1,745
SCR on a gas-fired facility will have a lower capital cost due to the lower catalyst volume,but will reduce NOx from a lower baseline NOx. Table III-9a shows the estimated costeffectiveness for an SCR on a 350 MMBTU/hr gas-fired facility with a capital cost of$5,500/MMBTU/hr ($1.925 million) that reduces NOx 80% from 0.15 lb/MMBTU baseline. Forannual control, NOx reduction can be achieved at a cost effectiveness approaching $2,000/ton athigher capacity factors. However, for seasonal control, cost of NOx reductions increases by a factorof about two. Since there are numerous gas-fired boilers in the range of 100 MMBTU/hr, analysiswas also performed for SCR on a gas-fired boiler of this size (Table III-9b). As indicated, NOxreductions are more costly on a smaller boiler. Except in the case of high capacity factor units thatare required to reduce NOx on an annual basis, the cost of NOx reduction will exceed $6,000/ton.

III-13
Table III-9a: Cost Effectiveness for SCR NOx Reduction on a 350 MMBTU/hr Gas-Fired Boiler
80% NOx reduction from 0.15 lb/MMBTU and Capital Cost of $5,500/MMBTU/hrCapacity FactorTime Period of
Control 0.45 0.65 0.85Seasonal $8,519 $6,064 $4,764Annual $3,626 $2,603 $2,062
Table III-9b: Cost Effectiveness for SCR NOx Reduction on a 100 MMBTU/hrGas-Fired Boiler
80% NOx reduction from 0.15 lb/MMBTU and Capital Cost of $7,500/MMBTU/hrCapacity FactorTime Period of
Control 0.45 0.65 0.85Seasonal $14,479 $10,190 $7,919Annual $6,110 $4,322 $3,376
ReburningReburning is another technology available for industrial boilers, but most experience has
been on utility boiler applications. Conventional Gas reburning is in use at industrial boilersoperated by Kodak in Rochester, New York.1 A version of gas reburning called Methane DeNOx isbeing commercially used at Cogentrix in Richmond, Virginia. 10
Another type of gas-reburning, Fuel Lean Gas Reburn (FLGRSM), has been employed onseveral utility units, but is also applicable to industrial units. For utility units, Conventional GasReburn costs about $15/KW (or about $1,500/MMBTU/hr) to deploy and FLGR deployment costsabout $7-8/KW (or about $800/MMBTU/hr). For industrial applications, a cost of about$2,000/MMBTU/hr for Conventional Gas Reburn and $1,000/MMBTU/hr for FLGR was assumed.For Amine Enhanced FLGR (AEFLGRSM), which has been deployed on several electric utility units,a cost of $2,500/MMBTU/hr was assumed for this report.
In cost analysis for the three cases of conventional gas reburning, FLGR, and AEFLGR, a350 MMBTU/hr boiler that fires coal as a primary fuel is assumed to have a baseline NOx level of0.45 lb/MMBTU with natural gas costs of $0.75/MMBTU higher than coal (“fuel differential”) (seeTables III-10a, III-11a and III-12a). Tables III-10b, III-11b and III-12b show results of similarcalculations, but at a higher fuel differential of $1.00/MMBTU.
These gas-based technologies provide NOx reduction below $2,000/ton under mostconditions when the fuel differential is $0.75/MMBTU. However, these technologies are sensitiveto the incremental fuel cost of gas over coal. When the fuel cost differential increases to$1.00/MMBTU, the cost of using conventional gas reburn increases by about $400/ton of NOxreduced. The same fuel differential increases the cost of reducing NOx with FLGR and AEFLGR byabout $200/ton and $100/ton, respectively.

III-14
Various forms of gas reburning could be used on facilities firing other fuels. For oil-firedfacilities, particularly those firing residual oil, similar results might be possible if the furnace couldtechnically accommodate the reburning system. Natural gas facilities could also utilize thistechnology, but in most cases it is expected that gas-fired facilities will utilize Low-NOx Burnertechnology rather than reburning because it is likely to be a simpler retrofit and because many gas-fired furnaces may be too small to permit the use of reburning.
Table III-10a: Cost Effectiveness of NOx Reduction by Conventional Gas Reburn,Assuming 55% NOx Reduction from 0.45 lb/MMBTU, 20% Gas Injection, and
$0.75/MMBTU Incremental Fuel Cost for Gas.
Capacity FactorTime Period ofControl 0.45 0.65 0.85
Seasonal $2,665 $2,215 $1,975Annual $1,810 $1,625 $1,520
Table III-10b: Same as 3.10a, Except $1.00/MMBTU Incremental Fuel Cost for Gas.
Capacity FactorTime Period ofControl 0.45 0.65 0.85
Seasonal $3,097 $2,613 $2,373Annual $2,208 $2,019 $1,920
Table III-11a: Cost Effectiveness of NOx Reduction by FLGR, Assuming 35% NOxReduction from 0.45 lb/MMBTU, 6% Gas Injection, and $0.75/MMBTU
Incremental Fuel Cost for Gas.
Capacity FactorTime Period ofControl 0.45 0.65 0.85
Seasonal $2,000 $1,565 $1,330Annual $1,170 $985 $890
Table III-11b: Same as 3.11a, Except $1.00/MMBTU Incremental Fuel Cost for Gas.
Capacity FactorTime Period ofControl 0.45 0.65 0.85
Seasonal $2,220 $1,756 $1,523Annual $1,362 $1,179 $1,083

III-15
Table III-12a: Cost Effectiveness of NOx Reduction by AEFLGR, Assuming 60%NOx Reduction from 0.45 lb/MMBTU, 6% Gas Injection, NSR=1.2 and
$0.75/MMBTU Incremental Fuel Cost for Gas.
Capacity FactorTime Period ofControl 0.45 0.65 0.85
Seasonal $2,455 $1,965 $1,700Annual $1,520 $1,315 $1,210
Table III-12b: Same as III-12a, Except $1.00/MMBTU Incremental Fuel Cost forGas.
Capacity FactorTime Period ofControl 0.45 0.65 0.85
Seasonal $2,604 $2,073 $1,812Annual $1,631 $1,425 $1,316
NSR is a measure of the urea or ammonia injection rate.
Coal Reburning is a technology used at Kodak Park (Case Study BLR-8 in Chapter IV).Natural gas was not readily available to Boiler #15 for use as a reburn fuel and a substantial portionof the coal reburning project cost was borne by cofunders who wished to demonstrate thetechnology. Reference 1 found this to be a costly method for NOx reduction that may be applicableonly in specific situations. In most cases it is expected that coal reburning will be too costly toemploy in most industrial boilers from a capital cost perspective. Technical challenges will alsolimit its applicability, and other techniques may be preferred economically and technically.However, there may be special situations where it may be applicable to industrial boilers.
D. Gas Turbines
NOx control methods for gas turbines include methods that reduce NOx that is generated inthe combustion process itself (primary controls) and methods that reduce NOx after it is generated inthe combustion process in the exhaust gas (secondary controls). In general, primary control methodsare less costly and provide a lesser level of control, and secondary methods are more costly but doprovide a much higher level of NOx control.
D.1 Cost Effectiveness of Primary Methods of Controlling NOx from Gas Turbines
Primary methods of NOx control minimize the amount of NOx generated in the turbinecombustor. The two most widely used methods include Dry Low NOx technology and DiluentInjection technology.
Dry Low NOx (DLN)Dry Low NOx has been employed on numerous gas turbines in the U.S. Several case studies
that use DLN are included in this report. Capital cost was the primary cost associated withimplementing Dry Low NOx on the Solar and General Electric (GE) turbines that were evaluated.

III-16
Allison offers a DLN retrofit that is fairly low in capital cost, though this retrofit is designed forbase-loaded operation under a fairly limited load range.11 In order to explore a broader range ofturbine applications and provide conservative results, Solar turbine retrofits designed for wider loadranges are evaluated in this report.
The cost of NOx reduction by DLN is very sensitive to the capacity factor of the turbine.Analysis of the case study data showed that there could be substantial variation in capital costmeasured in terms of dollars/horsepower ($/hp). This is due to different turbine types, variations inturbine designs over the years, and different scopes of supply that often result from turbinedifferences or simply from additional work the user found convenient at the time of retrofit. Forsome applications, this additional work can include the addition of sophisticated control retrofitsnecessary to utilize the DLN technology or equipment overhauls performed at the time of retrofit. Inthis latter case, when it was known that work was performed that was not essential for the DLNretrofit, its cost was not included for cost analyses in this chapter.
For the analysis in this report, $750,000 was assumed as the total capital cost to retrofit oneSolar Centaur turbine (4,700 hp at $160/hp) and $1,950,000 to retrofit one Solar Mars turbine(13,000 hp at $150/hp). These values are similar to the reported cost in the case studies. Also, notethat these were the total project costs the owners attributed to the project, which may include projectmanagement or other charges associated with the project beyond the equipment and installation.Fixed O&M costs were shown to be about $15,000 per year for each facility, which usually involvedmore than one turbine. No variable O&M charges were attributed to the DLN retrofit in thisanalysis. In the case studies, owners reported no adverse change in turbine heat rate. In fact, heatrate was improved when converting a turbine from water or steam injection to DLN.
The economic analysis in this report differs from that shown in the Case Studies GT-1, GT-2,GT-3 and GT-7 that involve Solar Centaurs and Solar Mars turbines (Chapter IV) in several ways.First, the analysis performed in this report averages the estimates from a discounted cash flowapproach and a first-year estimate, versus just a first-year estimate for the case studies. Thediscounted cash flow method of this report uses a fifteen-year project life at a 12% discount rate, andthe first- year analysis in this report uses a fifteen-year life and discount rate of 10% (CapitalRecovery Factor or CRF = 13.1%). The case study analyses are based on a ten-year life with an 8%discount rate (CRF = 14.9%). These assumptions can have a significant effect on the results.Second, in this study, indirect costs such as property taxes are explicitly stated while the case studyanalysis makes assumptions regarding other indirect costs (administration, etc.) and applies anannual charge equal to a certain percentage of the capital cost. Results of past studies suggest thatusing this percentage of total capital invested tends to overestimate the indirect costs, especially onvery capital-intensive air pollution technology retrofit projects discussed in this report.1 Finally,since the installations usually involve multiple turbines rather than a single turbine, the analysis inthis report assumes multiple turbine installations. On the other hand, the analyses in the case studiesare prepared for single turbine installations. Hence, all of these differences in the analysis approachcontribute to differences in results.
Tables III-13 and III-14 show analysis for Solar Centaur and Mars turbines, respectively.These turbines are widely used in industry, as are the Solar Taurus and turbines from Allison andDresser Rand. As Tables III-13 and III-14 show, retrofit of conventional combustion technologywith DLN can cost less than $2,000/ton. DLN retrofits on turbines operated at a high capacity factor

III-17
(95%) can reduce NOx emissions in the range of 70% on an annual basis at a cost of about$1,300/ton for a Mars turbine and by about 63% for about $1,900/ton for a Centaur turbine. Atlower capacity factors or for seasonal control, the costs are higher. For example this analysis showsthat the owner of a Solar Centaur with only 45% capacity factor may find the cost of reducingozone-season NOx to be over $9,000/ton with DLN. In this case, other approaches such as waterinjection may be more attractive.
Table III-13. Cost Effectiveness ($/ton) for Two Solar Centaur (7000 hp each)Retrofit with DLN for Reducing NOx from 135 to 50 ppm (63% reduction)
Capacity FactorTime Period ofControl and
NOxReduction
0.45 0.65 0.85 0.95
Seasonal135 to 50 ppm
$9,483 $6,565 $5,020 $4,492
Annual135 to 50 ppm
$3,951 $2,736 $2,092 $1,872
If the actual baseline NOx level were lower, as in Case Study GT-7, the cost of control willbe higher. New Centaur Turbines equipped with SoloNOxTM technology are guaranteed at25 ppm.12
A 75 MW turbine is evaluated next to represent larger turbines. Case Study GT-4 addressesa Dry Low NOx retrofit of 75 MW GE Frame 7 turbines originally equipped with water injection forNOx reduction. The cost effectiveness of retrofitting turbines with traditional combustiontechnology and no prior controls is also evaluated. While the case study GT-4 was a retrofit of aturbine that was originally equipped with water injection, for this study it is assumed that the retrofitwould have cost about the same if the turbine had conventional combustion technology. This isprobably a reasonable assumption for the purposes of this report. It is important to note that in thecase study GT-4, the owner reported a significant improvement in the heat rate as a result of theDLN retrofit from water injection. As will be shown below, this improvement in heat rate andreduced water treatment costs help to make a DLN a NOx control retrofit option that can pay foritself.
Table III-14. Cost Effectiveness ($/ton) for Retrofit of Two Solar Mars (2x13,000 hp)Reducing NOx from 167 to 50 ppm (70% reduction)
Capacity FactorTime Period ofControl and
NOxReduction
0.45 0.65 0.85 0.95
Seasonal167 to 50 ppm
$6,640 $4,597 $3,515 $3,145
Annual167 to 50 ppm
$2,767 $1,915 $1,465 $1,311
If the actual baseline NOx level were lower, as in Case Study GT-8, cost of control will be higher. New Marsturbines equipped with SoloNOxTM technology are guaranteed at 25 ppm.12

III-18
Case Study GT-4 showed a capital cost of the retrofit equal to $49/KW, or about $36/hp. Itis reasonable that for this larger turbine the cost of the retrofit would be less, when measured on a$/KW or $/hp basis, than for a smaller turbines, such as Solar Centaur and Solar Mars describedearlier. The cost of $36/hp for the larger 75 MW turbine is about one fourth to one fifth of theamount (in $/hp) that was used for the cost of DLN retrofits of industrial turbines in the range of 3-10 MW.
As shown in Table III-15, a DLN retrofit of a 75 MW GE Frame 7 equipped with originalcombustion technology will achieve 90% NOx reduction at a cost effectiveness well below$1000/ton under almost all of the conditions evaluated.
Table III-15. Cost Effectiveness for 75 MW GE Turbine Retrofit with DLN fromConventional Combustion, Reduction from 154 ppm to 15 ppm (90% reduction)
Capacity FactorTime Period ofControl 0.45 0.65 0.85 0.95
Seasonal $1,126 $779 $596 $533Annual $469 $325 $248 $222
Table III-16 shows the estimated cost of reducing NOx with a DLN retrofit on a turbine thatis originally equipped with water injection. These results are very interesting. For most conditions,reduction of NOx by a DLN retrofit on a turbine originally equipped with water injection willactually pay for itself due to reduced fuel costs and reduced annual costs associated with theoperation of the water injection equipment. Of course, this analysis is sensitive to the actual level ofefficiency improvement. In case study GT-4, the owner reported a significant improvement in heatrate as a result of the DLN retrofit from water injection, and this efficiency improvement was used inthe present analysis. Because the cost savings from reduction in purified water use were notprovided in the case study, estimated savings from reduction in purified water consumption wereestimated from Table 6-5 of Reference 6 adjusting the water treatment costs to 1999 dollarsassuming 2.6% inflation. The results of Table III-16 are plotted in Figure III-1, which show that anyproject with annual controls and a capacity factor greater than 45% pays for itself.
Table III-16. Cost Effectiveness for 75 MW Turbine Retrofit with DLN from WaterInjection, Reduction from 42 ppm to 15 ppm
Capacity FactorTime Period ofControl 0.45 0.65 0.85 0.95
Seasonal $1,414 ($369) ($1,313) ($1,636)Annual $107 ($636) ($1,029) ($1,164)

III-19
Figure III-1: Cost Effectiveness ($/ton of NOx reduced) of Reducing NOx from a 75 MWTurbine by DLN Retrofit of Turbine Originally Equipped with Water Injection
The cost estimates for seasonal control shown in Table III-16 and Figure III-1 are based onthe assumption that the DLN conversion is added to achieve seasonal controlled levels that are lowerthan what can be achieved by water injection alone. It is also assumed that the baseline condition isthe use of water injection on a year-round basis. To compare a DLN retrofit to water injection onlyduring the ozone season, it would be appropriate to compare the results in Table III-16 to the resultsshown in the section below.
Diluent InjectionDLN retrofit described above offers lower NOx emissions than diluent injection while firing
natural gas, and offers several cost and operating advantages, generally making diluent injection aless preferred approach on turbines with higher capacity factors. However, as will be seen, for verylow capacity factors that may occur for peaking turbines, diluent injection may be more desirablethan DLN. This is because diluent injection has a lower capital cost and because the higheroperating cost of diluent injection has little effect on the overall economics due to the very limitedoperating hours (of the order of 200 to 400 hours a year). Another case where diluent injection may
($2,000)
($1,500)
($1,000)
($500)
$0
$500
$1,000
$1,500
$2,000
0.45 0.65 0.85 0.95
Capacity
Cost($/ton)
SeasonalAnnual
net
net cost
values less than zero represent netafter paying project

III-20
be the only option is any situation where a manufacturer does not offer DLN (for example whenturbines fire fuel oil).
The costs for diluent injection include significant operating costs but low capital costs.Operating costs include the costs of purified water or steam, as well as increased fuel costs due to thereduced efficiency that results from water injection. Water and steam injection both have an impacton heat rate (about 2-4% for water injection and about 1% for steam injection). This economicimpact is partly offset by an increase in available power output of roughly 3-5% (Ref 6, Table 5.10),but this additional power frequently is not useful due to the limitations of the generator orcompressor that is being driven by the turbine. For this reason, the cost analysis of diluent injectiondid not include a factor for the increase in turbine power. There may be situations, however, wherethis additional power may be useful and should be included in the analysis.
PSE&G of New Jersey is planning to retrofit 24 peaking turbines at their Edison, NJ facilitywith high-pressure water injection.13 Each turbine is about 21 MW in size and will reduce NOxfrom about 125 ppm to about 50 ppm while firing gas and from about 180 ppm to about 50 ppmwhen firing oil. The total capital cost is $9 million. Water usage is about 10 gallons per turbine perminute and costs about $0.025/gallon. These turbines only operate a few hundred hours per year(around 200 hours) for summer peak duty and spinning reserve.13
Using the cost estimates from PSE&G, an estimate of cost of control for various scenarioscan be performed. These estimates are consistent with the general assumptions used in this reportand do not reflect PSE&G's analysis, which was not provided for this report. Table III-17 showsestimates of cost effectiveness for diluent injection on turbines with regular use, as well as forpeaking duty situations of 200 hours and 400 hours. As shown in Table III-17a, the cost of NOxreduction for peaking duties is about $3,500 to nearly $7,000/ton of NOx removed when firing gas,and the incremental cost of electricity generation ranges from $6.00/MWhr to over $11.00/MWhr.Table III-17b shows the results of similar analysis when firing distillate oil. The incremental cost ofgeneration is high enough that, for many situations, an increase of this size to generation cost mayrender the unit uneconomical for operation. But because these peaking turbines are operated onlywhen the value of electricity is very high (on hot, summer days), the turbines continue to beeconomical to operate under these conditions. Recalling that the analysis does not give credit foradditional power and assumes that the efficiency penalty will be 4%, actual operating experiencemay show that the retrofit economics are more favorable than is shown. It should be noted that theanalyses of Table III-17a and b are also sensitive to fuel price.
Table III-17a: Estimated Cost Effectiveness for Diluent Injection on Twenty-Four21-MW Peaking Turbines. Reduction from 125 ppm to 50 ppm (gas firing)
Peaking Duty Hours Capacity FactorTime Period ofControl 200 400 0.45 0.65 0.85
Seasonal ($/ton) $6,828 $3,684 $1,217 $989 $867Seasonal ($/MWhr) $11.38 $6.14 $0.85 $0.69 $0.60Annual ($/ton) $784 $688 $638Annual ($/MWhr) $1.31 $1.15 $1.06

III-21
Table III-17b: Estimated Cost Effectiveness for Diluent Injection on Twenty-Four21-MW Peaking Turbines. Reduction from 180 ppm to 50 ppm (distillate oil firing)
Peaking Duty Hours Capacity FactorTime Period ofControl 200 400 0.45 0.65 0.85
Seasonal ($/ton) $4,212 $2,450 $1,031 $899 $829Seasonal ($/MWhr) $12.17 $7.08 $1.24 $1.08 $1.00
Annual ($/ton) $781 $726 $697Annual ($/MWhr) $2.26 $2.10 $2.01
In the analysis for the case where the turbine operates year-round at an average capacityfactor, it was assumed that the water injection occurs only when there is a need for control, i.e., onlyduring the summer for seasonal control and year-round for annual controls. It is important to notethat, while the cost per ton to reduce NOx is higher with seasonal controls, the impact on thegeneration cost is reduced. This is because much of the cost of using this technology is associatedwith increased heat rate and water usage during water injection.
Finally, comparing the results in Table III-17a to those in III-17b, it is observed that, whilethe cost per ton of NOx removed is higher with gas, the impact on generation cost is lower. This isbecause the baseline NOx when firing gas is lower than when firing oil; however, the cost ofdistillate oil is higher than gas, increasing the cost of the heat rate when firing oil.
D.2 Cost Effectiveness of Secondary Methods of Controlling NOx from Gas Turbines
Secondary control methods for exhaust treatment are generally used when primary controlmethods cannot provide sufficiently low NOx levels to meet regulatory emission limitations.Although secondary methods are more expensive to install and operate, they do provide substantiallyhigher level of NOx reductions compared to primary methods.
Figure III-2 shows the capital cost ($/KW) of various post-combustor technologies. Thecurves were generated by fitting a power equation of the form y=ax-b, where a and b are constantsthat are determined in the regression analysis. Reference 15 provided the retrofit cost of a high-temperature SCR system, while Reference 11 provided the incremental cost of the varioustechnologies for a new turbine installation. Additionally, although the cost effectiveness ofSCONOxTM is not addressed in detail in this chapter, it is included in the figure because the data wasincluded in Reference 11. Clearly, for all of these technologies there is a very strong scaling effect,especially for turbines well below the 50 MW size.

III-22
Figure III-2: Capital Cost of Gas Turbine Exhaust Treatment NOx Reduction Technologies(Refs. 9 and 14)
Retrofit of Simple Cycle Turbines with High-Temperature SCRRetrofit of a simple cycle turbine or placement of an SCR between the turbine and the Heat
Recovery Steam Generator (HRSG) on a combined cycle system requires the use of a high-temperature SCR catalyst, which is somewhat more expensive than normal systems (Figure III-2).One supplier mentioned that they typically offer fully-installed SCRs for simple-cycle systems,including the catalyst, reactor, ammonia storage, injection and controls, commissioning, etc., at aprice of about $50/KW to $70/KW.14 This is consistent with a rough cost estimate from anothersupplier that indicated a price for an 80 MW GE Frame 7 of about $4.1 million ($2.5 million inequipment and $1.6 million in installation for a capital cost of $51/KW), not including balance-of-plant items. Systems with more complex duct modifications will typically cost at the high end ofthis range. For smaller, industrial turbines, such as in Solar's 2-12 MW product line, the samesupplier indicated a cost of about $200,000 to $1.2 million, with installation ranging from $275,000-$800,000. For these smaller, simple-cycle turbines, the cost of high-temperature SCR is in the rangeof $167/KW to $337/KW.15 Clearly, there are significant economies of scale for this technology thatmake the cost in $/KW much lower for larger turbines.
The size of the needed catalyst needs to be estimated to do the cost analysis of the SCRsystem. Catalysts need to be replaced periodically, and although the catalyst replacement cost is nota large component of the overall expense, it is not insignificant. Therefore, it is necessary to have agood estimate of the catalyst size and its cost. Figure III-3 shows catalyst size plotted as a function
0
50
100
150
200
250
300
350
400
0 25 50 75 100 125 150 175MW
$/KW
Hi T SCR retrofitHi T SCRConv SCRLo T SCRSCONOxHi T SCRHi T SCR retrofitLo T SCRConv SCRSCONOx

III-23
of turbine size (in megawatts) for turbine SCR systems addressed in Reference 16. This plot includesthree different types of catalyst types (metal plate, ceramic honeycomb and metal honeycomb), aswell as different turbine suppliers, and some different conditions (with or without water injection,and some dual-fuel while others firing only gas), providing enough data for a good linear correlation.
The data in Figure III-3 has some limitations. First, Reference 16 is nearly ten years old andcatalyst technology has improved, reducing the necessary catalyst volume. Second, the SCRapplications considered in this report are capable of greater NOx reductions, require lower level ofammonia slip guarantees, and include high- and low-temperature catalysts. These factors combineto require slightly more catalyst volume. These factors indicate that an increase of the originalregression line by 20% is reasonable. While this adjustment is, at best, approximate, it should beadequate for the purposes of these estimates. As a comparison for this new relationship betweencatalyst size and plant size, Reference 11 uses an approximation of 30 ft3/MW for conventional, low-temperature and high-temperature catalysts, which would result in a slightly higher estimate ofcatalyst volume at the larger size ranges and a slightly lower estimate at the low ranges than usingFigure III-3. In this report, Figure III-3 will be used to estimate catalyst volume for all SCR types.
Figure III-3: Cubic Meters of SCR Catalyst for Turbine with HRSG (Ref. 16)
High-temperature SCR is economically attractive for simple cycle turbines because it is wellsuited for the high-temperature exhaust of a simple-cycle turbine. In many cases, a turbine equippedwith an HRSG would not be retrofitted with a high-temperature SCR because of lack of enoughspace between the turbine and the HRSG. Additionally, most HRSGs built in the last decade aredesigned to accommodate a conventional SCR catalyst, regardless of whether or not an SCR isinitially provided as part of the HRSG. For this reason, combined-cycle turbines are most oftenretrofitted with a conventional SCR. Therefore this analysis performs all estimates for high-temperature SCR on simple cycle retrofits.
y = 0.4871x + 11.916R2 = 0.7683
0
10
20
30
40
50
60
0 20 40 60 80 100MW
plus 20%
cubicmetersofcatalyst

III-24
Using the data for the catalyst size in Figure III-3, an assumption of $14,000/m3 of catalyst,and a six-year life (assuming that natural gas is fired nearly all the time), the cost effectiveness ofhigh-temperature SCR on simple cycle turbines was developed (Tables III-18 a through e). Theanalysis is assumed to apply to either a high-temperature catalyst or to a conventional SCR catalystwith some air-cooling.
Table III-18a: Cost Effectiveness for SCR Retrofit on Simple Cycle 75 MW GasTurbine with Baseline NOx of 154 ppm and Controlled to 15 ppm (90% Control)
Capacity FactorTime Period ofControl 0.45 0.65 0.85
Seasonal $1,853 $1,410 $1,176Annual $849 $664 $566
Table III-18b: Cost Effectiveness for SCR Retrofit on Simple Cycle 75 MW GasTurbine with Baseline NOx of 42 ppm and Controlled to 7 ppm (83% Control)
Capacity FactorTime Period ofControl 0.45 0.65 0.85
Seasonal $6,969 $5,210 $4,278Annual $2,980 $2,247 $1,859
Table III-18c: Cost Effectiveness for SCR Retrofit on Simple Cycle 75 MW GasTurbine with Baseline NOx of 15 ppm and Controlled to 3 ppm (80% Control)
Capacity FactorTime Period ofControl 0.45 0.65 0.85
Seasonal $20,075 $14,943 $12,227Annual $8,441 $6,303 $5,171
Table III-18d: Cost Effectiveness for SCR retrofit on Simple Cycle 7000 hp (~5MW) Gas Turbine with Baseline NOx of 142 ppm and Controlled to 15 ppm (89%
Control)
Capacity FactorTime Period ofControl 0.45 0.65 0.85
Seasonal $7,965 $5,872 $4,763Annual $3,395 $2,523 $2,061
Table III-18e: Cost Effectiveness for SCR retrofit on Simple Cycle 7000 hp (~5MW) Gas Turbine with Baseline NOx of 42 ppm and Controlled to 5 ppm (88%
Control)
Capacity FactorTime Period ofControl 0.45 0.65 0.85
Seasonal $27,020 $19,835 $16,031Annual $11,335 $8,341 $6,756

III-25
Retrofit of Combined-Cycle Turbines with Low-Temperature SCR or Conventional SCRCombined-cycle turbines equipped with an HRSG generally cannot be retrofitted with a
high-temperature SCR because there usually is not enough room between the turbine and the HRSGfor the catalyst. Moreover, most HRSGs built in the last decade are designed to accommodate aconventional SCR catalyst, regardless of whether or not an SCR was initially provided as part of theHRSG. For these reasons, combined-cycle gas turbines are rarely retrofitted with high-temperatureSCR.
If the HRSG design is such that it will readily accommodate a conventional SCR but couldpossibly accommodate a low-temperature SCR, the user will usually choose a conventional SCRbecause of its lower cost. However, if the HRSG does not have enough space to accommodate aconventional SCR, or there is inadequate distance for good mixing of the ammonia with the exhaustgas between the ammonia injection grid and the conventional catalyst, a-low temperature SCRsystem may be the better choice. Turbines that have duct burners and are required to attain highreductions by SCR are more likely to have inadequate mixing distance between the location for theammonia injection grid and the HRSG catalyst space. In these cases, low-temperature SCR may bean appropriate technology choice.
From Figure III-2, the capital cost of a high-temperature SCR retrofit on a simple cycleturbine is about the same as the incremental cost of low-temperature SCR on a gas turbine with anHRSG. The cost of retrofitting a combined-cycle turbine with a low-temperature SCR will then beroughly the same as the cost of retrofitting the same model turbine in a simple-cycle arrangementwith high-temperature SCR. The cost effectiveness values would be expected to be similar as well.Because a principal benefit of low-temperature SCR is the low cost to retrofit, it is assumed that theretrofit cost is roughly equal to the capital cost shown in Figure III-2 for the turbine sizes of interest.
Tables III-19a through III-19e indicate the cost effectiveness of applying conventional SCRon a combined-cycle gas turbine that can readily accommodate the system. As noted earlier in thissection, it is expected that the cost-effectiveness of low-temperature SCR on a combined-cycle gasturbine will be very similar to that of high-temperature SCR on similarly sized simple-cycle gasturbines.
Table III-19a: Cost Effectiveness for Conventional SCR on Combined Cycle 75MW Gas Turbine with Baseline NOx of 154 ppm and Controlled to 15 ppm
Capacity FactorTime Period ofControl 0.45 0.65 0.85
Seasonal $1,275 $1,010 $869Annual $608 $497 $439
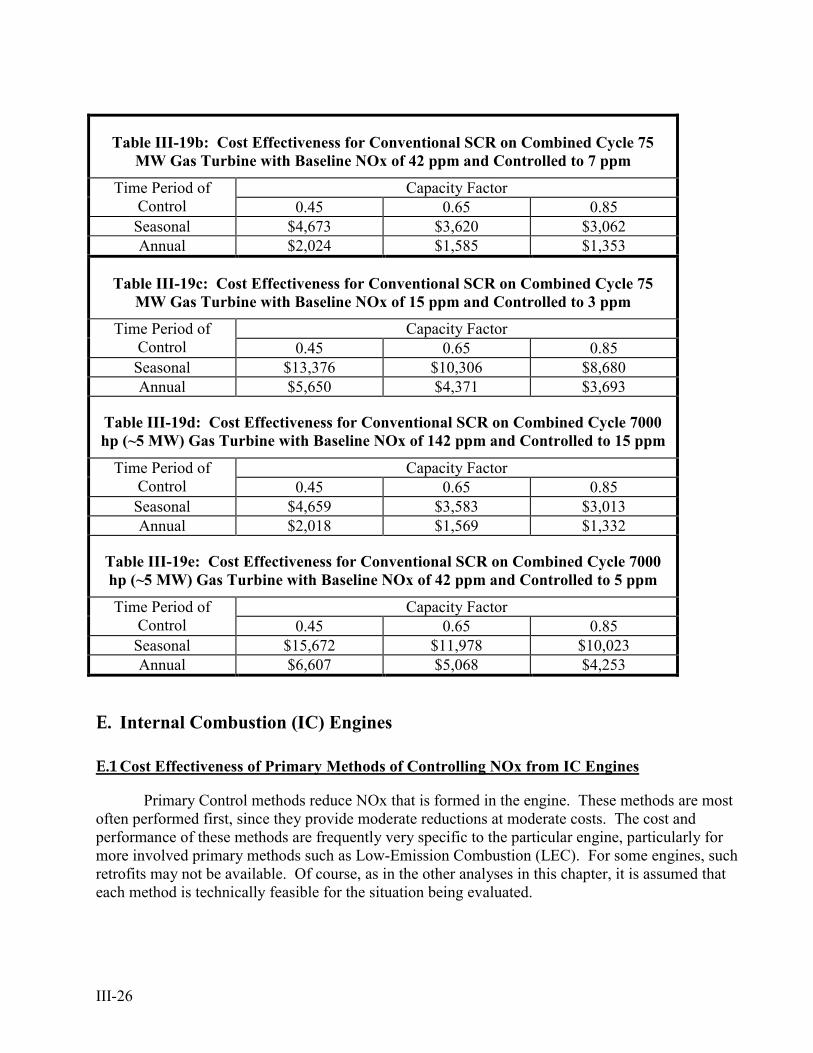
III-26
Table III-19b: Cost Effectiveness for Conventional SCR on Combined Cycle 75MW Gas Turbine with Baseline NOx of 42 ppm and Controlled to 7 ppm
Capacity FactorTime Period ofControl 0.45 0.65 0.85
Seasonal $4,673 $3,620 $3,062Annual $2,024 $1,585 $1,353
Table III-19c: Cost Effectiveness for Conventional SCR on Combined Cycle 75MW Gas Turbine with Baseline NOx of 15 ppm and Controlled to 3 ppm
Capacity FactorTime Period ofControl 0.45 0.65 0.85
Seasonal $13,376 $10,306 $8,680Annual $5,650 $4,371 $3,693
Table III-19d: Cost Effectiveness for Conventional SCR on Combined Cycle 7000hp (~5 MW) Gas Turbine with Baseline NOx of 142 ppm and Controlled to 15 ppm
Capacity FactorTime Period ofControl 0.45 0.65 0.85
Seasonal $4,659 $3,583 $3,013Annual $2,018 $1,569 $1,332
Table III-19e: Cost Effectiveness for Conventional SCR on Combined Cycle 7000hp (~5 MW) Gas Turbine with Baseline NOx of 42 ppm and Controlled to 5 ppm
Capacity FactorTime Period ofControl 0.45 0.65 0.85
Seasonal $15,672 $11,978 $10,023Annual $6,607 $5,068 $4,253
E. Internal Combustion (IC) Engines
E.1 Cost Effectiveness of Primary Methods of Controlling NOx from IC Engines
Primary Control methods reduce NOx that is formed in the engine. These methods are mostoften performed first, since they provide moderate reductions at moderate costs. The cost andperformance of these methods are frequently very specific to the particular engine, particularly formore involved primary methods such as Low-Emission Combustion (LEC). For some engines, suchretrofits may not be available. Of course, as in the other analyses in this chapter, it is assumed thateach method is technically feasible for the situation being evaluated.

III-27
Ignition Timing RetardThe data below is for Tennessee Gas Pipeline in Mercer, PA, which operates six 1100 hp
engines using ignition timing retard (Case Study IC-6). Reported costs for this project are shown inTable III-20.
Table III-20: Experience and Costs of Ignition Timing Retard (Case Study IC-6)
Months of Operation (as of Oct ’99) 54Increased Fuel Consumption Cost $5,000/year per engine
Project Cost $4,000 per engineEstimated Additional Maintenance $1,000/year per engine
Additional Cost of Testing $600/yr per engineBaseline NOx Emissions 10 gm/hp-hr
Controlled NOx Emissions 9 gm/hp-hrNumber of Forced Outages 0Total Lost Operating Hours 0
The approximate cost of NOx reduction is outlined in Table III-21. It is interesting to notethat the cost effectiveness for the 10% NOx reduction does not change very much as capacity factorchanges. This is because the largest cost item is increased fuel consumption. Although ignitiontiming retard will produce NOx reductions year round, the NOx reductions that occur outside of theozone season are not counted in the seasonal control scenario.
Table III-21: Estimated Cost Effectiveness ($/ton of NOx removed) for IgnitionTiming Retard on six 1,100 HP Engines from 10 gm/hp-hr to 9 gm/hp-hr (10%
Reduction)
Capacity FactorTime Period ofControl 0.45 0.65 0.85
Seasonal $1640 $1530 $1,476Annual $685 $640 $615
Ignition timing retard tends to be less effective at reducing NOx on spark-ignited enginesthan injection timing retard on compression-ignition engine (see below). However, both methodsprovide only small to moderate NOx reductions, making these methods of control of much lessinterest than other methods.
Injection Timing RetardInjection timing retard is a very cost effective way to achieve small to moderate NOx
reductions of 15% to about 30% on diesel engines. No case study data was available for the costs ofinjection timing retard, however, information from Reference 16 shows that costs for ignition andinjection timing retards are similar and so it will be assumed that the capital cost is about the same asshown in Table III-20. Estimates of cost effectiveness with a 25% NOx reduction are shown inTable III-22.

III-28
Table III-22: Estimated Cost Effectiveness ($/ton of NOx removed) for InjectionTiming Retard on six 1,100 HP Engines from 10 gm/hp-hr to 7.5 gm/hp-hr (25%
Reduction)
Capacity FactorTime Period ofControl 0.45 0.65 0.85
Seasonal $657 $612 $589Annual $274 $255 $245
Air/Fuel Ratio Changes and High-Energy IgnitionThis method has been used to reduce NOx on several large, two-stroke, reciprocating engines
of 2000 hp to 2700 hp with integral gas compressors (Case Studies IC-2, IC-3, IC-4). NOxreductions from baseline levels of 12 to 18 gm/hp-hr to controlled levels of about 5 to 8 gm/hp-hrwere achieved in the case study examples - typically a little over 50% NOx reduction. On average,these retrofits cost $22/hp (a range of $12/hp to $28/hp, primarily depending upon engine type).Fixed O&M was about $8,000 for each site, with three to six engines per site. The particular type ofengine being considered for air/fuel ratio changes will play a significant role in the cost andeffectiveness of employing this method of NOx reduction. To develop a "typical" analysis, it wasassumed that an installation of four 2,500-hp engines would achieve a reduction from 15 to 7 gm/hp-hr with a capital cost of $22/hp. The results of this analysis are shown in Table III-23.
Table III-23: Estimated Cost Effectiveness ($/ton of NOx removed) for High EnergyIgnition/A-F Ratio Adjustment on four 2,500 HP engines from 15 to 7 gm/hp-hr (53%
Reduction)
Capacity FactorTime Period ofControl 0.45 0.65 0.85Seasonal $385 $315 $280Annual $160 $130 $115
Low-Emission Combustion (LEC)A low-emission combustion retrofit is being employed on two 3400 hp engines at Tennessee
Natural Gas’ facility near Syracuse, NY (Case Study IC-7). The capital cost of retrofitting theseengines was about $340/hp, close to the value estimated from Reference 17. The cost effectivenessfor this project is shown in Table III-24.
For smaller, medium-speed engines, a lower capital cost would be expected, on the order of$200/hp.17 According to the California Air Resources Board BACT document on IC Enginecontrols (Ref. 18, Table D-1), Low-Emission Combustion offered up to a 90% reduction of NOx onnatural gas engines and about 60-70% control for landfill gas engines. This difference is probablydue to the lower initial NOx from the lower heating-value landfill gas. The cost estimates for areduction scenario assuming 80% reduction from 15 gm/hp-hr to 3 gm/hp-hr for a natural gasengine, an installation cost of $200/hp, and efficiency penalty of 0.5% for four 2500 hp engines, areshown in Table III-25.

III-29
Table III-24: Cost Effectiveness for two 3,400 HP IC Gas Engines (low speed)Equipped with Low-Emission Combustion Technology - 77% NOx reduction from
13 gm/hp-hr
Capacity FactorTime Period ofControl 0.45 0.65 0.85
Seasonal $2,296 $1,594 $1,222Annual $957 $664 $509
Table III-25: Cost Effectiveness for Four 2,500 HP IC Gas Engines (medium speed)Equipped with Low-Emission Combustion technology - 80% NOx Reduction from
15 gm/hp-hr
Capacity FactorTime Period ofControl 0.45 0.65 0.85
Seasonal $1,100 $765 $585Annual $460 $320 $245
Dual-fuel engines have much greater capital costs than engines firing a single fuel, which canbe approximated by
Capital Cost = $405,000 + ($450 x hp)
for engines larger than 1,000 hp.17 For a 2,500-hp engine, the capital costs are projected to be about$615/hp. Although NOx reductions occur year round, the seasonal control scenario only takes creditfor those NOx reductions made during the ozone season. In this case, the total costs are the sameregardless of the need for annual or seasonal control, resulting in the cost effectiveness numbersmuch greater for seasonal controls, even though the total cost and actual total NOx reduction are thesame.
As shown in Table III-26, NOx reductions through Low-Emission Combustion on a dual-fuelengines with high capacity factors can generally be achieved for under $1,000/ton for annualcontrols, and seasonal reductions can be achieved in the range of $2,000/ton.
Table III-26: Cost Effectiveness for Four 2,500 HP IC Dual-Fuel Engines Equippedwith Low-Emission Combustion Technology - 80% NOx Reduction from 15 gm/hp-hr
Capacity FactorTime Period ofControl 0.45 0.65 0.85
Seasonal $3,388 $2,346 $1,794Annual $1,412 $977 $747

III-30
E.2 Cost Effectiveness of Secondary Methods of Controlling NOx from IC Engines
Selective Catalytic Reduction (SCR)Selective Catalytic Reduction is used for diesel and lean-burn Spark Ignition (SI) engines.
Although two case studies were performed on IC engine SCR applications (case studies IC-1 and IC-5) only one provided information on the capital cost of the system (case study IC-5). It wastherefore necessary to rely on other references for additional capital cost values. SCR capital costsfor lean-burn engines can be approximated by
Total Capital Cost of Lean Burn IC SCR = $310,000 + ($72.7 x hp),
and the total capital cost of SCR for diesel and dual-fuel engines can be estimated by
Total Capital Cost of Diesel IC = $187,000 + ($98 x hp). 17
These equations include the cost of a continuous emission monitoring system (CEMS),estimated at $85,000.17 If a CEMS is not necessary, this cost should be deducted from estimatesobtained by the equations above.
Case Study IC-5 included information on capital and fixed operating costs, such as serviceand testing. The capital cost indicated in Case Study IC-5 was about 35% less than what issuggested by the equation above, even after deducting $85,000 for the CEMS. The large differencein cost is most probably due in large part to the fact that the SCR in Case Study IC-5 was a newinstallation rather than a retrofit, and may also indicate that SCR technology is becoming less costly.For the analysis in this report, the cost from the equation will be used in keeping with the focus onretrofits.
Case Study IC-1 showed a service cost of $78,000 per year for all three engines($26,000/engine) plus $9,600 per year for testing. In contrast, Case Study IC-5 showed fixed O&Mof only about $2,000/year. One reason for the difference is that the facility at PlymouthCogeneration (Case Study IC-5) has a CEMS, while the SYCOM system (Case Study IC-1) doesnot. The emissions testing costs in Case Study IC-5 are probably attributed to its CEMS. On theother hand, the value of the service contract for Case Study IC-1, at $78,000 for three engines, mayhave to do with the type of duty (pumping versus cogeneration), the specific engine, or the SCRsystem (larger engines may have higher lube oil leakage that might require more frequent catalystcleaning or an injection system requiring more frequent service). For this analysis, a middle valuebetween the reported values for the two case studies is assumed for fixed O&M:
$9,600 [for testing] + $14,000x(hp/9130) [for other fixed O&M].
As in most situations, the cost effectiveness of an SCR for IC engines depends to a largeextent on the initial NOx level and the capacity factor. In fact, it has been argued that, besides theexpense, there are technical reasons for not using SCR on engines with low capacity factors or thosewith highly variable loads, as addressed in Chapter II. Nevertheless, cost effectiveness values areshown for low capacity factor situations, recognizing that technical issues should be considered forany specific application.

III-31
The results of the analysis for SCR on IC engines are shown in Tables III-27a - d for gas anddiesel engines. For each fuel type, a single large facility of three 3130 hp engines is considered, aswell as a smaller installation of one 1800 hp engine. As shown in the tables, cost effectivenessnumbers under $1000/ton are possible for annual control under all situations when the capacityfactor is above 45%. Only under conditions where the engine capacity factor is 10% are costsgreater than $2,000/ton.
Table III-27a: Cost Effectiveness for Three 3130 HP Diesel Engines Equipped withSCR Technology - 90% NOx Reduction from 10 gm/hp-hr
Capacity FactorTime Period ofControl 0.10 0.45 0.65 0.85
Seasonal $4,246 $1,044 $763 $614Annual $1,838 $503 $386 $324
Table III-27b: Cost Effectiveness for Three 3130 HP Gas-Fired Engines Equippedwith SCR Technology - 90% NOx Reduction from 10 gm/hp-hr
Capacity FactorTime Period ofControl 0.10 0.45 0.65 0.85
Seasonal $3,884 $981 $726 $591Annual $1,691 $482 $375 $319
Table III-27c: Cost Effectiveness for One 1800 HP Diesel Engine Equipped withSCR Technology - 90% NOx Reduction from 10 gm/hp-hr
Capacity FactorTime Period ofControl 0.10 0.45 0.65 0.85
Seasonal $6,866 $1,626 $1,166 $922Annual $2,929 $746 $554 $453
Table III-27d: Cost Effectiveness for One 1800 HP Gas-Fired Engine Equippedwith SCR Technology - 90% NOx Reduction from 10 gm/hp-hr
Capacity FactorTime Period ofControl 0.10 0.45 0.65 0.85
Seasonal $8,245 $1,950 $1,397 $1,104Annual $3,508 $886 $655 $533
Capacity Factor of 0.10 equates to 876 annual operating hours or 365 hours during theozone season
As described in Section II.C.2 of this report, manufactures have developed simplified urea-SCR systems that are much less expensive to deploy on IC engines. This new technology stemsfrom efforts to apply SCR to mobile source diesel engine applications. The lower capital cost of thesimplified urea technology of Figure II-13 offers the potential for significantly reduced costs forcontrolling NOx from diesel and lean-burn gas IC engines, particularly at low capacity factors and
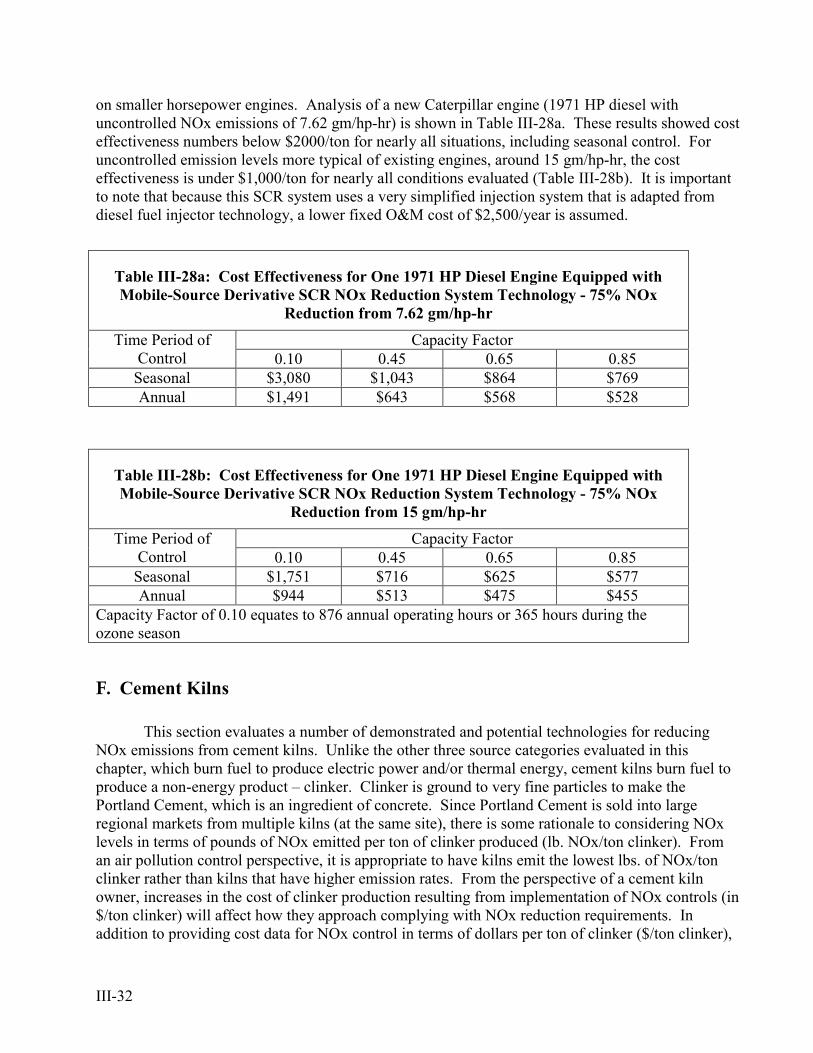
III-32
on smaller horsepower engines. Analysis of a new Caterpillar engine (1971 HP diesel withuncontrolled NOx emissions of 7.62 gm/hp-hr) is shown in Table III-28a. These results showed costeffectiveness numbers below $2000/ton for nearly all situations, including seasonal control. Foruncontrolled emission levels more typical of existing engines, around 15 gm/hp-hr, the costeffectiveness is under $1,000/ton for nearly all conditions evaluated (Table III-28b). It is importantto note that because this SCR system uses a very simplified injection system that is adapted fromdiesel fuel injector technology, a lower fixed O&M cost of $2,500/year is assumed.
Table III-28a: Cost Effectiveness for One 1971 HP Diesel Engine Equipped withMobile-Source Derivative SCR NOx Reduction System Technology - 75% NOx
Reduction from 7.62 gm/hp-hr
Capacity FactorTime Period ofControl 0.10 0.45 0.65 0.85
Seasonal $3,080 $1,043 $864 $769Annual $1,491 $643 $568 $528
Table III-28b: Cost Effectiveness for One 1971 HP Diesel Engine Equipped withMobile-Source Derivative SCR NOx Reduction System Technology - 75% NOx
Reduction from 15 gm/hp-hr
Capacity FactorTime Period ofControl 0.10 0.45 0.65 0.85
Seasonal $1,751 $716 $625 $577Annual $944 $513 $475 $455
Capacity Factor of 0.10 equates to 876 annual operating hours or 365 hours during theozone season
F. Cement Kilns
This section evaluates a number of demonstrated and potential technologies for reducingNOx emissions from cement kilns. Unlike the other three source categories evaluated in thischapter, which burn fuel to produce electric power and/or thermal energy, cement kilns burn fuel toproduce a non-energy product – clinker. Clinker is ground to very fine particles to make thePortland Cement, which is an ingredient of concrete. Since Portland Cement is sold into largeregional markets from multiple kilns (at the same site), there is some rationale to considering NOxlevels in terms of pounds of NOx emitted per ton of clinker produced (lb. NOx/ton clinker). Froman air pollution control perspective, it is appropriate to have kilns emit the lowest lbs. of NOx/tonclinker rather than kilns that have higher emission rates. From the perspective of a cement kilnowner, increases in the cost of clinker production resulting from implementation of NOx controls (in$/ton clinker) will affect how they approach complying with NOx reduction requirements. Inaddition to providing cost data for NOx control in terms of dollars per ton of clinker ($/ton clinker),

III-33
the analyses in this section also include the more traditional measure of cost effectiveness in dollarsper ton of NOx removed. This allows convenient comparison of costs of controlling NOx fromcement kilns to costs of NOx reductions from other source categories such as gas turbines, andindustrial and utility boilers.
F.1 Cost Effectiveness of Primary Methods of Controlling NOx from Cement Kilns
The primary methods available for controlling NOx depend on the type of kiln. A few kilntypes are considered. In many cases, combustion controls result in the improvement of thermalefficiency of kiln, which reduces NOx and reduces operating costs. As will be seen, in some casesthese combustion upgrades can actually pay for themselves.
Low-NOx Burners with Indirect Firing and Mid-Kiln Firing of TiresThis analysis uses information from Case Study CK-1 (California Portland Cement, Colton,
California). A total NOx reduction of 49% was achieved using both a Low-NOx Burner (withindirect firing) and mid-kiln firing with tires. The capital cost of this program was $7 million. Thefacility’s fixed and operating costs also increased as a result of this approach. It is assumed that thisapproach is used on a year-round basis, even for ozone-season control scenarios. For seasonalcontrol, only the NOx reduced during the ozone season is considered in the cost-effectivenesscalculation. This case study reported that facility production was reduced somewhat by the additionof tires. It is not known if this is a typical effect and because of the complexity it would add to theanalysis this was not considered here. Where appropriate, however, this effect should be considered.The analysis also does not include lost revenues due to a four-week outage. This is probably smallcompared to the overall cost of the program.
The cost effectiveness of this approach is obviously dependent upon the uncontrolledbaseline NOx level. If the uncontrolled NOx level is higher, the cost per ton of NOx reduced islikely to be lower than what is shown below. Another important factor in the NOx control costs isthe reduced fuel costs resulting from the substitution of tires for the primary fuel (coal). The heatingvalue of whole tires can vary from about 11,500 BTU/lb to nearly 17,000 BTU/lb,19 and steel-beltedtires, though they have low heating value, also contribute valuable minerals (especially iron) to thecement. The tipping fee being paid for whole tires, net of delivery charges, varies between locationsfrom $20/ton to about $200/ton.20 Assuming an average heating value of about 14,000 BTU/lb,tires can provide cement kiln operators with an estimated revenue source of about $0.71/MMBTU to$7.14/MMBTU of tire fuel used. This effect is incorporated into the cost effectiveness calculationsshown in Tables III-29 a through c.
Depending upon the tipping fees and operating conditions, the economic benefit of usingtires as fuel for mid-kiln firing may be sufficient to provide a net economic benefit after paying forthe cost of equipment (including the indirect firing and Low-NOx Burner equipment) plus the cost ofany additional operating expenses, though low tipping fees or low capacity factors may not providenet economic benefits. For this reason, the cement industry has implemented Low-NOx Burnerswith mid-kiln firing of tires at many facilities, solely for its economic benefits. The combinedtechnology of LNBs and mid-kiln firing, however, has the environmental benefit of moderatereductions in NOx emissions.

III-34
Table III-29a: Cost Effectiveness of Indirect Firing and Mid Kiln Tire Firing onLong-Dry Kiln - 49% Reduction from 5.0 lb/ton Clinker on Two 96 Ton/hr. Kilns
No Tipping Fee.xCapacity FactorTime Period of Control and Units
of Cost 0.45 0.65 0.85Seasonal, $/ton NOx $4,385 $2,673 $1,766Seasonal, $/ton clinker $2.42 $1.48 $0.97Annual, $/ton NOx $1,827 $1,114 $736Annual, $/ton clinker $2.42 $1.48 $0.97
Table III-29b: Cost Effectiveness of Indirect Firing and Mid Kiln Tire Firing onLong-Dry Kiln - 49% Reduction from 5.0 lb/ton Clinker on Two 96 Ton/hr. Kilns
$20/ton Tipping Fee.Capacity FactorTime Period of Control and Units
of Cost 0.45 0.65 0.85Seasonal, $/ton NOx $3,850 $2,137 $1,231Seasonal, $/ton clinker $2.13 $1.18 $0.68Annual, $/ton NOx $1,604 $891 $513Annual, $/ton clinker $2.13 $1.18 $0.68
Table III-29c: Cost Effectiveness of Indirect Firing and Mid Kiln Tire Firing onLong-Dry Kiln - 49% Reduction from 5.0 lb/ton Clinker on Two 96 Ton/hr. Kilns
$75/ton Tipping Fee.Capacity FactorTime Period of Control and Units
of Cost 0.45 0.65 0.85Seasonal, $/ton NOx $2,377 $665 ($242)Seasonal, $/ton clinker $1.31 $0.37 ($0.13)Annual, $/ton NOx $991 $277 ($101)Annual, $/ton clinker $1.31 $0.37 ($0.13)
The net economic benefit effect of tire tipping fees is more pronounced on kilns that only usemid-kiln firing and do not install capital-requiring Low-NOx Burner retrofits. NOx reductions fromthese kilns are quite marginal (about 20%), but the elimination of the LNB significantly reducescapital costs. The prices of mid-kiln firing systems vary by kiln. The cost of a mid-kiln firingsystem for a 25 or 40 tons per hour (tph) long dry or long wet kiln is $1,600,000, including a 20%charge for contingency.21 Reference 22 generally listed lower costs, from as little as $387,000 for asingle preheater kiln (electrical installation and controls programming not included) to $875,000 for
x Notes for Tables III-29 to III-30. Values in parentheses indicate a net economic benefit to the user.It is assumed that the technologies do not significantly impact production. This assumption may notbe correct in all cases and the impact on production should be considered when appropriate.

III-35
a complete system (all of project costs included), and as high as $1,872,500 for mid-kiln firing onthree long dry kilns (with all project costs included except controls programming). Reference 7 liststotal capital costs in the range of $391,000 to $707,000 for a mid-kiln firing conversion, generallymore consistent with the values of Reference 22 than Reference 21. Finally, case study CK-3 (BlueCircle Cement, Atlanta, Georgia) indicates a total capital cost of $1,495,000 for two 950 tons per day(tpd) or 40 tph kilns, with fixed O&M increasing by $64,000/yr and a decrease of variable O&Mcosts of over $900,000 through reduced fuel costs. For this analysis, economics similar to those ofcase study CK-3 are assumed.
It is important to note that this analysis assumes that mid-kiln tire injection will run year-round, even under circumstances where only seasonal controls are needed. This makes sensebecause the technology has economic benefits when in use and a user would not be motivated to turnit off outside of the ozone season. As in the previous analysis, impact on facility production was notconsidered. The results of the analysis are shown in Tables III-30a through c, showing that there arepotentially significant economic benefits of this technology, in addition to the small environmentalbenefit of lower NOx emissions. Because the economic benefits of the mid-kiln firing technologyare substantial, the cement industry has adopted it even in the absence of any explicit regulatoryrequirements.
CemStarSM
Case Study CK-2 (Texas Industries, Inc., Midlothian, Texas) reported that the capital cost forretrofitting CemStarSM on each of its four 40 ton/hr wet process kilns was $250,000. In addition tothis capital cost is an operating cost (a license fee) equal to about $16/ton of steel slag added to theprocess. At a plant of similar size to the Midlothian plant, a 3.3 tph slag addition would result inroughly an additional $53/hour for the operating cost of each kiln ($211/hr total for four kilns).Since the reduction in fuel cost expected from using CemStarSM is application-specific, it is notincluded in this cost analysis. Incremental clinker revenues are valued at an approximate level of$15 to $50 per ton of additional clinker produced.23 Net clinker value equals about $15-$50 per tonafter expenses (production cost, sales cost, transportation, etc.). These amounts will vary from onefacility to another and with market conditions.
Table III-30a: Cost Effectiveness of Mid Kiln Tire Firing on Long-Dry Kiln - 20%Reduction from 5.0 lb/ton Clinker on Two 40 Ton/hr Kilns
no tipping fee.x
Capacity FactorTime Period of Control and Unitsof Cost 0.45 0.65 0.85
Seasonal, $/ton NOx ($2,326) ($3,444) ($4,035)Seasonal, $/ton clinker ($0.48) ($0.72) ($0.84)Annual, $/ton NOx ($969) ($1,435) ($1,681)Annual, $/ton clinker ($0.48) ($0.72) ($0.84)

III-36
Table III-30b: Cost Effectiveness of Mid Kiln Tire Firing on Long-Dry Kiln - 20%Reduction from 5.0 lb/ton Clinker on Two 40 Ton/hr Kilns
$20/ton tipping fee.Capacity FactorTime Period of Control and Units
of Cost 0.45 0.65 0.85Seasonal, $/ton NOx ($5,164) ($6,281) ($6,873)Seasonal, $/ton clinker ($1.08) ($1.31) ($1.43)Annual, $/ton NOx ($2,151) ($2,617) ($2,864)Annual, $/ton clinker ($1.08) ($1.31) ($1.43)
Table III-30c: Cost Effectiveness of Mid Kiln Tire Firing on Long-Dry Kiln - 20%Reduction from 5.0 lb/ton Clinker on Two 40 TPH Kilns
$75/ton tipping fee.Capacity FactorTime Period of Control and Units
of Cost 0.45 0.65 0.85Seasonal, $/ton NOx ($12,966) ($14,084) ($14,675)Seasonal, $/ton clinker ($2.70) ($2.93) ($3.06)Annual, $/ton NOx ($5,403) ($5,868) ($6,115)Annual, $/ton clinker ($2.70) ($2.93) ($3.06)
Tables III-31 a, b, and c show the results of cost effectiveness calculations for four wet-process kilns equipped with CemStar for three different net clinker values (in dollars per ton). Threecontrol scenarios are considered for each case: 1) annual NOx control and annual operation (steelslag is added year-round to achieve year-round NOx reductions); 2) seasonal NOx control andannual operation (steel slag is added year round, but only ozone season NOx reduction counts); and3) seasonal NOx control and seasonal operation (steel slag is added only during the ozone season).
The calculations performed to produce the results in Table III-31a assume that theincremental clinker production is worth slightly less than the incremental license fee, evaluating thesituation where NOx reduction is the only reason to use the CemStar technology. This is an unusualcase since most facilities will benefit from increased production, even after the cost of the license fee($16/ton) is considered. Even in this case, cost of controlling NOx is well below $1000/ton. TablesIII-31 b and c show cases where the value of the incremental production exceeds the value of thelicense fee, as should be the case when this technology is applied. In these cases ($30/ton and$50/ton of net clinker, respectively), the CemStar technology produces net economic benefits inaddition to the NOx reductions provided. Over twenty kilns in the U.S. have used this technology.
Because of the economic benefits of this technology, the seasonal control and annualoperation scenario is more realistic than the seasonal control and seasonal operation scenario.
There is a significant cost trend indicated in the tables. The cost of using CemStar to reduceNOx ($/ton) decreases as usage increases, as would be expected. However, the decrease is slight,reflecting the relatively low capital cost and "pay as you go" nature of this technology. The resultsshown in Tables III-31b and III-31c show a net economic benefit in using the technology.

III-37
F.2 Cost Effectiveness of Secondary Methods of Controlling NOx from Cement Kilns
Selective Non-Catalytic Reduction (SNCR)There are currently no commercial applications of SNCR on cement kilns in the U.S.
However, some information from case studies and from estimates from vendors who have suppliedcommercial systems overseas provide data to estimate the cost of NOx reduction. In Reference 24,the capital cost of employing urea SNCR on a precalciner kiln is estimated to be $0.08/ton ofclinker, estimated on a 15-year life with the plant operating at 85% capacity. This equates to nearly$900,000 for a 100 tph kiln. This would scale to $1.35 million for a 150 tph kiln, but since scaling isprobably not linear with size, this is probably a conservative estimate. It is approximately consistentwith information in Reference 7 and information from a supplier described in Table III-32.25
Using the capital cost of about $1.35 million (including all associated project costs such asinstallation, site preparation, project management, etc.) for a 150 ton/hr kiln and a 45% NOxreduction from 700 lb/hr to 385 lb/hr, cost effectiveness was calculated (see Table III-33).
Costs in Table III-33 are shown in both $/ton of NOx reduced and $/ton of clinker produced.This is because the kiln operators are interested in the cost impact to the product. Moreover, the kilnoperators may choose to apply technology to those kilns where the impact to the cost of product isminimum. Alternatively, operators may choose to preferentially operate those kilns where theimpact of the cost of NOx control on the product cost is least.
Table III-31a: Cost Effectiveness of CemStar - 20% Reduction from 200 lbNOx/hr/kiln (800 pph total) on Four 40-Ton/hr Wet Process Kilns, Net Clinker Value
= $15/ton
Capacity FactorTime Period of Control and Operation0.45 0.65 0.85
Seasonal Control and Operation ($/ton NOx) $1,120 $822 $664Seasonal Control and Operation ($/ton clinker) $0.23 $0.17 $0.14Seasonal Control/Annual Operation ($/ton NOx) $1,332 $1,034 $877Seasonal Control/Annual Operation ($/ton clinker) $0.28 $0.22 $0.18Annual Control ($/ton NOx) $555 $431 $365Annual Control ($/ton clinker) $0.28 $0.22 $0.18
Table III-31b: Cost Effectiveness of CemStar - 20% Reduction from 200 lbNOx/hr/kiln (800 pph total) on Four 40-Ton/hr Wet Process Kilns, Net Clinker Value
= $30/ton
Capacity FactorTime Period of Control and Units of Cost0.45 0.65 0.85
Seasonal Control and Operation ($/ton NOx) ($1,156) ($1,454) ($1,611)Seasonal Control and Operation ($/ton clinker) ($0.24) ($0.30) ($0.34)Seasonal Control/Annual Operation ($/ton NOx) ($4,129) ($4,427) ($4,585)Seasonal Control/Annual Operation ($/ton clinker) ($0.86) ($0.92) ($0.96)Annual Control ($/ton NOx) ($1,721) ($1,845) ($1,910)Annual Control ($/ton clinker) ($0.86) ($0.92) ($0.96)
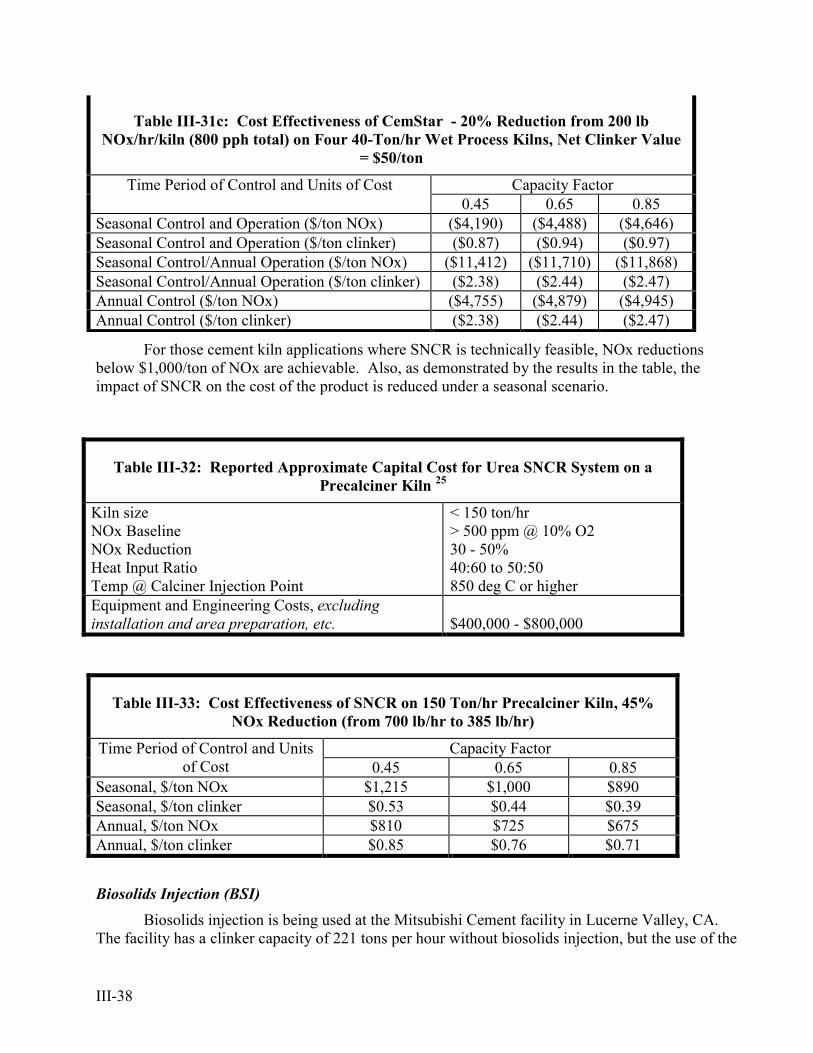
III-38
Table III-31c: Cost Effectiveness of CemStar - 20% Reduction from 200 lbNOx/hr/kiln (800 pph total) on Four 40-Ton/hr Wet Process Kilns, Net Clinker Value
= $50/ton
Capacity FactorTime Period of Control and Units of Cost0.45 0.65 0.85
Seasonal Control and Operation ($/ton NOx) ($4,190) ($4,488) ($4,646)Seasonal Control and Operation ($/ton clinker) ($0.87) ($0.94) ($0.97)Seasonal Control/Annual Operation ($/ton NOx) ($11,412) ($11,710) ($11,868)Seasonal Control/Annual Operation ($/ton clinker) ($2.38) ($2.44) ($2.47)Annual Control ($/ton NOx) ($4,755) ($4,879) ($4,945)Annual Control ($/ton clinker) ($2.38) ($2.44) ($2.47)
For those cement kiln applications where SNCR is technically feasible, NOx reductionsbelow $1,000/ton of NOx are achievable. Also, as demonstrated by the results in the table, theimpact of SNCR on the cost of the product is reduced under a seasonal scenario.
Table III-32: Reported Approximate Capital Cost for Urea SNCR System on aPrecalciner Kiln 25
Kiln sizeNOx BaselineNOx ReductionHeat Input RatioTemp @ Calciner Injection Point
< 150 ton/hr> 500 ppm @ 10% O230 - 50%40:60 to 50:50850 deg C or higher
Equipment and Engineering Costs, excludinginstallation and area preparation, etc. $400,000 - $800,000
Table III-33: Cost Effectiveness of SNCR on 150 Ton/hr Precalciner Kiln, 45%NOx Reduction (from 700 lb/hr to 385 lb/hr)
Capacity FactorTime Period of Control and Unitsof Cost 0.45 0.65 0.85
Seasonal, $/ton NOx $1,215 $1,000 $890Seasonal, $/ton clinker $0.53 $0.44 $0.39Annual, $/ton NOx $810 $725 $675Annual, $/ton clinker $0.85 $0.76 $0.71
Biosolids Injection (BSI)Biosolids injection is being used at the Mitsubishi Cement facility in Lucerne Valley, CA.
The facility has a clinker capacity of 221 tons per hour without biosolids injection, but the use of the

III-39
technology will typically reduce capacity slightly, due to the increased volume of gas from themoisture in the biosolids. At this facility, the capacity is reduced to 185 tph, a 16% reduction. Thecapital cost of the technology has been published at $371,000 for the Lucerne Valley facility,including all site work, equipment, etc. The operating costs for a facility similar to Mitsubishi’scover a wide range, from a cost of nearly $150,000 to a net revenue stream of $1,350,000 per year.This is explained by the potential for a tipping fee for receiving the biosolids, which can be worth upto about $1.5 million. Not included in these operating costs are the costs of increased fan power,incremental fuel cost, cost of lost revenue from reduced clinker production or additional license feesthat may be required. Despite reduced clinker production, fuel costs increase because of theadditional heat necessary to evaporate the moisture in the biosolids. Without including the value oflost clinker revenues, tipping fees for receiving biosolids, or license fees, Mitsubishi Cementestimated that the cost effectiveness of using biosolids injection in the range of $108/ton to$1,775/ton of NOx reduced for a plant operated at near 90% capacity and NOx reduction year-round.26
The economic viability of biosolids injection as a NOx reduction technique is driven largelyby the ability to negotiate a contract for receiving the biosolids while being paid a tipping fee. Itshould be noted that biosolids injection may not be applicable to many kilns. First, kilns must havethe proper temperature window for an SNCR reaction, limiting this technology to precalciner kilns.Second, the kiln must have sufficient available fan capacity to support biosolids injection withouttoo much of a decrease in clinker capacity. This is very limiting because most kilns operate nearmaximum capacity. Under just the right set of circumstances, biosolids injection can be aneconomically attractive approach for reducing NOx emissions. Because the economics andapplicability of this process are so strongly dependent on several variables that could vary widely,additional modeling for cost effectiveness was not performed.
G. Summary
This chapter evaluated a number of technologies for their cost effectiveness that have beencommercially applied to reduce NOx emissions under scenarios that are expected to be of interest toexisting sources. The costs of these technologies were determined from publicly available data,information provided by technology suppliers, and from information provided by the technologyusers. An extremely important part of this report is the final chapter (Chapter IV), in which thedetailed information related to cost and operating experience from actual technology users isprovided in the form of case studies. Incorporating the user-provided operating and cost data fromthese case studies into the cost analysis just presented provides robust and reliable estimates of costeffectiveness that are strongly anchored in reality.

III-40
H. References 1 NESCAUM-MARAMA, Status Report on NOx: Control Technologies and Cost Effectiveness forUtility Boilers, June 1998.2 Reilly and Brown, Investment Analysis and Portfolio Management, The Dryden Press, 1997: pp16-18.3 The Wall Street Journal, 23 June 1999.4 Brigham and Houston, Fundamentals of Financial Management, 8th ed., The Dryden Press, 1998.5 U.S. Environmental Protection Agency. “Alternative Control Techniques Document – NOxEmissions from Industrial/Commercial/Institutional (ICI) Boilers.” EPA-453/R-94-022, March1994.6 U.S. Environmental Protection Agency. “Alternative Control Techniques Document – NOxEmissions from Stationary Gas Turbines,” EPA-453/R-93-007, January 1993.7 U.S. Environmental Protection Agency. “Alternative Control Techniques Document – NOxEmissions from Cement Manufacturing.” EPA-453/R-94-004, March 1994.8 Mike Knenlein of Fuel Tech. Letter to the author. August 25, 1999.9 Doug Henneghan of Norton Catalytic Products. Personal Communication. 18 September 1999.10Sommerlad, R.E. and Pratapas, J.M. “Fas-Based Technologies – An Update on Development andCommercialization.” Ninth Annual NOx Control Conference, Council of Industrial Boiler Owners.Hartford, CT: March 11-12, 1996.11 Onsite Sycom Energy Corporation. "Cost Analysis of NOx Control Alternatives for StationaryGas Turbines." Performed for U.S. Department of Energy, Contract No. DE-FC02-97CHIO877.October 15, 1999.12 Leslie Witherspoon of Solar Turbines. Letter to the author. August 26, 1999.13 Alex Huhmann of PSE&G. Personal communication. December 6, 1999.14 Ken Burns of Engelhard. Personal communication. September 3, 1999.15 Mike Gregory of Peerless Manufacturing Company. Letter to the author. November 16, 1999.16 Electric Power Research Institute. “Gas Turbine Selective Catalytic Reduction ProcurementGuidelines.” EPRI GS-7254, Project 2936-1 May, 1991.17 U.S. Environmental Protection Agency. “Alternative Control Techniques Document – NOxEmissions from Stationary Reciprocating Internal Combustion Engines.” EPA-453/R-93-032, July,1993.18 State of California Air Resources Board. “CAPCOA/ARB Proposed Determination ofReasonably Available Control Technology and Best Available Retrofit Control Technology forStationary Internal Combustion Engines (DRAFT).” December 3, 1997.19 Schrama, H., Blumenthal, M., and Watherhead, E. C. "A Survey of Tire Burning Technology forthe Cement Industry." IEEE Cement Industry Technical Conference. San Juan, Puerto Rico: June4-9, 1995.

III-41
20 Waste News Online. Prices for recycled goods for the week ending October 15, 1999.21 Portland Cement Association. “Report on NOx Formation and Variability in Portland CementKiln Systems – Potential Control Techniques and Their Feasibility and Cost Effectiveness.” PCAR&D Serial No. 2227, 1999.22 Gregory Schwall of TMI Systems. Letter to Ann Dougherty of Portland Cement Association.October 30, 1998.23 Greg Mayes of Texas Industries. Letter to the author. January 17, 2000.24 Steuch, H.E., Hille, J., Sun, W.H., Bisnett, M.J., and Kirk, D.W. “Reduction of NOx Emissionsfrom a Dry Process Preheater Kiln with Calciner Through the Use of the NOxOUT Process.” FallMeeting of the General Technical Committee of the Portland Cement Association. Seattle, WA:September 18-24, 1994.25 Michael J Knenlein of Fuel Tech, Inc. Letter to the author. August 9, 1999.26 Biggs, H.O. “BioSolids Injection Technology: An Innovation in Cement Kiln NOx Control.”Thirty-first International Cement Seminar. TP881.I5, 1995.

III-42

IV-1
IV. Case Studies
A. Introduction
The purpose of the case studies is to provide information from the actual technology users ontheir experience (both operating and cost) with the control technologies addressed in the report. Theinformation was gathered and the case studies were prepared in a manner designed to ensure that theend-user’s perspective was maintained.
The case studies were performed in cooperation with the facility owners. In each case thefacility owners filled out a questionnaire that was designed for their particular facility type. With theinformation gathered from the owners, a case study was prepared and then sent to the facility ownersfor review and comment. After the facility owners had reviewed the case study and revisions weremade in accordance with their comments, the facility owners reviewed the revised case study for thefinal approval. After these steps the final version of the case study was included in this report.Every case study presented in this report went through this procedure.
A note on Cost Effectiveness - During this study it became apparent that only a fewof the owners of these facilities had performed calculations to estimate costeffectiveness, measured in terms of dollars per ton of NOx removed ($/ton). Thismay change in the future if market-based approaches, such as “cap and trade”approach, are introduced to meet regulatory requirements for these non-utilitysources. Under such an approach, facilities will have an incentive to estimateaccurately the cost effectiveness of strategies and technologies under consideration,since they will be able to trade (buy and sell) emission allowances with other sourceswith different incremental costs for control.
In the gas turbine and IC engine case studies from gas transmission companies (DukeEnergy and Tennessee Natural Gas), cost effectiveness calculations were provided bythem using a format that the gas transmission industry has devised.
Although cost effectiveness (in $/ton of NOx removed) was estimated by only a fewusers, all case study participants did provide extremely useful information on capitalcost and operating cost- the key pieces of information necessary to estimate costeffectiveness. This information, which for many of these source categories has notbeen publicly available directly from users until this report, is extremely important formaking an accurate assessment of technology costs. These key pieces of informationwere used where appropriate in Chapter III to provide robust and reliable costeffectiveness estimates that are “anchored in reality.”
An effort was made to have a consistent format among case studies in this chapter. However,because each case study represents a unique situation prepared with the user's assistance, formats forcase studies vary somewhat to accommodate the type and amount of information provided by thecase study participants.

IV-2
B. Industrial Boiler Case Studies
B.1 Case Study BLR-1, Minergy Corp, Neenah, WisconsinOperator Contact - Tom Baudhuin
Background and Technology SelectionMinergy Corporation operates a facility in Neenah, WI. In 1997 Minergy added a boiler for
generation of steam for facility use.
General Statistics on Minergy BoilerMMBTU/hr 350
Boiler age (yrs) 1.5Boiler type CycloneAir heater Tubular
Fuel(s) Natural Gas and 4000 BTU/lb Paper SludgeBaseline (uncontrolled) NOx 0.65 lb/MMBTU
Controlled NOx 0.30 lb/MMBTU
As a new source, the facility was subject to New Source Review Regulations and wasrequired to install Best Available Control Technology (BACT). For this type of facility BACT wasdetermined to require addition of Selective Non-Catalytic Reduction (SNCR) technology for controlof NOx emissions. Minergy selected urea-based SNCR, or NOxOUT®.
Project ExecutionThe SNCR system was installed as part of a larger project. Therefore, it is not possible to
determine the schedule for the SNCR system alone.
ExperienceThe operating experience from commissioning through to June 1999 is outlined on the table
that follows. Notably, the system met its guaranteed NOx reduction levels and ammonia slip levels.Despite reported ammonia slip of 25 ppm, ammonium bisulfate salt deposition on the air heater hasnot been a problem. There has not been any noticeable ammonia odor in the fly ash or any disposalproblems for ash due to ammonia. The system has been reliable in reducing NOx emissions. Ontwo occasions the boiler required shutdown for repair of tube leaks believed to be due toimpingement of urea droplets. Minergy is reviewing this matter with the technology supplier alongwith their practices for operating and maintaining the urea injectors.
Since the SNCR system was supplied with the boiler, it is uncertain what impact the SNCRsystem has on boiler efficiency or parasitic loads.

IV-3
Experience and PerformanceMonths in operation (June ’99) 18
# Forced outage incidents 2Lost boiler-operating hrs. 200Increased parasitic loads Unknown
Change in boiler efficiency UnknownReagent Consumption 30 gph
Reagent Consumption guarantee met? YesNH3 slip guarantee, ppm 50
NH3 slip actual, ppm 25Air heater washing/deposition? No
Visible Plume/year No
Cost EffectivenessMinergy was unable to provide detailed information regarding the cost of controlling NOx
emissions with SNCR at this facility. The approximate cost of the process equipment and associatedengineering and startup services was between $500,000 and $750,000. The cost of installation wasnot separated out since the SNCR system was provided as part of a larger program.
B.2 Case Study BLR-2, International Paper, Jay, Maine
Operator Contact - Peter Lee
Background and Technology SelectionInternational Paper operates a paper mill in Jay, Maine. At the facility there are two wall-
fired boilers that fire No. 6 fuel oil and generate 450 million pounds per hour (pph) of steam. Theboilers operate from 25% to 100% of full steam production rates.
General Statistics on International Paper BoilersMMBTU/hr 680 each (x 2)
Steam Generation (million pph) 450 each (x 2)Operating range 25%-100% of full steaming rateBoiler age (yrs) 34
Boiler type WallYear that NOx reduction system
was placed in service1995
Fuel(s) No. 6 Fuel OilFuel Nitrogen Content 0.461%
Baseline (uncontrolled) NOx 0.427 lb/MMBTU

IV-4
In 1995, the facility implemented Low NOx Burner modifications in order to reduce NOxemissions to meet Maine's NOx RACT requirements. The modifications entailed upgrading ofexisting burner hardware such as swirlers, nozzles, etc., and optimization of the operation of thatequipment.
Project ExecutionThe burner modifications were made with minimal impact to boiler operation.
ExperienceThe operating experience from commissioning through to September 1999 is outlined on the
table that follows. Notably, the program met its guaranteed NOx reduction level of 0.40lb/MMBTU, and actual NOx emissions are about 0.38 lb/MMBTU. There have not been anyincreases on opacity or particle matter or CO emissions. The burner modifications have not had anyadverse impact on boiler performance or reliability.
Experience and PerformanceMonths in operation (Sept ’99) 48
# Forced outage incidents 0Lost boiler-operating hrs. 0Increased parasitic loads None
Change in boiler efficiency NoneAdverse changes to CO, PM emissions or opacity? None
Changes in boiler reliability? NoneNOx Guarantee 0.40 lb/MMBTU
NOx guarantee met? YesActual NOx 0.38 lb/MMBTU
Cost EffectivenessInternational Paper performed this program for a total installed cost of about $30,000. They
have not performed a detailed cost estimate of the project.
B.3 Case Study BLR-3, Chevron Process Heater Equipped with SCR, El Segundo, California
Operator Contact - Jim Seebold (510) 242-3313
Background and Technology SelectionChevron operates a refinery in El Segundo, CA. The facility, which is close to Los Angeles,
is subject to the strict air pollution control requirements of the South Coast Air Quality ManagementDistrict and the California Air Resources Board. In 1991, Chevron was required to reduce NOxemissions from it’s fired heaters, including two furnaces that are floor fired and burn refinery fuelgas. The furnaces were originally equipped with combustion NOx controls that maintained NOx atabout 40-50 ppm. The combined rated capacity of the two furnaces is 68 MMBTU/hr.

IV-5
They selected SCR with a low-temperature catalyst due to the lower cost of this technicalapproach. Aqueous ammonia is used as the reagent for the SCR, and the catalyst is a low-temperature catalyst that is capable of operation at temperatures of 325 F to 650 F. In this case, theoperating temperature is about 420 F. The use of a low-temperature catalyst enabled use of SCRwith fewer plant modifications and less impact on heater operation than if a conventional SCRcatalyst were used. An SCR using conventional SCR catalyst would have entailed a capital cost ofroughly 50% more due to the modifications that would have been necessary to fit the catalyst.
General Statistics on Chevron Process HeatersMMBTU/hr 34 x 2 (68 total)Heater Type Floor Fired
Year that NOx reductionsystem was placed in service
1991
Fuel(s) Refinery Fuel GasBaseline (uncontrolled) NOx 40-50 ppm
Controlled NOx <9 ppm
Project ExecutionTotal system capital cost was $1.5 million. The project schedule was as follows:
Project Schedule and CostPreparation of Bid Package 4 weeksEvaluation of Proposals 4 weeksAward of Contract (AOC) to completion ofengineering
8-10 weeks
AOC to delivery of equipment 40-45 weeksAOC to completion of installation 50 weeksAOC to completion of system commissioning 52 weeksProject Cost $1.5 million
ExperienceThe operating experience from commissioning through to September 1999 is outlined on the
table that follows. The program met its guaranteed NOx reduction level of 9 ppm, or about 0.01lb/MMBTU with ammonia slip at undetectable levels. In the eight years of operation of the system,the permitted NOx emissions level has been exceeded four times. The $35,000 value for levelizedcatalyst cost includes a provision for disposal of the used catalyst as well as the cost of replacementcatalyst. The total variable O&M, which includes the catalyst, ammonia and other minor costs, is$41,000.
For most boiler applications NO2 comprises only a small portion of the total NOx. It isnotable that due to the high excess air levels and, consequently, the high NO2 content of the gasstream from this heater, the molar ratio of ammonia to NOx reduced is greater than the expected 1:1that is common for most boilers. It actually approaches 2:1.

IV-6
Experience and PerformanceTime in operation (Sept ’99) 8 years
# Forced outage incidents 1Lost heater-operating hrs. 0
# NOx exceedances 4Increased parasitic loads 75 KW
Change in heater efficiency NoneAdverse changes to CO, PM emissions or opacity? None
Changes in boiler reliability? NoneNOx Guarantee 9 ppm
NOx guarantee met? YesActual Controlled NOx < 9 ppm, or
< 0.01 lb/MMBTUAmmonia slip guarantee <20 ppm
Measured slip None detectedCatalyst lifetime guarantee 3 yrs
Catalyst volume 5.1 m3Levelized catalyst replacement cost $35,000
Total variable O&M charges for year (includeslevelized catalyst, ammonia, etc.)
$41,000
Additional man-hours per week 4
Cost EffectivenessA detailed, cost effectiveness analysis to determine the $/ton of NOx reduced was not
provided. However, using the data above with some assumptions, a determination of costeffectiveness could be made.
B.4 Case Study BLR-4, Sauder Woodworking, Archbold, Ohio
Operator Contact - Thomas Brodbeck (419) 446-3547
Background and Technology SelectionSauder Woodworking operates a wall-fired, 57 MMBTU/hr boiler that fires wood waste.
The facility was installed new in 1994 and was therefore subject to New Source Review (NSR)regulations, which imposes strict controls on new sources of NOx. Sauder was, therefore, requiredto control NOx to 0.20 lb/MMBTU and install Selective Catalytic Reduction technology.
The uncontrolled baseline NOx level into the SCR was not provided. The controlled NOx,however, is 0.20 lb/MMBTU.

IV-7
General Statistics on Sauder BoilerMMBTU/hr 57Boiler Type Wall Fired
Age of Boiler 5 years (since 1994)Year that NOx reduction
system was placed in service1994
Fuel(s) WoodBaseline (uncontrolled) NOx Not Available
Controlled NOx 0.20 lb/MMBTU
Project ExecutionThe SCR system was provided as a part of a new boiler facility. Therefore, it was a part of a
much larger project. The cost of the SCR catalyst, reactor, controls, ammonia injection grid, andassociated engineering to the boiler supplier is reported by the catalyst supplier (Norton) to be$450,000. However, additional costs were incurred in installing the equipment and supply of theammonia storage tank. So the total cost associated with SCR was greater than $450,000.
ExperienceThe 72 months of operating experience from commissioning through to September 1999
have demonstrated that the equipment has met its NOx reduction objective of 0.20 lb/MMBTU.This experience is summarized in the table that follows. The catalyst appears to be performing asexpected. The system has never caused the facility to lose operating hours. The SCR exit NOxanalyzer sampling system has required some periodic attention (four times in the six years).Deposits sometimes form on the sample line, causing erroneous indications.
Cost EffectivenessA detailed, cost effectiveness analysis to determine the $/ton of NOx reduced was not
performed by Sauder Woodworking.

IV-8
Experience and PerformanceMonths in Operation (as of Sept ’99) 72 months
# Forced outage incidents 0Lost operating hrs. 0# NOx exceedances 0
Increased parasitic loads Neg.Change in efficiency None
Adverse changes to CO, PM emissions or opacity? NoneChanges in boiler reliability? None
NOx Guarantee 0.20 lb/MMBTUNOx guarantee met? Yes
Actual Controlled NOx <0.20 lb/MMBTUAmmonia slip guarantee <20 ppm
Measured slip None detectedCatalyst lifetime guarantee 2 yrs
Catalyst performing as expected YesLevelized catalyst replacement Cost $25,000
Additional Man Hours per week 5
B.5 Case Study BLR-5, Michigan State University, TB Simon Power Plant, Unit #4, EastLansing, Michigan
Operator Contact - Bob Ellerhorst
Background and Technology SelectionThe Michigan State University in East Lansing, MI, operates a power plant providing energy to thecampus. In 1991 it added a new circulating fluidized bed (CFB) boiler that fires coal. The boiler,rated at 380 MMBTU/hr, was required under Michigan New Source Review regulations to install aSelective Non-Catalytic NOx Reduction system using aqueous urea solution as the reagent. Thebaseline uncontrolled level of NOx was not provided.
General Statistics on Michigan State BoilerMMBTU/hr 380
Boiler age (yrs) 8Boiler type Circulating Fluidized BedAir heater Tubular
Fuel(s) CoalBaseline (uncontrolled) NOx Not AvailableMaximum Controlled NOx 0.16 lb/MMBTU
Project ExecutionThe SNCR system was installed as a part of a much larger project to install the boiler.

IV-9
ExperienceThe operating experience from commissioning through to September 1999 is outlined in the
table that follows. Notably, the system met its guaranteed NOx reduction levels and ammonia sliplevels. Ammonium bisulfate salt deposition on the air heater has not been a problem. There has notbeen any noticeable ammonia odor in the fly ash or any disposal problems for ash due to ammonia.The system has met the guarantee level and there have been no occasions when the urea SNCRsystem has failed to provide the expected performance.
Although the system has been relatively reliable, causing no forced outages or lost operatinghours, there have been occasional mechanical problems in the form of injector plugging, meteringpump failures, flow meter fouling, and stainless steel pipe leeks. Therefore, periodic maintenanceand repair have been needed. There is sufficient redundancy in the system that mechanical failureshave never taken the system out of service.
Since the SNCR system was supplied with the boiler, it is uncertain what impact the SNCRsystem has on boiler efficiency or parasitic loads.
Experience and PerformanceMonths in operation (Sept. ’99) 84
Guaranteed NOx 0.16 lb/MMBTUControlled NOx 0.14 lb/MMBTU
# NOx exceedances attributable to SNCR system failure 0# Forced outage incidents attributable to SNCR system 0Lost boiler-operating hrs. attributable to SNCR system 0
Increased parasitic loads NegligibleChange in boiler efficiency NegligibleNH3 slip guarantee, ppm < 18
NH3 slip actual, ppm 0.75Air heater washing/deposition? No
Visible Plume/year NoExtra Man-Hours/week for O&M 2
Cost EffectivenessMichigan State’s TB Simon Power Plant was unable to provide detailed information
regarding the cost of controlling NOx with SNCR at this facility. The boiler and SNCR systemwere purchased together. Information identifying the specific cost of the SNCR system versus theboiler is not, therefore, available.

IV-10
B.6 Case Study BLR-6, Temple Inland Corp. Shippenville, Pennsylvania
Operator Contact - Ted Peters, Temple Inland Corp., (814) 226-8961
Background and Technology SelectionTemple Inland Corporation manufactures medium density fiberboard (MDF) and other wood
products. In 1996 they added a 155 MMBTU/hr bubbling bed boiler to provide process heat for thefacility. The new boiler is fired with MDF waste and hog fuel (wood waste). Temple Inland isrequired to control NOx emissions on the boiler to below 0.17 lb/MMBTU. Since the boiler has abaseline emission of 0.40 lb/MMBTU without secondary controls, additional controls were needed.SNCR was chosen as the preferred technical approach and urea was selected as the reagent becauseurea is used on site for other purposes.
General Statistics on Temple InlandMMBTU/hr 155
Boiler age (yrs) 3.5Year that NOx reduction system was placed in service 1997
Boiler type Bubbling BedFuel(s) MDF Waste
Baseline (uncontrolled) NOx 0.40 lb/MMBTUControlled NOx Under 0.17 lb/MMBTU
Project ExecutionThe SNCR system was installed as part of a much larger project to install the boiler. So, it is
not possible to determine precisely the schedule for the SNCR system. However, the followingschedule was provided as being approximately the schedule for SNCR. Of course, the entire projectschedule was longer since much more equipment was provided.
The total project took 32 weeks after award of contract. Total contract cost was $225,000 forthe process equipment, license, controls, etc. Project management, purchasing and other indirectcosts were about $8,500, and commissioning and testing costs were $6,500.
Project Schedule (Approximate, SNCR only)Task Time, weeks
Preparation of Bid Package 3Evaluation of Proposals 2Award of Contract (AOC) to completion ofengineering
10
AOC to arrival of equipment on site 26AOC to completion of installation 30AOC to completion of system commissioning 32

IV-11
Project CostsCost for equipment and engineering $225,000Commissioning and testing $6,500Other indirect costs $8,500Total $240,000
ExperienceThe operating experience from commissioning through to October 1999 is outlined in the
table that follows. Notably, the system met its guaranteed NOx reduction levels and ammonia sliplevels. Experience with the reliability of the system has been mixed. Although the pumping andcontrol systems have been highly reliable, the reagent distribution and injection system was initiallyprone to plugging throughout. The system, therefore, required continual attention to keep itoperating. The plugging is believed by Temple Inland to be associated with a chemical reactionbetween the urea and impurities in the reagent and/or dilution water. For reasons of cost control andavailability, Temple Inland does not use the technology supplier’s licensed reagent, but a locally-available urea product that is also used on site for other purposes. Temple Inland modified theSNCR system to mitigate the plugging problem, and the modifications were successful at mitigatingthe plugging to a more manageable level. Labor necessary to service the system is now less than theinitial experience.
Experience and PerformanceMonths in operation (Oct ’99) 41
Guaranteed NOx 0.17 lb/MMBTUActual controlled NOx 0.13 lb/MMBTU
Lost boiler-operating hrs. attributable to SNCR system NoneNH3 slip guarantee, ppm < 15
NH3 slip actual, ppm 5Aqueous Urea Solution Use (30% by wt.) 160 pph
Extra Man-Hours/week for O&M 4-40
Cost EffectivenessTemple Inland has not performed a detailed analysis of cost effectiveness in terms of dollars
per ton of NOx removed.

IV-12
B.7 Case Study BLR-7, Fort James Corporation, Green Bay, Wisconsin
Environmental Contact - Timothy Mattson, Fort James Corp., (920) 438-2191
Engineering Contact- Kim Dohm, Fort James Corporation, (920) 438-2644
Background and Technology SelectionThe Fort James Corporation commissioned a new refractory-lined Bubbling Bed combustor
with a waste heat boiler at the end of 1998. The boiler fires paper sludge at a rate of about 250 drytons per day. Fort James was required to install an SNCR system to reduce NOx to below 100 ppm,or 50% removal, whichever is less stringent. SNCR using aqueous ammonia reagent (19% by wt.)was selected.
General Statistics on Fort James BoilerMax. Steam Load 57,000 #/hr @ 180 psig
Boiler age (yrs) 1Combustor type Bubbling Bed
Fuel(s) Paper Sludge and natural gasBaseline (uncontrolled) NOx Approx. 250 ppm
Max. controlled NOx Approx. 75 ppm
Project ExecutionThe SNCR system was installed as a part of a much larger project to install the boiler. So, it
is not possible to determine precisely the schedule for the SNCR system. However, the followingschedule was provided by the vendor as being approximately the schedule for a stand-alone SNCRsystem. Of course, the entire project schedule was longer since much more equipment was provided.
Project Schedule (Approximate, SNCR only)Task Time, weeks
Preparation of Bid Package 2Award of Contract (AOC) to completion of engineering 6-8AOC to arrival of equipment on site 14-20AOC to completion of installation 18-24AOC to completion of system commissioning 20-26
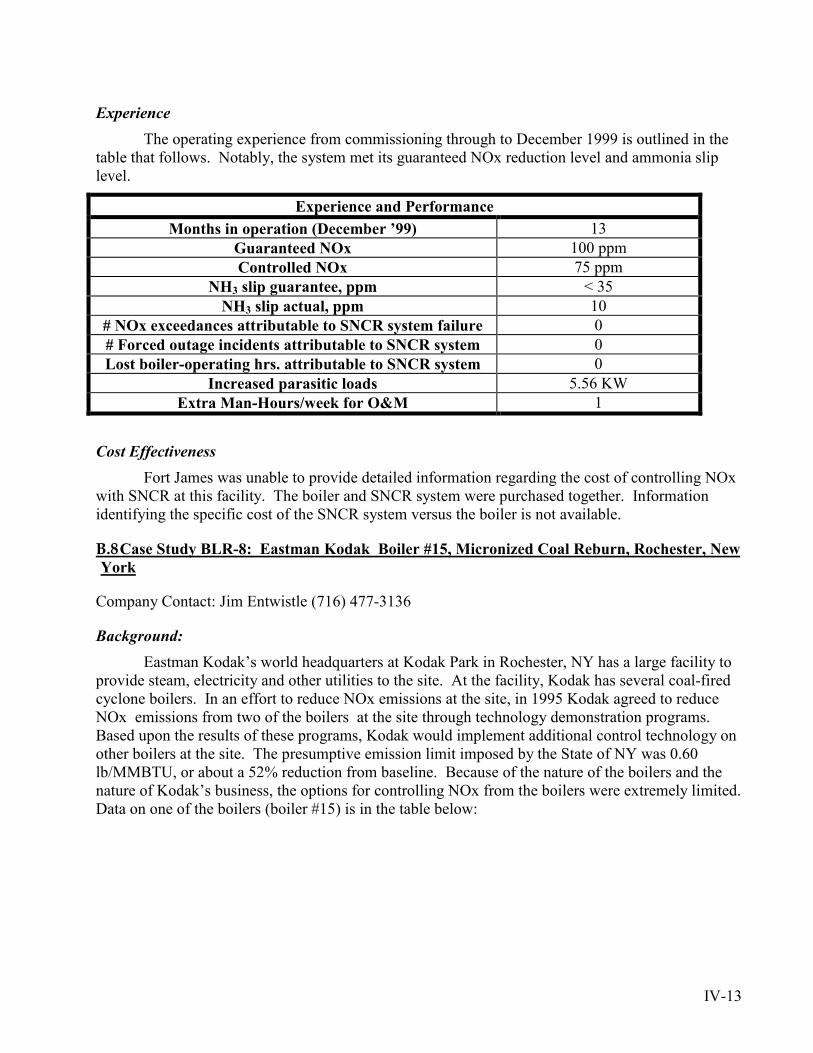
IV-13
ExperienceThe operating experience from commissioning through to December 1999 is outlined in the
table that follows. Notably, the system met its guaranteed NOx reduction level and ammonia sliplevel.
Experience and PerformanceMonths in operation (December ’99) 13
Guaranteed NOx 100 ppmControlled NOx 75 ppm
NH3 slip guarantee, ppm < 35NH3 slip actual, ppm 10
# NOx exceedances attributable to SNCR system failure 0# Forced outage incidents attributable to SNCR system 0Lost boiler-operating hrs. attributable to SNCR system 0
Increased parasitic loads 5.56 KWExtra Man-Hours/week for O&M 1
Cost EffectivenessFort James was unable to provide detailed information regarding the cost of controlling NOx
with SNCR at this facility. The boiler and SNCR system were purchased together. Informationidentifying the specific cost of the SNCR system versus the boiler is not available.
B.8 Case Study BLR-8: Eastman Kodak Boiler #15, Micronized Coal Reburn, Rochester, NewYork
Company Contact: Jim Entwistle (716) 477-3136
Background:Eastman Kodak’s world headquarters at Kodak Park in Rochester, NY has a large facility to
provide steam, electricity and other utilities to the site. At the facility, Kodak has several coal-firedcyclone boilers. In an effort to reduce NOx emissions at the site, in 1995 Kodak agreed to reduceNOx emissions from two of the boilers at the site through technology demonstration programs.Based upon the results of these programs, Kodak would implement additional control technology onother boilers at the site. The presumptive emission limit imposed by the State of NY was 0.60lb/MMBTU, or about a 52% reduction from baseline. Because of the nature of the boilers and thenature of Kodak’s business, the options for controlling NOx from the boilers were extremely limited.Data on one of the boilers (boiler #15) is in the table below:
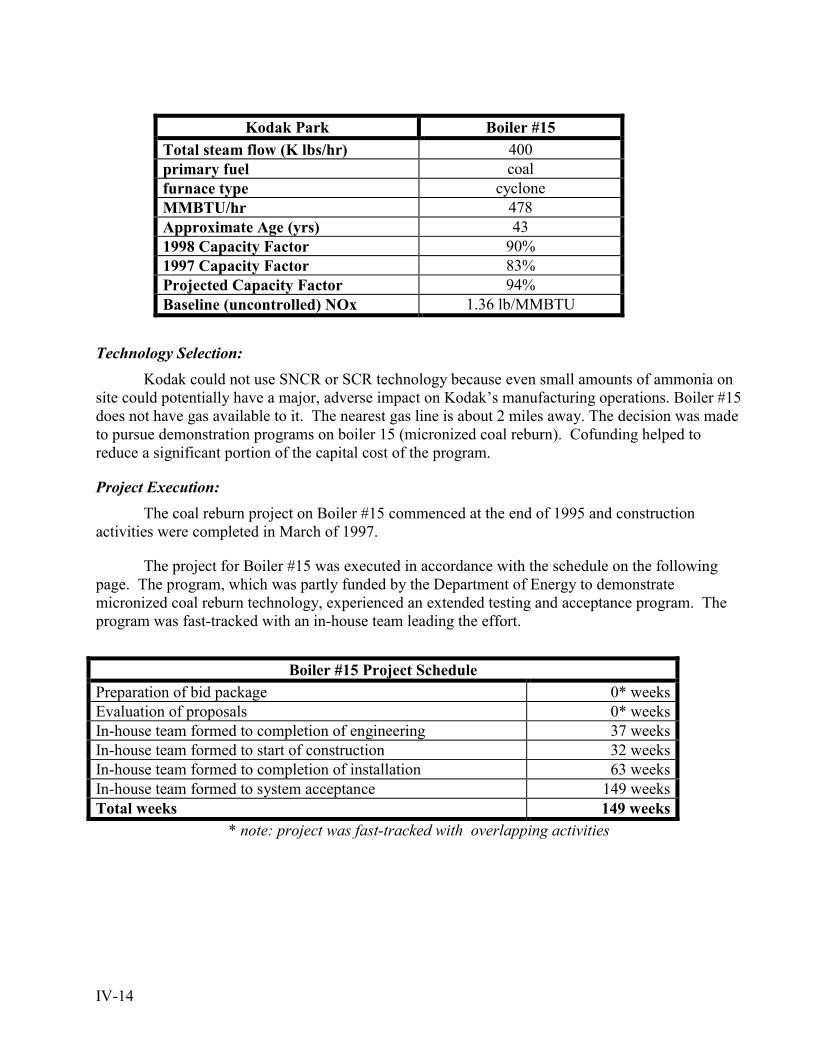
IV-14
Kodak Park Boiler #15Total steam flow (K lbs/hr) 400primary fuel coalfurnace type cycloneMMBTU/hr 478Approximate Age (yrs) 431998 Capacity Factor 90%1997 Capacity Factor 83%Projected Capacity Factor 94%Baseline (uncontrolled) NOx 1.36 lb/MMBTU
Technology Selection:Kodak could not use SNCR or SCR technology because even small amounts of ammonia on
site could potentially have a major, adverse impact on Kodak’s manufacturing operations. Boiler #15does not have gas available to it. The nearest gas line is about 2 miles away. The decision was madeto pursue demonstration programs on boiler 15 (micronized coal reburn). Cofunding helped toreduce a significant portion of the capital cost of the program.
Project Execution:The coal reburn project on Boiler #15 commenced at the end of 1995 and construction
activities were completed in March of 1997.
The project for Boiler #15 was executed in accordance with the schedule on the followingpage. The program, which was partly funded by the Department of Energy to demonstratemicronized coal reburn technology, experienced an extended testing and acceptance program. Theprogram was fast-tracked with an in-house team leading the effort.
Boiler #15 Project SchedulePreparation of bid package 0* weeksEvaluation of proposals 0* weeksIn-house team formed to completion of engineering 37 weeksIn-house team formed to start of construction 32 weeksIn-house team formed to completion of installation 63 weeksIn-house team formed to system acceptance 149 weeksTotal weeks 149 weeks
* note: project was fast-tracked with overlapping activities
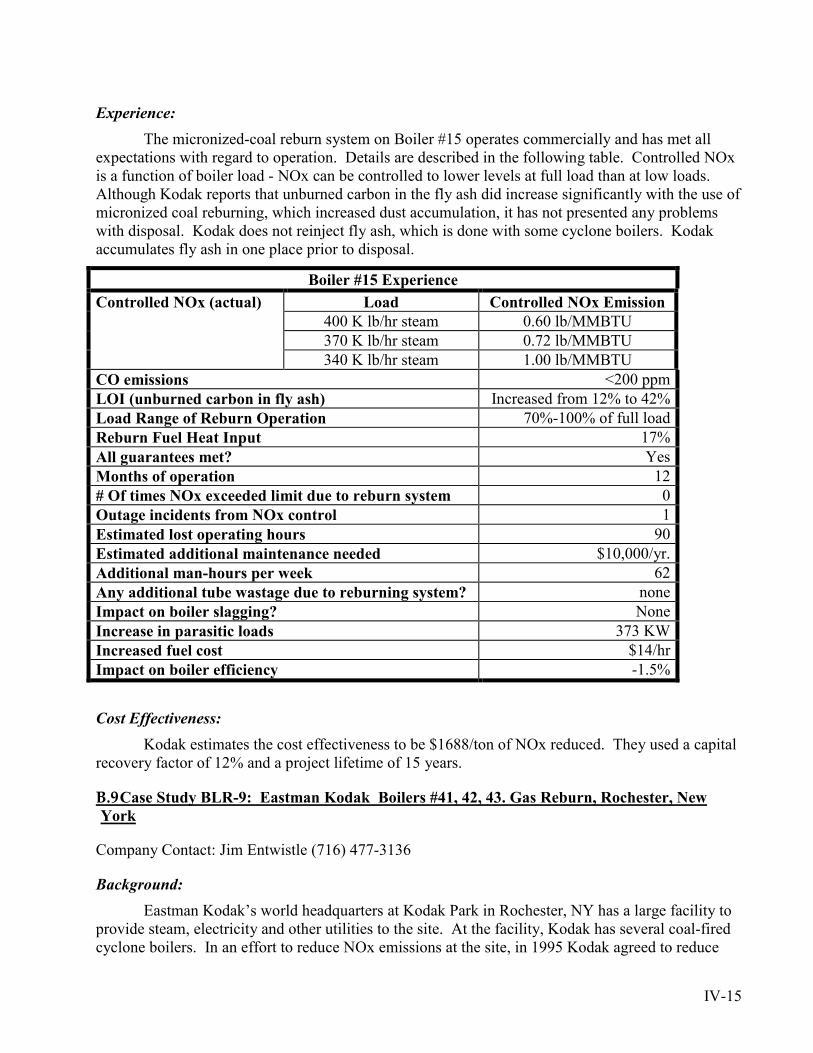
IV-15
Experience:The micronized-coal reburn system on Boiler #15 operates commercially and has met all
expectations with regard to operation. Details are described in the following table. Controlled NOxis a function of boiler load - NOx can be controlled to lower levels at full load than at low loads.Although Kodak reports that unburned carbon in the fly ash did increase significantly with the use ofmicronized coal reburning, which increased dust accumulation, it has not presented any problemswith disposal. Kodak does not reinject fly ash, which is done with some cyclone boilers. Kodakaccumulates fly ash in one place prior to disposal.
Boiler #15 ExperienceLoad Controlled NOx Emission
400 K lb/hr steam 0.60 lb/MMBTU370 K lb/hr steam 0.72 lb/MMBTU
Controlled NOx (actual)
340 K lb/hr steam 1.00 lb/MMBTUCO emissions <200 ppmLOI (unburned carbon in fly ash) Increased from 12% to 42%Load Range of Reburn Operation 70%-100% of full loadReburn Fuel Heat Input 17%All guarantees met? YesMonths of operation 12# Of times NOx exceeded limit due to reburn system 0Outage incidents from NOx control 1Estimated lost operating hours 90Estimated additional maintenance needed $10,000/yr.Additional man-hours per week 62Any additional tube wastage due to reburning system? noneImpact on boiler slagging? NoneIncrease in parasitic loads 373 KWIncreased fuel cost $14/hrImpact on boiler efficiency -1.5%
Cost Effectiveness:Kodak estimates the cost effectiveness to be $1688/ton of NOx reduced. They used a capital
recovery factor of 12% and a project lifetime of 15 years.
B.9 Case Study BLR-9: Eastman Kodak Boilers #41, 42, 43. Gas Reburn, Rochester, NewYork
Company Contact: Jim Entwistle (716) 477-3136
Background:Eastman Kodak’s world headquarters at Kodak Park in Rochester, NY has a large facility to
provide steam, electricity and other utilities to the site. At the facility, Kodak has several coal-firedcyclone boilers. In an effort to reduce NOx emissions at the site, in 1995 Kodak agreed to reduce

IV-16
NOx emissions from two of the boilers at the site, boilers #15 and #43, through technologydemonstration programs. Based upon the results of these programs, Kodak would implementadditional control technology on other boilers at the site. The presumptive emission limit imposedby the State of NY was 0.60 lb/MMBTU, or about a 52% reduction from baseline. Because of thenature of the boilers and the nature of Kodak’s business, the options for controlling NOx from theboilers were extremely limited. Data on three of the boilers are in the table below:
Kodak Park Boiler #41 Boiler #42 Boiler #43Primary fuel Coal Coal CoalFurnace type Cyclone Cyclone CycloneMMBTU/hr 500 500 640Approximate Age (yrs) 35 31 301997 Capacity Factor 77% 77% 76%1998 Capacity Factor 77% 79% 76%Projected Capacity Factor 79% 78% 77%Baseline (uncontrolled) NOx, lb/MMBTU 1.20 1.20 1.36
Technology Selection:Boilers #41, 42, and 43 has gas readily available, while Boiler #15 does not. The decision
was made to pursue demonstration programs on boilers 43 (gas reburn) and 15 (micronized coalreburn). After the successful demonstration of gas reburn on Boiler #43, Kodak made the decisionto install gas reburning on boilers #41 and 42. Demonstration of the technology on Boiler #43showed that flue gas recirculation was not necessary for these boilers. Therefore, the design of theBoiler #41 and #42 gas reburn systems differs significantly from the design of the gas reburn systemon Boiler #43 in that flue gas recirculation is not used on the two systems for Boilers #41 and #42.
Project Execution:The project on Boiler #43 was the first to be installed a and was a demonstration program.
The projects for Boilers #41, 42 and 43 proceeded according to the following schedules:
Boiler #43 Project SchedulePreparation of bid package 0* weeksEvaluation of proposals 0* weeksIn-house team formed to completion of engineering 46 weeksIn-house team formed to arrival of equipment on site 46 weeksIn-house team formed to completion of installation 58 weeksIn-house team formed to completion of system commissioning 65 weeksTotal weeks (in service in 1996) 65 weeks
* note: project was fast-tracked with overlapping activities

IV-17
Boiler #41 Project SchedulePreparation of bid package 0* weeksEvaluation of proposals 0* weeksIn-house team formed to completion of engineering 28 weeksIn-house team formed to arrival of equipment on site 35 weeksIn-house team formed to completion of installation 54 weeksIn-house team formed to completion of system commissioning 66 weeksTotal weeks (in service in 1999) 66 weeks
* note: project was fast-tracked with overlapping activities
Boiler #42 Project SchedulePreparation of bid package 0* weeksEvaluation of proposals 0* weeksIn-house team formed to completion of engineering 34 weeksIn-house team formed to arrival of equipment on site 22 weeksIn-house team formed to completion of installation 46 weeksIn-house team formed to completion of system commissioning 58 weeksTotal weeks (in service in 1998) 58 weeks
* note: project was fast-tracked with overlapping activities
Experience:The reburn systems on Boilers #43, 41,and 42 operate commercially and have met all
expectations with regard to operation. Details are described in the table below.

IV-18
ExperienceBoiler #41 Boiler #42 Boiler #43
Year that NOx reduction system was placed inservice
1999 1998 1996
Guaranteed NOx, lb/MMBTU 0.60 0.60 0.685Actual controlled NOx, lb/MMBTU 0.60 0.60 0.60CO emissions <200 ppm <200 ppm <200 ppmLOI 8% 10% 12%Load range of reburn operation, % of full load 70%-100% 70%-100% 70%-100%Reburn fuel heat input 13% 15.7% 20%All guarantees met? Yes Yes YesMonths of operation 8 14 38# of times NOx exceeded limit 0 0 0Outage incidents from NOx control 0 0 0Estimated lost operating hours 0 0 0Estimated additional labor, man-hr/week 5 5 5Estimated additional maintenance needed Negligible Negligible NegligibleIncreased fuel costs at full load? $117/hr $141/hr $230/hrAny additional tube wastage? No No NoImpact on slagging? None None NoneIncrease in parasitic loads 0 0 56 KWImpact on boiler efficiency -0.20% -0.23% 0.50%
As indicated in the table, the gas reburning has operated successfully without any failures forall three boilers.
Cost Effectiveness:Kodak has estimated the cost effectiveness of the NOx reduction system using a capital
recovery factor of 12% and a project economic life of 15 years. Cost effectiveness is estimated asfollows:
Estimated Cost Effectiveness ($/ton of NOx removed)Boiler 41 Boiler 42 Boiler 43$1,215 $1,482 $1,246
Actual costs experienced over the life of the facility will be dependent upon gas pricing andavailability.

IV-19
C. Gas Turbine Case Studies
C.1 Case Study GT-1, Duke Energy, Cromwell, Connecticut
Operator Contact - Mike Taylor, (617) 560-1456
Background and Technology SelectionDuke Energy owns natural gas transmission facilities in the Northeast US. The fleet of
engines includes turbines and reciprocating engines with integral compressors. Among theequipment located in Cromwell, CT, are two Solar Centaur turbines that drive compressors. Thesesimple-cycle gas turbines are rated at 4700 hp each.
The turbines were put in place before Connecticut’s Reasonably Available ControlTechnology (RACT) requirements were in place. Therefore, it was necessary to reduce NOxemissions in 1995 when Connecticut RACT requirements took effect.
The units operate as needed to meet gas transmission demands.
The turbines were retrofitted with Dry Low NOx (DLN) Combustor technology wasimplemented in order to achieve the necessary NOx reductions. Although other approaches wereconsidered, the primary reason for selection of this technology was that it was evaluated as the mostcost-effective approach.
General Statistics on Duke Energy Cromwell, CT, Gas TurbineTurbine Type Solar Centaur, simple-cycle compressor drive
HP 2 x 4700 hpHeat Recovery None
Fuel(s) Natural GasCapacity Factor Not Available
Baseline (uncontrolled) NOx T1 – 135 ppmvd at 15%O2 (permit)T2 – 110 ppmvd at 15%O2 (permit)
Controlled NOx T1 & T2 - 42 ppmvd at 15%O2 (permit)
Project ExecutionThe technology was retrofitted onto the turbines in 1993, in time to satisfy RACT
requirements. The cost of these retrofits, including commissioning, was $1.9 million. This priceincludes the cost of additional work on the compressors and reflects much more than the cost of theDLN retrofits alone. Personnel that managed the project are no longer with the company, so projectexecution details are not available.
ExperienceThe facility has been operating since 1993 with the Dry Low NOx retrofits. During that
time, the emissions of the turbines have been maintained under the required level and within theguarantee levels. In the roughly 72 months of operation, the NOx reduction system has resulted in

IV-20
150 turbine outages and a total of 1,200 lost operating hours for both gas turbines at the facility. Theshut downs and lost hours were due to frequent flameouts during weather changes that were nothandled well by the first-generation of fuel controls. Duke Energy has since equipped the turbineswith more modern electronic fuel controls from the manufacturer that have addressed this problem.Roughly two man-hours per week of additional service is needed to maintain the turbines.
The first generation combustor liner failed after about 5,000 hours. However, a new, thirdgeneration combustor liner appears to be operating properly for over 10,000 hours. The cost ofreplacing a combustor liner is roughly $20,000, including labor and materials.
Experience and PerformanceMonths in operation (as of Aug ’99) 72
Increased parasitic loads NoneChange in turbine efficiency None
Project Cost $950,000 per turbine(includes significant compressor work
not related to DLN retrofit)Estimated add’l fixed O&M see Cost Effectiveness Calculations
Add’l man-hours of labor 2 hours/week per turbineNOx guarantee, ppm 42 ppmvd at 15%O2
NOx guarantee met? YesCombustor Life prior to DLN 20,000 + hours
Combustor Life after DLN 5,000 to 10,000 hours *Number of forced outages 150*Total lost operating hours 1200*
* New fuel controls have addressed the frequent forced outage problem thatcontributed to high lost operating hours. First-generation combustor liners failedafter about 5,000 hours. New, third-generation combustor liner appears to haveincreased the combustor life to 10,000 hours or more.

IV-21
Cost EffectivenessSee attached cost effectiveness spreadsheets provided by Duke Energy.
Cromwell, CTSolar Centaur (T1)
Dry Low NOX Combustor Cost Effectiveness
Capital Costs Basis Value Units ReferenceTotal Capital Investment (TCI) TCI $950,000 $/turbine Project Cost
Total Capital Costs $950,000 $ Calculation
Operating Costs Basis Value Units ReferenceUnit Cost Hourly Rate $30 $/hr Industry AverageOperating Labor Required 2 hrs/wk/turbine 104 hrs/yr. ExperienceOperating Labor Cost $3,120 $/yr. CalculationSupervisor Labor Cost 15% of Operating Labor $468 $/yr. OAQPS
Total Operating Costs $3,588 $/yr. CalculationMaintenance Costs Basis Value Units Reference
Unit Cost Hourly Rate $36 $/hr Industry AverageMaintenance Labor Required 160 hrs/yr./turbine 160 hrs/yr. EstimateMaintenance Labor Cost $5,760 $/yr. CalculationMaterial Cost 100% of Maintenance Cost $5,760 $/yr. OAQPS
Total Maintenance Costs $11,520 $/yr. CalculationTotal O&M Costs $15,108 $/yr. Calculation
Indirect Costs Basis Value Units ReferenceOverhead 60% of O&M Costs $9,065 $/yr. OAQPSAdministration 2% of TCI $19,000 $/yr. OAQPSInsurance 1% of TCI $9,500 $/yr. OAQPSCost Recovery Factor (CRF) 10 yrs at 8% 0.149 n.d. OAQPSCapital Recovery TCI x CRF $141,578 $/yr. OAQPS
Total Indirect Costs $179,143 $/yr. Calculation
Total Annual Costs O&M Costs + Indirect Cost $194,251 $/yr. Calculation
NOX Emission Reduction Basis Value Units Reference
Baseline NOX Emissions Uncontrolled (135 ppmvd at 15%O2) 21.30 lb/hr Permit LimitControlled NOX Emissions Controlled (42 ppmv at 15% O2) 7.76 lb/hr Permit LimitNOX Emission Reduction Emissions Differential 59.31 tpy Calculation
Cost Effectiveness $3,275 $/ton Calculation

IV-22
Cromwell, CTSolar Centaur (T2)
Dry Low NOX Combustor Cost Effectiveness
Capital Costs Basis Value Units ReferenceTotal Capital Investment (TCI) TCI $950,000 $/turbine Project Cost
Total Capital Costs $950,000 $ Calculation
Operating Costs Basis Value Units ReferenceUnit Cost Hourly Rate $30 $/hr Industry AverageOperating Labor Required 2 hrs/wk/turbine 104 hrs/yr. ExperienceOperating Labor Cost $3,120 $/yr. CalculationSupervisor Labor Cost 15% of Operating Labor $468 $/yr. OAQPS
Total Operating Costs $3,588 $/yr. CalculationMaintenance Costs Basis Value Units Reference
Unit Cost Hourly Rate $36 $/hr Industry AverageMaintenance Labor Required 160 hrs/yr./turbine 160 hrs/yr. EstimateMaintenance Labor Cost $5,760 $/yr. CalculationMaterial Cost 100% of Maintenance Cost $5,760 $/yr. OAQPS
Total Maintenance Costs $11,520 $/yr. CalculationTotal O&M Costs $15,108 $/yr. Calculation
Indirect Costs Basis Value Units ReferenceOverhead 60% of O&M Costs $9,065 $/yr. OAQPSAdministration 2% of TCI $19,000 $/yr. OAQPSInsurance 1% of TCI $9,500 $/yr. OAQPSCost Recovery Factor (CRF) 10 yrs at 8% 0.149 n.d. OAQPSCapital Recovery TCI x CRF $141,578 $/yr. OAQPS
Total Indirect Costs $179,143 $/yr. Calculation
Total Annual Costs O&M Costs + Indirect Cost $194,251 $/yr. Calculation
NOX Emission Reduction Basis Value Units Reference
Baseline NOX Emissions Uncontrolled (110 ppmvd at 15%O2) 17.39 lb/hr Permit LimitControlled NOX Emissions Controlled (42 ppmv at 15% O2) 7.76 lb/hr Permit LimitNOX Emission Reduction Emissions Differential 42.18 tpy Calculation
Cost Effectiveness $4,605 $/ton Calculation

IV-23
C.2 Case Study GT-2, Duke Energy, Southeast, New York
Operator Contact - Mike Taylor, (617) 560-1456
Background and Technology SelectionDuke Energy owns natural gas transmission facilities in the Northeast US. The fleet of
engines includes turbines and reciprocating engines with integral compressors. Among theequipment located in the town of Southeast, NY, are two Solar Centaur turbines and one Solar Marsturbine that drive compressors. These simple-cycle gas-turbine engines are rated at 4700 hp each forthe Centaurs and 13,000 hp for the Mars.
The turbines were put in place before New York’s Reasonably Available Control Technology(RACT) requirements were in place. Therefore, it was necessary to reduce NOx emissions by 1995when these rules took effect.
The units operate as needed to meet gas transmission demands.
The turbines were retrofitted with Dry Low NOx (DLN) Combustor technology wasimplemented in order to achieve the necessary NOx reductions. Although other approaches wereconsidered, the primary reason for selection of this technology was that it was evaluated as the mostcost-effective approach.
General Statistics on Duke Energy Southeast, NY, Gas TurbineTurbine Type Solar Centaurs and Mars simple-cycle
compressor driveHP 2 x 4,700 hp (Centaur)
1 x 13,000 hp (Mars)Heat Recovery None
Fuel(s) Natural GasCapacity Factor Not Available
Baseline (uncontrolled) NOx Centaur - 135 ppmvd at 15%O2 (permit)Mars - 167 ppmvd at 15%O2 (permit)
Controlled NOx 50 ppmvd at 15%O2 (permit)
Project ExecutionThe technology was retrofitted onto the turbines in 1993, in time to satisfy RACT
requirements. The cost of these retrofits, including commissioning, was $3.5 million. Personnel thatmanaged the project are no longer with the company, so project execution details are not available.
ExperienceThe facility has been operating since 1993 with the Dry Low NOx retrofit. During that time,
the emissions from the turbines have been maintained under the required level and within theguarantee levels. In the roughly 72 months of operation, the NOx reduction system has resulted in50 turbine outages and a total of 450 lost operating hours for both gas turbines at the facility. Theshut downs and lost hours were due to frequent flameouts during weather changes which were not

IV-24
handled well by the first-generation of fuel controls. Duke Energy has since equipped the turbineswith more modern electronic fuel controls from the manufacturer that have addressed this problem.The Mars fuel injectors also plugged frequently until a finer upstream filter corrected this problem.Roughly two man-hours per week of additional service is needed to maintain the turbines.
The first generation combustor liner failed after about 5000 hours. However, a new, thirdgeneration combustor liner appears to be operating properly for over 10,000 hours. The cost ofreplacing a combustor liner is roughly $20,000, including labor and materials.
Experience and PerformanceMonths in operation (as of Aug ’99) 72
Increased parasitic loads NoneChange in turbine efficiency None
Project Cost $3.5 millionCentaur - $775,000 per turbine
Mars - $1,950,000Estimated add’l fixed O&M $15,000/year
Add’l man-hours of labor see Cost Effectiveness CalculationsNOx guarantee, ppm 42 ppmvd at 15%O2NOx guarantee met? Yes
Combustor Life prior to DLN 20,000 + hrsCombustor Life after DLN 5,000-10,000 hrs *Number of forced outages 50 *Total lost operating hours 450 *
* New fuel controls have addressed the frequent forced outage problem thatcontributed to high lost operating hours. First-generation combustor liners failed afterabout 5,000 hours. New, third-generation combustor liner appears to have increasedthe combustor life to 10,000 hours or more.
Cost EffectivenessOst effectiveness spreadsheets from Duke Energy appear on the following two pages.

IV-25
Southeast, NYSolar Centaurs
Dry Low NOX Combustor Cost Effectiveness
Capital Costs Basis Value Units ReferenceTotal Capital Investment (TCI) TCI $775,000 $/turbine Project Cost
Total Capital Costs $775,000 $ Calculation
Operating Costs Basis Value Units ReferenceUnit Cost Hourly Rate $30 $/hr Industry AverageOperating Labor Required 2 hrs/wk/turbine 104 hrs/yr. ExperienceOperating Labor Cost $3,120 $/yr. CalculationSupervisor Labor Cost 15% of Operating Labor $468 $/yr. OAQPS
Total Operating Costs $3,588 $/yr. CalculationMaintenance Costs Basis Value Units Reference
Unit Cost Hourly Rate $36 $/hr Industry AverageMaintenance Labor Required 160 hrs/yr./turbine 160 hrs/yr. EstimateMaintenance Labor Cost $5,760 $/yr. CalculationMaterial Cost 100% of Maintenance Cost $5,760 $/yr. OAQPS
Total Maintenance Costs $11,520 $/yr. CalculationTotal O&M Costs $15,108 $/yr. Calculation
Indirect Costs Basis Value Units ReferenceOverhead 60% of O&M Costs $9,065 $/yr. OAQPSAdministration 2% of TCI $15,500 $/yr. OAQPSInsurance 1% of TCI $7,750 $/yr. OAQPSCost Recovery Factor (CRF) 10 yrs at 8% 0.149 n.d. OAQPSCapital Recovery TCI x CRF $115,498 $/yr. OAQPS
Total Indirect Costs $147,813 $/yr. Calculation
Total Annual Costs O&M Costs + Indirect Cost $162,921 $/yr. Calculation
NOX Emission Reduction Basis Value Units Reference
Baseline NOX Emissions Uncontrolled (135 ppmvd at 15%O2) 21.60 lb/hr Permit LimitControlled NOX Emissions Controlled (50 ppmv at 15% O2) 7.59 lb/hr Permit LimitNOX Emission Reduction Emissions Differential 61.36 tpy Calculation
Cost Effectiveness $2,655 $/ton Calculation

IV-26
Southeast, NYSolar Mars
Dry Low NOX Combustor Cost Effectiveness
Capital Costs Basis Value Units ReferenceTotal Capital Investment (TCI) TCI $1,950,000 $/turbine Project Cost
Total Capital Costs $1,950,000 $ Calculation
Operating Costs Basis Value Units ReferenceUnit Cost Hourly Rate $30 $/hr Industry AverageOperating Labor Required 2 hrs/wk/turbine 104 hrs/yr. ExperienceOperating Labor Cost $3,120 $/yr. CalculationSupervisor Labor Cost 15% of Operating Labor $468 $/yr. OAQPS
Total Operating Costs $3,588 $/yr. CalculationMaintenance Costs Basis Value Units Reference
Unit Cost Hourly Rate $36 $/hr Industry AverageMaintenance Labor Required 160 hrs/yr./turbine 160 hrs/yr. EstimateMaintenance Labor Cost $5,760 $/yr. CalculationMaterial Cost 100% of Maintenance Cost $5,760 $/yr. OAQPS
Total Maintenance Costs $11,520 $/yr. CalculationTotal O&M Costs $15,108 $/yr. Calculation
Indirect Costs Basis Value Units ReferenceOverhead 60% of O&M Costs $9,065 $/yr. OAQPSAdministration 2% of TCI $39,000 $/yr. OAQPSInsurance 1% of TCI $19,500 $/yr. OAQPSCost Recovery Factor (CRF) 10 yrs at 8% 0.149 n.d. OAQPSCapital Recovery TCI x CRF $290,608 $/yr. OAQPS
Total Indirect Costs $358,280 $/yr. Calculation
Total Annual Costs O&M Costs + Indirect Cost $373,280 $/yr. Calculation
NOX Emission Reduction Basis Value Units Reference
Baseline NOX Emissions Uncontrolled (167 ppmvd at 15%O2) 75.68 lb/hr Permit LimitControlled NOX Emissions Controlled (42 ppmv at 15% O2) 7.70 lb/hr Permit LimitNOX Emission Reduction Emissions Differential 297.75 tpy Calculation
Cost Effectiveness $1,254 $/ton Calculation

IV-27
C.3 Case Study GT-3, Duke Energy, Stony Point, New York
Operator Contact - Mike Taylor, (617) 560-1456
Background and Technology SelectionDuke Energy owns natural gas transmission facilities in the Northeast US. The fleet of
engines includes turbines and reciprocating engines with integral compressors. Among theequipment located in Stony Point, NY are two Solar Centaur turbines and one Solar Mars turbinethat drive compressors. These simple-cycle gas-turbine engines are rated at 4700 hp each (Centaur)and 13,000 hp (Mars).
The turbines were put in place before New York’s Reasonably Available Control Technology(RACT) requirements were in place. Therefore, it was necessary to reduce NOx emissions by 1995when these rules took effect.
The units operate as needed to meet gas transmission demands.
The turbines were retrofitted with Dry Low NOx (DLN) Combustor technology wasimplemented in order to achieve the necessary NOx reductions. Although other approaches wereconsidered, the primary reason for selection of this technology was that it was evaluated as the mostcost-effective approach.
General Statistics on Duke Energy Stony Point NY, Gas TurbinesTurbine Type Solar Centaur and Mars simple-cycle compressor
drivesHP 2 x 4700 hp (Centaur)
1 x 13,000 (Mars)Heat Recovery None
Fuel(s) Natural GasCapacity Factor Not Available
Baseline (uncontrolled) NOx Centaur - 135 ppmvd at 15%O2 (permit)Mars - 167 ppmvd at 15%O2 (permit)
Controlled NOx 42 ppmvd at 15%O2 (permit)
Project ExecutionThe technology was retrofitted onto the turbines in 1993, in time to satisfy RACT
requirements. The cost of these retrofits, including commissioning, was $3.5 million. Personnel thatmanaged the project are no longer with the company, so project execution details are not available.
ExperienceThe facility has been operating since 1993 with the Dry Low NOx retrofit. During that time,
the emissions of the turbines have been maintained under the required level and within the guaranteelevels. In the roughly 72 months of operation, the NOx reduction system has resulted in 200 turbineoutages and a total of 2,000 lost operating hours for all gas turbines at the facility. The shut downs

IV-28
and lost hours were due to frequent flameouts during weather changes which were not handled wellby the first-generation fuel controls. Duke has since equipped the turbines with more modernelectronic fuel controls from the manufacturer that have addressed this problem. The Mars fuelinjectors also plugged frequently until a finer upstream filter corrected this problem. Roughly twoman-hours per week of additional service is needed to maintain the turbines.
The first generation combustor liner failed after about 5000 hours. However, a new, thirdgeneration combustor liner appears to be operating properly for over 10,000 hours. The cost ofreplacing a combustor liner is roughly $20,000, including labor and materials.
Experience and PerformanceMonths in operation (as of Aug ’99) 72
Increased parasitic loads NoneChange in turbine efficiency None
Project Cost $3.5 millionCentaur - $775,000 per turbine
Mars - $1,950,000Estimated add’l fixed O&M $15,000/year
Add’l man-hours of labor see Cost Effectiveness CalculationsNOx guarantee, ppm 42 ppmvd at 15%O2
NOx guarantee met? YesCombustor Life prior to DLN 20,000 + hrs
Combustor Life after DLN 5,000-10,000 hrsNumber of forced outages 200Total lost operating hours 2,000
New fuel controls have addressed the frequent forced outage problem that contributed tohigh lost operating hours. First-generation combustor liners failed after about 5,000hours. New, third-generation combustor liner appears to have increased the combustorlife to 10,000 hours or more.
Cost EffectivenessOst effectiveness spreadsheets from Duke Energy appear on the following two pages.

IV-29
Stony Point, NYSolar Centaurs
Dry Low NOX Combustor Cost Effectiveness
Capital Costs Basis Value Units ReferenceTotal Capital Investment (TCI) TCI $775,000 $/turbine Project Cost
Total Capital Costs $775,000 $ Calculation
Operating Costs Basis Value Units ReferenceUnit Cost Hourly Rate $30 $/hr Industry AverageOperating Labor Required 2 hrs/wk/turbine 104 hrs/yr. ExperienceOperating Labor Cost $3,120 $/yr. CalculationSupervisor Labor Cost 15% of Operating Labor $468 $/yr. OAQPS
Total Operating Costs $3,588 $/yr. CalculationMaintenance Costs Basis Value Units Reference
Unit Cost Hourly Rate $36 $/hr Industry AverageMaintenance Labor Required 160 hrs/yr./turbine 160 hrs/yr. EstimateMaintenance Labor Cost $5,760 $/yr. CalculationMaterial Cost 100% of Maintenance Cost $5,760 $/yr. OAQPS
Total Maintenance Costs $11,520 $/yr. CalculationTotal O&M Costs $15,108 $/yr. Calculation
Indirect Costs Basis Value Units ReferenceOverhead 60% of O&M Costs $9,065 $/yr. OAQPSAdministration 2% of TCI $15,500 $/yr. OAQPSInsurance 1% of TCI $7,750 $/yr. OAQPSCost Recovery Factor (CRF) 10 yrs at 8% 0.149 n.d. OAQPSCapital Recovery TCI x CRF $115,498 $/yr. OAQPS
Total Indirect Costs $147,813 $/yr. Calculation
Total Annual Costs O&M Costs + Indirect Cost $162,921 $/yr. Calculation
NOX Emission Reduction Basis Value Units Reference
Baseline NOX Emissions Uncontrolled (135 ppmvd at 15%O2) 27.00 lb/hr Permit LimitControlled NOX Emissions Controlled (42 ppmv at 15% O2) 7.70 lb/hr Guarantee/Permit LimitNOX Emission Reduction Emissions Differential 84.53 tpy Calculation
Cost Effectiveness $1,927 $/ton Calculation

IV-30
Stony Point, NYSolar Mars
Dry Low NOX Combustor Cost Effectiveness
Capital Costs Basis Value Units ReferenceTotal Capital Investment (TCI) TCI $1,950,000 $/turbine Project Cost
Total Capital Costs $1,950,000 $ Calculation
Operating Costs Basis Value Units ReferenceUnit Cost Hourly Rate $30 $/hr Industry AverageOperating Labor Required 2 hrs/wk/turbine 104 hrs/yr. ExperienceOperating Labor Cost $3,120 $/yr. CalculationSupervisor Labor Cost 15% of Operating Labor $468 $/yr. OAQPS
Total Operating Costs $3,588 $/yr. CalculationMaintenance Costs Basis Value Units Reference
Unit Cost Hourly Rate $36 $/hr Industry AverageMaintenance Labor Required 160 hrs/yr./turbine 160 hrs/yr. EstimateMaintenance Labor Cost $5,760 $/yr. CalculationMaterial Cost 100% of Maintenance Cost $5,760 $/yr. OAQPS
Total Maintenance Costs $11,520 $/yr. CalculationTotal O&M Costs $15,108 $/yr. Calculation
Indirect Costs Basis Value Units ReferenceOverhead 60% of O&M Costs $9,065 $/yr. OAQPSAdministration 2% of TCI $39,000 $/yr. OAQPSInsurance 1% of TCI $19,500 $/yr. OAQPSCost Recovery Factor (CRF) 10 yrs at 8% 0.149 n.d. OAQPSCapital Recovery TCI x CRF $290,608 $/yr. OAQPS
Total Indirect Costs $358,172 $/yr. Calculation
Total Annual Costs O&M Costs + Indirect Cost $373,280 $/yr. Calculation
NOX Emission Reduction Basis Value Units Reference
Baseline NOX Emissions Uncontrolled (167 ppmvd at 15%O2) 85.47 lb/hr Permit LimitControlled NOX Emissions Controlled (42 ppmv at 15% O2) 7.70 lb/hr Guarantee/Permit LimitNOX Emission Reduction Emissions Differential 340.63 tpy Calculation
Cost Effectiveness $1,096 $/ton Calculation

IV-31
C.4 Case Study GT-4 Kern River and Sycamore Cogeneration Projects, Bakersfield,California
Operator Contact: Daniel Beck (661) 392-2461
Background and Technology SelectionKern River and Sycamore Cogeneration Companies operate cogeneration and gas
compression equipment in Bakersfield, CA. The gas turbines are GE Frame 7’s that drive gascompression equipment. Each facility (Kern River and Sycamore) has four turbines each. Each gasturbine is rated at 75 MW, for a facility rating of 300 MW per facility. All four of Sycamore’sturbines and two of Kern River’s turbines have model EA compressors attached. The other twounits at Kern River have model E compressors (not quite as large as the model EA compressors).
Both facilities were originally equipped with water injection for NOx control. Additionalreductions were required that were beyond the capability of water injection. Therefore, it wasdetermined that water injection would be removed from the turbines and the turbines would beretrofitted with Dry Low NOx combustors, which were recently made available by the turbinemanufacturer, General Electric.
General Statistics on Kern River and Sycamore Cogeneration ProjectsTurbine Type GE Frame 7
Gas Turbine Output 4 x 75 MW (Kern River)4 x 75 MW (Sycamore)
Heat Recovery Yes, HRSGFuel(s) Natural Gas
Capacity Factor Over 95% both facilities Previous Controlled NOx
(with water injection)30-40 ppm
Guaranteed Outlet NOx 15 ppmControlled NOx (with DLN) 8-12 ppm
The units operate almost continuously, with historical capacity factors of 96.2% and 98.4% atKern River and Sycamore, respectively.
DLN is capable of 15 ppm of NOx (which approximates to just under 50 lb/hr at full load perturbine). The conventional combustors with water injection that the turbines were previouslyequipped with, were capable of under 42 ppm.
Project ExecutionThe first unit was retrofitted in 1995 and the last one was retrofitted in May of 1999. The
most recent retrofit took about 24 days to complete, with the work being awarded to the turbinemanufacturer - General Electric. It cost about $3.65 million to retrofit each unit.

IV-32
ExperienceDepending on the turbine, operating experience ranges from a few months to four years.
During this time there have been a total of 10-20 short-term NOx exceedances, under five forcedoutages and fewer than 100 lost operating hours. There is no additional labor associated withoperating the units with DLN.
Most of the exceedances have been associated with re-ignition problems. In this case, theunit is only in an unstable state for a very short time (i.e., five minutes), but the resulting emissionshave sent the units over 1-hr or 3-hr average limits. The facility owners are currently working withthe supplier on two outstanding items. They resulted in 4-5 emission exceedances in a short time(i.e., 1-month).
There are a number of advantages DLN has over water injection that are in addition to NOxreduction.
• Since the DLN retrofit, heat rate has improved 4% versus water injection.
• With water injection, combustor life was only 5-6 years. The Kern River and Sycamoreoperators are hoping for over ten years of combustor life with the DLN combustor.
• Finally, facility consumption of water is reduced from what it would have been with allunits running with water injection. This is important especially in dry regions such asBakersfield, CA.
Experience and PerformanceMonths in operation (as of Aug ’99) 3 to 48, depending on the turbine
Increased parasitic loads NoneChange in turbine efficiency 4% improvement
Project Cost $3.65 million/turbineEstimated add’l fixed O&M None (actually, O&M was reduced compared to
water injection)Add’l man-hours of labor None
NOx guarantee, ppm 15 ppmNOx guarantee met? Yes
Combustor Life prior to DLN 5-6 yrsCombustor Life after DLN Unknown, hoping for over 10 years
Number of NOx exceedances 10-20 *Number of forced outages <5Total lost operating hours <100
* Exceedances were due to short-term transients (typically under 5-minutes), but weresufficient to cause one-hour or three hour averages to exceed maximum allowed. Facilityoperators are working with supplier to resolve outstanding items.
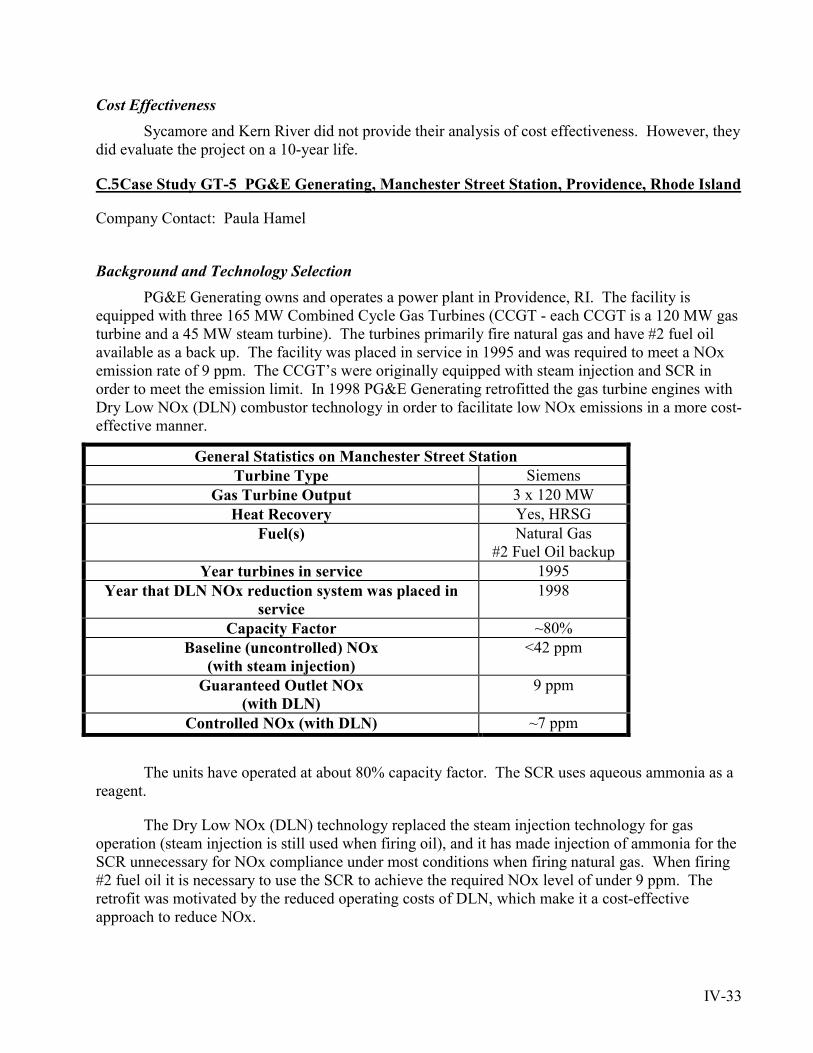
IV-33
Cost EffectivenessSycamore and Kern River did not provide their analysis of cost effectiveness. However, they
did evaluate the project on a 10-year life.
C.5 Case Study GT-5 PG&E Generating, Manchester Street Station, Providence, Rhode Island
Company Contact: Paula Hamel
Background and Technology SelectionPG&E Generating owns and operates a power plant in Providence, RI. The facility is
equipped with three 165 MW Combined Cycle Gas Turbines (CCGT - each CCGT is a 120 MW gasturbine and a 45 MW steam turbine). The turbines primarily fire natural gas and have #2 fuel oilavailable as a back up. The facility was placed in service in 1995 and was required to meet a NOxemission rate of 9 ppm. The CCGT’s were originally equipped with steam injection and SCR inorder to meet the emission limit. In 1998 PG&E Generating retrofitted the gas turbine engines withDry Low NOx (DLN) combustor technology in order to facilitate low NOx emissions in a more cost-effective manner.
General Statistics on Manchester Street StationTurbine Type Siemens
Gas Turbine Output 3 x 120 MWHeat Recovery Yes, HRSG
Fuel(s) Natural Gas#2 Fuel Oil backup
Year turbines in service 1995Year that DLN NOx reduction system was placed in
service1998
Capacity Factor ~80%Baseline (uncontrolled) NOx
(with steam injection)<42 ppm
Guaranteed Outlet NOx(with DLN)
9 ppm
Controlled NOx (with DLN) ~7 ppm
The units have operated at about 80% capacity factor. The SCR uses aqueous ammonia as areagent.
The Dry Low NOx (DLN) technology replaced the steam injection technology for gasoperation (steam injection is still used when firing oil), and it has made injection of ammonia for theSCR unnecessary for NOx compliance under most conditions when firing natural gas. When firing#2 fuel oil it is necessary to use the SCR to achieve the required NOx level of under 9 ppm. Theretrofit was motivated by the reduced operating costs of DLN, which make it a cost-effectiveapproach to reduce NOx.

IV-34
Project ExecutionThe original steam injection system and SCR were installed when the turbines were put in
place in 1995. The DLN technology was retrofitted on the facility only a few years later and was inservice in 1998.
ExperienceOperating experience with the turbines is four years and operating experience with the DLN
technology is for one to two years. During this time there have not been any exceedances of theFederal NSPS for NOx emissions from gas turbines (40CFR60 subpart GG). There has been oneforced outage per turbine due to pluggage of ammonia injection (for the SCR) and about 24 lostoperating hours per turbine. There is no additional labor associated with operating the units withDLN.
Experience and PerformanceMonths in operation (as of Oct ’99) 47-48, depending on turbine
Months since DLN retrofit 18Increased parasitic loads None
Change in turbine efficiency DLN improved efficiencyNOx guarantee, ppm 9 ppmNOx guarantee met? Yes
Number of NOx exceedances None (Federal NSPS)Number of forced outages 1 on each turbine from SCR ammonia
injector pluggingTotal lost operating hours About 24 on each turbine
Cost EffectivenessPG&E Generating did not provide capital or operating cost data.
C.6 Case Study GT-6 PG&E Generating, Pittsfield Generating Plant, Pittsfield, Massachusetts
Company Contact: Paula Hamel
Background and Technology SelectionPG&E Generating owns and operates a power plant in Pittsfield, MA. The facility is
equipped with three Combined Cycle Gas Turbines (CCGTs), each with a 40 MW gas turbine. Thefacility also provides cogeneration steam. The turbines primarily fire natural gas and have #2 fueloil available as a back up. The facility was placed in service in 1990 and was required to meet aNOx emission rate of 16.2 pounds per hour. The CCGT’s were originally equipped with steaminjection and SCR (using aqueous ammonia) in order to meet the emission limit.

IV-35
General Statistics on Pittsfield Generating PlantGas Turbine Output 3 x 40 MW
Heat Recovery Yes, HRSGFuel(s) Natural Gas
#2 Fuel Oil backupYear that turbines were placed in service 1990
Capacity Factor Not availableControlled NOx < 16.2 lb/hr
Project ExecutionThe steam injection system and SCR were installed when the turbines were placed in service
in 1990.
ExperienceOperating experience is about 113 months (as of September 1999). During this time there
have not been any exceedances of the Federal NSPS for NOx emissions from gas turbines (40CFR60subpart GG). There were two forced outages per turbine due to plugging of ammonia injection (forthe SCR) and about 12 total lost operating hours per turbine.
Experience and PerformanceMonths in operation (as of September ’99) 113 per turbine
NOx without steam injection with SCR 35 ppmNOx with steam injection and with SCR 7 ppm
CO with steam injection 2-4 ppmSteam flow : Fuel Flow (mass basis) 1.12 : 1
NOx guarantee, ppm 9 ppmNOx guarantee met? Yes
Number of NOx exceedances None (Federal NSPS)Number of forced outages 2 on each turbine from SCR ammonia
injector pluggingTotal lost operating hours About 12 on each turbine
Cost EffectivenessPG&E Generating did not provide capital or operating cost data.

IV-36
C.7 Case Study GT-7, Tennessee Gas Pipeline, Lockport, New York
Operator Contact - Sam Clowney (713) 420-3968
Background and Technology SelectionTennessee Gas Pipeline owns and operates natural gas transmission facilities in the Northeast
US. The fleet of engines includes turbines and reciprocating engines with integral compressors.Among the equipment located in Lockport, NY, are four Solar Centaur turbine that drivecompressors. These simple-cycle gas-turbine engines are rated at 4500 hp. The units were subjectto RACT review requirements that took effect due to the units producing greater than 500 hp.
The units operate as needed to meet gas transmission demands.
TGP evaluated several technologies to comply with New York State Department ofEnvironmental Conservation (NYSDEC) presumptive RACT levels of 50 ppm for gas turbines andselected Dry Low NOx Combustor technology to achieve the presumptive NOx RACT. This wasthe approach required by the State of New York’s RACT compliance plans.
General Statistics on Tennessee Gas Pipeline, Lockport, NYTurbine Type Solar Centaur simple-cycle compressor drive
HP 4 x 4500 hpHeat Recovery None
Fuel(s) Natural GasBaseline (uncontrolled) NOx 87 ppm (nominal OEM guarantee)
Controlled NOx 50 ppm (guarantee)
Project ExecutionThe technology was retrofitted onto the turbines in time to satisfy RACT requirements. The
cost of this retrofit, including commissioning, was $2.5 million. Three of the turbines cost $600,000each to retrofit, and the oldest turbine cost $700,000 to retrofit. These project costs includeextensive engineering and company overhead costs. Project execution details were not available.
ExperienceThe facility has been operating since 1995 with the Dry Low NOx retrofit. During that time,
the emissions of the turbines have been maintained under the required permit level and within themanufacturer's guaranteed levels.

IV-37
Experience and PerformanceMonths in operation (as of Oct ’99) 48
Increased parasitic loads NoneChange in turbine efficiency None
Project Cost $600,000 to $700,000 per turbineEstimated add’l fixed O&M See cost - effectiveness Calculations
Add’l man-hours of labor 5 days/turbine-yr.NOx guarantee, ppm 50 ppmNOx guarantee met? Yes
Combustor Life prior to DLN Insufficient dataCombustor Life after DLN Insufficient dataNumber of forced outages 0Total lost operating hours 0
Cost EffectivenessCost effectiveness spreadsheets from Tennessee Gas Pipeline appear on the following page.

IV-38
Lockport, NYSolar Centaur
DryLoNOx Cost Effectiveness
Cost Basis Value Reference Total Capital Investment (TCI) TCI $700,000 Project Cost
Basis Value Reference Operating Labor Unit Cost Hourly rate $30.00 Industry Average Labor Required 1 hr/week 52 Estimate Total Cost ($/yr) $1,560 Calculation
Supervisor Labor Labor Required 15% Operating Labor $234 OAQPS Total Cost ($/yr) $234 Calculation
Maintenance Unit Cost Hourly rate $36.00 Industry Average Labor Required 80 hrs/year 80 Estimate Maintenance Cost $2,880 Calculation Material Cost 100% of Maintenance Cost $2,880 Calculation Total Cost ($/yr) $5,760 Calculation
Indirect Overhead 60% of O&M Costs $4,532 OAQPS Administration 2% of TCI $14,000 OAQPS Insurance 1% of TCI $7,000 OAQPS Cost Recovery Factor (CRF) 10 Years, 8% Interest 0.149 OAQPS Capital Recovery TCI x CRF $104,321 Calculation Total Indirect Costs ($/yr) $129,853 Calculation
Base Case Emission Rate Uncontrolled @ 87 ppm; lb/hr 16.800 Solar Guarantee
NOx Emission rateDryLONOx Guarantee @ 50 ppm;
lb/hr 10.200 Permit Limit
Total NOx Controlled (ton/yr) Emission Differential; tpy 28.9 Calculation
Total Annual Cost ($/yr) Summation $137,407 Calculation
$4,753 COST EFFECTIVENESS ($/ton)

IV-39
D. Internal Combustion Engine Case Studies
D.1 Case Study IC-1, SYCOM Enterprises, Linden, New Jersey
Operator Contact - Donald Moore
Background and Technology SelectionSYCOM Enterprises is an energy services firm that operates a facility for Buckeye Pipeline’s
fuel pumping station in Linden, NJ. This pumping facility, which was placed in service in January1997, is powered by three 3130-hp, gas-fired Waukesha engines. These gas-fired engines were usedto replace the existing electrically driven pumps, which are more expensive to operate. As a newinternal combustion engine facility, the engines were subject to New Jersey's strict environmentalpermitting requirements. The requirements of the state of New Jersey made it necessary to installSelective Catalytic Reduction technology for reduction of NOx.
General Statistics on SYCOM Enterprise’s Linden, NJ Engine FacilityEngine Type Waukesha, reciprocating
HP 3 x 3130 hpOperating since January 1997 (2 ½ years)Heat Recovery None
Fuel(s) Natural GasCapacity Factor ~92%
Baseline (uncontrolled) NOx Not AvailableControlled NOx 50 ppm
The units operate nearly continuously, with shut downs for periodic maintenance or duringchanges in pumping operations. Each engine typically operates 18 or more hours per day.
Project ExecutionThe SCR was installed as a part of a packaged unit with the engine. Each catalyst reactor has
two layers of NOx reducing catalyst and a downstream catalyst for removing CO. Aqueousammonia is used for the SCR reagent. Each of the three engines is served by its own SCR system.There is a common aqueous ammonia storage system for all three SCR’s.
ExperienceThe facility has been operating since January 1997. The system has met its guaranteed NOx
emissions level. These engines are not equipped with Continuous Emissions Monitors. Emissionsare checked by a monthly emissions test.
The only significant operating difficulties have been: 1) occasional plugging of the ammoniainjector by rust flakes from upstream piping, which prevents effective and efficient SCR operationuntil the problem is corrected; 2) failure of ammonia pumps, that have been since repaired; 3) and

IV-40
the need to clean the catalyst due to deposition of lubricants from the engine during start-up cycles.The increased cost due to the injector plugging is estimated at about $3,000-4,000 per year and thecatalyst cleaning has been necessary twice on each of two of the engines and once on the third.Since the catalyst supplier provided for this, the additional cost due to this primarily results fromhaving to own a spare catalyst layer while the other layer is off for cleaning.
Experience and PerformanceMonths in operation (as of July ’99) 30
Increased parasitic loads UnknownChange in engine efficiency Unknown
Reagent cost per year $14,000Cost of service agreement
for SCR$78,000/year
(equal to $2166/month for each engine)Cost of additional testing $9,600/year
NOx guarantee, ppm 50 ppmNOx guarantee met? Yes
Catalyst washes Five total on three engines -Two for each of two engines
Once for the third
Cost EffectivenessSYCOM Enterprises was unable to provide the capital cost of the SCR system because it was
provided as a part of the engine package and was not a separate line item on the contract. Sincecapital cost is a major determinant of the cost effectiveness, it is not possible to determine this valuewithout more information.
D.2 Case Study IC-2, Duke Energy, Stony Point, New York
Operator Contact - Mike Taylor, (617) 560-1456
Background and Technology SelectionDuke Energy owns natural gas transmission facilities in the Northeast US. The fleet of
engines includes turbines and reciprocating engines with integral compressors. Among theequipment located in Stony Point, NY are four Clark TLA8 engines. These are two-strokereciprocating gas engines, 2700 hp each.
The engines are about 40 years old, manufactured well before NOx requirements were inplace. As a part of New York’s Reasonably Available Control Technology (RACT) requirements, itwas necessary to reduce NOx emissions to below 5.1 gm/hp-hr of NOx in 1995.
The units operate as needed to meet gas transmission demands.
High-energy ignition was implemented in order to achieve the necessary NOx reductions.Although other approaches were considered, the primary reason for selection of this technology wasthat it was the most cost-effective approach.

IV-41
General Statistics on Duke Energy Stony Point IC EnginesEngine Type Clark TLA8, two-stroke, reciprocating
HP 4 x 2700 hpFacility age ~ 40 years
Heat Recovery NoneFuel(s) Natural Gas
Capacity Factor Not AvailableBaseline (uncontrolled) NOx 10.08 gm/hp-hr (permit)
Controlled NOx 5.1 gm/hp-hr (permit)
Project ExecutionThe technology was retrofitted onto the engines in 1994, in time to satisfy RACT
requirements. The cost of these retrofits, including commissioning, was $304,000. Personnel thatmanaged the project are no longer with the company, so project execution details are not available.
ExperienceThe facility has been operating since 1994 with the high-energy ignition upgrade. During
that time, the emissions of the engines have been maintained under the required level. In the roughly60 months of operation, the NOx reduction system has resulted in six engine outages and a total of24 lost operating hours. Roughly two man-hours per week of additional service are needed tomaintain the engines.
Experience and PerformanceMonths in operation (as of Aug ’99) 60
Increased parasitic loads NoneChange in engine efficiency None
Project Cost $76,000 per engineEstimated add’l fixed O&M see Cost Effectiveness
CalculationsAdd’l man-hours of labor 2 hours/week per engineControlled NOx emissions 5.1 gm/hp-hrNumber of forced outages 6Total lost operating hours 24
Cost EffectivenessThe cost effectiveness spreadsheets from Duke Energy appear on the following page.

IV-42
Stony Point, NYClark TLA8
High Energy Ignition System Cost Effectiveness
Capital Costs Basis Value Units ReferenceTotal Capital Investment (TCI) TCI $76,000 $/engine Project Cost
Total Capital Costs $76,000 $ Calculation
Operating Costs Basis Value Units ReferenceUnit Cost Hourly Rate $30 $/hr Industry AverageOperating Labor Required 2 hrs/wk/engine 104 hrs/yr. ExperienceOperating Labor Cost $3,120 $/yr. CalculationSupervisor Labor Cost 15% of Operating Labor $468 $/yr. OAQPS
Total Operating Costs $3,588 $/yr. CalculationMaintenance Costs Basis Value Units Reference
Unit Cost Hourly Rate $36 $/hr Industry AverageMaintenance Labor Required 62 hrs/yr./engine 62 hrs/yr. EstimateMaintenance Labor Cost $2,232 $/yr. CalculationMaterial Cost 100% of Maintenance Cost $2,232 $/yr. OAQPS
Total Maintenance Costs $4,464 $/yr. CalculationTotal O&M Costs $8,052 $/yr. Calculation
Indirect Costs Basis Value Units ReferenceOverhead 60% of O&M Costs $4,831 $/yr. OAQPSAdministration 2% of TCI $1,520 $/yr. OAQPSInsurance 1% of TCI $760 $/yr. OAQPSCost Recovery Factor (CRF) 10 yrs at 8% 0.149 n.d. OAQPSCapital Recovery TCI x CRF $11,326 $/yr. OAQPS
Total Indirect Costs $18,437 $/yr. Calculation
Total Annual Costs O&M Costs + Indirect Cost $26,489 $/yr. Calculation
NOX Emission Reduction Basis Value Units Reference
Baseline NOX Emissions Uncontrolled (10.08 g/hp-hr) 60.00 lb/hr Permit LimitControlled NOX Emissions Controlled (5.1 g/hp-hr) 30.36 lb/hr Permit LimitNOX Emission Reduction Emissions Differential 129.84 tpy Calculation
Cost Effectiveness $204 $/ton Calculation
D.3 Case Study IC-3, Duke Energy, Burrillville, Rhode Island
Operator Contact - Mike Taylor, (617) 560-1456
Background and Technology SelectionDuke Energy owns natural gas transmission facilities in the Northeast US. The fleet of
engines includes turbines and reciprocating engines with integral compressors. Among theequipment located in Burrillville, RI are three Clark TLA8 engines. These are two strokereciprocating gas engines, 2700 hp each.
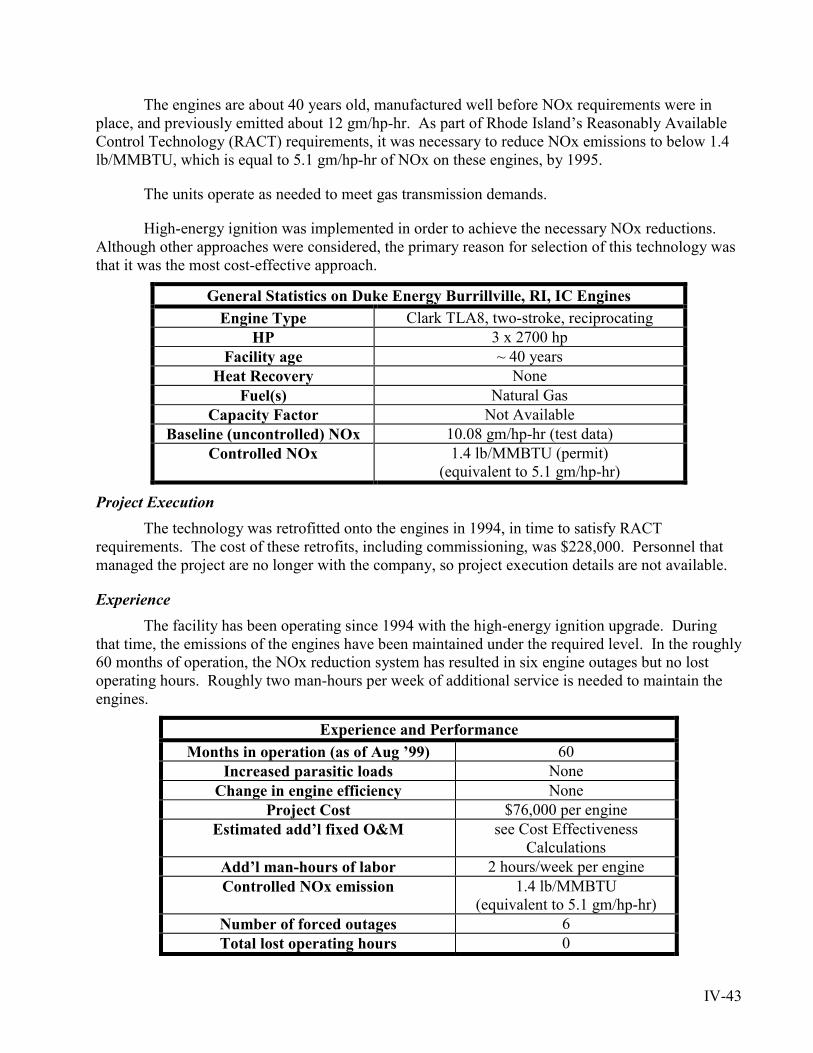
IV-43
The engines are about 40 years old, manufactured well before NOx requirements were inplace, and previously emitted about 12 gm/hp-hr. As part of Rhode Island’s Reasonably AvailableControl Technology (RACT) requirements, it was necessary to reduce NOx emissions to below 1.4lb/MMBTU, which is equal to 5.1 gm/hp-hr of NOx on these engines, by 1995.
The units operate as needed to meet gas transmission demands.
High-energy ignition was implemented in order to achieve the necessary NOx reductions.Although other approaches were considered, the primary reason for selection of this technology wasthat it was the most cost-effective approach.
General Statistics on Duke Energy Burrillville, RI, IC EnginesEngine Type Clark TLA8, two-stroke, reciprocating
HP 3 x 2700 hpFacility age ~ 40 years
Heat Recovery NoneFuel(s) Natural Gas
Capacity Factor Not AvailableBaseline (uncontrolled) NOx 10.08 gm/hp-hr (test data)
Controlled NOx 1.4 lb/MMBTU (permit)(equivalent to 5.1 gm/hp-hr)
Project ExecutionThe technology was retrofitted onto the engines in 1994, in time to satisfy RACT
requirements. The cost of these retrofits, including commissioning, was $228,000. Personnel thatmanaged the project are no longer with the company, so project execution details are not available.
ExperienceThe facility has been operating since 1994 with the high-energy ignition upgrade. During
that time, the emissions of the engines have been maintained under the required level. In the roughly60 months of operation, the NOx reduction system has resulted in six engine outages but no lostoperating hours. Roughly two man-hours per week of additional service is needed to maintain theengines.
Experience and PerformanceMonths in operation (as of Aug ’99) 60
Increased parasitic loads NoneChange in engine efficiency None
Project Cost $76,000 per engineEstimated add’l fixed O&M see Cost Effectiveness
CalculationsAdd’l man-hours of labor 2 hours/week per engineControlled NOx emission 1.4 lb/MMBTU
(equivalent to 5.1 gm/hp-hr)Number of forced outages 6Total lost operating hours 0

IV-44
Cost EffectivenessThe cost effectiveness spreadsheets from Duke Energy appear below.
Burrillville, RIClark TLA8
High Energy Ignition System Cost Effectiveness
Capital Costs Basis Value Units ReferenceTotal Capital Investment (TCI) TCI $76,000 $/engine Project Cost
Total Capital Costs $76,000 $ Calculation
Operating Costs Basis Value Units ReferenceUnit Cost Hourly Rate $30 $/hr Industry AverageOperating Labor Required 2 hrs/wk/engine 104 hrs/yr. ExperienceOperating Labor Cost $3,120 $/yr. CalculationSupervisor Labor Cost 15% of Operating Labor $468 $/yr. OAQPS
Total Operating Costs $3,588 $/yr. CalculationMaintenance Costs Basis Value Units Reference
Unit Cost Hourly Rate $36 $/hr Industry AverageMaintenance Labor Required 62 hrs/yr./engine 62 hrs/yr. EstimateMaintenance Labor Cost $2,232 $/yr. CalculationMaterial Cost 100% of Maintenance Cost $2,232 $/yr. OAQPS
Total Maintenance Costs $4,464 $/yr. CalculationTotal O&M Costs $8,052 $/yr. Calculation
Indirect Costs Basis Value Units ReferenceOverhead 60% of O&M Costs $4,831 $/yr. OAQPSAdministration 2% of TCI $1,520 $/yr. OAQPSInsurance 1% of TCI $760 $/yr. OAQPSCost Recovery Factor (CRF) 10 yrs at 8% 0.149 n.d. OAQPSCapital Recovery TCI x CRF $11,326 $/yr. OAQPS
Total Indirect Costs $18,437 $/yr. Calculation
Total Annual Costs O&M Costs + Indirect Cost $26,489 $/yr. Calculation
NOX Emission Reduction Basis Value Units Reference
Baseline NOX Emissions Uncontrolled (10.08 g/hp-hr) 60.00 lb/hr Test DataControlled NOX Emissions Controlled (5.1 g/hp-hr) 30.36 lb/hr Permit LimitNOX Emission Reduction Emissions Differential 129.84 tpy Calculation
Cost Effectiveness $204 $/ton Calculation

IV-45
D.4 Case Study IC-4, Duke Energy, Cromwell, Connecticut
Operator Contact - Mike Taylor, (617) 560-1456
Background and Technology SelectionDuke Energy owns natural gas transmission facilities in the Northeast US. The fleet of
engines includes turbines and reciprocating engines with integral compressors. Among theequipment located in Cromwell, CT are six Cooper GMWA8 engines. These are two strokereciprocating gas engines, 2000 hp each.
The engines are about 42 years old, manufactured well before NOx requirements were inplace, and previously emitted NOx at a rate of 14.53 gm/hp-hr. As part of Connecticut’s ReasonablyAvailable Control Technology (RACT) requirements, it was necessary to reduce NOx emissions tobelow 8.72 gm/hp-hr of NOx by 1995.
The units operate as needed to meet gas transmission demands.
High-energy ignition was implemented in order to achieve the necessary NOx reductions.Although other approaches were considered, the primary reason for selection of this technology wasthat it was evaluated as the most cost-effective approach.
General Statistics on Duke Energy Cromwell, CT, IC EnginesEngine Type Cooper GMWA8, two-stroke, reciprocating
HP 6 x 2000 hpFacility age ~ 42 years
Heat Recovery NoneFuel(s) Natural Gas
Capacity Factor Not AvailableBaseline (uncontrolled) NOx 14.53 gm/hp-hr (permit)
Controlled NOx 8.72 gm/hp-hr (permit)
Project ExecutionThe technology was retrofitted onto the engines in 1994, in time to satisfy RACT
requirements. The cost of these retrofits, including commissioning, was $145,000. Personnel thatmanaged the project are no longer with the company, so project execution details are not available.
ExperienceThe facility has been operating since 1994 with the high-energy ignition upgrade. During
that time, the emissions of the engines have been maintained under the required level. In the roughly60 months of operation, the NOx reduction system has resulted in six engine outages and a total of12 lost operating hours. Roughly two man-hours per week of additional service is needed tomaintain the engines.

IV-46
Experience and PerformanceMonths in operation (as of Aug ’99) 60
Increased parasitic loads NoneChange in engine efficiency None
Project Cost $24,167 per engineEstimated add’l fixed O&M $8,000/year
Add’l man-hours of labor 2/weekControlled NOx 8.72 gm/hp-hr
Number of forced outages 6Total lost operating hours 12
Cost EffectivenessThe cost effectiveness spreadsheets from Duke Energy appear on the following page.

IV-47
Cromwell, CTCooper GMWA8
High Energy Ignition System Cost Effectiveness
Capital Costs Basis Value Units ReferenceTotal Capital Investment (TCI) TCI $24,167 $/engine Project Cost
Total Capital Costs $24,167 $ Calculation
Operating Costs Basis Value Units ReferenceUnit Cost Hourly Rate $30 $/hr Industry AverageOperating Labor Required 2 hrs/wk/engine 104 hrs/yr. ExperienceOperating Labor Cost $3,120 $/yr. CalculationSupervisor Labor Cost 15% of Operating Labor $468 $/yr. OAQPS
Total Operating Costs $3,588 $/yr. CalculationMaintenance Costs Basis Value Units Reference
Unit Cost Hourly Rate $36 $/hr Industry AverageMaintenance Labor Required 62 hrs/yr./engine 62 hrs/yr. EstimateMaintenance Labor Cost $2,232 $/yr. CalculationMaterial Cost 100% of Maintenance Cost $2,232 $/yr. OAQPS
Total Maintenance Costs $4,464 $/yr. CalculationTotal O&M Costs $8,052 $/yr. Calculation
Indirect Costs Basis Value Units ReferenceOverhead 60% of O&M Costs $4,831 $/yr. OAQPSAdministration 2% of TCI $483 $/yr. OAQPSInsurance 1% of TCI $242 $/yr. OAQPSCost Recovery Factor (CRF) 10 yrs at 8% 0.149 n.d. OAQPSCapital Recovery TCI x CRF $3,602 $/yr. OAQPS
Total Indirect Costs $9,158 $/yr. Calculation
Total Annual Costs O&M Costs + Indirect Cost $17,210 $/yr. Calculation
NOX Emission Reduction Basis Value Units Reference
Baseline NOX Emissions Uncontrolled (14.53 g/hp-hr) 64.07 lb/hr Permit LimitControlled NOX Emissions Controlled (8.72 g/hp-hr) 38.45 lb/hr Permit LimitNOX Emission Reduction Emissions Differential 112.20 tpy Calculation
Cost Effectiveness $153 $/ton Calculation
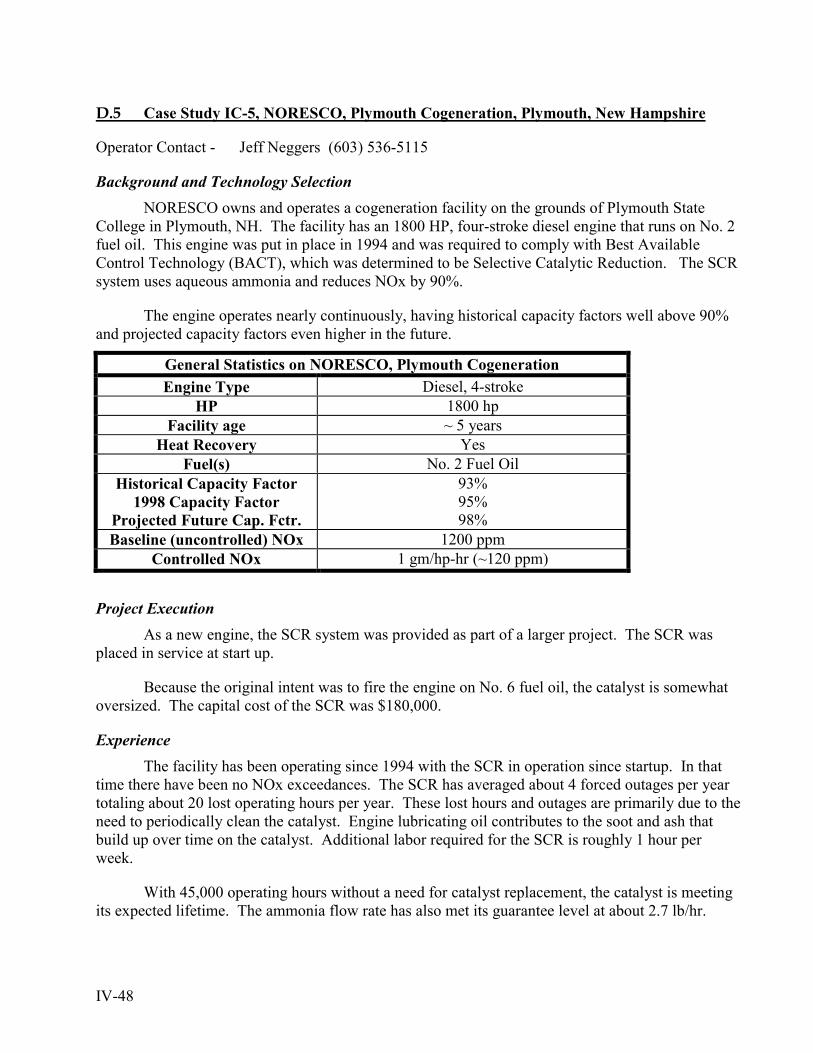
IV-48
D.5 Case Study IC-5, NORESCO, Plymouth Cogeneration, Plymouth, New Hampshire
Operator Contact - Jeff Neggers (603) 536-5115
Background and Technology SelectionNORESCO owns and operates a cogeneration facility on the grounds of Plymouth State
College in Plymouth, NH. The facility has an 1800 HP, four-stroke diesel engine that runs on No. 2fuel oil. This engine was put in place in 1994 and was required to comply with Best AvailableControl Technology (BACT), which was determined to be Selective Catalytic Reduction. The SCRsystem uses aqueous ammonia and reduces NOx by 90%.
The engine operates nearly continuously, having historical capacity factors well above 90%and projected capacity factors even higher in the future.
General Statistics on NORESCO, Plymouth CogenerationEngine Type Diesel, 4-stroke
HP 1800 hpFacility age ~ 5 years
Heat Recovery YesFuel(s) No. 2 Fuel Oil
Historical Capacity Factor1998 Capacity Factor
Projected Future Cap. Fctr.
93%95%98%
Baseline (uncontrolled) NOx 1200 ppmControlled NOx 1 gm/hp-hr (~120 ppm)
Project ExecutionAs a new engine, the SCR system was provided as part of a larger project. The SCR was
placed in service at start up.
Because the original intent was to fire the engine on No. 6 fuel oil, the catalyst is somewhatoversized. The capital cost of the SCR was $180,000.
ExperienceThe facility has been operating since 1994 with the SCR in operation since startup. In that
time there have been no NOx exceedances. The SCR has averaged about 4 forced outages per yeartotaling about 20 lost operating hours per year. These lost hours and outages are primarily due to theneed to periodically clean the catalyst. Engine lubricating oil contributes to the soot and ash thatbuild up over time on the catalyst. Additional labor required for the SCR is roughly 1 hour perweek.
With 45,000 operating hours without a need for catalyst replacement, the catalyst is meetingits expected lifetime. The ammonia flow rate has also met its guarantee level at about 2.7 lb/hr.

IV-49
Instrumentation with brass fittings located at the SCR inlet was found to fail rapidly due tocorrosion from ammonia. Downstream equipment was unaffected due to the much lower ammoniaconcentration.
Experience and PerformanceMonths in operation (as of Sept ’99) ~ 60
Accumulated Operating Hours 45,000Change in engine efficiency Increased back pressure, up to
maximum of 12” H2OProject Cost $180,000 (SCR only)
Estimated additional fixed O&M $2,000/yearEstimated additional variable O&M $21,000/yr
Additional man-hours of labor 1/weekCatalyst Replacement None yet
Controlled NOx 120 ppm(90% reduction, all loads)
Number of forced outages ~ 4/ yr.Total lost operating hours ~20/yr
Cost EffectivenessA detailed cost analysis for cost effectiveness was not done by NORESCO. However, the
SCR has facilitated cost savings in other aspects of the overall facility operation. Because thisengine is operated almost continuously and controls to a low level, another engine at the facility isnot required to install NOx reduction equipment. Moreover, the high capacity factor of the enginepermits it’s HRSG to provide a significant portion of the university’s heating load without anyadditional fuel being spent. Thus, this cogeneration project has resulted in several benefits,including environmental benefits.
D.6 Case Study IC-6, Tennessee Gas Pipeline, Mercer, Pennsylvania
Operator Contact - Sam Clowney (713) 420-3968
Background and Technology SelectionTennessee Gas Pipeline owns and operates natural gas transmission facilities in the Northeast
US. The fleet of engines includes turbines and reciprocating engines with integral compressors.Among the equipment located in Mercer, PA are six Cooper GMV-10 engines. These are two-strokereciprocating gas engines, site rated at 1100 hp each.
As part of Pennsylvania’s Reasonably Available Control Technology (PA RACT)requirements, it was necessary to reduce NOx emissions since the units produced greater than 500hp.

IV-50
TGP evaluated several technologies and chose parametric control (retarded ignition timing)as the cost-effective option for these engines in accordance with PA RACT regulations.
General Statistics on Tennessee Gas Pipeline - Mercer PA IC engineEngine Type Cooper GMV-10, two-stroke, reciprocating
HP 6 x 1100 hpHeat Recovery None
Fuel(s) Natural GasBaseline (uncontrolled) NOx 10 gm/hp-hr
Controlled NOx 9 gm/hp-hr
The units operate as needed to meet gas transmission demands.
Project ExecutionThe technology was retrofitted onto the engines in time to satisfy RACT requirements. The
cost of this retrofit, including commissioning, was $4000 per engine. The project was implementedquickly, being a relatively minor change.
ExperienceThe facility has been operating since 1995 with the ignition timing retard. During that time,
the emissions from the engines have been maintained at around 9 gm/hp-hr. There is additionalmaintenance due to increased carbon buildup in the engine with the retarded timing.
Experience and PerformanceMonths in operation (as of Oct ’99) 54
Increased fuel consumption See Cost effectiveness calculationsProject Cost See Cost effectiveness calculations
Estimated add’l maintenance See Cost effectiveness calculationsAdd’l cost of testing See Cost effectiveness calculations
Controlled NOx emissions 9 gm/hp-hrNumber of forced outages Insufficient DataTotal lost operating hours 0
Cost EffectivenessCost effectiveness spreadsheets from Tennessee Gas appear on the following page.

IV-51
Mercer, PACooper GMV-10
LEC Cost Effectiveness
Cost Basis Value Reference Total Capital Investment (TCI) TCI $4,000 Project Cost
Basis Value Reference Operating Cost Unit Cost Hourly Rate $30.00 Labor Required 60 hrs/yr 60 Total Cost ($/yr) $1,800 Calculation
Supervisor Labor Labor Required 15% Operating Labor $270 OAQPS Total Cost ($/yr) $270 Calculation
Maintenance Unit Cost Hourly rate $36.00 Industry Average Labor Required 80 hrs/year 80 Estimate Maintenance Cost $2,880 Calculation
Material Cost100% of Maintenance Cost + Added
Fuel Cost $7,880 Calculation Total Cost ($/yr) $10,760 Calculation
Indirect Overhead 60% of O&M Costs $7,698.00 OAQPS Administration 2% of TCI $80.00 OAQPS Insurance 1% of TCI $40.00 OAQPS Cost Recovery Factor (CRF) 10 Years, 8% Interest 0.149 OAQPS Capital Recovery TCI x CRF $596 Calculation Total Indirect Costs ($/yr) $8,414 Calculation
Base Case Emission Rate Uncontrolled; lb/hr 35.110 Test Data NOx Emission rate Controlled; lb/hr 31.600 Permit Limit
Total NOx Controlled (ton/yr) Emission Differential; tpy 15.4 Calculation
Total Annual Cost ($/yr) Summation $21,244 Calculation
$1,382COST EFFECTIVENESS ($/ton)

IV-52
D.7 Case Study IC-7, Tennessee Gas Pipeline, Syracuse, New York
Operator Contact - Sam Clowney (713) 420-3968
Background and Technology SelectionTennessee Gas Pipeline owns and operates natural gas transmission facilities in the Northeast
US. The fleet of engines includes turbines and reciprocating engines with integral compressors.Among the equipment located in Syracuse, NY are two Clark TLA-10 engines. These are two-stroke reciprocating gas engines, 3400 hp each.
As part of New York’s Reasonably Available Control Technology (RACT) requirements, itwas necessary to reduce NOx emissions since the units produced greater than 500 hp.
TGP evaluated several technologies to comply with NYSDEC presumptive RACT levels of 3grams/BHP-hr for reciprocation engines and selected OEM low-emission combustion kits to achievethe presumptive NOx RACT. This was the approach required by the State of New York’s RACTcompliance plans.
General Statistics on Tennessee Gas Pipeline - Syracuse, NY IC EnginesEngine Type Clark TLA-10, two-stroke, reciprocating
HP 2 x 3400 hpHeat Recovery None
Fuel(s) Natural GasBaseline (uncontrolled) NOx 13 gm/hp-hr
Controlled NOx 3 gm/hp-hr
The units operate as needed to meet gas transmission demands.
Project ExecutionThe technology was retrofitted onto the engines in time to satisfy RACT requirements. (With
extension granted by state) The cost of this retrofit, including commissioning, was $1,164,000 perengine.
ExperienceThe facility has been operating since 1995 with the low emission combustion retrofits.
During that time, the emissions of the engines have been maintained at 3 gm/hp-hr. There have beensome maintenance difficulties associated with check valves to Pre-Combustion Chambers.

IV-53
Experience and PerformanceMonths in operation (as of Oct ’99) 54
Project Cost $1,164,000 per engineControlled NOx emissions 3 gm/hp-hrNumber of forced outages Insufficient DataTotal lost operating hours Insufficient Data
Cost EffectivenessSpreadsheet from Tennessee Gas detailing costs follows.
Syracuse, NYClark TLA-8
LEC Cost EffectivenessCost Basis Value Reference
Total Capital Investment (TCI) TCI $1,164,000 Actual Project Cost
Basis Value Reference Operating Labor Unit Cost Hourly rate $30.00 Industry Average Labor Required 1 hr/shift, 3 shifts/day 1,095 Estimate Total Cost ($/yr) $32,850 Calculation
Supervisor Labor Labor Required 15% Operating Labor $4,928 OAQPS Total Cost ($/yr) $4,928 Calculation
Maintenance Unit Cost Hourly rate $36.00 Industry Average Labor Required 20 hrs/month 240 Estimate Maintenance Cost $8,640 Calculation Material Cost 100% of Maintenance Cost $8,640 Calculation Total Cost ($/yr) $17,280 Calculation
Indirect Overhead 60% of O&M Costs $33,035 OAQPS Administration 2% of TCI $23,280 OAQPS Insurance 1% of TCI $11,640 OAQPS Cost Recovery Factor (CRF) 10 Years, 8% Interest 0.149 OAQPS Capital Recovery TCI x CRF $173,470 Calculation Total Indirect Costs ($/yr) $241,425 Calculation
Base Case Emission Rate Uncontrolled; lb/hr 97.440 Test Data NOx Emission rate Controlled; lb/hr 22.500 Permit Limit
Total NOx Controlled (ton/yr) Emission Differential; tpy 328.2 Calculation Total Annual Cost ($/yr) Summation $296,482 Calculation
$903 COST EFFECTIVENESS ($/ton)

IV-54
D.8 Case Study IC-8, Tennessee Gas Pipeline, Coudersport, Pennsylvania
Operator Contact - Sam Clowney (713) 420-3968
Background and Technology SelectionTennessee Gas Pipeline owns and operates natural gas transmission facilities in the Northeast
US. The fleet of engines includes turbines and reciprocating engines with integral compressors.Among the equipment located in Coudersport, PA are ten KVG-412 engines. These are four-strokereciprocating gas engines, 1,320 hp each.
TGP evaluated several technologies and chose Non Selective Catalytic Reduction (NSCR)with retarded ignition timing as the cost-effective option for these engines in accordance with PARACT regulations.
General Statistics on Tennessee Gas Pipeline – Coudersport, PA, IC EngineEngine Type KVG-412, four-stroke, reciprocating
HP 10 x 1320 hpHeat Recovery None
Fuel(s) Natural GasBaseline (uncontrolled) NOx 20 gm/hp-hr
Controlled NOx 3 gm/hp-hr
The units operate as needed to meet gas transmission demands.
Project ExecutionThe technology was retrofitted onto the engines in time to satisfy RACT requirements. The
cost of this retrofit, including commissioning, was $150,000 per engine.
ExperienceThe facility has been operating since 1995 with the NSCR. During that time, the emissions
of the engines have been maintained at 3 gm/hp-hr. Additional maintenance and testing is required,associated with the catalyst and the fuel/air ratio controls.
Experience and PerformanceMonths in operation (as of Oct ’99) 54
Project Cost $183,000 per engineEstimated add’l maintenance See cost effectiveness calc.
Add’l cost of testing See cost effectiveness calc.NOx emissions 3 gm/hp-hr
Number of forced outages <20Total lost operating hours <1000

IV-55
Cost EffectivenessCost effectiveness spreadsheets from Tennessee Gas follow.
Coudersport, PAIngersoll Rand KVG-412NSCR Cost Effectiveness
Cost Basis Value Reference Total Capital Investment (TCI) TCI $183,000 Actual Project Cost
Basis Value Reference Operating Labor Unit Cost Hourly rate $24.00 Industry Average Labor Required 1 hr/shift, 3 shifts/day 1,095 Estimate Total Cost ($/yr) $26,280 Calculation
Supervisor Labor Labor Required 15% Operating Labor $3,942 OAQPS Total Cost ($/yr) $3,942 Calculation
Maintenance Unit Cost Hourly rate $36.00 Industry Average Labor Required 1hrs/shift, 3 shifts/day 250 Estimate Maintenance Cost $9,000 Calculation Material Cost 100% of Maintenance Cost $9,000 Calculation Testing Cost $600 Average Total Cost ($/yr) $18,600 Calculation
Indirect Overhead 60% of O&M Costs $29,293 OAQPS Administration 2% of TCI $3,660 OAQPS Insurance 1% of TCI $1,830 OAQPS Cost Recovery Factor (CRF) 10 Years, 8% Interest 0.149 OAQPS Capital Recovery TCI x CRF $27,272 Calculation Total Indirect Costs ($/yr) $62,056 Calculation
Base Case Emission Rate Uncontrolled; lb/hr 58.200 Test Data NOx Emission rate Controlled; lb/hr 8.700 Permit Limit
Total NOx Controlled (ton/yr) Emission Differential; tpy 216.8 Calculation
Total Annual Cost ($/yr) Summation $110,878 Calculation
$511COST EFFECTIVENESS ($/ton)

IV-56
E. Cement Kiln Case Studies
E.1 Case Study CK-1, California Portland Cement, Colton, California
Company Contact - John Bennett (626) 852-6261
Background and Technology SelectionCalifornia Portland Cement operates two (2) 1150 tons per day, long, dry kilns
General Statistics on California Portland Cement, Colton, CaliforniaFacility Type Two Long Dry KilnsProduction 2 x 1150 TPD
Original Fuels Coal/Coke - 97%Natural Gas - 3%
Current Fuels(BTU basis)
Coal/Coke - 88%Tires - 10 %
Nat. Gas - 2%Approx. Facility Age 35 yrs
Year NOx Reduction in Service 1998Baseline (uncontrolled) NOx 5.4 lb NOx/ton clinker
Controlled NOx 2.73 lb/ton clinker
California Portland Cement was required by the South Coast Air Quality ManagementDistrict (SCAQMD) to reduce NOx emissions at the facility. The facility previously fired onlycoal/coke and natural gas. In order to reduce emissions, California Portland Cement decided toconvert the kiln to indirect firing and mid-kiln firing with tires. Indirect Firing permits the use of aLow NOx Burner in the kiln. Firing tires mid-kiln enables the firing intensity in the primarycombustion zone to be reduced, which helps to reduce NOx.
Project ExecutionThe technology was retrofitted onto the kiln in 1998. The project took 12 months and
required a kiln shutdown of 4 weeks. The entire cost of the project, including equipment,installation and commissioning, was $7 million.
ExperienceThe facility has been operating since 1998. The modifications have not had any adverse
impact on kiln reliability. In fact it is expected that the kiln reliability should be improved with theindirect firing system because problems that may be experienced with the coal mill will not have animmediate impact on the burner operation.
If tires are added at the rate of one tire per rotation (equivalent to a fuel substitution rate onBTU basis of about 12%), the facility clinker production is reduced by about 10% To date,

IV-57
California Portland Cement has not determined a way to regain this lost capacity while operating thetire injection system.
Experience and PerformanceMonths in operation (as of Aug ’99) 10
Increased parasitic loads Neg.Project Capital Cost $7,000,000
Estimated add’l fixed O&M $250,000/yearEstimated add’l variable O&M $100,000
Approximate Baseline (uncontrolled) NOx 5.4 lb/ton clinkerControlled NOx 2.73 lb/ton clinker
% reduction ~49%Impact on Kiln reliability 10% reduction in plant production at tire
addition rate of one tire per rotation.
Cost EffectivenessThe total capital charges were $7 million and operation and maintenance costs a total of
about $350,000/yr ($250,000 fixed and $100,000 variable). The variable O&M cost is primarilyassociated with replacement of parts associated with the tire feeder and the burner tips.
E.2 Case Study CK-2, Texas Industries, Inc., Midlothian, Texas
Company Contact - Greg Mayes (972) 647 - 7058
Background and Technology SelectionTexas Industries is the largest producer of Portland Cement in Texas. One of their facilities
is located just outside of Dallas in Midlothian, TX. The facility has four long-wet kilns withcapacities of roughly 40 tons per hour each. The facility normally fires coal, combustible waste, anda small amount of natural gas. The waste is typically about one third of the heat input while the coalis typically 60% of the heat input.
Texas Industries has developed and patented the CemStarSM process, primarily as a methodto increase plant capacity (U.S. patents: 5,421,880 and 5,494,515). Although they use CemStar toimprove capacity, the Midlothian facility is equipped with Continuous Emissions Monitors and hasmonitored improvements in NOx emissions while operating with CemStar. Because of the fuelflexibility of the Midlothian plant, there is significant variability in the potential NOx emissions.Recent testing to characterize NOx emissions under well-controlled conditions generated thefollowing results.

IV-58
General Statistics on Texas Industries, Midlothian Texas, Cement PlantFacility Type Four Long-Wet KilnsProduction 4 x 40 TPH of clinker
Typical Fuels(BTU basis)
Coal - ≥50%Natural Gas ≤10 %
Waste ~33%Approx. Facility Age 39 yrs
Year that NOx reductionsystem was placed in service
1995
NOx Testing Short Term Tests Long Term TestsFuel Firing Condition Coal ~ 50%
Gas ~ 50%Waste - none
Coal ~100%Waste - none
Baseline (uncontrolled) NOx 813 pph 206 pph
Project ExecutionTXI’s Midlothian Cement Plant is where CemStar was originally developed. It is located
adjacent to TXI’s Chaparral Steel Mill, which provides the steel slag. The installation of equipmentfor CemStar (mostly, standard material handling equipment for the steel slag) required a kilnshutdown of two days. The capital cost of the equipment was $250,000 per kiln.
Although the CemStar process has been used for years at the Midlothian Plant, emphasis sofar has mostly been on capacity improvement rather than air pollution emissions improvement. Forthis reason, TXI recently conducted a series of tests under well-controlled kiln conditions tocharacterize the level of NOx reduction that CemStar provides.
ExperienceThe facility has been operating since 1961. The CemStar process has not had any adverse
impact on kiln reliability. The results of recent tests to characterize NOx emissions with and withoutCemStar yielded the results shown below.
Short-term tests were conducted over a period of a few days and the long-term tests wereconducted over a period of a few weeks for each condition. The tests were conducted at differentconditions. In both cases significant NOx reduction was demonstrated - about 42% from conditionsfiring coal and gas and about 19% when operating under all-coal conditions.

IV-59
Experience and PerformanceMonths in operation (as of Aug ’99) 50
Increased parasitic loads Neg.Increased Kiln Production Capacity ~10%
Project Capital Cost $ 1 millionEstimated add’l fixed O&M $20,000 /yr.
Estimated add’l variable O&M $10,000/yrNOx Testing Short Term Tests Long Term Tests
Fuel Firing Condition Coal ~ 50%Gas ~ 50%
Waste - none
Coal ~100%Waste - none
Uncontrolled Baseline NOx 813 pph 206 pphControlled NOx 471 pph 167 pph
Percent Reduction 42% 19%Impact on Kiln reliability No adverse impact
Cost EffectivenessThe cost of employing CemStar includes the cost of capital equipment, about $250,000 for
each kiln at the Midlothian plant. In addition, there is a running royalty fee that is based upon theusage of steel slag. For the Midlothian plant, this royalty would have added a cost of about $16 perton of additional clinker produced. Rev 12/15/99
E.3 Case Study CK-3, Blue Circle Cement, Atlanta, Georgia
Company Contact - Tia Bohannon (404) 794-1561
Background and Technology SelectionBlue Circle Cement operates two (2) 950 ton per day (TPD) long, dry kilns
General Statistics on Blue Circle Cement kilnsFacility Type Two Long Dry KilnsProduction 2 x 950 TPD
Original Fuels 70% Coal, 30% CokeFuels After Retrofit Coal/Coke 80%
Tires - 20%Approx. Facility Age 38 yrs
Year that NOx reductionsystem was placed in service
1998
Baseline (uncontrolled) NOx 510 ppmControlled NOx Currently in test phase
Blue Circle Cement decided to implement this technology to reduce NOx emissions and alsoto take advantage of fuel savings and revenue potential for receiving tires. The economic benefit of

IV-60
receiving the tires in place of purchasing coal is estimated by Blue Circle to be $916,884 per year.Other technologies that Blue Circle considered was tire-derived-fuel (chipped tires) addition to thekiln back end. The facility is equipped with CEMS.
Project ExecutionThe technology was retrofitted onto the kilns in 1999. The project took 28 weeks and
required a kiln shutdown of one week. The entire cost of the project, including equipment,installation and commissioning, was $1,495,000. At this time Blue Circle is still testing the kilns.The process will be officially put in service in the year 2000.
Blue Circle Cement Mid-Kiln Project ScheduleAward of Contract to Completion of Engineering 4 weeksAward of Contract to Completion of installation 26 weeksAward of Contract to system commissioning 28 weeksTotal weeks from Award of Contract 28 weeksTotal Required Shutdown Period for Retrofitting of Kiln 1 week
ExperienceThe facility is still being tested. Thus far, the modifications have not had any adverse impact
on product quality.
Experience and Expected PerformanceMonths in operation (as of Jan 2000) Still in testing
Project Capital Cost $1,495,000Estimated add’l fixed O&M $64,000/yearEstimated add’l labor m-h’s none
Estimated add’l variable O&M Economic benefit estimated at $916,884/yearApprox. Starting NOx 510 ppm
Expected Controlled NOx 350 ppm% reduction ~30%
Impact on product quality No adverse impact determined thus far
Cost EffectivenessThe total capital charges were $1,495,000 and fixed operation and maintenance costs a total
of about $64,000/year with an expected net benefit of $916,884/year due to fuel savings and tippingfee revenue. When Blue Circle cement evaluated this project, they used a 10-year project horizon.
E.4 Case Study CK-4, Ash Grove Cement, Foreman, Arkansas
Company Contact - Steve Bales (913) 451-8900
Background and Technology SelectionAsh Grove Cement operates one 1,300 tpd, wet kiln at this location that is the subject of this
case study. Two smaller kilns are also burning tires at this location.

IV-61
General Statistics on Ash Grove Cement kilnFacility Type One Wet KilnProduction 1,300 TPD
Original Fuels 73% Coal, 27% WasteFuels After Retrofit
(BTU basis)Coal 65%, Waste 27%, Tires - 8%
Approx. Facility Age 42 yr.Year that NOx reduction
system was placed in service1998
Baseline NOx(with process control)
~383 lb. NOx/hr
Controlled NOx(with process control & tires)
~345 lb. NOx/hr
Ash Grove Cement decided to implement mid-kiln firing primarily to take advantage of fuelsavings and revenue potential for receiving and burning tires. There is an immediate fuelreplacement of 8% (BTU basis). In addition, Ash Grove receives a tipping fee from the State ofArkansas for the tires. The facility is also equipped with a Linkman process control system that hasprovided process improvements through reduction of kiln operating variability. The facility isequipped with a CEMS. When using Linkman, a process control strategy that uses NOx as an input,a substitution of 8% of the fossil fuel with tires, reduces the NOx emission rate from 383 lb./hr to345 lb./hr. This 10% reduction of NOx is obtained by feeding one truck tire every third revolutionof the kiln.
Project ExecutionThe technology was retrofitted onto the kiln in January 1998. The entire cost of the project,
for this kiln, including equipment, installation and commissioning, was approximately $500,000.
ExperienceThe facility has been burning tires for more than 25 months. The experience with the
technology is outlined in the table below.
Performance before and after NOx based Process ControlPrior to the installation of the Linkman control method, the baseline for NOx without tires
was 845 lb./hr. NOx emissions were reduced to 550 lb./hr through mid-kiln firing of tires - a 35%reduction of NOx. The process control strategies of the Linkman process control system using NOxare primarily for the purpose of maintaining process stability and are not specifically designed tocontrol NOx. Nevertheless, NOx reduction does occur as a result of the improved process controlwith Linkman. The NOx emission level with Linkman alone without tire addition is 383 lb/hr - a55% reduction from the uncontrolled NOx emission level of 845 lb./hr. The combined technologiesof automated process control (Linkman) with mid-kiln firing of tires achieved a NOx emission levelof 345 lb./hr - a 59% reduction from the totally uncontrolled level.

IV-62
Figure IV-1 compares the frequency histogram of NOx emissions of Linkman processcontrol alone to the frequency histogram of NOx emissions of Linkman process control with mid-kiln firing of tires. As demonstrated, the average NOx emissions for the combination of Linkmanwith mid-kiln firing of tires is 10% lower than that for kiln operation with Linkman alone.
The benefits of each control strategy are shown in Figure IV-2, A-D. Figure A shows afrequency histogram of NOx emissions for the uncontrolled condition. As shown, NOx is extremelyvariable. Figure B shows the effect of mid-kiln firing of tires alone. Clearly, the highest NOxvalues are diminished in frequency, resulting in 35% reduction in average NOx emissions from theconditions of Figure A. Figure C shows the effects of the Linkman process control alone. Again,the highest NOx emissions are avoided and only the lowest NOx emissions result, providing a 55%reduction in average NOx emissions from the conditions of Figure A. Figure D shows that thecombined processes provide 59% reduction in NOx emissions from the conditions of Figure A. Thearrows show the percent reduction for each condition to provide a combined 59% reduction of NOxemissions.
Experience and Expected PerformanceMonths in operation (as of Jan 2000) 25
Project Capital Cost $500,000Estimated add’l fixed O&M $15,000/year
Estimated add’l labor man-hours One man-hour per shiftxi
Estimated add’l variable O&M Ash Grove receives a tipping fee from theState
Forced Outages from new equipment Average 10 outage per year, however thekiln is not stopped to fix the problem until
the next kiln outageLost operating hours from new equipment Typically no hour are lost
Impact on product quality No adverse impact
Cost EffectivenessThe total capital charges were $500,000 for the mid-kiln firing system, and fixed operation
and maintenance costs a total of about $15,000/year. In addition, there are fuel savings and tippingfee revenue that justified this project purely from the perspective of return on investment. NOxreduction was not the primary motivation for proceeding with the project, but it was an additionalbenefit.
xi It usually takes one man-hour to fix hung up tires or to put back tires that have fallen off the conveyer, for all threekilns.

IV-63
Figure IV-1: Nitrogen Oxide Emission Burning Tires vs. Not-Burning Tiresxii
xii There were 1,158 ½ hour average data points while burning tires and 4,595 ½ hour average data points without tires.
0
10
20
30
40
50
60
70
80
90
10055 80 10
5
130
155
180
205
230
255
280
305
330
355
380
405
430
455
480
505
530
555
580
605
630
655
680
705
NOx (Pounds per Hour)
Freq
uenc
y D
istr
ibut
ion
of N
Ox
0%
10%
20%
30%
40%
50%
60%
70%
80%
90%
100%FrequencyFrequency with TiresCumulative %Cumulative % with Tires
Average Burning Tires 345 #/hr
w/o Burning Tires 383 #/hror 10% NOx Reduction

IV-6
4
Figu
re IV
-2:
Eff
ect o
f Tir
es a
nd P
roce
ss C
ontr
ol o
n N
Ox
Em
issi
ons
0
100
200
300
400
500
600
700
800
900
1000
5011
017
023
029
035
041
047
053
059
065
071
077
083
089
095
010
1010
7011
3011
9012
5013
1013
7014
3014
90
NO
x (P
ound
s pe
r Hou
r)
Normalized Frequency Distribution of NO
0%10%
20%
30%
40%
50%
60%
70%
80%
90%
100%
Freq
uenc
yCu
mul
ativ
e %
Aver
age
Base
line 8
45 #
/hr
0
100
200
300
400
500
600
700
800
900
1000
5011
017
023
029
035
041
047
053
059
065
071
077
083
089
095
010
1010
7011
3011
9012
5013
1013
7014
3014
90
NO
x (P
ound
s pe
r Hou
r)
Normalized Frequency Distribution of NO
0%10%
20%
30%
40%
50%
60%
70%
80%
90%
100%
Freq
uenc
yCu
mul
ativ
e %
Aver
age
whi
le B
urni
ng T
ires 5
50 #
/hr
0
100
200
300
400
500
600
700
800
900
1000
5011
017
023
029
035
041
047
053
059
065
071
077
083
089
095
010
1010
7011
3011
9012
5013
1013
7014
3014
90
NO
x (P
ound
s pe
r Hou
r)
Normalized Frequency Distribution of NO
0%10%
20%
30%
40%
50%
60%
70%
80%
90%
100%
Freq
uenc
yCu
mul
ativ
e %
Ave
rage
w
/o B
urni
ng T
ires
383
#/h
r
0
100
200
300
400
500
600
700
800
900
1000
5011
017
023
029
035
041
047
053
059
065
071
077
083
089
095
010
1010
7011
3011
9012
5013
1013
7014
3014
90
NO
x (P
ound
s pe
r Hou
r)
Normalized Frequency Distribution of NO
0%10%
20%
30%
40%
50%
60%
70%
80%
90%
100%
Freq
uenc
yCu
mul
ativ
e %
Ave
rage
w
hile
Bur
ning
Tir
es 3
45 #
/hr
A.
Bas
elin
e (8
45 lb
./hr)
C.
Proc
ess C
ontr
ol (3
83 lb
./hr)
D.
Proc
ess C
ontr
ol &
Tir
es (3
45 lb
./hr)
B.
Tir
es (5
50 lb
./hr)
35%
55%
37%
10%59
.2%

IV-1
Appendixes: Worksheets for Economic Analysis
The following worksheets were prepared to analyze the cost effectiveness of various NOx controlapproaches. For each condition evaluated, there were three linked worksheets: a project data sheet, aprocess analysis sheet, and a cash flow analysis sheet. What follows are examples of cost analysisfor each source category. These examples do not include every condition analyzed in this report.The analysis shown includes the following:
1. A rigorous analysis of projected cash flows for a 15-year period analyzed on an after-taxbasis. Because an after-tax analysis is interested in the net cash flow after taxes, the tax-reducing effects of depreciation and O&M cash expenditures are considered in this analysis.Although financing cash flows (i.e., debt principal and interest payments) are shown overproject life, this is really for information purposes and does not figure into the finalcalculation of cost effectiveness. Capital and financing costs are treated in a manner typicalin capital project analysis - applying a capital recovery factor using the WACC to determinean annual capital recovery.
2. A rigorous analysis of projected cash flows for a 15-year period analyzed on a before-taxbasis. This is the same as the analysis above, except the tax-reducing effects of someexpenses (such as depreciation) are not included.
3. A less rigorous analysis (but, no less valid) that uses a simplified capital recovery approachand assesses cost on a before-tax basis.
It is important to note that the results shown in tables of Chapter III of this report are the average ofthe results of methods #2 and #3. The reader will notice in the following tables that both of theseapproaches yielded similar results in all cases, demonstrating that the less rigorous approach issatisfactory for the purpose of this report or other similar efforts.
Although the worksheets in this appendix only show cash flows for the first 3 years, analysis wasactually performed for the economic life of the project (15 years).

IV-2
Boiler Worksheets
NOx Reduction Case SpreadsheetBoiler with Selective Non Catalytic Reduction
Boiler Technical DataTarget Boiler Size (MMBTU/hr) 350Initial NOx value (lb/MMBTU) 0.45NOx reduction needed (up to 40%) 35%boiler heat rate (BTU/kWh) 12,000Outlet NOx Value 0.29
Project Economic Data# of months/year NOx reduction needed 5Capacity Factor 65%Primary Fuel Cost ($/MMBTU) $1.50Primary Fuel Escalation (%/yr.) 2.6%Cost of Urea ($/gallon) $0.95Cost of Urea ($/ton) $406.74Urea Escalation (%/yr.) 2.6%Estimated Fixed O&M in first year $25,000Labor&Fixed O&M Escalation (%/yr.) 2.6%Capital Cost ($) $775,000Cost of Equity Capital (%) 15.0%Cost of Debt (%) 7.5%Cost of Preferred Equity (%) 6.0%% financed with debt (%) 40.0%Term of debt financing (years) 15% financed with Common Equity 60.0%% financed with Preferred Equity 0.0%WACC, % 11.0%Income tax rate (%) 35.0%Projected inflation rate (%) 2.6%Evaluation period of Project (yrs) 15Property Tax rate ($/$1,000) $15.00Pretax Rate of Return (ACT document) 10.0%
Boiler SNCR Process Analysis
PlantMMBTU/hr 350lb/hr NOx reduced 55lbmole/hr NOx reduced 1Pri. Fuel Cost, $/MMBTU $1.50Pri. Fuel Cost, $/hr $525Urea Cost ($/gallon) $0.95Urea Cost ($/ton) $406.74Urea Cost ($/lbmole) $12.20Urea Utilization 40%Urea usage (lbmole/hr) 1.5Urea usage (gal/hr) 19.25Urea Cost ($/hr) $18.28Heat Rate Increase 0.50%Uncontrolled NOx 0.45Controlled NOx 0.29Capital Cost, includes license ($/kW) 775,000Fixed O&M ($/yr.) $25,000Capacity factor 0.65Months NOx reduction in service 5.00Projected Book Life, yrs 15.00Ann. NOx Red'n, tons 65

IV-3
Cash FlowsAll values shown in current dollars, except where indicated otherwise
Year0 1 2 3
Operating CostsUncontrolled fuel Cost $0 ($1,245,563) ($1,277,947) ($1,311,174)Controlled Fuel Cost $0 ($1,251,822) ($1,284,369) ($1,317,763)Urea Cost $0 ($43,365) ($44,493) ($45,650)Total Variable O&M ($49,624) ($50,915) ($52,238)Fixed O&M $0 ($25,000) ($25,650) ($26,317)Total O&M $0 ($74,624) ($76,565) ($78,555)
Total Capital Cost $775,000Financed with Common Equity ($465,000)Financed with Preferred Equity $0Preferred Dividends $0 $0 $0Amount financed w/ debt ($310,000)Debt payments ($35,119) ($35,119) ($35,119)Interest portion of payment ($23,250) ($22,360) ($21,403)MACRS 10 yr. 10% 18% 14%Depreciation (MACRS) ($77,500) ($139,500) ($108,500)EOP Book Value $775,000 $697,500 $558,000 $449,500Property Taxes ($11,625) ($10,463) ($8,370)Adjustment for Income taxes $57,312 $79,285 $68,399
Net Cash Flow (current $, incl. fin.) ($465,000) ($64,056) ($42,862) ($53,646)Net Cash Flow (current $, excl fin.) ($775,000) ($28,937) ($7,743) ($18,526)Capital Expenditure Annuity @ WACC ($107,478) ($107,478) ($107,478)NCF with annualized capital ($136,415) ($115,221) ($126,005)Current $ $/ton of NOx reduced ($2,086.12) ($1,762.00) ($1,926.91)NCF w/ann. cap. Discount by infl rate ($132,958) ($109,455) ($116,666)Sum of discounted NCF ($1,823,151)TOTAL Tons NOx reduced Proj. Life 981$/ton NOx reduced (after taxes) ($1,859)
Before Tax Net Cash Flow ($193,728) ($194,505) ($194,404)Discounted Before Tax NCF ($188,818) ($184,772) ($179,996)Sum of discounted Before Tax NCF ($2,463,127)
981$/ton NOx reduced (before tax basis) ($2,511)
Annual Capital Recovery ($85,250)Annual O&M ($74,624)Total Cost ($159,874)Annual NOx reduced (tons) 65$/ton (per ACT document) ($2,445)Average ($2,478)

IV-4
NOx Reduction Case SpreadsheetBoiler Selective Catalytic Reduction
Boiler Technical DataTarget Boiler Size (MMBTU/hr) 350Initial NOx value (lb/MMBTU) 0.45NOx reduction needed (up to 90%) 80%Outlet NOx Value 0.09
Project Economic Data# of months/year NOx reduction needed 5Capacity Factor 85%Primary Fuel Cost ($/MMBTU) $1.50Primary Fuel Escalation (%/yr.) 2.6%Cost of Ammonia ($/ton) $360.00Ammonia Escalation (%/yr.) 2.6%Catalyst Cost ($/m3) $10,000Op Hrs Between Catalyst Replacement 20,000Estimated Fixed O&M in first year $50,000Labor&Fixed O&M Escalation (%/yr.) 2.6%Capital cost ($/MMBTU/hr) $12,500Capital Cost ($) $4,375,000Cost of Equity Capital (%) 15.0%Cost of Debt (%) 7.5%Cost of Preferred Equity (%) 6.0%% financed with debt (%) 40.0%Term of debt financing (years) 15% financed with Common Equity 60.0%% financed with Preferred Equity 0.0%WACC, % 11.0%Income tax rate (%) 35.0%Projected inflation rate (%) 2.6%Evaluation period of Project (yrs) 15Property Tax rate ($/$1,000) $15.00ACT pretax marginal rate of return 10.0%
Process AnalysisBoiler SCRPlantMMBTU/hr 350lb/hr NOx reduced 126lbmole/hr NOx reduced 3Pri. Fuel Cost, $/MMBTU $1.50Pri. Fuel Cost, $/hr $525Ammonia Cost ($/ton) $360.00Ammonia Cost ($/lbmole) $3.06Ammonia usage (lbmole/hr) 2.7Ammonia usage (lb/hr) 46.57Ammonia Cost ($/hr) $8.38Approx. Catalyst Loading (m3) 42
Heat Rate Increase 0.50%Uncontrolled NOx 0.45Controlled NOx 0.09Capital Cost, includes license ($/KW) 4,375,000Fixed O&M ($/yr.) $50,000Capacity factor 0.85Months NOx reduction in service 5.00Projected Book Life, yrs 15.00Ann. NOx Red'n, tons 195
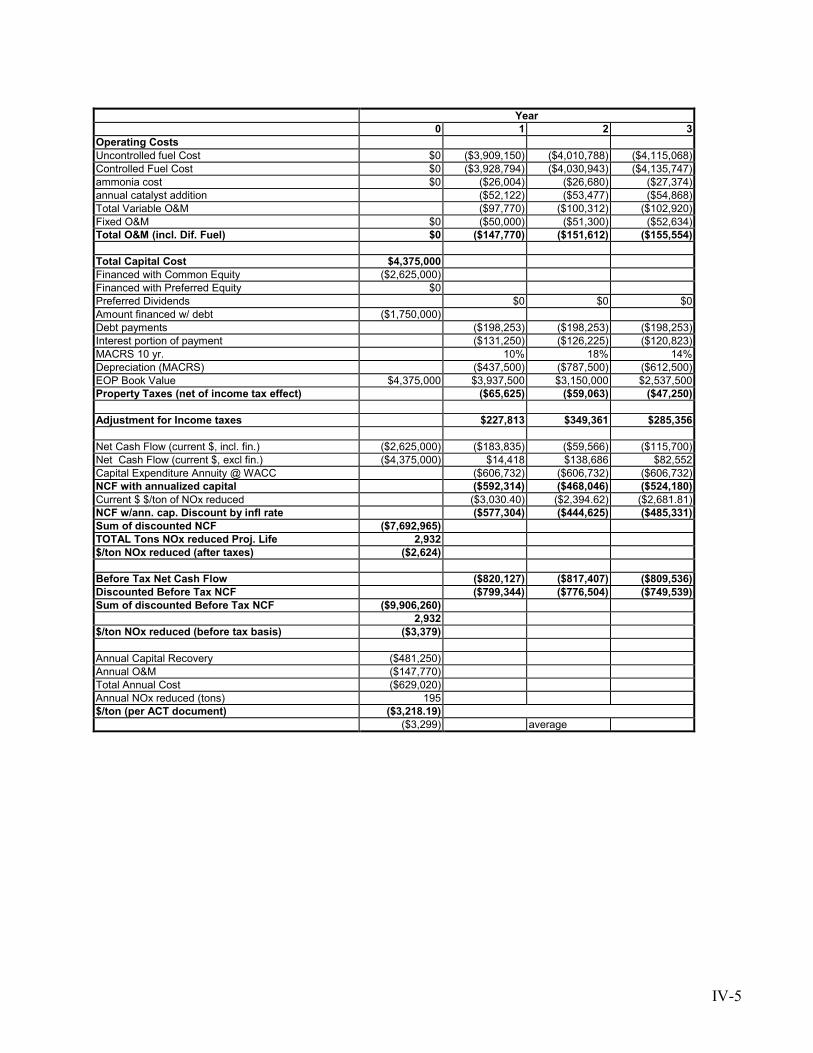
IV-5
Year0 1 2 3
Operating CostsUncontrolled fuel Cost $0 ($3,909,150) ($4,010,788) ($4,115,068)Controlled Fuel Cost $0 ($3,928,794) ($4,030,943) ($4,135,747)ammonia cost $0 ($26,004) ($26,680) ($27,374)annual catalyst addition ($52,122) ($53,477) ($54,868)Total Variable O&M ($97,770) ($100,312) ($102,920)Fixed O&M $0 ($50,000) ($51,300) ($52,634)Total O&M (incl. Dif. Fuel) $0 ($147,770) ($151,612) ($155,554)
Total Capital Cost $4,375,000Financed with Common Equity ($2,625,000)Financed with Preferred Equity $0Preferred Dividends $0 $0 $0Amount financed w/ debt ($1,750,000)Debt payments ($198,253) ($198,253) ($198,253)Interest portion of payment ($131,250) ($126,225) ($120,823)MACRS 10 yr. 10% 18% 14%Depreciation (MACRS) ($437,500) ($787,500) ($612,500)EOP Book Value $4,375,000 $3,937,500 $3,150,000 $2,537,500Property Taxes (net of income tax effect) ($65,625) ($59,063) ($47,250)
Adjustment for Income taxes $227,813 $349,361 $285,356
Net Cash Flow (current $, incl. fin.) ($2,625,000) ($183,835) ($59,566) ($115,700)Net Cash Flow (current $, excl fin.) ($4,375,000) $14,418 $138,686 $82,552Capital Expenditure Annuity @ WACC ($606,732) ($606,732) ($606,732)NCF with annualized capital ($592,314) ($468,046) ($524,180)Current $ $/ton of NOx reduced ($3,030.40) ($2,394.62) ($2,681.81)NCF w/ann. cap. Discount by infl rate ($577,304) ($444,625) ($485,331)Sum of discounted NCF ($7,692,965)TOTAL Tons NOx reduced Proj. Life 2,932$/ton NOx reduced (after taxes) ($2,624)
Before Tax Net Cash Flow ($820,127) ($817,407) ($809,536)Discounted Before Tax NCF ($799,344) ($776,504) ($749,539)Sum of discounted Before Tax NCF ($9,906,260)
2,932$/ton NOx reduced (before tax basis) ($3,379)
Annual Capital Recovery ($481,250)Annual O&M ($147,770)Total Annual Cost ($629,020)Annual NOx reduced (tons) 195$/ton (per ACT document) ($3,218.19)
($3,299) average

IV-6
NOx Reduction Case Spreadsheet
Gas Boiler with SCR
Boiler Technical DataTarget Boiler Size (MMBTU/hr) 350Initial NOx value (lb/MMBTU) 0.15NOx reduction needed (up to 90%) 80%Outlet NOx Value 0.03
Project Economic Data# of months/year NOx reduction needed 12Capacity Factor 85%Primary Fuel Cost ($/MMBTU) $1.50Primary Fuel Escalation (%/yr.) 2.6%Cost of Ammonia ($/ton) $360.00Ammonia Escalation (%/yr.) 2.6%Catalyst Cost ($/m3) $10,000Op Hrs Between Catalyst Replacement 20,000Estimated Fixed O&M in first year $50,000Labor&Fixed O&M Escalation (%/yr.) 2.6%Capital cost ($/MMBTU/hr) $5,500Capital Cost ($) $1,925,000Cost of Equity Capital (%) 15.0%Cost of Debt (%) 7.5%Cost of Preferred Equity (%) 6.0%% financed with debt (%) 40.0%Term of debt financing (years) 15% financed with Common Equity 60.0%% financed with Preferred Equity 0.0%WACC, % 11.0%Income tax rate (%) 35.0%Projected inflation rate (%) 2.6%Evaluation period of Project (yrs) 15Property Tax rate ($/$1,000) $15.00ACT pretax marginal rate of return 10.0%
Process Analysis
PlantMMBTU/hr 350lb/hr NOx reduced 42lbmole/hr NOx reduced 1Pri. Fuel Cost, $/MMBTU $1.50Pri. Fuel Cost, $/hr $525Ammonia Cost ($/ton) $360.00Ammonia Cost ($/lbmole) $3.06Ammonia usage (lbmole/hr) 0.9Ammonia usage (lb/hr) 15.52Ammonia Cost ($/hr) $2.79Approx. Catalyst Loading (m3) 18
Heat Rate Increase 0.50%Uncontrolled NOx 0.15Controlled NOx 0.03Capital Cost, includes license ($/KW) 1,925,000Fixed O&M ($/yr.) $50,000Capacity factor 0.85Months NOx reduction in service 12.00Projected Book Life, yrs 15.00Ann. NOx Red'n, tons 156

IV-7
Cash FlowsAll values shown in current dollars, except where indicated otherwise
Year0 1 2 3
Operating CostsUncontrolled fuel Cost $0 ($3,909,150) ($4,010,788) ($4,115,068)Controlled Fuel Cost $0 ($3,928,794) ($4,030,943) ($4,135,747)ammonia cost $0 ($20,803) ($21,344) ($21,899)annual catalyst addition ($10,859) ($11,141) ($11,431)Total Variable O&M ($51,306) ($52,640) ($54,009)Fixed O&M $0 ($50,000) ($51,300) ($52,634)Total O&M (incl. Dif. Fuel) $0 ($101,306) ($103,940) ($106,643)
Total Capital Cost $1,925,000Financed with Common Equity ($1,155,000)Financed with Preferred Equity $0Preferred Dividends $0 $0 $0Amount financed w/ debt ($770,000)Debt payments ($87,231) ($87,231) ($87,231)Interest portion of payment ($57,750) ($55,539) ($53,162)MACRS 10 yr. 10% 18% 14%Depreciation (MACRS) ($192,500) ($346,500) ($269,500)EOP Book Value $1,925,000 $1,732,500 $1,386,000 $1,116,500Property Taxes (net of income tax effect) ($28,875) ($25,988) ($20,790)Adustment for Income taxes $112,938 $166,750 $138,926Net Cash Flow (current $, incl fin.) ($1,155,000) ($104,474) ($50,409) ($75,737)Net Cash Flow (current $, excl fin.) ($1,925,000) ($17,243) $36,822 $11,494Capital Expenditure Annuity @ WACC ($266,962) ($266,962) ($266,962)NCF with annualized capital ($284,205) ($230,140) ($255,468)Current $ $/ton of NOx reduced ($1,817.56) ($1,471.80) ($1,633.78)NCF w/ann cap. Discount by infl rate ($277,003) ($218,624) ($236,535)Sum of discounted NCF ($3,729,740)TOTAL Tons NOx reduced Proj. Life 2,345$/ton NOx reduced (after taxes) ($1,590)
Before Tax Net Cash Flow ($397,143) ($396,890) ($394,395)Discounted Before Tax NCF ($387,079) ($377,029) ($365,165)Sum of discounted Before Tax NCF ($4,889,270)
2,345$/ton NOx reduced (before tax basis) ($2,085)
Annual Capital Recovery ($211,750)Annual O&M ($101,306)Total Annual Cost ($313,056)Annual NOx reduced (tons) 156$/ton (per ACT document) ($2,002.07)
($2,043) average

IV-8
NOx Case WorksheetConventional Gas Reburn
Boiler Technical DataTarget Boiler Size (MMBTU/hr) 350Initial NOx value (lb/MMBTU) 0.45NOx reduction needed (up to 40%) 55%boiler heat rate (BTU/KWhr) 10,000Outlet NOx Value 0.20
Project Economic Data# of months/year NOx reduction needed 5Capacity Factor 85%Primary Fuel Cost ($/MMBTU) $1.50Primary Fuel Escalation (%/yr.) 2.6%Percent Reburn Fuel, % 20.0%Cost of Natural Gas ($/MMBTU) $2.50Natural Gas Escalation (%/yr.) 2.6%Estimated Fixed O&M in first year $25,000Labor&Fixed O&M Escalation (%/yr.) 2.6%Capital Cost ($) $700,000Capital Cost ($/MMBTU/hr) $2,000Cost of Equity Capital (%) 15.0%Cost of Debt (%) 7.5%Cost of Preferred Equity (%) 6.0%% financed with debt (%) 40.0%Term of debt financing (years) 20% financed with Common Equity 60.0%% financed with Preferred Equity 0.0%WACC, % 11.0%Income tax rate (%) 35.0%Projected inflation rate (%) 2.6%Evaluation period of Project (yrs) 15Property Tax rate ($/$1,000) $15.00ACT pretax marginal rate of return 10.0%
Process Analysis
PlantMMBTU/hr 350Pri. Fuel Cost, $/MMBTU $1.50Pri. Fuel Cost, $/hr $420Reburn Fuel Cost, $/MMBTU $2.50% Fuel Reburn zone 20.0%Reburn Fuel Cost, $/hr $175Uncontrolled NOx 0.45Controlled NOx 0.20Capital Cost, $) 700,000Fixed O&M ($/yr.) $25,000Capacity factor 0.85Months NOx reduction in service 5.00Projected Book Life, yrs 15.00Ann. NOx Red'n, tons 134

IV-9
Cash FlowsAll values shown in current dollars, except where indicated otherwise
Year0 1 2 3
Operating CostsUncontrolled fuel Cost $0 ($1,628,813) ($1,671,162) ($1,714,612)Primary Fuel Cost $0 ($1,303,050) ($1,336,929) ($1,371,689)Reburn Fuel Cost $0 ($542,938) ($557,054) ($571,537)Tot. Controlled Fuel Cost $0 ($1,845,988) ($1,893,983) ($1,943,227)Variable O&M ($217,175) ($222,822) ($228,615)Fixed O&M $0 ($25,000) ($25,650) ($26,317)Total O&M + dif. Fuel $0 ($242,175) ($248,472) ($254,932)
Total Capital Cost $700,000Financed with Common Equity ($420,000)Financed with Preferred Equity $0Preferred Dividends $0 $0 $0Amount financed w/ debt ($280,000)Debt payments ($27,466) ($27,466) ($27,466)Interest portion of payment ($21,000) ($20,515) ($19,994)MACRS 10 yr. 10% 18% 14%Depreciation (MACRS) ($70,000) ($126,000) ($98,000)EOP Book Value $700,000 $630,000 $504,000 $406,000Property Taxes ($10,500) ($9,450) ($7,560)Adustment for Income taxes $112,936 $134,373 $126,172Net Cash Flow (current $, incl fin.) ($420,000) ($167,205) ($151,015) ($163,785)Net Cash Flow (current $, excl fin.) ($700,000) ($139,739) ($123,549) ($136,320)Capital Expenditure Annuity @ WACC ($97,077) ($97,077) ($97,077)NCF with annualized capital ($236,816) ($220,626) ($233,397)Current $ $/ton of NOx reduced ($1,762.32) ($1,641.84) ($1,736.88)NCF w/ann cap. Discount by infl rate ($230,815) ($209,586) ($216,099)Sum of discounted NCF ($3,307,565)TOTAL Tons NOx reduced Proj. Life 2,016$/ton NOx reduced (after taxes) ($1,641)
Before Tax Net Cash Flow ($349,752) ($354,999) ($359,569)Discounted Before Tax NCF ($340,889) ($337,235) ($332,920)Sum of discounted Before Tax NCF ($4,779,910)
2,016$/ton NOx reduced (before tax basis) ($2,371)
Annual Capital Recovery ($77,000)Annual O&M ($242,175)Total Cost ($319,175)Annual NOx reduced (tons) 134$/ton (per ACT document) ($2,375)
$2,373 average

IV-10
NOx Case WorksheetAE FLGR
Boiler Technical DataTarget Boiler Size (MMBTU/hr) 350Initial NOx value (lb/MMBTU) 0.45NOx reduction needed (up to 70%) 60%boiler heat rate (BTU/KWhr) 10,000Outlet NOx Value 0.18Urea NSR 1.2
Project Economic Data# of months/year NOx reduction needed 12Capacity Factor 85%Primary Fuel Cost ($/MMBTU) $1.50Primary Fuel Escalation (%/yr.) 2.6%Cost of Natural Gas ($/MMBTU) $2.50Natural Gas Escalation (%/yr.) 2.6%Urea Cost ($/gallon) $0.95Urea Cost ($/ton) $406.74Urea Escalation 2.6%Estimated Fixed O&M in first year $25,000Labor&Fixed O&M Escalation (%/yr.) 2.6%Capital Cost ($) $875,000Capital Cost ($/MMBTU/hr) $2,500Cost of Equity Capital (%) 15.0%Cost of Debt (%) 7.5%Cost of Preferred Equity (%) 6.0%% financed with debt (%) 40.0%Term of debt financing (years) 20% financed with Common Equity 60.0%% financed with Preferred Equity 0.0%WACC, % 11.0%Income tax rate (%) 35.0%Projected inflation rate (%) 2.6%Evaluation period of Project (yrs) 15Property Tax rate ($/$1,000) $15.00ACT pretax marginal rate of return 10.0%
Process Analysis
PlantMMBTU/hr 350Pri. Fuel Cost, $/MMBTU $1.50Pri. Fuel Cost, $/hr $494Reburn Fuel Cost, $/MMBTU $2.50% Fuel Reburn zone 6.0%Reburn Fuel Cost, $/hr $53Uncontrolled NOx 0.45Controlled NOx 0.18Initial NOx (full load), lb/hr 158Initial NOx (full load), lbmole/hr 3.42lbmole/hr urea 2.05lb/hr urea 123$/hr urea (full load) $25Capital Cost, $) 875,000Fixed O&M ($/yr.) $25,000Capacity factor 0.85Months NOx reduction in service 12.00Projected Book Life, yrs 15.00Ann. NOx Red'n, tons 352

IV-11
Cash FlowsAll values shown in current dollars, except where indicated otherwise
Year0 1 2 3
Operating CostsUncontrolled fuel Cost $0 ($3,909,150) ($4,010,788) ($4,115,068)Primary Fuel Cost $0 ($3,674,601) ($3,770,141) ($3,868,164)Reburn Fuel Cost $0 ($390,915) ($401,079) ($411,507)Tot. Controlled Fuel Cost $0 ($4,065,516) ($4,171,219) ($4,279,671)Urea Cost ($186,652) ($191,505) ($196,484)Variable O&M ($343,018) ($351,937) ($361,087)Fixed O&M $0 ($25,000) ($25,650) ($26,317)Total O&M + dif. Fuel $0 ($368,018) ($377,587) ($387,404)Total Capital Cost $875,000Financed with Common Equity ($525,000)Financed with Preferred Equity $0Preferred Dividends $0 $0 $0Amount financed w/ debt ($350,000)Debt payments ($34,332) ($34,332) ($34,332)Interest portion of payment ($26,250) ($25,644) ($24,992)MACRS 10 yr. 10% 18% 14%Depreciation (MACRS) ($87,500) ($157,500) ($122,500)EOP Book Value $875,000 $787,500 $630,000 $507,500Property Taxes ($13,125) ($11,813) ($9,450)Adustment for Income taxes $164,025 $191,415 $181,774Net Cash Flow (current $, incl fin.) ($525,000) ($251,450) ($232,317) ($249,412)Net Cash Flow (current $, excl fin.) ($875,000) ($217,118) ($197,984) ($215,080)Capital Expenditure Annuity @ WACC ($121,346) ($121,346) ($121,346)NCF with annualized capital ($338,464) ($319,331) ($336,426)Current $ $/ton of NOx reduced ($962.03) ($907.64) ($956.24)NCF w/ann cap. Discount by infl rate ($329,887) ($303,351) ($311,493)Sum of discounted NCF ($4,754,991)TOTAL Tons NOx reduced Proj. Life 5,277$/ton NOx reduced (after taxes) ($901)
Before Tax Net Cash Flow ($502,489) ($510,745) ($518,200)Discounted Before Tax NCF ($489,756) ($485,188) ($479,795)Sum of discounted Before Tax NCF ($6,929,556)
5,277$/ton NOx reduced (before tax basis) ($1,313)
Annual Capital Recovery ($96,250)Annual O&M ($368,018)Total Cost ($464,268)Annual NOx reduced (tons) 352$/ton (per ACT document) ($1,320)Average of two methods $1,316 average

IV-12
NOx Case WorksheetFuel Lean Gas Reburn
Boiler Technical DataTarget Boiler Size (MMBTU/hr) 350Initial NOx value (lb/MMBTU) 0.45NOx reduction needed (up to 40%) 35%boiler heat rate (BTU/KWhr) 10,000Outlet NOx Value 0.29
Project Economic Data# of months/year NOx reduction needed 5Capacity Factor 85%Primary Fuel Cost ($/MMBTU) $1.50Primary Fuel Escalation (%/yr.) 2.6%Cost of Natural Gas ($/MMBTU) $2.50Natural Gas Escalation (%/yr.) 2.6%Estimated Fixed O&M in first year $25,000Labor&Fixed O&M Escalation (%/yr.) 2.6%Capital Cost ($) $350,000Capital Cost ($/MMBTU/hr) $1,000Cost of Equity Capital (%) 15.0%Cost of Debt (%) 7.5%Cost of Preferred Equity (%) 6.0%% financed with debt (%) 40.0%Term of debt financing (years) 20% financed with Common Equity 60.0%% financed with Preferred Equity 0.0%WACC, % 11.0%Income tax rate (%) 35.0%Projected inflation rate (%) 2.6%Evaluation period of Project (yrs) 15Property Tax rate ($/$1,000) $15.00ACT pretax marginal rate of return 10.0%
Process Analysis
PlantMMBTU/hr 350Pri. Fuel Cost, $/MMBTU $1.50Pri. Fuel Cost, $/hr $493Reburn Fuel Cost, $/MMBTU $2.50% Fuel Reburn zone 6.1%Reburn Fuel Cost, $/hr $54Uncontrolled NOx 0.45Controlled NOx 0.29Capital Cost, $) 350,000Fixed O&M ($/yr.) $25,000Capacity factor 0.85Months NOx reduction in service 5.00Projected Book Life, yrs 15.00Ann. NOx Red'n, tons 86

IV-13
Cash FlowsAll values shown in current dollars, except where indicated otherwise
Year0 1 2 3
Operating CostsUncontrolled fuel Cost $0 ($1,628,813) ($1,671,162) ($1,714,612)Primary Fuel Cost $0 ($1,529,048) ($1,568,803) ($1,609,592)Reburn Fuel Cost $0 ($166,275) ($170,598) ($175,033)Tot. Controlled Fuel Cost $0 ($1,695,322) ($1,739,401) ($1,784,625)Variable O&M ($66,510) ($68,239) ($70,013)Fixed O&M $0 ($25,000) ($25,650) ($26,317)Total O&M + dif. Fuel $0 ($91,510) ($93,889) ($96,330)
Total Capital Cost $350,000Financed with Common Equity ($210,000)Financed with Preferred Equity $0Preferred Dividends $0 $0 $0Amount financed w/ debt ($140,000)Debt payments ($13,733) ($13,733) ($13,733)Interest portion of payment ($10,500) ($10,258) ($9,997)MACRS 10 yr. 10% 18% 14%Depreciation (MACRS) ($35,000) ($63,000) ($49,000)EOP Book Value $350,000 $315,000 $252,000 $203,000Property Taxes ($5,250) ($4,725) ($3,780)Adustment for Income taxes $46,116 $56,565 $52,189Net Cash Flow (current $, incl fin.) ($210,000) ($64,377) ($55,782) ($61,655)Net Cash Flow (current $, excl fin.) ($350,000) ($50,644) ($42,049) ($47,922)Capital Expenditure Annuity @ WACC ($48,539) ($48,539) ($48,539)NCF with annualized capital ($99,182) ($90,588) ($96,460)Current $ $/ton of NOx reduced ($1,159.86) ($1,059.35) ($1,128.02)NCF w/ann cap. Discount by infl rate ($96,669) ($86,055) ($89,311)Sum of discounted NCF ($1,372,708)TOTAL Tons NOx reduced Proj. Life 1,283$/ton NOx reduced (after taxes) ($1,070)
Before Tax Net Cash Flow ($145,298) ($147,153) ($148,649)Discounted Before Tax NCF ($141,616) ($139,789) ($137,632)Sum of discounted Before Tax NCF ($1,957,533)
1,283$/ton NOx reduced (before tax basis) ($1,526)
Annual Capital Recovery ($38,500)Annual O&M ($91,510)Total Cost ($130,010)Annual NOx reduced (tons) 86$/ton (per ACT document) ($1,520)Average of two methods $1,523 average

IV-14
NOx Case WorksheetLow NOx Burners
Boiler Technical DataTarget Boiler Size (MMBTU/hr) 350Initial NOx value (lb/MMBTU) 0.6NOx reduction needed (up to 40%) 25%boiler heat rate (BTU/KWhr) 10,000Outlet NOx Value 0.45
Project Economic Data# of months/year NOx reduction needed 5Capacity Factor 85%Primary Fuel Cost ($/MMBTU) $1.50Primary Fuel Escalation (%/yr.) 2.6%Cost of Natural Gas ($/MMBTU) $2.50Natural Gas Escalation (%/yr.) 2.6%Estimated Fixed O&M in first year $0Labor&Fixed O&M Escalation (%/yr.) 2.6%heat rate increase 0.00%Capital Cost ($) $1,750,000Cost of Equity Capital (%) 15.0%Cost of Debt (%) 7.5%Cost of Preferred Equity (%) 6.0%% financed with debt (%) 40.0%Term of debt financing (years) 15% financed with Common Equity 60.0%% financed with Preferred Equity 0.0%WACC, % 11.0%Income tax rate (%) 35.0%Projected inflation rate (%) 2.6%Evaluation period of Project (yrs) 15Property Tax rate ($/$1,000) $15.00ACT Pretax Marginal Rate of Return 10.0%
Process Analysis
PlantNameplate MMBTU/hr 350Pri. Fuel Cost, $/MMBTU $1.50Pri. Fuel Cost, $/hr $525Reburn Fuel Cost, $/MMBTU $2.50Uncontrolled NOx 0.60Controlled NOx 0.45Capacity factor 0.85Months NOx reduction in service 5.00Projected Book Life, yrs 15.00Ann. NOx Red'n, tons 81
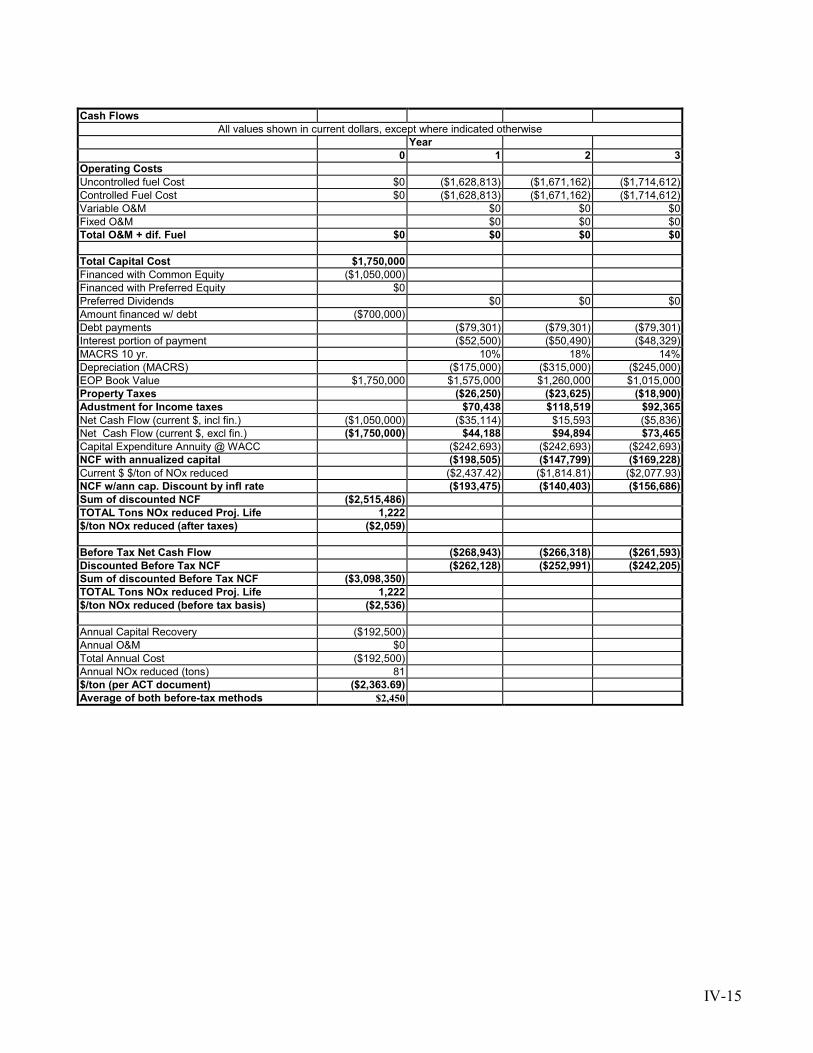
IV-15
Cash FlowsAll values shown in current dollars, except where indicated otherwise
Year0 1 2 3
Operating CostsUncontrolled fuel Cost $0 ($1,628,813) ($1,671,162) ($1,714,612)Controlled Fuel Cost $0 ($1,628,813) ($1,671,162) ($1,714,612)Variable O&M $0 $0 $0Fixed O&M $0 $0 $0Total O&M + dif. Fuel $0 $0 $0 $0
Total Capital Cost $1,750,000Financed with Common Equity ($1,050,000)Financed with Preferred Equity $0Preferred Dividends $0 $0 $0Amount financed w/ debt ($700,000)Debt payments ($79,301) ($79,301) ($79,301)Interest portion of payment ($52,500) ($50,490) ($48,329)MACRS 10 yr. 10% 18% 14%Depreciation (MACRS) ($175,000) ($315,000) ($245,000)EOP Book Value $1,750,000 $1,575,000 $1,260,000 $1,015,000Property Taxes ($26,250) ($23,625) ($18,900)Adustment for Income taxes $70,438 $118,519 $92,365Net Cash Flow (current $, incl fin.) ($1,050,000) ($35,114) $15,593 ($5,836)Net Cash Flow (current $, excl fin.) ($1,750,000) $44,188 $94,894 $73,465Capital Expenditure Annuity @ WACC ($242,693) ($242,693) ($242,693)NCF with annualized capital ($198,505) ($147,799) ($169,228)Current $ $/ton of NOx reduced ($2,437.42) ($1,814.81) ($2,077.93)NCF w/ann cap. Discount by infl rate ($193,475) ($140,403) ($156,686)Sum of discounted NCF ($2,515,486)TOTAL Tons NOx reduced Proj. Life 1,222$/ton NOx reduced (after taxes) ($2,059)
Before Tax Net Cash Flow ($268,943) ($266,318) ($261,593)Discounted Before Tax NCF ($262,128) ($252,991) ($242,205)Sum of discounted Before Tax NCF ($3,098,350)TOTAL Tons NOx reduced Proj. Life 1,222$/ton NOx reduced (before tax basis) ($2,536)
Annual Capital Recovery ($192,500)Annual O&M $0Total Annual Cost ($192,500)Annual NOx reduced (tons) 81$/ton (per ACT document) ($2,363.69)Average of both before-tax methods $2,450

IV-16
NOx Case WorksheetLow NOx Burners - Oil
Boiler Technical DataTarget Boiler Size (MMBTU/hr) 1360Initial NOx value (lb/MMBTU) 0.427NOx reduction needed (up to 40%) 10%boiler heat rate (BTU/KWhr) 10,000Outlet NOx Value 0.38
Project Economic Data# of months/year NOx reduction needed 12Capacity Factor 85%Primary Fuel Cost ($/MMBTU) $1.50Primary Fuel Escalation (%/yr.) 2.6%Cost of Natural Gas ($/MMBTU) $2.50Natural Gas Escalation (%/yr.) 2.6%Estimated Fixed O&M in first year $0Labor&Fixed O&M Escalation (%/yr.) 2.6%heat rate increase 0.00%Capital Cost ($) $30,000Cost of Equity Capital (%) 15.0%Cost of Debt (%) 7.5%Cost of Preferred Equity (%) 6.0%% financed with debt (%) 40.0%Term of debt financing (years) 15% financed with Common Equity 60.0%% financed with Preferred Equity 0.0%WACC, % 11.0%Income tax rate (%) 35.0%Projected inflation rate (%) 2.6%Evaluation period of Project (yrs) 15Property Tax rate ($/$1,000) $15.00ACT Pretax Marginal Rate of Return 10.0%
Process Analysis
PlantNameplate MMBTU/hr 1,360Pri. Fuel Cost, $/MMBTU $1.50Pri. Fuel Cost, $/hr $2,040Reburn Fuel Cost, $/MMBTU $2.50Uncontrolled NOx 0.43Controlled NOx 0.38Capacity factor 0.85Months NOx reduction in service 12.00Projected Book Life, yrs 15.00Ann. NOx Red'n, tons 216

IV-17
Cash FlowsAll values shown in current dollars, except where indicated otherwise
Year0 1 2 3
Operating CostsUncontrolled fuel Cost $0 ($15,189,840) ($15,584,776) ($15,989,980)Controlled Fuel Cost $0 ($15,189,840) ($15,584,776) ($15,989,980)Variable O&M $0 $0 $0Fixed O&M $0 $0 $0Total O&M + dif. Fuel $0 $0 $0 $0
Total Capital Cost $30,000Financed with Common Equity ($18,000)Financed with Preferred Equity $0Preferred Dividends $0 $0 $0Amount financed w/ debt ($12,000)Debt payments ($1,359) ($1,359) ($1,359)Interest portion of payment ($900) ($866) ($828)MACRS 10 yr. 10% 18% 14%Depreciation (MACRS) ($3,000) ($5,400) ($4,200)EOP Book Value $30,000 $27,000 $21,600 $17,400Property Taxes ($450) ($405) ($324)Adustment for Income taxes $1,208 $2,032 $1,583Net Cash Flow (current $, incl fin.) ($18,000) ($602) $267 ($100)Net Cash Flow (current $, excl fin.) ($30,000) $758 $1,627 $1,259Capital Expenditure Annuity @ WACC ($4,160) ($4,160) ($4,160)NCF with annualized capital ($3,403) ($2,534) ($2,901)Current $ $/ton of NOx reduced ($15.74) ($11.72) ($13.42)NCF w/ann cap. Discount by infl rate ($3,317) ($2,407) ($2,686)Sum of discounted NCF ($43,123)TOTAL Tons NOx reduced Proj. Life 3,243$/ton NOx reduced (after taxes) ($13)
Before Tax Net Cash Flow ($4,610) ($4,565) ($4,484)Discounted Before Tax NCF ($4,494) ($4,337) ($4,152)Sum of discounted Before Tax NCF ($53,115)TOTAL Tons NOx reduced Proj. Life 3,243$/ton NOx reduced (before tax basis) ($16)
Annual Capital Recovery ($3,300)Annual O&M $0Total Annual Cost ($3,300)Annual NOx reduced (tons) 216$/ton (per ACT document) ($15.26)Average of both before-tax methods $16

IV-18
Gas Turbine Worksheets
NOx Case Worksheet75 MW GT - Dry Low NOx: from Diluent Injection
Engine Technical DataTarget Engine Size, (MW) 75Initial NOx value (ppm) 42Initial NOx massflow (lb/hr) 139.99NOx reduction needed (up to 40%) 64%Engine heat rate (BTU/KWhr) 10,000Outlet NOx Value (ppm) 15.00Outlet NOx massflow (lb/hr) 50.00
Project Economic Data# of months/year NOx reduction needed 12Capacity Factor 95%Primary Fuel Cost ($/MMBTU) $2.25Primary Fuel Escalation (%/yr.) 2.6%Estimated Fixed O&M in first year $0Labor&Fixed O&M Escalation (%/yr.) 2.6%heat rate increase -4.00%Capital Cost ($) $3,650,000Capital Cost ($/KW) $49Cost of Equity Capital (%) 15.0%Cost of Debt (%) 7.5%Cost of Preferred Equity (%) 6.0%% financed with debt (%) 40.0%Term of debt financing (years) 15% financed with Common Equity 60.0%% financed with Preferred Equity 0.0%WACC, % 11.0%Income tax rate (%) 35.0%Projected inflation rate (%) 2.6%Evaluation period of Project (yrs) 15Property Tax rate ($/$1,000) $15.00ACT Pretax Marginal Rate of Return 10.0%
Process Analysis
PlantNameplate MW 75Pri. Fuel Cost, $/MMBTU $2.25Pri. Fuel Cost, $/hr $1,688Uncontrolled NOx (ppm) 42.00Controlled NOx 15.00Capital Cost $3,650,000Fixed O&M ($/yr.) $0Capacity factor 0.95Months NOx reduction in service 12.00Projected Book Life, yrs 15.00Ann. NOx Red'n, tons 374

IV-19
Cash FlowsAll values shown in current dollars, except where indicated otherwise
Year0 1 2 3
Operating CostsUncontrolled fuel Cost $0 ($14,043,375) ($14,408,503) ($14,783,124)Controlled Fuel Cost $0 ($13,481,640) ($13,832,163) ($14,191,799)Fuel Savings $561,735 $576,340 $591,325Water and Water Treatment savings (y or n) y $313,500 $321,651 $330,014Fixed O&M $0 $0 $0 $0Total O&M + dif. Fuel $0 $875,235 $897,991 $921,339Total Capital Cost $3,650,000Financed with Common Equity ($2,190,000)Financed with Preferred Equity $0Preferred Dividends $0 $0 $0Amount financed w/ debt ($1,460,000)Debt payments ($165,399) ($165,399) ($165,399)Interest portion of payment ($109,500) ($105,308) ($100,801)MACRS 10 yr. 10% 18% 14%Depreciation (MACRS) ($365,000) ($657,000) ($511,000)EOP Book Value $3,650,000 $3,285,000 $2,628,000 $2,117,000Property Taxes ($54,750) ($49,275) ($39,420)Adustment for Income taxes ($104,370) ($10,619) ($71,872)Net Cash Flow (current $, incl fin.) ($2,190,000) $495,666 $616,216 $586,698Net Cash Flow (current $, excl fin.) ($3,650,000) $661,065 $781,615 $752,097Capital Expenditure Annuity @ WACC ($506,188) ($506,188) ($506,188)NCF with annualized capital $154,877 $275,428 $245,909Current $ $/ton of NOx reduced $413.61 $735.55 $656.72NCF w/ann cap. Discount by infl rate $150,953 $261,645 $227,684Sum of discounted NCF $3,070,707TOTAL Tons NOx reduced Proj. Life 5,617$/ton NOx reduced (after taxes) $547
Before Tax Net Cash Flow $314,297 $342,528 $375,731Discounted Before Tax NCF $306,332 $325,388 $347,884Sum of discounted Before Tax NCF $6,333,561
5,617$/ton NOx reduced (before tax basis) $1,128
Annual Capital Recovery ($401,500)Annual O&M $875,235Total Annual Cost $473,735Annual NOx reduced (tons) 374$/ton (per ACT document) $1,265
Average ($/ton)-both before-tax methods $1,196

IV-20
NOx Case WorksheetGT - 75 MW Dry Low NOx from Std. Combustor
Engine Technical DataTarget Engine Size, (MW) 75Initial NOx value (ppm) 154Initial NOx massflow (lb/hr) 513.28NOx reduction needed (up to 40%) 90%Engine heat rate (BTU/KWhr) 10,000Outlet NOx Value (ppm) 15.00Outlet NOx massflow (lb/hr) 50.00
Project Economic Data# of months/year NOx reduction needed 12Capacity Factor 45%Primary Fuel Cost ($/MMBTU) $2.25Primary Fuel Escalation (%/yr.) 2.6%Estimated Fixed O&M in first year $0Labor&Fixed O&M Escalation (%/yr.) 2.6%heat rate increase 0.00%Capital Cost ($) $3,650,000Capital Cost ($/KW) $49Cost of Equity Capital (%) 15.0%Cost of Debt (%) 7.5%Cost of Preferred Equity (%) 6.0%% financed with debt (%) 40.0%Term of debt financing (years) 15% financed with Common Equity 60.0%% financed with Preferred Equity 0.0%WACC, % 11.0%Income tax rate (%) 35.0%Projected inflation rate (%) 2.6%Evaluation period of Project (yrs) 15Property Tax rate ($/$1,000) $15.00ACT Pretax Marginal Rate of Return 10.0%
Process Analysis
PlantNameplate MW 75Pri. Fuel Cost, $/MMBTU $2.25Pri. Fuel Cost, $/hr $1,688Uncontrolled NOx (ppm) 154.00Controlled NOx 15.00Capital Cost $3,650,000Fixed O&M ($/yr.) $0Capacity factor 0.45Months NOx reduction in service 12.00Projected Book Life, yrs 15.00Ann. NOx Red'n, tons 913

IV-21
Cash FlowsAll values shown in current dollars, except where indicated otherwise
Year0 1 2 3
Operating CostsUncontrolled fuel Cost $0 ($6,652,125) ($6,825,080) ($7,002,532)Controlled Fuel Cost $0 ($6,652,125) ($6,825,080) ($7,002,532)Fuel Savings $0 $0 $0Water and Water Treatment savings (y or n) n $0 $0 $0Fixed O&M $0 $0 $0 $0Total O&M + dif. Fuel $0 $0 $0 $0Total Capital Cost $3,650,000Financed with Common Equity ($2,190,000)Financed with Preferred Equity $0Preferred Dividends $0 $0 $0Amount financed w/ debt ($1,460,000)Debt payments ($165,399) ($165,399) ($165,399)Interest portion of payment ($109,500) ($105,308) ($100,801)MACRS 10 yr. 10% 18% 14%Depreciation (MACRS) ($365,000) ($657,000) ($511,000)EOP Book Value $3,650,000 $3,285,000 $2,628,000 $2,117,000Property Taxes ($54,750) ($49,275) ($39,420)Adustment for Income taxes $146,913 $247,196 $192,647Net Cash Flow (current $, incl fin.) ($2,190,000) ($73,237) $32,522 ($12,172)Net Cash Flow (current $, excl fin.) ($3,650,000) $92,163 $197,921 $153,227Capital Expenditure Annuity @ WACC ($506,188) ($506,188) ($506,188)NCF with annualized capital ($414,025) ($308,267) ($352,961)Current $ $/ton of NOx reduced ($453.41) ($337.59) ($386.54)NCF w/ann cap. Discount by infl rate ($403,534) ($292,841) ($326,802)Sum of discounted NCF ($5,246,585)TOTAL Tons NOx reduced Proj. Life 13,697$/ton NOx reduced (after taxes) ($383)
Before Tax Net Cash Flow ($560,938) ($555,463) ($545,608)Discounted Before Tax NCF ($546,723) ($527,667) ($505,171)Sum of discounted Before Tax NCF ($6,462,273)
13,697$/ton NOx reduced (before tax basis) ($472)
Annual Capital Recovery ($401,500)Annual O&M $0Total Annual Cost ($401,500)Annual NOx reduced (tons) 913$/ton (per ACT document) ($440)
Average ($/ton)-both before-tax methods ($456)

IV-22
NOx Reduction Case SpreadsheetSelective Catalytic Reduction 75 MW turbine with DLN
Turbine Technical DataEngine Size (MW) 75Initial NOx value (ppm) 15Initial NOx massflow (lb/hr) 50.00NOx reduction needed (up to 40%) 80%Engine heat rate (BTU/KWhr) 10,000Outlet NOx Value (ppm) 3.00Outlet NOx massflow (lb/hr) 10.00Project Economic Data# of months/year NOx reduction needed 5Capacity Factor 85%Primary Fuel Cost ($/MMBTU) $2.25Primary Fuel Escalation (%/yr.) 2.6%Heat Rate Increase 0.5%Cost of Ammonia ($/ton) $360.00Ammonia Escalation (%/yr.) 2.6%Catalyst Cost ($/m3) $14,000Op Hrs Between Catalyst Replacement 42,000Estimated Fixed O&M in first year $20,000Labor&Fixed O&M Escalation (%/yr.) 2.6%Captial cost, ($/KW) $60Capital Cost ($) $4,500,000Cost of Equity Capital (%) 15.0%Cost of Debt (%) 7.5%Cost of Preferred Equity (%) 6.0%% financed with debt (%) 40.0%Term of debt financing (years) 15% financed with Common Equity 60.0%% financed with Preferred Equity 0.0%WACC, % 11.0%Income tax rate (%) 35.0%Projected inflation rate (%) 2.6%Evaluation period of Project (yrs) 15Property Tax rate ($/$1,000) $15.00ACT pretax marginal rate of return 10.0%
Process Analysis
Gas Turbine SCRMW 75.0lb/hr NOx reduced 40.00lbmole/hr NOx reduced 0.87Pri. Fuel Cost, $/MMBTU $2.25Pri. Fuel Cost, $/hr @ full load $1,688Ammonia Cost ($/ton) $360.00Ammonia Cost ($/lbmole) $3.06Ammonia usage (lbmole/hr) 0.9Ammonia usage (lb/hr) 14.78Ammonia Cost ($/hr) $2.66Approx Catalyst Loading (m3) 57Heat Rate Increase 0.50%Uncontrolled NOx 15.00Controlled NOx 3.00Capital Cost, includes license ($/KW) 4,500,000Fixed O&M ($/yr.) $20,000Capacity factor 0.85Months NOx reduction in service 5.00Projected Book Life, yrs 15.00Ann. NOx Red'n, tons 62

IV-23
Cash FlowsAll values shown in current dollars, except where indicated otherwise
Year0 1 2 3
Operating CostsUncontrolled fuel Cost $0 ($12,565,125) ($12,891,818) ($13,227,006)Controlled Fuel Cost $0 ($12,628,266) ($12,956,601) ($13,293,473)ammonia cost $0 ($8,255) ($8,469) ($8,689)annual catalyst addition ($142,063) ($145,757) ($149,547)Total Variable O&M ($213,459) ($219,009) ($224,704)Fixed O&M $0 ($20,000) ($20,520) ($21,054)Total O&M (incl. Dif. Fuel) $0 ($233,459) ($239,529) ($245,757)
Total Capital Cost $4,500,000Financed with Common Equity ($2,700,000)Financed with Preferred Equity $0Preferred Dividends $0 $0 $0Amount financed w/ debt ($1,800,000)Debt payments ($203,917) ($203,917) ($203,917)Interest portion of payment ($135,000) ($129,831) ($124,275)MACRS 10 yr. 10% 18% 14%Depreciation (MACRS) ($450,000) ($810,000) ($630,000)EOP Book Value $4,500,000 $4,050,000 $3,240,000 $2,610,000Property Taxes (net of income tax effect) ($67,500) ($60,750) ($48,600)Adustment for Income taxes $262,836 $388,598 $323,525Net Cash Flow (current $, incl fin.) ($2,700,000) ($242,041) ($115,599) ($174,749)Net Cash Flow (current $, excl fin.) ($4,500,000) ($38,124) $88,318 $29,168Capital Expenditure Annuity @ WACC ($624,067) ($624,067) ($624,067)NCF with annualized capital ($662,191) ($535,749) ($594,899)Current $ $/ton of NOx reduced ($10,672.96) ($8,635.01) ($9,588.38)NCF w/ann cap. Discount by infl rate ($645,410) ($508,940) ($550,809)Sum of discounted NCF ($8,686,939)TOTAL Tons NOx reduced Proj. Life 931$/ton NOx reduced (after taxes) ($9,334)
Before Tax Net Cash Flow ($925,027) ($924,347) ($918,424)Discounted Before Tax NCF ($901,585) ($878,092) ($850,357)Sum of discounted Before Tax NCF ($11,380,334)
931$/ton NOx reduced (before tax basis) ($12,228)
Annual Capital Recovery ($495,000)Annual O&M ($233,459)Total Annual Cost ($728,459)Annual NOx reduced (tons) 62$/ton (per ACT document) ($11,741)Average of both before-tax methods $11,985

IV-24
NOx Reduction Case SpreadsheetSelective Catalytic Reduction - std combustor
Turbine Technical DataEngine Size (MW) 75Initial NOx value (ppm) 154Initial NOx massflow (lb/hr) 513.28NOx reduction needed (up to 40%) 90%Engine heat rate (BTU/KWhr) 10,000Outlet NOx Value (ppm) 15.00Outlet NOx massflow (lb/hr) 50.00
Project Economic Data# of months/year NOx reduction needed 5Capacity Factor 85%Primary Fuel Cost ($/MMBTU) $2.25Primary Fuel Escalation (%/yr.) 2.6%Heat Rate Increase 0.5%Cost of Ammonia ($/ton) $360.00Ammonia Escalation (%/yr.) 2.6%Catalyst Cost ($/m3) $14,000Op Hrs Between Catalyst Replacement 42,000Estimated Fixed O&M in first year $20,000Labor&Fixed O&M Escalation (%/yr.) 2.6%Captial cost, ($/KW) $60Capital Cost ($) $4,500,000Cost of Equity Capital (%) 15.0%Cost of Debt (%) 7.5%Cost of Preferred Equity (%) 6.0%% financed with debt (%) 40.0%Term of debt financing (years) 15% financed with Common Equity 60.0%% financed with Preferred Equity 0.0%WACC, % 11.0%Income tax rate (%) 35.0%Projected inflation rate (%) 2.6%Evaluation period of Project (yrs) 15Property Tax rate ($/$1,000) $15.00ACT pretax marginal rate of return 10.0%
Process Analysis
Gas Turbine SCRMW 75.0lb/hr NOx reduced 463.29lbmole/hr NOx reduced 10.07Pri. Fuel Cost, $/MMBTU $2.25Pri. Fuel Cost, $/hr @ full load $1,688Ammonia Cost ($/ton) $360.00Ammonia Cost ($/lbmole) $3.06Ammonia usage (lbmole/hr) 10.1Ammonia usage (lb/hr) 171.21Ammonia Cost ($/hr) $30.82Approx Catalyst Loading (m3) 57Heat Rate Increase 0.50%Uncontrolled NOx 154.00Controlled NOx 15.00Capital Cost, includes license ($/KW) 4,500,000Fixed O&M ($/yr.) $20,000Capacity factor 0.85Months NOx reduction in service 5.00Projected Book Life, yrs 15.00Ann. NOx Red'n, tons 719

IV-25
Cash FlowsAll values shown in current dollars, except where indicated otherwise
Year0 1 2 3
Operating CostsUncontrolled fuel Cost $0 ($12,565,125) ($12,891,818) ($13,227,006)Controlled Fuel Cost $0 ($12,628,266) ($12,956,601) ($13,293,473)ammonia cost $0 ($95,615) ($98,101) ($100,651)annual catalyst addition ($142,063) ($145,757) ($149,547)Total Variable O&M ($300,820) ($308,641) ($316,666)Fixed O&M $0 ($20,000) ($20,520) ($21,054)Total O&M (incl. Dif. Fuel) $0 ($320,820) ($329,161) ($337,719)Total Capital Cost $4,500,000Financed with Common Equity ($2,700,000)Financed with Preferred Equity $0Preferred Dividends $0 $0 $0Amount financed w/ debt ($1,800,000)Debt payments ($203,917) ($203,917) ($203,917)Interest portion of payment ($135,000) ($129,831) ($124,275)MACRS 10 yr. 10% 18% 14%Depreciation (MACRS) ($450,000) ($810,000) ($630,000)EOP Book Value $4,500,000 $4,050,000 $3,240,000 $2,610,000Property Taxes (net of income tax effect) ($67,500) ($60,750) ($48,600)Adustment for Income taxes $293,412 $419,969 $355,712Net Cash Flow (current $, incl fin.) ($2,700,000) ($298,825) ($173,859) ($234,524)Net Cash Flow (current $, excl fin.) ($4,500,000) ($94,908) $30,058 ($30,607)Capital Expenditure Annuity @ WACC ($624,067) ($624,067) ($624,067)NCF with annualized capital ($718,975) ($594,009) ($654,675)Current $ $/ton of NOx reduced ($1,000.42) ($826.54) ($910.95)NCF w/ann cap. Discount by infl rate ($700,755) ($564,285) ($606,155)Sum of discounted NCF ($9,517,118)TOTAL Tons NOx reduced Proj. Life 10,780$/ton NOx reduced (after taxes) ($883)Before Tax Net Cash Flow ($1,012,387) ($1,013,978) ($1,010,386)Discounted Before Tax NCF ($986,732) ($963,239) ($935,504)Sum of discounted Before Tax NCF ($12,657,532)
10,780$/ton NOx reduced (before tax basis) ($1,174)Annual Capital Recovery ($495,000)Annual O&M ($320,820)Total Annual Cost ($815,820)Annual NOx reduced (tons) 719$/ton (per ACT document) ($1,135)
Average of both before tax methods, $/ton $1,155

IV-26
NOx Reduction Case SpreadsheetSelective Catalytic Reduction 75 MW GT with diluent injection
Turbine Technical DataEngine Size (MW) 75Initial NOx value (ppm) 42Initial NOx massflow (lb/hr) 139.99NOx reduction needed (up to 40%) 83%Engine heat rate (BTU/KWhr) 10,000Outlet NOx Value (ppm) 7.00Outlet NOx massflow (lb/hr) 23.33
Project Economic Data# of months/year NOx reduction needed 5Capacity Factor 85%Primary Fuel Cost ($/MMBTU) $2.25Primary Fuel Escalation (%/yr.) 2.6%Heat Rate Increase 0.5%Cost of Ammonia ($/ton) $360.00Ammonia Escalation (%/yr.) 2.6%Catalyst Cost ($/m3) $14,000Op Hrs Between Catalyst Replacement 42,000Estimated Fixed O&M in first year $20,000Labor&Fixed O&M Escalation (%/yr.) 2.6%Captial cost, ($/KW) $60Capital Cost ($) $4,500,000Cost of Equity Capital (%) 15.0%Cost of Debt (%) 7.5%Cost of Preferred Equity (%) 6.0%% financed with debt (%) 40.0%Term of debt financing (years) 15% financed with Common Equity 60.0%% financed with Preferred Equity 0.0%WACC, % 11.0%Income tax rate (%) 35.0%Projected inflation rate (%) 2.6%Evaluation period of Project (yrs) 15Property Tax rate ($/$1,000) $15.00ACT pretax marginal rate of return 10.0%
Process Analysis
Gas Turbine SCRMW 75.0lb/hr NOx reduced 116.66lbmole/hr NOx reduced 2.54Pri. Fuel Cost, $/MMBTU $2.25Pri. Fuel Cost, $/hr @ full load $1,688Ammonia Cost ($/ton) $360.00Ammonia Cost ($/lbmole) $3.06Ammonia usage (lbmole/hr) 2.5Ammonia usage (lb/hr) 43.11Ammonia Cost ($/hr) $7.76Approx Catalyst Loading (m3) 57Heat Rate Increase 0.50%Uncontrolled NOx 42.00Controlled NOx 7.00Capital Cost, includes license 4,500,000Fixed O&M ($/yr.) $20,000Capacity factor 0.85Months NOx reduction in service 5.00Projected Book Life, yrs 15.00Ann. NOx Red'n, tons 181

IV-27
Cash FlowsAll values shown in current dollars, except where indicated otherwise
Year0 1 2 3
Operating CostsUncontrolled fuel Cost $0 ($12,565,125) ($12,891,818) ($13,227,006)Controlled Fuel Cost $0 ($12,628,266) ($12,956,601) ($13,293,473)ammonia cost $0 ($24,076) ($24,702) ($25,344)annual catalyst addition ($142,063) ($145,757) ($149,547)Total Variable O&M ($229,280) ($235,242) ($241,358)Fixed O&M $0 ($20,000) ($20,520) ($21,054)Total O&M (incl. Dif. Fuel) $0 ($249,280) ($255,762) ($262,412)Total Capital Cost $4,500,000Financed with Common Equity ($2,700,000)Financed with Preferred Equity $0Preferred Dividends $0 $0 $0Amount financed w/ debt ($1,800,000)Debt payments ($203,917) ($203,917) ($203,917)Interest portion of payment ($135,000) ($129,831) ($124,275)MACRS 10 yr. 10% 18% 14%Depreciation (MACRS) ($450,000) ($810,000) ($630,000)EOP Book Value $4,500,000 $4,050,000 $3,240,000 $2,610,000Property Taxes (net of income tax effect) ($67,500) ($60,750) ($48,600)Adustment for Income taxes $268,373 $394,279 $329,354Net Cash Flow (current $, incl fin.) ($2,700,000) ($252,324) ($126,150) ($185,575)Net Cash Flow (current $, excl fin.) ($4,500,000) ($48,407) $77,767 $18,342Capital Expenditure Annuity @ WACC ($624,067) ($624,067) ($624,067)NCF with annualized capital ($672,475) ($546,300) ($605,725)Current $ $/ton of NOx reduced ($3,716.13) ($3,018.88) ($3,347.27)NCF w/ann cap. Discount by infl rate ($655,433) ($518,963) ($560,833)Sum of discounted NCF ($8,837,286)TOTAL Tons NOx reduced Proj. Life 2,714$/ton NOx reduced (after taxes) ($3,256)Before Tax Net Cash Flow ($940,848) ($940,579) ($935,079)Discounted Before Tax NCF ($917,006) ($893,512) ($865,777)Sum of discounted Before Tax NCF ($11,611,637)
2,714$/ton NOx reduced (before tax basis) ($4,278)Annual Capital Recovery ($495,000)Annual O&M ($249,280)Total Annual Cost ($744,280)Annual NOx reduced (tons) 181$/ton (per ACT document) ($4,113)
Average of both before-tax methods, $/ton $4,195

IV-28
NOx Case WorksheetGT-Dry Low NOx: Two Solar CentaurEngine Technical DataTarget Engine Size, (hp) 9,400 two CentaursInitial NOx value (ppm) 135Initial NOx massflow (lb/hr) 44NOx reduction needed (up to 40%) 63%Engine heat rate (BTU/KWhr) 7,960Outlet NOx Value (ppm) 50.00Outlet NOx massflow (lb/hr) 16.11Project Economic Data# of months/year NOx reduction needed 5Capacity Factor 95%Primary Fuel Cost ($/MMBTU) $2.25Primary Fuel Escalation (%/yr.) 2.6%Estimated Fixed O&M in first year $15,000Labor&Fixed O&M Escalation (%/yr.) 2.6%heat rate increase 0.00%Capital Cost ($) $1,550,000Capital Cost ($/HP) $165Cost of Equity Capital (%) 15.0%Cost of Debt (%) 7.5%Cost of Preferred Equity (%) 6.0%% financed with debt (%) 40.0%Term of debt financing (years) 15% financed with Common Equity 60.0%% financed with Preferred Equity 0.0%WACC, % (after tax) 11.0%WACC, % (before tax) 12.0%Income tax rate (%) 35.0%Projected inflation rate (%) 2.6%Evaluation period of Project (yrs) 15Property Tax rate ($/$1,000) $15.00ACT Pretax Marginal Rate of Return 10.0%
Process AnalysisPlantNameplate HP 9,400Pri. Fuel Cost, $/MMBTU $2.25Pri. Fuel Cost, $/hr $126Uncontrolled NOx (ppm) 135.00Controlled NOx 50.00Capital Cost $1,550,000Fixed O&M ($/yr.) $15,000Capacity factor 0.95Months NOx reduction in service 5.00Projected Book Life, yrs 15.00Ann. NOx Red'n, tons 47

IV-29
Year0 1 2 3
Operating CostsUncontrolled fuel Cost $0 $1,045,177 $1,072,352 $1,100,233Controlled Fuel Cost $0 $1,045,177 $1,072,352 $1,100,233Variable O&M $0 $0 $0
Fixed O&M $0 ($15,000) ($15,390) ($15,790)
Total O&M + dif. Fuel $0 ($15,000) ($15,390) ($15,790)
Total Capital Cost $1,550,000Financed with Common Equity ($930,000)Financed with Preferred Equity $0Preferred Dividends $0 $0 $0Amount financed w/ debt ($620,000)Debt payments ($70,238) ($70,238) ($70,238)Interest portion of payment ($46,500) ($44,720) ($42,806)MACRS 10 yr. 10% 18% 14%Depreciation (MACRS) ($155,000) ($279,000) ($217,000)EOP Book Value $1,550,000 $1,395,000 $1,116,000 $899,000Property Taxes ($23,250) ($20,925) ($16,740)
Adj for income tax effect of depn, oper exp,and prop tax
$67,638 $110,360 $87,336
Net Cash Flow (current $, incl fin.) ($930,000) ($40,851) $3,807 ($15,433)Net Cash Flow (current $, excl fin.) ($1,550,000) $29,388 $74,045 $54,805Capital Expenditure Annuity @ WACC ($214,956) ($214,956) ($214,956)Before Tax Capital Expend Annuity ($227,578) ($227,578) ($227,578)NCF with annualized capital ($185,569) ($140,911) ($160,151)Current $ $/ton of NOx reduced ($3,907.14) ($2,966.87) ($3,371.97)NCF w/ann cap. Discount by infl rate ($180,866) ($133,860) ($148,282)Sum of discounted NCF ($2,370,546)TOTAL Tons NOx reduced Proj. Life 712$/ton NOx reduced (after taxes) ($3,327)
Before Tax Net Cash Flow ($265,828) ($263,893) ($260,108)Discounted Before Tax NCF ($259,091) ($250,687) ($240,830)Sum of discounted Before Tax NCF ($3,118,674)
712$/ton NOx reduced (before tax basis) ($4,378)
Annual Capital Recovery ($203,784)Annual O&M ($15,000)Total Annual Cost ($218,784)Annual NOx reduced (tons) 47$/ton (per ACT document) ($4,606) Using method of ACT document
Average ($/ton)-both methods ($4,492)

IV-30
NOx Case WorksheetGT-Dry Low NOx: Two Solar Mars 13000Engine Technical DataTarget Engine Size, (hp) 26,000Initial NOx value (ppm) 167Initial NOx massflow (lb/hr) 135NOx reduction needed (up to 40%) 70%Engine heat rate (BTU/KWhr) 7,960Final NOx Value (ppm) 50.00Final NOx massflow (lb/hr) 40.31Project Economic Data# of months/year NOx reduction needed 12Capacity Factor 95%Primary Fuel Cost ($/MMBTU) $2.25Primary Fuel Escalation (%/yr.) 2.6%Estimated Fixed O&M in first year $15,000Labor&Fixed O&M Escalation (%/yr.) 2.6%heat rate increase 0.00%Capital Cost ($) $3,900,000Capital Cost ($/HP) $150Cost of Equity Capital (%) 15.0%Cost of Debt (%) 7.5%Cost of Preferred Equity (%) 6.0%% financed with debt (%) 40.0%Term of debt financing (years) 15% financed with Common Equity 60.0%% financed with Preferred Equity 0.0%WACC, % 11.0%Before Tax WACC 12.0%Income tax rate (%) 35.0%Projected inflation rate (%) 2.6%Evaluation period of Project (yrs) 15Property Tax rate ($/$1,000) $15.00ACT Pretax Marginal Rate of Return 10.0%
Process Analysis
PlantNameplate HP 26,000Pri. Fuel Cost, $/MMBTU $2.25Pri. Fuel Cost, $/hr $347Uncontrolled NOx (ppm) 167.00Controlled NOx 50.00Capital Cost $3,900,000Fixed O&M ($/yr.) $15,000Capacity factor 0.95Months NOx reduction in service 12.00Projected Book Life, yrs 15.00Ann. NOx Red'n, tons 392

IV-31
Year0 1 2 3
Operating CostsUncontrolled fuel Cost $0 ($2,890,916) ($2,966,080) ($3,043,198)Controlled Fuel Cost $0 ($2,890,916) ($2,966,080) ($3,043,198)Variable O&M $0 $0 $0
Fixed O&M $0 ($15,000) ($15,390) ($15,790)
Total O&M + dif. Fuel $0 ($15,000) ($15,390) ($15,790)
Total Capital Cost $3,900,000Financed with Common Equity ($2,340,000)Financed with Preferred Equity $0Preferred Dividends $0 $0 $0Amount financed w/ debt ($1,560,000)Debt payments ($176,728) ($176,728) ($176,728)Interest portion of payment ($117,000) ($112,520) ($107,705)MACRS 10 yr. 10% 18% 14%Depreciation (MACRS) ($390,000) ($702,000) ($546,000)EOP Book Value $3,900,000 $3,510,000 $2,808,000 $2,262,000Property Taxes ($58,500) ($52,650) ($42,120)
Adj for income tax effect of depn, operexp, and prop tax
$162,225 $269,514 $211,369
Net Cash Flow (current $, incl fin.) ($2,340,000) ($88,003) $24,746 ($23,270)Net Cash Flow (current $, excl fin.) ($3,900,000) $88,725 $201,474 $153,458Capital Expenditure Annuity @ WACC ($540,858) ($540,858) ($540,858)Before Tax Capital Expend Annuity ($572,615) ($572,615) ($572,615)NCF with annualized capital ($452,133) ($339,384) ($387,400)Current $ $/ton of NOx reduced ($1,151.98) ($864.71) ($987.05)NCF w/ann cap. Discount by infl rate ($440,676) ($322,401) ($358,688)Sum of discounted NCF ($5,748,484)TOTAL Tons NOx reduced Proj. Life 5,887$/ton NOx reduced (after taxes) ($976)
Before Tax Net Cash Flow ($646,115) ($640,655) ($630,525)Discounted Before Tax NCF ($629,741) ($608,596) ($583,795)Sum of discounted Before Tax NCF ($7,514,502)
5,887$/ton NOx reduced (before tax basis) ($1,276)
Annual Capital Recovery ($512,748)Annual O&M ($15,000)Total Annual Cost ($527,748)Annual NOx reduced (tons) 392$/ton (per ACT document) ($1,345) Using method of ACT document
Average ($/ton)-both methods ($1,311)

IV-32
NOx Reduction Case SpreadsheetSelective Catalytic Reduction
Turbine Technical DataEngine Size (hp) 7,000 HP 5.28 MWInitial NOx value (ppm) 42Initial NOx massflow (lb/hr) 9NOx reduction needed (up to 40%) 88%Engine heat rate (BTU/KWhr) 11,000Outlet NOx Value (ppm) 5.00Outlet NOx massflow (lb/hr) 1.11
Project Economic Data# of months/year NOx reduction needed 5Capacity Factor 85%Primary Fuel Cost ($/MMBTU) $2.25Primary Fuel Escalation (%/yr.) 2.6%Heat Rate Increase 0.5%Cost of Ammonia ($/ton) $360.00Ammonia Escalation (%/yr.) 2.6%Catalyst Cost ($/m3) $14,000Op Hrs Between Catalyst Replacement 42,000Estimated Fixed O&M in first year $20,000Labor&Fixed O&M Escalation (%/yr.) 2.6%Captial cost, ($/KW) $225Capital Cost ($) $1,174,950Cost of Equity Capital (%) 15.0%Cost of Debt (%) 7.5%Cost of Preferred Equity (%) 6.0%% financed with debt (%) 40.0%Term of debt financing (years) 15% financed with Common Equity 60.0%% financed with Preferred Equity 0.0%WACC, % 11.0%Before Tax WACC 12.0%Income tax rate (%) 35.0%Projected inflation rate (%) 2.6%Evaluation period of Project (yrs) 15Property Tax rate ($/$1,000) $15.00ACT pretax marginal rate of return 10.0%
Process AnalysisGas Turbine SCRMW 7,000.0lb/hr NOx reduced 8.22lbmole/hr NOx reduced 0.18Pri. Fuel Cost, $/MMBTU $2.25Pri. Fuel Cost, $/hr @ full load $129Ammonia Cost ($/ton) $360.00Ammonia Cost ($/lbmole) $3.06Ammonia usage (lbmole/hr) 0.2Ammonia usage (lb/hr) 3.04Ammonia Cost ($/hr) $0.55Approx Catalyst Loading (m3) 16Heat Rate Increase 0.50%Uncontrolled NOx 42.00Controlled NOx 5.00Capital Cost, includes license ($/KW) 1,174,950Fixed O&M ($/yr.) $20,000Capacity factor 0.85Months NOx reduction in service 5.00Projected Book Life, yrs 15.00Ann. NOx Red'n, tons 13

IV-33
Year0 1 2 3
Operating CostsUncontrolled fuel Cost $0 ($962,355) ($987,376) ($1,013,048)Controlled Fuel Cost $0 ($967,190) ($992,337) ($1,018,138)ammonia cost $0 ($1,696) ($1,740) ($1,786)annual catalyst addition ($40,835) ($41,896) ($42,986)Total Variable O&M ($47,367) ($48,598) ($49,862)
Fixed O&M $0 ($20,000) ($20,520) ($21,054)
Total O&M (incl. dif. Fuel) $0 ($67,367) ($69,118) ($70,915)
Total Capital Cost $1,174,950Financed with Common Equity ($704,970)Financed with Preferred Equity $0Preferred Dividends $0 $0 $0Amount financed w/ debt ($469,980)Debt payments ($53,243) ($53,243) ($53,243)Interest portion of payment ($35,249) ($33,899) ($32,448)MACRS 10 yr. 10% 18% 14%Depreciation (MACRS) ($117,495) ($211,491) ($164,493)EOP Book Value $1,174,950 $1,057,455 $845,964 $681,471Property Taxes (net of income tax effect) ($17,624) ($15,862) ($12,689)
Adj for income tax effect of depn, proptax, oper exp
$70,870 $103,765 $86,834
Net Cash Flow (current $, incl fin.) ($704,970) ($67,364) ($34,458) ($50,013)Net Cash Flow (current $, excl fin.) ($1,174,950) ($14,121) $18,785 $3,229Capital Expenditure Annuity @ WACC ($162,944) ($162,944) ($162,944)Before Tax Capital Expenditure Annuity ($172,511) ($172,511) ($172,511)NCF with annualized capital ($177,065) ($144,159) ($159,715)Current $ $/ton of NOx reduced ($13,887.26) ($11,306.46) ($12,526.47)NCF w/ann cap. discount by infl rate ($172,578) ($136,945) ($147,878)Sum of discounted NCF ($2,329,079)TOTAL Tons NOx reduced Proj. Life 191$/ton NOx reduced (after taxes) ($12,178)
Before Tax Net Cash Flow ($257,502) ($257,491) ($256,116)Discounted Before Tax NCF ($250,977) ($244,606) ($237,134)Sum of discounted Before Tax NCF ($3,182,715)
191$/ton NOx reduced (before tax basis) $16,641
Annual Capital Recovery ($129,245)Annual O&M ($67,367)Total Annual Cost ($196,611)Annual NOx reduced (tons) 13$/ton (per ACT document) ($15,420) Consistent with method of ACT document
$16,031 Average

IV-34
Reciprocating Internal Combustion Engine Worksheets
NOx Case WorksheetClean Burn-IC - med speed: four 2,500 hp engines
Engine Technical DataTarget Engine Size 10,000Initial NOx value (gm/hp-hr) 15NOx reduction needed (up to 40%) 80%Engine heat rate (BTU/KWhr) 7,500Outlet NOx Value 3.00
Project Economic Data# of months/year NOx reduction needed 5Capacity Factor 45%Primary Fuel Cost ($/MMBTU) $2.25Primary Fuel Escalation (%/yr.) 2.6%Estimated Fixed O&M in first year $8,000Labor&Fixed O&M Escalation (%/yr.) 2.6%heat rate increase -1.00%Capital Cost ($) $2,000,000Cost of Equity Capital (%) 15.0%Cost of Debt (%) 7.5%Cost of Preferred Equity (%) 6.0%% financed with debt (%) 40.0%Term of debt financing (years) 15% financed with Common Equity 60.0%% financed with Preferred Equity 0.0%WACC, % 11.0%Income tax rate (%) 35.0%Projected inflation rate (%) 2.6%Evaluation period of Project (yrs) 15Property Tax rate ($/$1,000) $15.00ACT Pretax Marginal Rate of Return 10.0%
Process Analysis
PlantNameplate HP 10,000Pri. Fuel Cost, $/MMBTU $2.25Pri. Fuel Cost, $/hr $126Uncontrolled NOx 15.00Controlled NOx 3.00Capital Cost, includes license ($/KW) 2,000,000Fixed O&M ($/yr.) $8,000Capacity factor 0.45Months NOx reduction in service 5.00Projected Book Life, yrs 15.00Ann. NOx Red'n, tons 217

IV-35
Cash FlowsAll values shown in current dollars, except where indicated otherwise
Year0 1 2 3
Operating CostsUncontrolled fuel Cost $0 ($496,249) ($509,151) ($522,389)Controlled Fuel Cost $0 ($491,286) ($504,059) ($517,165)Variable O&M $4,962 $5,092 $5,224Fixed O&M $0 ($8,000) ($8,208) ($8,421)Total O&M + dif. Fuel $0 ($3,038) ($3,116) ($3,198)
Total Capital Cost $2,000,000Financed with Common Equity ($1,200,000)Financed with Preferred Equity $0Preferred Dividends $0 $0 $0Amount financed w/ debt ($800,000)Debt payments ($90,630) ($90,630) ($90,630)Interest portion of payment ($60,000) ($57,703) ($55,233)MACRS 10 yr. 10% 18% 14%Depreciation (MACRS) ($200,000) ($360,000) ($280,000)EOP Book Value $2,000,000 $1,800,000 $1,440,000 $1,160,000Property Taxes ($30,000) ($27,000) ($21,600)Adustment for Income taxes $81,563 $136,541 $106,679Net Cash Flow (current $, incl fin.) ($1,200,000) ($42,104) $15,794 ($8,748)Net Cash Flow (current $, excl fin.) ($2,000,000) $48,526 $106,424 $81,882Capital Expenditure Annuity @ WACC ($277,363) ($277,363) ($277,363)NCF with annualized capital ($228,838) ($170,939) ($195,482)Current $ $/ton of NOx reduced ($1,054.21) ($787.48) ($900.54)NCF w/ann cap. discount by infl rate ($223,039) ($162,385) ($180,994)Sum of discounted NCF ($2,903,706)TOTAL Tons NOx reduced Proj. Life 3,256$/ton NOx reduced (after taxes) ($892)
Before Tax Net Cash Flow ($310,401) ($307,480) ($302,161)Discounted Before Tax NCF ($302,535) ($292,093) ($279,767)Sum of discounted Before Tax NCF ($3,585,379)
3,256$/ton NOx reduced (before tax basis) ($1,101)
Annual Capital Recovery ($220,000)Annual O&M ($3,038)Total Annual Cost ($223,038)Annual NOx reduced (tons) 217$/ton (per ACT document) ($1,027)
Average of both before tax methods ($1,064)

IV-36
NOx Case WorksheetClean Burn-IC, four 2,500 hp dual fuel engines
Engine Technical DataTarget Engine Size 10,000Initial NOx value (gm/hp-hr) 15NOx reduction needed (up to 40%) 87%Engine heat rate (BTU/KWhr) 7,000Outlet NOx Value 2.00Project Economic Data# of months/year NOx reduction needed 12Capacity Factor 45%Primary Fuel Cost ($/MMBTU) $2.25Primary Fuel Escalation (%/yr.) 2.6%Estimated Fixed O&M in first year $8,000Labor&Fixed O&M Escalation (%/yr.) 2.6%heat rate increase 0.00%Capital Cost ($) $6,200,000Cost of Equity Capital (%) 15.0%Cost of Debt (%) 7.5%Cost of Preferred Equity (%) 6.0%% financed with debt (%) 40.0%Term of debt financing (years) 15% financed with Common Equity 60.0%% financed with Preferred Equity 0.0%WACC, % 11.0%Income tax rate (%) 35.0%Projected inflation rate (%) 2.6%Evaluation period of Project (yrs) 15Property Tax rate ($/$1,000) $15.00ACT Pretax Marginal Rate of Return 10.0%
Process Analysis
PlantNameplate HP 10,000Pri. Fuel Cost, $/MMBTU $2.25Pri. Fuel Cost, $/hr $117Uncontrolled NOx 15.00Controlled NOx 2.00Capital Cost, includes license ($/KW) 6,200,000Fixed O&M ($/yr.) $8,000Capacity factor 0.45Months NOx reduction in service 12.00Projected Book Life, yrs 15.00Ann. NOx Red'n, tons 564

IV-37
Cash FlowsAll values shown in current dollars, except where indicated otherwise
Year0 1 2 3
Operating CostsUncontrolled fuel Cost $0 ($463,165) ($475,208) ($487,563)Controlled Fuel Cost $0 ($463,165) ($475,208) ($487,563)Variable O&M $0 $0 $0Fixed O&M $0 ($8,000) ($8,208) ($8,421)Total O&M + dif. Fuel $0 ($8,000) ($8,208) ($8,421)
Total Capital Cost $6,200,000Financed with Common Equity ($3,720,000)Financed with Preferred Equity $0Preferred Dividends $0 $0 $0Amount financed w/ debt ($2,480,000)Debt payments ($280,952) ($280,952) ($280,952)Interest portion of payment ($186,000) ($178,879) ($171,223)MACRS 10 yr. 10% 18% 14%Depreciation (MACRS) ($620,000) ($1,116,000) ($868,000)EOP Book Value $6,200,000 $5,580,000 $4,464,000 $3,596,000Property Taxes ($93,000) ($83,700) ($66,960)Adustment for Income taxes $252,350 $422,768 $330,183Net Cash Flow (current $, incl fin.) ($3,720,000) ($129,602) $49,907 ($26,150)Net Cash Flow (current $, excl fin.) ($6,200,000) $151,350 $330,860 $254,802Capital Expenditure Annuity @ WACC ($859,826) ($859,826) ($859,826)NCF with annualized capital ($708,476) ($528,966) ($605,024)Current $ $/ton of NOx reduced ($1,255.31) ($937.25) ($1,072.01)NCF w/ann cap. discount by infl rate ($690,522) ($502,497) ($560,184)Sum of discounted NCF ($8,988,031)TOTAL Tons NOx reduced Proj. Life 8,466$/ton NOx reduced (after taxes) ($1,062)
Before Tax Net Cash Flow ($960,826) ($951,734) ($935,207)Discounted Before Tax NCF ($936,478) ($904,109) ($865,896)Sum of discounted Before Tax NCF ($11,093,970)
8,466$/ton NOx reduced (before tax basis) ($1,310)
Annual Capital Recovery ($682,000)Annual O&M ($8,000)Total Annual Cost ($690,000)Annual NOx reduced (tons) 564$/ton (per ACT document) ($1,223)
Average of both before tax methods ($1,267)

IV-38
NOx Case WorksheetClean Burn-IC: two low speed 3400 hp engines
Engine Technical DataTarget Engine Size 6,800Initial NOx value (gm/hp-hr) 13NOx reduction needed (up to 40%) 77%Engine heat rate (BTU/KWhr) 7,500Outlet NOx Value (gm/hp-hr) 2.99
Project Economic Data# of months/year NOx reduction needed 5Capacity Factor 45%Primary Fuel Cost ($/MMBTU) $2.25Primary Fuel Escalation (%/yr.) 2.6%Estimated Fixed O&M in first year $8,000Labor&Fixed O&M Escalation (%/yr.) 2.6%heat rate increase 0.50%Capital Cost ($) $2,328,000Cost of Equity Capital (%) 15.0%Cost of Debt (%) 7.5%Cost of Preferred Equity (%) 6.0%% financed with debt (%) 40.0%Term of debt financing (years) 15% financed with Common Equity 60.0%% financed with Preferred Equity 0.0%WACC, % 11.0%Income tax rate (%) 35.0%Projected inflation rate (%) 2.6%Evaluation period of Project (yrs) 15Property Tax rate ($/$1,000) $15.00ACT Pretax Marginal Rate of Return 10.0%
Process Analysis
PlantNameplate HP 6,800Pri. Fuel Cost, $/MMBTU $2.25Pri. Fuel Cost, $/hr $86Uncontrolled NOx 13.00Controlled NOx 2.99Capital Cost, includes license ($/KW) 2,328,000Fixed O&M ($/yr.) $8,000Capacity factor 0.45Months NOx reduction in service 5.00Projected Book Life, yrs 15.00Ann. NOx Red'n, tons 123

IV-39
Cash FlowsAll values shown in current dollars, except where indicated otherwise
Year0 1 2 3
Operating CostsUncontrolled fuel Cost $0 ($337,449) ($346,223) ($355,224)Controlled Fuel Cost $0 ($339,136) ($347,954) ($357,001)Variable O&M ($1,687) ($1,731) ($1,776)Fixed O&M $0 ($8,000) ($8,208) ($8,421)Total O&M + dif. Fuel $0 ($9,687) ($9,939) ($10,198)
Total Capital Cost $2,328,000Financed with Common Equity ($1,396,800)Financed with Preferred Equity $0Preferred Dividends $0 $0 $0Amount financed w/ debt ($931,200)Debt payments ($105,493) ($105,493) ($105,493)Interest portion of payment ($69,840) ($67,166) ($64,291)MACRS 10 yr. 10% 18% 14%Depreciation (MACRS) ($232,800) ($419,040) ($325,920)EOP Book Value $2,328,000 $2,095,200 $1,676,160 $1,350,240Property Taxes ($34,920) ($31,428) ($25,142)Adustment for Income taxes $97,093 $161,142 $126,441Net Cash Flow (current $, incl fin.) ($1,396,800) ($53,008) $14,282 ($14,392)Net Cash Flow (current $, excl fin.) ($2,328,000) $52,485 $119,775 $91,101Capital Expenditure Annuity @ WACC ($322,851) ($322,851) ($322,851)NCF with annualized capital ($270,366) ($203,075) ($231,750)Current $ $/ton of NOx reduced ($2,195.78) ($1,649.28) ($1,882.16)NCF w/ann cap. discount by infl rate ($263,514) ($192,914) ($214,574)Sum of discounted NCF ($3,438,372)TOTAL Tons NOx reduced Proj. Life 1,847$/ton NOx reduced (after taxes) ($1,862)
Before Tax Net Cash Flow ($367,458) ($364,218) ($358,191)Discounted Before Tax NCF ($358,146) ($345,992) ($331,644)Sum of discounted Before Tax NCF ($4,263,317)
1,847$/ton NOx reduced (before tax basis) ($2,308)
Annual Capital Recovery ($256,080)Annual O&M ($9,687)Total Annual Cost ($265,767)Annual NOx reduced (tons) 123$/ton (per ACT document) ($2,158)
average of both before tax methods ($2,233)

IV-40
NOx Reduction Case SpreadsheetSelective Catalytic Reduction SCR on dieselIC Engine Technical DataEngine Size (HP) 9390Initial NOx value (gm/hp-hr) 10Initial NOx massflow (lb/hr) 206.8NOx reduction needed (up to 90%) 90%Outlet NOx Value (gm/hp-hr) 1.00Outlet NOx massflow (lb/hr) 20.7Project Economic Data# of months/year NOx reduction needed 5Capacity Factor 85%Primary Fuel Cost ($/MMBTU) $5.00Primary Fuel Escalation (%/yr.) 2.6%Heat Rate (BTU/HP-hr) 5,600Heat Rate Increase 0.5%Cost of Ammonia ($/ton) $360.00Ammonia Escalation (%/yr.) 2.6%Catalyst Cost ($/m3) $14,000Catalyst Volume (ft3) 84Layers of Cat 1Op Hrs Between Catalyst Replacement 24,000 between layer changeEstimated Fixed O&M in first year $23,600Labor&Fixed O&M Escalation (%/yr.) 2.6%Captial cost ($/hp) $109Capital Cost ($) $1,022,220Cost of Equity Capital (%) 15.0%Cost of Debt (%) 7.5%Cost of Preferred Equity (%) 6.0%% financed with debt (%) 40.0%Term of debt financing (years) 15% financed with Common Equity 60.0%% financed with Preferred Equity 0.0%WACC, % 11.0%Before Tax WACC 12.0%Income tax rate (%) 35.0%Projected inflation rate (%) 2.6%Evaluation period of Project (yrs) 15Property Tax rate ($/$1,000) $15.00ACT pretax marginal rate of return 10.0%
Process AnalysisHP 9,390.0lb/hr NOx reduced 186.15lbmole/hr NOx reduced 4.05Pri. Fuel Cost, $/MMBTU $5.00Pri. Fuel Cost, $/hr $263Ammonia Cost ($/ton) $360.00Ammonia Cost ($/lbmole) $3.06Ammonia usage (lbmole/hr) 4.0Ammonia usage (lb/hr) 68.79Ammonia Cost ($/hr) $12.38Approx Catalyst Loading (m3) 2.4Heat Rate Increase 0.50%Uncontrolled NOx 10.00Controlled NOx 1.00Capital Cost, includes license ($/KW) 1,022,220Fixed O&M ($/yr.) $23,600Capacity factor 0.85Months NOx reduction in service 5.00Projected Book Life, yrs 15.00Ann. NOx Red'n, tons 289

IV-41
Cash FlowsAll values shown in current dollars, except where indicated otherwise
Year0 1 2 3
Operating CostsUncontrolled fuel Cost $0 $815,709 $836,918 $858,678Controlled Fuel Cost $0 $819,808 $841,123 $862,993ammonia cost $0 ($38,417) ($39,416) ($40,441)annual catalyst addition ($3,475) ($3,565) ($3,658)Total Variable O&M ($37,793) ($38,776) ($39,784)
Fixed O&M $0 ($23,600) ($24,214) ($24,843)
Total O&M (incl. dif. Fuel) $0 ($61,393) ($62,989) ($64,627)
Total Capital Cost $1,022,220Financed with Common Equity ($613,332)Financed with Preferred Equity $0Preferred Dividends $0 $0 $0Amount financed w/ debt ($408,888)Debt payments ($46,322) ($46,322) ($46,322)Interest portion of payment ($30,667) ($29,492) ($28,230)MACRS 10 yr. 10% 18% 14%Depreciation (MACRS) ($102,222) ($184,000) ($143,111)EOP Book Value $1,022,220 $919,998 $735,998 $592,888Property Taxes (net of income tax effect) ($15,333) ($13,800) ($11,040)
Income tax adj for prop tax, depn, oper exp $62,632 $91,276 $76,572
Net Cash Flow (current $, incl fin.) ($613,332) ($60,416) ($31,835) ($45,417)Net Cash Flow (current $, excl fin.) ($1,022,220) ($14,094) $14,487 $905Capital Expenditure Annuity @ WACC ($141,763) ($141,763) ($141,763)Before Tax Capital Exp Ann ($141,763) ($141,763) ($141,763)NCF with annualized capital ($155,858) ($127,276) ($140,858)Current $ $/ton of NOx reduced ($539.75) ($440.77) ($487.81)NCF w/ann cap. discount by infl rate ($151,908) ($120,907) ($130,418)Sum of discounted NCF ($2,052,774)TOTAL Tons NOx reduced Proj. Life 4,331$/ton NOx reduced (after taxes) ($474)
Before Tax Net Cash Flow ($218,490) ($218,552) ($217,430)Discounted Before Tax NCF ($212,953) ($207,616) ($201,316)Sum of discounted Before Tax NCF ($2,707,386)
4,331$/ton NOx reduced (before tax basis) ($625)
Annual Capital Recovery ($112,444)Annual O&M ($61,393)Total Annual Cost ($173,837)Annual NOx reduced (tons) 289$/ton (per ACT document) ($602.02) Consistent with method of ACT document
$614

IV-42
NOx Reduction Case SpreadsheetSelective Catalytic Reduction large lean burn engine
IC Engine Technical DataEngine Size (HP) 9390 one engineInitial NOx value (gm/hp-hr) 10Initial NOx massflow (lb/hr) 206.8NOx reduction needed (up to 90%) 90%Outlet NOx Value (gm/hp-hr) 1.00Outlet NOx massflow (lb/hr) 20.7
Project Economic Data# of months/year NOx reduction needed 5Capacity Factor 85%Primary Fuel Cost ($/MMBTU) $2.25Primary Fuel Escalation (%/yr.) 2.6%Heat Rate (BTU/HP-hr) 5,600Heat Rate Increase 0.5%Cost of Ammonia ($/ton) $360.00Ammonia Escalation (%/yr.) 2.6%Catalyst Cost ($/m3) $14,000Catalyst Volume (ft3) 63Layers of cat 1Op Hrs Between Catalyst Replacement 24,000 between layer changeEstimated Fixed O&M in first year $23,600Labor&Fixed O&M Escalation (%/yr.) 2.6%Captial cost ($/hp) $97Capital Cost ($) $907,653Cost of Equity Capital (%) 15.0%Cost of Debt (%) 7.5%Cost of Preferred Equity (%) 6.0%% financed with debt (%) 40.0%Term of debt financing (years) 15% financed with Common Equity 60.0%% financed with Preferred Equity 0.0%WACC, % 11.0%Before Tax WACC 12.0%Income tax rate (%) 35.0%Projected inflation rate (%) 2.6%Evaluation period of Project (yrs) 15Property Tax rate ($/$1,000) $15.00ACT pretax marginal rate of return 10.0%Process AnalysisLean IC SCRHP 9,390.0lb/hr NOx reduced 186.15lbmole/hr NOx reduced 4.05Pri. Fuel Cost, $/MMBTU $2.25Pri. Fuel Cost, $/hr $118Ammonia Cost ($/ton) $360.00Ammonia Cost ($/lbmole) $3.06Ammonia usage (lbmole/hr) 4.0Ammonia usage (lb/hr) 68.79Ammonia Cost ($/hr) $12.38Approx Catalyst Loading (m3) 1.8Heat Rate Increase 0.50%Uncontrolled NOx 10.00Controlled NOx 1.00Capital Cost, includes license ($/KW) 907,653Fixed O&M ($/yr.) $23,600Capacity factor 0.85Months NOx reduction in service 5.00Projected Book Life, yrs 15.00Ann. NOx Red'n, tons 289
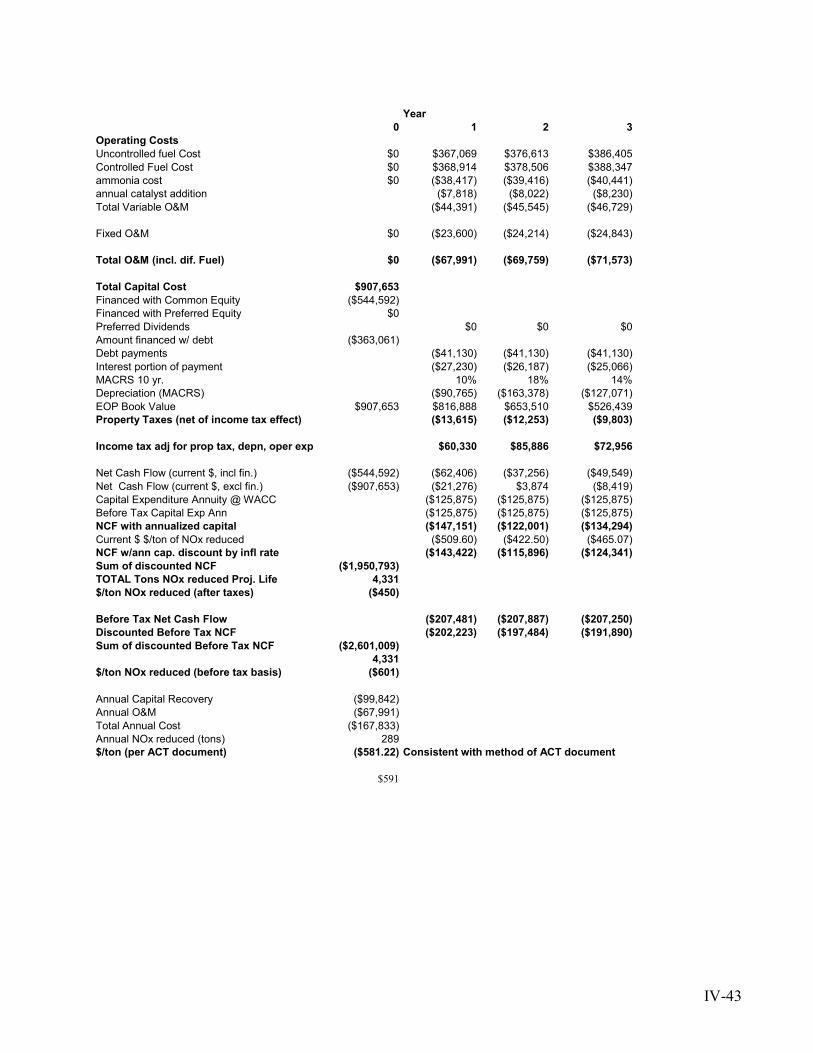
IV-43
Year0 1 2 3
Operating CostsUncontrolled fuel Cost $0 $367,069 $376,613 $386,405Controlled Fuel Cost $0 $368,914 $378,506 $388,347ammonia cost $0 ($38,417) ($39,416) ($40,441)annual catalyst addition ($7,818) ($8,022) ($8,230)Total Variable O&M ($44,391) ($45,545) ($46,729)
Fixed O&M $0 ($23,600) ($24,214) ($24,843)
Total O&M (incl. dif. Fuel) $0 ($67,991) ($69,759) ($71,573)
Total Capital Cost $907,653Financed with Common Equity ($544,592)Financed with Preferred Equity $0Preferred Dividends $0 $0 $0Amount financed w/ debt ($363,061)Debt payments ($41,130) ($41,130) ($41,130)Interest portion of payment ($27,230) ($26,187) ($25,066)MACRS 10 yr. 10% 18% 14%Depreciation (MACRS) ($90,765) ($163,378) ($127,071)EOP Book Value $907,653 $816,888 $653,510 $526,439Property Taxes (net of income tax effect) ($13,615) ($12,253) ($9,803)
Income tax adj for prop tax, depn, oper exp $60,330 $85,886 $72,956
Net Cash Flow (current $, incl fin.) ($544,592) ($62,406) ($37,256) ($49,549)Net Cash Flow (current $, excl fin.) ($907,653) ($21,276) $3,874 ($8,419)Capital Expenditure Annuity @ WACC ($125,875) ($125,875) ($125,875)Before Tax Capital Exp Ann ($125,875) ($125,875) ($125,875)NCF with annualized capital ($147,151) ($122,001) ($134,294)Current $ $/ton of NOx reduced ($509.60) ($422.50) ($465.07)NCF w/ann cap. discount by infl rate ($143,422) ($115,896) ($124,341)Sum of discounted NCF ($1,950,793)TOTAL Tons NOx reduced Proj. Life 4,331$/ton NOx reduced (after taxes) ($450)
Before Tax Net Cash Flow ($207,481) ($207,887) ($207,250)Discounted Before Tax NCF ($202,223) ($197,484) ($191,890)Sum of discounted Before Tax NCF ($2,601,009)
4,331$/ton NOx reduced (before tax basis) ($601)
Annual Capital Recovery ($99,842)Annual O&M ($67,991)Total Annual Cost ($167,833)Annual NOx reduced (tons) 289$/ton (per ACT document) ($581.22) Consistent with method of ACT document
$591

IV-44
NOx Reduction Case SpreadsheetSelective Catalytic Reduction ARIS 2000 on Diesel
IC Engine Technical DataEngine Size (HP) 1971Initial NOx value (gm/hp-hr) 15Initial NOx massflow (lb/hr) 65.1NOx reduction needed (up to 90%) 75%Outlet NOx Value (gm/hp-hr) 3.75Outlet NOx massflow (lb/hr) 16.3
Project Economic Data# of months/year NOx reduction needed 12Capacity Factor 10%Primary Fuel Cost ($/MMBTU) $5.00Primary Fuel Escalation (%/yr.) 2.6%Heat Rate (BTU/HP-hr) 5,600Heat Rate Increase 0.5%32.5% Urea Solution Cost ($/gallon) $0.86Cost of Urea ($/lb) $0.29Ammonia Escalation (%/yr.) 2.6%Catalyst Cost ($/ft3) $1,500Catalyst Volume (ft3) 8.76Op Hrs Between Catalyst Replacement 24,000Estimated Fixed O&M in first year $2,500Labor&Fixed O&M Escalation (%/yr.) 2.6%Captial cost ($/hp) $41Capital Cost ($) $80,000Cost of Equity Capital (%) 15.0%Cost of Debt (%) 7.5%Cost of Preferred Equity (%) 6.0%% financed with debt (%) 40.0%Term of debt financing (years) 15% financed with Common Equity 60.0%% financed with Preferred Equity 0.0%WACC, % 11.0%Before Tax WACC 12.0%Income tax rate (%) 35.0%Projected inflation rate (%) 2.6%Evaluation period of Project (yrs) 15Property Tax rate ($/$1,000) $15.00ACT pretax marginal rate of return 10.0%Process AnalysisDiesel SCR :ARIS 2000HP 1,971.0lb/hr NOx reduced 48.84lbmole/hr NOx reduced 1.06Pri. Fuel Cost, $/MMBTU $5.00Pri. Fuel Cost, $/hr $55Urea Cost ($/lb) $0.29Urea Cost ($/lbmole) $17.64Urea Usage (lbmole/hr) 0.53Urea Usage (lb/hr) 31.85Urea Cost ($/hr) $9.37Approx Catalyst Loading (m3) 0.25Heat Rate Increase 0.50%Uncontrolled NOx 15.00Controlled NOx 3.75Capital Cost, includes license ($/KW) 80,000Fixed O&M ($/yr.) $2,500Capacity factor 0.10Months NOx reduction in service 12.00Projected Book Life, yrs 15.00Ann. NOx Red'n, tons 21

IV-45
Cash FlowsAll values shown in current dollars, except where indicatedotherwise
Year0 1 2 3
Operating CostsUncontrolled fuel Cost $0 $48,345 $49,602 $50,891Controlled Fuel Cost $0 $48,588 $49,851 $51,147Urea Cost $0 ($8,204) ($8,417) ($8,636)annual catalyst addition ($480) ($492) ($505)Total Variable O&M ($8,441) ($8,660) ($8,885)
Fixed O&M $0 ($2,500) ($2,565) ($2,632)
Total O&M (incl. dif. Fuel) $0 ($10,941) ($11,225) ($11,517)
Total Capital Cost $80,000Financed with Common Equity ($48,000)Financed with Preferred Equity $0Preferred Dividends $0 $0 $0Amount financed w/ debt ($32,000)Debt payments ($3,625) ($3,625) ($3,625)Interest portion of payment ($2,400) ($2,308) ($2,209)MACRS 10 yr. 10% 18% 14%Depreciation (MACRS) ($8,000) ($14,400) ($11,200)EOP Book Value $80,000 $72,000 $57,600 $46,400Property Taxes (net of income tax effect) ($1,200) ($1,080) ($864)
Income Tax Adj for prop tax, depn, operexp
$7,049 $9,347 $8,253
Net Cash Flow (current $, incl fin.) ($48,000) ($8,717) ($6,583) ($7,753)Net Cash Flow (current $, excl fin.) ($80,000) ($5,091) ($2,958) ($4,128)Capital Expenditure Annuity @ WACC ($11,095) ($11,095) ($11,095)Before Tax Cap Exp Ann ($11,746) ($11,746) ($11,746)NCF with annualized capital ($16,186) ($14,053) ($15,222)Current $ $/ton of NOx reduced ($756.62) ($656.91) ($711.57)NCF w/ann cap. discount by infl rate ($15,776) ($13,350) ($14,094)Sum of discounted NCF ($218,962)TOTAL Tons NOx reduced Proj. Life 321$/ton NOx reduced (after taxes) ($682)
Before Tax Net Cash Flow ($23,887) ($24,051) ($24,127)Discounted Before Tax NCF ($23,281) ($22,848) ($22,339)Sum of discounted Before Tax NCF ($309,596)
321$/ton NOx reduced (before tax basis) ($965)
Annual Capital Recovery ($8,800)Annual O&M ($10,941)Total Annual Cost ($19,741)Annual NOx reduced (tons) 21$/ton (per ACT document) ($922.79) Consistent with method of ACT document
$944

IV-46
Cement Kiln WorksheetsNOx Reduction Case SpreadsheetKILN - Combustion CemStar
Kiln Technical DataTarget Kiln Size (TPH clinker) 160 four kilns of 40 TPH EachInitial NOx value (pph) 800Initial NOx value (lb/ton clinker) 5.00NOx reduction needed (up to 40%) 20%Outlet NOx Value (pph) 640Outlet NOx Value (lb/ton clinker) 3.70
Project Economic Data# of months/year NOx reduction needed 5Capacity Factor 45%Net Clinker Value ($/ton) $15Heat Input Rate (MMBTU/ton clinker) 6.00Primary Fuel Cost ($/MMBTU) $1.50Primary Fuel Escalation (%/yr.) 2.6%Secondary Fuel Cost ($/MMBTU) $2.25Secondary Fuel Escalation (%/yr.) 2.6%Fuel cost Change -1.0%Slag Fee ($/ton) $16.00Slag Feed Rate (ton/hr) 13 for all four kilnston clinker/ton slag 1.0Estimated Fixed O&M in first year $100,000Labor&Fixed O&M Escalation (%/yr.) 2.6%Capital Cost ($) $1,000,000Cost of Equity Capital (%) 15.0%Cost of Debt (%) 7.5%Cost of Preferred Equity (%) 6.0%% financed with debt (%) 40.0%Term of debt financing (years) 15% financed with Common Equity 60.0%% financed with Preferred Equity 0.0%WACC, % 11.0%Before Tax WACC 12.0%Income tax rate (%) 35.0%Projected inflation rate (%) 2.6%Evaluation period of Project (yrs) 15Property Tax rate ($/$1,000) $15.00Pretax Rate of Return (ACT document) 10.0%
Process Analysis KILN - Combustion
PlantTPH clinker 160lb/hr NOx reduced 160lbmole/hr NOx reduced 3Heat Input (MMBTU/hr) 960Fuel Cost (without NOx control) $9Fuel Cost (with NOx control) $9Fuel Cost Change ($0)Uncontrolled NOx 800.00Controlled NOx 640.00Capital Cost, includes license ($/KW) 1,000,000Fixed O&M ($/yr.) $25,000Capacity factor 0.45Months NOx reduction in service 5.00Projected Book Life, yrs 15.00Ann. NOx Red'n, tons 131

IV-47
Cash FlowsAll values shown in current dollars, except where indicated otherwiseKILN - Combustion Cemstar Year
0 1 2 3Operating CostsInclude Fuel Cost Effect (y / n) yMisc Var O&M ($20,000) ($20,520) ($20,520)Change in Fuel Cost $148 $152 $152Additional Cost for Slag Addition $0 ($832,550) ($854,197) ($854,197)Value of additional production $780,516 $800,809 $800,809Total Variable O&M ($52,034) ($53,387) ($53,387)
Fixed O&M $0 ($10,000) ($10,260) ($10,527)
Total O&M $0 ($62,034) ($63,647) ($63,914)
Total Capital Cost $1,000,000Financed with Common Equity ($600,000)Financed with Preferred Equity $0Preferred Dividends $0 $0 $0Amount financed w/ debt ($400,000)Debt payments ($45,315) ($45,315) ($45,315)Interest portion of payment ($30,000) ($28,851) ($27,617)MACRS 10 yr. 10% 18% 14%Depreciation (MACRS) ($100,000) ($180,000) ($140,000)EOP Book Value $1,000,000 $900,000 $720,000 $580,000Property Taxes ($15,000) ($13,500) ($10,800)
income tax adj for prop tax, depn, oper exp $61,962 $90,002 $75,150
Net Cash Flow (current $, incl fin.) ($600,000) ($60,387) ($32,461) ($44,879)Net Cash Flow (current $, excl fin.) ($1,000,000) ($15,072) $12,854 $436Capital Expenditure Annuity @ WACC ($138,682) ($138,682) ($138,682)Before Tax Cap Exp Ann ($146,824) ($146,824) ($146,824)NCF with annualized capital ($153,754) ($125,827) ($138,246)Current $ $/ton of NOx reduced ($1,170.12) ($957.59) ($1,052.10)NCF w/ann cap. discount by infl rate ($149,858) ($119,531) ($128,000)Sum of discounted NCF ($1,958,104)TOTAL Tons NOx reduced Proj. Life 1,971$/ton NOx reduced (after taxes) ($993)Total Tons Clinker over project life 9,460,800$/ton clinker ($0.21)
Before Tax Net Cash Flow ($223,859) ($223,972) ($221,538)Discounted Before Tax NCF ($218,186) ($212,764) ($205,119)Sum of discounted Before Tax NCF ($2,671,617)TOTAL Tons NOx reduced Proj. Life 1,971$/ton NOx reduced (before tax basis) ($1,355)$/ton clinker ($0.28)
Annual Capital Recovery ($110,000)Annual O&M ($62,034)Total Cost ($172,034)Annual NOx reduced (tons) 131$/ton (per ACT document) ($1,309) Consistent with method of ACT document$/ton clinker ($0.27) average
$1,332$0.28
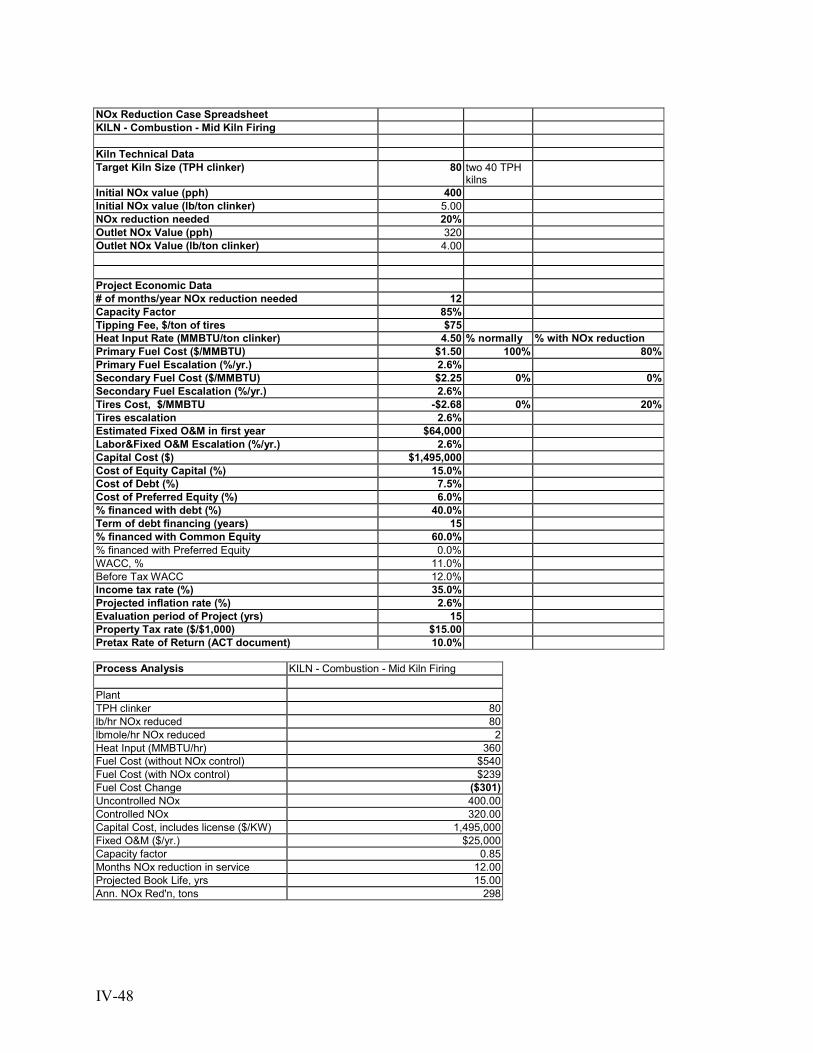
IV-48
NOx Reduction Case SpreadsheetKILN - Combustion - Mid Kiln Firing
Kiln Technical DataTarget Kiln Size (TPH clinker) 80 two 40 TPH
kilnsInitial NOx value (pph) 400Initial NOx value (lb/ton clinker) 5.00NOx reduction needed 20%Outlet NOx Value (pph) 320Outlet NOx Value (lb/ton clinker) 4.00
Project Economic Data# of months/year NOx reduction needed 12Capacity Factor 85%Tipping Fee, $/ton of tires $75Heat Input Rate (MMBTU/ton clinker) 4.50 % normally % with NOx reductionPrimary Fuel Cost ($/MMBTU) $1.50 100% 80%Primary Fuel Escalation (%/yr.) 2.6%Secondary Fuel Cost ($/MMBTU) $2.25 0% 0%Secondary Fuel Escalation (%/yr.) 2.6%Tires Cost, $/MMBTU -$2.68 0% 20%Tires escalation 2.6%Estimated Fixed O&M in first year $64,000Labor&Fixed O&M Escalation (%/yr.) 2.6%Capital Cost ($) $1,495,000Cost of Equity Capital (%) 15.0%Cost of Debt (%) 7.5%Cost of Preferred Equity (%) 6.0%% financed with debt (%) 40.0%Term of debt financing (years) 15% financed with Common Equity 60.0%% financed with Preferred Equity 0.0%WACC, % 11.0%Before Tax WACC 12.0%Income tax rate (%) 35.0%Projected inflation rate (%) 2.6%Evaluation period of Project (yrs) 15Property Tax rate ($/$1,000) $15.00Pretax Rate of Return (ACT document) 10.0%
Process Analysis KILN - Combustion - Mid Kiln Firing
PlantTPH clinker 80lb/hr NOx reduced 80lbmole/hr NOx reduced 2Heat Input (MMBTU/hr) 360Fuel Cost (without NOx control) $540Fuel Cost (with NOx control) $239Fuel Cost Change ($301)Uncontrolled NOx 400.00Controlled NOx 320.00Capital Cost, includes license ($/KW) 1,495,000Fixed O&M ($/yr.) $25,000Capacity factor 0.85Months NOx reduction in service 12.00Projected Book Life, yrs 15.00Ann. NOx Red'n, tons 298

IV-49
KILN - Combustion - Mid Kiln Firing Year0 1 2 3
Operating CostsInclude Fuel Cost Effect (y / n) yMisc Var O&MChange in Fuel Cost $2,240,182Variable O&M $0 $2,240,182 $2,298,427 $2,298,427Total Variable O&M $2,240,182 $2,298,427 $2,298,427
Fixed O&M $0 ($64,000) ($65,664) ($67,371)
Total O&M $0 $2,176,182 $2,232,763 $2,231,056
Total Capital Cost $1,495,000Financed with Common Equity ($897,000)Financed with Preferred Equity $0Preferred Dividends $0 $0 $0Amount financed w/ debt ($598,000)Debt payments ($67,746) ($67,746) ($67,746)Interest portion of payment ($44,850) ($43,133) ($41,287)MACRS 10 yr. 10% 18% 14%Depreciation (MACRS) ($149,500) ($269,100) ($209,300)EOP Book Value $1,495,000 $1,345,500 $1,076,400 $867,100Property Taxes ($22,425) ($20,183) ($16,146)
Income tax adj for prop tax, depn, oper exp ($701,490) ($680,218) ($701,963)
Net Cash Flow (current $, incl fin.) ($897,000) $1,384,521 $1,464,617 $1,445,201Net Cash Flow (current $, excl fin.) ($1,495,000) $1,452,267 $1,532,362 $1,512,946Capital Expenditure Annuity @ WACC ($207,329) ($207,329) ($207,329)Before Tax Cap Exp Ann ($219,502) ($219,502) ($219,502)NCF with annualized capital $1,244,938 $1,325,033 $1,305,617Current $ $/ton of NOx reduced $4,179.89 $4,448.81 $4,383.62NCF w/ann cap. discount by infl rate $1,213,390 $1,258,729 $1,208,854Sum of discounted NCF $15,568,125TOTAL Tons NOx reduced Proj. Life 4,468$/ton NOx reduced (after taxes) $3,485Total Tons Clinker over project life 8,935,200$/ton clinker $1.74
Before Tax Net Cash Flow $1,934,255 $1,993,078 $1,995,408Discounted Before Tax NCF $1,885,239 $1,893,344 $1,847,522Sum of discounted Before Tax NCF $24,460,535TOTAL Tons NOx reduced Proj. Life 4,468$/ton NOx reduced (before tax basis) $5,475$/ton clinker $2.74
Annual Capital Recovery ($164,450)Annual O&M $2,176,182Total Cost $2,011,732Annual NOx reduced (tons) 298$/ton (per ACT document) $6,754 Consistent with method of
ACT document$/ton clinker $3.38
($6,115) average($3.06)
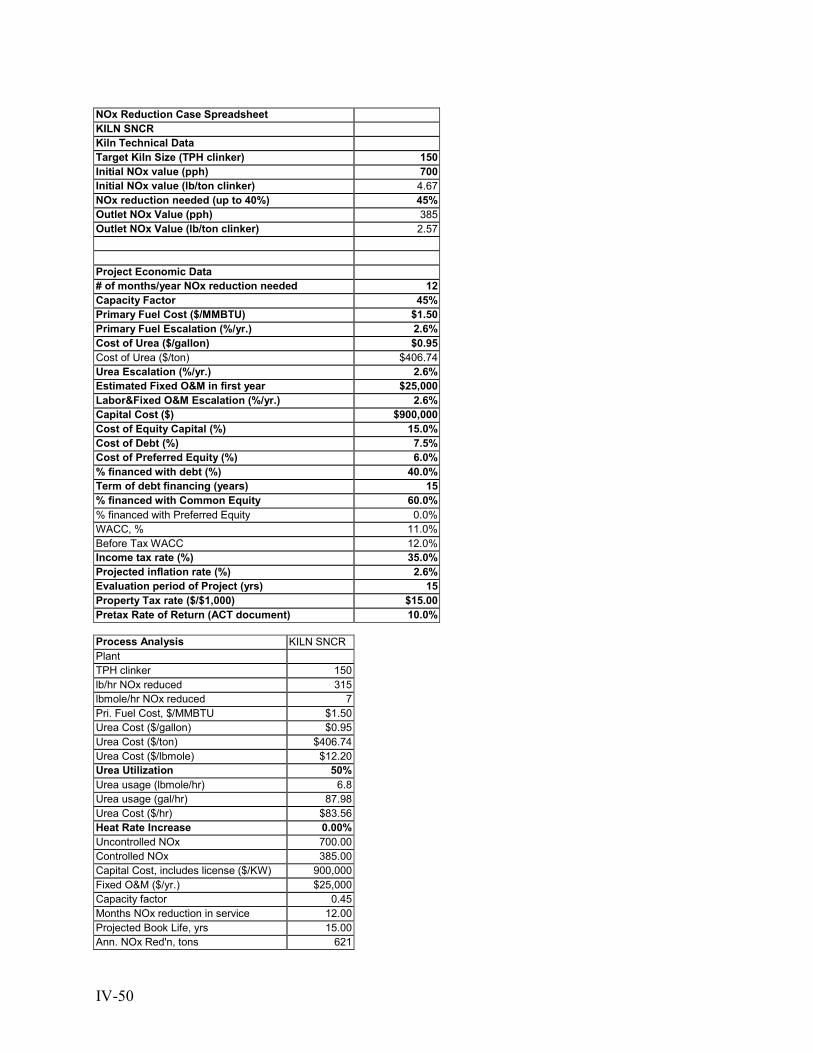
IV-50
NOx Reduction Case SpreadsheetKILN SNCRKiln Technical DataTarget Kiln Size (TPH clinker) 150Initial NOx value (pph) 700Initial NOx value (lb/ton clinker) 4.67NOx reduction needed (up to 40%) 45%Outlet NOx Value (pph) 385Outlet NOx Value (lb/ton clinker) 2.57
Project Economic Data# of months/year NOx reduction needed 12Capacity Factor 45%Primary Fuel Cost ($/MMBTU) $1.50Primary Fuel Escalation (%/yr.) 2.6%Cost of Urea ($/gallon) $0.95Cost of Urea ($/ton) $406.74Urea Escalation (%/yr.) 2.6%Estimated Fixed O&M in first year $25,000Labor&Fixed O&M Escalation (%/yr.) 2.6%Capital Cost ($) $900,000Cost of Equity Capital (%) 15.0%Cost of Debt (%) 7.5%Cost of Preferred Equity (%) 6.0%% financed with debt (%) 40.0%Term of debt financing (years) 15% financed with Common Equity 60.0%% financed with Preferred Equity 0.0%WACC, % 11.0%Before Tax WACC 12.0%Income tax rate (%) 35.0%Projected inflation rate (%) 2.6%Evaluation period of Project (yrs) 15Property Tax rate ($/$1,000) $15.00Pretax Rate of Return (ACT document) 10.0%
Process Analysis KILN SNCRPlantTPH clinker 150lb/hr NOx reduced 315lbmole/hr NOx reduced 7Pri. Fuel Cost, $/MMBTU $1.50Urea Cost ($/gallon) $0.95Urea Cost ($/ton) $406.74Urea Cost ($/lbmole) $12.20Urea Utilization 50%Urea usage (lbmole/hr) 6.8Urea usage (gal/hr) 87.98Urea Cost ($/hr) $83.56Heat Rate Increase 0.00%Uncontrolled NOx 700.00Controlled NOx 385.00Capital Cost, includes license ($/KW) 900,000Fixed O&M ($/yr.) $25,000Capacity factor 0.45Months NOx reduction in service 12.00Projected Book Life, yrs 15.00Ann. NOx Red'n, tons 621

IV-51
KILN SNCR Year0 1 2 3
Operating CostsUrea Cost $0 ($329,386) ($337,950) ($346,737)Total Variable O&M ($329,386) ($337,950) ($346,737)
Fixed O&M $0 ($25,000) ($25,650) ($26,317)
Total O&M $0 ($354,386) ($363,600) ($373,054)
Total Capital Cost $900,000Financed with Common Equity ($540,000)Financed with Preferred Equity $0Preferred Dividends $0 $0 $0Amount financed w/ debt ($360,000)Debt payments ($40,783) ($40,783) ($40,783)Interest portion of payment ($27,000) ($25,966) ($24,855)MACRS 10 yr. 10% 18% 14%Depreciation (MACRS) ($90,000) ($162,000) ($126,000)EOP Book Value $900,000 $810,000 $648,000 $522,000Property Taxes ($13,500) ($12,150) ($9,720)
Income tax adj for oper exp, depn, prop tax $160,260 $188,213 $178,071
Net Cash Flow (current $, incl fin.) ($540,000) ($248,409) ($228,321) ($245,486)Net Cash Flow (current $, excl fin.) ($900,000) ($207,626) ($187,538) ($204,703)Capital Expenditure Annuity @ WACC ($124,813) ($124,813) ($124,813)Before Tax Cap Exp Ann ($132,142) ($132,142) ($132,142)NCF with annualized capital ($332,439) ($312,351) ($329,516)Current $ $/ton of NOx reduced ($535.45) ($503.09) ($530.74)NCF w/ann cap. discount by infl rate ($324,015) ($296,721) ($305,095)Sum of discounted NCF ($4,661,382)TOTAL Tons NOx reduced Proj. Life 9,313$/ton NOx reduced (after taxes) ($501)Total Tons Clinker over project life 8,869,500$/ton clinker ($0.53)
Before Tax Net Cash Flow ($500,028) ($507,892) ($514,915)Discounted Before Tax NCF ($487,357) ($482,477) ($476,753)Sum of discounted Before Tax NCF ($6,864,590)TOTAL Tons NOx reduced Proj. Life 9,313$/ton NOx reduced (before tax basis) ($737)$/ton clinker ($0.77)
Annual Capital Recovery ($99,000)Annual O&M ($354,386)Total Cost ($453,386)Annual NOx reduced (tons) 621$/ton (per ACT document) ($730.25) Consistent with method of ACT document$/ton clinker ($0.77)avg $/ton NOx ($734)avg $/ton clinker ($0.77)