status of gcos upper-air reference network planning achieving satellite instrument calibration for...
Post on 22-Dec-2015
214 views
TRANSCRIPT

Status of GCOS Upper-Air Reference Network Planning
Achieving Satellite Instrument Calibration for Climate Change Workshop16-18 May 2006, Landsdowne, VA
Dian SeidelNOAA Air Resources Laboratory
Silver Spring, Maryland
2
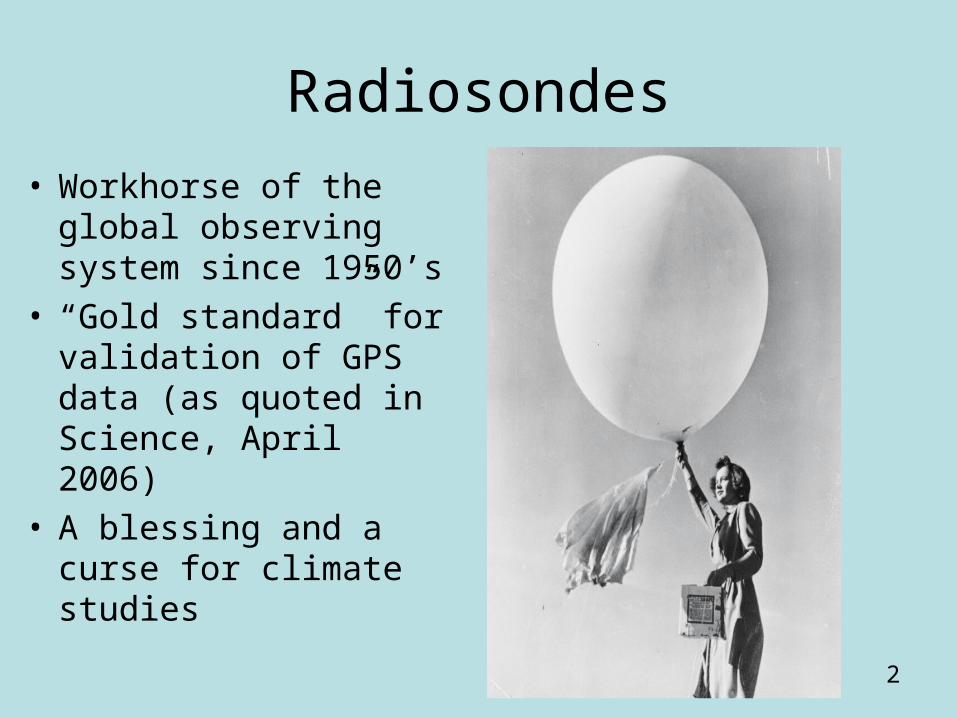
Radiosondes
• Workhorse of the global observing system since 1950’s
• “Gold standard” for validation of GPS data (as quoted in Science, April 2006)
• A blessing and a curse for climate studies
3
Value of In Situ Sounding Data
• High vertical resolution• Possibility of co-located measurements of
a suite of variables• Continuity with historical radiosonde
archive• Independent alternative to remotely
sensed observations• Potential for calibration of satellite
observations

4
Inadequacy of Exisiting Radiosonde Network for Climate Monitoring
• Observations from many networks - by many types of instruments - are not referenced to standards, or to each other.
• Instrument and observing method changes are not well documented, and there is no overlap to guide data adjustments.
• Humidity observations are not accurate enough, particularly in cold, dry regions.
5
6
Need for a Reference Upper-Air Network
• To ensure that climate monitoring findings, climate projections and predictions, and climate policy decisions are based on reliable observations
• Reliability requires:– Redundant measurements and analyses– Small uncertainty in observations– Long-term continuity of observing system– Stability of observations and their accuracy– Complete metadata– Ongoing data quality control and analysis– Dedicated data center

7
Key Climate Science Drivers for a Reference Upper-Air Network
• Monitoring and detecting climate variability and change• Understanding the vertical profile of temperature trends• Understanding the climatology and variability of water
vapor, particularly in the upper-troposphere and lower stratosphere
• Understanding and monitoring tropopause characteristics• Understanding and monitoring the vertical profile of ozone,
aerosols and other constituents• Reliable reanalyses of climate change• Prediction of climate variations• Understanding climate mechanisms and improving climate
models
8
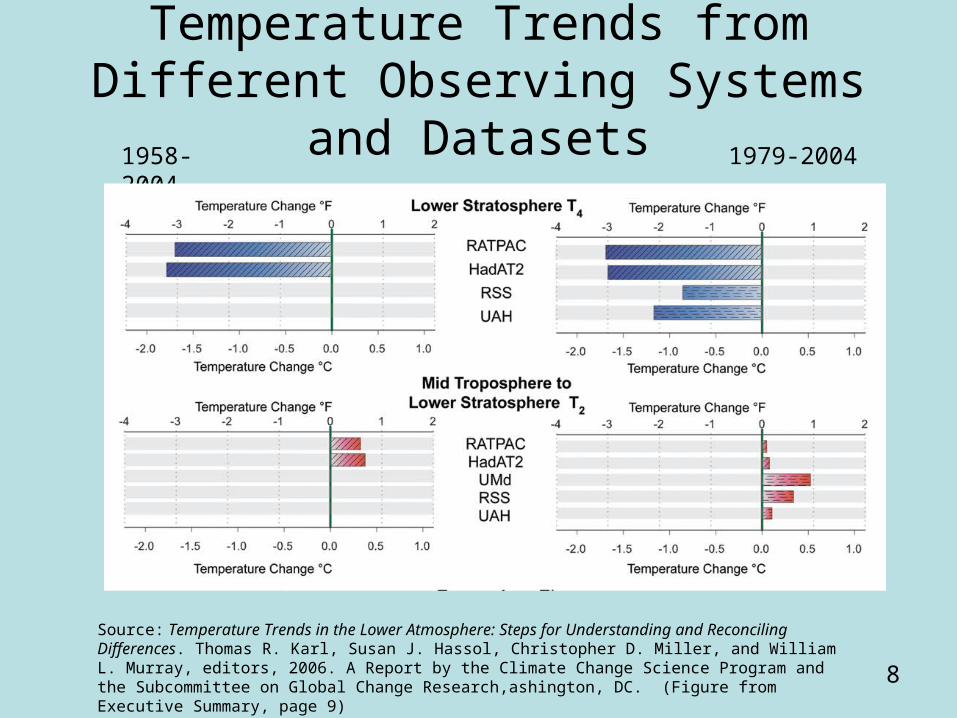
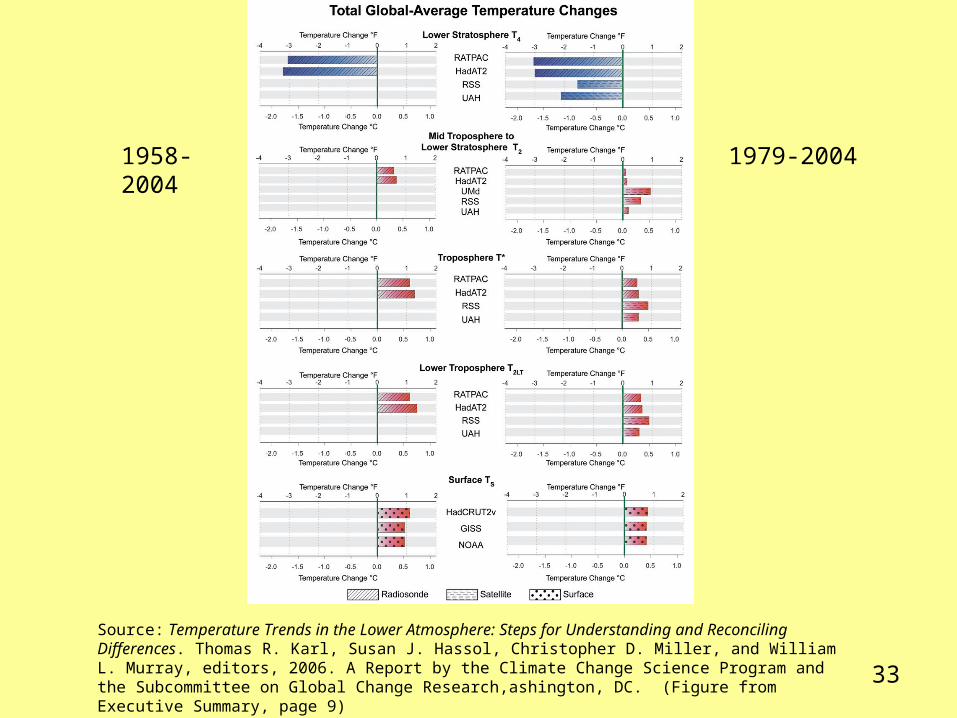
Temperature Trends from Different Observing Systems and Datasets
Source: Temperature Trends in the Lower Atmosphere: Steps for Understanding and Reconciling Differences. Thomas R. Karl, Susan J. Hassol, Christopher D. Miller, and William L. Murray, editors, 2006. A Report by the Climate Change Science Program and the Subcommittee on Global Change Research,ashington, DC. (Figure from Executive Summary, page 9)
1979-20041958-2004
9
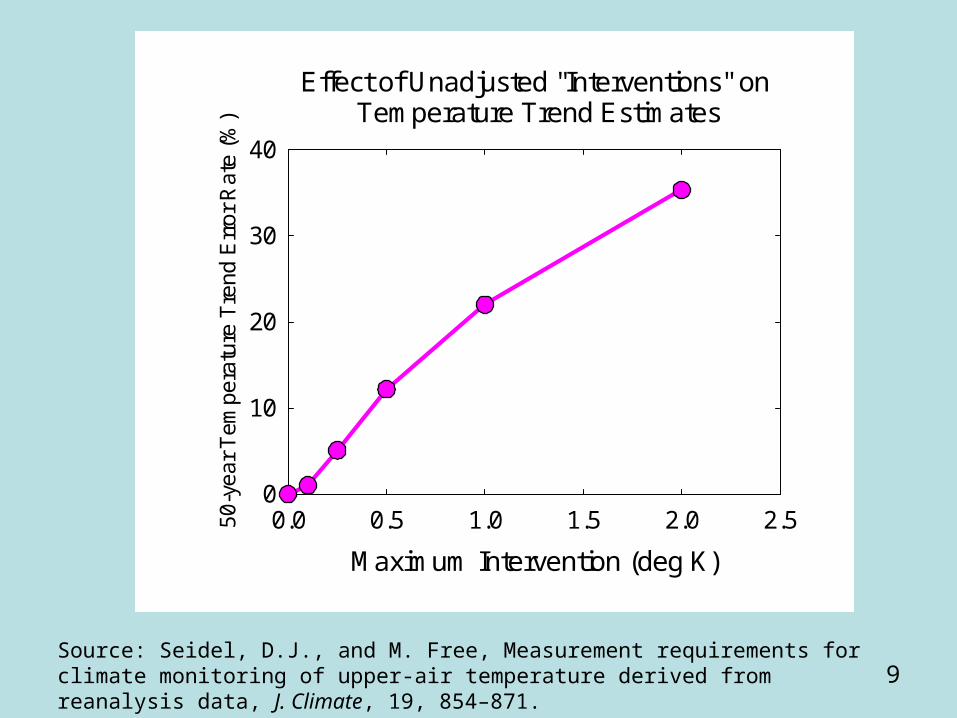
Effect of Unadjusted "Interventions" on Temperature Trend Estimates
Maximum Intervention (deg K)
0.0 0.5 1.0 1.5 2.0 2.550-y
ear
Tem
pera
ture
Tre
nd E
rror
Rat
e (%
)
0
10
20
30
40
Source: Seidel, D.J., and M. Free, Measurement requirements for climate monitoring of upper-air temperature derived from reanalysis data, J. Climate, 19, 854–871.

10
Importance of Upper-Tropospheric Water Vapor Observations
Source: Soden, B.J, and I.M. Held: An assessment of climate feedbacks in coupled ocean-atmosphere models, J. Climate, submitted.
11
Defining Observational Requirements
• “NOAA/GCOS Workshop to Define Climate Requirements for Upper-Air Observations” - Boulder, CO, February 2005.
• ~ 70 scientists and data users from a wide cross-section of the climate community.
• Workshop report reviewed by a larger group.
12
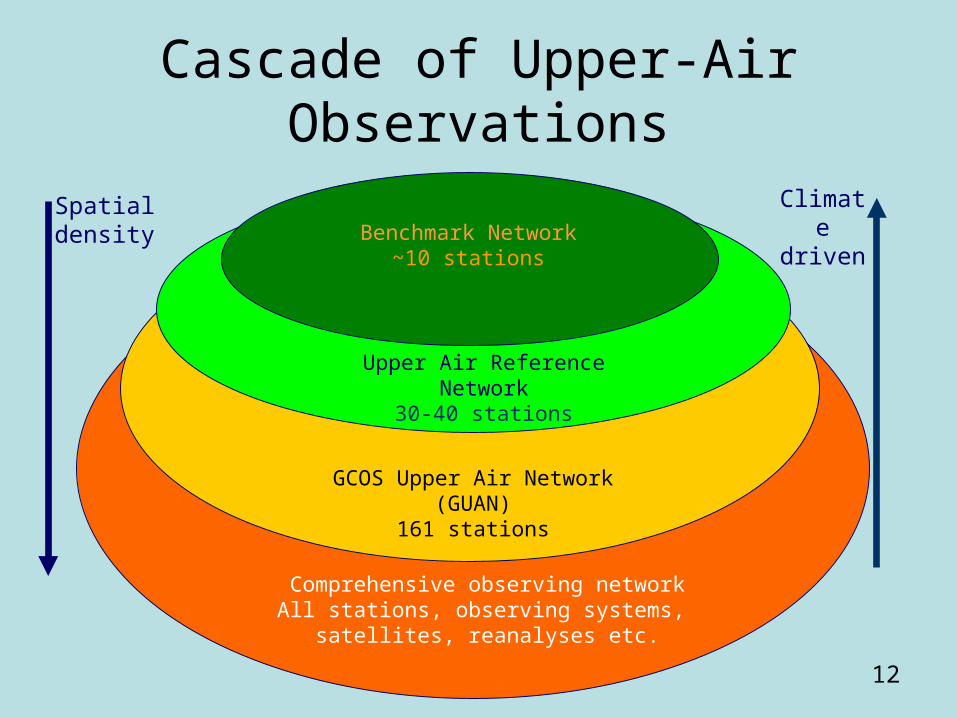
Cascade of Upper-Air Observations
Benchmark Network~10 stations
Upper Air Reference Network30-40 stations
GCOS Upper Air Network (GUAN)
161 stations
Comprehensive observing networkAll stations, observing systems,
satellites, reanalyses etc.
Spatial density
Climate driven
13
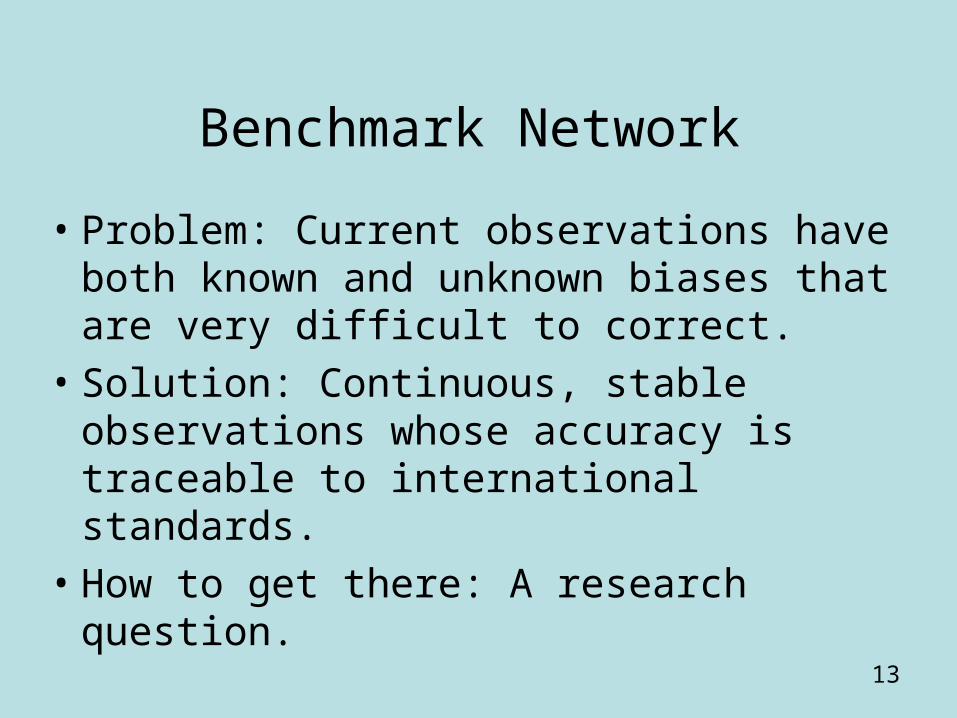
Benchmark Network
• Problem: Current observations have both known and unknown biases that are very difficult to correct.
• Solution: Continuous, stable observations whose accuracy is traceable to international standards.
• How to get there: A research question.

14
Comprehensive Network
• Provides the detailed spatial resolution necessary to relate climate change and variability to human activities and the environment.
• Includes multiple data types, including satellite data.
• Relies not only on network measurements but also on assimilation and analysis of the observations.
• Meets other (non-climate) requirements.
15
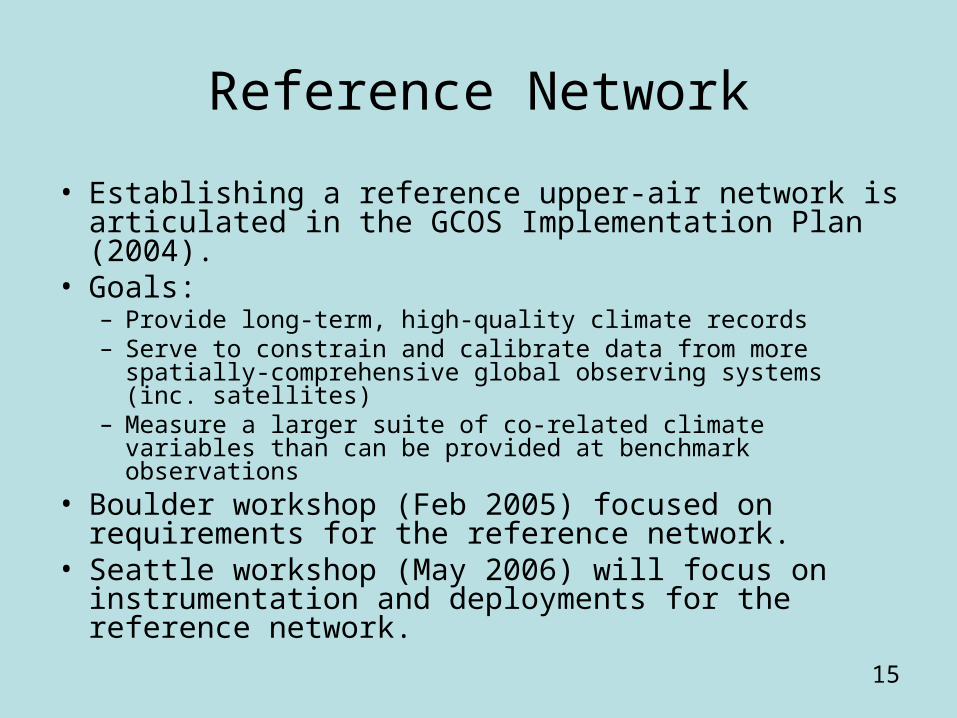
Reference Network
• Establishing a reference upper-air network is articulated in the GCOS Implementation Plan (2004).
• Goals:– Provide long-term, high-quality climate records– Serve to constrain and calibrate data from more spatially-
comprehensive global observing systems (inc. satellites)– Measure a larger suite of co-related climate variables than can
be provided at benchmark observations• Boulder workshop (Feb 2005) focused on
requirements for the reference network.• Seattle workshop (May 2006) will focus on
instrumentation and deployments for the reference network.

16
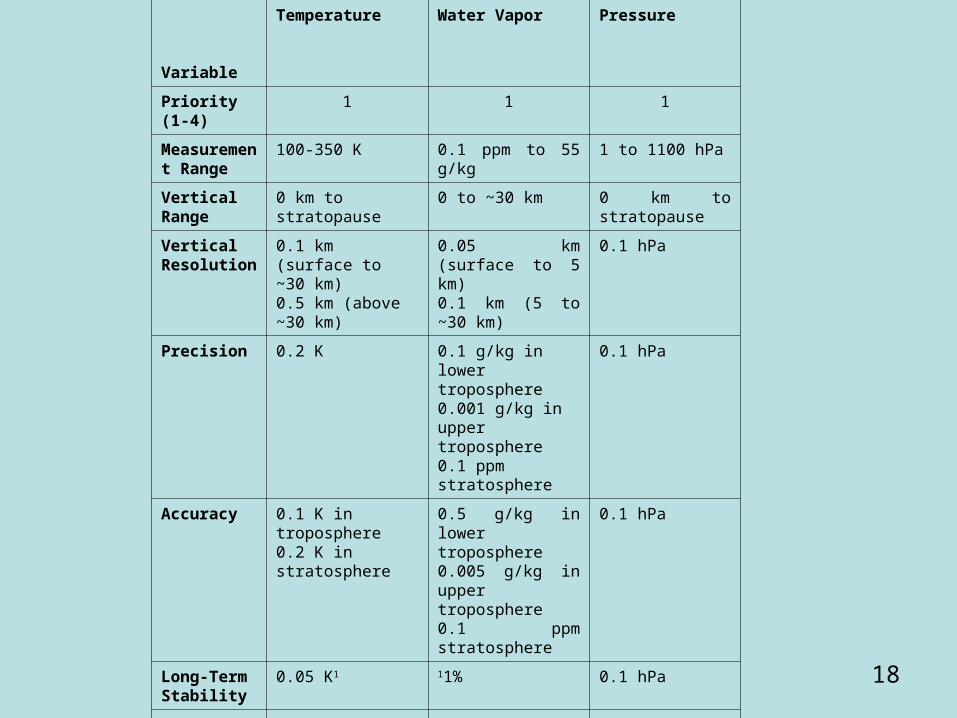
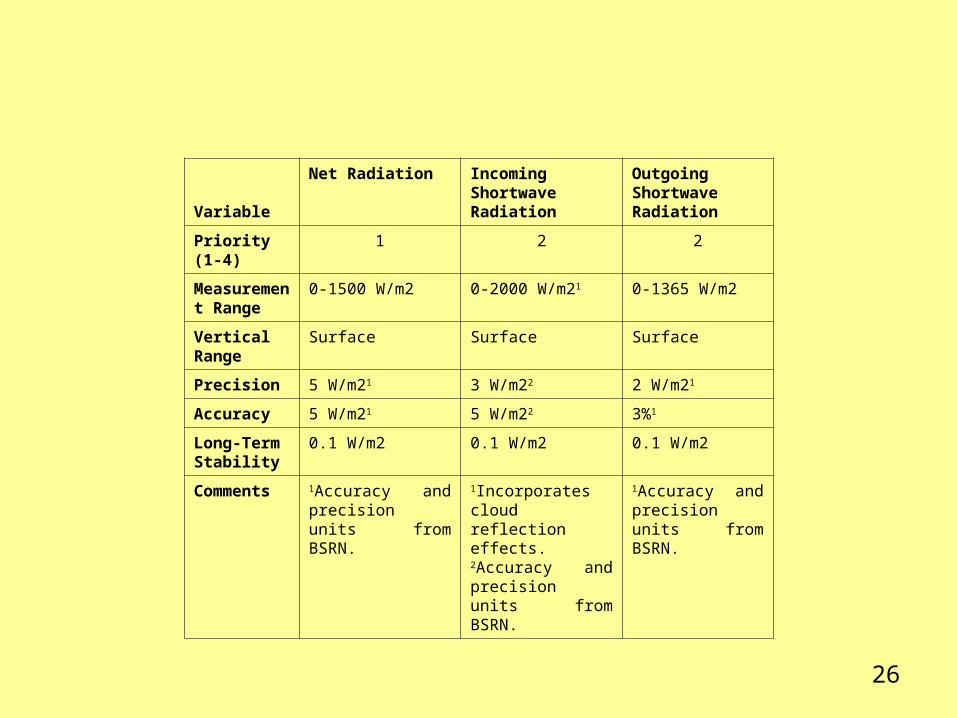
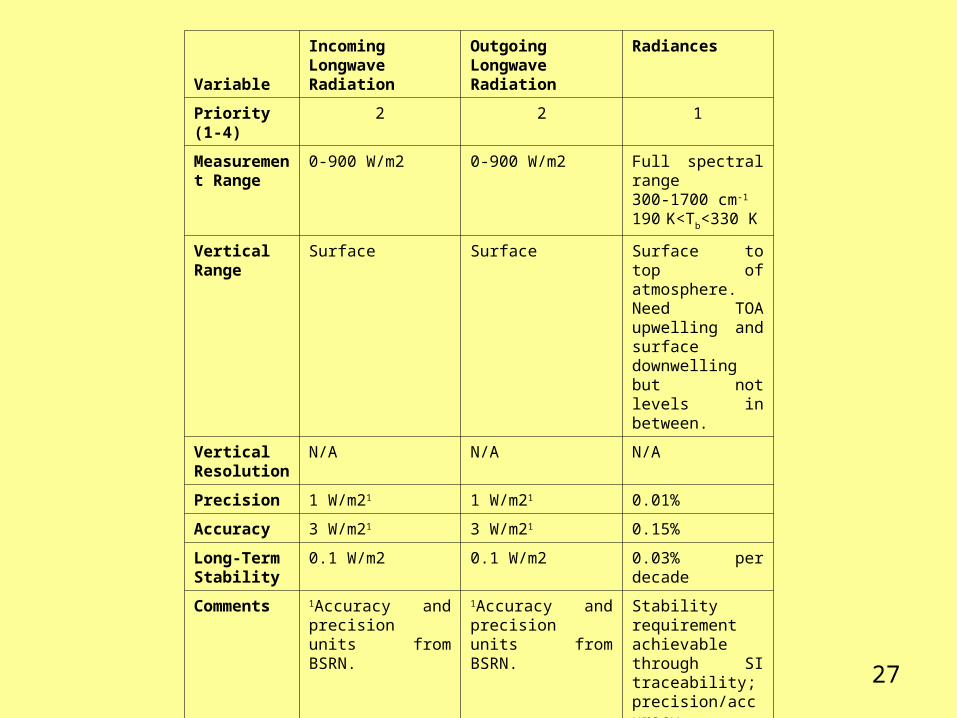
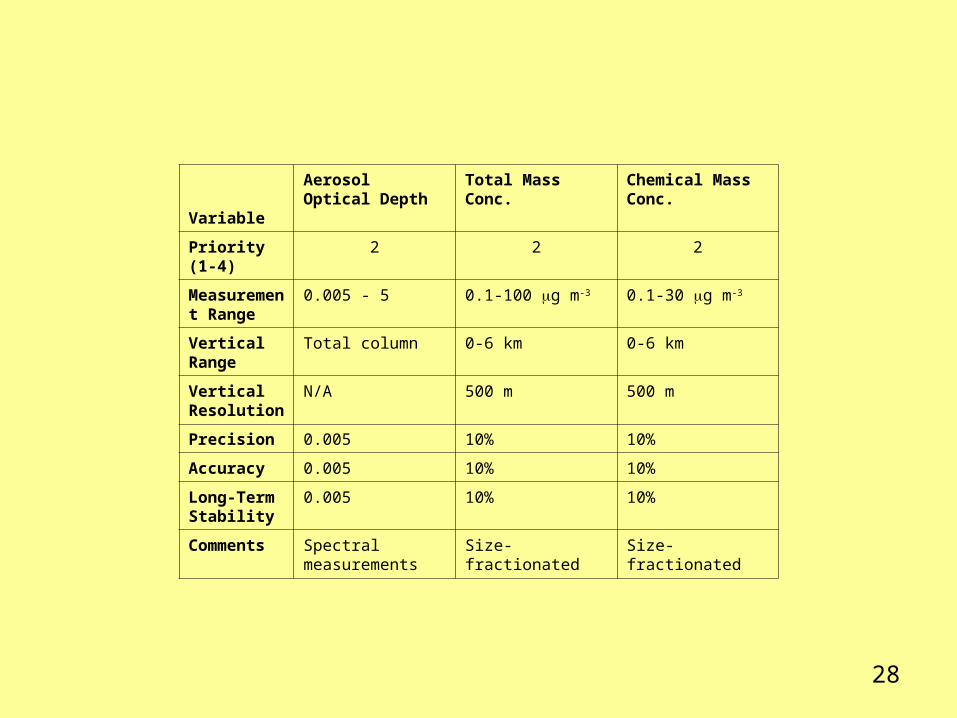
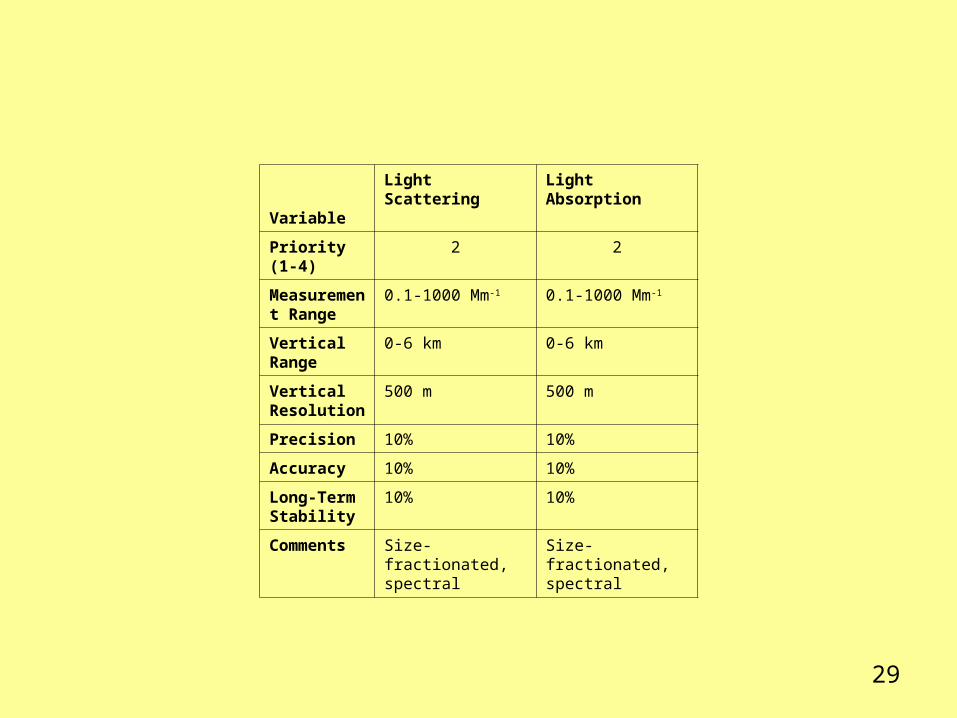
Terms Used in Requirements Tables
• Priority - Ranking from 1 to 4, with 1 as highest priority for GCOS. Based on GCOS “Essential Climate Variables” concept.
• Precision – repeatability; standard deviation of random errors
• Accuracy – systematic error; measured minus actual value
• Long-Term Stability – Maximum tolerable change in systematic error over time (multiple decades)
17
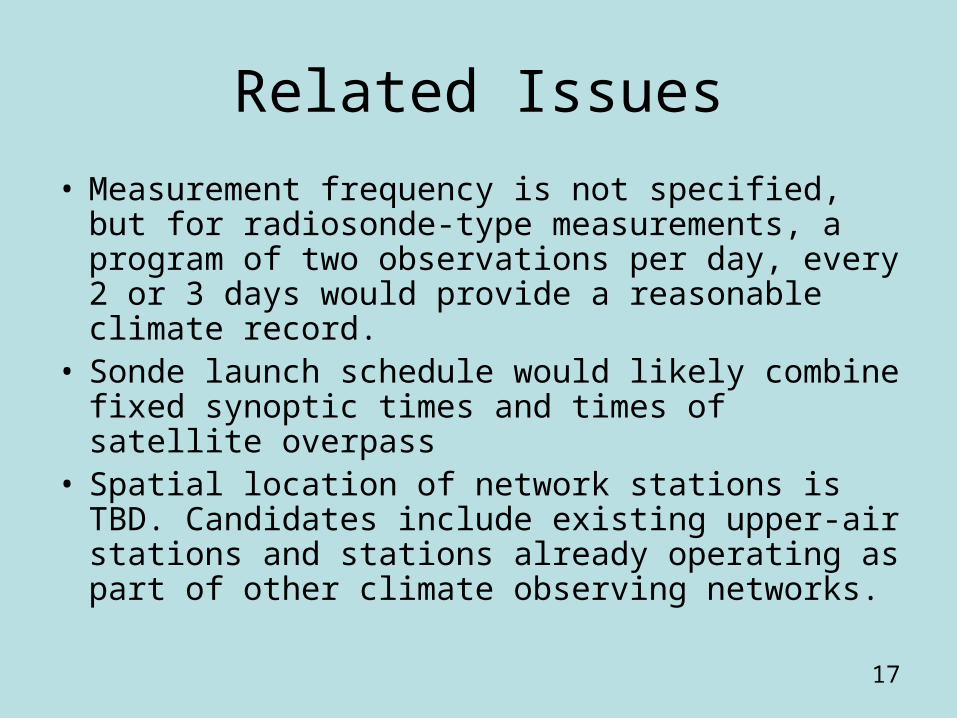
Related Issues
• Measurement frequency is not specified, but for radiosonde-type measurements, a program of two observations per day, every 2 or 3 days would provide a reasonable climate record.
• Sonde launch schedule would likely combine fixed synoptic times and times of satellite overpass
• Spatial location of network stations is TBD. Candidates include existing upper-air stations and stations already operating as part of other climate observing networks.
18
Variable
Temperature Water Vapor Pressure
Priority (1-4) 1 1 1
Measurement Range
100-350 K 0.1 ppm to 55 g/kg 1 to 1100 hPa
Vertical Range
0 km to stratopause 0 to ~30 km 0 km to stratopause
Vertical Resolution
0.1 km (surface to ~30 km)0.5 km (above ~30 km)
0.05 km (surface to 5 km)0.1 km (5 to ~30 km)
0.1 hPa
Precision 0.2 K 0.1 g/kg in lower troposphere0.001 g/kg in upper troposphere0.1 ppm stratosphere
0.1 hPa
Accuracy 0.1 K in troposphere0.2 K in stratosphere
0.5 g/kg in lower troposphere0.005 g/kg in upper troposphere0.1 ppm stratosphere
0.1 hPa
Long-Term Stability
0.05 K1 11% 0.1 hPa
Comments 1The signal over the satellite era is order 0.1-0.2K/decade (Section 2.1.1) so long-term stability needs to be order of magnitude smaller to avoid ambiguity.
1Stability is given in percent, but note that accuracy and precision vary by orders of magnitude with height.
19
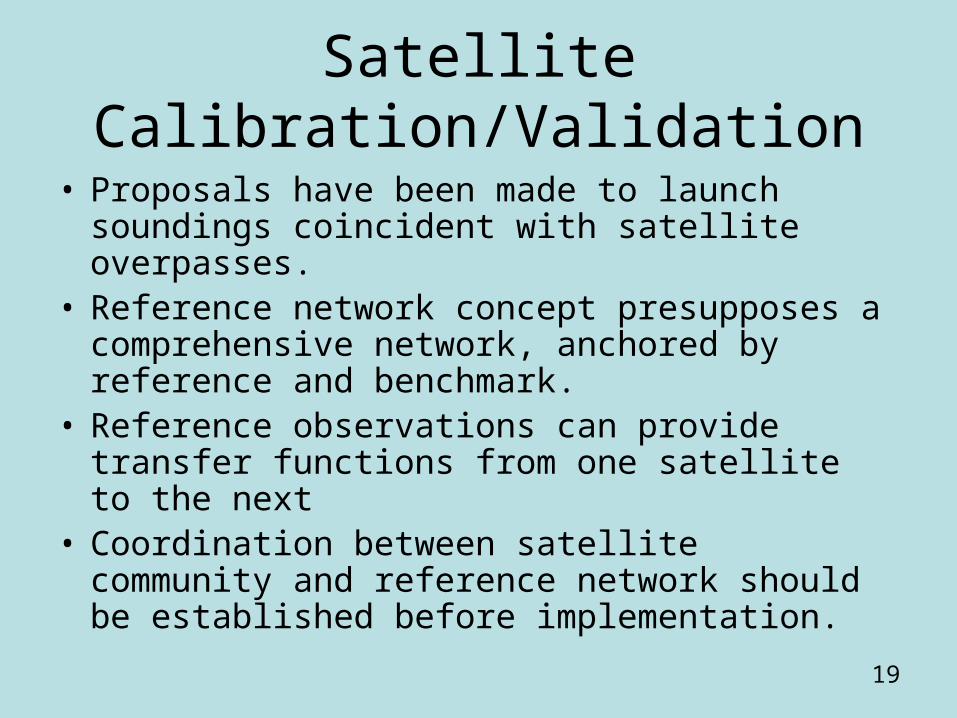
Satellite Calibration/Validation
• Proposals have been made to launch soundings coincident with satellite overpasses.
• Reference network concept presupposes a comprehensive network, anchored by reference and benchmark.
• Reference observations can provide transfer functions from one satellite to the next
• Coordination between satellite community and reference network should be established before implementation.

20
Websites for More Information
• On requirements (Boulder workshop, Feb. 2005) www.oco.noaa.gov/docs/ua_workshopreport_v7.pdf
• On Seattle workshop www.oco.noaa.gov/workshop2
• On GCOS Implementation Plan www.wmo.ch/web/gcos/Implementation_Plan_(GCOS).pdf
21
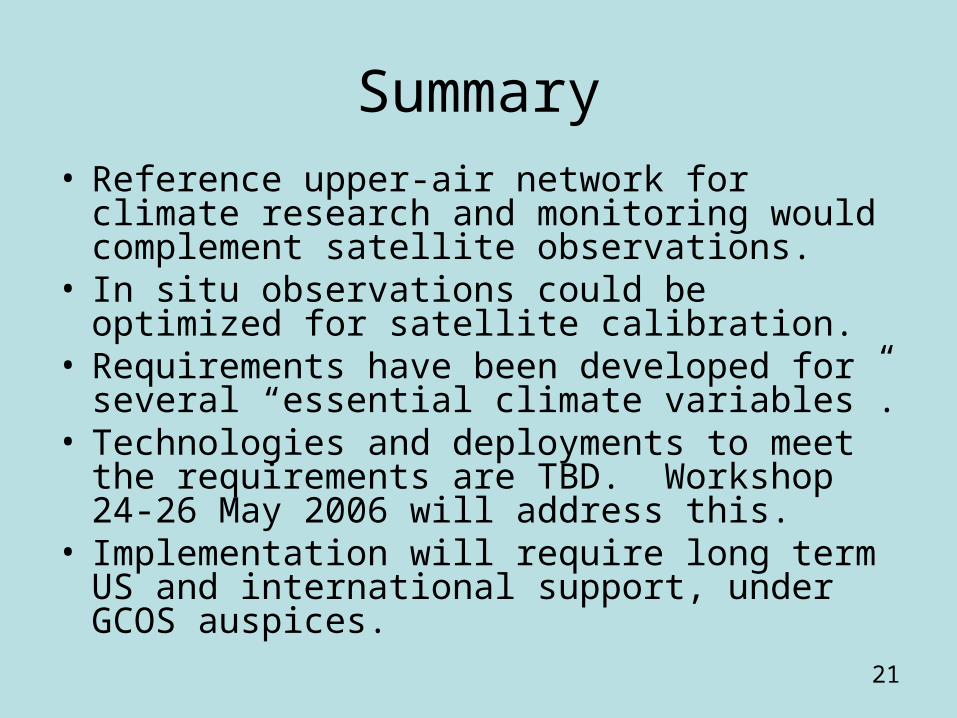
Summary• Reference upper-air network for climate
research and monitoring would complement satellite observations.
• In situ observations could be optimized for satellite calibration.
• Requirements have been developed for several “essential climate variables”.
• Technologies and deployments to meet the requirements are TBD. Workshop 24-26 May 2006 will address this.
• Implementation will require long term US and international support, under GCOS auspices.
22
Requirements Tables

23
Variable
Temperature Water Vapor Pressure
Priority (1-4) 1 1 1
Measurement Range
100-350 K 0.1 ppm to 55 g/kg 1 to 1100 hPa
Vertical Range
0 km to stratopause 0 to ~30 km 0 km to stratopause
Vertical Resolution
0.1 km (surface to ~30 km)0.5 km (above ~30 km)
0.05 km (surface to 5 km)0.1 km (5 to ~30 km)
0.1 hPa
Precision 0.2 K 0.1 g/kg in lower troposphere0.001 g/kg in upper troposphere0.1 ppm stratosphere
0.1 hPa
Accuracy 0.1 K in troposphere0.2 K in stratosphere
0.5 g/kg in lower troposphere0.005 g/kg in upper troposphere0.1 ppm stratosphere
0.1 hPa
Long-Term Stability
0.05 K1 11% 0.1 hPa
Comments 1The signal over the satellite era is order 0.1-0.2K/decade (Section 2.1.1) so long-term stability needs to be order of magnitude smaller to avoid ambiguity.
1Stability is given in percent, but note that accuracy and precision vary by orders of magnitude with height.
24
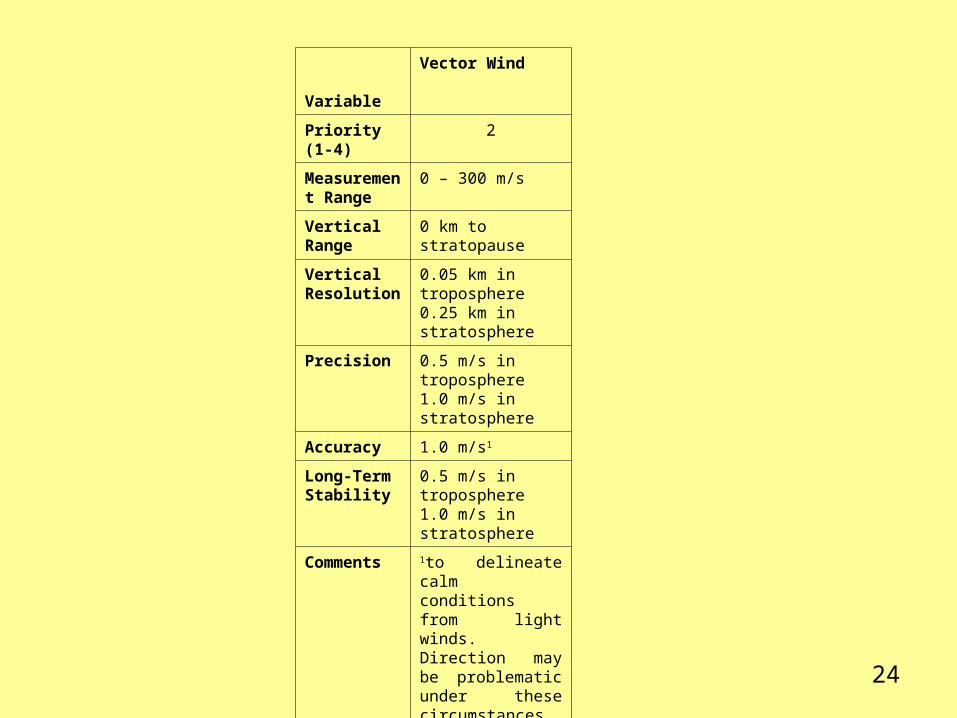
Variable
Vector Wind
Priority (1-4) 2
Measurement Range
0 – 300 m/s
Vertical Range
0 km to stratopause
Vertical Resolution
0.05 km in troposphere0.25 km in stratosphere
Precision 0.5 m/s in troposphere1.0 m/s in stratosphere
Accuracy 1.0 m/s1
Long-Term Stability
0.5 m/s in troposphere1.0 m/s in stratosphere
Comments 1to delineate calm conditions from light winds. Direction may be problematic under these circumstances.

25
Variable
Ozone Carbon Dioxide Methane
Priority (1-4) 2 3 2
Measurement Range
0.005-20 ppmV
Vertical Range
Surface to 100 km
Vertical Resolution
0.5 km in stratosphere1 km in troposphere
Precision
Accuracy 3% total column5% stratosphere5% troposphere
Long-Term Stability
0.2% total column0.6% stratosphere1% troposphere
Comments
26
Variable
Net Radiation Incoming Shortwave Radiation
Outgoing Shortwave Radiation
Priority (1-4) 1 2 2
Measurement Range
0-1500 W/m2 0-2000 W/m21 0-1365 W/m2
Vertical Range
Surface Surface Surface
Precision 5 W/m21 3 W/m22 2 W/m21
Accuracy 5 W/m21 5 W/m22 3%1
Long-Term Stability
0.1 W/m2 0.1 W/m2 0.1 W/m2
Comments 1Accuracy and precision units from BSRN.
1Incorporates cloud reflection effects.2Accuracy and precision units from BSRN.
1Accuracy and precision units from BSRN.
27
Variable
Incoming Longwave Radiation
Outgoing Longwave Radiation
Radiances
Priority (1-4) 2 2 1
Measurement Range
0-900 W/m2 0-900 W/m2 Full spectral range300-1700 cm-1
190 K<Tb<330 K
Vertical Range
Surface Surface Surface to top of atmosphere.Need TOA upwelling and surface downwelling but not levels in between.
Vertical Resolution
N/A N/A N/A
Precision 1 W/m21 1 W/m21 0.01%
Accuracy 3 W/m21 3 W/m21 0.15%
Long-Term Stability
0.1 W/m2 0.1 W/m2 0.03% per decade
Comments 1Accuracy and precision units from BSRN.
1Accuracy and precision units from BSRN.
Stability requirement achievable through SI traceability; precision/accuracy requirement for mean seasonal radiances at ~1000 km spatial scale.
28
Variable
Aerosol Optical Depth
Total Mass Conc. Chemical Mass Conc.
Priority (1-4) 2 2 2
Measurement Range
0.005 - 5 0.1-100 g m‑3 0.1-30 g m‑3
Vertical Range
Total column 0-6 km 0-6 km
Vertical Resolution
N/A 500 m 500 m
Precision 0.005 10% 10%
Accuracy 0.005 10% 10%
Long-Term Stability
0.005 10% 10%
Comments Spectral measurements
Size-fractionated Size-fractionated
29
Variable
Light Scattering Light Absorption
Priority (1-4) 2 2
Measurement Range
0.1-1000 Mm‑1 0.1-1000 Mm‑1
Vertical Range
0-6 km 0-6 km
Vertical Resolution
500 m 500 m
Precision 10% 10%
Accuracy 10% 10%
Long-Term Stability
10% 10%
Comments Size-fractionated, spectral
Size-fractionated, spectral

30
Variable
Cloud Amount/Frequency
Cloud Base Height Cloud Layer Heights and Thicknesses
Priority (1-4) 2 2 2
Measurement Range
0-100% 0-20 km1 (1000-50 mb)
0-20 km
Vertical Range
0 to 20Km surface to 50 mb Surface to 50mb
Vertical Resolution
50 m 5 mb 50 m1
Precision 0.1-0.3%1 100 m (10-40 mb2) 50 m2
Accuracy 0.1-0.3%1 100 m (10-40 mb2) 50 m2
Long-Term Stability
0.1-0.2%2 20 m/decade3 50 m/decade
Comments 11-3% variations from ISCCP21-2%/decade trend (Norris 2005)
1 1000-50mb (Rossow and Schiffer 1999)2 10-40 mb variations from ISCCP3 44/154 m/decade for base/top from Chernykh et al. (2001), which was questioned by Seidel and Durre (2002)
1the minimum layer thickness of ~30 m (cirrus) (Del Genio et al. 2002; Winker and Vaughan 1994)2the standard deviation of >= 100 m (Wang et al. 2000)

31
Variable
Cloud Top Height Cloud Top Pressure Cloud Top Temperature
Priority (1-4) 3 3 3
Measurement Range
0-20 km 1013-15 hPa 190-310 K
Vertical Range
0-20 km 0-20 km 0-20 km
Vertical Resolution
150 m 150m 1 km
Precision 50m 1 hPa
Accuracy 150 m 15 hPa 1 K/(cloud emissivity)
Long-Term Stability
30 m 3 hPa 0.2 K/(cloud emissivity)
Comments

32
Variable
Cloud Particle Size Cloud Optical Depth Cloud Liquid Water/Ice
Priority (1-4) 4 4 4
Measurement Range
Vertical Range
0-20 km 0-20 km 0-20 km
Vertical Resolution
1 km 1 km 1 km
Precision
Accuracy 10% water20% ice
10% 25% water0.025 mm ice
Long-Term Stability
2% water4% ice
2% 5% water0.005 mm ice
Comments
33
Source: Temperature Trends in the Lower Atmosphere: Steps for Understanding and Reconciling Differences. Thomas R. Karl, Susan J. Hassol, Christopher D. Miller, and William L. Murray, editors, 2006. A Report by the Climate Change Science Program and the Subcommittee on Global Change Research,ashington, DC. (Figure from Executive Summary, page 9)
1979-20041958-2004
34
Notes on Water Vapor Feedback Figure from Soden and Held
• The magnitude water vapor feedback as a function of height and latitude under the assumption of a uniform warming and constant relative humidity moistening in units of W/m2/K/100 mb. Results shown are zonal and annual means. The main contribution to the positive feedback is the increase in water vapor content with increased temperature, leading to increased greenhouse effect and thus further temperature increases. Note that the maximum feedback occurs in the tropical upper troposphere.