status and trends in the education of racial and ethnic · pdf filestatus and trends in the...
TRANSCRIPT

Status and Trends in the Educationof Racial and Ethnic Groups
NCES 2010-015
U.S. DEPARTMENT OF EDUCATION


Susan AudNational Center for Education Statistics
Mary Ann FoxAngelina KewalRamaniEducation Statistics Services Institute – American Institutes for Research
NCES 2010-015
U.S. DEPARTMENT OF EDUCATION
Status and Trends in the Educationof Racial and Ethnic GroupsJULY 2010

U.S. Department of EducationArne Duncan Secretary
Institute of Education SciencesJohn Q. Easton Director
National Center for Education StatisticsStuart Kerachsky Deputy Commissioner
The National Center for Education Statistics (NCES) is the primary federal entity for collecting, analyzing, and reporting data related to education in the United States and other nations. It fulfills a congressional mandate to collect, collate, analyze, and report full and complete statistics on the condition of education in the United States; conduct and publish reports and specialized analyses of the meaning and significance of such statistics; assist state and local education agencies in improving their statistical systems; and review and report on education activities in foreign countries.
NCES activities are designed to address high-priority education data needs; provide consistent, reliable, complete, and accurate indicators of education status and trends; and report timely, useful, and high-quality data to the U.S. Department of Education, the Congress, the states, other education policymakers, practitioners, data users, and the general public. Unless specifically noted, all information contained herein is in the public domain.
We strive to make our products available in a variety of formats and in language that is appropriate to a variety of audiences. You, as our customer, are the best judge of our success in communicating information effectively. If you have any comments or suggestions about this or any other NCES product or report, we would like to hear from you. Please direct your comments to
National Center for Education Statistics Institute of Education Sciences U.S. Department of Education 1990 K Street NW Washington, DC 20006-5651
July 2010
The NCES World Wide Web Home Page address is http://nces.ed.gov.The NCES World Wide Web Publications and Products address is http://nces.ed.gov/pubsearch.
Suggested Citation Aud, S., Fox, M., and KewalRamani, A. (2010). Status and Trends in the Education of Racial and Ethnic Groups (NCES 2010-015). U.S. Department of Education, National Center for Education Statistics. Washington, DC: U.S. Government Printing Office.
For ordering information on this report, write to
ED Pubs U.S. Department of Education P.O. Box 22207 Alexandria, VA 22304
or call toll free 1-877-4ED-Pubs or order online at http://www.edpubs.gov.
Content Contact Susan Aud (202) 219-7013 [email protected]

Status and Trends in the Education of Racial and Ethnic Groups examines the educational progress and challenges of students in the United States by race/ethnicity. This report shows that over time, the numbers of students of each race/ethnicity who have completed high school and continued their education in college have increased. Despite these gains, the rate of progress has varied, and differences persist among Whites, Blacks, Hispanics, Asians, Native Hawaiians or Other Pacific Islanders, American Indians/Alaska Natives and students of two or more races in their performance on key indicators of educational performance.
Demographics
■ Between 1980 and 2008, the racial/ethnic composition of the United States shifted—the White population declined from 80 percent of the total population to 66 percent; the Hispanic population increased from 6 percent of the total to 15 percent; the Black population remained at about 12 percent; and the Asian/Pacific Islander population increased from less than 2 percent of the total population to 4 percent. In 2008, American Indians/Alaska Natives made up about 1 percent and people of two or more races made up about 1 percent of the population. (Indicator 1)
■ In 2007, about 14 percent of the U.S. population was born outside of the 50 states and District of Columbia; this included the approximately 69 percent of Asians and 44 percent of Hispanics who were born outside of the 50 states and District of Columbia. (Indicator 2)
■ In 2007, across all racial/ethnic groups except Blacks and American Indians/Alaska Natives, the majority of children under 18 lived with married parents. About 34 percent of Black children under 18 lived with married parents and 56 percent of Black children lived with a female parent with no spouse present. (Indicator 3)
■ The percentages of children who were living in poverty were higher for Blacks (34 percent), American Indians/Alaska Natives (33 percent), Hispanics (27 percent), and Native Hawaiians or Other Pacific Islanders (26 percent), than for children of two or more races (18 percent), Asians (11 percent) and Whites (10 percent). (Indicator 4)
■ In 2008, a higher percentage of Asian children (51 percent) had a mother with at least a bachelor’s degree than did White children (36 percent), children of two or more races (31 percent), Black children (17 percent), American Indian/Alaska Native children (16 percent), and Hispanic children (11 percent). (Indicator 5)
HigHligHts

Status and Trends in the Education of Racial and Ethnic Groupsiv
Hig
hlig
hts
Preprimary, Elementary, and secondary Education Participation
■ In 2005–06, a higher percentage of White, Black, and Asian 4-year-olds participated in center-based care than did Hispanic 4-year-olds. (Indicator 6)
■ From 2000–01 to 2007–08, the proportion of public school enrollment composed of White students decreased from 61 to 56 percent. During the same period, Hispanic school enrollment increased from 17 to 21 percent of the total enrollment and Asian/Pacific Islander enrollment increased from 4 to 5 percent of the total. The percentage of Black (17 percent) and American Indian/Alaska Native (1 percent) students remained unchanged. (Indicator 7.1)
■ In 2007–08, White students were concen-trated in suburban and rural areas, with lower percentages in cities and towns. Black, Hispanic, and Asian/Pacific Islander students were concentrated in cities and suburban areas. (Indicator 7.2)
■ In 2007–08, public schools in which at least half of the enrollment was White enrolled 87 percent of all White students. Schools in which at least half of the enrollment was Black enrolled 48 percent of all Black students, and schools in which at least half of the enrollment was Hispanic enrolled 57 percent of all Hispanic students. (Indicator 7.4)
■ Forty-eight percent of public school 4th-graders were eligible for free or reduced-price lunches in 2009, including 77 percent of Hispanic, 74 percent of Black, 68 percent of American Indian/Alaska Native, 34 percent of Asian/Pacific Islander, and 29 percent of White 4th-graders. (Indicator 7.5)
■ From 1998 to 2007, the percentage of 6- to 21-year-olds who were served by the Individuals with Disabilities Education Act (IDEA) increased by less than 1 percentage point, and in 2007, 9 percent were served by IDEA. Fourteen percent of American Indians/Alaska Natives in this age group were served under IDEA in 2007, compared with 12 percent of Blacks, 9 percent of Hispanics, 8 percent of Whites, and 5 percent of Asians/Pacific Islanders. (Indicator 8.1)
■ In 2007, about 69 percent of Hispanic and 64 percent of Asian elementary/secondary school students spoke a language other than English at home. About 18 percent of Hispanic and 17 percent of Asian students spoke English with difficulty, compared with 7 percent of Native Hawaiians or Other Pacific Islanders, 3 percent of American Indians/Alaska Natives, and 1 percent each of Whites and Blacks, according to household reports. (Indicator 8.2)
■ In 2007–08, about 25 percent of secondary mathematics teachers who taught in schools with at least half Black enrollment had neither a certification nor a college major in mathematics, compared to 8 percent of secondary mathematics teachers who taught in schools with at least half White enrollment. (Indicator 9.1)
Achievement
■ Hispanic and American Indian/Alaska Native 4-year-olds had lower rates of profi-ciency in letter recognition compared with 4-year-olds of other racial/ethnic groups in 2005–06. (Indicator 10)
■ On the 2007 National Assessment of Educational Progress (NAEP) reading assessment, higher percentages of Asian/Pacific Islander and White 4th-graders and 8th-graders scored at or above Proficient than did American Indian/Alaska Native, Black, and Hispanic students at the same grade levels. On the 2009 NAEP 4th and 8th grade mathematics assessment, a higher percentage of Asians/Pacific Islanders scored at or above Proficient than did 4th- and 8th-graders of all other races/ethnicities shown. (Indicator 11)
■ On the 2007 Trends in International Mathematics and Science Study (TIMSS), Asians in the United States scored higher in mathematics at both the 4th- and 8th- grade levels than students of any other race/ethnicity in the United States. In 4th-grade mathematics, Asians in the United States scored higher than students from all other participating jurisdictions except Hong Kong, Singapore, and Chinese Taipei. (Indicator 12)

Status and Trends in the Education of Racial and Ethnic Groups v
Hig
hlights
■ Among 2005 high school graduates, a lower percentage of Hispanic students had completed courses in geometry, algebra II, and statistics than had White, Black or Asian/Pacific Islander students. (Indicator 13.1)
■ From 1999 to 2008, the total number of Black and Hispanic students taking an Advanced Placement (AP) exam more than tripled, from 94,000 to 318,000 students. In 2008, Asians had the highest mean AP exam score (3.08) across all exams, while Blacks had the lowest (1.91). (Indicator 14)
■ The population of SAT test-takers has become more diverse in the past decade, predominantly due to an increase in participation among Hispanic students. Hispanics comprised 9 percent of test-takers in 1998 and 13 percent in 2008, while Asians comprised 9 percent of test-takers in 1998 and 11 percent in 2008. White students scored higher than any other racial/ethnic group on the critical reading portion of the exam in 2008, while Asian students had the highest average scores on the mathematics portion. (Indicator 15.1)
■ In 2008, Black students were 14 percent of ACT test-takers, compared with 11 percent in 1998, and Hispanic students were 9 percent, compared with 6 percent in 1998. Nearly one-third of Asian ACT test-takers met the college readiness benchmark, established by ACT, on all four exams, compared to 3 percent of Black test-takers. (Indicator 15.2)
Persistence
■ Among 8th-graders in 2009, Asians/Pacific Islanders, at 63 percent, had the highest percentage of students who had no absences in the past month, compared to 35 percent of American Indians/Alaska Natives. (Indicator 16)
■ In 2007, a higher percentage of Black elementary/secondary students had been retained in a grade (21 percent) than
was the case for White, Hispanic, or Asian elementary/secondary students. Additionally, a higher percentage of Black 6th- through 12th-grade students had been suspended (43 percent) from school at some point than was the case for students of any other race/ethnicity. (Indicator 17)
■ Between 1997 and 2007, the percentage of 16- to 24-year-olds who were high school status dropouts1 decreased from 11 percent to 9 percent. In 2007, the status dropout rate was higher among Hispanics (21 percent) than among Blacks (8 percent), Asians/Pacific Islanders (6 percent), and Whites (5 percent). (Indicator 18.1)
■ Of the students who entered high school in the 2003–04 school year, 74 percent gradu-ated within 4 years, including 91 percent of Asians, 80 percent of Whites, 62 percent of Hispanics, 61 percent of American Indians/Alaska Natives, and 60 percent of Blacks. (Indicator 18.2)
student Behaviors
■ In 2007, parents of Asian high school students reported that their children spent the most hours per week on homework (10 hours, on average). Of the students ages 16 years and older who were employed, higher percentages of Black and Hispanic students reported that they worked more than 20 hours per week (50 and 54 percent, respectively) than White students (35 percent), although the percentage of White students who worked was higher than that of Black and Hispanic students. (Indicator 19)
■ In 2007, a higher percentage of White (18 percent) children ages 12 to 17 reported drinking alcohol in the past month than did their Hispanic (15 percent) peers, peers of two or more races (13 percent), and Black (10 percent) and Asian (8 percent) peers. (Indicator 20)
■ Between 1991 and 2005, birth rates for 15- to 19-year-old females decreased for all racial/ethnic groups. However, the teen
1 Status dropouts are 16- to 24-year-olds who are not enrolled in school and who have not completed a high school program, regardless of when they left school. People who have received a GED are considered high school completers.

Status and Trends in the Education of Racial and Ethnic Groupsvi
Hig
hlig
hts
birth rates increased between 2005 and 2007 for Whites, Blacks, and American Indians/Alaska Natives. (Indicator 21)
■ In 2007, among 9th- through 12th-grade students, higher percentages of students of two or more races (13 percent), Black students (10 percent), and Hispanic students (9 percent) reported being threatened or injured with a weapon on school property in the past 12 months than did White (7 percent) and American Indian/Alaska Native students (6 percent). (Indicator 22)
Postsecondary Education
■ In 2008, about 72 percent of recent White high school completers were enrolled in college in that same year, up from 50 percent in 1980. In addition, the immediate transition to college rate was higher in 2007 than the rate in 1980 for Blacks (56 vs. 44 percent) and for Hispanics (62 vs. 50 percent). (Indicator 23.1)
■ In 2008, some 44 percent of White 18- to 24-year-olds were enrolled in colleges and universities, while in 1980 some 28 percent were enrolled. In addition, approximately 32 percent of Black 18- to 24-year-olds were enrolled in colleges or universities (an increase of 12 percentage points from 1980) and 26 percent of Hispanic 18- to 24-year-olds were enrolled (an increase of 10 percentage points from 1980). (Indicator 23.2)
■ Between 1976 and 2008, total undergraduate fall enrollment increased for each racial/ethnic group; Hispanics and Asians/Pacific Islanders had the fastest rates of increase and Whites had the slowest rate of increase. In 2008, more females than males were enrolled as undergraduates—the gender gap was largest for Black undergraduates, with females accounting for 64 percent of Black undergraduate enrollment. (Indicator 24.1)
■ Trends in graduate enrollments were similar to those in undergraduate enrollment, in that while there were increases in the rates for all racial/ethnic groups, the largest increases were for Hispanics and Asians/Pacific Islanders and the smallest increase was for Whites. Again, the largest gender gap was
for Black graduate students, with females representing 71 percent of Black graduate enrollment in 2008. (Indicator 24.2)
■ Among students enrolled in college in 2008, about 81 percent of Hispanics and 79 percent of American Indians/Alaska Natives attended public institutions, higher than the percentages of Whites (73 percent), Blacks (68 percent), and Asians/Pacific Islanders (75 percent) who did so. Some 21 percent of White, 18 percent of Asian/Pacific Islander, and 17 percent of Black students attended private not-for-profit institutions, while 11 percent of Hispanic and 12 percent of American Indian/Alaska Native students did so. A higher percentage of Black students (15 percent) attended private for-profit institutions than did students of the other races/ethnicities shown (ranging from 6 to 8 percent). (Indicator 24.3)
■ In 2007–08, some 80 percent of full-time, full-year undergraduates received financial aid (grants or loans); Black students had the highest percentage of recipients (92 percent) and received the largest average amount per person ($13,500). (Indicator 25)
■ In 2008, females earned more degrees than males within each racial/ethnic group, and Black females received over twice as many degrees as Black males. (Indicator 26.1)
Outcomes of Education
■ In 2008, about 29 percent of U.S. adults (25 years of age or older) had at least a bachelor’s degree, including 52 percent of Asian/Pacific Islander adults, 33 percent of White adults, 20 percent of Black adults, 13 percent of Hispanic adults, and 15 percent of American Indian/Alaska Native adults. (Indicator 27)
■ In 2008, the unemployment rate was higher for Hispanics (8 percent), Blacks (9 percent), American Indians/Alaska Natives (10 percent), and persons of two or more races (10 percent), than it was for Whites and Asians (4 percent each). In general, lower unemployment rates were associated with higher levels of education for each racial/ethnic group. The unemployment rate for Blacks without a high school diploma or equivalent was 22 percent, compared with
Status and Trends in the Education of Racial and Ethnic Groups vii
Hig
hlights
11 percent for those with a high school credential and 4 percent for those with at least a bachelor’s degree. (Indicator 28)
■ In 2007, the median income of male workers was generally higher than that of female workers for each race/ethnicity and at each educational level. Median income differed by race/ethnicity. For example, of those with at least a bachelor’s degree, the median income was $71,000 for White males and $69,000 for Asian males, compared with $55,000 for Black males and $54,000 for Hispanic males. For females, of those with at least a bachelor’s degree, the median income was $54,000 for Asians, compared with $50,000 for Whites, $45,000 for Blacks, and $43,000 for Hispanics. (Indicator 29)

This page intentionally left blank.

COntEnts
Highlights ................................................................................................................................................. iiiList of Tables ..............................................................................................................................................xiList of Figures ............................................................................................................................................xv
Introduction ............................................................................................................................................... 1
Chapter 1. Demographics .......................................................................................................................... 51. Population and Geographic Distributions .................................................................................. 62. Nativity .................................................................................................................................... 10
Snapshot of Hispanic and Asian Subgroups: Nativity ................................................................... 123. Children’s Living Arrangements ............................................................................................... 144. Children Living in Poverty ....................................................................................................... 16
Snapshot of Hispanic and Asian Subgroups: Children Living in Poverty ........................................ 185. Parental Education ................................................................................................................... 20
Chapter 2. Preprimary, Elementary, and Secondary Education Participation ............................................ 236. Care Arrangements .................................................................................................................. 247. Elementary and Secondary Enrollment .................................................................................... 268. Special Needs ........................................................................................................................... 40
Snapshot of Hispanic and Asian Subgroups: English Language Learners ........................................ 469. Teacher Qualifications and Experience ..................................................................................... 48
Chapter 3. Achievement ........................................................................................................................... 5310. Proficiency of 4-Year-Olds ....................................................................................................... 5411. Reading and Mathematics Achievement ................................................................................... 5612. International Comparisons....................................................................................................... 6413. Mathematics and Science Coursetaking in High School ........................................................... 7014. Advanced Placement (AP) Courses........................................................................................... 76
Snapshot of Hispanic Subgroups: Advanced Placement ................................................................. 7915. College Entrance Exams ........................................................................................................... 80
Page

Status and Trends in the Education of Racial and Ethnic Groupsx
Co
nten
ts
Chapter 4. Persistence .............................................................................................................................. 8916. Absences .................................................................................................................................. 9017. Retention, Suspension, and Expulsion ..................................................................................... 9218. Dropout Rates and Graduation Rates ...................................................................................... 94
Snapshot of Hispanic and Asian Subgroups: Dropout Rate by Nativity .......................................... 98Snapshot: Dropout Rates for Institutionalized Youth and Young Adults by Race/Ethnicity ............. 100
Chapter 5. Student Behaviors ................................................................................................................. 10319. After-School Time Use .......................................................................................................... 10420. Cigarette, Alcohol, and Drug Use .......................................................................................... 10821. Teenage Pregnancy ................................................................................................................. 11022. Safety at School ...................................................................................................................... 114
Chapter 6. Postsecondary Education ...................................................................................................... 11723. College Participation Rates .................................................................................................... 11824. Enrollment ............................................................................................................................ 122
Snapshot: Enrollment in Historically Black Colleges and Universities, Hispanic Serving Institutions, and Tribal Colleges ............................................................................................... 130
25. Financial Aid.......................................................................................................................... 13226. Degrees Awarded ................................................................................................................... 134
Chapter 7. Outcomes of Education ........................................................................................................ 13927. Educational Attainment ......................................................................................................... 140
Snapshot of Hispanic and Asian Subgroups: Educational Attainment ......................................... 14228. Unemployment Rates ............................................................................................................ 14429. Median Income ...................................................................................................................... 146
References .............................................................................................................................................. 149
Appendix A: Guide to Sources ................................................................................................................ 151
Page

list Of tABlEs
1a. Resident population and percentage distribution, by race/ethnicity: Selected years, 1980–2008, and projections, selected years, 2010–2025 ............................................................... 7
1b. Percentage distribution of the resident population, by race/ethnicity, region, and state: 2008 ............................................................................................................................................. 8
2a. Number and percentage of population in the United States, by nativity and race/ethnicity: 2000, 2005, and 2007 ................................................................................................................. 11
2b. Number, percentage, and percentage distribution of U.S. population, by nativity and race/ethnicity with Hispanic and Asian subgroups: 2007 .................................................................... 12
2c. Number, percentage, and percentage distribution of U.S. population under age 18, by nativity and race/ethnicity with Hispanic and Asian subgroups: 2007 ......................................... 13
3. Number and percentage distribution of children under age 18, by living arrangements and race/ethnicity: 2007 .................................................................................................................... 14
4. Percentage of children under age 18 living in poverty, by living arrangements and race/ethnicity with Hispanic and Asian subgroups: 2007 ............................................................. 16
5. Percentage of children ages 6 to 18, by parent’s highest level of educational attainment and child’s race/ethnicity: 2008 .......................................................................................................... 22
6. Percentage distribution of primary type of care arrangements of children from the 2001 birth cohort at about 4 years old, by race/ethnicity: 2005–06 .............................................................. 24
7.1a. Number and percentage distribution of public elementary and secondary students, by region and race/ethnicity: Selected years, 2000–01 through 2007–08 .................................................... 26
7.1b. Number and percentage distribution of public elementary and secondary students, by region, state, and race/ethnicity: 2007–08 ............................................................................................... 28
7.2. Number and percentage distribution of public elementary and secondary students, by race/ethnicity and locale: 2007–08 ..................................................................................................... 30
7.3. Number and percentage distribution of public school enrollment in the United States and 20 largest public school districts, by race/ethnicity: 2007–08 ...................................................... 33
7.4. Percentage distribution of public elementary and secondary school students of each racial/ethnic group, by percent enrollment in school of selected racial/ethnic group: 2007–08 .... 34
7.5a. Percentage of public school 4th-graders eligible for free or reduced-price lunch, by school locale and race/ethnicity: 2009 .................................................................................................... 36
7.5b. Percentage distribution of public school 4th-graders, by percentage of students in school eligible for free or reduced-price lunch and race/ethnicity: 2009.................................................. 38
8.1a. Percentage of children ages 3 to 5 and ages 6 to 21 served under the Individuals with Disabilities Education Act (IDEA), by race/ethnicity: 1998–2007 .............................................. 41
8.1b. Number and percentage of children ages 3 to 5 and ages 6 to 21 served under the Individuals with Disabilities Education Act (IDEA), by race/ethnicity and type of disability: 2007 ............... 42
8.2a. Number and percentage of elementary and secondary school students who spoke a language other than English at home and percentage who spoke English with difficulty, by grade level and race/ethnicity: 2007 .............................................................................................................. 44
Table Page

Status and Trends in the Education of Racial and Ethnic Groupsxii
list
of
tab
les
8.2b. Number and percentage of elementary and secondary school students who spoke a language other than English at home and percentage who spoke English with difficulty, by race/ethnicity with Hispanic and Asian subgroups: 2007 ................................................................................... 47
9.1. Percentage of public high school teachers with a college major and standard certification in their respective main teaching assignment in mathematics, English, and science, by race/ethnicity concentration of schools: 2007–08 ............................................................................... 49
9.2 Average number of years of teaching experience of regular full-time public school teachers and percentage who have less than 3 years of teaching experience, by race/ethnicity concentration of school: 2007–08 ............................................................................................... 50
10. Percentage of children from the 2001 birth cohort who were proficient in letter and number and shape recognition at about 4 years old, by race/ethnicity: 2005–06...................................... 54
11.1. Percentage distribution of students at National Assessment of Educational Progress (NAEP) reading achievement levels, by race/ethnicity and grade: 2005 and 2007 ..................................... 57
11.2. Percentage distribution of students at National Assessment of Educational Progress (NAEP) mathematics achievement levels, by race/ethnicity and grade: 2005 and 2009 ............................. 60
12a. Average scores among 4th- and 8th-graders in the United States on the Trends in International Mathematics and Science Study (TIMSS), by race/ethnicity: 2007 ............................................. 64
12b. Average scores among 4th-graders on the Trends in International Mathematics and Science Study (TIMSS), by participating country and race/ethnicity in the United States: 2007 ............. 66
12c. Average scores among 8th-graders on the Trends in International Mathematics and Science Study (TIMSS), by participating country and race/ethnicity in the United States: 2007 ............. 68
13a. Percentage of high school graduates who completed selected mathematics courses in high school, by race/ethnicity: 1998, 2000, and 2005 ........................................................................ 71
13b. Percentage of high school graduates who completed selected science courses in high school, by race/ethnicity: 1998, 2000, and 2005 .................................................................................... 73
14a. Number and percent change in the number of students taking Advanced Placement (AP) examinations, by race/ethnicity: 1999–2008 ............................................................................... 76
14b. Mean grade and percentage distribution of grades on Advanced Placement (AP) exams, by subject and race/ethnicity: 2008 .................................................................................................. 78
14c. Number of exams taken and mean grade on Advanced Placement (AP) exams, by Hispanic subgroup and subject: 2008 ........................................................................................................ 79
15.1a. Percentage distribution of the 12th-grade SAT test-taking population, by race/ethnicity: 1998–2008 ................................................................................................................................. 80
15.1b. Average SAT scores for the 12th-grade SAT test-taking population, by race/ethnicity and subject: Selected years, 1998–2008 .............................................................................................. 82
15.2a. Percentage distribution of ACT test-taking population, by race/ethnicity: 1998–2008 ............... 8415.2b. Average ACT scores in English and mathematics, by race/ethnicity: Selected years, 1998–2008 .. 8515.2c. Percentage of ACT test-taking population meeting college readiness benchmark scores, by
race/ethnicity: 2008 .................................................................................................................... 8616. Percentage distribution of 8th-graders and percentage at or above Basic on the National
Assessment of Educational Progress (NAEP) mathematics assessment, by the number of days absent from school in the past month and race/ethnicity: 2009 ................................................... 90
17a. Percentage of public school students in kindergarten through grade 12 who had ever repeated a grade, by sex and race/ethnicity: 2007 ...................................................................................... 92
Table Page

Status and Trends in the Education of Racial and Ethnic Groups xiii
list of tab
les
17b. Percentage of public school students in grades 6 through 12 who had ever been suspended or expelled, by sex and race/ethnicity: 2007................................................................................. 93
18.1a. Percentage of 16- to 24-year-olds who were high school status dropouts, by race/ethnicity and sex: 1997–2007 .................................................................................................................... 97
18.1b. Number and percentage of 16- to 24-year-olds who were high school status dropouts, by nativity and race/ethnicity with Hispanic and Asian subgroups: 2007 ......................................... 99
18.1c. Number and percentage of institutionalized and noninstitutionalized 16- to 24-year-olds who were high school status dropouts, by race/ethnicity: 2007 .................................................. 100
18.2. Averaged freshman graduation rate for public high school students and number of graduates, by race/ethnicity: School year 2006–07 ..................................................................................... 102
19.1. Percentage of high school students who did homework outside of school and whose parents checked that homework was done, by frequency and race/ethnicity: 2007................................. 104
19.2. Percentage of high school students ages 16 years and older who were employed and the percentage distribution of those who were employed, by hours worked per week and race/ethnicity: 2008 .......................................................................................................................... 106
20. Percentage of 12- to 17-year-olds and 18- to 25-year-olds who reported using alcohol, cigarettes, or marijuana in past month, by race/ethnicity: 2007 ................................................. 108
21a. Number of live births per 1,000 females ages 15 to 19, by race/ethnicity: Selected years, 1990–2007 ............................................................................................................................... 110
21b. Number of live births per 1,000 females ages 15 to 19, by Hispanic ethnicity: 1990–2007 ....... 11222a. Percentage of students in grades 9 through 12 who reported that they were threatened or
injured with a weapon on school property, carried a weapon to school, engaged in a physical fight on school property, or reported that drugs were made available to them on school property, by race/ethnicity: 2007 ............................................................................................... 114
22b. Percentage of students ages 12 to 18 who reported that gangs were present at school, by race/ethnicity: 2007 .................................................................................................................. 115
23.1. Percentage of high school completers who were enrolled in 2- or 4-year colleges the October immediately following high school completion, by race/ethnicity: Selected years, 1980–2008 ... 118
23.2. Percentage of 18- to 24-year-olds enrolled in colleges and universities, by race/ethnicity and sex: Selected years, 1980–2008 ........................................................................................... 121
24.1. Total number, total percentage distribution, and percent female of undergraduate fall enrollment in degree-granting institutions, by race/ethnicity: Selected years, 1976–2008 .......... 123
24.2. Total number, total percentage distribution, and percent female of graduate (postbaccalaureate) fall enrollment in degree-granting institutions, by race/ethnicity: Selected years, 1976–2008 ........................................................................................................ 125
24.3. Number and percentage distribution of U.S. citizen enrollment in degree-granting institutions, by race/ethnicity and institutional type: 2008 ........................................................ 128
24.4. Fall enrollment in degree-granting institutions that are historically Black colleges and universities, in institutions that serve large proportions of Hispanic students, and in tribally controlled institutions, by selected race/ethnicity: 2007............................................................. 130
25. Percentage of full-time, full-year undergraduates receiving financial aid and average amount of aid, by race/ethnicity and type of aid: 2007–08 ........................................................ 132
Table Page

Status and Trends in the Education of Racial and Ethnic Groupsxiv
list
of
tab
les
Table Page
26.1. Number, percentage conferred on females, and percentage distribution of degrees awarded by degree-granting institutions, by level of degree, race/ethnicity, and sex: 2007–08 ................. 135
26.2. Percentage of degrees awarded by degree-granting institutions in the most popular fields of study, by race/ethnicity and level of study: 2007–08 .................................................................. 138
27a. Percentage distribution of adults ages 25 and over according to highest level of educational attainment, by race/ethnicity: Selected years, 1996–2008 ......................................................... 141
27b. Number and percentage of persons ages 25 to 29 with at least a bachelor’s degree, by nativity and race/ethnicity with Hispanic and Asian subgroups: 2007 ....................................... 143
28. Unemployment rates for persons ages 16 years and older, by educational attainment, age group, and race/ethnicity: 2008 ................................................................................................. 144
29. Median annual earnings of full-time, full-year wage and salary workers ages 25 and older, by educational attainment, sex, and race/ethnicity: 2007 ........................................................... 148

list Of figurEs
1. Percentage distribution of total population in the United States, by race/ethnicity: Selected years, 1980–2008, and projections, selected years, 2010–2025 ...................................................... 6
2. Percentage distribution of population under 18 in the United States, by race/ethnicity and nativity: 2007 .............................................................................................................................. 10
3. Percentage distribution of children under age 18, by race/ethnicity and living arrangements: 2007 ........................................................................................................................................... 15
4. Percentage of children under 18 living in poverty, by living arrangements and race/ethnicity: 2007 ........................................................................................................................................... 17
5. Percentage of children ages 6 to 18 whose mother attained a level of education less than high school completion, and percentage whose mother attained at least a bachelor’s degree, by child’s race/ethnicity: 2008 .................................................................................................... 21
6. Percentage distribution of primary type of care arrangements of children from the 2001 birth cohort at about 4 years old, by race/ethnicity: 2005–06 .............................................................. 25
7.1. Percentage distribution of public elementary and secondary students, by region and race/ethnicity: 2007–08 .............................................................................................................. 27
7.2. Percentage distribution of public elementary and secondary students, by race/ethnicity and locale: 2007–08 .................................................................................................................... 31
7.4. Percentage distribution of public elementary and secondary school students of each r acial/ethnic group, by percent enrollment in school of selected racial/ethnic group: 2007–08 ..... 35
7.5a. Percentage of public school 4th-graders eligible for free or reduced-price lunch, by school locale and race/ethnicity: 2009 .................................................................................................... 37
7.5b. Percentage of public school 4th-graders in low-poverty and high-poverty schools, by race/ethnicity: 2009 .................................................................................................................... 39
8.1. Percentage of children ages 3 to 5 and ages 6 to 21 served under the Individuals with Disabilities Education Act (IDEA), by race/ethnicity: 2007 ........................................................ 41
8.2. Percentage of elementary and secondary school students who spoke a language other than English at home and percentage who spoke English with difficulty, by race/ethnicity: 2007 ........ 45
9.1. Percentage of public high school teachers with neither a college major nor standard certification in the subject that is their main teaching assignment, by race/ethnicity concentration of schools and subject: 2007–08 ........................................................................... 48
9.2. Average number of years of teaching experience of regular full-time public school teachers and percentage who have less than 3 years of teaching experience, by race/ethnicity concentration of school: 2007–08 ............................................................................................... 51
10. Percentage of children from the 2001 birth cohort who were proficient in letter and number and shape recognition at about 4 years old, by race/ethnicity: 2005–06....................................... 55
11.1a. Percentage distribution of 4th-grade students at National Assessment of Educational Progress (NAEP) reading achievement levels, by race/ethnicity: 2007 ....................................................... 58
11.1b. Percentage distribution of 8th-grade students at National Assessment of Educational Progress (NAEP) reading achievement levels, by race/ethnicity: 2007 ....................................................... 58
11.1c. Percentage distribution of 12th-grade students at National Assessment of Educational Progress (NAEP) reading achievement levels, by race/ethnicity: 2005 ....................................................... 59
Figure Page

Status and Trends in the Education of Racial and Ethnic Groupsxvi
list
of
fig
ures
11.2a. Percentage distribution of 4th-grade students at National Assessment of Educational Progress (NAEP) mathematics achievement levels, by race/ethnicity: 2009 ............................................... 61
11.2b. Percentage distribution of 8th-grade students at National Assessment of Educational Progress (NAEP) mathematics achievement levels, by race/ethnicity: 2009 ............................................... 61
11.2c. Percentage distribution of 12th-grade students at National Assessment of Educational Progress (NAEP) mathematics achievement levels, by race/ethnicity: 2005 ............................................... 62
12a. Average scores among 4th-graders in the United States on the Trends in International Mathematics and Science Study (TIMSS), by subject and race/ethnicity: 2007 .......................... 65
12b. Average scores among 8th-graders in the United States on the Trends in International Mathematics and Science Study (TIMSS), by subject and race/ethnicity: 2007 .......................... 65
13a. Percentage of high school graduates who completed selected mathematics courses, by race/ethnicity: 1998 and 2005 .................................................................................................... 72
13b. Percentage of high school graduates who completed selected science courses, by race/ethnicity: 1998 and 2005 ..................................................................................................... 74
13b. Percentage of high school graduates who completed selected science courses, by race/ethnicity: 1998 and 2005—Continued ................................................................................ 75
14. Percentage distribution of grades on all Advanced Placement (AP) exams, by race/ethnicity: 2008 .................................................................................................................... 77
15.1a. Percentage distribution of the 12th-grade SAT test-taking population, by race/ethnicity: 1998 and 2008 ............................................................................................................................ 81
15.1b. Average SAT scores for the 12th-grade SAT test-taking population, by subject and race/ethnicity: 2008 .................................................................................................................... 83
15.2a. Percentage distribution of ACT test-taking population, by race/ethnicity: 1998 and 2008 .......... 8415.2b. Percentage of ACT test-taking population meeting college readiness benchmark scores,
by race/ethnicity, 2008 ................................................................................................................ 8716. Percentage of 8th-graders at or above Basic on the National Assessment of Educational
Progress (NAEP) mathematics assessment, by race/ethnicity and number of days absent from school in the past month: 2009 .......................................................................................... 91
17. Percentage of public school students in grades 6 through 12 who had ever been suspended, by race/ethnicity and sex: 2007 ................................................................................................... 93
18.1. Percentage of 16- to 24-year-olds who were high school status dropouts, by race/ethnicity: 1997–2007 ................................................................................................................................. 95
18.2. Averaged freshman graduation rate for public high school students, by race/ethnicity: School year 2006–07 ................................................................................................................. 101
19.1. Percentage of high school students who did homework, by frequency and race/ethnicity: 2007 ......................................................................................................................................... 105
19.2a. Percentage of high school students ages 16 years and older who were employed, by race/ethnicity: 2008 .................................................................................................................. 107
19.2b. Percentage distribution of employed high school students 16 years and over, by hours worked per week and race/ethnicity: 2008 ................................................................................. 107
20. Percentage of 12- to 17-year-olds who reported using alcohol, cigarettes, or marijuana in the past month, by race/ethnicity: 2007 ................................................................................ 109
Figure Page
Status and Trends in the Education of Racial and Ethnic Groups xvii
list of fig
ures
21. Number of live births per 1,000 females ages 15 to 19, by race/ethnicity: Selected years, 1990–2007 ............................................................................................................................... 111
22. Percentage of high school students who reported that they were threatened or injured with a weapon on school property, carried a weapon to school, or engaged in a physical fight on school property, by race/ethnicity: 2007 ....................................................................... 115
23.1. Percentage of high school completers who were enrolled in 2- or 4-year colleges the October immediately following high school completion, by race/ethnicity: Selected years, 1980–2008 ............................................................................................................................... 119
23.2. Percentage of 18- to 24-year-olds enrolled in colleges and universities, by race/ethnicity: Selected years: 1980–2008 ........................................................................................................ 120
24.1. Difference in percentages of female and male undergraduate fall enrollment in degree-granting institutions, by race/ethnicity: Selected years, 1976–2008 ................................ 124
24.2. Difference in percentages of female and male graduate (postbaccalaureate) fall enrollment in degree-granting institutions, by race/ethnicity: Selected years, 1976–2008 ............................ 126
24.3. Percentage distribution of U.S. citizen enrollment in degree-granting institutions, by institutional type and race/ethnicity: 2008 ............................................................................... 129
25a. Percentage of full-time, full-year undergraduates receiving financial aid, by race/ethnicity: 2007–08 ................................................................................................................................... 133
25b. Average amount of financial aid awarded to full-time, full-year undergraduates, by race/ethnicity and type of aid: 2007–08 .................................................................................... 133
26. Percentage distribution of bachelor’s degrees awarded by degree-granting institutions, by sex and race/ethnicity: 2007–08 ........................................................................................... 136
27. Percentage of adults ages 25 and over who completed at least high school and percentage who have at least a bachelor’s degree, by race/ethnicity: Selected years, 1996–2008 ................... 140
28. Unemployment rates for persons ages 16 and over, by educational attainment and race/ethnicity: 2008 .................................................................................................................. 145
29. Median annual earnings of full-time, full-year wage and salary workers ages 25 and older, by sex, race/ethnicity, and educational attainment: 2007 ........................................................... 147
Figure Page

This page intentionally left blank.

This report uses statistics to examine, by racial/ethnic group, current conditions and changes over time in education activities and outcomes in the United States. Some traditionally disadvantaged racial/ethnic groups have made strides in educational achievement over the past few decades, but gaps persist.
Status and Trends in the Education of Racial and Ethnic Groups is part of a series of reports produced by the National Center for Education Statistics (NCES) that focus on specific racial/ethnic groups, including Status and Trends in the Education of American Indians and Alaska Natives: 2008 (DeVoe and Darling-Churchill 2008), Status and Trends in the Education of Racial and Ethnic Minorities (KewalRamani et al. 2007), Status and Trends in the Education of Blacks (Hoffman and Llagas 2003), and Status and Trends in the Education of Hispanics (Llagas 2003).
Organization of the report
The report begins with demographic information (chapter 1) and then is organized roughly according to the chronology of an individual’s education, starting with indicators on preprimary, elementary, and secondary education participation (chapter 2) and continuing with student achievement (chapter 3) and persistence in education (chapter 4), behaviors that can affect educational experience (chapter 5), participation in postsecondary education (chapter 6), and outcomes of education (chapter 7). A list of references and a guide to sources appear at the end of the report. Standard error tables are available on the NCES website: http://nces.ed.gov/pubsearch/pubsinfo.asp?pubid=2010015.
The indicators presented in this report are intended to provide an overview of the education data available from many federal surveys. Readers are cautioned not to draw causal inferences based on the univariate
and bivariate results presented in this report. It is important to note that many of the variables examined in this report may be related to one another, and complex interactions and relationships among the variables have not been explored. The variables presented here are also just a sample of the thousands that can be examined using the surveys included in this report. The indicators were selected to provide a range of data that are relevant to a variety of policy issues, rather than emphasize comprehensive informa-tion on any particular issue.
Definitions of race and Ethnicity
The Office of Management and Budget (OMB) is responsible for the standards that govern the categories used to collect and present federal data on race and ethnicity. The OMB revised the guidelines on racial/ethnic categories used by the federal government in October 1997, with a January 2003 deadline for implementation (Office of Management and Budget 1997). The revised standards require a minimum of these five categories for data on race: American Indian or Alaska Native, Asian, Black or African American, Native Hawaiian or Other Pacific Islander, and White. The standards also require the collection of data on the ethnicity categories Hispanic or Latino and Not Hispanic or Latino. It is important to note that Hispanic origin is an ethnicity rather than a race, and therefore persons of Hispanic origin may be of any race. Origin can be viewed as the heritage, nationality group, lineage, or country of birth of the person or the person’s parents or ancestors before their arrival in the United States. The races White, Black, Asian, Native Hawaiian or Other Pacific Islander, and American Indian/Alaska Native, as presented in this report, exclude persons of Hispanic origin unless noted otherwise.
intrODuCtiOn

Status and Trends in the Education of Racial and Ethnic Groups2
intr
od
ucti
on
These racial/ethnic categories are defined as follows:
American Indian or Alaska Native: A person having origins in any of the original peoples of North and South America (including Central America) and who maintains tribal affiliation or community attachment.
Asian: A person having origins in any of the original peoples of the Far East, Southeast Asia, or the Indian subcontinent, including, for example, Cambodia, China, India, Japan, Korea, Malaysia, Pakistan, the Philippine Islands, Thailand, and Vietnam.
Black or African American: A person having origins in any of the black racial groups of Africa.
Native Hawaiian or Other Pacific Islander: A person having origins in any of the original peoples of Hawaii, Guam, Samoa, or other Pacific Islands.
White: A person having origins in any of the original peoples of Europe, the Middle East, or North Africa.
Hispanic or Latino: A person of Mexican, Puerto Rican, Cuban, South or Central American, or other Spanish culture or origin, regardless of race.
Within this report, some of the category names have been shortened. American Indian or Alaska Native is denoted as American Indian/Alaska Native; Black or African American is shortened to Black; and Hispanic or Latino is shortened to Hispanic. When discussed separately, Native Hawaiian or Other Pacific Islander is not shortened in the text, but is shortened in tables and figures to Native Hawaiian/Pacific Islander.
The indicators in this report are drawn from a number of different sources. Many are federal surveys that collect data using the OMB standards for racial/ethnic classification described above; however, some sources have not fully adopted the standards and some indicators include data collected prior to the adoption of the OMB standards. This report focuses on the six categories that are the most common among the various data sources used: White, Black, Hispanic, Asian, Native Hawaiian or Other Pacific Islander, and American Indian/Alaska Native. Asians and Native Hawaiians or Other Pacific Islanders are combined into one category in indicators for which the data were not collected separately for the two groups.
Some of the surveys from which data are presented in this report give respondents the option of selecting either an “other” race category, or two or more races (in some cases a “multiracial” category is the option), or both. Therefore, the remaining categories presented consist entirely of persons who identify as belonging to only one race or ethnicity. Where possible, indicators present data on the “two or more races” category; however, in some cases this category may not be separately shown, due to various data issues. The “other” category is not separately shown. Any comparisons made between persons of one racial/ethnic group to “all other racial/ethnic groups” include only the racial/ethnic groups shown in the indicator. In some surveys, respondents are not given the option to select more than one race. In these surveys, respondents of two or more races must select a single race category. Any comparisons between data from surveys that give the option to select more than one race and surveys that do not offer such an option should take into account the fact that there is a potential for bias if members of one racial group are more likely than members of the others to identify themselves as “two or more races.”2 For postsecondary data, foreign students are counted separately and therefore are not included in any racial/ethnic category. Please see Appendix A: Guide to Sources at the end of this report for specific information on each of the report’s data sources.
The American Community Survey, conducted by the U.S. Census Bureau, collects information regarding specific ancestry. “Snapshots” throughout this report highlight Hispanic ancestry subgroups (such as Mexican, Puerto Rican, or Cuban) and Asian ancestry subgroups (such as Asian Indian, Chinese, or Filipino). Indicator 2 (Nativity), Indicator 4 (Children Living in Poverty), Indicator 8.2 (English Language Learner Students), Indicator 18 (Dropout Rates and Graduation Rates), and Indicator 27 (Educational Attainment) each provide a “Snapshot” table that includes detailed Hispanic and Asian ancestries and a brief comparison among the subgroups and race/ethnicity categories. For more information on these subgroup definitions, see Appendix A: Guide to Sources.
2 Such bias was found by a National Center for Health Statistics study that examined race/ethnicity responses to the 2000 Census. This study found, for example, that as the percentage of multiple-race respondents in a county increased, the likelihood of respondents stating Black as their primary race increased among Black/White respondents but decreased among American Indian or Alaska Native/Black respondents. See Parker, J., et al., (2004). Bridging between two standards for collecting information on race and ethnicity: an application to Census 2000 and vital rates. Public Health Reports 119(2): 192–205. Available through http://www.pubmedcentral.nih.gov/articlerender.fcgi?artid=1497618.

Status and Trends in the Education of Racial and Ethnic Groups 3
introd
uction
technical note
This report includes data from both universe and sample surveys. In the case of universe data, all relevant units are included in the data collection. As a result, there is no sampling error, and observed differences are reported as true. In the case of sample surveys, a nationally representative sample of respondents is selected and asked to participate in the data collection. Since the sample represents just one of many possible samples that could be selected, there is error associated with the sample. To avoid reaching false conclusions about differences between groups or differences over time measured by sample survey data, sampling error is taken into account in statistical tests that are conducted to support statements about differences. Thus, all statements about differences in this report are supported by the data, either directly in the case of universe surveys or with statistical significance testing in the case of sample survey data. In addition, there are occasional references to apparent differences that are not significant.
All significance tests of differences in sample survey data are tested at the .05 level of significance. Several test procedures were used, depending on the type of data interpreted and the nature of the statement tested. The most commonly used test procedures were t tests, linear trend tests, and equivalency tests. The t tests were not adjusted to compensate for multiple comparisons being made simultaneously. Trend tests were conducted by evaluating the significance of the slope of a simple regression of the annual data points and by conducting a t test to compare the end points. Equivalence tests at the 0.15 level
were used to determine whether two statistics were substantively equivalent; this was accomplished by using a hypothesis test to determine whether the confidence interval of the difference between sample estimates was significantly greater or less than a preset substantively important difference. In most cases involving percentages, a difference of 3.0 percentage points was used to determine substantive equivalence or difference. In some indicators involving only very small percentages, a lower value was used. The appearance of a “!” symbol (meaning “Interpret data with caution”) in a table or figure indicates a data cell with a high ratio of standard error to estimate (0.30 or greater); therefore, the estimate may be unstable and the reader should use caution when interpreting the data. These unstable estimates are discussed, however, when statistically significant differences are found despite large standard errors.
Although percentages reported in the tables are generally rounded to one decimal place (e.g., 76.5 percent), percentages reported in the text and figures are generally rounded from the original number to whole numbers (with any value of 0.50 or above rounded to the next highest whole number). While the data labels on the figures have been rounded to whole numbers, the graphical presentation of these data are based on the unrounded estimates shown in the corresponding table. Due to rounding, cumulative percentages may sometimes equal 99 or 101 percent, rather than 100 percent. In addition, sometimes a whole number in the text may seem rounded incorrectly based on its value when rounded to one decimal place. For example, the percentage 14.479 rounds to 14.5 at one decimal place, but rounds to 14 when reported as a whole number.

This page intentionally left blank.

1 DEmOgrAPHiCs
The first chapter in this report presents demographic information that provides context for the education indicators presented in later chapters. In order to describe the status of the various racial/ethnic groups in this country’s education system, it is important to provide contextual information on the relative size of each group, where the members of those groups come from, and where and how they live.
For this reason, indicators 1 and 2 describe the size and distribution of the U.S. population in terms of race/ethnicity, geographic distribution, and nativity. Between 1999 and 2000, Hispanics surpassed Blacks as the country’s largest racial/ethnic group other than Whites, and the population of Hispanics continued to grow at a faster rate than the overall population through 2008 (indicator 1). In 2008, Hispanics repre-sented 15 percent of the total U.S. population. In the Western United States, in 2008, the percentages of the population who were Hispanic, Asian, Native Hawaiian or Other Pacific Islander, American Indian/Alaska Native, and persons of two or more races were higher than the national percentages. New Mexico, California, and Texas had the highest percentages of the population who were Hispanic (ranging from 36 to 45 percent).
In 2007, about 14 percent of the U.S. population was born outside of the United States (refers to the 50 states and the District of Columbia) (indicator 2). Approximately 69 percent of Asians and 44 percent of Hispanics were born outside of the United States. Of the population under 18 years old, 5 percent were born outside of the United States, including 24
percent of Asians, 21 percent of Native Hawaiians or Other Pacific Islanders, and 11 percent of Hispanics.
Indicators 3 and 4 examine the living arrangements and poverty status of children under the age of 18. In 2007, across all racial/ethnic groups except Blacks and American Indians/Alaska Natives, the majority of children under 18 were living with married parents (indicator 3). About 34 percent of Black children under 18 lived with married parents and 56 percent of Black children lived with a female parent with no spouse present.
About 18 percent of children under 18 were living in poverty (indicator 4). The overall percentages of children who were living in poverty were higher for Blacks (34 percent), American Indians/Alaska Natives (33 percent), Hispanics (27 percent), and Native Hawaiians or Other Pacific Islanders (26 percent), than for children of two or more races (18 percent), Asians (11 percent), and Whites (10 percent).
The last indicator in Chapter 1 focuses on the educational attainment of parents. In 2008, a higher percentage of Asian children had a mother with at least a bachelor’s degree than did White, Black, Hispanic, and American Indian/Alaska Native chil-dren (indicator 5). In addition, a higher percentage of Asian children had mothers with at least a bachelor’s degree than Native Hawaiian or Other Pacific Islander children and children of two or more races. This pattern was also true for the percentages of children with a father who had at least a bachelor’s degree.

Status and Trends in the Education of Racial and Ethnic Groups6
Ind
icat
or
1 —
Po
pul
atio
n an
d G
eog
rap
hic
Dis
trib
utio
ns
Figure 1. Percentage distribution of total population in the United States, by race/ethnicity: Selected years, 1980–2008, and projections, selected years, 2010–2025
NOTE: “Other” includes the following race categories: Native Hawaiian or Other Pacific Islander, American Indian/Alaska Native, and Two or more races. Numbers for the year 2000 are from the Decennial Census. All other years are population estimates. Prior to 2000, Asian includes Native Hawaiian or Other Pacific Islander. The category “Two or more races” was not an option prior to 1996. Race categories exclude persons of His-panic ethnicity. SOURCE: U.S. Department of Commerce, Census Bureau, Statistical Abstract of the United States: 2000 and 2004, Population Estimates Program, 1980–2000; Table 4: Estimates of the Population by Race and Hispanic Origin for the United States and States: July 1, 2008 (SC-EST2008-04), released May 14, 2009, retrieved May 15, 2009, from http://www.census.gov/popest/states/asrh/SC-EST2008-04.html; and Pro-jected Population by Single Year of Age, Sex, Race, and Hispanic Origin for the United States: July 1, 2000 to July 1, 2050 (NP2008-T4), released August 14, 2008.
■ White ■ Black ■ Hispanic ■ Asian ■ Other
1980 1985 1990 1995 2000
Year
2005 2010 2015 2020 20250
20
40
60
80
90
70
50
30
10
100Percent Projected
The U.S. population has become more diverse over the past two decades as the populations of Hispanics and Asians have increased more rapidly than the populations of Whites and Blacks. In particular, between 1999 and 2000, Hispanics surpassed Blacks as the largest racial/ethnic group other than Whites (U.S. Department of Commerce 2001a).3 The populations of Hispanics, Asians, Native Hawaiians or Other Pacific Islanders, and those of two or more races are expected to grow faster than the populations of Whites, Blacks, and American Indians/Alaska Natives between 2008 and 2025.
Between 1980 and 2008, there were shifts in the racial/ethnic composition of the resident population of the United States. In 1980, the White population represented about 80 percent of the total population.
This percentage decreased to 69 percent in 2000 and to 66 percent in 2008. In contrast, the Hispanic popu-lation’s share of the total population increased from 6.4 percent in 1980 to 12.6 percent in 2000 to 15.4 percent in 2008. In addition, Asians/Pacific Islanders represented less than 2 percent of the population in 1980 and by 2008, their share had increased to 4.5 percent (Asians represented 4.4 percent and Native Hawaiian or Other Pacific Islanders represented 0.1 percent of the population). The percentage of the total population who were Black increased from 11.5 to 12.2 percent between 1980 and 2000. Since 2000, the growth rate for the Black population has been similar to the growth rate of the overall population; thus, the Black population continued to represent 12.2 percent of the total population through 2008.
1. Population and Geographic Distributions
3 In 1999, Blacks represented 12.1 percent of the population and Hispanics represented 11.5 percent (U.S. Department of Commerce 2001b). In Census 2000 (table 1a) Blacks represented 12.2 percent of the population and Hispanics represented 12.6 percent.

Status and Trends in the Education of Racial and Ethnic Groups 7
Chap
ter 1 — D
emo
grap
hicsBetween 2008 and 2025, these patterns of population change are expected to continue. For example, the Hispanic population is expected to grow at a faster rate than most other races/ethnicities. In 2025, about 21 percent of the population is expected to be of Hispanic ethnicity. In addition, the growth rate for Whites is expected to be slower than the rate for
other races/ethnicities, decreasing their share of the total population. In 2025, the distribution of the population is expected to be 58 percent White, 21 percent Hispanic, 12 percent Black, 6 percent Asian, 2 percent two or more races, 1 percent American Indian/Alaska Native, and less than 1 percent Native Hawaiian or Other Pacific Islander.
table 1a. resident population and percentage distribution, by race/ethnicity: selected years, 1980–2008, and projections, selected years, 2010–2025
Year Total White Black Hispanic Asian
Native Hawaiian/
Pacific Islander
American Indian/ Alaska Native
Two or more races
Number (in thousands)1980 226,546 180,906 26,142 14,609 3,563 (1) 1,326 —1985 237,924 184,945 27,738 18,368 5,315 (1) 1,558 —1990 248,791 188,315 29,304 22,379 6,996 (1) 1,797 —1995 262,803 193,328 31,590 27,107 8,846 (1) 1,932 —2000 282,158 195,771 34,414 35,629 10,436 369 2,104 3,4362001 284,915 196,325 34,793 36,958 10,777 377 2,131 3,5552002 287,501 196,773 35,147 38,264 11,103 384 2,158 3,6732003 289,986 197,152 35,457 39,579 11,432 391 2,184 3,7912004 292,806 197,727 35,811 40,956 11,782 399 2,213 3,9182005 295,583 198,244 36,145 42,354 12,145 407 2,241 4,0472006 298,442 198,781 36,499 43,777 12,520 416 2,271 4,1792007 301,280 199,272 36,849 45,219 12,901 425 2,300 4,3142008 304,060 199,491 37,172 46,944 13,238 435 2,329 4,45220102 310,233 200,853 37,985 49,726 14,083 452 2,392 4,74320152 325,540 203,208 39,916 57,711 16,141 497 2,548 5,51920202 341,387 205,255 41,847 66,365 18,308 541 2,697 6,37420252 357,452 206,662 43,703 75,772 20,591 585 2,830 7,309
Percentage distribution1980 100.0 79.9 11.5 6.4 1.6 (1) 0.6 —1985 100.0 77.7 11.7 7.7 2.2 (1) 0.7 —1990 100.0 75.7 11.8 9.0 2.8 (1) 0.7 —1995 100.0 73.6 12.0 10.3 3.4 (1) 0.7 —2000 100.0 69.4 12.2 12.6 3.7 0.1 0.7 1.22001 100.0 68.9 12.2 13.0 3.8 0.1 0.7 1.22002 100.0 68.4 12.2 13.3 3.9 0.1 0.8 1.32003 100.0 68.0 12.2 13.6 3.9 0.1 0.8 1.32004 100.0 67.5 12.2 14.0 4.0 0.1 0.8 1.32005 100.0 67.1 12.2 14.3 4.1 0.1 0.8 1.42006 100.0 66.6 12.2 14.7 4.2 0.1 0.8 1.42007 100.0 66.1 12.2 15.0 4.3 0.1 0.8 1.42008 100.0 65.6 12.2 15.4 4.4 0.1 0.8 1.520102 100.0 64.7 12.2 16.0 4.5 0.1 0.8 1.520152 100.0 62.4 12.3 17.7 5.0 0.2 0.8 1.720202 100.0 60.1 12.3 19.4 5.4 0.2 0.8 1.920252 100.0 57.8 12.2 21.2 5.8 0.2 0.8 2.0
— Not available.1 Prior to 2000, estimates for Native Hawaiian or Other Pacific Islander are included in the estimates for Asian.2 Projected.NOTE: Numbers for the year 2000 are from the Decennial Census. All other years are population estimates. The category “Two or more races” was not an option prior to 1996. Race categories exclude persons of Hispanic ethnicity. Detail may not sum to totals because of rounding.SOURCE: U.S. Department of Commerce, Census Bureau, Statistical Abstract of the United States: 2000 and 2004, Population Estimates Program, 1980–2000; Table 4: Estimates of the Population by Race and Hispanic Origin for the United States and States: July 1, 2008 (SC-EST2008-04), released May 14, 2009, retrieved May 15, 2009, from http://www.census.gov/popest/states/asrh/SC-EST2008-04.html; and Projected Population by Single Year of Age, Sex, Race, and Hispanic Origin for the United States: July 1, 2000 to July 1, 2050 (NP2008-T4), released August 14, 2008.

Status and Trends in the Education of Racial and Ethnic Groups8
ind
icat
or
1 —
Po
pul
atio
n an
d g
eog
rap
hic
Dis
trib
utio
nsRacial/ethnic composition varies regionally and from state to state. In 2008, the West had higher percentages of its population who were Hispanic, Asian, Native Hawaiian or Other Pacific Islander, American Indian/Alaska Native, and of two or more races when compared with the national proportions. In the West, the population was 28 percent Hispanic, 9 percent Asian, 0.5 percent Native Hawaiian or Other Pacific Islander, 2 percent American Indian/Alaska Native, and 2 percent persons of two or more races. In contrast, the Midwest had lower percentages of these racial/ethnic groups when compared with the national percentages. In the Midwest, the population was 6 percent Hispanic, 2 percent Asian, 1 percent each American Indian/Alaska Native and persons of two or more races, and less than 0.05 percent Native Hawaiian or Other Pacific Islander.
Among the 50 states and the District of Columbia, Hawaii had the highest percentage of its population
who were Asian (38 percent), Native Hawaiian or Other Pacific Islander (9 percent), and of two or more races (16 percent). New Mexico had the highest percentage of its population who were Hispanic (45 percent). Other states with large percentages of their population who were Hispanic included California (37 percent) and Texas (36 percent). The District of Columbia had the highest percentage of its popula-tion who were Black (53 percent) when compared with the 50 states.
In contrast to other states, several states had smaller percentages of its population who were Black, Hispanic, Asian, Native Hawaiian or Other Pacific Islander, American Indian/Alaska Native, and of two or more races. In such states as Maine, Vermont, West Virginia, New Hampshire, and Iowa, those racial/ethnic groups combined represented less than 10 percent of the population.
table 1b. Percentage distribution of the resident population, by race/ethnicity, region, and state: 2008
Region and state White Black Hispanic Asian
Native Hawaiian/
Pacific Islander
American Indian/ Alaska Native
Two or more races
united states 65.6 12.2 15.4 4.4 0.1 0.8 1.5Northeast 70.7 11.1 11.7 5.1 # 0.2 1.1 Connecticut 73.8 9.3 0.2 3.4 # 1.2 12.0 Maine 95.3 1.0 1.3 0.9 # 0.6 1.0 Massachusetts 79.2 5.9 8.6 4.9 # 0.2 1.2 New Hampshire 93.1 1.1 2.6 1.9 # 0.2 1.0 New Jersey 61.7 13.1 16.3 7.6 # 0.2 1.1 New York 60.0 14.8 16.7 6.9 # 0.3 1.2 Pennsylvania 81.4 10.3 4.8 2.4 # 0.1 1.0 Rhode Island 78.8 5.0 11.6 2.7 0.1 0.4 1.3 Vermont 95.2 0.8 1.4 1.1 # 0.4 1.1
Midwest 79.2 10.2 6.4 2.4 # 0.6 1.2 Illinois 64.7 14.5 15.2 4.3 # 0.2 1.1 Indiana 83.2 8.9 5.2 1.3 # 0.2 1.1 Iowa 90.3 2.5 4.2 1.6 # 0.3 1.0 Kansas 80.3 5.9 9.1 2.2 0.1 0.9 1.6 Michigan 77.5 14.0 4.1 2.3 # 0.5 1.4 Minnesota 85.4 4.4 4.1 3.5 # 1.1 1.4 Missouri 82.1 11.3 3.2 1.4 0.1 0.4 1.4 Nebraska 84.1 4.3 7.9 1.7 0.1 0.9 1.2 North Dakota 89.6 1.0 2.1 0.7 # 5.4 1.1 Ohio 82.5 11.8 2.6 1.6 # 0.2 1.3 South Dakota 86.1 1.1 2.6 0.7 # 8.2 1.3 Wisconsin 85.1 5.9 5.1 2.0 # 0.9 1.1
See notes at end of table.

Status and Trends in the Education of Racial and Ethnic Groups 9
Chap
ter 1 — D
emo
grap
hicstable 1b. Percentage distribution of the resident population, by race/ethnicity, region, and state: 2008—
Continued
Region and state White Black Hispanic Asian
Native Hawaiian/
Pacific Islander
American Indian/ Alaska Native
Two or more races
united states 65.6 12.2 15.4 4.4 0.1 0.8 1.5South 62.0 18.8 14.8 2.5 0.1 0.7 1.2 Alabama 68.4 26.2 2.9 0.9 # 0.5 1.0 Arkansas 75.6 15.5 5.6 1.0 0.1 0.8 1.3 Delaware 68.3 20.4 6.8 2.8 # 0.3 1.3 District of Columbia 33.1 53.1 8.6 3.3 0.1 0.3 1.4 Florida 60.3 15.0 21.0 2.2 0.1 0.3 1.2 Georgia 58.1 29.6 8.0 2.8 0.1 0.3 1.2 Kentucky 87.8 7.6 2.4 1.0 # 0.2 1.0 Louisiana 61.9 31.7 3.4 1.4 # 0.6 1.0 Maryland 57.7 28.8 6.7 5.0 0.1 0.3 1.5 Mississippi 58.7 37.0 2.2 0.8 # 0.5 0.8 North Carolina 67.2 21.2 7.4 1.9 0.1 1.1 1.1 Oklahoma 71.4 7.7 7.6 1.7 0.1 7.7 3.9 South Carolina 65.2 28.1 4.1 1.2 # 0.4 1.0 Tennessee 77.1 16.5 3.7 1.3 # 0.3 1.1 Texas 47.4 11.3 36.5 3.3 0.1 0.4 1.1 Virginia 67.0 19.5 6.8 4.8 0.1 0.3 1.6 West Virginia 93.5 3.5 1.1 0.7 # 0.2 0.9
West 54.7 4.6 27.9 8.6 0.5 1.5 2.3 Alaska 65.7 3.9 6.1 4.4 0.6 14.8 4.4 Arizona 58.4 3.5 30.1 2.3 0.1 4.1 1.4 California 42.3 6.0 36.6 12.1 0.3 0.5 2.1 Colorado 71.0 3.8 20.2 2.5 0.1 0.7 1.6 Hawaii 24.9 2.8 8.7 38.4 8.6 0.4 16.1 Idaho 85.1 0.7 10.2 1.1 0.1 1.3 1.5 Montana 87.9 0.6 3.0 0.6 0.1 6.2 1.6 Nevada 57.1 7.3 25.7 6.0 0.5 1.1 2.3 New Mexico 41.7 2.1 44.9 1.2 0.1 8.6 1.3 Oregon 80.0 1.8 11.0 3.6 0.3 1.2 2.3 Utah 81.7 1.0 12.0 1.9 0.7 1.2 1.5 Washington 75.5 3.4 9.8 6.6 0.4 1.4 2.8 Wyoming 86.8 1.1 7.7 0.7 0.1 2.3 1.3
# Rounds to zero. NOTE: Race categories exclude persons of Hispanic ethnicity. Detail may not sum to totals because of rounding. SOURCE: U.S. Department of Commerce, Census Bureau, Table 4: Estimates of the Population by Race and Hispanic Origin for the United States and States: July 1, 2008 (SC-EST2008-04), released May 14, 2009, retrieved May 15, 2009, from http://www.census.gov/popest/states/asrh/SC-EST2008-04.html.

Status and Trends in the Education of Racial and Ethnic Groups10
ind
icat
or
2 —
nat
ivit
y
The population in the United States born outside of the 50 states and the District of Columbia (referred to in this indicator as “born outside the United States”) increased between 2000 and 2007, making up 12 percent of the U.S. population in 2000 and 14 percent in 2007. The percentage of children born outside the U.S., however, has remained steady since 2000 at 5 percent of the U.S. population.
In the United States in 2007, about 5 percent of the 73.9 million children under age 18 were born outside of the United States. Some 24 percent of Asian children were born outside the United States, a higher percentage than any other race/ethnicity except Native Hawaiian or Other Pacific Islander. The percentages of Native Hawaiian or Other Pacific Islander (21 percent) and Hispanic (11 percent) children who were born outside the United States were also higher than those for children of two or more races (3 percent), Black children (3 percent), White children (2 percent), and American Indian/Alaska Native children (0.4 percent). Between 2000 and 2007, the percentage of children
under age 18 who were born outside the United States increased by 7 percentage points for Native Hawaiians or Other Pacific Islanders and decreased for Hispanics and Asians by 3 and 2 percentage points, respectively.
In 2007, some 14 percent of the total population was born outside the United States. The percentage of the total population born outside the United States was higher than the percentage of children born outside the United States for all racial/ethnic groups. Among the racial/ethnic groups, 69 percent of Asians, 44 percent of Hispanics, 40 percent of Native Hawaiians or Other Pacific Islanders, 8 percent of Blacks, 7 percent of those of two or more races, 5 percent of Whites, and 2 percent of American Indians/Alaska Natives were born outside the United States. Between 2000 and 2007, the percentage of Blacks and Native Hawaiians or other Pacific Islanders who were born outside the United States increased. However, during the same period, there was a decline in the percentage of persons of two or more races born outside the United States.
2. nativity
figure 2. Percentage distribution of population under 18 in the united states, by race/ethnicity and nativity: 2007
# Rounds to zero. 1 Total includes other race/ethnicity categories not separately shown. 2 United States refers to the 50 states and the District of Columbia.NOTE: Race categories exclude persons of Hispanic ethnicity. Detail may not sum to totals because of rounding. SOURCE: U.S. Department of Commerce, Census Bureau, American Community Survey, 2007.
■ Born within the United States2 ■ Born outside the United States2
Total1 White Black Hispanic Asian
Race/ethnicity
NativeHawaiian/
Pacific Islander
AmericanIndian/Alaska
Native
Two ormoreraces
Percent
95
5
98
2
97
3
89
11
76
24
79
21
100
#
97
3
0
20
40
60
80
90
70
50
30
10
100

Status and Trends in the Education of Racial and Ethnic Groups 11
Chap
ter 1 — D
emo
grap
hicstable 2a. number and percentage of population in the united states, by nativity and race/ethnicity: 2000,
2005, and 2007
Total population Under 18
Born within the United States1
Born outside the United States1
Born within the United States1
Born outside the United States1
Year and race/ ethnicity
Number (in thou-
sands) Percent
Number (in thou-
sands) Percent
Number (in thou-
sands) Percent
Number (in thou-
sands) Percent2000
total2 239,867 87.7 33,764 12.3 68,434 94.9 3,673 5.1White 181,930 95.5 8,521 4.5 43,562 98.2 806 1.8Black 29,385 93.1 2,171 6.9 9,950 97.3 273 2.7Hispanic 19,239 56.2 15,025 43.9 10,318 85.1 1,806 14.9Asian 3,100 29.9 7,263 70.1 1,863 74.1 651 25.9Native Hawaiian/
Pacific Islander 254 69.0 114 31.0 105 86.1 17 13.9American Indian/
Alaska Native 1,786 97.6 45 2.4 602 98.0 12 2.0Two or more races 3,780 90.1 415 9.9 1,878 96.2 74 3.8
2005total2 249,067 86.4 39,332 13.6 69,361 94.8 3,786 5.2
White 183,732 95.4 8,795 4.6 41,570 98.1 795 1.9Black 31,663 92.0 2,747 8.0 10,297 97.1 311 2.9Hispanic 23,456 56.0 18,470 44.1 12,554 87.0 1,885 13.1Asian 3,802 30.8 8,529 69.2 2,131 75.8 682 24.2Native Hawaiian/
Pacific Islander 224 64.6 122 35.4 76 82.5 16 17.5American Indian/
Alaska Native 1,996 98.0 40 2.0 578 99.0 6 1.0Two or more races 3,741 92.5 305 7.5 1,891 97.1 57 2.9
2007total2 259,801 86.1 41,821 13.9 70,336 95.2 3,576 4.8
White 189,497 95.4 9,097 4.6 41,218 98.2 737 1.8Black 33,622 91.8 3,003 8.2 10,275 97.3 290 2.7Hispanic 25,572 56.4 19,806 43.7 13,581 88.6 1,751 11.4Asian 4,036 30.8 9,065 69.2 2,197 76.1 690 23.9Native Hawaiian/
Pacific Islander 242 59.8 163 40.2 82 78.8 22 21.2American Indian/
Alaska Native 1,989 98.4 32 1.6 557 99.6 2 0.4Two or more races 4,430 92.6 356 7.4 2,208 97.5 58 2.51 United States refers to the 50 states and the District of Columbia. 2 Total includes other race/ethnicity categories not separately shown.NOTE: Race categories exclude persons of Hispanic ethnicity. This table uses a different data source from table 1a; therefore, detail in this table will not sum to the totals in table 1a. Detail may not sum to totals because of rounding. SOURCE: U.S. Department of Commerce, Census Bureau, American Community Survey, 2000, 2005, and 2007.

Status and Trends in the Education of Racial and Ethnic Groups12
ind
icat
or
2 —
nat
ivit
y
The two racial/ethnic groups whose populations had the largest proportions of persons born outside the United States in 2007 were Asians and Hispanics. About 69 percent of the 13.1 million Asians and 44 percent of the 45.4 million Hispanics living in the United States in 2007 were born outside the 50 states and District of Columbia.
Among children born outside of the United States under the age of 18 in 2007, some 49 percent were Hispanic and 19 percent were Asian. Approximately 32 percent of all children born outside the United States were Mexican, a higher percentage than any other Hispanic subgroup. About 4 percent of children born outside the United States were South American, 4 percent were Puerto Rican, 3 percent were Other Central American, 2 percent were Dominican, 2 percent were Salvadoran, and 1 percent each were Cuban and Other Hispanic/Latino. Some 19 percent of all children born outside the United States were Asian, with children in the following subgroups: Chinese children (5 percent), Asian Indian children (4 percent), Filipino and Korean children (3 percent each), Other Asian and Vietnamese children (2 percent each), and Japanese children (1 percent).
Snapshot of Hispanic and Asian Subgroups: Nativity
table 2b. number, percentage, and percentage distribution of u.s. population, by nativity and race/ethnicity with Hispanic and Asian subgroups: 2007
Born outside the United States1
Race/ethnicity and subgroup
Total population
Born within the United States1 Number Percent
Percentage distribution
Total2 301,621,200 86.1 41,820,700 13.9 100.0White 198,594,500 95.4 9,097,000 4.6 21.8Black 36,624,900 91.8 3,002,900 8.2 7.2Hispanic 45,378,600 56.4 19,806,300 43.7 47.4
Mexican 29,189,300 59.5 11,812,300 40.5 28.3Puerto Rican 4,114,700 64.8 1,448,300 35.2 3.5Cuban 1,608,800 37.5 1,004,900 62.5 2.4Dominican 1,198,800 37.9 744,000 62.1 1.8Salvadoran 1,473,500 33.3 983,400 66.7 2.4Other Central American 2,059,100 31.2 1,417,000 68.8 3.4South American 2,500,800 28.9 1,779,000 71.1 4.3Other Hispanic or Latino 3,233,500 80.9 617,300 19.1 1.5
Asian 13,100,900 30.8 9,064,700 69.2 21.7Asian Indian 2,578,200 26.3 1,901,000 73.7 4.6Chinese3 3,022,600 28.2 2,170,100 71.8 5.2Filipino 2,383,900 29.6 1,678,000 70.4 4.0Japanese 783,400 56.5 340,900 43.5 0.8Korean 1,350,500 22.6 1,044,900 77.4 2.5Vietnamese 1,478,300 32.3 1,000,900 67.7 2.4Other Asian 1,504,000 38.2 928,900 61.8 2.2
Native Hawaiian/ Pacific Islander 404,200 59.8 162,700 40.2 0.4
American Indian/ Alaska Native 2,021,700 98.4 32,300 1.6 0.1
Two or more races 4,785,900 92.6 356,000 7.4 0.91 United States refers to the 50 states and the District of Columbia.2 Total includes other race/ethnicity categories not separately shown.3 Excludes Taiwanese. Taiwanese is included in the “Other Asian” category.NOTE: Population estimates may differ from those in other tables due to time of year of estimation. Race categories exclude persons of Hispanic ethnicity. Detail may not sum to totals because of rounding. SOURCE: U.S. Department of Commerce, Census Bureau, American Community Survey, 2007.

Status and Trends in the Education of Racial and Ethnic Groups 13
Chap
ter 1 — D
emo
grap
hics
Of all the Hispanic subgroups, South Americans had the highest percentage of children who were born outside the United States (26 percent). Among Asian subgroups, Koreans had the highest percentage of children born outside the United States (39 percent).
The percentage of children under age 18 who were born outside the United States was lower than the percentage of the total population who were born outside the United States for all Hispanics (11 vs. 44 percent) and Asians (24 vs. 69 percent). There were also differences between the distributions of children born outside the United States and the total population born outside the United States among some subgroups. A larger proportion of children outside the United States were Mexican (32 percent), compared with the proportion of Mexicans in the total population who were born outside of the United States (28 percent). In contrast, a smaller percentage of Vietnamese children were born outside the United States, compared with the percentage of Vietnamese in the total population who were born outside the United States (1.7 vs. 2.4 percent).
Table 2c. Number, percentage, and percentage distribution of U.S. population under age 18, by nativity and race/ethnicity with Hispanic and Asian subgroups: 2007
Born outside the United States1
Race/ethnicity and subgroup
Total population
Born within the United States1 Number Percent
Percentage distribution
Total2 73,912,900 95.2 3,576,500 4.8 100.0White 41,955,200 98.2 737,100 1.8 20.6Black 10,565,400 97.3 290,000 2.7 8.1Hispanic 15,332,000 88.6 1,751,100 11.4 49.0
Mexican 10,616,900 89.3 1,134,400 10.7 31.7Puerto Rican 1,334,300 89.5 139,700 10.5 3.9Cuban 328,400 86.0 46,000 14.0 1.3Dominican 370,200 82.0 66,700 18.0 1.9Salvadoran 429,600 86.8 56,800 13.2 1.6Other Central American 558,700 81.3 104,700 18.8 2.9South American 609,700 74.3 156,800 25.7 4.4Other Hispanic or Latino 1,084,300 95.8 46,000 4.2 1.3
Asian 2,886,500 76.1 689,700 23.9 19.3Asian Indian 623,100 77.1 142,600 22.9 4.0Chinese3 607,600 73.3 162,200 26.7 4.5Filipino 460,900 76.0 110,800 24.0 3.1Japanese 84,300 68.2 26,800 31.8 0.8Korean 287,300 61.2 111,600 38.9 3.1Vietnamese 372,100 83.7 60,600 16.3 1.7Other Asian 451,200 83.4 75,000 16.6 2.1
Native Hawaiian/Pacific Islander 103,900 78.8 22,000 21.2 0.6
American Indian/Alaska Native 558,700 99.6 2,200 0.4 0.1
Two or more races 2,265,300 97.5 57,600 2.5 1.61 United States refers to the 50 states and the District of Columbia.2 Total includes other race/ethnicity categories not separately shown.3 Excludes Taiwanese. Taiwanese is included in the “Other Asian” category.NOTE: Population estimates may differ from those in other tables due to time of year of estimation. Race categories exclude persons of Hispanic ethnicity. Detail may not sum to totals because of rounding.SOURCE: U.S. Department of Commerce, Census Bureau, American Community Survey, 2007.

Status and Trends in the Education of Racial and Ethnic Groups14
ind
icat
or
3 —
Chi
ldre
n’s
livi
ng A
rran
gem
ents In 2007, about 73.9 million children under 18 years
old resided in the United States. Of these children, 66 percent lived with married parents, 25 percent lived with a female parent with no spouse present, 7 percent lived with a male parent with no spouse present, and 2 percent lived in other arrangements.4
Across all racial/ethnic groups shown except Blacks and American Indians/Alaska Natives, the majority of children under 18 years old lived with married parents. About 83 percent of all Asian children lived with married parents, higher than the percentages for White children (75 percent), Native Hawaiian or Other Pacific Islander children (61 percent), Hispanic children (61 percent), children of two or more races (56 percent), American Indian/Alaska Native children (47 percent), and Black children
(34 percent). A higher percentage of Black children lived with a female parent with no spouse present (56 percent) than did American Indian/Alaska Native children (38 percent), children of two or more races (34 percent), Hispanic children (28 percent), Native Hawaiian or Other Pacific Islander children (27 percent), White children (17 percent), and Asian children (11 percent). A higher percentage of American Indian/Alaska Native children (11 percent) lived with a male parent with no spouse present than did Hispanic children (9 percent), Black children (8 percent), children of two or more races (7 percent), White children (6 percent), and Asian children (5 percent). Two percent of all children lived in other arrangements, with percentages by race/ethnicity ranging from 1 percent of Asian children to 4 percent of American Indian/Alaska Native children.
3. Children’s living Arrangements
4 Children are classified by either their parent’s marital status or, if no parents are present in the household, by the marital status of the related householder. Children in the “Other” category include those who are not related to the householder (foster children, children in unrelated subfamilies, and children living in group quarters), plus any children who were reported as the householder or spouse of the householder.
table 3. number and percentage distribution of children under age 18, by living arrangements and race/ethnicity: 2007
Race/ethnicityNumber of
children
Percentage distribution of children, by living arrangements
Total
Children living with parent(s) or related to householder1
All other children2
Married parents
Female parent,
no spouse present
Male parent,
no spouse present
total3 73,913,000 100.0 65.6 25.2 7.0 2.2White 41,955,000 100.0 75.0 16.8 6.1 2.0Black 10,565,000 100.0 33.6 56.0 7.6 2.8Hispanic 15,332,000 100.0 60.7 27.8 8.9 2.5Asian 2,886,000 100.0 82.5 11.4 4.9 1.2Native Hawaiian/
Pacific Islander 104,000 100.0 60.7 27.4 8.7 3.2American Indian/
Alaska Native 559,000 100.0 47.1 38.2 11.0 3.7Two or more races 2,265,000 100.0 56.5 33.8 7.2 2.41 Children in these living arrangements live with their parent(s) or live with a householder to whom they are related in some way. Children are classified by either their parent’s marital status or, if no parents are present in the household, by the marital status of the related householder. 2 Children in this category are those who are not related to the householder (foster children, children in unrelated subfamilies, and children living in group quarters), plus any children who were reported as the householder or spouse of the householder. 3 Total includes other race/ethnicity categories not separately shown. NOTE: The householder of record is the person living or staying in the household in whose name the house or apartment is owned, being bought, or rented. Race categories exclude persons of Hispanic ethnicity. Detail may not sum to totals because of rounding. SOURCE: U.S. Department of Commerce, Census Bureau, American Community Survey, 2007.

Status and Trends in the Education of Racial and Ethnic Groups 15
Chap
ter 1 — D
emo
grap
hicsfigure 3. Percentage distribution of children under age 18, by race/ethnicity and living arrangements:
2007
1 Children in this category are those who are not related to the householder (foster children, children in unrelated subfamilies, and children living in group quarters), plus any children who were reported as the householder or spouse of the householder. NOTE: Children are classified by either their parent’s marital status or, if no parents are present in the household, by the marital status of the related householder. The householder of record is the person living or staying in the household in whose name the house or apartment is owned, being bought, or rented. Race categories exclude persons of Hispanic ethnicity. Detail may not sum to totals because of rounding. SOURCE: U.S. Department of Commerce, Census Bureau, American Community Survey, 2007.
■ Married parents ■ Female parent, no ■ Male parent, no ■ Other1 spouse present spouse present
White Black Hispanic Asian
Race/ethnicity
NativeHawaiian/
Pacific Islander
AmericanIndian/Alaska
Native
Two ormoreraces
Percent
0
20
40
60
80
90
70
50
30
10
100
75
17
6
2
34
56
8
3
61
28
9
3
83
11
51
61
27
9
3
47
38
11
4
56
34
7
2

Status and Trends in the Education of Racial and Ethnic Groups16
ind
icat
or
4 —
Chi
ldre
n li
ving
in P
ove
rty
Poverty poses a serious challenge to a child’s ability to succeed in school. Research has suggested that living in poverty in the early childhood years can lead to lower rates of school completion (Brooks-Gunn and Duncan, 1997). Further, growing up in poverty can negatively affect a child’s physical health as well as his or her working memory, due to the chronic
psychological stress of living in poverty (Evans and Schamberg 2009). In the United States in 2007, some 18 percent of children under age 18 were living in poverty.5 The percentage of these children living in poverty ranged from 5 to 52 percent depending on race/ethnicity and living arrangement.
4. Children living in Poverty
5 Children are classified by either their parent’s marital status or, if no parents are present in the household, by the marital status of the related householder. Poverty information was available for children who were related to the householder. Therefore, this indicator excludes any children who were not related to the householder or who are recorded as the householder or spouse of the householder. To define poverty, the U.S. Census Bureau utilizes a set of money income thresholds that vary by family size and composition. A family, along with each individual in it, is considered poor if the family’s total income is less than that family’s threshold. The poverty thresholds do not vary geographically and are adjusted annually for inflation using the Consumer Price Index. The official poverty definition counts money income before taxes and does not include capital gains and noncash benefits (such as public housing, Medicaid, and food stamps).
table 4. Percentage of children under age 18 living in poverty, by living arrangements and race/ethnicity with Hispanic and Asian subgroups: 2007
Race/ethnicity and subgroup
All children related to
householder
Living arrangement
Married parents
Female parent, no spouse present
Male parent, no spouse present
total1 17.5 8.1 41.4 19.7White 10.1 5.0 31.4 14.5Black 34.1 11.2 48.6 28.4Hispanic 27.1 17.7 48.7 24.3
Mexican 28.6 20.4 50.5 25.1Puerto Rican 31.6 10.4 52.1 27.1Cuban 12.7 7.0 28.6 13.4Dominican 34.1 13.6 50.9 23.0Salvadoran 19.8 10.9 41.8 17.3Other Central American 25.1 14.9 45.6 24.3South American 14.3 9.1 29.8 17.6Other Hispanic or Latino 20.9 9.4 43.0 23.8
Asian 11.1 8.1 30.6 15.8Asian Indian 7.5 6.4 21.3 20.1Chinese2 10.5 8.4 26.1 17.8Filipino 5.0 2.7 16.3 7.9!Japanese 9.9 7.3 25.4 41.7!Korean 10.8 7.4 36.1 9.0!Vietnamese 15.2 10.6 35.7 15.4Other Asian 19.9 14.8 45.0 19.3
Native Hawaiian/Pacific Islander 25.6 18.6 37.7 35.6American Indian/Alaska Native 32.7 17.9 51.5 30.5Two or more races 17.9 5.2 38.5 19.8
! Interpret data with caution. 1 Total includes other race/ethnicity categories not separately shown. 2 Excludes Taiwanese. Taiwanese is included in the “Other Asian” category. NOTE: Children are classified by either their parent’s marital status or, if no parents are present in the household, by the marital status of the related householder. Poverty information was available for children who were related to the householder. Therefore, this table excludes any children who were not related to the householder or who are recorded as the householder or spouse of the householder. To define poverty, the U.S. Census Bureau utilizes a set of money income thresholds that vary by family size and composition. A family, along with each individual in it, is considered poor if the family’s total income is less than that family’s threshold. The poverty thresholds do not vary geographically and are adjusted annually for inflation using the Consumer Price Index. The official poverty definition counts money income before taxes and does not include capital gains and noncash benefits (such as public housing, Medicaid, and food stamps). Race categories exclude persons of Hispanic ethnicity. SOURCE: U.S. Department of Commerce, Census Bureau, American Community Survey, 2007.

Status and Trends in the Education of Racial and Ethnic Groups 17
Chap
ter 1 — D
emo
grap
hicsThe percentages of children who were living in poverty were higher for Blacks (34 percent), American Indians/Alaska Natives (33 percent), Hispanics (27 percent), and Native Hawaiians or Other Pacific Islanders (26 percent), than for children of two or more races (18 percent), Asians (11 percent), and Whites (10 percent). The poverty rate for children living with a female parent with no spouse present was higher for American Indian/Alaska Native children (52 percent), Hispanic and Black children (49 percent each) and children of two or more races (39 percent) than for White children (31 percent) and Asian children (31 percent). In addition, the percentage of children living with a female parent with no spouse present and living in poverty was higher for American Indian/Alaska Native children than for Native Hawai-ian or Other Pacific Islander children (38 percent). No other measurable differences were found between Native Hawaiians or Other Pacific Islanders and other racial/ethnic groups living with a female parent with no spouse present and living in poverty, in part due to high standard errors. For children living with a male parent with no spouse present, the percentages in poverty for American Indian/Alaska Native children (30 percent) and Black children (28 percent) were higher than the percentages for Hispanic children
in poverty (24 percent), and each were higher than the percentages for children of two or more races (20 percent), Asian children (16 percent), and White children (15 percent). Among married-parent living arrangements, a smaller percentage of White children and children of two or more races (5 percent each) were living in poverty than was the case for Asian (8 percent), Black (11 percent), Hispanic (18 percent), American Indian/Alaska Native (18 percent), and Native Hawaiian or Other Pacific Islander (19 percent) children.
In general, across racial/ethnic groups, a higher percentage of children living with a female parent with no spouse present were living in poverty than children living with a male parent with no spouse present. Compared with other living arrangements, children living with married parents had the lowest poverty rate for each race/ethnicity shown. For instance, 49 percent of all Hispanic children classified as living with a female parent with no spouse present lived in poverty in 2007, compared with 24 percent of Hispanic children living with a male parent with no spouse present and 18 percent of Hispanic children living with married parents.
Figure 4. Percentage of children under 18 living in poverty, by living arrangements and race/ethnicity: 2007
NOTE: Children are classified by either their parent’s marital status or, if no parents are present in the household, by the marital status of the related householder. Poverty information was available for children who were related to the householder. Poverty information was available for children who were related to the householder. Therefore, this table excludes any children who were not related to the householder or who are recorded as the householder or spouse of the householder. To define poverty, the U.S. Census Bureau utilizes a set of money income thresholds that vary by family size and composition. A family, along with each individual in it, is considered poor if the family’s total income is less than that family’s threshold. The poverty thresholds do not vary geographically and are adjusted annually for inflation using the Consumer Price Index. The official poverty definition counts money income before taxes and does not include capital gains and noncash benefits (such as public housing, Medicaid, and food stamps). Race categories exclude persons of Hispanic ethnicity. SOURCE: U.S. Department of Commerce, Census Bureau, American Community Survey, 2007.
■ White ■ Black ■ Hispanic ■ Asian ■ Native Hawaiian/ ■ American Indian/ ■ Two or more Pacific Islander Alaska Native races
Married parents Female parent,no spouse present
Male parent,no spouse present
Living arranagement
Percent
0
10
20
30
40
50
60
5
11
18
8
19 18
5
31
49 49
31
38
52
39
15
2824
16
36
30
20 Allchildren:18%

Status and Trends in the Education of Racial and Ethnic Groups18
ind
icat
or
4 —
Chi
ldre
n li
ving
in P
ove
rty
In 2007, there were 15.3 million Hispanic children and 2.9 million Asian children under age 18 (see indicator 3). Of these children who were living with their parents or a relative, 27 percent of Hispanic children and 11 percent of Asian children were living in poverty.
A higher percentage of Hispanic children were living in poverty (27 percent) than the national percentage of children living in poverty (18 percent). Some 34 percent of Dominican, 32 percent of Puerto Rican, 29 percent of Mexican, 25 percent of Other Central American, and 21 percent of Other Hispanic or Latino children were living in poverty; each percentage was higher than the national estimate. A lower percentage of Cuban children (13 percent) and South American children (14 percent) were living in poverty compared with the national estimate. The percentage of Salvadoran families living in poverty was not measurably different from the national percentage.
A lower percentage of Asian children were living in poverty (11 percent) than the national percentage of children in poverty (18 percent). Specifically, percentages for Filipino (5 percent), Asian Indian (8 percent), Japanese (10 percent), Chinese (11 percent), Korean (11 percent), and Vietnamese (15 percent) children in poverty were lower than the national percentage, while the percentage of Other Asian (20 percent) children living in poverty was not measurably different than the national percentage.
Snapshot of Hispanic and Asian Subgroups: Children Living in Poverty

This page intentionally left blank.

Status and Trends in the Education of Racial and Ethnic Groups20
Ind
icat
or
5 —
Par
enta
l Ed
ucat
ion
Research has shown a link between parental educa-tion levels and child outcomes such as educational experience, attainment, and academic achievement. For example, there was a positive association between children with highly educated mothers and their rates of participation in early childhood education programs and home literacy activities (U.S. Depart-ment of Education 2009, indicators 2 and 3). In addition, children with more highly educated parents earned higher average reading and mathematics scores on the National Assessment of Educational Progress (NAEP) than did children with less-educated parents (U.S. Department of Education 2009, indicators 12 and 13). Although the overall level of educational attainment, in terms of the percentage of students earning a college degree, increased between 1996 and 2008 for each racial/ethnic group (see indicator 27), there were differences across these groups.
Generally, the percentages of Asian and White children who had parents with at least a bachelor’s degree were higher than the percentages of children of other races/ethnicities who had parents with at least a bachelor’s degree in 2008. In addition, the percentage of Asian children whose mothers held at least a bachelor’s degree (51 percent) was higher than the corresponding percentage for White children (36 percent). These two percentages were higher than the percentages of Black (17 percent), Hispanic (11 percent), and American Indian/Alaska Native (16 percent) children who had mothers with at least a bachelor’s degree. In addition, the percentage of
Asian children with mothers who had at least a bachelor’s degree was higher than the percentages of Native Hawaiian or Other Pacific Islander children (25 percent) and children of two or more races (31 percent) whose mothers had similar educational attainment.6 A higher percentage of children of two more races than Black or Hispanic children had a mother who had at least a bachelor’s degree, and a higher percentage of Black children than Hispanic children had mothers who had at least a bachelor’s degree. The same patterns held true for the percent-ages of children who had fathers with at least a bachelor’s degree.
Differences also were apparent across races/ethnicities in the lower level of parental education in 2008. Among Hispanic children, 39 percent had mothers whose highest level of education was less than high school completion. This percentage was higher than the percentages for Whites (5 percent), Blacks (13 percent), Asians (15 percent), Native Hawaiians or Other Pacific Islanders (9 percent), American Indians/Alaska Natives (19 percent), and children of two or more races (6 percent). Similarly, the percentage of Hispanic children with fathers whose highest level of education was less than high school completion (41 percent) was higher than the respective percentages for Whites (6 percent), Blacks (11 percent), Asians (11 percent), Native Hawaiians or Other Pacific Islanders (2 percent), American Indians/Alaska Natives (14 percent), and children of two or more races (5 percent).
5. Parental Education
6 Although there appear to be differences between the percentages of Native Hawaiian or Other Pacific Islander children with a parent who had at least a bachelor’s degree and children of other races/ethnicities, only the differences between the percentage of Asian children and the percentage of Native Hawaiian or Other Pacific Islander children with a parent who had at least a bachelor’s degree were statistically significant.

Status and Trends in the Education of Racial and Ethnic Groups 21
Chap
ter 1 — D
emo
grap
hicsFigure 5. Percentage of children ages 6 to 18 whose mother attained a level of education less than high
school completion, and percentage whose mother attained at least a bachelor’s degree, by child’s race/ethnicity: 2008
! Interpret data with caution. NOTE: Parents include adoptive and stepparents but exclude parents not residing in the same household as their children. Race categories exclude persons of Hispanic ethnicity. SOURCE: U.S. Department of Commerce, Census Bureau, Current Population Survey (CPS), Annual Social and Economic Supplement, 2008.
Two or moreraces
American Indian/Alaska Native
Native Hawaiian/Pacific Islander
Asian
Hispanic
Black
White
Two or moreraces
American Indian/Alaska Native
Native Hawaiian/Pacific Islander
Asian
Hispanic
Black
White
Race/ethnicity Mother with less than high school completion
Mother with at least a bachelor’s degree
1009080706050
Percent
403020
31
16
25!
51
11
17
36
6
19
9!
15
39
13
5
100

Status and Trends in the Education of Racial and Ethnic Groups22
ind
icat
or
5 —
Par
enta
l Ed
ucat
ion
table 5. Percentage of children ages 6 to 18, by parent’s highest level of educational attainment and child’s race/ethnicity: 2008
Parent and race/ethnicity
Less than high
school completion
High school completion1
Some college
Asso- ciate’s
degree
Bachelor’s or higher degree
TotalBachelor’s
degreeMaster’s
degree
Doctor’s or first- profes-
sional degree
Mothertotal2 13.2 27.8 19.1 11.5 28.5 20.2 6.5 1.7
White 4.6 26.4 20.2 13.1 35.7 25.0 8.5 2.3Black 12.9 35.5 23.6 11.2 16.8 12.5 3.5 0.7Hispanic 39.3 29.0 13.6 7.3 10.7 8.4 1.8 0.5Asian 14.6 20.5 6.7 7.7 50.6 35.1 12.4 3.1Native Hawaiian/
Pacific Islander 8.8! 32.1 22.0! 12.6! 24.6! 17.4! 1.4! 5.8!American Indian/
Alaska Native 19.4 27.2 23.1 14.2 16.1 12.2 ‡ ‡Two or more races 5.6 21.5 30.5 11.8 30.7 21.4 6.9 2.3!
Fathertotal2 13.1 28.6 16.5 9.1 32.7 20.3 7.9 4.6
White 5.8 28.6 17.4 9.8 38.5 23.6 9.2 5.6Black 11.2 35.0 21.1 11.6 21.0 14.2 5.0 1.8Hispanic 41.1 28.6 11.9 5.6 12.8 8.9 2.9 1.1Asian 10.5 17.6 7.5 7.8 56.6 30.7 15.3 10.7Native Hawaiian/
Pacific Islander 2.4! 30.9! 18.0! 24.1! 24.6! 15.5! 4.6! 4.4!American Indian/
Alaska Native 14.0! 29.9 26.5 10.8! 18.7 12.7! 0.7! 5.3!Two or more races 5.2 26.8 25.3 11.3 31.3 20.1 7.7 3.5!
! Interpret data with caution.‡ Reporting standards not met.1 Includes high school diploma or equivalent.2 Total includes other race/ethnicity categories not separately shown.NOTE: Parents include adoptive and stepparents but exclude parents not residing in the same household as their children. Race categories exclude persons of Hispanic ethnicity. Detail may not sum to totals because of rounding.SOURCE: U.S. Department of Commerce, Census Bureau, Current Population Survey (CPS), Annual Social and Economic Supplement, 2008.

PrePrimary, elementary, and Secondary education ParticiPation
This chapter examines characteristics of students in preprimary, elementary, and secondary education. Indicator 6 focuses on care arrangements for 4-year-olds from the birth cohort born in the United States in 2001. In 2005–06, rates of participation in center-based care were higher for White, Black, Asian, and American Indian/Alaska Native 4-year-olds than for Hispanic and Native Hawaiian or Other Pacific Islander 4-year-olds.
Indicator 7 looks at components of elementary and secondary enrollment. The racial/ethnic distribution of public school students among the total enrolled in school has changed over time. Between 2000–01 and 2007–08, the percentage of White students in school decreased from 61 to 56 percent (indicator 7.1). During this same time period, the percentage of students who were Black and American Indian/Alaska Native remained unchanged, while the percentage of students who were Hispanic increased from 17 to 21 percent. In addition, the percentage of Asian/Pacific Islander students increased from 4 to 5 percent. In the 2007–08 school year, Vermont and Maine had the highest percentages of students who were White (95 and 94 percent, respectively), and the District of Columbia had the highest percentage of enrolled students who were Black (83 percent). New Mexico had the highest percentage of Hispanic students (56 percent), Hawaii had the highest percentage of Asian/Pacific Islander students (73 percent), and Alaska had the highest percentage of American Indian/Alaska Native students (25 percent). White students were concentrated in suburban and rural areas, with lower percentages residing in cities and towns. In contrast, Black, Hispanic, and Asian/Pacific Islander students were concentrated in cities and suburban areas. American Indian/Alaska Native students were clustered in rural areas (indicator 7.2).
A higher percentage of Black, Hispanic, and American Indian/Alaska Native students in public schools were eligible for the free and reduced-price
lunch program (frequently used as a proxy measure of poverty) compared with their White and Asian/Pacific Islander peers. A higher percentage of Black and Hispanic students attended high-poverty schools (as determined by the percentage of students in school eligible for the free and reduced-lunch program) than did students of other racial/ethnic groups, while a lower percentage of Asian/Pacific Islander and White students attended high-poverty schools (indicator 7.5).
Indicator 8 explores the demographics of children who may require special services in order to address their disabilities or their difficulties speaking English. In 2007, greater percentages of American Indian/Alaska Native 6- to 21-year-olds were served under the Individuals with Disabilities Education Act than was the case for White, Black, Hispanic, and Asian/Pacific Islander 6- to 21-year-olds (indicator 8.1). Also, in 2007, greater percentages of Hispanic and Asian elementary and secondary students spoke a language other than English at home, compared with students of other racial/ethnic groups (indicator 8.2). In addition, higher percentages of Hispanic and Asian students spoke English with difficulty than students of other races/ethnicities.
The first section of indicator 9 examines the percentage of high school teachers who either have a major or certification in the subject that they consider their main teaching assignment. Twelve percent of teachers whose main assignment was secondary mathematics had neither a major nor a certification in that subject (indicator 9.1). The second section in this indicator focuses on “new” teachers, meaning those with less than 3 years of experience, by the racial/ethnic concentration of schools. Schools that were at least half White employed a smaller percentage of new teachers (10 percent) than did schools that were at least half Black (13 percent) or at least half Hispanic (15 percent) (indicator 9.2).
2

Status and Trends in the Education of Racial and Ethnic Groups24
Ind
icat
or
6 —
Car
e A
rran
gem
ents The Early Childhood Longitudinal Study, conducted
by the National Center for Education Statistics, contains a birth cohort of a representative sample of children born in the United States in 2001. This indicator examines the distribution of 4-year-olds from this cohort by their primary type of care arrangement, as reported by their parents. The types of arrangements include staying home with a parent (no regular nonparental arrangement), home-based care with either a relative or a non-relative, center-based care, or multiple arrangements.
Overall, in 2005, the primary care arrangement for 20 percent of 4-year-olds was staying at home without any regular nonparental care. A higher percentage of Hispanic 4-year-olds (27 percent) than 4-year-olds of other races/ethnicities were in this arrangement; the percentage for Hispanics was 9 percentage points higher than Whites, 11 percentage points higher than Blacks, 10 percentage points higher than Asians, 7
percentage points higher than American Indians/Alaska Natives, and 9 percentage points higher than children of two or more races. Although the overall rate of participation in center-based care was 57 percent, 20 percent of Native Hawaiian or Other Pacific Islander 4-year-olds and 49 percent of Hispanic 4-year-olds participated in center-based care. These percentages were lower than the percentages for White, Black, Asian, and American Indian/Alaska Native 4-year-olds (ranging between 60 and 62 percent). Thirty-one percent of American Indian/Alaska Native 4-year-olds and 25 percent of Black 4-year-olds were enrolled in Head Start, the federal program for disadvantaged children, compared with 7 percent of Whites, 19 percent of Hispanics, 5 percent of Asians, and 5 percent of Native Hawaiians or Other Pacific Islanders. White (53 percent) and Asian (55 percent) 4-year-olds had the highest percentages of enrollment in center-based programs other than Head Start.
6. Care Arrangements
Table 6. Percentage distribution of primary type of care arrangements of children from the 2001 birth cohort at about 4 years old, by race/ethnicity: 2005–06
Race/ethnicity
Primary type of care arrangement
No regular nonparental
arrangement
Home-based care Center-based care1Multiple arrange-
ments2Relative
care3Non-relative
care4 TotalHead Start
Other than Head Start
Total 20.0 13.1 7.6 57.5 12.7 44.8 1.9White 17.9 11.0 9.2 60.1 6.8 53.3 1.9Black 16.0 13.9 4.3 62.4 25.4 37.1 3.3Hispanic 27.2 15.9 6.2 49.4 18.6 30.9 1.2Asian 17.5 16.0 3.4 60.7 5.5 55.3 2.3!Native Hawaiian/
Pacific Islander 22.3! 45.0! ‡ 19.9! 5.0! 14.9! ‡
American Indian/ Alaska Native 20.0 14.0 5.3 59.6 31.1 28.5 1.1!
Two or more races
17.8 17.5 8.9 53.9 12.2 41.7 1.8!
! Interpret data with caution.‡ Reporting standards not met.1 Care provided in places such as early learning centers, nursery schools, and preschools, including Head Start.2 Children who spent an equal amount of time in each of two or more arrangements.3 Care provided in the child’s home or in another private home by a relative (excluding parents).4 Care provided in the child’s home or in another private home by a person unrelated to the child.NOTE: Primary type of care arrangement is the type of nonparental care in which the child spent the most hours. Data are based on a representative sample of children born in 2001. Detail may not sum to totals because of rounding and suppression of cells that do not meet standards. Race categories exclude persons of Hispanic ethnicity.SOURCE: U.S. Department of Education, National Center for Education Statistics, Early Childhood Longitudinal Study, Birth Cohort, Longitudinal 9-month—Preschool Restricted-Use Data File.

Status and Trends in the Education of Racial and Ethnic Groups 25
Chap
ter 2 — P
reprim
ary, Elem
entary, and s
econd
ary Ed
ucation P
articipatio
nfigure 6. Percentage distribution of primary type of care arrangements of children from the 2001 birth
cohort at about 4 years old, by race/ethnicity: 2005–06
! Interpret data with caution.1 Care provided in places such as early learning centers, nursery schools, and preschools, excluding Head Start. 2 Children who spent an equal amount of time in each of two or more arrangements. NOTE: Primary type of care arrangement is the type of nonparental care in which the child spent the most hours. Data are based on a representative sample of children born in 2001. Detail may not sum to totals because of rounding. Reporting standards for Native Hawaiian and Other Pacific Islanders were not met in some categories; therefore, estimates are not shown. Race categories exclude persons of Hispanic ethnicity. SOURCE: U.S. Department of Education, National Center for Education Statistics, Early Childhood Longitudinal Study, Birth Cohort, Longitudinal 9-month—Preschool Restricted-Use Data File.
10090807040302010 60500
Percent
■ No regular nonparental ■ Home-based care, ■ Head Start ■ Center-based care, ■ Multiple arrangement nonparental other than arrangements2
Head Start1
Two ormore races
American Indian/Alaska Native
Asian
Hispanic
Black
White
Race/ethnicity
18
18
18
27
16
20
20
26
19
22
18
19
7
12
5
19
25
31
53
42
55
31
37
29
2
2!
2!
1
3
1!

Status and Trends in the Education of Racial and Ethnic Groups26
ind
icat
or
7 —
Ele
men
tary
and
sec
ond
ary
Enr
ollm
ent
Examining patterns in elementary and secondary enrollment and the characteristics of schools and students helps to illustrate the educational experiences of students. Indicator 7.1 looks at the racial/ethnic composition of public school enrollment in the 50 states and the District of Columbia. Indicator 7.2 examines school enrollment in the four major types of locales (city, suburban, town, and rural) by race/ethnicity. Indicator 7.3 profiles the students enrolled in the 20 largest school districts in the United States. Indicator 7.4 focuses on the distribution of students of different races/ethnicities across schools with varying enrollments of White, Black, Hispanic, Asian/Pacific Islander, and American Indian/Alaska Native students. Finally, indicator 7.5 examines enrollment in terms of race/ethnicity and eligibility for the federal free and reduced-price lunch program.
7.1. Enrollment by Region and State
The racial/ethnic distribution of public elementary and secondary students has changed over time. Between 2000–01 and 2007–08, the percentage of
students enrolled in public school who were White decreased from 61 to 56 percent. During this same time period, the percentage of Black (17 percent) and American Indian/Alaska Native students (1 percent) remained unchanged. However, the percentage of Hispanic students increased from 17 to 21 percent, and the percentage of Asian/Pacific Islander students increased from 4 to 5 percent.
Regional differences in the racial/ethnic distribution of students were observed over time. For instance, the percentage of White students in the West decreased from 50 percent in 2000–01 to 44 percent in 2007–08. The percentage of Hispanic students increased in all regions of the United States. For example, the percentage of Hispanic students in the West increased from 32 to 38 percent between 2000–01 and 2007–08, and the percentage of Hispanics in the South increased from 15 to 20 percent. In the Northeast, enrollment of Asian/Pacific Islander students increased from 4 to 6 percent during that time period.
7. Elementary and secondary Enrollment
table 7.1a. number and percentage distribution of public elementary and secondary students, by region and race/ethnicity: selected years, 2000–01 through 2007–08
Year and region Total
enrollment Total White Black Hispanic
Asian/ Pacific
Islander
American Indian/ Alaska Native
2000–01total 46,120,425 100.0 61.0 17.0 16.6 4.2 1.2
Northeast 8,227,746 100.0 67.4 15.5 12.4 4.4 0.3Midwest 10,749,486 100.0 76.6 14.7 5.7 2.2 0.9South 16,040,151 100.0 54.9 26.7 15.3 2.1 1.0West 11,103,042 100.0 50.1 6.5 32.1 8.9 2.4
2003–04total 47,277,389 100.0 58.4 17.1 18.8 4.5 1.2
Northeast 8,303,699 100.0 65.7 15.6 13.6 4.8 0.3Midwest 10,752,028 100.0 74.5 15.2 7.0 2.4 0.9South 16,684,008 100.0 52.4 26.5 17.7 2.4 1.1West 11,537,654 100.0 46.9 6.5 35.2 9.1 2.4
2007–08total 48,397,895 100.0 55.8 17.0 21.2 4.8 1.2
Northeast 8,059,559 100.0 63.4 15.4 15.4 5.6 0.3Midwest 10,555,854 100.0 72.6 15.2 8.5 2.8 0.9South 18,149,304 100.0 50.4 25.8 20.0 2.8 1.1West 11,633,178 100.0 43.7 6.2 38.4 9.4 2.2
NOTE: Enrollment counts exclude schools with no reported enrollment or missing race/ethnicity information. Total enrollment including students with missing race/ethnicity information was 47,060,714 in 2000–01; 48,353,523 in 2003–04; and 48,910,025 in 2007–08. Race categories exclude persons of Hispanic ethnicity. Northeast includes CT, ME, MA, NH, NJ, NY, PA, RI, and VT; Midwest includes IL, IN, IA, KS, MI, MN, MO, NE, ND, OH, SD, and WI; South includes AL, AR, DE, DC, FL, GA, KY, LA, MD, MS, NC, OK, SC, TN, TX, VA, and WV; West includes AK, AZ, CA, CO, HI, ID, MT, NV, NM, OR, UT, WA, and WY. Detail may not sum to totals because of rounding. SOURCE: U.S. Department of Education, National Center for Education Statistics, Common Core of Data (CCD), “Public Elementary/Secondary School Universe Survey,” 2000–01, 2003–04, and 2007–08.

Status and Trends in the Education of Racial and Ethnic Groups 27
Chap
ter 2 — P
reprim
ary, Elem
entary, and S
econd
ary Ed
ucation P
articipatio
nFigure 7.1. Percentage distribution of public elementary and secondary students, by region and race/
ethnicity: 2007–08
# Rounds to zero. NOTE: Enrollment counts exclude schools with no reported enrollment or missing race/ethnicity information. Race categories exclude persons of Hispanic ethnicity. Northeast includes CT, ME, MA, NH, NJ, NY, PA, RI, and VT; Midwest includes IL, IN, IA, KS, MI, MN, MO, NE, ND, OH, SD, and WI; South includes AL, AR, DE, DC, FL, GA, KY, LA, MD, MS, NC, OK, SC, TN, TX, VA, and WV; West includes AK, AZ, CA, CO, HI, ID, MT, NV, NM, OR, UT, WA, and WY. Detail may not sum to totals because of rounding. SOURCE: U.S. Department of Education, National Center for Education Statistics, Common Core of Data (CCD), “Public Elementary/Secondary School Universe Survey,” 2007–08.
1009080706050Percent
403020100
■ White ■ Black ■ Hispanic ■ Asian/Pacific ■ American Indian/ Islander Alaska Native
West
South
Midwest
Northeast
Total,United States
Region
1
44 6 38 9 2
50 26 20 3 1
73 15 9 3 1
63 15 15 6 #
56 17 21 5

Status and Trends in the Education of Racial and Ethnic Groups28
ind
icat
or
7 —
Ele
men
tary
and
sec
ond
ary
Enr
ollm
ent
table 7.1b. number and percentage distribution of public elementary and secondary students, by region, state, and race/ethnicity: 2007–08
Region and stateTotal
enrollment Total White Black Hispanic
Asian/ Pacific
Islander
American Indian/ Alaska Native
total 48,397,895 100.0 55.8 17.0 21.2 4.8 1.2Northeast 8,059,559 100.0 63.4 15.4 15.4 5.6 0.3
Connecticut 568,405 100.0 65.3 13.8 16.6 3.9 0.4Maine 190,737 100.0 94.1 2.6 1.1 1.5 0.7Massachusetts 943,788 100.0 72.2 8.3 14.1 5.0 0.3New Hampshire 200,772 100.0 92.5 1.9 3.1 2.2 0.3New Jersey 1,379,626 100.0 55.0 17.3 19.4 8.2 0.2New York 2,760,141 100.0 51.6 19.5 21.0 7.4 0.5Pennsylvania 1,779,302 100.0 74.1 15.8 7.2 2.8 0.2Rhode Island 146,228 100.0 69.0 8.9 18.3 3.1 0.7Vermont 90,560 100.0 95.2 1.6 1.1 1.7 0.3
Midwest 10,555,854 100.0 72.6 15.2 8.5 2.8 0.9Illinois 2,054,675 100.0 55.4 19.9 20.4 4.0 0.3Indiana 1,006,651 100.0 78.9 12.7 6.8 1.4 0.3Iowa 482,204 100.0 85.1 5.6 6.5 2.1 0.6Kansas 463,890 100.0 73.2 8.9 13.5 2.6 1.7Michigan 1,652,120 100.0 71.7 20.2 4.7 2.5 0.9Minnesota 837,578 100.0 76.4 9.4 6.1 6.0 2.1Missouri 917,188 100.0 76.1 17.9 3.7 1.8 0.4Nebraska 291,244 100.0 75.4 8.0 12.9 2.0 1.7North Dakota 95,052 100.0 86.0 2.0 2.1 1.0 8.8Ohio 1,760,503 100.0 78.6 17.0 2.7 1.5 0.1South Dakota 120,271 100.0 83.4 2.0 2.4 1.2 11.1Wisconsin 874,478 100.0 76.8 10.5 7.6 3.6 1.5
See notes at end of table.
As with the resident population discussed in indicator 1, the distribution of Black, Hispanic, Asian/Pacific Islander, and American Indian/Alaska Native students enrolled in public schools varied by state. In the 2007–08 school year, Vermont and Maine enrolled the highest percentages of White students (95 and 94 percent, respectively), and the District of Columbia enrolled the lowest (5 percent). The District of Columbia had the highest percentage of enrolled students who were Black: 83 percent of the 78,000 public school students were Black, while Blacks made up 53 percent of the District’s resident population in 2008 (indicator 1).7 New Mexico had the highest percentage of Hispanic enrollment (56 percent of 328,000 public school students). This percentage was
11 points higher than the percentage of the state’s resident population that was Hispanic in 2008 (45 percent). Hawaii had the highest percentage of Asian/Pacific Islander enrollment: 73 percent of 180,000 public school students were Asians/Pacific Islanders. In comparison, Hawaii’s resident population was 38 percent Asian and 9 percent Native Hawaiian or Other Pacific Islander in 2008 (in addition, 16 percent of Hawaiians identified themselves as “two or more races”). Some 25 percent of 123,000 public school students in Alaska were American Indian/Alaska Native in 2007–08, a larger percentage than in any other state. This percentage was 11 points higher than the percentage of the Alaska resident population that was American Indian/Alaska Native in 2008.
7 See table 1b on page 9 for the resident population estimates presented in this paragraph.

Status and Trends in the Education of Racial and Ethnic Groups 29
Chap
ter 2 — P
reprim
ary, Elem
entary, and s
econd
ary Ed
ucation P
articipatio
ntable 7.1b. number and percentage distribution of public elementary and secondary students, by region,
state, and race/ethnicity: 2007–08—Continued
Region and stateTotal
enrollment Total White Black Hispanic
Asian/ Pacific
Islander
American Indian/ Alaska Native
total 48,397,895 100.0 55.8 17.0 21.2 4.8 1.2South 18,149,304 100.0 50.4 25.8 20.0 2.8 1.1
Alabama 743,778 100.0 58.8 35.7 3.5 1.1 0.8Arkansas 479,016 100.0 67.0 22.6 8.1 1.5 0.7Delaware 122,574 100.0 53.0 33.0 10.4 3.2 0.4District of
Columbia 78,108 100.0 5.4 83.1 9.9 1.5 0.1Florida 2,570,955 100.0 47.6 23.9 25.7 2.5 0.3Georgia 1,600,235 100.0 47.5 39.2 10.0 3.1 0.2Kentucky 654,134 100.0 85.2 10.9 2.7 1.1 0.1Louisiana 680,911 100.0 49.2 46.0 2.7 1.4 0.8Maryland 845,700 100.0 47.0 37.9 9.0 5.6 0.4Mississippi 494,122 100.0 46.4 50.6 1.9 0.9 0.2North Carolina 1,408,604 100.0 56.7 29.0 10.4 2.4 1.5Oklahoma 642,065 100.0 58.1 10.8 10.0 1.9 19.2South Carolina 709,204 100.0 53.7 39.3 5.1 1.5 0.4Tennessee 963,839 100.0 68.6 24.8 4.9 1.5 0.2Texas 4,673,455 100.0 34.8 14.3 47.2 3.4 0.3Virginia 1,200,092 100.0 58.6 26.6 8.8 5.6 0.3West Virginia 282,512 100.0 93.0 5.2 0.9 0.7 0.1
West 11,633,178 100.0 43.7 6.2 38.4 9.4 2.2Alaska 123,277 100.0 57.1 4.0 6.1 7.5 25.3Arizona 1,087,263 100.0 44.5 5.6 41.6 2.8 5.4California 6,070,428 100.0 29.4 7.6 50.3 11.9 0.8Colorado 801,867 100.0 61.5 6.0 27.9 3.4 1.2Hawaii 179,897 100.0 19.4 2.3 4.6 73.0 0.6Idaho 271,915 100.0 81.6 1.2 14.0 1.7 1.6Montana 142,823 100.0 84.0 1.0 2.5 1.2 11.4Nevada 429,362 100.0 43.1 11.0 36.4 7.9 1.5New Mexico 327,670 100.0 29.5 2.6 55.6 1.4 10.9Oregon 535,118 100.0 72.3 3.0 17.6 4.9 2.2Utah 573,515 100.0 78.9 1.5 14.7 3.3 1.6Washington 1,003,679 100.0 68.0 5.7 15.1 8.6 2.6Wyoming 86,364 100.0 83.9 1.6 10.0 1.1 3.5
NOTE: Enrollment counts exclude schools with no reported enrollment or missing race/ethnicity information. Total enrollment including students with missing race/ethnicity information was 48,910,025. Race categories exclude persons of Hispanic ethnicity. Detail may not sum to totals because of rounding. SOURCE: U.S. Department of Education, National Center for Education Statistics, Common Core of Data (CCD), “Public Elementary/Secondary School Universe Survey,” 2007–08.

Status and Trends in the Education of Racial and Ethnic Groups30
ind
icat
or
7 —
Ele
men
tary
and
sec
ond
ary
Enr
ollm
ent
7.2. Enrollment by Locale
The racial/ethnic distribution of public school students by locale illustrates how Black, Hispanic, Asian/Pacific Islander, and American Indian/Alaska Native students are distributed across city, suburban, town, and rural areas.8 In the 2007–08 school year, 56 percent of all public elementary and secondary students in the nation were White, 17 percent were Black, 21 percent were Hispanic, 5 percent were Asian/Pacific Islander, and 1 percent were American Indian/Alaska Native.
A greater percentage of public elementary and secondary students attended schools in suburban areas (35 percent) than in cities (29 percent), rural
areas (23 percent), and towns (13 percent). White students were concentrated in suburban (36 percent) and rural areas (31 percent), with lower percentages in cities (17 percent) and towns (16 percent). In contrast, Black, Hispanic, and Asian/Pacific Islander students were concentrated in cities and suburban areas. About 47 percent of all Black students, 45 percent of Hispanic students, and 42 percent of Asian/Pacific Islander students were in cities, while 14 percent of Black, 11 percent of Hispanic, and 10 percent of Asian/Pacific Islander students were in rural areas. A greater percentage of American Indian/Alaska Native students (41 percent) were in rural areas than in cities (20 percent), suburban areas (16 percent), and towns (22 percent).
8 The NCES Common Core of Data (CCD), collected annually, is one source of data on the racial/ethnic composition of schools, both overall and for specific locales. See Appendix A: Guide to Sources for definitions of locales.
table 7.2. number and percentage distribution of public elementary and secondary students, by race/ethnicity and locale: 2007–08
Locale Total White Black Hispanic
Asian/ Pacific
Islander
American Indian/
Alaska Native
Numbertotal 48,397,895 26,991,389 8,238,245 10,237,009 2,345,968 585,284
City 14,232,071 4,659,317 3,881,265 4,589,508 982,962 119,019Suburban 16,913,887 9,751,799 2,513,524 3,536,220 1,017,506 94,838Town 6,097,471 4,218,463 691,804 940,324 115,775 131,105Rural 11,154,466 8,361,810 1,151,652 1,170,957 229,725 240,322
Percentage distribution of race/ethnicity for each localetotal 100.0 55.8 17.0 21.2 4.8 1.2
City 100.0 32.7 27.3 32.2 6.9 0.8Suburban 100.0 57.7 14.9 20.9 6.0 0.6Town 100.0 69.2 11.3 15.4 1.9 2.2Rural 100.0 75.0 10.3 10.5 2.1 2.2
Percentage distribution of locale for each race/ethnicitytotal 100.0 100.0 100.0 100.0 100.0 100.0
City 29.4 17.3 47.1 44.8 41.9 20.3Suburban 34.9 36.1 30.5 34.5 43.4 16.2Town 12.6 15.6 8.4 9.2 4.9 22.4Rural 23.0 31.0 14.0 11.4 9.8 41.1
NOTE: Enrollment counts exclude schools with no reported enrollment or missing race/ethnicity information. Total enrollment including students with missing race/ethnicity information is 48,910,025. Race/ethnicity categories exclude persons of Hispanic ethnicity. For definitions of locales, see Appendix A: Guide to Sources. Detail may not sum to totals because of rounding.SOURCE: U.S. Department of Education, National Center for Education Statistics, Common Core of Data (CCD), “Public Elementary/Secondary School Universe Survey,” 2007–08.

Status and Trends in the Education of Racial and Ethnic Groups 31
Chap
ter 2 — P
reprim
ary, Elem
entary, and S
econd
ary Ed
ucation P
articipatio
nFigure 7.2. Percentage distribution of public elementary and secondary students, by race/ethnicity and
locale: 2007–08
NOTE: Enrollment counts exclude schools with no reported enrollment or missing race/ethnicity information. Race categories exclude persons of Hispanic ethnicity. For definitions of locales, see Appendix A: Guide to Sources. Detail may not sum to totals because of rounding. SOURCE: U.S. Department of Education, National Center for Education Statistics, Common Core of Data (CCD), “Public Elementary/Secondary School Universe Survey,” 2007–08.
20 16 22 41
42 43 5 10
45 35 9 11
47 31 8 14
17 36 16 31
29 35 13 23
American Indian/Alaska Native
Asian/Pacific Islander
Hispanic
Black
White
Total
Race/ethnicity
1009080706050
Percent
403020100
■ City ■ Suburban ■ Town ■ Rural

Status and Trends in the Education of Racial and Ethnic Groups32
ind
icat
or
7 —
Ele
men
tary
and
sec
ond
ary
Enr
ollm
ent
7.3. Enrollment in the 20 Largest School Districts
The largest school districts differ from school districts in general in their average school size, median pupil/teacher ratio, and levels of Black, Hispanic, Asian/Pacific Islander, and American Indian/Alaska Native student enrollment (Tang and Sable 2009). During the 2007–08 school year, approximately 49 million9
students were enrolled in U.S. public schools within 13,900 regular public school districts.10 The 20 largest school districts enrolled over 5 million students, or 11 percent of the total student enrollment.
The number of students enrolled in the 20 largest school districts varied substantially, ranging from 990,000 students in New York City Public Schools to 130,000 students in Maryland’s Prince George’s County Public Schools. Five of the 20 largest school districts were located in Florida, two districts each were located in California, Texas, Maryland, and North Carolina, and the rest were located in seven different states across the country. Many, but not all, were located in large cities or their suburbs.
The racial/ethnic distribution of students in the 20 largest school districts varied. In 18 out of the 20 school districts, less than 50 percent of all students were White. Dallas Independent School District (TX) and Prince George’s County Public Schools (MD) had the lowest percentages of White students (5 percent each), while Wake County Public Schools (NC) had the highest percentage of White students (55 percent). Of the 20 largest public school districts, Prince George’s County Public Schools (MD) had the highest percentage of students who were Black (74 percent of 130,000 students). Los Angeles Unified (CA) had the highest percentage of students who were Hispanic (74 percent of 694,000 students). The Hawaii Department of Education, the school district that encompasses the entire state’s education system, had the highest percentage of students who were Asian/Pacific Islander (73 percent of 180,000 students), followed by the Fairfax County Public Schools District (VA) (20 percent of 166,000 students). In each of the 20 largest districts, the percentage of students who were American Indian/Alaska Native was less than the national percentage of students who were American Indian/Alaska Native.
9 Total enrollment is higher than the total on table 7.3 due to missing race/ethnicity information. 10 “Regular public school districts” are local agencies that are responsible for providing education services to school-age children within their jurisdiction. For more information, see http://nces.ed.gov/ccd/pdf/pau08pgen.pdf.

Status and Trends in the Education of Racial and Ethnic Groups 33
Chap
ter 2 — P
reprim
ary, Elem
entary, and s
econd
ary Ed
ucation P
articipatio
ntable 7.3. number and percentage distribution of public school enrollment in the united states and 20
largest public school districts, by race/ethnicity: 2007–08
School district StateTotal
enrollment Total White Black Hispanic
Asian/ Pacific
Islander
American Indian/ Alaska Native
total, united states † 48,397,895 100.0 55.8 17.0 21.2 4.8 1.2
total, 20 largest public school districts † 5,241,310 100.0 21.3 28.3 40.2 9.8 0.3
New York City Public Schools NY 989,941 100.0 14.2 31.7 39.7 14.0 0.4
Los Angeles Unified CA 693,680 100.0 8.8 10.9 73.7 6.4 0.3City of Chicago IL 407,510 100.0 8.2 47.9 40.2 3.4 0.2Dade County School
District FL 348,128 100.0 9.3 26.6 62.8 1.2 0.1Clark County School
District NV 309,051 100.0 36.1 14.2 39.7 9.2 0.8Broward County School
District FL 258,893 100.0 31.2 38.6 26.6 3.4 0.2Houston Independent
School District TX 199,534 100.0 8.0 28.4 60.3 3.2 0.1Hillsborough County
School District FL 193,180 100.0 44.3 23.3 29.1 3.1 0.3Hawaii Department of
Education HI 179,897 100.0 19.4 2.3 4.6 73.0 0.6Orange County School
District FL 174,142 100.0 35.0 28.1 32.0 4.4 0.4Philadelphia City School
District PA 172,704 100.0 13.4 63.4 16.9 6.1 0.2Palm Beach County
School District FL 170,883 100.0 41.8 30.1 24.8 2.8 0.5Fairfax County Public
Schools VA 165,722 100.0 51.0 11.3 17.9 19.5 0.3Dallas Independent School
District TX 157,804 100.0 4.8 28.7 65.3 1.0 0.2Qwinnett County GA 155,618 100.0 38.0 28.3 22.7 10.8 0.1Montgomery County Pub-
lic Schools MD 137,717 100.0 40.1 22.9 21.5 15.2 0.3Wake County Public
Schools NC 134,401 100.0 54.7 27.7 11.6 5.8 0.3San Diego Unified School
District CA 131,577 100.0 25.3 13.5 44.4 16.3 0.5Charlotte-Mecklenburg
Schools NC 131,176 100.0 35.8 43.7 15.4 4.6 0.5Prince George’s County
Public Schools MD 129,752 100.0 5.1 74.2 17.4 2.9 0.4
† Not applicable.NOTE: Total enrollment, including students with missing race/ethnicity information, is 48,910,025. Race categories exclude persons of Hispanic ethnicity. Detail may not sum to totals because of rounding.SOURCE: U.S. Department of Education, National Center for Education Statistics, Common Core of Data (CCD), “Public Elementary/Secondary School Universe Survey,” 2007–08.
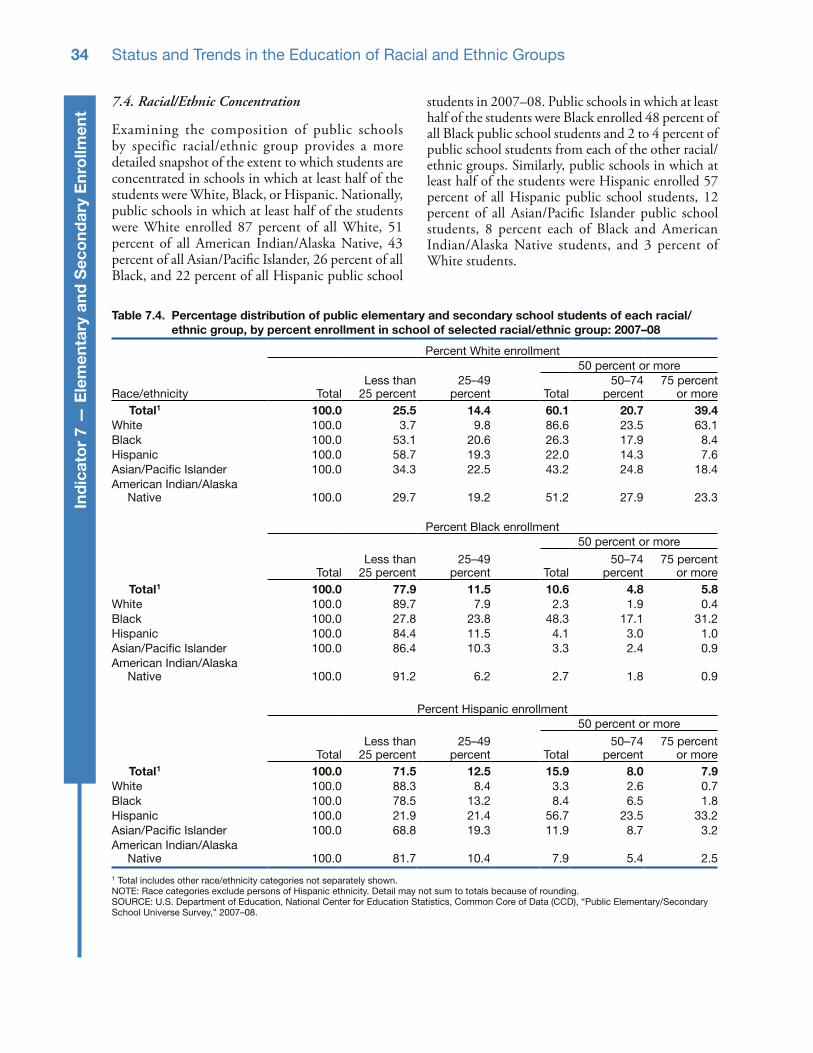
Status and Trends in the Education of Racial and Ethnic Groups34
ind
icat
or
7 —
Ele
men
tary
and
sec
ond
ary
Enr
ollm
ent
7.4. Racial/Ethnic Concentration
Examining the composition of public schools by specific racial/ethnic group provides a more detailed snapshot of the extent to which students are concentrated in schools in which at least half of the students were White, Black, or Hispanic. Nationally, public schools in which at least half of the students were White enrolled 87 percent of all White, 51 percent of all American Indian/Alaska Native, 43 percent of all Asian/Pacific Islander, 26 percent of all Black, and 22 percent of all Hispanic public school
students in 2007–08. Public schools in which at least half of the students were Black enrolled 48 percent of all Black public school students and 2 to 4 percent of public school students from each of the other racial/ethnic groups. Similarly, public schools in which at least half of the students were Hispanic enrolled 57 percent of all Hispanic public school students, 12 percent of all Asian/Pacific Islander public school students, 8 percent each of Black and American Indian/Alaska Native students, and 3 percent of White students.
table 7.4. Percentage distribution of public elementary and secondary school students of each racial/ethnic group, by percent enrollment in school of selected racial/ethnic group: 2007–08
Percent White enrollment50 percent or more
Race/ethnicity TotalLess than
25 percent25–49
percent Total50–74
percent75 percent
or moretotal1 100.0 25.5 14.4 60.1 20.7 39.4
White 100.0 3.7 9.8 86.6 23.5 63.1Black 100.0 53.1 20.6 26.3 17.9 8.4Hispanic 100.0 58.7 19.3 22.0 14.3 7.6Asian/Pacific Islander 100.0 34.3 22.5 43.2 24.8 18.4American Indian/Alaska
Native 100.0 29.7 19.2 51.2 27.9 23.3
Percent Black enrollment50 percent or more
TotalLess than
25 percent25–49
percent Total50–74
percent75 percent
or moretotal1 100.0 77.9 11.5 10.6 4.8 5.8
White 100.0 89.7 7.9 2.3 1.9 0.4Black 100.0 27.8 23.8 48.3 17.1 31.2Hispanic 100.0 84.4 11.5 4.1 3.0 1.0Asian/Pacific Islander 100.0 86.4 10.3 3.3 2.4 0.9American Indian/Alaska
Native 100.0 91.2 6.2 2.7 1.8 0.9
Percent Hispanic enrollment50 percent or more
TotalLess than
25 percent25–49
percent Total50–74
percent75 percent
or moretotal1 100.0 71.5 12.5 15.9 8.0 7.9
White 100.0 88.3 8.4 3.3 2.6 0.7Black 100.0 78.5 13.2 8.4 6.5 1.8Hispanic 100.0 21.9 21.4 56.7 23.5 33.2Asian/Pacific Islander 100.0 68.8 19.3 11.9 8.7 3.2American Indian/Alaska
Native 100.0 81.7 10.4 7.9 5.4 2.5
1 Total includes other race/ethnicity categories not separately shown.NOTE: Race categories exclude persons of Hispanic ethnicity. Detail may not sum to totals because of rounding. SOURCE: U.S. Department of Education, National Center for Education Statistics, Common Core of Data (CCD), “Public Elementary/Secondary School Universe Survey,” 2007–08.

Status and Trends in the Education of Racial and Ethnic Groups 35
Chap
ter 2 — P
reprim
ary, Elem
entary, and s
econd
ary Ed
ucation P
articipatio
nfigure 7.4. Percentage distribution of public elementary and secondary school students of each racial/
ethnic group, by percent enrollment in school of selected racial/ethnic group: 2007–08
NOTE: Race categories exclude persons of Hispanic ethnicity. Detail may not sum to totals because of rounding. SOURCE: U.S. Department of Education, National Center for Education Statistics, Common Core of Data (CCD), “Public Elementary/Secondary School Universe Survey,” 2007–08.
51
43
22
26
87
30 19
34 23
59 19
53 21
4 10
American Indian/Alaska Native
Asian/Pacific Islander
Hispanic
Black
White
Race/ethnicity Percent White enrollment
1009080706050
Percent
403020100
1009080706050403020100
91 6 3
86 10 3
84 11 4
28 24 48
90 8 2
American Indian/Alaska Native
Asian/Pacific Islander
Hispanic
Black
White
Race/ethnicity Percent Black enrollment
Percent
American Indian/Alaska Native
Asian/Pacific Islander
Hispanic
Black
White
Race/ethnicity Percent Hispanic enrollment
■ Less than 25 percent ■ 25–49 percent ■ 50 percent or more
Percent1009080706050403020100
82 10 8
69 19 12
22 21 57
78 13 8
88 8 3

Status and Trends in the Education of Racial and Ethnic Groups36
ind
icat
or
7 —
Ele
men
tary
and
sec
ond
ary
Enr
ollm
ent
7.5. Free and Reduced-Price Lunch
The National School Lunch Program is a federally assisted meal program that provides nutritionally balanced, low-cost or free lunches to children from low-income families in public and nonprofit private schools and residential child care institutions (U.S. Department of Agriculture 2005).11 Eligibility for the free and reduced-price lunch program is often used as a proxy measure of family income.
Overall, 48 percent of public school 4th-graders were eligible for free or reduced-price lunches in 2009. White 4th-graders had the lowest percentage of eligible students (29 percent). The percentages of Black (74 percent), Hispanic (77 percent), and American Indian/Alaska Native (68 percent) 4th-graders who were eligible were higher than the
percentages of White 4th-graders and Asian/Pacific Islander (34 percent) 4th-graders who were eligible.
A higher percentage of public school 4th-graders in cities (62 percent) were eligible for free or reduced-price lunch than were 4th-graders in suburban areas (39 percent), towns (52 percent), and rural areas (42 percent). Eighty-two percent of Hispanics in cities and 84 percent of Hispanics in towns were eligible; these percentages were higher than those for their Hispanic counterparts in suburban (70 percent) and rural areas (72 percent). For Blacks, the percentage of eligible students was higher in cities and towns (80 and 83 percent, respectively) than in suburban and rural areas (65 and 72 percent, respectively). Higher percentages of Black and Hispanic students in cities were eligible compared with students of other races/ethnicities living in cities.
11 Children from households with incomes at or below 130 percent of the poverty level are eligible for free meals. Those with incomes between 130 percent and 185 percent of the poverty level are eligible for reduced-price meals, for which students can be charged no more than 40 cents. The poverty level for a family of four in 2009 was $22,050. The thresholds for free and reduced-price lunch are $28,665 and $40,793, respectively.
table 7.5a. Percentage of public school 4th-graders eligible for free or reduced-price lunch, by school locale and race/ethnicity: 2009
Race/ethnicity Total City Suburban Town Rural
total1 48 62 39 52 42White 29 31 21 39 34Black 74 80 65 83 72Hispanic 77 82 70 84 72Asian/Pacific Islander 34 45 25 41 23American Indian/Alaska Native 68 67 52 70 721 Total includes other race/ethnicity categories not separately shown.NOTE: To be eligible for the National School Lunch Program, a student must be from a household with an income at or below 185 percent of the poverty level for reduced-price lunch or at or below 130 percent of the poverty level for free lunch. Race categories exclude persons of Hispanic ethnicity. For definitions of locales, see Appendix A: Guide to Sources. SOURCE: U.S. Department of Education, National Center for Education Statistics, National Assessment of Educational Progress (NAEP), 2009 Mathematics Assessment, NAEP Data Explorer.

Status and Trends in the Education of Racial and Ethnic Groups 37
Chap
ter 2 — P
reprim
ary, Elem
entary, and s
econd
ary Ed
ucation P
articipatio
nfigure 7.5a. Percentage of public school 4th-graders eligible for free or reduced-price lunch, by school
locale and race/ethnicity: 2009
NOTE: To be eligible for the National School Lunch Program, a student must be from a household with an income at or below 185 percent of the poverty level for reduced-price lunch or at or below 130 percent of the poverty level for free lunch. Race categories exclude persons of Hispanic ethnicity. For definitions of locales, see Appendix A: Guide to Sources. SOURCE: U.S. Department of Education, National Center for Education Statistics, National Assessment of Educational Progress (NAEP), 2009 Mathematics Assessment, NAEP Data Explorer.
City Suburban
School locale
Town Rural0
10
20
30
40
50
60
70
80
90
100Percent
31
80 82
45
67
21
6570
25
52
39
83 84
41
70
34
72 72
23
72
■ White ■ Black ■ Hispanic ■ Asian/Pacific ■ American Indian/ Islander Alaska Native
Total: 48%

Status and Trends in the Education of Racial and Ethnic Groups38
ind
icat
or
7 —
Ele
men
tary
and
sec
ond
ary
Enr
ollm
ent
The concentration of students in low-poverty and high-poverty public schools also differed by race/ethnicity in 2009. Low-poverty public schools are defined here as schools in which 10 percent or less of students are eligible for free or reduced-price lunch. High-poverty public schools pertain here to schools in which more than 75 percent of students are eligible for free or reduced-price lunch. Higher percentages of Asian/Pacific Islander (27 percent) and White
(19 percent) public school 4th-graders attended low-poverty schools than did Black (3 percent), Hispanic (3 percent), and American Indian/Alaska Native (4 percent) 4th-graders. Black and Hispanic 4th-graders had the highest percentages of attendance at high-poverty public schools (47 and 52 percent, respectively), while White 4th-graders had the lowest percentage of attendance at schools in this category (7 percent).
table 7.5b. Percentage distribution of public school 4th-graders, by percentage of students in school eligible for free or reduced-price lunch and race/ethnicity: 2009
Percentage eligible for free or reduced-price lunch
Race/ethnicity Total
10 percent or less
11–25 percent
26–50 percent
51–75 percent
More than 75 percent
total1 100 13 14 25 23 24White 100 19 20 32 22 7Black 100 3 7 18 25 47Hispanic 100 3 6 15 24 52Asian/Pacific Islander 100 27 16 22 21 13American Indian/Alaska Native 100 4 6 20 33 371 Total includes other race/ethnicity categories not separately shown.NOTE: To be eligible for the National School Lunch Program, a student must be from a household with an income at or below 185 percent of the poverty level for reduced-price lunch or at or below 130 percent of the poverty level for free lunch. Race categories exclude persons of Hispanic ethnicity. Detail may not sum to total because of rounding.SOURCE: U.S. Department of Education, National Center for Education Statistics, National Assessment of Educational Progress (NAEP), 2009 Mathematics Assessment, NAEP Data Explorer.
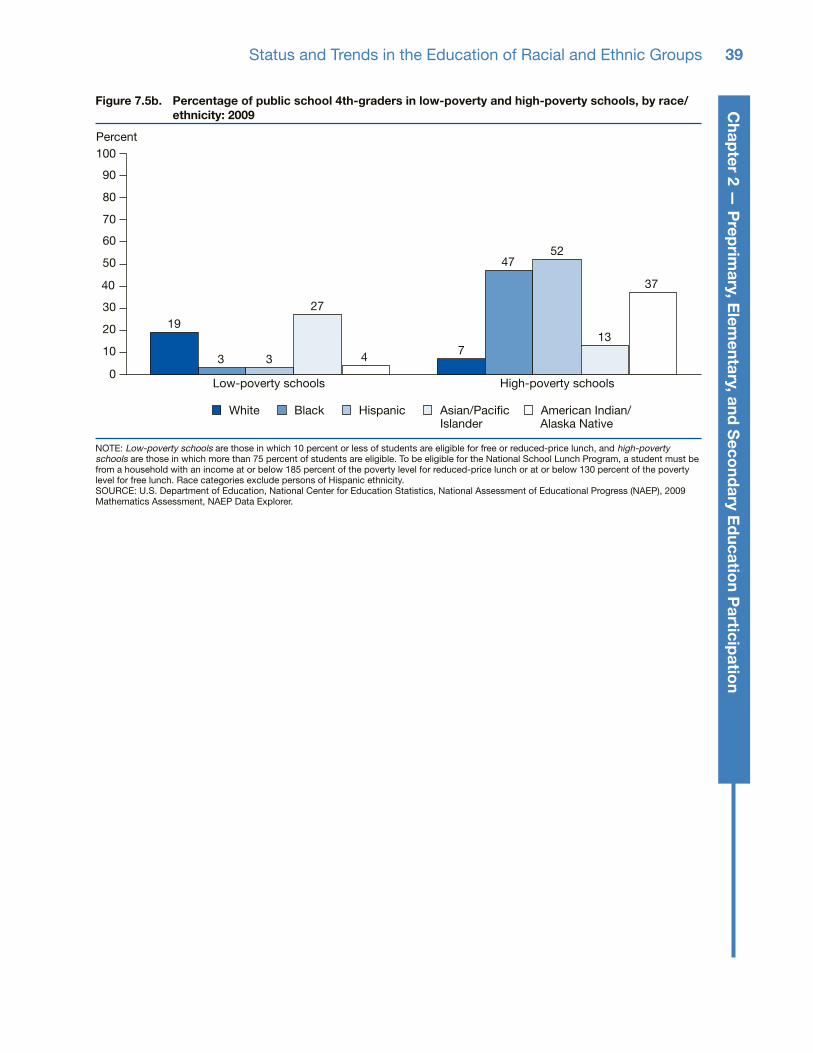
Status and Trends in the Education of Racial and Ethnic Groups 39
Chap
ter 2 — P
reprim
ary, Elem
entary, and S
econd
ary Ed
ucation P
articipatio
nFigure 7.5b. Percentage of public school 4th-graders in low-poverty and high-poverty schools, by race/
ethnicity: 2009
NOTE: Low-poverty schools are those in which 10 percent or less of students are eligible for free or reduced-price lunch, and high-poverty schools are those in which more than 75 percent of students are eligible. To be eligible for the National School Lunch Program, a student must be from a household with an income at or below 185 percent of the poverty level for reduced-price lunch or at or below 130 percent of the poverty level for free lunch. Race categories exclude persons of Hispanic ethnicity. SOURCE: U.S. Department of Education, National Center for Education Statistics, National Assessment of Educational Progress (NAEP), 2009 Mathematics Assessment, NAEP Data Explorer.
Percent
■ White ■ Black ■ Hispanic ■ Asian/Pacific ■ American Indian/ Islander Alaska Native
Low-poverty schools High-poverty schools0
10
20
30
40
50
60
70
80
90
100
19
27
4 7
4752
13
37
3 3

Status and Trends in the Education of Racial and Ethnic Groups40
ind
icat
or
8 —
sp
ecia
l nee
ds
Students with special needs are protected by federal laws that are aimed at improving their educational outcomes. The Individuals with Disabilities Education Act (IDEA) supports state and local education systems’ efforts to protect the rights and meet the needs of children with disabilities. Indicator 8.1 profiles the students served by IDEA. Students with limited English proficiency, or English Language Learners (ELL), are protected by the Civil Rights Act, which requires schools to improve language deficiencies of students so that they may fully participate in the education system. Indicator 8.2 presents data on the number and percentage of elementary and secondary students who spoke another language at home and who spoke English with difficulty in 2007.
8.1. Students With Disabilities
Students with disabilities may require services to provide them access to the same learning opportunities as students without disabilities. The Individuals with Disabilities Education Act, or IDEA,12 supports states and localities in their efforts to aid infants, toddlers, children, and the families of youth with disabilities by protecting their rights, meeting their individual needs, and improving their educational outcomes13 (U.S. Department of Education, Office of Special Education and Rehabilitative Services, n.d.; Individuals with Disabilities Education Act of 2004). This indicator examines trend data for racial/ethnic groups in percentages of the resident population served by IDEA and the 2007 prevalence rates of different disabilities.
The percentage of all preschoolers (children 3 to 5 years old) served under IDEA increased 1 percentage point from 1998 to 2007. Six percent of 3- to 5-year-olds, or 700,000 children, received services under IDEA in 2007. Nine percent of American
Indian/Alaska Native preschoolers in this age group were served under IDEA, compared with 6 percent each of White and Black preschoolers and 4 percent each of Hispanic and Asian preschoolers. In 2007, three percent of all preschoolers were identified as having a speech or language impairment; 4 percent of American Indian/Alaska Native preschoolers had this disability, compared with 3 percent of Whites and 2 percent each of Blacks, Hispanics, and Asians/Pacific Islanders in this age group. Though percentages varied by race, all other disabilities shown were identified in less than 1 percent of all preschoolers.
From 1998 to 2007, the percentage of 6- to 21-year-olds served under IDEA increased by less than 1 percentage point; increases in this percentage were seen for all races/ethnicities shown, with the exception of Whites. Nine percent of all 6- to 21-year-olds, or 5.9 million people in this age group, were served in 2007. Fourteen percent of American Indians/Alaska Natives in this age group were served under IDEA, compared with 12 percent of Blacks, 9 percent of Hispanics, 8 percent of Whites, and 5 percent of Asians/Pacific Islanders. Four percent of all 6- to 21-year-olds were identified as having a specific learning disability; 7 percent of American Indians/Alaska Natives in this age group had this type of disability, compared with 5 percent of Blacks and Hispanics, 3 percent of Whites, and 2 percent of Asians/Pacific Islanders. Two percent of 6- to 21-year-olds were identified as having a speech or language impairment. In addition, 2 percent of Black 6- to 21-year-olds were identified as having mental retardation, while 1 percent or less of 6- to 21-year-olds in other racial/ethnic groups had this disability. All other disabilities shown had a prevalence rate of 1 percent or less of the population in this age group, though percentages varied by race/ethnicity.
8. special needs
12 Previously the Education for All Handicapped Children Act, and amended in the Individuals with Disabilities Education Act (IDEA) of 2004 (P.L. 94-142). 13 Under IDEA, each public school child who receives special education and related services must have an Individualized Education Program (IEP) to address the student’s unique needs. See Appendix A: Guide to Sources for more information about IDEA history and requirements.

Status and Trends in the Education of Racial and Ethnic Groups 41
Chap
ter 2 — P
reprim
ary, Elem
entary, and s
econd
ary Ed
ucation P
articipatio
ntable 8.1a. Percentage of children ages 3 to 5 and ages 6 to 21 served under the individuals with
Disabilities Education Act (iDEA), by race/ethnicity: 1998–2007
Age group and year Total White Black Hispanic
Asian/ Pacific
Islander
American Indian/Alaska
Native
3 to 5 years1998 4.8 4.9 4.4 3.0 2.3 5.71999 5.0 5.5 5.0 3.5 2.5 5.82000 5.1 5.6 5.3 3.5 2.8 6.62001 5.3 5.8 5.5 3.8 3.0 7.12002 5.6 6.1 5.8 4.0 3.2 7.72003 5.8 6.4 5.9 4.3 3.6 8.32004 5.9 6.5 5.9 4.4 3.8 8.62005 5.8 6.5 5.7 4.4 4.0 8.82006 5.8 6.4 5.7 4.5 4.0 9.02007 5.7 6.3 5.6 4.5 4.2 8.6
6 to 21 years1998 8.6 8.5 11.4 7.5 3.8 10.21999 8.7 8.3 11.2 7.4 3.9 11.92000 8.7 8.5 11.8 7.5 4.2 12.42001 8.8 8.6 12.0 7.7 4.2 12.92002 8.9 8.6 12.2 8.0 4.4 13.22003 9.1 8.7 12.4 8.2 4.5 13.82004 9.2 8.8 12.6 8.4 4.7 14.12005 9.2 8.7 12.5 8.5 4.8 14.32006 9.1 8.7 12.4 8.5 4.8 14.32007 9.0 8.5 12.2 8.5 4.8 14.4
NOTE: Race categories exclude persons of Hispanic ethnicity.SOURCE: U.S. Department of Education, Office of Special Education Programs (OSEP), 1998 through 2007.
figure 8.1. Percentage of children ages 3 to 5 and ages 6 to 21 served under the individuals with Disabilities Education Act (iDEA), by race/ethnicity: 2007
NOTE: Race categories exclude persons of Hispanic ethnicity. SOURCE: U.S. Department of Education, Office of Special Education Programs (OSEP), 2007.
3 to 5 years
Age group
6 to 21 years0
10
20
30
40
50Percent
6 6 4 4
9 812
95
14
■ White ■ Black ■ Hispanic ■ Asian/Pacific ■ American Indian/ Islander Alaska Native
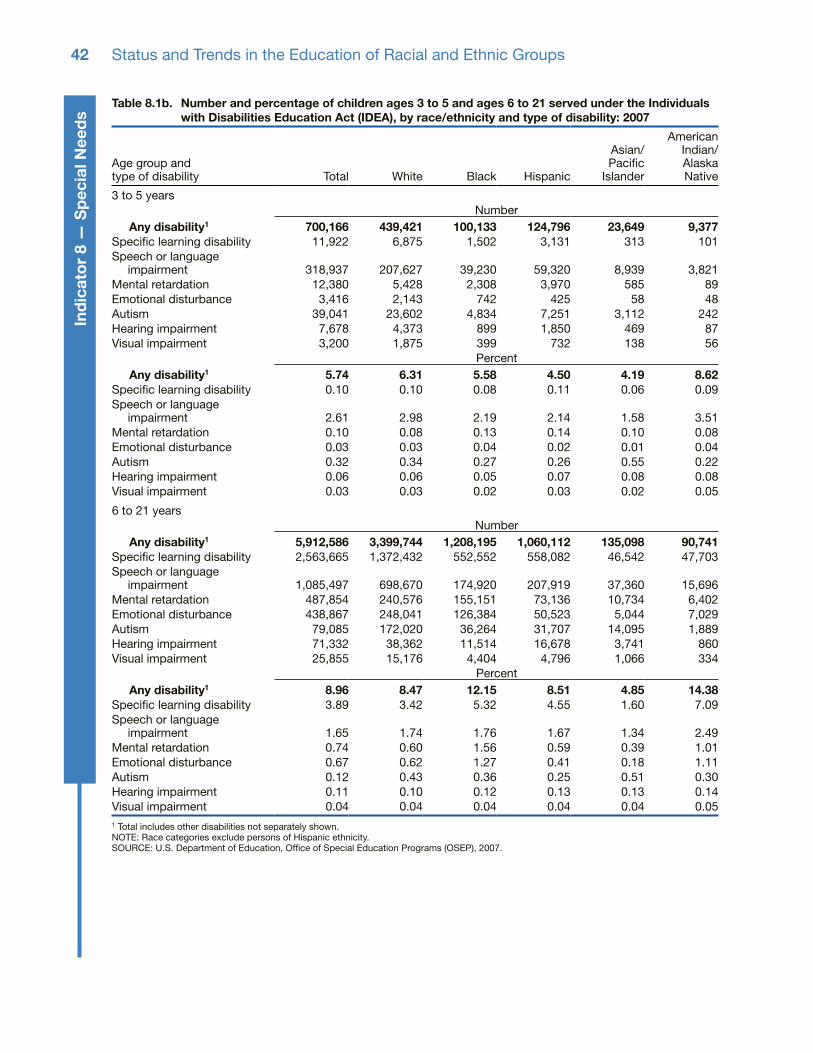
Status and Trends in the Education of Racial and Ethnic Groups42
ind
icat
or
8 —
sp
ecia
l nee
ds
table 8.1b. number and percentage of children ages 3 to 5 and ages 6 to 21 served under the individuals with Disabilities Education Act (iDEA), by race/ethnicity and type of disability: 2007
Age group and type of disability Total White Black Hispanic
Asian/ Pacific
Islander
American Indian/ Alaska Native
3 to 5 yearsNumber
Any disability1 700,166 439,421 100,133 124,796 23,649 9,377Specific learning disability 11,922 6,875 1,502 3,131 313 101Speech or language
impairment 318,937 207,627 39,230 59,320 8,939 3,821Mental retardation 12,380 5,428 2,308 3,970 585 89Emotional disturbance 3,416 2,143 742 425 58 48Autism 39,041 23,602 4,834 7,251 3,112 242Hearing impairment 7,678 4,373 899 1,850 469 87Visual impairment 3,200 1,875 399 732 138 56
PercentAny disability1 5.74 6.31 5.58 4.50 4.19 8.62
Specific learning disability 0.10 0.10 0.08 0.11 0.06 0.09Speech or language
impairment 2.61 2.98 2.19 2.14 1.58 3.51Mental retardation 0.10 0.08 0.13 0.14 0.10 0.08Emotional disturbance 0.03 0.03 0.04 0.02 0.01 0.04Autism 0.32 0.34 0.27 0.26 0.55 0.22Hearing impairment 0.06 0.06 0.05 0.07 0.08 0.08Visual impairment 0.03 0.03 0.02 0.03 0.02 0.05
6 to 21 yearsNumber
Any disability1 5,912,586 3,399,744 1,208,195 1,060,112 135,098 90,741Specific learning disability 2,563,665 1,372,432 552,552 558,082 46,542 47,703Speech or language
impairment 1,085,497 698,670 174,920 207,919 37,360 15,696Mental retardation 487,854 240,576 155,151 73,136 10,734 6,402Emotional disturbance 438,867 248,041 126,384 50,523 5,044 7,029Autism 79,085 172,020 36,264 31,707 14,095 1,889Hearing impairment 71,332 38,362 11,514 16,678 3,741 860Visual impairment 25,855 15,176 4,404 4,796 1,066 334
PercentAny disability1 8.96 8.47 12.15 8.51 4.85 14.38
Specific learning disability 3.89 3.42 5.32 4.55 1.60 7.09Speech or language
impairment 1.65 1.74 1.76 1.67 1.34 2.49Mental retardation 0.74 0.60 1.56 0.59 0.39 1.01Emotional disturbance 0.67 0.62 1.27 0.41 0.18 1.11Autism 0.12 0.43 0.36 0.25 0.51 0.30Hearing impairment 0.11 0.10 0.12 0.13 0.13 0.14Visual impairment 0.04 0.04 0.04 0.04 0.04 0.051 Total includes other disabilities not separately shown.NOTE: Race categories exclude persons of Hispanic ethnicity.SOURCE: U.S. Department of Education, Office of Special Education Programs (OSEP), 2007.

This page intentionally left blank.
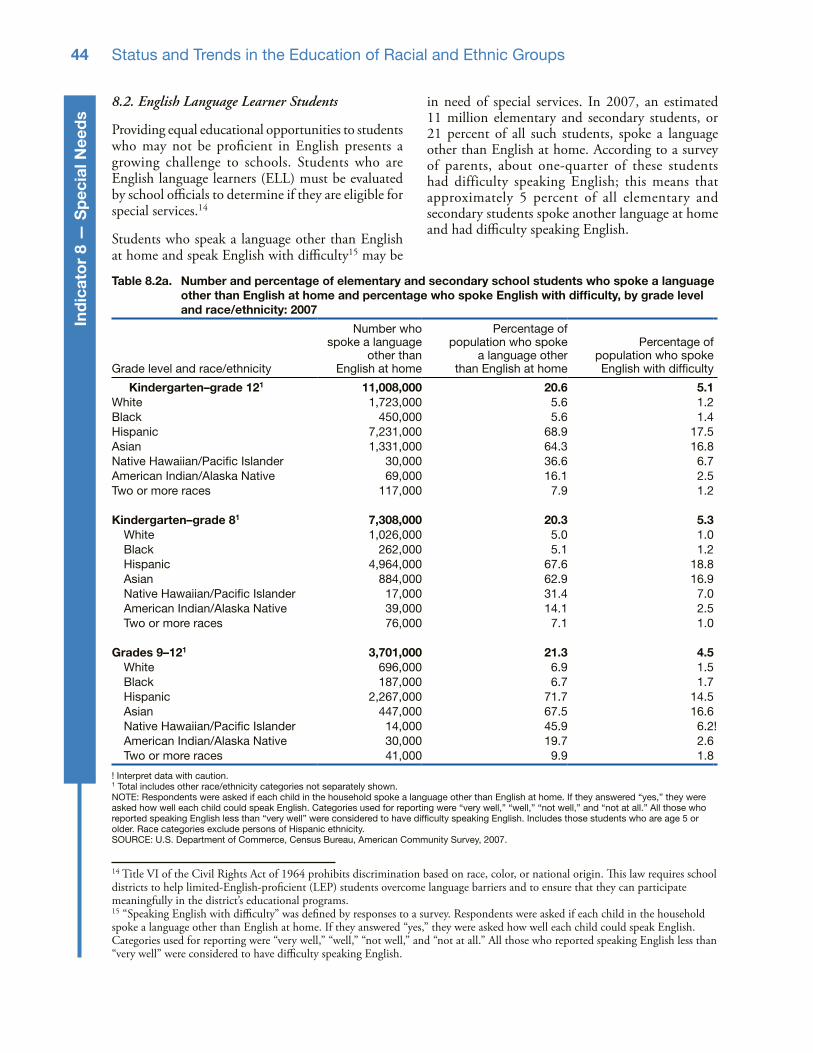
Status and Trends in the Education of Racial and Ethnic Groups44
ind
icat
or
8 —
sp
ecia
l nee
ds
8.2. English Language Learner Students
Providing equal educational opportunities to students who may not be proficient in English presents a growing challenge to schools. Students who are English language learners (ELL) must be evaluated by school officials to determine if they are eligible for special services.14
Students who speak a language other than English at home and speak English with difficulty15 may be
in need of special services. In 2007, an estimated 11 million elementary and secondary students, or 21 percent of all such students, spoke a language other than English at home. According to a survey of parents, about one-quarter of these students had difficulty speaking English; this means that approximately 5 percent of all elementary and secondary students spoke another language at home and had difficulty speaking English.
14 Title VI of the Civil Rights Act of 1964 prohibits discrimination based on race, color, or national origin. This law requires school districts to help limited-English-proficient (LEP) students overcome language barriers and to ensure that they can participate meaningfully in the district’s educational programs. 15 “Speaking English with difficulty” was defined by responses to a survey. Respondents were asked if each child in the household spoke a language other than English at home. If they answered “yes,” they were asked how well each child could speak English. Categories used for reporting were “very well,” “well,” “not well,” and “not at all.” All those who reported speaking English less than “very well” were considered to have difficulty speaking English.
table 8.2a. number and percentage of elementary and secondary school students who spoke a language other than English at home and percentage who spoke English with difficulty, by grade level and race/ethnicity: 2007
Grade level and race/ethnicity
Number who spoke a language
other than English at home
Percentage of population who spoke
a language other than English at home
Percentage of population who spoke English with difficulty
Kindergarten–grade 121 11,008,000 20.6 5.1White 1,723,000 5.6 1.2Black 450,000 5.6 1.4Hispanic 7,231,000 68.9 17.5Asian 1,331,000 64.3 16.8Native Hawaiian/Pacific Islander 30,000 36.6 6.7American Indian/Alaska Native 69,000 16.1 2.5Two or more races 117,000 7.9 1.2
Kindergarten–grade 81 7,308,000 20.3 5.3White 1,026,000 5.0 1.0Black 262,000 5.1 1.2Hispanic 4,964,000 67.6 18.8Asian 884,000 62.9 16.9Native Hawaiian/Pacific Islander 17,000 31.4 7.0American Indian/Alaska Native 39,000 14.1 2.5Two or more races 76,000 7.1 1.0
grades 9–121 3,701,000 21.3 4.5White 696,000 6.9 1.5Black 187,000 6.7 1.7Hispanic 2,267,000 71.7 14.5Asian 447,000 67.5 16.6Native Hawaiian/Pacific Islander 14,000 45.9 6.2!American Indian/Alaska Native 30,000 19.7 2.6Two or more races 41,000 9.9 1.8
! Interpret data with caution.1 Total includes other race/ethnicity categories not separately shown.NOTE: Respondents were asked if each child in the household spoke a language other than English at home. If they answered “yes,” they were asked how well each child could speak English. Categories used for reporting were “very well,” “well,” “not well,” and “not at all.” All those who reported speaking English less than “very well” were considered to have difficulty speaking English. Includes those students who are age 5 or older. Race categories exclude persons of Hispanic ethnicity.SOURCE: U.S. Department of Commerce, Census Bureau, American Community Survey, 2007.
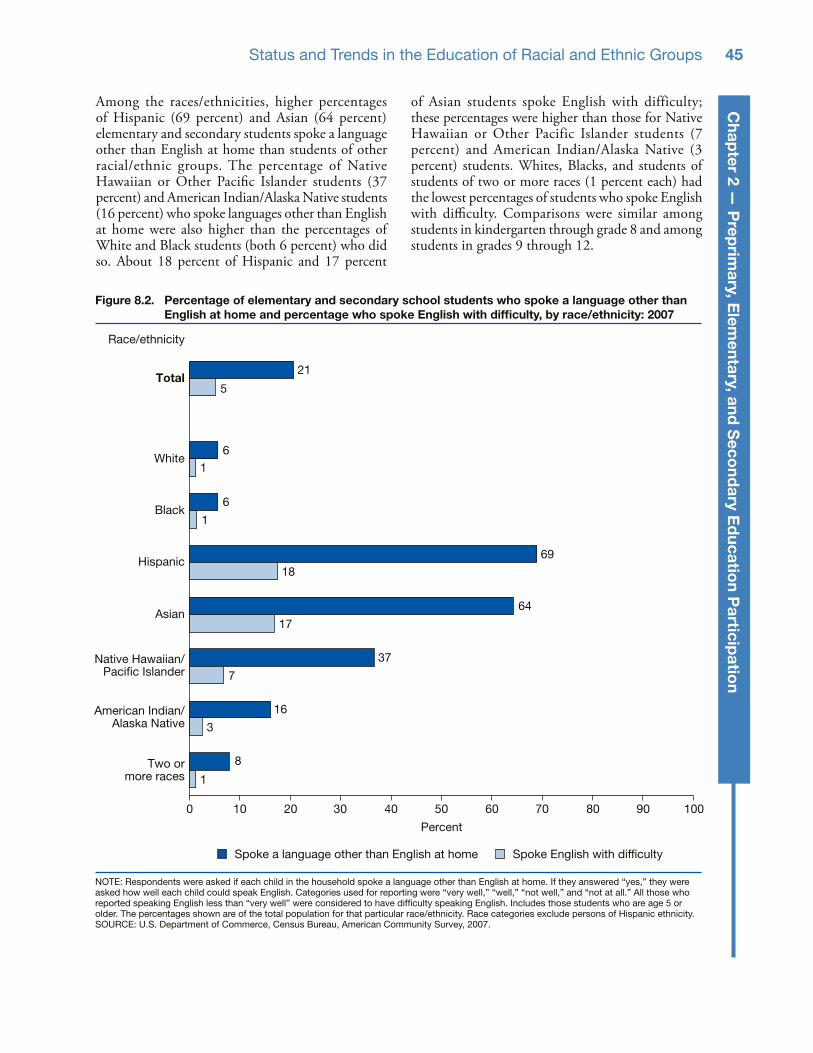
Status and Trends in the Education of Racial and Ethnic Groups 45
Chap
ter 2 — P
reprim
ary, Elem
entary, and s
econd
ary Ed
ucation P
articipatio
nAmong the races/ethnicities, higher percentages of Hispanic (69 percent) and Asian (64 percent) elementary and secondary students spoke a language other than English at home than students of other racial/ethnic groups. The percentage of Native Hawaiian or Other Pacific Islander students (37 percent) and American Indian/Alaska Native students (16 percent) who spoke languages other than English at home were also higher than the percentages of White and Black students (both 6 percent) who did so. About 18 percent of Hispanic and 17 percent
of Asian students spoke English with difficulty; these percentages were higher than those for Native Hawaiian or Other Pacific Islander students (7 percent) and American Indian/Alaska Native (3 percent) students. Whites, Blacks, and students of students of two or more races (1 percent each) had the lowest percentages of students who spoke English with difficulty. Comparisons were similar among students in kindergarten through grade 8 and among students in grades 9 through 12.
figure 8.2. Percentage of elementary and secondary school students who spoke a language other than English at home and percentage who spoke English with difficulty, by race/ethnicity: 2007
NOTE: Respondents were asked if each child in the household spoke a language other than English at home. If they answered “yes,” they were asked how well each child could speak English. Categories used for reporting were “very well,” “well,” “not well,” and “not at all.” All those who reported speaking English less than “very well” were considered to have difficulty speaking English. Includes those students who are age 5 or older. The percentages shown are of the total population for that particular race/ethnicity. Race categories exclude persons of Hispanic ethnicity. SOURCE: U.S. Department of Commerce, Census Bureau, American Community Survey, 2007.
Two ormore races
American Indian/Alaska Native
Native Hawaiian/Pacific Islander
Asian
Hispanic
Black
White
Total
Race/ethnicity
1009080706050
Percent
403020100
21
5
61
6
1
69
18
64
17
37
7
16
3
8
1
■ Spoke a language other than English at home ■ Spoke English with difficulty

Status and Trends in the Education of Racial and Ethnic Groups46
ind
icat
or
8 —
sp
ecia
l nee
ds
In 2007, about 7.2 million Hispanic elementary and secondary school students spoke a language other than English at home. Higher percentages of Dominican and Salvadoran students (88 and 87 percent, respectively) spoke a language other than English at home when compared with South American (79 percent), other Central American (78 percent), Mexican (72 percent), and Cuban (70 percent) students. Of those of Hispanic ethnicity, Puerto Ricans (50 percent) and Other Hispanics or Latinos (43 percent) had the lowest percentages of students who spoke a language other than English at home. In addition, the percentages of Mexican, Dominican, Salvadoran, and other Central American students (ranging from 18 to 20 percent) who had difficulty speaking English were higher than the percentages of Cuban (13 percent), South American (14 percent), Puerto Rican (8 percent), and Other Hispanic or Latino (8 percent) students who had difficulty speaking English.
In 2007, an estimated 1.3 million Asian students spoke a language other than English at home. A higher percentage of Vietnamese students (80 percent) spoke a language other than English at home than was the case for Korean (75 percent), Chinese (71 percent), Other Asian (69 percent), and Asian Indian (66 percent) students. Of those of Asian race, Japanese (51 percent) and Filipinos (34 percent) had the lowest percentages of students who spoke a language other than English at home. In addition, 18 to 25 percent of Chinese, Japanese, Korean, Vietnamese, and other Asian students spoke English with difficulty, compared with 8 percent of Filipino students and 10 percent of Asian Indian students.
snapshot of Hispanic and Asian subgroups: English language learners

Status and Trends in the Education of Racial and Ethnic Groups 47
Chap
ter 2 — P
reprim
ary, Elem
entary, and s
econd
ary Ed
ucation P
articipatio
n
table 8.2b. number and percentage of elementary and secondary school students who spoke a language other than English at home and percentage who spoke English with difficulty, by race/ethnicity with Hispanic and Asian subgroups: 2007
Race/ethnicity and subgroup
Number who spoke a language other than
English at home
Percentage of population who spoke a language other than
English at home
Percentage of population who spoke English with difficulty
total1 11,008,000 20.6 5.1White 1,723,000 5.6 1.2Black 450,000 5.6 1.4Hispanic 7,231,000 68.9 17.5
Mexican 5,132,000 71.6 19.9Puerto Rican 474,000 49.5 8.3Cuban 164,000 70.0 13.2Dominican 242,000 87.6 17.7Salvadoran 257,000 86.9 20.5Other Central American 296,000 78.5 19.1South American 338,000 78.8 14.5Other Hispanic or Latino 327,000 42.8 7.7
Asian 1,331,000 64.3 16.8Asian Indian 257,000 65.9 10.0Chinese2 315,000 71.3 21.1Filipino 121,000 34.3 8.2Japanese 32,000 51.1 21.5Korean 165,000 74.6 20.6Vietnamese 212,000 79.5 25.0Other Asian 228,000 68.7 18.5
Native Hawaiian or other Pacific Islander 30,000 36.6 6.7
American Indian/Alaska Native 69,000 16.1 2.5Two or more races 117,000 7.9 1.21 Total includes other race/ethnicity categories not separately shown.2 Excludes Taiwanese. Taiwanese is included in the “Other Asian” category.NOTE: Respondents were asked if each child in the household spoke a language other than English at home. If they answered “yes,” they were asked how well each child could speak English. Categories used for reporting were “very well,” “well,” “not well,” and “not at all.” All those who reported speaking English less than “very well” were considered to have difficulty speaking English. Includes those students who are age 5 or older. Race categories exclude persons of Hispanic ethnicity. Detail may not sum to totals because of rounding.SOURCE: U.S. Department of Commerce, Census Bureau, American Community Survey, 2007.

Status and Trends in the Education of Racial and Ethnic Groups48
ind
icat
or
9 —
tea
cher
Qua
lifica
tio
ns a
nd E
xper
ienc
e
Current federal education legislation requires school districts to measure and report on teacher qualifications, both to ensure that students are being taught by highly qualified teachers and to ensure that teachers are distributed equitably across schools, regardless of student demographics. Indicator 9.1 examines the percentage of high school teachers who had either a college major or certification in the subject that they consider to be their main teaching assignment. The focus is on those teachers who are lacking both, as they are not likely to be considered highly qualified. Indicator 9.2 reports the percentage of novice teachers (teachers with less than 3 years of experience), as well as the average years of teaching experience, by the concentration of various racial/ethnic groups in high schools. These data indicate where the most experienced teachers are working. It has been suggested that, even for highly effective
teachers, the first few years of their career can be difficult. Research has shown that Black and White students have different levels of exposure to novice teachers (Clotfelter, Ladd, and Vigdor 2004).
9.1. Teacher Qualifications
Teachers are certified by the state in which they teach. Certification can be standard, advanced professional, or probationary. The 2007–08 Schools and Staffing Survey (SASS) asked teachers whether they were certified in the subject that they taught most often (referred to as their main assignment), as well as what their major was in college. These data were combined for public high school teachers and reported by subject area (mathematics, English, and science), as well as by the percentage of the school enrollment that was White, Black, or Hispanic.16
9. teacher Qualifications and Experience
16 The Schools and Staffing Survey did not contain sufficient numbers of public secondary school teachers to be able to analyze schools with concentrations of Asian/Pacific Islander or American Indian/Alaska Native students.
figure 9.1. Percentage of public high school teachers with neither a college major nor standard certification in the subject that is their main teaching assignment, by race/ethnicity concentration of schools and subject: 2007–08
! Interpret data with caution. NOTE: Race categories exclude persons of Hispanic ethnicity. SOURCE: U.S. Department of Education, National Center for Education Statistics, Schools and Staffing Survey, Public School Teacher and Public School Data Files, 2007–08.
■ Math ■ English ■ Science
Total White enrollmentof 50 percent or more
Race/ethnicity concentration of school
Black enrollmentof 50 percent or more
Hispanic enrollmentof 50 percent or more
0
10
20
30
40
50Percent
128
48
64
25
13
4!
15 15
9!

Status and Trends in the Education of Racial and Ethnic Groups 49
Chap
ter 2 — P
reprim
ary, Elem
entary, and s
econd
ary Ed
ucation P
articipatio
nTwelve percent of teachers whose main assignment was secondary mathematics had neither a major nor a certification in the subject. This percentage was higher than the percentage of English teachers or science teachers that had neither qualification (8 and 4 percent, respectively). For schools with at least
half White enrollment, 8 percent of mathematics teachers had neither qualification, which was lower than the overall rate and the rate for schools with at least half Black enrollment (25 percent). Other differences between racial/ethnic groups could not be distinguished, in part due to large standard errors.
table 9.1. Percentage of public high school teachers with a college major and standard certification in their respective main teaching assignment in mathematics, English, and science, by race/ethnicity concentration of schools: 2007–08
Major in main assignment No major in main assignment
Subject and race/ethnicity concentration of school Total Total Certified
Not certified Total Certified
Not certified
Main assignment in mathematicsAll schools 100.0 71.6 59.8 11.8 28.4 16.2 12.2
Percentage of White enrollment
Less than 10 percent 100.0 70.6 47.0 23.7! 29.4 10.1 19.250 percent or more 100.0 75.1 65.2 9.9 24.9 16.6 8.3
Percentage of Black enrollment
Less than 10 percent 100.0 75.9 64.4 11.5 24.1 15.1 9.050 percent or more 100.0 56.0 48.6 7.4! 44.0 19.3 24.7
Percentage of Hispanic enrollment
Less than 10 percent 100.0 74.8 65.6 9.2 25.2 15.5 9.750 percent or more 100.0 70.3 44.8 25.6! 29.7 15.0 14.7
Main assignment in EnglishAll schools 100.0 81.9 66.6 15.4 18.1 9.7 8.4
Percentage of White enrollment
Less than 10 percent 100.0 75.6 56.6 19.0 24.4 11.8 12.650 percent or more 100.0 83.9 70.3 13.6 16.1 9.9 6.2
Percentage of Black enrollment
Less than 10 percent 100.0 81.8 67.6 14.2 18.2 10.4 7.850 percent or more 100.0 76.2 59.0 17.1 23.8 10.8! 13.0
Percentage of Hispanic enrollment
Less than 10 percent 100.0 84.3 70.4 14.0 15.7 9.1 6.650 percent or more 100.0 72.8 53.2 19.6 27.2 12.0 15.2
Main assignment in scienceAll schools 100.0 83.6 70.5 13.1 16.4 11.9 4.5
Percentage of White enrollment
Less than 10 percent 100.0 82.5 62.3 20.2 17.5! 11.9! 5.6!50 percent or more 100.0 84.8 73.3 11.5 15.2 11.2 4.0
Percentage of Black enrollment
Less than 10 percent 100.0 84.4 72.7 11.7 15.6 11.1 4.650 percent or more 100.0 77.6 57.3 20.3 22.4 18.7 3.7!
Percentage of Hispanic enrollment
Less than 10 percent 100.0 84.4 72.9 11.5 15.6 11.5 4.050 percent or more 100.0 80.5 64.7 15.7! 19.5! 10.6! 8.9!
! Interpret data with caution.NOTE: Race categories exclude persons of Hispanic ethnicity.SOURCE: U.S. Department of Education, National Center for Education Statistics, Schools and Staffing Survey, Public School Teacher and Public School Data Files, 2007–08.

Status and Trends in the Education of Racial and Ethnic Groups50
ind
icat
or
9 —
tea
cher
Qua
lifica
tio
ns a
nd E
xper
ienc
e9.2. Teacher Experience
Another measure of potential teacher quality is years of teaching experience. Indicator 9.2 uses 2007–08 Schools and Staffing Survey data to look at the percentage of “new” teachers, meaning those with less than 3 years of experience, by the racial/ethnic concentration of schools.
Schools with at least half White enrollment had a smaller percentage of new teachers (10 percent) than schools that were more than half Black (13 percent), or at least half Hispanic (15 percent). In contrast, schools with at least half White enrollment had teachers with more experience (14 years of experience, on average) than schools with at least half Hispanic enrollment (12 years of experience, on average).
table 9.2 Average number of years of teaching experience of regular full-time public school teachers and percentage who have less than 3 years of teaching experience, by race/ethnicity concentration of school: 2007–08
Race/ethnicity concentration of schoolAverage number of years
of teaching experience
Percentage of teachers with less than 3 years
of experience
total1 13.5 11.5White enrollment of 50 percent or more 14.1 10.0Black enrollment of 50 percent or more 13.1 12.9Hispanic enrollment of 50 percent or more 12.4 15.4Asian/Pacific Islander enrollment of 50 percent or more 12.5 15.7!American Indian/Alaska Native enrollment of 50 per-
cent or more 13.1 13.81 Total includes all regular full-time public school teachers.! Interpret data with caution.NOTE: Race categories exclude persons of Hispanic ethnicity.SOURCE: U.S. Department of Education, National Center for Education Statistics, Schools and Staffing Survey, Public School Teacher, and Public School Data Files, 2007–08.

Status and Trends in the Education of Racial and Ethnic Groups 51
Chap
ter 2 — P
reprim
ary, Elem
entary, and S
econd
ary Ed
ucation P
articipatio
nFigure 9.2. Average number of years of teaching experience of regular full-time public school teachers
and percentage who have less than 3 years of teaching experience, by race/ethnicity concentration of school: 2007–08
! Interpret data with caution.NOTE: Race categories exclude persons of Hispanic ethnicity. SOURCE: U.S. Department of Education, National Center for Education Statistics, Schools and Staffing Survey, Public School Teacher, and Public School Data Files, 2007–08.
■ White ■ Black ■ Hispanic ■ Asian/Pacific ■ American Indian/ Islander Alaska Native
Average number of yearsof teaching experience
0
5
10
15
20
25Years
1413 12 13 13
Percentage of teachers with less than 3 years of experience
Schools in which enrollment is 50 percent or more:
0
10
20
30
40
50
Percent
1013
15 16!14

This page intentionally left blank.

Chapter 3 focuses on different measures of academic achievement for elementary and secondary students. In 2005, Hispanic and American Indian/Alaska Native 4-year-olds from the 2001 birth cohort had lower rates of proficiency in letter recognition than White, Black, and Asian children and children of two or more races (indicator 10).
On the 2007 main National Assessment of Educational Progress (NAEP) reading assessment, higher percentages of Asian/Pacific Islander and White 4th- and 8th-graders scored at or above Proficient than did Black, Hispanic, or American Indian/Alaska Native students at the same grade levels. At 12th grade, a higher percentage of White students scored at or above Proficient than did Asian/Pacific Islander, Black, and Hispanic students. On the 2009 (4th and 8th grade) and 2005 (12th grade) NAEP mathematics assessment, a higher proportion of Asians/Pacific Islanders in 4th, 8th, and 12th grade scored at or above Proficient than did White, Black, Hispanic, and American Indian/Alaska Native 4th-, 8th-, and 12th-graders (indicator 11).
On an international level, U.S. 4th- and 8th-graders scored higher than the international average on the 2007 Trends in International Mathematics and Science Study (TIMSS). Within the United States, Asian students scored higher in mathematics than any other race/ethnicity at both the 4th- and 8th-grade level. A similar pattern held for science, with the exception that there was no measurable difference between the scores of Asian students and White students at either 4th or 8th grade (indicator 12).
Another way to measure student achievement is by the courses that students complete in high school. In 2005, a smaller percentage of Hispanic students took geometry, algebra II, and statistics than did White, Black, or Asian/Pacific Islander students. A higher percentage of Asian/Pacific Islander students took chemistry and physics than did White, Black, Hispanic, and American Indian/Alaska Native students (indicator 13).
High school students who wish to advance in a particular area of study may take Advanced Placement (AP) courses. Students who take an AP exam can earn college credit based on their scores. In 2008, over 1.5 million students in the United States took an AP exam, up from nearly 0.7 million students in 1999. Black students experienced the largest percentage increase in the number of students taking an AP exam during this time period. Similarly, the number of Hispanics participating in the AP program has more than tripled between 1999 and 2008 (indicator 14).
College entrance examination test-takers have become more diverse over the past decade. In 1998, Hispanic students represented 9 percent of SAT test-takers and 6 percent of ACT test-takers. By 2008, those percentages had increased to 13 percent and 9 percent, respectively. On the SAT, White students had the highest average critical reading score in 2008 and Asian students had the highest average mathematics score. On the ACT exam, one-third of Asian students met the college readiness benchmarks on all four sections, compared with 3 percent of Black students (indicator 15).
3 ACHiEvEmEnt

Status and Trends in the Education of Racial and Ethnic Groups54
ind
icat
or
10 —
Pro
fici
ency
of
4-ye
ar-O
lds
The Early Childhood Longitudinal Study Birth Cohort of 2001 assessed a representative sample of children born in the United States in 2001. These children were assessed when they were about 4 years old on their ability to identify a letter by either its name or the sound it makes (letter recognition), and their ability to identify single-digit numbers and basic geometric shapes (number and shape recognition). Children who met predetermined thresholds on letter recognition or number and shape recognition were considered proficient in those subjects. This indicator reports on the cognitive abilities of these 4-year-olds, in terms of letter recognition and number and shape recognition.
Overall, 33 percent of the 4-year-olds tested in 2005–06 were proficient in letter recognition. Hispanic and American Indian/Alaska Native children had lower rates of proficiency (23 percent and 19 percent, respectively), while Asian children
had a higher rate of proficiency (49 percent) than other groups. White children (37 percent) and children of two or more races (35 percent) had higher rates of proficiency than Black (28 percent), Hispanic (23 percent), and American Indian/Alaska Native (19 percent) children.
Approximately 65 percent of the 4-year-olds tested were proficient in recognizing numbers and shapes. American Indian/Alaska Native children had a lower rate of number and shape proficiency (40 percent) than Hispanic children (51 percent), Black children (55 percent), children of two or more races (65 percent), White children (73 percent), and Asian children (81 percent). Asian 4-year-olds had higher rates of proficiency than any other racial/ethnic group. No measurable differences in the proficiency rates were found between Hispanic and Black children.
10. Proficiency of 4-year-Olds
table 10. Percentage of children from the 2001 birth cohort who were proficient in letter and number and shape recognition at about 4 years old, by race/ethnicity: 2005–06
Race/ethnicityProficient in
letter recognition
Proficient in numbers and
shape recognition
total 32.7 65.4White 36.8 73.1Black 28.3 54.7Hispanic 23.0 51.4Asian 49.4 81.2Native Hawaiian/Pacific Islander ‡ ‡American Indian/Alaska Native 18.8 39.9Two or more races 35.4 65.4
‡ Reporting standards not met.NOTE: Data are based on a representative sample of children born in 2001. Race categories exclude persons of Hispanic ethnicity.SOURCE: U.S. Department of Education, National Center for Education Statistics, Early Childhood Longitudinal Study, Birth Cohort, Longitudinal 9-month—Preschool Restricted-Use Data File.

Status and Trends in the Education of Racial and Ethnic Groups 55
Chap
ter 3 — A
chievement
figure 10. Percentage of children from the 2001 birth cohort who were proficient in letter and number and shape recognition at about 4 years old, by race/ethnicity: 2005–06
NOTE: Data are based on a representative sample of children born in 2001. Estimates for Native Hawaiian and Other Pacific Islanders are not shown because reporting standards were not met. Race categories exclude persons of Hispanic ethnicity. SOURCE: U.S. Department of Education, National Center for Education Statistics, Early Childhood Longitudinal Study, Birth Cohort, Longitudinal 9-month—Preschool Restricted-Use Data File.
Percent proficient at letter recognition Percent proficient in numbers and shapes0
10
20
30
40
50
60
70
80
90
100Percent
37
2823
49
19
35
73
5551
81
40
65
■ White ■ Black ■ Hispanic ■ Asian ■ American Indian/ ■ Two or more races Alaska Native

Status and Trends in the Education of Racial and Ethnic Groups56
ind
icat
or
11 —
rea
din
g a
nd m
athe
mat
ics
Ach
ieve
men
t
The National Assessment of Educational Progress (NAEP) is a nationally representative assessment of what U.S. students know and can do in various subject areas. This indicator focuses on the results of 4th-, 8th-, and 12th-grade students in the subjects of reading and mathematics.
NAEP results are reported as average scores and the percentage of students performing at or above three achievement levels: Basic, Proficient, and Advanced. These achievement levels are performance standards showing what students should know and be able to do. Basic denotes partial mastery of knowledge and skills that are fundamental for proficient work at a given grade. (Below Basic, therefore, denotes less than this level of achievement.) Proficient represents solid academic performance. Students reaching this level have demonstrated competency over challenging subject matter. Advanced signifies superior performance.17
11.1. Reading Achievement
In grades 4, 8, and 12 the NAEP reading assessment gauges student performance in reading for literary experience and reading for information. In grades 8 and 12 it also gauges performance in reading to perform a task. In 2007, about 33 percent of 4th-graders scored at or above the Proficient level. Higher percentages of Asian/Pacific Islander (46
percent) and White (43 percent) students scored at or above this level than did their Black (14 percent), Hispanic (17 percent), and American Indian/Alaska Native (18 percent) peers. Over one-half of Black (54 percent) 4th-graders and about one-half of Hispanic (50 percent) and American Indian/Alaska Native (51 percent) 4th-graders scored below the Basic achievement level in 2007.
At the 8th-grade level, 31 percent of all students scored at or above the Proficient level. Higher percentages of Asian/Pacific Islander (41 percent) and White (40 percent) students scored at or above this level than did their Black (13 percent), Hispanic (15 percent), and American Indian/Alaska Native (18 percent) peers. In 2005, approximately 35 percent of 12th-grade students scored at or above the Proficient level. The percentages of White (43 percent) and Asian/Pacific Islander (36 percent) students who scored at or above Proficient were higher than the percentages of Black (16 percent) and Hispanic (20 percent) students who did so. The percentage of White 12th-graders at the Proficient level was also higher than the percentage of Asian/Pacific Islander 12th-graders at that level. The percentage of American Indian/Alaska Native 12th-graders at the Proficient level was not measurably different from the respective percentages of other racial/ethnic groups, which may be due in part to a large standard error.
11. reading and mathematics Achievement
17 Achievement levels are determined by the National Assessment Governing Board (NAGB), based on recommendations from panels of educators and members of the public, to provide a context for interpreting student performance on NAEP. Detailed descriptions of the NAEP achievement levels for each subject and grade can be found on the NAGB website (http://www.nagb.org/publications/achievement.htm).

Status and Trends in the Education of Racial and Ethnic Groups 57
Chap
ter 3 — A
chievement
table 11.1. Percentage distribution of students at national Assessment of Educational Progress (nAEP) reading achievement levels, by race/ethnicity and grade: 2005 and 2007
Grade, year, and achievement level Total1 White Black Hispanic
Asian/ Pacific
Islander
American Indian/ Alaska Native
4th grade, 2007Below Basic 33 22 54 50 23 51At Basic 34 35 32 32 32 30At or above Proficient 33 43 14 17 46 18
At Advanced 8 11 2 3 15 4
8th grade, 2007Below Basic 26 16 45 42 20 44At Basic 43 43 42 43 39 38At or above Proficient 31 40 13 15 41 18
At Advanced 3 4 # 1 5 2!
12th grade, 2005Below Basic 27 21 46 40 26 33!At Basic 37 36 38 40 38 41At or above Proficient 35 43 16 20 36 26!
At Advanced 5 6 1! 2! 5 ‡
# Rounds to zero. ! Interpret data with caution. ‡ Reporting standards not met. 1 Total includes other race/ethnicity categories not separately shown. NOTE: Achievement levels are performance standards showing what students should know and be able to do. Basic denotes partial mastery of knowledge and skills that are fundamental for proficient work at a given grade. (Below Basic, therefore, denotes less than this level of achievement.) Proficient represents solid academic performance. Students reaching this level have demonstrated competency over challenging subject matter. Advanced signifies superior performance. NAEP reports data on student race/ethnicity based on information obtained from school rosters. Race categories exclude persons of Hispanic ethnicity. The NAEP assessment was not administered to grade 12 in 2007. Detail may not sum to totals because of rounding. SOURCE: U.S. Department of Education, National Center for Education Statistics, National Assessment of Educational Progress (NAEP), 2005 and 2007 Reading Assessment, NAEP Data Explorer.

Status and Trends in the Education of Racial and Ethnic Groups58
ind
icat
or
11 —
rea
din
g a
nd m
athe
mat
ics
Ach
ieve
men
tfigure 11.1a. Percentage distribution of 4th-grade students at national Assessment of Educational
Progress (nAEP) reading achievement levels, by race/ethnicity: 2007
NOTE: Achievement levels are performance standards showing what students should know and be able to do. Basic denotes partial mastery of knowledge and skills that are fundamental for proficient work at a given grade. (Below Basic, therefore, denotes less than this level of achievement.) Proficient represents solid academic performance. Students reaching this level have demonstrated competency over challenging subject matter. Advanced signifies superior performance. NAEP reports data on student race/ethnicity based on information obtained from school rosters. Race categories exclude persons of Hispanic ethnicity. Detail may not sum to totals because of rounding. SOURCE: U.S. Department of Education, National Center for Education Statistics, National Assessment of Educational Progress (NAEP), 2007 Reading Assessment, NAEP Data Explorer.
figure 11.1b. Percentage distribution of 8th-grade students at national Assessment of Educational Progress (nAEP) reading achievement levels, by race/ethnicity: 2007
# Rounds to zero. ! Interpret data with caution. NOTE: Achievement levels are performance standards showing what students should know and be able to do. Basic denotes partial mastery of knowledge and skills that are fundamental for proficient work at a given grade. (Below Basic, therefore, denotes less than this level of achievement.) Proficient represents solid academic performance. Students reaching this level have demonstrated competency over challenging subject matter. Advanced signifies superior performance. NAEP reports data on student race/ethnicity based on information obtained from school rosters. Race categories exclude persons of Hispanic ethnicity. Detail may not sum to totals because of rounding. SOURCE: U.S. Department of Education, National Center for Education Statistics, National Assessment of Educational Progress (NAEP), 2007 Reading Assessment, NAEP Data Explorer.
American Indian/Alaska Native
Asian/Pacific Islander
Hispanic
Black
White
Race/ethnicity
70 60 50 40
Percent below Basic Percent at or above Basic
30 20 10 0 10 20 30 40 50 60 70 80 90 100
51 30 14 4
23 32 31 15
50 32 15 3
54 32 12 2
22 35 32 11
■ Below Basic ■ At Basic ■ At Proficient ■ At Advanced
American Indian/Alaska Native
Asian/Pacific Islander
Hispanic
Black
White
Race/ethnicity
70 60 50 40 30 20 10 0 10 20 30 40 50 60 70 80 90 100
44 38 16 2!
20 39 36 5
42 43 15 1
45 42 12 #
16 43 36 4
Percent below Basic Percent at or above Basic
■ Below Basic ■ At Basic ■ At Proficient ■ At Advanced

Status and Trends in the Education of Racial and Ethnic Groups 59
Chap
ter 3 — A
chievement
figure 11.1c. Percentage distribution of 12th-grade students at national Assessment of Educational Progress (nAEP) reading achievement levels, by race/ethnicity: 2005
! Interpret data with caution. ‡ Reporting standards not met. NOTE: Achievement levels are performance standards showing what students should know and be able to do. Basic denotes partial mastery of knowledge and skills that are fundamental for proficient work at a given grade. (Below Basic, therefore, denotes less than this level of achievement.) Proficient represents solid academic performance. Students reaching this level have demonstrated competency over challenging subject matter. Advanced signifies superior performance. NAEP reports data on student race/ethnicity based on information obtained from school rosters. Race categories exclude persons of Hispanic ethnicity. The NAEP assessment was not administered to grade 12 in 2007. Detail may not sum to totals because of rounding. SOURCE: U.S. Department of Education, National Center for Education Statistics, National Assessment of Educational Progress (NAEP), 2005 Reading Assessment, NAEP Data Explorer.
Race/ethnicity
Percent below Basic Percent at or above Basic
■ Below Basic ■ At Basic ■ At Proficient ■ At Advanced
American Indian/Alaska Native
Asian/Pacific Islander
Hispanic
Black
White
70 60 50 40 30 20 10 0 10 20 30 40 50 60 70 80 90 100
33! 41 24! ‡
26 38 31 5
40 40 18 2!
46 38 15 1!
21 36 37 6

Status and Trends in the Education of Racial and Ethnic Groups60
ind
icat
or
11 —
rea
din
g a
nd m
athe
mat
ics
Ach
ieve
men
t11.2. Mathematics Achievement
The NAEP mathematics assessment measures students’ abilities in five content areas: number sense, properties, and operations; measurement; geometry and spatial sense; data analysis, statistics, and probability; and algebra and functions. In 2009, about 39 percent of 4th- graders scored at or above the Proficient level. Asians/Pacific Islanders (60 percent) had the highest percentage of 4th-graders scoring at or above Proficient, followed by White students (51 percent). Both of these groups had higher percentages of students scoring at this level than did Hispanics (22 percent) and American Indian/Alaska Natives (21 percent) students. Blacks had the lowest
percentage of 4th-grade students scoring at or above the Proficient level (16 percent) of all groups.
The percentage of 8th-graders scoring at or above Proficient followed a similar pattern: in 2009, approximately 54 percent of Asian/Pacific Islander students scored at or above Proficient, higher than the percentages for White (44 percent), American Indian/Alaska Native (18 percent), Hispanic (17 percent), and Black (12 percent) 8th-graders. In 2005, at the 12th-grade level, a higher percentage of Asian/Pacific Islander students (36 percent) scored at or above Proficient than did White (29 percent), Hispanic (8 percent), Black (6 percent), and American Indian/Alaska Native (6 percent) students.
table 11.2. Percentage distribution of students at national Assessment of Educational Progress (nAEP) mathematics achievement levels, by race/ethnicity and grade: 2005 and 2009
Grade, year, and achievement level Total1 White Black Hispanic
Asian/ Pacific
Islander
American Indian/ Alaska Native
4th grade, 2009Below Basic 18 9 36 29 8 34At Basic 43 40 48 49 31 45At or above Proficient 39 51 16 22 60 21
At Advanced 6 8 1 1 17 2
8th grade, 2009Below Basic 27 17 50 43 15 44At Basic 39 40 37 40 31 38At or above Proficient 34 44 12 17 54 18
At Advanced 8 11 1 2 20 3
12th grade, 2005Below Basic 39 30 70 60 27 58At Basic 38 41 25 32 37 36At or above Proficient 23 29 6 8 36 6!
At Advanced 2 3 # # 6 1!
# Rounds to zero.! Interpret data with caution.1 Total includes other race/ethnicity categories not separately shown.NOTE: Achievement levels are performance standards showing what students should know and be able to do. Basic denotes partial mastery of knowledge and skills that are fundamental for proficient work at a given grade. (Below Basic, therefore, denotes less than this level of achievement.) Proficient represents solid academic performance. Students reaching this level have demonstrated competency over challenging subject matter. Advanced signifies superior performance. NAEP reports data on student race/ethnicity based on information obtained from school rosters. Race categories exclude persons of Hispanic ethnicity. The NAEP assessment was not administered to grade 12 in 2007. Detail may not sum to totals because of rounding.SOURCE: U.S. Department of Education, National Center for Education Statistics, National Assessment of Educational Progress (NAEP), 2005 and 2009 Mathematics Assessment, NAEP Data Explorer.

Status and Trends in the Education of Racial and Ethnic Groups 61
Chap
ter 3 — A
chievement
Figure 11.2a. Percentage distribution of 4th-grade students at National Assessment of Educational Progress (NAEP) mathematics achievement levels, by race/ethnicity: 2009
NOTE: Achievement levels are performance standards showing what students should know and be able to do. Basic denotes partial mastery of knowledge and skills that are fundamental for proficient work at a given grade. (Below Basic, therefore, denotes less than this level of achievement.) Proficient represents solid academic performance. Students reaching this level have demonstrated competency over challenging subject matter. Advanced signifies superior performance. NAEP reports data on student race/ethnicity based on information obtained from school rosters. Race categories exclude persons of Hispanic ethnicity. Detail may not sum to totals because of rounding. SOURCE: U.S. Department of Education, National Center for Education Statistics, National Assessment of Educational Progress (NAEP), 2009 Mathematics Assessment, NAEP Data Explorer.
Figure 11.2b. Percentage distribution of 8th-grade students at National Assessment of Educational Progress (NAEP) mathematics achievement levels, by race/ethnicity: 2009
NOTE: Achievement levels are performance standards showing what students should know and be able to do. Basic denotes partial mastery of knowledge and skills that are fundamental for proficient work at a given grade. (Below Basic, therefore, denotes less than this level of achievement.) Proficient represents solid academic performance. Students reaching this level have demonstrated competency over challenging subject matter. Advanced signifies superior performance. NAEP reports data on student race/ethnicity based on information obtained from school rosters. Race categories exclude persons of Hispanic ethnicity. Detail may not sum to totals because of rounding. SOURCE: U.S. Department of Education, National Center for Education Statistics, National Assessment of Educational Progress (NAEP), 2009 Mathematics Assessment, NAEP Data Explorer.
Percent below Basic Percent at or above Basic
■ Below Basic ■ At Basic ■ At Proficient ■ At Advanced
American Indian/Alaska Native
Asian/Pacific Islander
Hispanic
Black
White
Race/ethnicity
70 60 50 40 30 20 10 0 10 20 30 40 50 60 70 80 90 100
34 45 19 2
8 31 43 17
29 49 20 1
36 48 15 1
9 40 42 8
American Indian/Alaska Native
Asian/Pacific Islander
Hispanic
Black
White
Race/ethnicity
70 60 50 40 30 20 10 0 10 20 30 40 50 60 70 80 90 100
44 38 15 3
15 31 34 20
43 40 15 2
50 37 11 1
17 40 33 11
Percent below Basic Percent at or above Basic
■ Below Basic ■ At Basic ■ At Proficient ■ At Advanced

Status and Trends in the Education of Racial and Ethnic Groups62
ind
icat
or
11 —
rea
din
g a
nd m
athe
mat
ics
Ach
ieve
men
tfigure 11.2c. Percentage distribution of 12th-grade students at national Assessment of Educational
Progress (nAEP) mathematics achievement levels, by race/ethnicity: 2005
# Rounds to zero. ! Interpret data with caution. NOTE: Achievement levels are performance standards showing what students should know and be able to do. Basic denotes partial mastery of knowledge and skills that are fundamental for proficient work at a given grade. (Below Basic, therefore, denotes less than this level of achievement.) Proficient represents solid academic performance. Students reaching this level have demonstrated competency over challenging subject matter. Advanced signifies superior performance. NAEP reports data on student race/ethnicity based on information obtained from school rosters. Race categories exclude persons of Hispanic ethnicity. The NAEP assessment was not administered to grade 12 in 2007. Detail may not sum to totals because of rounding. SOURCE: U.S. Department of Education, National Center for Education Statistics, National Assessment of Educational Progress (NAEP), 2005 Mathematics Assessment, NAEP Data Explorer.
Race/ethnicity
Percent below Basic Percent at or above Basic
■ Below Basic ■ At Basic ■ At Proficient ■ At Advanced
American Indian/Alaska Native
Asian/Pacific Islander
Hispanic
Black
White
70 60 50 40 30 20 10 0 10 20 30 40 50 60 70 80 90 100
58 36 5! 1!
27 37 30 6
60 32 8 #
70 25 5 #
30 41 26 3

This page intentionally left blank.

Status and Trends in the Education of Racial and Ethnic Groups64
ind
icat
or
12 —
inte
rnat
iona
l Co
mp
aris
ons The Trends in International Mathematics and
Science Study (TIMSS) began in 1995 and has been administered four times since by the International Association for the Evaluation of Educational Achievement (IEA). In 2007, thirty-six jurisdictions participated at the 4th-grade level and 48 participated at the 8th-grade level. These assessments measure how well students have acquired knowledge and skills taught in school, as they are designed to align with the curricula of participating jurisdictions.
This indicator compares the 2007 average mathematics and science scores of 4th- and 8th-grade students in the United States with the overall TIMSS average and the scores of the other participating jurisdictions. In all grades and subjects, the U.S. average score exceeded the TIMSS average of 500.
At the 4th-grade level in mathematics, the U.S. average score was 529. Of U.S. students, Asian students scored the highest at 582, compared with White students who scored 550, students of two or more races who scored 534, Hispanic students who scored 504, and Black students who scored 482, on average.
At the 8th-grade level in mathematics, the U.S. average score was 508, with scores ranging from 457 for Black students to 549 for Asian students. Asian and White students scored higher than the TIMSS average of 500, while Black and Hispanic students scored lower. The average score for students of two or more races (506) was not measurably different than the TIMSS average.
The U.S. average score on the 4th-grade science assessment was 539, with Asian students scoring 573, White students scoring 567, students of two or more races scoring 550, Hispanic students scoring 502, and Black students scoring 488.
The U.S. average score in 8th-grade science was 520; scores ranged from 455 for Black students to 551 for White students. White students, Asian students, and students of two or more races scored higher than the TIMSS average, while Black and Hispanic students scored lower.
12. international Comparisons
table 12a. Average scores among 4th- and 8th-graders in the united states on the trends in international mathematics and science study (timss), by race/ethnicity: 2007
Mathematics Science
Grade and race/ethnicity Average score Grade and race/ethnicity Average score
4th grade 4th gradetimss scale average 500 timss scale average 500
united states1 529 united states1 539White 550 White 567Black 482 Black 488Hispanic 504 Hispanic 502Asian 582 Asian 573Two or more races 534 Two or more races 550
8th grade 8th gradetimss scale average 500 timss scale average 500
united states1 508 united states1 520White 533 White 551Black 457 Black 455Hispanic 475 Hispanic 480Asian 549 Asian 543Two or more races 506 Two or more races 522
1 Includes other races/ethnicities not separately shown.NOTE: Scores are reported on a scale of 0 to 1,000. Race categories exclude persons of Hispanic ethnicity. SOURCE: International Association for the Evaluation of Educational Achievement (IEA), Trends in International Mathematics and Science Study (TIMSS), 2007.

Status and Trends in the Education of Racial and Ethnic Groups 65
Chap
ter 3 — A
chievement
figure 12a. Average scores among 4th-graders in the united states on the trends in international mathematics and science study (timss), by subject and race/ethnicity: 2007
1 Includes other races/ethnicities not separately shown. NOTE: Scores are reported on a scale of 0 to 1,000. Race categories exclude persons of Hispanic ethnicity. SOURCE: International Association for the Evaluation of Educational Achievement (IEA), Trends in International Mathematics and Science Study (TIMSS), 2007.
figure 12b. Average scores among 8th-graders in the united states on the trends in international mathematics and science study (timss), by subject and race/ethnicity: 2007
1 Includes other races/ethnicities not separately shown. NOTE: Scores are reported on a scale of 0 to 1,000. Race categories exclude persons of Hispanic ethnicity. SOURCE: International Association for the Evaluation of Educational Achievement (IEA), Trends in International Mathematics and Science Study (TIMSS), 2007.
Mathematics
Subject
Science0
100
200
300
400
500
600
700Score
529550
482 504
582534
TIMSSaverage:
500
539567
488 502
573550
■ U.S. average1 ■ White ■ Black ■ Hispanic ■ Asian ■ Two or more races
TIMSSaverage:
500
■ U.S. average1 ■ White ■ Black ■ Hispanic ■ Asian ■ Two or more races
Mathematics
Subject
Science
508533
457475
549506 520
551
455480
543 522
0
100
200
300
400
500
600
700Score

Status and Trends in the Education of Racial and Ethnic Groups66
ind
icat
or
12 —
inte
rnat
iona
l Co
mp
aris
ons
table 12b. Average scores among 4th-graders on the trends in international mathematics and science study (timss), by participating country and race/ethnicity in the united states: 2007
Mathematics Science
Country and race/ethnicity Average score Country and race/ethnicity Average score
timss scale average 500 timss scale average 500united states1,2,3 529 united states1,2,3 539
White 550 White 567Black 482 Black 488Hispanic 504 Hispanic 502Asian 582 Asian 573Two or more races 534 Two or more races 550
Countries whose scores were higher than the U.S. score Countries whose scores were higher than the U.S. score Hong Kong SAR4 607 Singapore 587Singapore 599 Chinese Taipei 557Chinese Taipei 576 Hong Kong SAR4 554Japan 568 Japan 548Kazakhstan5 549Russian Federation 544 Countries whose scores were not measurably different
from the U.S. scoreEngland 541Latvia5 537 Russian Federation 546
Latvia5 542Countries whose scores were not measurably different
from the U.S. scoreEngland 542Hungary 536
Netherlands6 535 Italy 535Lithuania5 530 Kazakhstan5 533Germany 525Denmark1 523 Countries whose scores were lower than the U.S. score
Germany 528Countries whose scores were lower than the U.S. score Australia 527
Australia 516 Slovak Republic 526Hungary 510 Austria 526Italy 507 Sweden 525Austria 505 Netherlands6 523Sweden 503 Slovenia 518Slovenia 502 Denmark1 517Armenia 500 Czech Republic 515Slovak Republic 496 Lithuania5 514Scotland1 494 New Zealand 504New Zealand 492 Scotland1 500Czech Republic 486 Armenia 484Norway 473 Norway 477Ukraine 469 Ukraine 474Georgia5 438 Iran, Islamic Republic of 436Iran, Islamic Republic of 402 Georgia5 418Algeria 378 Colombia 400Colombia 355 El Salvador 390Morocco 341 Algeria 354El Salvador 330 Kuwait7 348Tunisia 327 Tunisia 318Kuwait7 316 Morocco 297Qatar 296 Qatar 294Yemen 224 Yemen 197
1 Met guidelines for sample participation rates only after substitute schools were included.2 National Defined Population covers 90 percent to 95 percent of National Target Population.3 Includes other races/ethnicities not separately shown.4 Hong Kong is a Special Administrative Region (SAR) of the People’s Republic of China.5 National Target Population does not include all of the International Target Population defined by TIMSS.6 Nearly satisfied guidelines for sample participation rates only after substitute schools were included.7 Kuwait tested the same cohort of students as other countries, but later in 2007, at the beginning of the next school year.NOTE: Scores are reported on a scale of 0 to 1,000. The tests for significance take into account the standard error for the reported difference. Thus, a small difference between the United States and one country may be significant while a larger difference between the United States and another country may not be significant. For more information on the international requirements for sampling, data collection, and participation rates, see Highlights From TIMSS 2007: Mathematics and Science Achievement of U.S. Fourth- and Eighth-Grade Students in an International Context, Appendix A (Gonzales et al. 2008) for information.SOURCE: International Association for the Evaluation of Educational Achievement (IEA), Trends in International Mathematics and Science Study (TIMSS), 2007.

This page intentionally left blank.

Status and Trends in the Education of Racial and Ethnic Groups68
ind
icat
or
12 —
inte
rnat
iona
l Co
mp
aris
ons
table 12c. Average scores among 8th-graders on the trends in international mathematics and science study (timss), by participating country and race/ethnicity in the united states: 2007
Mathematics Science
Country and race/ethnicity Average score Country and race/ethnicity Average score
timss scale average 500 timss scale average 500united states1,2,3 508 united states1,2,3 520
White 533 White 551Black 457 Black 455Hispanic 475 Hispanic 480Asian 549 Asian 543Two or more races 506 Two or more races 522
Countries whose scores were higher than the U.S. score Countries whose scores were higher than the U.S. score Chinese Taipei 598 Singapore 567Korea, Republic of 597 Chinese Taipei 561Singapore 593 Japan 554Hong Kong SAR1,4 572 Korea, Republic of 553Japan 570 England1 542
Hungary 539Countries whose scores were not measurably different
from the U.S. scoreCzech Republic 539Slovenia 538
Hungary 517 Russian Federation 530England1 513Russian Federation 512 Countries whose scores were not measurably different
from the U.S. scoreLithuania5 506Czech Republic 504 Hong Kong SAR1,4 530
Lithuania5 519Australia 515
See notes at end of table.

Status and Trends in the Education of Racial and Ethnic Groups 69
Chap
ter 3 — A
chievement
table 12c. Average scores among 8th-graders on the trends in international mathematics and science study (timss), by participating country and race/ethnicity in the united states: 2007—Continued
Mathematics Science
Country and race/ethnicity Average score Country and race/ethnicity Average score
Countries whose scores were lower than the U.S. score
Countries whose scores were lower than the U.S. score
Slovenia 501 Sweden 511Armenia 499 Scotland1 496Australia 496 Italy 495Sweden 491 Armenia 488Malta 488 Norway 487Scotland1 487 Ukraine 485Serbia2,5 486 Jordan 482Italy 480 Malaysia 471Malaysia 474 Thailand 471Norway 469 Serbia2,5 470Cyprus 465 Bulgaria6 470Bulgaria 464 Israel6 468Israel6 463 Bahrain 467Ukraine 462 Bosnia and Herzegovina 466Romania 461 Romania 462Bosnia and Herzegovina 456 Iran, Islamic Republic of 459Lebanon 449 Malta 457Thailand 441 Turkey 454Turkey 432 Syrian Arab Republic 452Jordan 427 Cyprus 452Tunisia 420 Tunisia 445Georgia5 410 Indonesia 427Iran, Islamic Republic of 403 Oman 423Bahrain 398 Georgia5 421Indonesia 397 Kuwait7 418Syrian Arab Republic 395 Colombia 417Egypt 391 Lebanon 414Algeria 387 Egypt 408Colombia 380 Algeria 408Oman 372 Palestinian National Authority 404Palestinian National Authority 367 Saudi Arabia 403Botswana 364 El Salvador 387Kuwait7 354 Botswana 355El Salvador 340 Qatar 319Saudi Arabia 329 Ghana 303Ghana 309Qatar 307
1 Met guidelines for sample participation rates only after substitute schools were included.2 National Defined Population covers 90 percent to 95 percent of National Target Population. 3 Includes other races/ethnicities not separately shown.4 Hong Kong is a Special Administrative Region (SAR) of the People’s Republic of China.5 National Target Population does not include all of the International Target Population defined by TIMSS.6 National Defined Population covers less than 90 percent of National Target Population (but at least 77 percent). 7 Kuwait tested the same cohort of students as other countries, but later in 2007, at the beginning of the next school year.NOTE: Scores are reported on a scale of 0 to 1,000. The tests for significance take into account the standard error for the reported difference. Thus, a small difference between the United States and one country may be significant while a larger difference between the United States and another country may not be significant. For more information on the international requirements for sampling, data collection, and participation rates, see Highlights From TIMSS 2007: Mathematics and Science Achievement of U.S. Fourth- and Eighth-Grade Students in an International Context, Appendix A (Gonzales et al. 2008) for information.SOURCE: International Association for the Evaluation of Educational Achievement (IEA), Trends in International Mathematics and Science Study (TIMSS), 2007.

Status and Trends in the Education of Racial and Ethnic Groups70
ind
icat
or
13 —
mat
hem
atic
s an
d s
cien
ce C
our
seta
king
in H
igh
sch
oo
l
This indicator examines the percentage of high school students who completed selected mathematics and science courses using data from high school graduates’ transcripts from 1998, 2000, and 2005. These data only report the percentage of students who earned credit in each course while in high school (grades 9–12) and do not count those students who took these courses prior to entering high school.
13.1. Mathematics Coursetaking
Compared with 1998 high school graduates, a higher percentage of 2005 graduates had completed geometry, algebra II, statistics, precalculus, and calculus while in high school. For all racial/ethnic groups, a higher percentage of graduates had completed a geometry course in 2005 than in 1998, including Blacks, Hispanics, and American Indians/Alaska Natives: these groups had increases ranging from 12 to 18 percentage points. A similar pattern was found for the completion of algebra II—a higher percentage of White, Black, Hispanic, and American Indian/Alaska Native students had completed algebra II in 2005 than in 1998, and these increases ranged from 7 to 21 percentage points. Partly due to high standard errors, there was no measurable difference between the 1998 and 2005 percentages of Asian/Pacific Islander graduates who had completed algebra II. Furthermore, the gap between the percentage of
White students and Black students who had taken algebra II decreased from 9 percentage points in 1998 to 2 percentage points in 2005. Similarly, the gap between the percentage of White students and Hispanic students who had taken algebra II decreased from 16 to 9 percentage points between 1998 and 2005.
A higher percentage of White and Asian/Pacific Islander graduates had completed a calculus course in 2005 than in 1998. During this period, the percentage of White students who had completed a calculus course increased by 3 percentage points, while the percentage of Asian/Pacific Islander students increased by 11 percentage points.
Among 2005 high school graduates, a lower percentage of Hispanic students had completed courses in geometry, algebra II, and statistics than had White, Black, or Asian/Pacific Islander students. A higher percentage of Asian/Pacific Islander graduates than graduates of other racial/ethnic groups had completed precalculus and calculus courses. For example, 30 percent of Asian/Pacific Islander graduates had completed a calculus course in high school, compared with 15 percent of White, 6 percent each of Black and Hispanic, and 8 percent of American Indian/Alaska Native graduates.
13. mathematics and science Coursetaking in High school

Status and Trends in the Education of Racial and Ethnic Groups 71
Chap
ter 3 — A
chievement
table 13a. Percentage of high school graduates who completed selected mathematics courses in high school, by race/ethnicity: 1998, 2000, and 2005
Year and race/ethnicity Geometry Algebra II Trigonometry Statistics Precalculus Calculus
1998total 75.1 61.7 8.9 3.7 23.1 11.0
White 77.7 64.6 10.0 4.3 25.0 12.1Black 72.5 55.6 4.8 2.1 13.8 6.6Hispanic 62.3 48.3 5.6 1.7 15.3 6.2Asian/Pacific Islander 75.9 70.1 11.7 3.8 41.3 18.4American Indian/Alaska
Native 57.2 46.6 5.5 3.7! 16.4 6.2!
2000total 78.3 67.8 7.5 5.7 26.7 11.6
White 79.2 68.9 8.5 6.1 28.2 12.5Black 77.9 64.8 4.1 3.8! 16.2 4.7Hispanic 72.8 59.8 2.9 2.3 19.3 5.6Asian/Pacific Islander 80.6 80.4 14.5! 11.5 48.8 30.8American Indian/Alaska
Native 65.0 60.3 4.3! 2.1! 12.6 2.4!
2005total 83.3 70.3 8.3 7.7 29.5 13.6
White 83.4 71.2 9.6 8.5 32.0 15.3Black 84.7 69.2 3.9 5.8 17.9 5.5Hispanic 80.5 62.7 4.8 3.4 20.5 6.3Asian/Pacific Islander 86.1 78.3 9.4 13.0 48.8 29.8American Indian/Alaska
Native 74.2 67.5 10.4! 2.8! 15.9 7.9!
! Interpret data with caution.NOTE: These data only report the percentage of students who earned credit for each course while in high school and do not count those students who took these courses before entering high school. Race categories exclude persons of Hispanic ethnicity. SOURCE: U.S. Department of Education, National Center for Education Statistics, High School Transcript Study (HSTS), 1998, 2000, and 2005.

Status and Trends in the Education of Racial and Ethnic Groups72
ind
icat
or
13 —
mat
hem
atic
s an
d s
cien
ce C
our
seta
king
in H
igh
sch
oo
lfigure 13a. Percentage of high school graduates who completed selected mathematics courses, by
race/ethnicity: 1998 and 2005
! Interpret data with caution. NOTE: These data only report the percentage of students who earned credit for each course while in high school and do not count those students who took these courses before entering high school. Race categories exclude persons of Hispanic ethnicity. SOURCE: U.S. Department of Education, National Center for Education Statistics, High School Transcript Study (HSTS), 1998 and 2005.
■ 1998 ■ 2005
American Indian/Alaska Native
Asian/Pacific Islander
Hispanic
Black
White
American Indian/Alaska Native
Asian/Pacific Islander
Hispanic
Black
White
American Indian/Alaska Native
Asian/Pacific Islander
Hispanic
Black
White
Course and race/ethnicity
Geometry
Algebra II
Calculus
1009080706050
Percent
403020100
8!6!
3018
66
67
1512
6847
7870
6348
6956
7165
7457
8676
8062
8572
8378

Status and Trends in the Education of Racial and Ethnic Groups 73
Chap
ter 3 — A
chievement
13.2. Science Coursetaking
A higher percentage of 2005 high school graduates than 1998 graduates completed chemistry and/or physics while in high school. Higher percentages of 2005 graduates who were White, Black, Hispanic, and Asian/Pacific Islander had completed a chemistry course than had 1998 graduates from those racial/ethnic groups. In addition, a higher percentage of White graduates had completed physics in 2005 than in 1998. The percentage of 2005 graduates who had completed both a biology and a chemistry course was higher than the percentage of 1998 graduates who had completed both courses, and this held true for White, Black, Hispanic, and Asian/Pacific Islander graduates. The percentage of 2005 graduates who had completed courses in all three subjects—biology, chemistry, and physics—did not differ measurably from 1998.
In 2005, a higher percentage of Asian/Pacific Islander graduates had completed a chemistry course than had White, Black, Hispanic, and American Indian/Alaska Native graduates. This pattern was also true for physics. Asian/Pacific Islander students had the highest percentages of graduates who completed courses in both biology and chemistry (75 percent) and who completed courses in biology, chemistry, and physics (43 percent). There was a 29 percentage point difference between Asians/Pacific Islanders who took biology, chemistry, and physics and American Indians/Alaska Natives who did so, a 24 percentage point difference between Asians/Pacific Islanders and Hispanics who did so, a 22 point difference between Asians/Pacific Islanders and Blacks who did so, and a 14 percentage point difference between Asians/Pacific Islanders and Whites who did so.
table 13b. Percentage of high school graduates who completed selected science courses in high school, by race/ethnicity: 1998, 2000, and 2005
Year and race/ethnicity Biology Chemistry PhysicsBiology and
chemistry
Biology, chemistry,
and physics
1998total 92.7 60.4 28.8 59.0 25.4
White 93.7 63.2 30.7 62.0 27.6Black 92.8 54.3 21.4 53.0 17.4Hispanic 86.5 46.1 18.9 43.7 15.9Asian/Pacific Islander 92.9 72.4 46.4 69.5 40.2American Indian/Alaska Native 91.3 46.9 16.2 43.2 14.2
2000 total 91.2 62.0 31.4 59.4 25.1
White 91.8 63.0 32.4 60.3 25.7Black 92.3 59.9 25.2 58.0 20.1Hispanic 89.7 52.4 23.2 50.4 17.6Asian/Pacific Islander 88.3 75.4 54.0 71.1 47.2American Indian/Alaska Native 88.4 43.6 17.5 39.4 11.9
2005total 92.3 66.2 32.7 64.3 27.3
White 92.6 67.1 34.6 65.3 29.0Black 93.6 63.6 25.8 62.0 21.3Hispanic 89.1 59.2 23.3 57.2 18.9Asian/Pacific Islander 92.1 79.4 49.9 75.5 42.8American Indian/Alaska Native 92.1 49.3 18.2 48.0 14.1
NOTE: These data only report the percentage of students who earned credit for each course while in high school and do not count those students who took these courses before entering high school. Race categories exclude persons of Hispanic ethnicity. SOURCE: U.S. Department of Education, National Center for Education Statistics, High School Transcript Study (HSTS), 1998, 2000, and 2005.

Status and Trends in the Education of Racial and Ethnic Groups74
ind
icat
or
13 —
mat
hem
atic
s an
d s
cien
ce C
our
seta
king
in H
igh
sch
oo
lfigure 13b. Percentage of high school graduates who completed selected science courses, by race/
ethnicity: 1998 and 2005
See notes at end of figure.
American Indian/Alaska Native
Asian/Pacific Islander
Hispanic
Black
White
Physics
American Indian/Alaska Native
Asian/Pacific Islander
Hispanic
Black
White
Course and race/ethnicity
Chemistry
1816
5046
2319
2621
3531
4947
7972
5946
6454
6763
■ 1998 ■ 2005
1009050
Percent
60403020100 70 80

Status and Trends in the Education of Racial and Ethnic Groups 75
Chap
ter 3 — A
chievement
Figure 13b. Percentage of high school graduates who completed selected science courses, by race/ethnicity: 1998 and 2005—Continued
NOTE: These data only report the percentage of students who earned credit for each course while in high school and do not count those students who took these courses before entering high school. Race categories exclude persons of Hispanic ethnicity. SOURCE: U.S. Department of Education, National Center for Education Statistics, High School Transcript Study (HSTS), 1998 and 2005.
■ 1998 ■ 2005
American Indian/Alaska Native
Asian/Pacific Islander
Hispanic
Black
White
Biology,Chemistry,
and Physics
American Indian/Alaska Native
Asian/Pacific Islander
Hispanic
Black
White
Biology andChemistry
1009050
Percent
60403020100 70 80
1414
4340
1916
2117
2928
4843
7569
5744
6253
6562
Course and race/ethnicity

Status and Trends in the Education of Racial and Ethnic Groups76
ind
icat
or
14 —
Ad
vanc
ed P
lace
men
t (A
P) C
our
ses
In 2008, a total of 12,323 U.S. public high schools offered Advanced Placement (AP) courses to their graduating classes (The College Board 2008). Students who take AP courses in high school are eligible to take AP exams and may earn college credit for scores above a minimum threshold. Currently, 37 AP exams are offered, and a school that offers the AP program offers 10 different AP courses, on average. Students who complete AP courses may be better prepared for college than their peers and could potentially complete their college degrees in a shorter time period.
In 2008, over 1.5 million students in the United States took at least one AP exam, a number that has more than doubled since 10 years ago. While the number of students taking an AP exam increased for all racial and ethnic groups, the largest relative increase in AP exam taking was among Black students. Just over 31,000 Black students participated in 1999, while more than 108,500 Black students participated in 2008. In addition, Hispanic student participation in AP exam taking has more than tripled over the same time period, increasing from 62,900 students to 209,700 students.
14. Advanced Placement (AP) Courses
table 14a. number and percent change in the number of students taking Advanced Placement (AP) examinations, by race/ethnicity: 1999–2008
Year Total1 White Black Hispanic Asian
American Indian/Alaska
Native
1999 685,981 445,880 31,023 62,853 75,875 3,1362000 747,922 504,600 36,158 74,852 85,756 3,5842001 820,880 549,065 40,078 86,018 92,762 3,4722002 913,251 607,816 45,271 98,495 102,653 3,8962003 998,329 660,225 51,160 114,246 111,704 4,5302004 1,081,102 702,489 57,001 130,042 121,038 4,9742005 1,197,439 762,548 67,702 148,960 135,815 5,6542006 1,312,523 816,301 79,171 166,197 147,381 6,4492007 1,432,169 890,169 92,574 188,323 162,505 7,0842008 1,546,020 949,986 108,545 209,721 177,198 7,750Percent change
1999 to 2008 125.4 113.1 249.9 233.7 133.5 147.11 Total includes other race/ethnicity categories not separately shown. NOTE: Data reported are for all students who completed an Advanced Placement exam. The College Board collects racial/ethnic information based on the following categories: American Indian/Alaskan, Asian/Asian American, Black/Afro-American, Latino (Chicano/Mexican, Puerto Rican, Other Latino), White, and Other. Black refers to test-takers who identified themselves as Black/Afro-American, and Hispanic refers to the sum of all Latino subgroups. Race categories exclude persons of Hispanic ethnicity.SOURCE: The College Board, Advanced Placement Program, National Summary Report, 1999–2008.

Status and Trends in the Education of Racial and Ethnic Groups 77
Chap
ter 3 — A
chievement
AP examinations are scored on a scale from 1 to 5, with a 5 being the highest. The College Board considers a student to have been “successful” on an exam if he or she receives a 3 or higher. In 2008, the average score across all exams was a 2.83, with 57 percent of all test scores being a 3 or higher. The
highest mean score was attained by Asian students (3.08), followed by White (2.96), Hispanic (2.42), American Indian/Alaska Native (2.39), and Black students (1.91). Some 26 percent of Black students received a score of 3 or higher, compared with 64 percent of Asian students.
figure 14. Percentage distribution of grades on all Advanced Placement (AP) exams, by race/ethnicity: 2008
NOTE: The grades for all AP examinations range from 1 to 5, with 5 being the highest score. Data reported are for all students who completed an Advanced Placement exam. The College Board collects racial/ethnic information based on the following categories: American Indian/Alaskan, Asian/Asian American, Black/Afro-American, Latino (Chicano/Mexican, Puerto Rican, Other Latino), White, and Other. Black refers to test-takers who identified themselves as Black/Afro-American, and Hispanic refers to the sum of all Latino subgroups. Race categories exclude persons of Hispanic ethnicity. SOURCE: The College Board, Advanced Placement Program, National Summary Report, 2008.
■ 1 ■ 2 ■ 3 ■ 4 ■ 5
American Indian/Alaska Native
Asian
Hispanic
Black
White
Race/ethnicity
1009080706050
Percent
403020100
28 61429
2021231917
101434 24
3848 1526
Percent of all exams scoring 3 or above: 57%
21 14212716
19
23
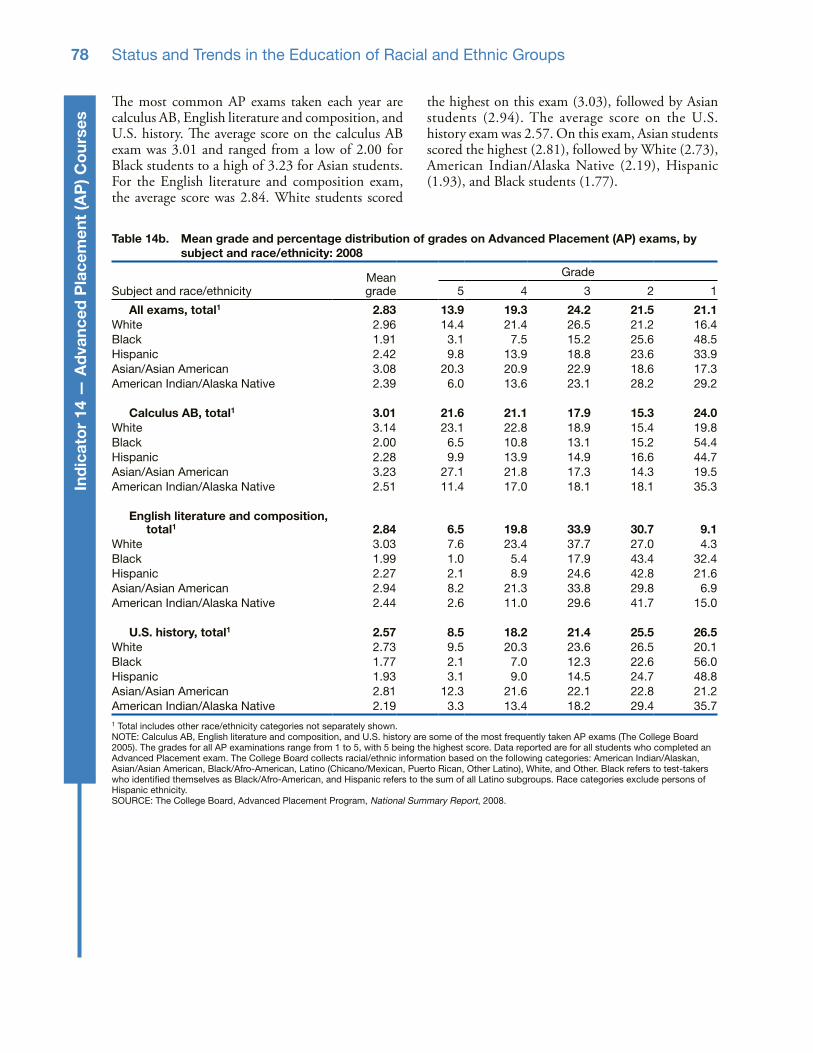
Status and Trends in the Education of Racial and Ethnic Groups78
ind
icat
or
14 —
Ad
vanc
ed P
lace
men
t (A
P) C
our
ses
The most common AP exams taken each year are calculus AB, English literature and composition, and U.S. history. The average score on the calculus AB exam was 3.01 and ranged from a low of 2.00 for Black students to a high of 3.23 for Asian students. For the English literature and composition exam, the average score was 2.84. White students scored
the highest on this exam (3.03), followed by Asian students (2.94). The average score on the U.S. history exam was 2.57. On this exam, Asian students scored the highest (2.81), followed by White (2.73), American Indian/Alaska Native (2.19), Hispanic (1.93), and Black students (1.77).
table 14b. mean grade and percentage distribution of grades on Advanced Placement (AP) exams, by subject and race/ethnicity: 2008
Subject and race/ethnicityMean grade
Grade
5 4 3 2 1
All exams, total1 2.83 13.9 19.3 24.2 21.5 21.1White 2.96 14.4 21.4 26.5 21.2 16.4Black 1.91 3.1 7.5 15.2 25.6 48.5Hispanic 2.42 9.8 13.9 18.8 23.6 33.9Asian/Asian American 3.08 20.3 20.9 22.9 18.6 17.3American Indian/Alaska Native 2.39 6.0 13.6 23.1 28.2 29.2
Calculus AB, total1 3.01 21.6 21.1 17.9 15.3 24.0White 3.14 23.1 22.8 18.9 15.4 19.8Black 2.00 6.5 10.8 13.1 15.2 54.4Hispanic 2.28 9.9 13.9 14.9 16.6 44.7Asian/Asian American 3.23 27.1 21.8 17.3 14.3 19.5American Indian/Alaska Native 2.51 11.4 17.0 18.1 18.1 35.3
English literature and composition, total1 2.84 6.5 19.8 33.9 30.7 9.1
White 3.03 7.6 23.4 37.7 27.0 4.3Black 1.99 1.0 5.4 17.9 43.4 32.4Hispanic 2.27 2.1 8.9 24.6 42.8 21.6Asian/Asian American 2.94 8.2 21.3 33.8 29.8 6.9American Indian/Alaska Native 2.44 2.6 11.0 29.6 41.7 15.0
u.s. history, total1 2.57 8.5 18.2 21.4 25.5 26.5White 2.73 9.5 20.3 23.6 26.5 20.1Black 1.77 2.1 7.0 12.3 22.6 56.0Hispanic 1.93 3.1 9.0 14.5 24.7 48.8Asian/Asian American 2.81 12.3 21.6 22.1 22.8 21.2American Indian/Alaska Native 2.19 3.3 13.4 18.2 29.4 35.71 Total includes other race/ethnicity categories not separately shown. NOTE: Calculus AB, English literature and composition, and U.S. history are some of the most frequently taken AP exams (The College Board 2005). The grades for all AP examinations range from 1 to 5, with 5 being the highest score. Data reported are for all students who completed an Advanced Placement exam. The College Board collects racial/ethnic information based on the following categories: American Indian/Alaskan, Asian/Asian American, Black/Afro-American, Latino (Chicano/Mexican, Puerto Rican, Other Latino), White, and Other. Black refers to test-takers who identified themselves as Black/Afro-American, and Hispanic refers to the sum of all Latino subgroups. Race categories exclude persons of Hispanic ethnicity. SOURCE: The College Board, Advanced Placement Program, National Summary Report, 2008.

Status and Trends in the Education of Racial and Ethnic Groups 79
Chap
ter 3 — A
chievement
In 2008, Hispanic students in the United States took about 338,700 AP exams. The most common exam taken by Hispanic students, Spanish language, had the highest average scores for each Hispanic subgroup—3.69 for both Mexican American students and Other Hispanic students, and 3.27 for Puerto Rican students. In addition to the 57,200 Spanish language exams they completed, students of Hispanic ethnicity also completed about 40,300 exams in English language and composition and approximately 39,400 exams in U.S. history in 2008.18 Puerto Rican students had the highest average score of the Hispanic subgroups on four of the five most commonly taken AP exams—biology, calculus AB, English language and composition, and U.S. history.
snapshot of Hispanic subgroups: Advanced Placement
18 English language and composition and U.S. history exams represented approximately 12 percent each of the exams taken by Hispanic students. In comparison, 12 percent of all AP exams taken in 2008 were English language and composition and 11 percent were U.S. history.
table 14c. number of exams taken and mean grade on Advanced Placement (AP) exams, by Hispanic subgroup and subject: 2008
Subject
Mexican American Puerto Rican Other Hispanic
Exams taken Mean grade Exams taken Mean grade Exams taken Mean grade
total1 161,410 2.38 20,260 2.39 157,064 2.47Biology 6,116 1.73 1,040 2.06 6,472 1.99Calculus AB 9,980 2.13 1,168 2.55 8,682 2.41Calculus BC 1,604 2.76 205 3.43 1,909 3.18Chemistry 3,359 1.75 520 2.22 3,422 2.11English language and
composition 19,915 2.13 2,278 2.47 18,097 2.27English literature and
composition 16,346 2.20 2,552 2.39 16,437 2.33Human geography 1,376 2.03 590 1.80 2,726 2.17Psychology 4,346 2.36 1,065 2.52 6,932 2.59Spanish language 30,981 3.69 1,897 3.27 24,280 3.69Spanish literature 6,780 2.66 199 2.59 5,039 2.78U.S. history 19,569 1.85 2,526 2.12 17,277 1.98World history 7,835 1.86 1,172 2.11 7,913 2.021 Totals include other subjects not separately shown.NOTE: Data reported are for all students who completed an Advanced Placement exam. The College Board collects racial/ethnic information based on the following categories: American Indian/Alaskan, Asian/Asian American, Black/Afro-American, Latino (Chicano/Mexican, Puerto Rican, Other Latino), White, and Other.SOURCE: The College Board, Advanced Placement Program, National Summary Report, 2008.

Status and Trends in the Education of Racial and Ethnic Groups80
ind
icat
or
15 —
Co
lleg
e E
ntra
nce
Exa
ms
Many colleges and universities in the United States require students to submit standardized assessment scores from either the SAT or ACT as part of their applications (Snyder, Dillow, and Hoffman 2009, table 326). Of the class that graduated from high school in 2008, 1.5 million students took the SAT and 1.4 million students took the ACT (SAT 2008 and ACT 2008). While overall more students are taking these examinations, differences remain across racial/ethnic groups in both SAT and ACT results. Compared with previous years, in 2008, White students represented a lower percentage of SAT test-takers (60 percent) and ACT test-takers (68 percent).
15.1. SAT Results
The population of SAT test-takers is becoming more diverse. Over the last decade, Black students have consistently represented 11–12 percent of high school graduates who took the SAT. Hispanic students, however, represented 13 percent of total test-takers in 2008, up from 9 percent in 1998. The percentage of Asian/Pacific Islander test-takers also increased, from 9 percent in 1998 to 11 percent in 2008.
15. College Entrance Exams
table 15.1a. Percentage distribution of the 12th-grade sAt test-taking population, by race/ethnicity: 1998–2008
Race/ethnicity 1998 1999 2000 2001 2002 2003 2004 2005 2006 2007 2008
total1 100.0 100.0 100.0 100.0 100.0 100.0 100.0 100.0 100.0 100.0 100.0White 67.1 66.8 66.4 65.5 65.0 63.8 62.7 62.3 62.1 60.8 59.8Black 10.9 11.1 11.1 11.2 11.4 12.0 12.0 11.6 11.3 12.0 12.1Hispanic 8.6 8.8 9.1 9.4 9.7 10.2 10.7 10.9 11.4 12.0 13.2Asian/Pacific Islander 9.0 8.9 9.0 9.5 9.6 9.6 9.8 10.2 10.4 10.0 10.5American Indian/Alaska
Native 1.0 0.8 0.7 0.7 0.7 0.7 0.7 0.7 0.7 1.0 0.71 Total includes other races/ethnicities not separately shown; therefore, detail may not sum to 100. NOTE: Test-takers were asked to self-identify a single racial/ethnic group. The categories “Mexican American,” “Puerto Rican,” and “Other Hispanic/Latino” are combined into the category “Hispanic” for this table. Race categories exclude persons of Hispanic ethnicity. SOURCE: The College Board, College Bound Seniors, 1998–2008.

Status and Trends in the Education of Racial and Ethnic Groups 81
Chap
ter 3 — A
chievement
figure 15.1a. Percentage distribution of the 12th-grade sAt test-taking population, by race/ethnicity: 1998 and 2008
NOTE: Test-takers were asked to self-identify a single racial/ethnic group. Race categories exclude persons of Hispanic ethnicity. SOURCE: The College Board, College Bound Seniors, 1998 and 2008.
■ 1998 ■ 2008
White Black Hispanic
Race/ethnicity
Asian/PacificIslander
American Indian/Alaska Native
0
10
20
30
40
50
60
70
80
90
100
Percent
6760
11 129
139 11
1 1

Status and Trends in the Education of Racial and Ethnic Groups82
ind
icat
or
15 —
Co
lleg
e E
ntra
nce
Exa
ms
The SAT includes a critical reading section and a mathematics section, each scored on a scale ranging from 200 to 800 points.19,20 In 2008, the overall average score on the critical reading section was 502, with White students having the highest average of any racial/ethnic group (528). Asian/Pacific Islander students had the second highest average critical reading score (513), followed by American Indian/Alaska Native (485), Puerto Rican (456), Other Hispanic/Latino (455), Mexican American (454), and Black students (430).
The overall average score on the critical reading section has declined over the last decade from 505 to 502, yet many of the racial/ethnic groups have not followed the pattern. White, Mexican American, Puerto Rican, Asian/Pacific Islander, and American Indian/Alaska Native students each had higher average critical reading scores in 2008 than in 1998. Black students’ average critical reading score declined from 434 in
1998 to 430 in 2008, and Other Hispanic/Latino students’ average score declined from 461 to 455 during this time period.
Although the critical reading and mathematics sections have the same score range, in general, average scores were higher on the mathematics section. The overall average score on the mathematics section was 515 in 2008. Asian/Pacific Islander students had the highest mathematics average in 2008 (581), which was higher than the averages of White (537), American Indian/Alaska Native (491), Mexican American (463), Other Hispanic/Latino (461), Puerto Rican (453), and Black (426) students. Although Asian/Pacific Islander and White students improved their mathematics scores from 2006 to 2008 (by 3 points and 1 point, respectively), the performance of all other racial/ethnic groups shown declined by 1 to 3 points.
table 15.1b. Average sAt scores for the 12th-grade sAt test-taking population, by race/ethnicity and subject: selected years, 1998–2008
Subject and year Total1 White Black
Mexican American
Puerto Rican
Other Hispanic/
Latino
Asian/ Pacific
Islander
American Indian/ Alaska Native
Critical Reading1998 505 526 434 453 452 461 498 4802000 505 528 434 453 456 461 499 4822002 504 527 430 446 455 458 501 4792004 508 528 430 451 457 461 507 4832006 503 527 434 454 459 458 510 4872008 502 528 430 454 456 455 513 485
Mathematics1998 512 528 426 460 447 466 562 4832000 514 530 426 460 451 467 565 4812002 516 533 427 457 451 464 569 4832004 518 531 427 458 452 465 577 4882006 518 536 429 465 456 463 578 4942008 515 537 426 463 453 461 581 491
Writing2006 497 519 428 452 448 450 512 4742007 494 518 425 450 447 450 513 4732008 494 518 424 447 445 448 516 4701 Total includes other race/ethnicity categories not separately shown.NOTE: Data are for seniors who took the SAT any time during high school (through March of their senior year). If a student took a test more than once, the most recent score was used. The SAT was formerly known as the Scholastic Assessment Test and the Scholastic Aptitude Test. Possible scores on each part of the SAT range from 200 to 800. The critical reading section was formerly known as the verbal section. The writing section was introduced in March 2005; however, the first aggregate data on the writing section was reported in 2006. Test-takers were asked to self-identify a single racial/ethnic group. Race categories exclude persons of Hispanic ethnicity.SOURCE: The College Board, College Bound Seniors, selected years, 1998–2008.
19 The critical reading section of the exam includes sentence completions, passage-based reading, and analogies that measure extended reasoning, literal comprehension, and vocabulary in context. The mathematics section of the exam includes multiple-choice items, student-produced responses, and quantitative comparisons. 20 In 2006, the SAT introduced a new writing section, but results are not discussed in this indicator.

Status and Trends in the Education of Racial and Ethnic Groups 83
Chap
ter 3 — A
chievement
figure 15.1b. Average sAt scores for the 12th-grade sAt test-taking population, by subject and race/ethnicity: 2008
NOTE: Data are for seniors who took the SAT any time during their high school years through March of their senior year. If a student took a test more than once, the most recent score was used. The SAT was formerly known as the Scholastic Assessment Test and the Scholastic Aptitude Test. Possible scores on each part of the SAT range from 200 to 800. The critical reading section was formerly known as the verbal section. Test-takers were asked to self-identify a single racial/ethnic group. Race categories exclude persons of Hispanic ethnicity. SOURCE: The College Board, College Bound Seniors, 2008.
■ White ■ Black ■ Mexican ■ Puerto Rican ■ Other Hispanic/ ■ Asian/Pacific ■ American Indian/ American Latino Islander Alaska Native
Subject
0 100 200 300 400
Score
500 600 700 800
CriticalReading
513
455
456
454
430
528
Mathematics
491
581
461
453
463
426
537
Writing
470
516
448
445
447
424
518

Status and Trends in the Education of Racial and Ethnic Groups84
Ind
icat
or
15 —
Co
lleg
e E
ntra
nce
Exa
ms
15.2. ACT Results
The ACT consists of four sections: English, mathematics, reading, and science. Scores for each section range from 0 to 36. The ACT calculates composite scores for each section that indicate a minimal readiness for college (Allen and Scoming 2005).
Similar to the SAT, the race/ethnicity mix of ACT test-takers has changed over the past decade. Black students represented 14 percent of the test-takers in 2008, up from 11 percent in 1998. Similarly, the percent of test-takers that were Hispanic increased from 6 percent in 1998 to 9 percent in 2008.
Figure 15.2a. Percentage distribution of ACT test-taking population, by race/ethnicity: 1998 and 2008
NOTE: Estimates are based on all students who took the ACT assessment during their sophomore, junior, or senior year, and who graduated from high school in the spring of the respective year shown. If a student tested more than once, only his/her most recent test record was used. Test-takers were asked to self-identify a single racial/ethnic group. Race categories exclude persons of Hispanic ethnicity. SOURCE: American College Testing Program, ACT National Scores Report, 1998 and 2008.
■ 1998 ■ 2008
White Black Hispanic
Race/ethnicity
Asian/Pacific Islander
American Indian/Alaska Native
0
10
20
30
40
50
60
70
80
90
100Percent
76
68
11 14
6 93 4 1 1
Table 15.2a. Percentage distribution of ACT test-taking population, by race/ethnicity: 1998–2008
Race/ethnicity 1998 1999 2000 2001 2002 2003 2004 2005 2006 2007 2008
Total1 100.0 100.0 100.0 100.0 100.0 100.0 100.0 100.0 100.0 100.0 100.0White 76.1 76.1 75.6 75.2 74.2 73.3 72.4 71.2 69.9 68.8 68.3Black 10.8 10.8 11.0 11.1 11.5 11.8 12.1 12.7 12.8 13.5 13.6Hispanic 5.6 5.5 5.7 5.9 6.4 6.9 7.2 7.6 7.9 8.2 8.7Asian/Pacific Islander 3.3 3.5 3.5 3.6 3.5 3.6 3.6 3.6 3.7 3.7 3.9American Indian/Alaska
Native 1.2 1.1 1.1 1.1 1.1 1.1 1.1 1.2 1.3 1.2 1.11 Includes other race/ethnicity categories not separately shown; therefore, detail may not sum to 100.NOTE: Estimates are based on all students who took the ACT assessment during their sophomore, junior, or senior year, and who graduated from high school in the spring of the respective year shown. Test-takers were asked to self-identify a single racial/ethnic group. Race categories exclude persons of Hispanic ethnicity. SOURCE: American College Testing Program, ACT National Scores Report, 1998–2008.

Status and Trends in the Education of Racial and Ethnic Groups 85
Chap
ter 3 — A
chievement
ACT English scores have fluctuated over time. In English, the overall average score decreased from 20.4 in 1998 to 20.2 in 2002 and then increased to 20.6 in 2008. The racial/ethnic groups whose scores in 2008 were not higher than their scores in 1998 were Black students (16.4 in 1998 and 16.1 in 2008) and American Indian/Alaska Native students (18.1 in both years).
ACT mathematics scores also decreased between 1998 and 2002 and then increased between 2002 and 2008 for each race/ethnicity group. The largest overall gain made during this time period was for Asian/Pacific Islander students. Their average score was 0.7 points higher in 2008 than it was in 1998 (24.1 and 23.4, respectively).
table 15.2b. Average ACt scores in English and mathematics, by race/ethnicity: selected years, 1998–2008
Year Total1 White Black HispanicMexican
American
Puerto Rican/ Other
Hispanic
Asian/ Pacific
Islander
American Indian/ Alaska Native
English1998 20.4 21.2 16.4 — 17.5 18.7 20.5 18.12000 20.5 21.3 16.4 — 17.6 18.7 20.5 18.02002 20.2 21.2 16.2 — 17.1 17.9 20.5 17.62004 20.4 21.4 16.3 — 17.3 17.9 21.0 17.82006 20.6 21.7 16.3 — 17.4 18.1 21.5 17.82008 20.6 21.7 16.1 17.7 — — 22.1 18.1
Mathematics1998 20.8 21.4 16.9 — 18.6 19.7 23.4 18.62000 20.7 21.3 16.8 — 18.7 19.5 23.2 18.52002 20.6 21.3 16.7 — 18.4 18.9 22.9 18.42004 20.7 21.4 16.9 — 18.5 18.9 23.0 18.62006 20.8 21.6 17.0 — 18.7 19.1 23.4 18.62008 21.0 21.8 17.0 19.0 — — 24.1 18.8
— Not available.1 Includes students who did not report their race/ethnicity.NOTE: Scores for both English and mathematics range from 0 to 36. Some data have been revised from previously published figures. Estimates are based on all students who took the ACT assessment during their sophomore, junior or senior year, and who graduated from high school in the spring of the respective year shown. Test-takers were asked to self-identify a single racial/ethnic group. Race categories exclude persons of Hispanic ethnicity. SOURCE: American College Testing Program, ACT National Scores Reports, selected years, 1998–2008.

Status and Trends in the Education of Racial and Ethnic Groups86
ind
icat
or
15 —
Co
lleg
e E
ntra
nce
Exa
ms
The ACT benchmarking scores provide insight as to the college preparedness of high school seniors who took the ACT. For each subject area, benchmarking scores reflect the average score associated with a 50 percent likelihood of obtaining a “B,” or a 75 percent likelihood of obtaining a “C” in a corresponding college course. In 2008, about 22 percent of the ACT test-takers met the college readiness benchmark in all four subjects. About one-third of Asian/Pacific Islander test-takers met all four benchmarks, compared to 3 percent of Black test-takers.
The highest college readiness rate was in English and the lowest was in science (68 percent vs. 28 percent). In all four subjects, Black test-takers had the lowest readiness rates. White test-takers had the highest readiness rates in English and reading (77 percent and 61 percent, respectively), while Asians/Pacific Islanders had the highest readiness rates in mathematics and science (63 percent and 38 percent, respectively).
table 15.2c. Percentage of ACt test-taking population meeting college readiness benchmark scores, by race/ethnicity: 2008
Race/ethnicity All four
English (benchmark
score: 18)
Mathematics (benchmark
score: 22)
Reading (benchmark
score: 21)
Science (benchmark
score: 24)
total1 22 68 43 53 28White 27 77 49 61 33Black 3 37 11 21 5Hispanic 10 49 26 35 13Asian/Pacific Islander 33 75 63 59 38American Indian/Alaska
Native 11 52 25 40 161 Includes students who did not report their race/ethnicity. NOTE: College readiness benchmark scores are based on the actual performance of college students and are the minimum ACT subject-area scores associated with a 50 percent chance of earning at least a B or a 75 percent chance of earning at least a C in corresponding college classes. English scores predict performance in English composition, mathematics scores predict performance in algebra, reading scores predict performance in social sciences, and science scores predict performance in biology. Estimates are based on all students who took the ACT assessment during their sophomore, junior, or senior year, and who graduated from high school in the spring of 2008. Test-takers were asked to self-identify a single racial/ethnic group. Race categories exclude persons of Hispanic ethnicity. SOURCE: American College Testing Program, ACT National Scores Report, 2008.

Status and Trends in the Education of Racial and Ethnic Groups 87
Chap
ter 3 — A
chievement
figure 15.2b. Percentage of ACt test-taking population meeting college readiness benchmark scores, by race/ethnicity, 2008
NOTE: College readiness benchmark scores are based on the actual performance of college students and are the minimum ACT subject-area scores associated with a 50 percent chance of earning at least a B or a 75 percent chance of earning at least a C in corresponding college classes. English scores predict performance in English composition, mathematics scores predict performance in algebra, reading scores predict performance in social sciences, and science scores predict performance in biology. Estimates are based on all students who took the ACT assessment during their sophomore, junior, or senior year, and who graduated from high school in the spring of 2008. Test-takers were asked to self-identify a single racial/ethnic group. Race categories exclude persons of Hispanic ethnicity. SOURCE: American College Testing Program, ACT National Scores Report, 2008.
■ White ■ Black ■ Hispanic ■ Asian/Pacific Islander ■ American Indian/Alaska Native
Subject area
1009080706050
Percent
403020100
Science
1638
135
33
Reading
4059
3521
61
Mathematics
2563
2611
49
English
5275
4937
77
All four
1133
103
27

This page intentionally left blank.

Chapter 4 looks at three measures of student persistence in school. Indicator 16 examines student absences from school. Among eighth-graders in 2009, Asians/Pacific Islanders had the highest percentage of students who had no absences in the month prior to the survey, while American Indians/Alaska Natives had the highest percentage of students who had missed 3 or more days. Generally, a higher percentage of students who had not missed school scored at or above the Basic achievement level on the NAEP mathematics assessment than students who had been absent.
Indicator 17 examines rates of retention, suspension, and expulsion. In 2007, a higher percentage of Black students than students of any other race/ethnicity in grades 6 through 12 had been suspended from school at some point in their school career. Additionally, a higher percentage of Black students than White, Hispanic, or Asian students in kindergarten through grade 12 had been retained in a grade. Overall rates of retention, suspension, and expulsion were higher for males than females.
Indicator 18 discusses high school status dropout rates and graduation rates. Between 1997 and 2007, the percentage of 16- to 24-year-olds who were high school status dropouts, meaning they were not enrolled in school and had not earned a high school credential (either a diploma or equivalency credential, such as a General Education Development [GED] certificate), decreased from 11 percent to 9 percent. In 2007, Hispanics had a higher percentage of status dropouts (21 percent) than did Blacks, Whites, and Asians/Pacific Islanders, and Blacks and American Indians/Alaska Natives had higher percentages than did Whites and Asians/Pacific Islanders (indicator 18.1). For each year between 1997 and 2007, males had a higher status dropout rate than females. This indicator also examines the averaged freshman graduation rate (AFGR), which is an estimate of the percentage of a freshman class that receives a regular high school diploma within 4 years of entering high school. Of the students that entered high school in the 2002–03 school year, some 74 percent graduated within 4 years (indicator 18.2). The AFGR was higher for White and Asian/Pacific Islander students than for Black, Hispanic, and American Indian/Alaska Native students.
4 PErsistEnCE

Status and Trends in the Education of Racial and Ethnic Groups90
ind
icat
or
16 —
Ab
senc
es Children who are frequently absent from school may experience academic difficulties and are less likely to complete school if no intervention takes place (DeSocio et al. 2007). Examining school absences by racial/ethnic group may reveal racial/ethnic differences in the percentages of students who are at risk academically.
In 2009, about 63 percent of Asian/Pacific Islander 8th-grade students reported zero absences from school in the preceding month, while 35 percent of American Indian/Alaska Native 8th-grade students reported no absences. Asians/Pacific Islanders had the lowest percentage of students who had missed 3 or more days of school (11 percent), while American Indians/Alaska Natives had the highest (28 percent). Higher percentages of Black (23 percent) and Hispanic students (22 percent) had missed 3
or more days than was the case for White students (19 percent).
Examining students’ school attendance and their scores on the National Assessment of Educational Progress (NAEP) mathematics assessment sheds light on the link between absences and achievement (see indicator 11.2 for more information on the NAEP mathematics assessment). Students with fewer absences were more likely to score at or above Basic on the NAEP mathematics assessment. For 8th-graders overall, 78 percent of students who had no absences in the past month scored at or above Basic, whereas 74 percent of those with one or two absences and 60 percent of those with three or more absences scored at or above Basic. This pattern held true for most racial/ethnic groups.21
16. Absences
21 There was one exception to this pattern: the percentage of American Indian/Alaska Native students with no absences who scored at or above Basic was not measurably different from the percentage with one or two absences who scored at or above Basic.
table 16. Percentage distribution of 8th-graders and percentage at or above Basic on the national Assessment of Educational Progress (nAEP) mathematics assessment, by the number of days absent from school in the past month and race/ethnicity: 2009
Race/ethnicity Total No absences1–2
absences3 or more absences
Percentage distributiontotal1 100 45 35 20
White 100 44 37 19Black 100 45 32 23Hispanic 100 45 34 22Asian/Pacific Islander 100 63 26 11American Indian/Alaska Native 100 35 36 28
Percentage at or above Basictotal1 73 78 74 60
White 83 87 84 73Black 50 56 50 38Hispanic 57 63 58 44Asian/Pacific Islander 85 89 84 68American Indian/Alaska Native 56 64 59 431 Total includes other race/ethnicity categories not separately shown.NOTE: Race categories exclude persons of Hispanic ethnicity. Detail may not sum to totals because of rounding. SOURCE: U.S. Department of Education, National Center for Education Statistics, National Assessment of Educational Progress (NAEP), 2009 Mathematics Assessment, retrieved November 18, 2009, from the NAEP Data Explorer (http://nces.ed.gov/nationsreportcard/nde).

Status and Trends in the Education of Racial and Ethnic Groups 91
Chap
ter 4 — P
ersistencefigure 16. Percentage of 8th-graders at or above Basic on the national Assessment of Educational
Progress (nAEP) mathematics assessment, by race/ethnicity and number of days absent from school in the past month: 2009
NOTE: Race categories exclude persons of Hispanic ethnicity. SOURCE: U.S. Department of Education, National Center for Education Statistics, National Assessment of Educational Progress (NAEP), 2009 Mathematics Assessment, retrieved November 18, 2009, from the NAEP Data Explorer (http://nces.ed.gov/nationsreportcard/nde).
■ No absences ■ 1–2 absences ■ 3 or more absences
White Black Hispanic
Race/ethnicity
Asian/Pacific Islander
American Indian/Alaska Native
0
10
20
30
40
50
60
70
80
90
100Percent
87 84
73
5650
38
6358
44
8984
6864
59
43

Status and Trends in the Education of Racial and Ethnic Groups92
ind
icat
or
17 —
ret
enti
on,
sus
pen
sio
n, a
nd E
xpul
sio
n Students may be retained in a grade if they lack the required academic or social skills to advance to the next grade. In 2007, some 11 percent of public school students in kindergarten through grade 12 had ever been retained (i.e., repeated a grade since starting school). Students in higher grades may also be suspended (temporarily removed from regular school activities either in or out of school) or expelled (permanently removed from school with no services) due to behavior problems. In 2007, some 22 percent of public school students in grades 6 through 12 had been suspended and 3 percent had been expelled.
In 2007, about 21 percent of Black students in kindergarten through grade 12 had been retained, a higher percentage than the percentages for White, Hispanic, or Asian students. The percentages of Hispanic students (12 percent) and students of two or more races (14 percent) who had been retained in a grade were higher than the percentages of White (9 percent) and Asian (3 percent) students who had been retained.
Of students in grades 6 through 12, a larger percentage of Black students (43 percent) had been suspended than White (16 percent), Hispanic (22 percent),
Asian (11 percent), American Indian/Alaska Native (14 percent) students, and students of two or more races (25 percent). Students of two or more races and Hispanic students had higher rates of suspension than the rates for White and Asian students. In addition, a higher percentage of Black students had been expelled (13 percent) than was the case for White students (1 percent), Hispanic students (3 percent), and students of two or more races (4 percent).
Differences exist between males and females when examining rates of retention, suspension, and expulsion. In 2007, about 14 percent of male students in kindergarten through grade 12 had repeated a grade, compared with 9 percent of female students. Additionally, for both Black and White students, a larger percentage of males than females had been retained. A similar pattern emerged for suspensions. Overall, the percentage of males in grades 6 through 12 who had been suspended was almost twice the percentage of females who had been suspended (28 vs. 15 percent) and the same ratio was observed for White and Hispanic males and females. Additionally, among students overall, the percentage of males in grades 6 through 12 who had been expelled was twice that of their female counterparts.
17. retention, suspension, and Expulsion
table 17a. Percentage of public school students in kindergarten through grade 12 who had ever repeated a grade, by sex and race/ethnicity: 2007
Race/ethnicity Total Male Female
total1 11.5 13.9 8.9White 8.7 11.2 6.1Black 20.9 25.6 15.3Hispanic 11.8 12.4 11.1Asian 3.5! 6.5! #American Indian/Alaska Native 13.0! ‡ ‡Two or more races 14.5 15.7 13.1
# Rounds to zero.! Interpret data with caution.‡ Reporting standards not met.1 Total includes other race/ethnicity categories not separately shown.NOTE: All data are based on parent reports. Reporting standards for Native Hawaiian and Other Pacific Islanders were not met; therefore, data for this group are not shown on the table. Race categories exclude persons of Hispanic ethnicity.SOURCE: U.S. Department of Education, National Center for Education Statistics, Parent and Family Involvement in Education Survey of the National Household Education Surveys Program (NHES), 2007.

Status and Trends in the Education of Racial and Ethnic Groups 93
Chap
ter 4 — P
ersistence
Figure 17. Percentage of public school students in grades 6 through 12 who had ever been suspended, by race/ethnicity and sex: 2007
! Interpret data with caution. ‡ Reporting standards not met. NOTE: All data are based on parent reports. Reporting standards for Native Hawaiian and Other Pacific Islanders and American Indians or Alaska Natives were not met; therefore, data for those groups are not shown on the figure. Race categories exclude persons of Hispanic ethnicity. SOURCE: U.S. Department of Education, National Center for Education Statistics, Parent and Family Involvement in Education Survey of the National Household Education Surveys Program (NHES), 2007.
■ Male ■ Female
White Black Hispanic
Race/ethnicity
Asian Two or more races
0
10
20
30
40
50Percent
21
10
49
35
30
14
‡
15!
29
21
Table 17b. Percentage of public school students in grades 6 through 12 who had ever been suspended or expelled, by sex and race/ethnicity: 2007
Suspended Expelled
Race/ethnicity Total Male Female Total Male Female
Total1 21.6 27.9 14.9 3.4 4.5 2.3White 15.6 21.3 9.7 1.0 1.3 0.7!Black 42.8 49.5 34.7 12.8 16.6 8.2Hispanic 21.9 29.6 14.1 3.0! 3.1! 2.9!Asian 10.8! 14.9! ‡ ‡ ‡ ‡American Indian/Alaska Native 14.2! ‡ ‡ ‡ ‡ ‡Two or more races 25.5 29.2 20.5 3.7! 6.2! 0.3!
! Interpret data with caution.‡ Reporting standards not met.1 Total includes other race/ethnicity categories not separately shown.NOTE: All data are based on parent reports. Reporting standards for Native Hawaiian and Other Pacific Islanders were not met; therefore, data for this group are not shown on the table. Race categories exclude persons of Hispanic ethnicity.SOURCE: U.S. Department of Education, National Center for Education Statistics, Parent and Family Involvement in Education Survey of the National Household Education Surveys Program (NHES), 2007.

Status and Trends in the Education of Racial and Ethnic Groups94
ind
icat
or
18 —
Dro
po
ut r
ates
and
gra
dua
tio
n r
ates Young adults who do not finish high school are more
likely to be unemployed than those who complete high school and if they do find employment they may earn less than high school graduates. (see indicators 28 and 29). The status dropout rate represents the percentage of 16- to 24-year-olds who are not enrolled in school and have not earned a high school credential (either a diploma or an equivalency credential such as a General Educational Development [GED] certificate). In the first part of this indicator, status dropout rates are estimated using both the Current Population Survey (CPS) and the American Community Survey (ACS). The CPS provides several decades of historical trends on status dropouts that are not available from the ACS. However, the ACS allows for more detailed comparisons of status dropout rates by race/ethnicity and nativity. And unlike the CPS, the ACS includes institutionalized persons, such as those who are incarcerated.
The second part of this indicator provides estimates on the percentage of public school students who are graduating on time with a regular diploma. To do so, it uses the Averaged Freshman Graduation Rate—an estimate of the percentage of a freshman class that receives a regular diploma within four years of entering high school.
18.1. Dropouts
Between 1997 and 2007, the percentage of 16- to 24-year-olds who were status dropouts decreased from
11 to 9 percent. Status dropout rates and changes in these rates over time differ by race/ethnicity. In 1997, a higher percentage of Hispanics were status dropouts (25 percent) than were Blacks (13 percent), Whites (8 percent), Asians/Pacific Islanders (7 percent), and American Indians/Alaska Natives (15 percent). The percentages of Blacks and American Indians/Alaska Natives who were status dropouts were also higher than the respective percentages of Whites and Asians/Pacific Islanders. In 2007, a similar pattern was evident: a higher percentage of Hispanics were status dropouts (21 percent) than Blacks (8 percent), Asians/Pacific Islanders (6 percent), and Whites (5 percent), and the percentages of Blacks and American Indians/Alaska Natives (19 percent) who were status dropouts were higher than the percentages of Whites and Asians/Pacific Islanders who were status dropouts. No measurable differences in status dropout rates were found between Hispanics and American Indians/Alaska Natives in 2007.
In general, the status dropout rates for Whites, Blacks, and Hispanics declined between 1997 and 2007. However, for each year during that period, the status dropout rate was lower for Whites and Blacks than for Hispanics. The rate for Asians/Pacific Islanders was also lower than the rates for Hispanics and Blacks between 1997 and 2007. During that period, the gap between the status dropout rates of Blacks and Whites narrowed. While the gap between the status dropout rates of Hispanics and Whites was larger in 1998 than in 1997, this gap narrowed between 1998 and 2007.
18. Dropout rates and graduation rates

Status and Trends in the Education of Racial and Ethnic Groups 95
Chap
ter 4 — P
ersistencefigure 18.1. Percentage of 16- to 24-year-olds who were high school status dropouts, by race/ethnicity:
1997–2007
NOTE: The data presented here represent status dropout rates. The status dropout rate is the percentage of civilian, noninstitutionalized 16- to 24-year-olds who are not in high school and who have not earned a high school credential (either a diploma or equivalency credential such as a GED). It includes all dropouts, regardless of when they last attended school, as well as individuals who may have never attended school in the United States, such as immigrants who did not complete a high school diploma in their home country. The 1999 data for American Indians/Alaska Natives have been suppressed due to unstable estimates. Race categories exclude persons of Hispanic ethnicity. SOURCE: U.S. Department of Commerce, Census Bureau, Current Population Survey (CPS), October 1997–2007.
1997 1998 1999 2000 2001 2002
Year
2003 2004 2005 2006 20070
10
20
30
40
50Percent
� White � Black � Hispanic � Asian/Pacific Islander � American Indian/Alaska Native
�� � � � � � � � �
������������
� �� �� � � � � �
�
�� � � � �
� � � � �
��
� �� � �
� ��

Status and Trends in the Education of Racial and Ethnic Groups96
ind
icat
or
18 —
Dro
po
ut r
ates
and
gra
dua
tio
n r
ates
The decreases in status dropout rates that were found for males and females were similar to the decreases in overall status dropout rates. For example, status dropout rates were lower in 2007 than in 1997 for males (10 percent vs. 12 percent) and for females (8 percent vs. 10 percent). In addition, the rates varied by race/ethnicity for each sex. A higher percentage of Hispanic males (25 percent) were status dropouts than were Black males (8 percent) and White and Asian/Pacific Islander males (6 percent each) in 2007. Similarly, a higher percentage of Hispanic females (18 percent) were status dropouts than were Black (9 percent), White (4 percent), and Asian/Pacific Islander (6 percent) females. Overall, males had a higher status dropout rate than females for each year
between 1997 and 2007. In addition, in 2007, White and Hispanic males had higher status dropout rates (6 and 25 percent, respectively) than their female counterparts (4 and 18 percent, respectively).
Status dropout rates for White and Black males and White, Black, and Hispanic females declined between 1997 and 2007. Comparing rates in 1997 with those in 2007, there was no measurable change in the gap between White males and females or the gap between Black males and females. Despite apparent differences in the rates of Hispanic males and females, no measurable change in the gap was found between 1997 and 2007.

Status and Trends in the Education of Racial and Ethnic Groups 97
Chap
ter 4 — P
ersistencetable 18.1a. Percentage of 16- to 24-year-olds who were high school status dropouts, by race/ethnicity
and sex: 1997–2007
Year and sex Total White Black HispanicAsian/Pacific
Islander
American Indian/Alaska
Native
Total1997 11.0 7.6 13.4 25.3 6.9 14.51998 11.8 7.7 13.8 29.5 4.1 11.81999 11.2 7.3 12.6 28.6 4.3 ‡2000 10.9 6.9 13.1 27.8 3.8 14.02001 10.7 7.3 10.9 27.0 3.6 13.12002 10.5 6.5 11.3 25.7 3.9 16.82003 9.91 6.3 10.9 23.5 3.9 15.02004 10.31 6.8 11.8 23.8 3.6 17.02005 9.41 6.0 10.4 22.4 2.9 14.02006 9.31 5.8 10.7 22.1 3.6 14.72007 8.71 5.3 8.4 21.4 6.1 19.3
Male1997 11.9 8.5 13.3 27.0 5.9 12.2!1998 13.3 8.6 15.5 33.5 3.4! 9.0!1999 11.9 7.7 12.1 31.0 5.9 ‡2000 12.0 7.0 15.3 31.8 4.9 10.9!2001 12.2 7.9 13.0 31.6 5.4 10.3!2002 11.8 6.7 12.8 29.6 4.9 21.42003 11.31 7.1 12.5 26.7 5.5 17.4!2004 11.61 7.1 13.5 28.5 2.2! 12.6!2005 10.81 6.6 12.0 26.4 2.8! 16.62006 10.51 6.4 9.7 25.7 4.7 16.8!2007 9.81 6.0 8.0 24.7 5.8 21.4
Female1997 10.1 6.7 13.5 23.4 7.9 16.91998 10.3 6.9 12.2 25.0 4.8 14.4!1999 10.5 6.9 13.0 26.0 2.9! ‡2000 9.9 6.9 11.1 23.5 2.6! 17.8!2001 9.3 6.7 9.0 22.1 1.6! 14.92002 9.2 6.3 9.9 21.2 2.8! 12.72003 8.41 5.6 9.5 20.1 2.3! 12.7!2004 9.01 6.4 10.2 18.5 4.9 21.72005 8.01 5.3 9.0 18.1 3.0! 11.3!2006 8.51 5.3 11.7 18.1 2.5! 12.1!2007 7.71 4.5 8.8 18.0 6.4 17.6
‡ Reporting standards not met.! Interpret data with caution. 1 For 2003 through 2007, totals include other race/ethnicity categories not separately shown.NOTE: The data presented here represent status dropout rates. The status dropout rate is defined for this table as the percentage of civilian, noninstitutionalized 16- to 24-year-olds who are not in high school and who have not earned a high school credential (either a diploma or equivalency credential such as a GED). It includes all dropouts, regardless of when they last attended school, as well as individuals who may have never attended school in the United States, such as immigrants who did not complete a high school diploma in their home country. The 1999 data for American Indians/Alaska Natives have been suppressed due to unstable estimates. This table uses a different data source from table 18.1b. In addition, this table includes persons in the civilian, noninstitutionalized population, while tables 18.1b and 18.1c include institutionalized persons in addition to noninstitutionalized persons. Therefore, estimates are not directly comparable to the 2007 estimates in table 18.1b or 18.1c. Race categories exclude persons of Hispanic ethnicity.SOURCE: U.S. Department of Commerce, Census Bureau, Current Population Survey (CPS), October 1997–2007.

Status and Trends in the Education of Racial and Ethnic Groups98
ind
icat
or
18 —
Dro
po
ut r
ates
and
gra
dua
tio
n r
ates
The status dropout rate includes all 16- to 24-year-old dropouts, regardless of when they last attended school, as well as individuals who may never have attended school in the United States and who may never have earned a high school credential. Therefore, examining status dropout rates for those born within the United States (refers to the 50 states and the District of Columbia) may provide a more accurate measure of those who have attended U.S. schools. Based on data from the ACS, the status dropout rate in 2007 was higher for Hispanics born in the United States (11 percent) than for Whites (6 percent), Asians (2 percent), and Native Hawaiians or Other Pacific Islanders (6 percent) born in the United States. However, the status dropout rate for Hispanics born in the United States was lower than the rate for American Indians/Alaska Natives born in the United States, and no measurable differences were found between Hispanics and Blacks born in the United States.
Overall, the status dropout rate for 16- to 24-year-olds born in the United States was lower than the rate for their peers born outside the United States (8 vs. 21 percent). Hispanics, Asians, and Native Hawaiians or Other Pacific Islanders born in the United States had lower status dropout rates than their counterparts born outside the United States, whereas Whites, Blacks, and American Indians/Alaskan Natives born in the United States had higher status dropout rates than their counterparts born outside the United States. Higher dropout rates among Hispanics born outside the United States partially account for the high dropout rates among all Hispanic young adults. For Hispanic 16- to 24-year-olds who were born outside the United States, the 2007 status dropout rate was 34 percent—higher than the rate for Hispanics born within the United States. (11 percent).
Among Hispanic subgroups, Other Central Americans (29 percent) and Salvadorans (26 percent) in the United States had the highest percentages of young adults who were status dropouts, followed by Mexicans (22 percent), Puerto Ricans (15 percent), Dominicans (13 percent), and Other Hispanics or Latinos (12 percent). Cubans (6 percent) and South Americans (8 percent) had the lowest percentages among all Hispanic subgroups of young adults who were status dropouts. Among Mexicans, Puerto Ricans, Dominicans, Salvadorans, Other Central Americans, South Americans, and Other Hispanics or Latinos, the status dropout rate was higher for young adults who were born outside the United States than for those who were born in the United States.
Among Asian subgroups, the status dropout rate for young adults in the Other Asian subgroup (including Cambodian, Hmong, and other groups) (7 percent) was higher than the rates for Indian (1 percent), Filipino (1 percent), Korean (1 percent), Chinese (3 percent), Japanese (3 percent), and Vietnamese young adults (4 percent). Indian, Chinese, Filipino, and Other Asian young adults who were born outside the United States had higher status dropout rates than did those born in the United States of the same subgroups.
Snapshot of Hispanic and Asian Subgroups: Dropout Rate by Nativity

Status and Trends in the Education of Racial and Ethnic Groups 99
Chap
ter 4 — P
ersistence
table 18.1b. number and percentage of 16- to 24-year-olds who were high school status dropouts, by nativity and race/ethnicity with Hispanic and Asian subgroups: 2007
Race/ethnicity Population
Number of status
dropoutsStatus dropout
rate (percent)
Dropout rate for born within the United States1
(percent)
Dropout rate for born
outside the United States1
(percent)
total2 38,491,300 3,582,600 9.3 7.7 21.2White 23,350,100 1,425,900 6.1 6.1 5.4Black 5,535,400 634,600 11.5 11.8 7.6Hispanic 6,766,000 1,349,500 19.9 11.5 34.3
Mexican 4,459,300 991,100 22.2 12.1 38.8Puerto Rican 604,100 89,200 14.8 12.8 23.0Cuban 180,200 10,900 6.0 5.3 8.0Dominican 192,500 25,100 13.0 8.7 18.1Salvadoran 215,300 55,600 25.8 10.1 41.1Other Central American 323,600 94,500 29.2 8.6 40.8South American 319,900 25,500 8.0 5.4 9.8Other Hispanic or Latino 471,200 57,500 12.2 11.3 18.8
Asian 1,565,400 46,600 3.0 2.2 3.7Asian Indian 286,200 3,900 1.4 0.8! 1.8Chinese3 356,700 10,100 2.8 1.0! 4.6Filipino 192,900 2,300 1.2 0.4! 1.7Japanese 266,900 6,900 2.6 2.6 2.6Korean 63,200 800! 1.3! 1.3! 1.4!Vietnamese 164,600 6,600 4.0 3.9 4.1Other Asian 234,900 16,000 6.8 4.8 9.7
Native Hawaiian/Pacific Islander 72,400 5,500 7.6 5.5 12.0
American Indian/Alaska Native 317,700 48,600 15.3 15.4 1.8!
! Interpret data with caution.1 United States refers to the 50 states and the District of Columbia.2 Total includes other race/ethnicity categories not separately shown.3 Excludes Taiwanese. Taiwanese is included in the “Other Asian” category.NOTE: The data presented here represent status dropout rates. The status dropout rate is defined for this table as the percentage of 16- to 24-year-olds who are not in high school and who have not earned a high school credential (either a diploma or equivalency credential such as a GED). It includes all dropouts, regardless of when they last attended school, as well as individuals who may have never attended school in the United States, such as immigrants who did not complete a high school diploma in their home country. This table uses a different data source from table 18.1a. In addition, this table includes institutionalized persons and noninstitutionalized persons, whereas table 18.1a includes only noninstitutionalized persons. Therefore, estimates are not directly comparable to the 2007 estimates in table 18.1a. Race categories exclude persons of Hispanic ethnicity.SOURCE: U.S. Department of Commerce, Census Bureau, American Community Survey, 2007.

Status and Trends in the Education of Racial and Ethnic Groups100
ind
icat
or
18 —
Dro
po
ut r
ates
and
gra
dua
tio
n r
ates
The 2007 ACS included persons residing in institutionalized and noninstitutionalized group quarters. Institutionalized group quarters include adult and juvenile correctional facilities, nursing facilities, and other health care facilities. Noninstitutionalized group quarters include college and university housing, military quarters, and other noninstitutional facilities such as quarters for workers and religious groups and temporary shelters for the homeless. This section focuses on status dropout rates for institutionalized 16- to 24-year-olds. Comparisons are made between institutionalized 16- to 24-year-olds and their peers residing in both households and noninstitutionalized group quarters.
In 2007, the status dropout rate was 46 percent for institutionalized youth and young adults and 9 percent for their noninstitutionalized agemates. Institutionalized Whites, Blacks, Hispanics, Asians, and American Indians/Alaska Natives had higher status dropout rates than their noninstitutionalized peers. Among the institutionalized, Hispanics (52 percent) had a higher status dropout rate than Whites (40 percent), Asians (38 percent), and American Indians/Alaska Natives (38 percent). Additionally, the rate for institutionalized Blacks (50 percent) was higher than the rate for institutionalized Whites. Similarly, looking at noninstitutionalized youth and young adults, the status dropout rate for Hispanics (19 percent) was higher than the rates for Whites (6 percent), Blacks (10 percent), Asians (3 percent), Native Hawaiians/Pacific Islanders (7 percent), and American Indians/Alaska Natives (15 percent).
Snapshot: Dropout Rates for Institutionalized Youth and Young Adults by Race/Ethnicity
table 18.1c. number and percentage of institutionalized and noninstitutionalized 16- to 24-year-olds who were high school status dropouts, by race/ethnicity: 2007
Race/ethnicity Total status
dropout rate
Institutionalized group quarters Noninstitutionalized
Total number
Status dropout rate
Total number
Status dropout rate
total1 9.3 538,100 45.9 37,953,200 8.8White 6.1 192,800 39.8 23,157,200 5.8Black 11.5 203,300 49.6 5,332,100 10.0Hispanic 19.9 114,700 52.5 6,651,300 19.4Asian 3.0 6,100 38.1 1,559,300 2.8Native Hawaiian/Pacific
Islander 7.6 ‡ ‡ 71,300 7.5American Indian/Alaska
Native 15.3 7,300 37.9 310,400 14.8
‡ Reporting standards not met.1 Total includes other race/ethnicity categories not separately shown.NOTE: The data presented here represent status dropout rates for 16- to 24-year-olds. The status dropout rate is defined for this table as the percentage of 16- to 24-year-olds who are not in high school and who have not earned a high school credential (either a diploma or equivalency credential such as a GED). It includes all dropouts, regardless of when they last attended school, as well as individuals who may have never attended school in the United States, such as immigrants who did not complete a high school diploma in their home country. This table uses a different data source from table 18.1a. In addition, this table includes institutionalized persons and noninstitutionalized persons, whereas table 18.1a includes only noninstitutionalized persons. Therefore, total status dropout rate estimates are not directly comparable to the 2007 estimates in table 18.1a. Institutionalized group quarters include adult and juvenile correctional facilities, nursing facilities, and other health care facilities. Noninstitutionalized group quarters, such as college and university housing, military quarters, facilities for workers and religious groups, and temporary shelters for the homeless are included in the noninstitutionalized category. Race categories exclude persons of Hispanic ethnicity.SOURCE: U.S. Department of Commerce, Census Bureau, American Community Survey, 2007.

Status and Trends in the Education of Racial and Ethnic Groups 101
Chap
ter 4 — P
ersistence18.2. Averaged Freshman Graduation Rates
The averaged freshman graduation rate (AFGR) estimates the percentage of an incoming freshman class that graduates with a regular high school diploma 4 years later. The averaged freshman enrollment count is the average of the number of 8th-graders enrolled 5 years prior to graduation, the number of 9th-graders enrolled 4 years prior, and the number of 10th-graders enrolled 3 years prior. The intent of this averaging is to
account for the relatively high rate of grade retention in the freshman year. Of the 3.9 million students estimated to have entered public high school in the 2003–04 school year (data not shown), 2.9 million, or 74 percent, graduated in 2006–07. However, the numbers vary across race/ethnicities. The AFGR was 91 percent for Asian students and 80 percent for White students; in contrast, it was 60 percent for Blacks, 62 percent for Hispanics, and 61 percent for American Indians/Alaska Natives.
figure 18.2. Averaged freshman graduation rate for public high school students, by race/ethnicity: school year 2006–07
NOTE: New York and Kentucky did not report graduate counts by race/ethnicity, and race/ethnicity graduate counts for the District of Columbia were suppressed due to inaccuracy. Therefore, data for the AFGR for these states are not included. In addition, the AFGR could not be calculated by race/ethnicity for Nevada as enrollments by race/ethnicity were not reported for the 2004–05 school year. For more information, see Appendix A: Guide to Sources. The AFGR is an estimate of the percentage of an entering freshman class that graduates within 4 years. For 2006–07, it equals the total number of diploma recipients in 2006–07 divided by the average membership of the 8th-grade class in 2002–03, the 9th-grade class in 2003–04, and the 10th-grade class in 2004–05. Ungraded students were allocated to individual grades proportional to each state’s enrollment in those grades. Graduates include only those who earned regular diplomas or diplomas for advanced academic achievement (e.g., honors diplomas) as defined by the state or jurisdiction. Race categories exclude persons of Hispanic ethnicity. SOURCE: U.S. Department of Education, National Center for Education Statistics (NCES), Common Core of Data (CCD), “NCES Common Core of Data State Dropout and Completion Data File,” school year 2006–07, version 1a.
White Black Hispanic
Race/ethnicity
Asian/Pacific Islander
American Indian/Alaska Native
0
10
20
30
40
50
60
70
80
90
100Percent
80
60 62
91
61
Total:74%

Status and Trends in the Education of Racial and Ethnic Groups102
ind
icat
or
18 —
Dro
po
ut r
ates
and
gra
dua
tio
n r
ates
table 18.2. Averaged freshman graduation rate for public high school students and number of graduates, by race/ethnicity: school year 2006–07
Race/ethnicityAveraged freshman
graduation rate (AFGR) Number of graduates
total 73.9 2,892,351White 80.3 1,723,915Black 60.3 374,075Hispanic 62.3 376,396Asian/Pacific Islander 91.4 138,589American Indian/Alaska Native 61.3 29,724
NOTE: New York and Kentucky did not report graduate counts by race/ethnicity, and race/ethnicity graduate counts for the District of Columbia were suppressed due to inaccuracy. Data for these states were used in the calculation of the totals, but are not included in the race/ethnicity categories. In addition, the AFGR could not be calculated by race/ethnicity for Nevada as enrollments by race/ethnicity were not reported for the 2004–05 school year. Data for Nevada are included in the totals and the number of graduates by race/ethnicity, but are not included in the AFGR by race/ethnicity. As a result, the sum of the number of graduates in each racial/ethnic group does not equal the total number of graduates. For more information, see Appendix A: Guide to Sources. The AFGR is an estimate of the percentage of an entering freshman class that graduates within 4 years. For 2006–07, it equals the total number of diploma recipients in 2006–07 divided by the average membership of the 8th-grade class in 2002–03, the 9th-grade class in 2003–04, and the 10th-grade class in 2004–05. Ungraded students were allocated to individual grades proportional to each state’s enrollment in those grades. Graduates include only those who earned regular diplomas or diplomas for advanced academic achievement (e.g., honors diploma) as defined by the state or jurisdiction. Race categories exclude persons of Hispanic ethnicity.SOURCE: U.S. Department of Education, National Center for Education Statistics (NCES), Common Core of Data (CCD), “NCES Common Core of Data State Dropout and Completion Data File,” school year 2006–07, version 1a.

This chapter focuses on behaviors students engage in that could influence their educational experiences and outcomes. The first indicator, indicator 19, examines students’ use of after-school time, focusing on the time spent on homework or at a part-time job. For example, in 2007, parents of Asian high schoolers reported that their children spent the highest number of hours on homework per week—10 hours on average—when compared with parents of students of other races/ethnicities. In addition, 68 percent of parents of Asian students reported that their children did homework 5 or more days per week; this percentage was higher than the percentages for White (44 percent), Hispanic (40 percent), and Black (30 percent) students. In 2008, about 24 percent of all high school students who were 16 years or older were employed. The percentage of White students who worked (29 percent) was higher than that of Black (14 percent), Hispanic (18 percent), Asian (14 percent), or American Indian/Alaska Native (14 percent) students.
Indicators 20, 21, and 22 examine negative student behaviors and focus on illegal substance usage, teenage pregnancy rates, and crime rates at school. In 2007, among children between the ages of 12 and 17, about 16 percent reported drinking alcohol in the past month, 10 percent reported smoking cigarettes in the past month, and 7 percent reported using marijuana in the past month. These percentages varied by race/ethnicity (indicator 20). For example, a
higher percentage of White (18 percent) and Hispanic (15 percent) children ages 12 to 17 reported drinking alcohol in the past month than did their Black and Asian peers (10 and 8 percent, respectively).
Although teenage birth rates declined between 1991 and 2005, they increased in the more recent time period between 2005 and 2007 (indicator 21). Expressed as a rate per 1,000 15- to 19-year-olds, the 2007 birth rates for Hispanic (82 births per 1,000 15- to 19-year-olds), Black (64 per 1,000), and American Indian/Alaska Native (59 per 1,000) teenage females were higher than the birth rates for White (27 per 1,000) and Asian/Pacific Islander (17 per 1,000) teenage females.
Indicator 22 provides information on the percentages of high school students who reported being threatened or injured with a weapon on school property; the percentages who reported having illegal drugs offered, sold, or given to them on school property; and the reported presence of gangs in elementary and secondary schools. Percentages also varied by race/ethnicity: for example in grades 9 through 12, in 2007, about 13 percent of students of two or more races, 10 percent of Black students, and 9 percent of Hispanic students reported being threatened or injured with a weapon on school property in the past 12 months. The percentages for White and American Indian/Alaska Native students were lower: 7 percent and 6 percent, respectively.
5 stuDEnt BEHAviOrs

Status and Trends in the Education of Racial and Ethnic Groups104
ind
icat
or
19 —
Aft
er-s
cho
ol t
ime
use
What adolescents do with their time after school can influence their success. Some research has shown that how students spend their time outside of school is linked to their academic achievement (Tierney, Baldwin Grossman, and Resch 1995; Zaff et al. 2003).
19.1 Homework
The completion of homework has been found to have a positive effect on academic achievement, particularly for high school students (Cooper, Robinson and Patall 2006). In 2007, parents reported that their high school students spent 7 hours, on average, on homework per week. About 42 percent of parents reported that their students did homework 5 or more days per week, while 5 percent reported that their students did homework less than once per week. Overall, 65 percent of parents reported that they checked to make sure that their high school students’ homework was done.
Asian high school students spent more hours per week on homework (10 hours on average) than students of all other races/ethnicities shown (who spent an average of 6 to 7 hours per week on homework). Additionally, 68 percent of Asian parents reported that their students did homework 5 or more days per week, compared with 44 percent of White parents, 30 percent of Black parents, and 40 percent of Hispanic parents. There was no measurable difference between the percentage of parents of Asian students and the percentage of parents of students of two or more races who reported that their children did homework 5 or more days per week.
A higher percentage of parents of Black students (83 percent) reported that they checked to make sure that their students’ homework was done than did the parents of White students (57 percent), Asian students (59 percent), or students of two or more races (66 percent). In addition, a higher percentage of Hispanic parents (76 percent) than of White or Asian parents reported checking their students’ homework.
19. After-school time use
table 19.1. Percentage of high school students who did homework outside of school and whose parents checked that homework was done, by frequency and race/ethnicity: 2007
Race/ethnicity
Average hours
per week spent on
home-work by
students who did
homework outside of
school
Percentage distribution of students who did homework outside of school by how frequently they
did homework
Percent of students
whose parents1
checked that
homework was done
Less than once
per week
1 to 2 days per week
3 to 4 days per week
5 or more days per
week
All high school students2 (grades 9 through 12) 6.8 5.4 14.8 38.0 41.9 64.6
White 6.8 4.2 12.9 38.6 44.3 57.2Black 6.3 9.3! 20.1 41.0 29.7 83.1Hispanic 6.4 5.9 17.7 36.6 39.9 75.6Asian 10.3 # 13.8! 18.5! 67.7 59.0Two or more races 7.1 6.2 10.5 32.9 50.5 65.9
# Rounds to zero.! Interpret data with caution.1 Refers to one or more parent or other household adult.2 Total includes other race/ethnicity categories not separately shown.NOTE: Data based on responses of the parent most knowledgeable about the student’s education. Reporting standards for Native Hawaiian and Other Pacific Islanders and American Indians/Alaska Natives were not met; therefore, data for these groups are not shown in the table. Race categories exclude persons of Hispanic ethnicity. Detail may not sum to totals because of rounding.SOURCE: U.S. Department of Education, National Center for Education Statistics, Parent and Family Involvement in Education Survey of the National Household Education Surveys Program (NHES), 2007.

Status and Trends in the Education of Racial and Ethnic Groups 105
Chap
ter 5 — s
tudent B
ehaviors
figure 19.1. Percentage of high school students who did homework, by frequency and race/ethnicity: 2007
# Rounds to zero. ! Interpret data with caution. NOTE: Data based on responses of the parent most knowledgeable about the student’s education. Reporting standards for Native Hawaiian and Other Pacific Islanders and American Indians/Alaska Natives were not met; therefore, data for these groups are not shown in the figure. Race categories exclude persons of Hispanic ethnicity. Detail may not sum to totals because of rounding. SOURCE: U.S. Department of Education, National Center for Education Statistics, Parent and Family Involvement in Education Survey of the National Household Education Surveys Program (NHES), 2007.
■ Less than once per week ■ 1–2 days per week ■ 3–4 days per week ■ 5 or more days per week
Two or more races
Asian
Hispanic
Black
White
Race/ethnicity
1009080706050
Percent
403020100
6 10 33 50
14! 19! 68
6 18 37 40
9! 20 41 30
4 13 39 44
#

Status and Trends in the Education of Racial and Ethnic Groups106
Ind
icat
or
19 —
Aft
er-S
cho
ol T
ime
Use
19.2 Part-Time Work
Research suggests that working more than 15 hours per week while in high school can have a negative effect on academic achievement (Singh, Change, and Dike 2007). Overall, 24 percent of high school students who were 16 years or older were employed in 2008. The percentage of White students (29 percent) who worked was higher than the percentages
of Black (14 percent), Hispanic (18 percent), Asian (14 percent), and American Indian/Alaska Native (14 percent) students who worked. However, of the students who did work, White students worked fewer hours, on average, than Black and Hispanic students. For example, 35 percent of White students who were employed worked more than 20 hours per week, compared with 50 percent of Black students and 54 percent of Hispanic students.
Table 19.2. Percentage of high school students ages 16 years and older who were employed and the percentage distribution of those who were employed, by hours worked per week and race/ethnicity: 2008
Percentage distribution of hours worked per week
Race/ethnicity Percent employedLess than 10 hours 10–20 hours More than 20 hours
Total1 23.8 20.0 40.7 39.3White 28.8 21.8 42.8 35.4Black 14.2 12.8! 37.2 50.1Hispanic 17.6 14.0 32.0 54.0Asian 13.8 ‡ ‡ ‡American Indian/Alaska
Native 13.6! ‡ ‡ ‡Two or more races 22.5 ‡ ‡ ‡
‡ Reporting standards not met.! Interpret data with caution.1 Total includes other race/ethnicity categories not separately shown.NOTE: Reporting standards for Native Hawaiian and Other Pacific Islanders were not met; therefore, data for this group are not shown in the table. Race categories exclude persons of Hispanic ethnicity. Detail may not sum to 100 percent because of rounding.SOURCE: U.S. Department of Commerce, Census Bureau, Current Population Survey (CPS), Annual Social and Economic Supplement, 2008.

Status and Trends in the Education of Racial and Ethnic Groups 107
Chap
ter 5 — s
tudent B
ehaviors
figure 19.2a. Percentage of high school students ages 16 years and older who were employed, by race/ethnicity: 2008
! Interpret data with caution. 1 Total includes other race/ethnicity categories not separately shown. NOTE: Reporting standards for Native Hawaiian and Other Pacific Islanders were not met; therefore, data for this group are not shown in the figure. Race categories exclude persons of Hispanic ethnicity. SOURCE: U.S. Department of Commerce, Census Bureau, Current Population Survey (CPS), Annual Social and Economic Supplement, 2008.
figure 19.2b. Percentage distribution of employed high school students 16 years and over, by hours worked per week and race/ethnicity: 2008
NOTE: Total includes other race/ethnicity categories not separately shown. Reporting standards for Asian, Native Hawaiian and Other Pacific Islanders, American Indian/Alaska Native, and two or more races were not met; therefore, data for these groups are not shown in the figure. Race categories exclude persons of Hispanic ethnicity. SOURCE: U.S. Department of Commerce, Census Bureau, Current Population Survey (CPS), Annual Social and Economic Supplement, 2008.
Total1
Race/ethnicity
0
10
20
30
40
50Percent
24
White
29
Black
14
Hispanic
18
Asian
14
American Indian/Alaska Native
14!
Two ormore races
22
■ Less than 10 hours ■ 10–20 hours ■ More than 20 hours
Hispanic
Black
White
Total
Race/ethnicity
1009080706050
Percent
403020100
14 32 54
13 37 50
22 43 35
20 41 39

Status and Trends in the Education of Racial and Ethnic Groups108
ind
icat
or
20 —
Cig
aret
te, A
lco
hol,
and
Dru
g u
se Students who use alcohol, cigarettes, and drugs such as marijuana are more likely than their peers to experience low academic achievement, truancy, and other discipline-related issues (Bryant et al. 2003; Bryant and Zimmerman 2002). In the National Survey on Drug Use and Health, children between the ages of 12 and 17 and adults between the ages of 18 and 25 were surveyed to determine whether they had used alcohol, cigarettes, or marijuana in the past 30 days.
In 2007, among youth between the ages of 12 and 17, about 16 percent reported drinking alcohol in the past month, 10 percent reported smoking cigarettes in the past month, and 7 percent reported using marijuana in the past month. These percentages varied by race/ethnicity. A higher percentage of White (18 percent) and Hispanic (15 percent) children ages 12 to 17 reported drinking alcohol in the past month than did their Black and Asian peers (10 and 8 percent, respectively), with the percentage of Whites exceeding that of Hispanics. In addition, the percentage of White 12- to 17-year-olds drinking alcohol in the past month was higher than the percentage of youth of two or more races doing so (13 percent). Cigarette use was reported by a higher percentage of Whites (12 percent) than Blacks (6 percent), Hispanics (7 percent), Asians (3 percent), and youth of two or more races (9 percent). Although there appear to be differences in the percentage of American Indians/Alaska Natives and the percentages of Blacks and Hispanics reporting cigarette use in the
past month, these differences were not statistically significant. Marijuana use was reported by 7 percent of White 12- to 17-year-olds, higher than the percentages reported by Black (6 percent), Hispanic (6 percent), and Asian (4 percent) 12- to 17-year-olds.
Among young adults ages 18 to 25, a higher percentage of Whites (68 percent) and young adults of two or more races (63 percent) reported having at least one alcoholic drink in the past month than did Blacks, Hispanics, or Asians (whose percentages ranged from 50 to 51 percent). Fifty-two percent of American Indians/Alaska Natives reported cigarette smoking in the past month, higher than the percentage of most other races: 41 percent of White young adults reported cigarette use in the past month, and the percentage of Black, Hispanic, and Asian young adults who reported cigarette use in the past month ranged between 26 and 30 percent. There was no measurable difference in the percentage of American Indian/Alaska Native young adults and young adults of two or more races who reported cigarette smoking in the past month, in part due to large standard errors. A higher percentage of White and Black young adults ages 18 to 25 reported using marijuana in the past month (18 and 16 percent, respectively) than did Hispanic (12 percent) and Asian (9 percent) young adults. In addition, the percentage of young adults of two or more races who reported using marijuana in the past month (24 percent) was higher than the percentage of Blacks, Hispanics, and Asians who reported doing so.
20. Cigarette, Alcohol, and Drug use
table 20. Percentage of 12- to 17-year-olds and 18- to 25-year-olds who reported using alcohol, cigarettes, or marijuana in past month, by race/ethnicity: 2007
Age group and substance used Total1 White Black Hispanic Asian
American Indian/Alaska Native
Two or more races
12- to 17-year-oldsAlcohol 15.9 18.2 10.1 15.2 8.1 ‡ 12.5Cigarettes 9.8 12.2 6.1 6.7 3.4 13.4 8.9Marijuana 6.7 7.3 5.8 5.7 4.2! ‡ 6.9
18- to 25-year-olds Alcohol 61.2 67.5 50.2 50.7 50.1 ‡ 63.1Cigarettes 36.2 40.8 26.2 29.5 25.7 52.2 41.5Marijuana 16.4 18.1 16.4 11.9 8.9 ‡ 23.5
! Interpret data with caution.‡ Reporting standards not met.1 Total includes other race/ethnicity categories not separately shown.NOTE: Reporting standards for Native Hawaiian and Other Pacific Islanders were not met; therefore, data for this group are not shown on the table. Race categories exclude persons of Hispanic ethnicity.SOURCE: U.S. Department of Health and Human Services, Substance Abuse and Mental Health Services Administration, Office of Applied Studies, National Survey on Drug Use and Health, 2007.

Status and Trends in the Education of Racial and Ethnic Groups 109
Chap
ter 5 — s
tudent B
ehaviors
figure 20. Percentage of 12- to 17-year-olds who reported using alcohol, cigarettes, or marijuana in the past month, by race/ethnicity: 2007
! Interpret data with caution. ‡ Reporting standards not met. NOTE: Reporting standards for Native Hawaiian and Other Pacific Islanders were not met; therefore, data for this group are not shown on the figure. Race categories exclude persons of Hispanic ethnicity. SOURCE: U.S. Department of Health and Human Services, Substance Abuse and Mental Health Services Administration, Office of Applied Studies, National Survey on Drug Use and Health, 2007.
■ White ■ Black ■ Hispanic ■ Asian ■ American Indian/ ■ Two or more races Alaska Native
Marijuana
Cigarettes
Alcohol
Substance
504030
Percent
20100
7
4!
6
6
7
9
13
37
6
12
13
8‡
‡
15
10
18

Status and Trends in the Education of Racial and Ethnic Groups110
ind
icat
or
21 —
tee
nag
e P
reg
nanc
y
Teenagers who have children are less likely to complete high school than their peers who do not have children (Hofferth, Reid, and Mott 2001). For this indicator, teenage birth rates are reported as the number of live births per 1,000 females who are 15 to 19 years old. In 2007, the birth rate was 43 births per 1,000 15- to 19-year-old females.22 The birth rates for Hispanic (82 per 1,000), Black (64 per 1,000), and American Indian/Alaska Native (59 per 1,000) teenage females were higher than that of the general population of teenage females. Comparatively, the 2007 birth rate for White teenage females was 27 births per 1,000 females and that for Asians/Pacific Islanders was 17 per 1,000.
In 1991, the teenage birth rate was highest for Black females (118 per 1,000) and Hispanic females (105 per 1,000). Between 1991 and 2005, birth rates dropped for 15- to 19-year-old females of all racial/ethnic groups. The birth rate for Black teenage females declined from 118 per 1,000 in 1991 to 61 per 1,000 in 2005, which was the greatest drop of all racial/ethnic groups. During this same period, the birth rates for Hispanic teenage females declined from 105 per 1,000 to 82 per 1,000, and American Indian/Alaska Native teenage birth rates declined from 84
per 1,000 to 53 per 1,000. White teenage birth rates declined from 43 per 1,000 to 26 per 1,000, and Asian/Pacific Islander teenage birth rates declined from 27 per 1,000 to 17 per 1,000. Between 2005 and 2007, birth rates increased for the first time in 15 years for each race/ethnicity, with the exception of Hispanics and Asians/Pacific Islanders. The birth rate increased to 64 per 1,000 for Blacks, 59 per 1,000 for American Indians/Alaska Natives, and 27 per 1,000 for Whites. The birth rate in 2007 for Hispanic 15- to 19-year-olds was the same as the birth rate in 2005 (82 per 1,000).
Asian/Pacific Islander teenage females have had consistently lower birth rates compared with White, Black, Hispanic, and American Indian/Alaska Native teenage females. Black teenage females had higher birth rates than their peers of other racial/ethnic groups from 1990 through 1994. Since 1995, Hispanic teenage females have had higher birth rates than Black teenage females and teenage females from all other racial groups shown. The gap between the birth rates of Blacks and Hispanics generally increased through 2005, but decreased more recently between 2005 and 2007.
21. teenage Pregnancy
22 Data for 2007 are preliminary.
table 21a. number of live births per 1,000 females ages 15 to 19, by race/ethnicity: selected years, 1990–2007
Year Total White Black HispanicAsian/Pacific
IslanderAmerican Indian/
Alaska Native
1990 59.9 42.5 116.2 100.3 26.4 81.11991 61.8 43.4 118.2 104.6 27.3 84.11992 60.3 41.7 114.7 103.3 26.5 82.41993 59.0 40.7 110.5 101.8 26.5 79.81994 58.2 40.4 105.7 101.3 26.6 76.41995 56.0 39.3 97.2 99.3 25.5 72.91996 53.5 37.6 91.9 94.6 23.5 68.21997 51.3 36.0 88.3 89.6 22.3 65.21998 50.3 35.3 85.7 87.9 22.2 64.71999 48.8 34.1 81.0 86.8 21.4 59.92000 47.7 32.6 79.2 87.3 20.5 58.32001 45.3 30.3 73.5 86.4 19.8 56.32002 43.0 28.5 68.3 83.4 18.3 53.82003 41.6 27.4 64.7 82.3 17.4 53.12004 41.1 26.7 63.1 82.6 17.3 52.52005 40.5 25.9 60.9 81.7 17.0 52.72006 41.9 26.6 63.7 83.0 17.0 55.020071 42.5 27.2 64.3 81.7 17.3 59.01 Data are preliminary.NOTE: The race categories White and Black exclude persons of Hispanic ethnicity, and the categories Asian/Pacific Islander and American Indian/Alaska Native include persons of Hispanic ethnicity.SOURCE: U.S. Department of Health and Human Services, Centers for Disease Control and Prevention (CDC), National Vital Statistics Reports, Vol. 57, no. 12, Births: Preliminary Data for 2007, National Center for Health Statistics, 2009.

Status and Trends in the Education of Racial and Ethnic Groups 111
Chap
ter 5 — s
tudent B
ehaviors
figure 21. number of live births per 1,000 females ages 15 to 19, by race/ethnicity: selected years, 1990–2007
1 Data are preliminary. NOTE: The race categories White and Black exclude persons of Hispanic ethnicity, and the categories Asian/Pacific Islander and American Indian/Alaska Native include persons of Hispanic ethnicity. SOURCE: U.S. Department of Health and Human Services, Centers for Disease Control and Prevention (CDC), National Vital Statistics Reports, Vol. 57, no. 12, Births: Preliminary Data for 2007, National Center for Health Statistics, 2009.
1990 1995
Year
2000 2005 200710
10
20
30
40
50
60
70
80
90
100
110
120
Number of live birthsper 1,000 females
� White � Black � Hispanic � Asian/Pacific Islander � American Indian/Alaska Native
� � � � � � � � � � � � � � � � � �
� � � � � � � � � � � � � � � � � �
� � ��
��
� � � � ��
� � � � ��
� �����������
�����
� � � � � � � � �� � � � � � � �
�
�
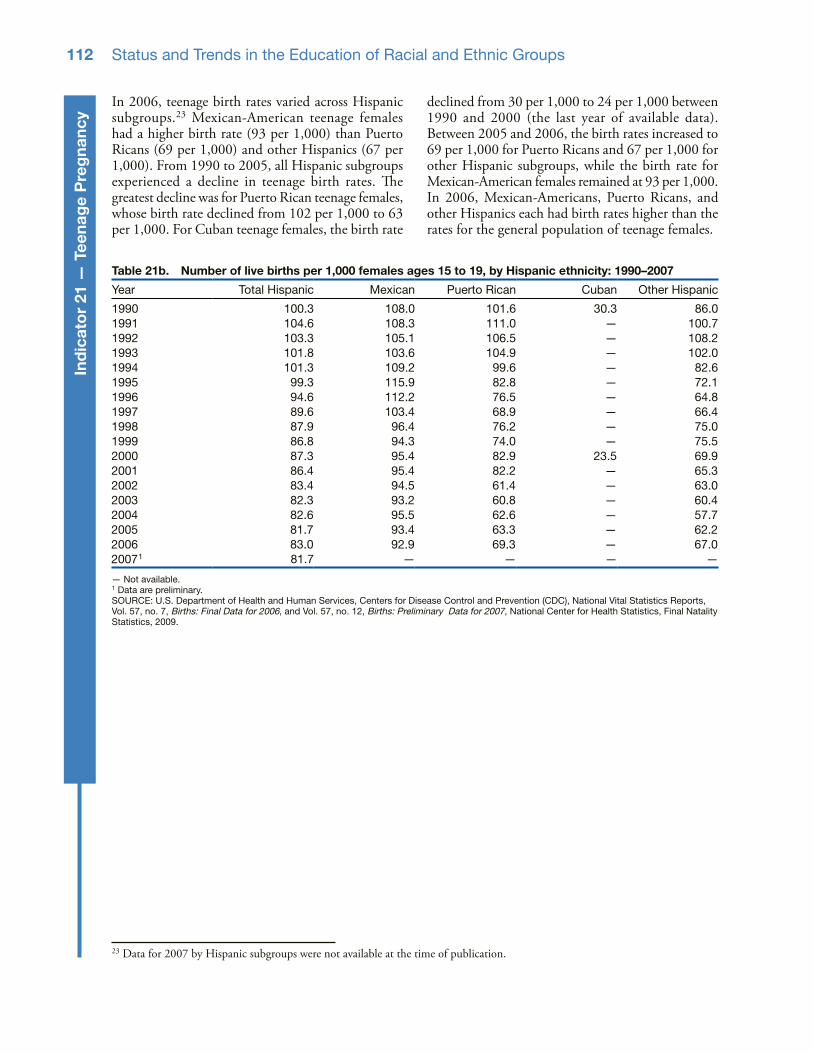
Status and Trends in the Education of Racial and Ethnic Groups112
ind
icat
or
21 —
tee
nag
e P
reg
nanc
yIn 2006, teenage birth rates varied across Hispanic subgroups.23 Mexican-American teenage females had a higher birth rate (93 per 1,000) than Puerto Ricans (69 per 1,000) and other Hispanics (67 per 1,000). From 1990 to 2005, all Hispanic subgroups experienced a decline in teenage birth rates. The greatest decline was for Puerto Rican teenage females, whose birth rate declined from 102 per 1,000 to 63 per 1,000. For Cuban teenage females, the birth rate
declined from 30 per 1,000 to 24 per 1,000 between 1990 and 2000 (the last year of available data). Between 2005 and 2006, the birth rates increased to 69 per 1,000 for Puerto Ricans and 67 per 1,000 for other Hispanic subgroups, while the birth rate for Mexican-American females remained at 93 per 1,000. In 2006, Mexican-Americans, Puerto Ricans, and other Hispanics each had birth rates higher than the rates for the general population of teenage females.
table 21b. number of live births per 1,000 females ages 15 to 19, by Hispanic ethnicity: 1990–2007
Year Total Hispanic Mexican Puerto Rican Cuban Other Hispanic
1990 100.3 108.0 101.6 30.3 86.01991 104.6 108.3 111.0 — 100.71992 103.3 105.1 106.5 — 108.21993 101.8 103.6 104.9 — 102.01994 101.3 109.2 99.6 — 82.61995 99.3 115.9 82.8 — 72.11996 94.6 112.2 76.5 — 64.81997 89.6 103.4 68.9 — 66.41998 87.9 96.4 76.2 — 75.01999 86.8 94.3 74.0 — 75.52000 87.3 95.4 82.9 23.5 69.92001 86.4 95.4 82.2 — 65.32002 83.4 94.5 61.4 — 63.02003 82.3 93.2 60.8 — 60.42004 82.6 95.5 62.6 — 57.72005 81.7 93.4 63.3 — 62.22006 83.0 92.9 69.3 — 67.020071 81.7 — — — —
— Not available.1 Data are preliminary.SOURCE: U.S. Department of Health and Human Services, Centers for Disease Control and Prevention (CDC), National Vital Statistics Reports, Vol. 57, no. 7, Births: Final Data for 2006, and Vol. 57, no. 12, Births: Preliminary Data for 2007, National Center for Health Statistics, Final Natality Statistics, 2009.
23 Data for 2007 by Hispanic subgroups were not available at the time of publication.

This page intentionally left blank.

Status and Trends in the Education of Racial and Ethnic Groups114
ind
icat
or
22 —
saf
ety
at s
cho
ol
Student reports of experiencing violence, the threat of violence, and the presence of gangs at school are one indicator of school safety. The Youth Risk Behavior Survey, conducted by the Centers for Disease Control and Prevention (CDC), asks students in grades 9 through 12 whether they have carried a weapon to school in the past 30 days, have been threatened or injured with a weapon in school in the past year, or have engaged in a physical fight on school property in the past year, as well as whether drugs were available to them on school property in the past year. The School Crime Supplement to the National Crime Victimization Survey (SCS/NCVS) asks students ages 12 to 18 in elementary and secondary schools about crime on their campuses, including the presence of gangs.
In 2007, among 9th- through 12th-grade students, higher percentages of students of two or more races (13 percent), Black students (10 percent), and Hispanic students (9 percent) reported being threatened or injured with a weapon on school property in the past 12 months than did White students (7 percent) and American Indian/Alaska Native students (6 percent). No other measurable differences were found among the races/ethnicities. In 2007, approximately 6 percent of all students in grades 9 through 12 reported carrying a weapon on school property during the previous 30 days. Few
measurable differences were found among the races/ethnicities in the percentage who reported carrying a weapon on school property—a larger percentage of Hispanic students (7 percent) reported doing so than did White (5 percent) and Asian (4 percent) students, but no other differences were detected. About 12 percent of all high school students engaged in a physical fight on school property in the past 12 months. This percentage was higher for Black students, Hispanic students, American Indian/Alaska Native students, and students of two or more races (from 15 to 20 percent) than for White and Asian students (10 and 8 percent, respectively).
An estimated 22 percent of high school students reported having illegal drugs offered, sold, or given to them on school property in 2007. Differences in this percentage were found across racial/ethnic groups. Specifically, higher percentages of Hispanic (29 percent) and Native Hawaiian or Other Pacific Islander (38 percent) students reported that drugs were made available to them than did Black, White, and Asian students (from 19 to 21 percent). Although it appears that a higher percentage of Native Hawaiian or Other Pacific Islander students than Hispanic students reported that drugs were made available to them, the difference was not found to be statistically significant.
22. safety at school
table 22a. Percentage of students in grades 9 through 12 who reported that they were threatened or injured with a weapon on school property, carried a weapon to school, engaged in a physical fight on school property, or reported that drugs were made available to them on school property, by race/ethnicity: 2007
Race/ethnicity
Were threatened or injured with a
weapon1Carried
a weapon2Engaged in
a physical fight1
Drugs were available on
school property1
total 7.8 5.9 12.4 22.3White 6.9 5.3 10.2 20.8Black 9.7 6.0 17.6 19.2Hispanic 8.7 7.3 15.5 29.1Asian 7.6! 4.1 8.5 21.0Native Hawaiian/Pacific Islander 8.1! 9.5! 9.6! 38.5American Indian/Alaska Native 5.9 7.7 15.0 25.1Two or more races 13.3 5.0 19.6 24.6
! Interpret with caution.1 In the past 12 months.2 On one or more of the past 30 days.NOTE: Race categories exclude persons of Hispanic ethnicity.SOURCE: Centers for Disease Control and Prevention (CDC) , National Center for Chronic Disease Prevention and Health Promotion, Youth Risk Behavior Surveillance System (YRBSS), 2007.

Status and Trends in the Education of Racial and Ethnic Groups 115
Chap
ter 5 — s
tudent B
ehaviors
Youth gangs are linked to serious crime problems such as the presence of guns and drugs in elementary and secondary schools (Chandler et al. 1998). In 2007, about 23 percent of students ages 12 to 18 reported a presence of gangs at their school. A higher
percentage of Black (38 percent) and Hispanic (36 percent) students reported a presence of gangs at their schools than did White (16 percent) and Asian (17 percent) students.
figure 22. Percentage of high school students who reported that they were threatened or injured with a weapon on school property, carried a weapon to school, or engaged in a physical fight on school property, by race/ethnicity: 2007
! Interpret with caution. 1 In the past 12 months. 2 On one or more of the past 30 days. NOTE: High school students are defined as students enrolled in grades 9 through 12. Race categories exclude persons of Hispanic ethnicity. SOURCE: Centers for Disease Control and Prevention (CDC), National Center for Chronic Disease Prevention and Health Promotion, Youth Risk Behavior Surveillance System (YRBSS), 2007.
■ White ■ Black ■ Hispanic ■ Asian ■ Native Hawaiian/ ■ American Indian/ ■ Two or more Pacific Islander Alaska Native races
Percent
Were threatened or injuredwith a weapon1
Incident
Carried a weapon2 Engaged in a physical fight10
10
20
30
40
50
710 9 8! 8!
6
13
5 6 74
9!8
5
10
1815
8 10!
15
20
table 22b. Percentage of students ages 12 to 18 who reported that gangs were present at school, by race/ethnicity: 2007
Race/ethnicity Total
total 23.2White 16.0Black 37.6Hispanic 36.1Asian 17.4Other1 26.41 Includes American Indians, Alaska Natives, Pacific Islanders, and persons of two or more races. NOTE: Race categories exclude persons of Hispanic ethnicity.SOURCE: U.S. Department of Justice, Bureau of Justice Statistics, School Crime Supplement (SCS) to the National Crime Victimization Survey, 2007.

This page intentionally left blank.

This chapter focuses on indicators of postsecondary education participation, including the number of students who enroll in 2-year and 4-year colleges and universities and the rate at which they enroll, the percentage of students who receive financial aid and the amount received, and the number of students awarded degrees from colleges and universities by type of degree and field of study. About 72 percent of 2008 White high school completers were enrolled in college in that same year, up from 50 percent for White recent high school completers in 1980. In addition, this immediate transition to college rate was higher in 2007 (the latest year for which data are available due to the use of a moving average) than the rate in 1980 for Blacks (56 vs. 44 percent) and for Hispanics (62 vs. 50 percent) (indicator 23.1). Similarly, the overall college participation rate, meaning the percentage of 18- to 24-year-olds enrolled in 2-year or 4-year colleges or universities, was higher in 2008 than it was in 1980 for Whites, Blacks, and Hispanics. In 2008, 44 percent of White 18- to 24-year-olds (up from 28 percent in 1980), 32 percent of Black 18- to 24-year-olds (up from 20 percent in 1980), and 26 percent of Hispanic 18- to 24-year-olds (up from 16 percent in 1980) were enrolled in 2- or 4-year colleges and universities (indicator 23.2). Although there was no measurable increase in the participation rate of Asians/Pacific Islanders between 1990 and 2008, the rates for Asians/Pacific Islanders have been consistently higher than the rates for the other racial/ethnic groups shown: in 2008, 58 percent of 18- to 24-year-old Asians/Pacific Islanders were enrolled in 2- or 4-year colleges and universities.
Between 1976 and 2008, total undergraduate enrollment increased for several racial/ethnic groups (indicator 24.1). The fastest rate of increase was for Hispanics and Asians/Pacific Islanders, and the slowest rate was for Whites. Differences in the rate of increase accounted for shifts in the racial/ethnic distribution of students enrolled. For example, in 1976, Hispanics accounted for 4 percent of total undergraduate enrollment; in 2008, Hispanics accounted for 13 percent of enrollment.
In 2008, females made up 57 percent of undergraduate enrollment. The difference between male and female enrollments was largest for Black students, with females accounting for 64 percent of Black undergraduate enrollment in 2008.
Trends in graduate enrollments were similar to those in undergraduate enrollment, with enrollment of Hispanics and Asians/Pacific Islanders each increasing five- and six-fold, respectively, between 1976 and 2008 (indicator 24.2). As with undergraduate enrollment, female graduate enrollment exceeded male graduate enrollment for all racial/ethnic groups, with the largest difference being between Black males and Black females. By 2008, some 71 percent of Black graduate students were female.
In terms of undergraduate enrollment by institution type, Black students had the highest percentage (15 percent) attending private, for-profit schools, and nearly half of Hispanic students attended 2-year public institutions (indicator 24.3).
In 2007–08, some 80 percent of full-time, full-year undergraduate students received some financial aid. A higher percentage of Black undergraduate students received financial aid than did White, Hispanic, and Asian/Pacific Islander undergraduates. Black students also received higher average amounts of aid ($13,500) in 2007–08 than White, Hispanic, Asian/Pacific Islander, or American Indian/Alaska Native students. Hispanics had a lower average amount of aid than White and Asian/Pacific Islander students (indicator 25).
Over 3 million degrees were awarded by colleges and universities in 2008, of which 51 percent were bachelor’s degrees. Within each racial/ethnic group, more females than males received degrees. Over twice as many Black females received degrees as Black males (indicator 26.1). Business was the most popular field of study for recipients of bachelor’s degrees in 2008 for all racial/ethnic groups. Of all racial/ethnic groups, Blacks had the highest percentage of bachelor’s degrees awarded in business (25 percent) and the lowest percentage of degrees awarded in engineering and engineering technologies (indicator 26.2). Asian recipients of master’s degrees had a higher percentage awarded in engineering and engineering technologies, computer and information sciences and support services, and biological and biomedical sciences than any other racial/ethnic group.
6 POstsECOnDAry EDuCAtiOn
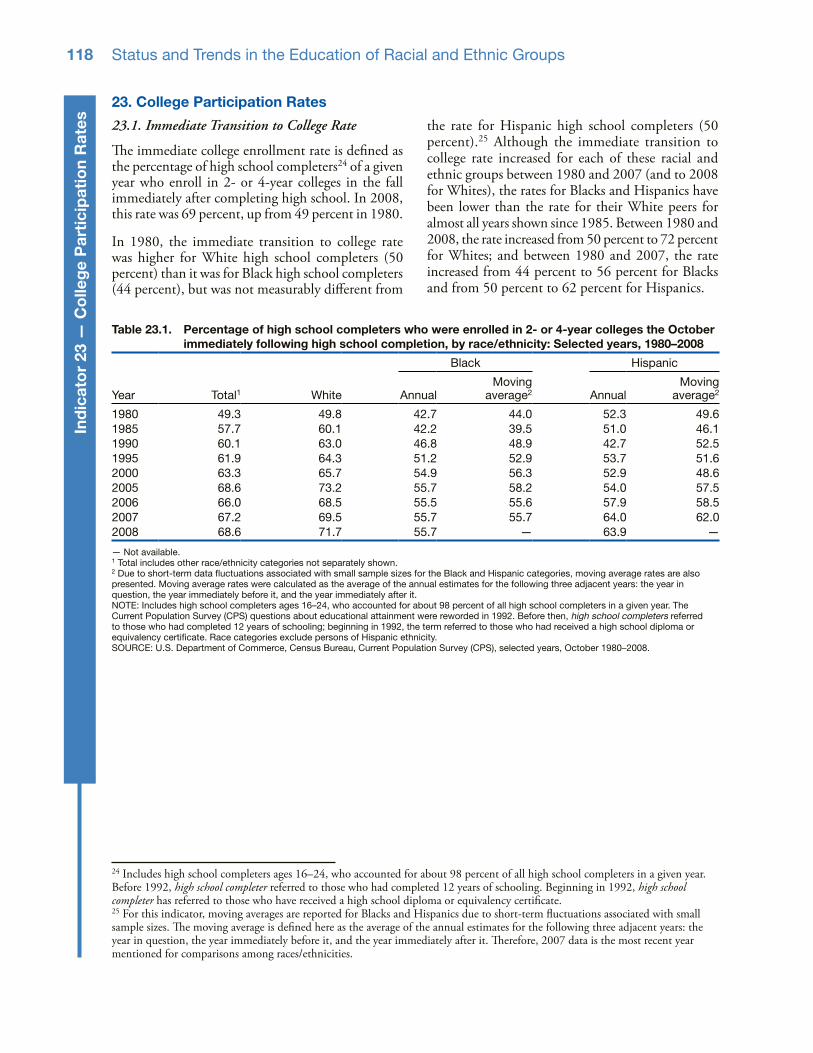
Status and Trends in the Education of Racial and Ethnic Groups118
ind
icat
or
23 —
Co
lleg
e P
arti
cip
atio
n r
ates 23.1. Immediate Transition to College Rate
The immediate college enrollment rate is defined as the percentage of high school completers24 of a given year who enroll in 2- or 4-year colleges in the fall immediately after completing high school. In 2008, this rate was 69 percent, up from 49 percent in 1980.
In 1980, the immediate transition to college rate was higher for White high school completers (50 percent) than it was for Black high school completers (44 percent), but was not measurably different from
the rate for Hispanic high school completers (50 percent).25 Although the immediate transition to college rate increased for each of these racial and ethnic groups between 1980 and 2007 (and to 2008 for Whites), the rates for Blacks and Hispanics have been lower than the rate for their White peers for almost all years shown since 1985. Between 1980 and 2008, the rate increased from 50 percent to 72 percent for Whites; and between 1980 and 2007, the rate increased from 44 percent to 56 percent for Blacks and from 50 percent to 62 percent for Hispanics.
23. College Participation rates
table 23.1. Percentage of high school completers who were enrolled in 2- or 4-year colleges the October immediately following high school completion, by race/ethnicity: selected years, 1980–2008
Black Hispanic
Year Total1 White AnnualMoving
average2 AnnualMoving
average2
1980 49.3 49.8 42.7 44.0 52.3 49.61985 57.7 60.1 42.2 39.5 51.0 46.11990 60.1 63.0 46.8 48.9 42.7 52.51995 61.9 64.3 51.2 52.9 53.7 51.62000 63.3 65.7 54.9 56.3 52.9 48.62005 68.6 73.2 55.7 58.2 54.0 57.52006 66.0 68.5 55.5 55.6 57.9 58.52007 67.2 69.5 55.7 55.7 64.0 62.02008 68.6 71.7 55.7 — 63.9 —
— Not available.1 Total includes other race/ethnicity categories not separately shown.2 Due to short-term data fluctuations associated with small sample sizes for the Black and Hispanic categories, moving average rates are also presented. Moving average rates were calculated as the average of the annual estimates for the following three adjacent years: the year in question, the year immediately before it, and the year immediately after it.NOTE: Includes high school completers ages 16–24, who accounted for about 98 percent of all high school completers in a given year. The Current Population Survey (CPS) questions about educational attainment were reworded in 1992. Before then, high school completers referred to those who had completed 12 years of schooling; beginning in 1992, the term referred to those who had received a high school diploma or equivalency certificate. Race categories exclude persons of Hispanic ethnicity. SOURCE: U.S. Department of Commerce, Census Bureau, Current Population Survey (CPS), selected years, October 1980–2008.
24 Includes high school completers ages 16–24, who accounted for about 98 percent of all high school completers in a given year. Before 1992, high school completer referred to those who had completed 12 years of schooling. Beginning in 1992, high school completer has referred to those who have received a high school diploma or equivalency certificate.25 For this indicator, moving averages are reported for Blacks and Hispanics due to short-term fluctuations associated with small sample sizes. The moving average is defined here as the average of the annual estimates for the following three adjacent years: the year in question, the year immediately before it, and the year immediately after it. Therefore, 2007 data is the most recent year mentioned for comparisons among races/ethnicities.

Status and Trends in the Education of Racial and Ethnic Groups 119
Chap
ter 6 — P
ostseco
ndary E
ducatio
nfigure 23.1. Percentage of high school completers who were enrolled in 2- or 4-year colleges the
October immediately following high school completion, by race/ethnicity: selected years, 1980–2008
1 Due to short-term data fluctuations associated with small sample sizes for the Black and Hispanic categories, moving average rates are presented. Moving average rates were calculated as the average of the annual estimates for the following three adjacent years: the year in question, the year immediately before it, and the year immediately after it. NOTE: Includes high school completers ages 16–24, who accounted for about 98 percent of all high school completers in a given year. The Current Population Survey (CPS) questions about educational attainment were reworded in 1992. Before then, high school completers referred to those who had completed 12 years of schooling; beginning in 1992, the term referred to those who had received a high school diploma or equivalency certificate. Race categories exclude persons of Hispanic ethnicity. Detail may not sum to totals because of rounding. SOURCE: U.S. Department of Commerce, Census Bureau, Current Population Survey (CPS), selected years, October 1980–2008.
1980 1985 1990 1995
Year
2000 2005 20080
10
20
30
40
50
60
70
80
90
100Percent
� White � Black1 � Hispanic1
��
� � � ��
� ��
��
�� � � � �
�� � �
� ��

Status and Trends in the Education of Racial and Ethnic Groups120
ind
icat
or
23 —
Co
lleg
e P
arti
cip
atio
n r
ates
23.2. College Participation Rate
The college participation rate is the percentage of all 18- to 24-year-olds enrolled in 2-year and 4-year colleges or universities, including both undergraduate and graduate studies. This measure accounts for population growth within the demographic group.
The overall college participation rate has increased over the past 27 years. In 1980, some 28 percent of White 18- to 24-year-olds were enrolled in colleges and universities, compared with 44 percent in 2008—an increase of 17 percentage points. The college participation rates of Blacks and Hispanics also increased. In 2008, approximately 32 percent of Black 18- to 24-year-olds were enrolled in colleges or universities (an increase of 12 percentage points from 1980) and 26 percent of Hispanic 18- to 24-year-olds were enrolled (an increase of 10 percentage points from 1980). No measurable differences were found between 1990 and 2008 in the participation rates of Asians/Pacific Islanders or American Indians/Alaska Natives (data were not available for 1980). The apparent increase in the participation rate of American Indians/Alaska Natives was not statistically significant, in part due to large standard errors.
Although there was no measurable increase in the participation rate of Asians/Pacific Islanders between 1990 and 2008, the participation rates of Asians/Pacific Islanders have been consistently higher than the rates of the other racial/ethnic groups shown. For example, in 2008, 58 percent of all 18- to 24-year old Asians/Pacific Islanders were enrolled in colleges and universities, and this rate was higher than each of the rates of the other races/ethnicities shown (ranging from 22 to 44 percent).
Participation rates also differed for males and females in 2008. Hispanic females had a participation rate of 29 percent, compared to a rate of 23 percent for Hispanic males. In addition, Black females had a higher participation rate (34 percent) than their male counterparts (30 percent). White females also enrolled at a higher rate (47 percent) than White males (42 percent). No measurable differences were detected between the sexes in the participation rates of Asians/Pacific Islanders and American Indians/Alaska Natives, in part due to high standard errors.
figure 23.2. Percentage of 18- to 24-year-olds enrolled in colleges and universities, by race/ethnicity: selected years: 1980–2008
NOTE: Race categories exclude persons of Hispanic ethnicity. SOURCE: U.S. Department of Commerce, Census Bureau, Current Population Survey (CPS), October 1980–2008.
1980 1985 1990 1995
Year
2000 2005 20080
10
20
30
40
50
60
70
80
90
100Percent
� � �� � � � � �
� �� � � � � � � � �
� �� � � � � � � � �
� � �� � � � � � � �
�
�
� �� � � � �
� White � Black � Hispanic � Asian/Pacific Islander � American Indian/Alaska Native

Status and Trends in the Education of Racial and Ethnic Groups 121
Chap
ter 6 — P
ostseco
ndary E
ducatio
ntable 23.2. Percentage of 18- to 24-year-olds enrolled in colleges and universities, by race/ethnicity and
sex: selected years, 1980–2008
Sex and year Total1 White Black HispanicAsian/Pacific
Islander
American Indian/Alaska
Native
Total1980 26.1 27.7 19.7 16.3 — —1985 27.9 30.1 19.8 17.0 — —1990 32.1 35.1 25.2 15.9 56.9 15.81995 34.3 37.9 27.5 20.7 54.6 27.62000 35.5 38.7 30.5 21.7 55.9 15.92005 38.9 42.8 33.1 24.8 60.5 27.82006 37.3 41.0 32.6 23.6 57.0 26.22007 38.8 42.6 33.1 26.6 56.1 24.72008 39.6 44.2 32.1 25.8 57.6 21.9
Male1980 26.9 28.9 17.7 16.3 — —1985 28.4 30.8 20.3 15.1 — —1990 32.4 35.6 25.8 15.4 59.2 8.4!1995 33.1 37.0 26.0 18.7 55.7 27.4!2000 32.6 36.2 25.1 18.5 59.0 12.8!2005 35.3 39.4 28.2 20.7 62.0 25.72006 34.1 37.9 28.1 20.0 58.2 18.1!2007 35.5 39.6 32.2 20.7 56.5 11.8!2008 37.0 41.7 29.7 23.0 53.8 18.7!
Female1980 25.4 26.7 21.3 16.4 — —1985 27.4 29.3 19.3 19.0 — —1990 31.8 34.7 24.7 16.4 54.9 21.7!1995 35.5 38.8 28.7 23.0 53.7 27.8!2000 38.4 41.3 35.2 25.4 52.8 20.5!2005 42.5 46.1 37.6 29.5 59.0 29.52006 40.6 44.1 36.9 27.6 55.8 35.92007 42.1 45.7 34.0 33.0 55.7 34.52008 42.3 46.9 34.2 28.9 61.1 24.3
— Not available.! Interpret data with caution.1 Total includes other race/ethnicity categories not separately shown.NOTE: Race categories exclude persons of Hispanic ethnicity. SOURCE: U.S. Department of Commerce, Census Bureau, Current Population Survey (CPS), selected years, October 1980–2008.

Status and Trends in the Education of Racial and Ethnic Groups122
ind
icat
or
24 —
Enr
ollm
ent
Over the past 25 years, the total enrollment of adults in degree-granting institutions increased for Whites, Blacks, and Hispanics. Within each racial/ethnic group, female enrollment increased more than male enrollment, although the rates of increase varied by race/ethnicity. This indicator also examines differences in the percentage distribution of enrollment by institution type among the races/ethnicities.
24.1. Undergraduate Enrollment
Undergraduate enrollment figures include all students, regardless of age, enrolled either part time or full time in undergraduate studies at a degree-granting institution. Between 1976 and 2008, total undergraduate fall enrollment increased for each racial/ethnic group. Asian/Pacific Islander enrollment increased six-fold, from 169,000 in 1976 to 1,118,000
in 2008. Hispanic enrollment rose from 353,000 in 1976 to 2,103,000 in 2008—approximately six times the enrollment in 1976. These two racial/ethnic groups had the fastest rates of enrollment growth, leading to increases in their share of total enrollment between 1976 and 2008: from 2 to 7 percent for Asians/Pacific Islanders and from 4 to 13 percent for Hispanics.26 During that time period, American Indian/Alaska Native enrollment more than doubled, increasing from 70,000 to 176,000. Black enrollment rose from 943,000 to 2,269,000, increasing their share of overall enrollment from 10 to 14 percent. White enrollment also increased, but at the slowest rate of all racial/ethnic groups. Although White enrollment rose from 7,740,000 to 10,339,000, White enrollment as a percentage of total enrollment declined from 82 percent in 1976 to 63 percent in 2008.
24. Enrollment
26 Percentages are based on total enrollment, including nonresident aliens, for whom race/ethnicity is not known.
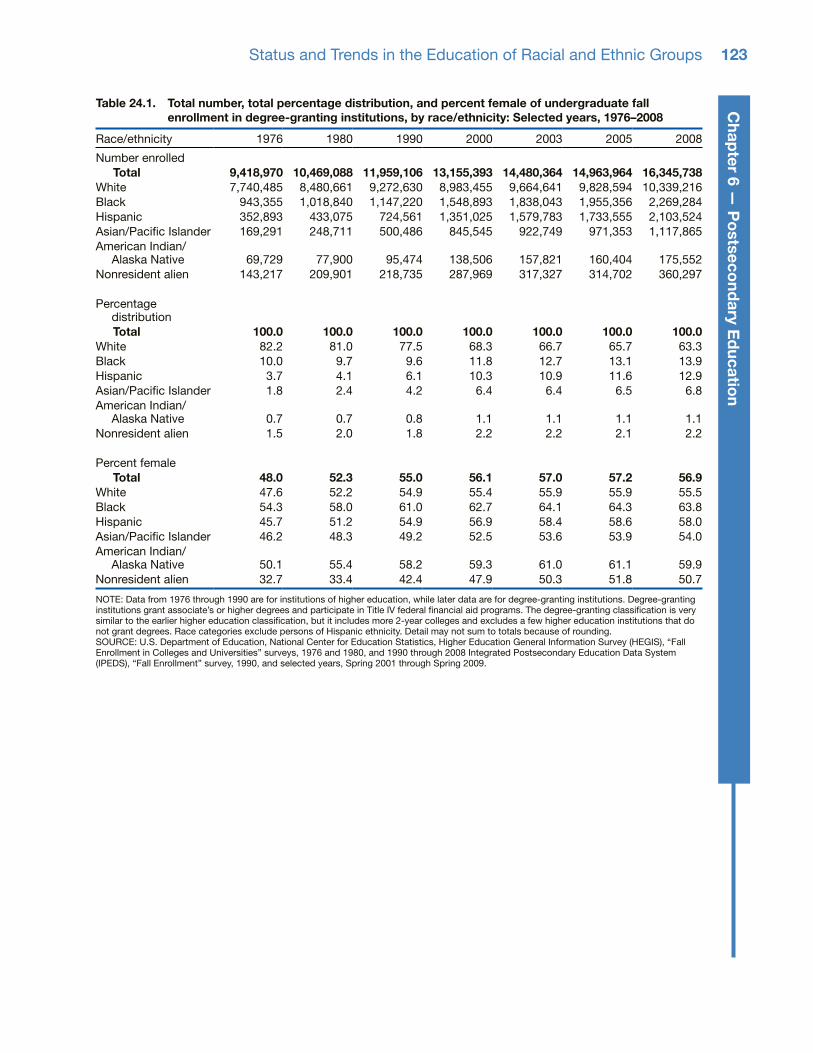
Status and Trends in the Education of Racial and Ethnic Groups 123
Chap
ter 6 — P
ostseco
ndary E
ducatio
ntable 24.1. total number, total percentage distribution, and percent female of undergraduate fall
enrollment in degree-granting institutions, by race/ethnicity: selected years, 1976–2008
Race/ethnicity 1976 1980 1990 2000 2003 2005 2008
Number enrolledtotal 9,418,970 10,469,088 11,959,106 13,155,393 14,480,364 14,963,964 16,345,738
White 7,740,485 8,480,661 9,272,630 8,983,455 9,664,641 9,828,594 10,339,216Black 943,355 1,018,840 1,147,220 1,548,893 1,838,043 1,955,356 2,269,284Hispanic 352,893 433,075 724,561 1,351,025 1,579,783 1,733,555 2,103,524Asian/Pacific Islander 169,291 248,711 500,486 845,545 922,749 971,353 1,117,865American Indian/
Alaska Native 69,729 77,900 95,474 138,506 157,821 160,404 175,552Nonresident alien 143,217 209,901 218,735 287,969 317,327 314,702 360,297
Percentage distributiontotal 100.0 100.0 100.0 100.0 100.0 100.0 100.0
White 82.2 81.0 77.5 68.3 66.7 65.7 63.3Black 10.0 9.7 9.6 11.8 12.7 13.1 13.9Hispanic 3.7 4.1 6.1 10.3 10.9 11.6 12.9Asian/Pacific Islander 1.8 2.4 4.2 6.4 6.4 6.5 6.8American Indian/
Alaska Native 0.7 0.7 0.8 1.1 1.1 1.1 1.1Nonresident alien 1.5 2.0 1.8 2.2 2.2 2.1 2.2
Percent femaletotal 48.0 52.3 55.0 56.1 57.0 57.2 56.9
White 47.6 52.2 54.9 55.4 55.9 55.9 55.5Black 54.3 58.0 61.0 62.7 64.1 64.3 63.8Hispanic 45.7 51.2 54.9 56.9 58.4 58.6 58.0Asian/Pacific Islander 46.2 48.3 49.2 52.5 53.6 53.9 54.0American Indian/
Alaska Native 50.1 55.4 58.2 59.3 61.0 61.1 59.9Nonresident alien 32.7 33.4 42.4 47.9 50.3 51.8 50.7
NOTE: Data from 1976 through 1990 are for institutions of higher education, while later data are for degree-granting institutions. Degree-granting institutions grant associate’s or higher degrees and participate in Title IV federal financial aid programs. The degree-granting classification is very similar to the earlier higher education classification, but it includes more 2-year colleges and excludes a few higher education institutions that do not grant degrees. Race categories exclude persons of Hispanic ethnicity. Detail may not sum to totals because of rounding.SOURCE: U.S. Department of Education, National Center for Education Statistics, Higher Education General Information Survey (HEGIS), “Fall Enrollment in Colleges and Universities” surveys, 1976 and 1980, and 1990 through 2008 Integrated Postsecondary Education Data System (IPEDS), “Fall Enrollment” survey, 1990, and selected years, Spring 2001 through Spring 2009.

Status and Trends in the Education of Racial and Ethnic Groups124
ind
icat
or
24 —
Enr
ollm
ent
Overall, the number of both males and females in undergraduate programs has increased since 1976. By 1980, the percentage of females enrolled as undergraduates surpassed the percentage of males enrolled as undergraduates. The largest difference between male and female enrollments was among Black students. In 1976, some 54 percent of Black undergraduates were female. Over time, Black females continued to enroll in degree-granting institutions in larger numbers than Black males, and in 2008, females accounted for 64 percent of the total Black undergraduate enrollment. American Indian/Alaska Native female enrollment also overtook male enrollment. In 1976, enrollment numbers were almost equal between American Indian/Alaska Native males
and females, but by 2008, females made up 60 percent of the total American Indian/Alaska Native student enrollment. Additionally, females increased their shares of the total Hispanic and White enrollment (from 46 to 58 percent for Hispanic females and from 48 to 56 percent for White females). Between 1976 and 1990, Asian/Pacific Islander females represented less than half of the total Asian/Pacific Islander enrollment. Since 2000, however, more females have enrolled, and in 2008, females represented 54 percent and males represented 46 percent of total Asian/Pacific Islander undergraduate enrollment. For Asians/Pacific Islanders, these percentages are a near reversal from the percentages of three decades earlier.
figure 24.1. Difference in percentages of female and male undergraduate fall enrollment in degree-granting institutions, by race/ethnicity: selected years, 1976–2008
NOTE: Data from 1976 through 1990 are for institutions of higher education, while later data are for degree-granting institutions. Degree-granting institutions grant associate’s or higher degrees and participate in Title IV federal financial aid programs. The degree-granting classification is very similar to the earlier higher education classification, but it includes more 2-year colleges and excludes a few higher education institutions that do not grant degrees. Race categories exclude persons of Hispanic ethnicity. SOURCE: U.S. Department of Education, National Center for Education Statistics, Higher Education General Information Survey (HEGIS), “Fall Enrollment in Colleges and Universities” surveys, 1976 and 1980, and 1990 through 2008 Integrated Postsecondary Education Data System (IPEDS), “Fall Enrollment” survey, 1990, and selected years, Spring 2001 through Spring 2009.
1976 1980 1990 2000 2005 2008-50
-40
-30
-20
-10
0
10
20
30
40
50Difference in percentage (female percent – male percent)
More females enrolled
More males enrolled
Year
�
� White � Black � Hispanic � Asian/Pacific � American Indian/ � Nonresident alien Islander Alaska Native
����
����
�� � � � �
����
�
�
�
�
�
�� � �
�
�� �
� � �
� �
�
��
��

Status and Trends in the Education of Racial and Ethnic Groups 125
Chap
ter 6 — P
ostseco
ndary E
ducatio
n24.2. Graduate Enrollment
Total graduate27 enrollment also increased for each racial/ethnic group between 1976 and 2008. During that time period, Asian/Pacific Islander enrollment grew six-fold, rising from 29,000 to 185,000 students. Hispanic graduate enrollment in 2008 was over five times that of enrollment in 1976, increasing from 31,000 to 169,000 students. Additionally, the number of Black graduate students increased from 90,000 in 1976 to 315,000 in 2008. Each of these racial/ethnic groups increased its share
of total enrollment during this time. For example, the percent of total graduate enrollment increased from 6 to 12 percent for Blacks, from 2 to 6 percent for Hispanics, and from 2 to 7 percent for Asians/Pacific Islanders.28 American Indian/Alaska Native graduate enrollment more than doubled, increasing from 6,400 to 17,700 students. Although the number of White graduate students increased from 1,336,000 to 1,750,000, the percentage share of total enrollment decreased for Whites between 1976 and 2008 from 85 to 64 percent.
27 Includes enrollment in master’s, first-professional, and doctorate programs.28 Percentages are based on total enrollment, including nonresident aliens, for whom race/ethnicity is not known.
table 24.2. total number, total percentage distribution, and percent female of graduate (postbaccalaureate) fall enrollment in degree-granting institutions, by race/ethnicity: selected years, 1976–2008
Race/ethnicity 1976 1980 1990 2000 2003 2005 2008
Number enrolledtotal 1,566,644 1,617,720 1,859,531 2,156,896 2,431,117 2,523,511 2,737,076
White 1,335,646 1,352,351 1,449,830 1,478,644 1,616,272 1,666,846 1,749,565Black 89,670 87,910 99,819 181,425 230,342 259,205 315,194Hispanic 30,897 38,642 57,888 110,781 136,488 148,420 169,364Asian/Pacific Islander 28,587 37,735 71,954 132,679 152,834 163,029 184,932American Indian/
Alaska Native 6,381 6,003 7,319 12,644 14,825 15,899 17,737Nonresident alien 75,463 95,079 172,721 240,723 280,356 270,112 300,284
Percentage distributiontotal 100.0 100.0 100.0 100.0 100.0 100.0 100.0
White 85.3 83.6 78.0 68.6 66.5 66.1 63.9Black 5.7 5.4 5.4 8.4 9.5 10.3 11.5Hispanic 2.0 2.4 3.1 5.1 5.6 5.9 6.2Asian/Pacific Islander 1.8 2.3 3.9 6.2 6.3 6.5 6.8American Indian/
Alaska Native 0.4 0.4 0.4 0.6 0.6 0.6 0.6Nonresident alien 4.8 5.9 9.3 11.2 11.5 10.7 11.0
Percent femaletotal 42.7 46.2 51.4 56.3 57.5 58.5 59.0
White 43.0 46.9 53.3 57.8 58.8 59.4 59.7Black 56.3 59.6 63.2 67.8 69.5 70.4 71.3Hispanic 41.5 47.3 53.3 59.8 61.5 62.2 63.0Asian/Pacific Islander 39.3 39.7 43.8 51.8 54.0 54.7 55.3American Indian/
Alaska Native 41.7 49.7 56.3 60.3 62.1 62.7 63.1Nonresident alien 23.6 25.4 30.4 38.9 40.3 41.6 41.5
NOTE: Data from 1976 through 1990 are for institutions of higher education, while later data are for degree-granting institutions. Degree-granting institutions grant associate’s or higher degrees and participate in Title IV federal financial aid programs. The degree-granting classification is very similar to the earlier higher education classification, but it includes more 2-year colleges and excludes a few higher education institutions that do not grant degrees. Data include enrollment in master’s, first-professional, and doctorate programs. Race categories exclude persons of Hispanic ethnicity. Detail may not sum to totals because of rounding.SOURCE: U.S. Department of Education, National Center for Education Statistics, Higher Education General Information Survey (HEGIS), “Fall Enrollment in Colleges and Universities” surveys, 1976 and 1980, and 1990 through 2008 Integrated Postsecondary Education Data System (IPEDS), “Fall Enrollment” survey, 1990, and selected years, Spring 2001 through Spring 2009.

Status and Trends in the Education of Racial and Ethnic Groups126
ind
icat
or
24 —
Enr
ollm
ent
Shifts between male and female graduate enrollment were similar to shifts between male and female undergraduate enrollment. More females were enrolled in graduate programs in 2008 than males, and the size of the gap differed by race/ethnicity. Again, the difference in the percentages of males and females enrolled was largest for Black students. In 1976, Black females composed 56 percent of the total Black graduate enrollment. Black females continued to enroll at faster rates than did their male counterparts and, by 2008, some 71 percent of Black graduate
students were female. In 1976, females represented less than 50 percent of the total graduate enrollment of Whites, Hispanics, Asians/Pacific Islanders, and American Indians/Alaska Natives. However, between 1976 and 2008, female enrollment grew faster than male enrollment for each of these racial/ethnic groups, and in 2008 females accounted for 60 percent of White, 63 percent of Hispanic, 55 percent of Asian/Pacific Islander, and 63 percent of American Indian/Alaska Native graduate enrollment.
figure 24.2. Difference in percentages of female and male graduate (postbaccalaureate) fall enrollment in degree-granting institutions, by race/ethnicity: selected years, 1976–2008
NOTE: Data from 1976 through 1990 are for institutions of higher education, while later data are for degree-granting institutions. Degree-granting institutions grant associate’s or higher degrees and participate in Title IV federal financial aid programs. The degree-granting classification is very similar to the earlier higher education classification, but it includes more 2-year colleges and excludes a few higher education institutions that do not grant degrees. Race categories exclude persons of Hispanic ethnicity. SOURCE: U.S. Department of Education, National Center for Education Statistics, Higher Education General Information Survey (HEGIS), “Fall Enrollment in Colleges and Universities” surveys, 1976 and 1980, and 1990 through 2008 Integrated Postsecondary Education Data System (IPEDS), “Fall Enrollment” survey, 1990, and selected years, Spring 2001 through Spring 2009.
Difference in percentage (female percent – male percent)
1976 1980 1990
Year
2000 2003 2005 2008-60
-50
-40
-30
-20
-10
0
10
20
30
40
50
More females enrolled
More males enrolled
� White � Black � Hispanic � Asian/Pacific � American Indian/ � Nonresident alien Islander Alaska Native
� �
�
�� � �
����
�
�
�
����
�
�
�
����
����
�
�
�
��
�
��
� �
�
�
�

Status and Trends in the Education of Racial and Ethnic Groups 127
Chap
ter 6 — P
ostseco
ndary E
ducatio
n24.3 Enrollment by Institutional Type
Within the broader context of higher education are several different types of institutions. In terms of governance, institutions are public, private not-for-profit, or private for-profit. The first group includes most traditional state university systems, as well as community colleges. The second group ranges from major research universities, such as Harvard or Stanford, to small liberal arts colleges. The third group includes privately operated higher education corporations, such as Strayer University or the University of Phoenix. Beyond their ownership structure, postsecondary institutions can also be characterized by the length of programs offered, from less than 2-year to 4-year institutions, and by their level of research activity.
In 2008, some 73 percent of the 18.4 million U.S. college students attended public institutions, 19 percent attended private not-for-profit institutions, and 8 percent attended private for-profit institutions. There were variations by race/ethnicity, however. About 81 percent of Hispanics and 79 percent of American Indians/Alaska Natives attended public institutions, higher than the percentages for Whites (73 percent), Blacks (68 percent), and Asians/Pacific
Islanders (75 percent). Some 21 percent of White, 18 percent of Asian/Pacific Islander, and 17 percent of Black students attended private not-for-profit institutions, while 11 percent of Hispanic and 12 percent of American Indian/Alaska Native students did so. A higher percentage of Black students (15 percent) attended private for-profit institutions than of students of any of the other races/ethnicities shown (ranging from 6 to 8 percent).
Enrollment among the races/ethnicities also varied by the length of programs offered and by the level of research activity at the institutions that students attended. About 24 percent of Asian/Pacific Islander students and 22 percent of White students attended public research institutions,29 higher than the percentages for Black, Hispanic, and American Indian/Alaska Native students (ranging from 13 to 17 percent). A higher percentage of Asian/Pacific Islander students attended private research institutions (9 percent) compared with the other races/ethnicities shown (ranging from 3 to 6 percent). Almost half (49 percent) of Hispanic college and university students attended public 2-year institutions, a higher percentage than any other race/ethnicity shown (ranging from 33 to 42 percent).
29 Research institutions include those with a high level of research activity or those that award at least 20 doctor’s degrees per year. Relative levels of research activity for research universities were determined by an analysis of research and development expendi-tures, science and engineering research staffing, and doctoral degrees conferred, by field. Further information on the research index ranking may be obtained from http://www.carnegiefoundation.org/classifications/index.asp?key=798#related.

Status and Trends in the Education of Racial and Ethnic Groups128
ind
icat
or
24 —
Enr
ollm
ent
table 24.3. number and percentage distribution of u.s. citizen enrollment in degree-granting institutions, by race/ethnicity and institutional type: 2008
Institutional type Total White Black HispanicAsian/Pacific
Islander
American Indian/Alaska
Native
Number enrolledtotal, all types 18,442,233 12,088,781 2,584,478 2,272,888 1,302,797 193,289
Public institutions 13,545,180 8,817,677 1,759,200 1,832,397 982,876 153,030Research 3,614,610 2,612,923 355,490 294,693 318,678 32,826Other 4-year 3,392,814 2,266,300 471,852 415,226 199,662 39,7742-year 6,537,756 3,938,454 931,858 1,122,478 464,536 80,430
Private, not-for-profit 3,454,943 2,513,749 431,988 248,545 236,537 24,124
Research 1,012,479 692,750 103,743 87,379 122,796 5,811Other 4-year 2,407,925 1,799,663 321,311 158,120 112,079 16,7522-year 34,539 21,336 6,934 3,046 1,662 1,561
Private, for-profit 1,442,110 757,355 393,290 191,946 83,384 16,1354-year 1,147,730 615,507 312,559 136,784 70,205 12,6752-year 294,380 141,848 80,731 55,162 13,179 3,460
Percentage distributiontotal, all types 100.0 100.0 100.0 100.0 100.0 100.0
Public institutions 73.4 72.9 68.1 80.6 75.4 79.2Research 19.6 21.6 13.8 13.0 24.5 17.0Other 4-year 18.4 18.7 18.3 18.3 15.3 20.62-year 35.4 32.6 36.1 49.4 35.7 41.6
Private, not-for-profit 18.7 20.8 16.7 10.9 18.2 12.5
Research 5.5 5.7 4.0 3.8 9.4 3.0Other 4-year 13.1 14.9 12.4 7.0 8.6 8.72-year 0.2 0.2 0.3 0.1 0.1 0.8
Private, for-profit 7.8 6.3 15.2 8.4 6.4 8.34-year 6.2 5.1 12.1 6.0 5.4 6.62-year 1.6 1.2 3.1 2.4 1.0 1.8
NOTE: Nonresident alien enrollment is not included in table. Research institutions include those with a high level of research activity or those that award at least 20 doctor’s degrees per year. Relative levels of research activity for research universities were determined by an analysis of research and development expenditures, science and engineering research staffing, and doctoral degrees conferred, by field. Further information on the research index ranking may be obtained from http://www.carnegiefoundation.org/classifications/index.asp?key=798#related. Other 4-year institutions include those that award at least 50 master’s degrees per year, those that primarily emphasize undergraduate education, and those that award degrees primarily in single fields of study such as medicine, business, fine arts, theology, and engineering. SOURCE: U.S. Department of Education, National Center for Education Statistics, 2008 Integrated Postsecondary Education Data System (IPEDS), Spring 2009.

Status and Trends in the Education of Racial and Ethnic Groups 129
Chap
ter 6 — P
ostseco
ndary E
ducatio
nfigure 24.3. Percentage distribution of u.s. citizen enrollment in degree-granting institutions, by
institutional type and race/ethnicity: 2008
NOTE: Research institutions include those with a high level of research activity or those that award at least 20 doctor’s degrees per year. Relative levels of research activity for research universities were determined by an analysis of research and development expenditures, science and engineering research staffing, and doctoral degrees conferred, by field. Further information on the research index ranking may be obtained from http://www.carnegiefoundation.org/classifications/index.asp?key=798#related. Other 4-year institutions include those that award at least 50 master’s degrees per year, those that primarily emphasize undergraduate education, and those that award degrees primarily in single fields of study such as medicine, business, fine arts, theology, and engineering. SOURCE: U.S. Department of Education, National Center for Education Statistics, 2008 Integrated Postsecondary Education Data System (IPEDS), Spring 2009.
■ White ■ Black ■ Hispanic ■ Asian/Pacific Islander ■ American Indian/Alaska Native
Privatefor-profit
2-year
Privatefor-profit
4-year
Privatenot-for-profit other 4-year
Privatenot-for-profit
research
Public2-year
Publicother
4-year
Publicresearch
Institutional type
50403020
Percent
100
2214
1324
17
191818
1521
3336
4936
42
6
44
93
15
127
99
512
65
7
13
21
2

Status and Trends in the Education of Racial and Ethnic Groups130
ind
icat
or
24 —
Enr
ollm
ent
Almost 2.8 million college students are enrolled in institutions that serve large percentages of particular races/ethnicities. Historically Black colleges and universities (HBCUs) are those that were established prior to 1964 and have the principal mission of educating Black Americans. In 2007, approximately 11 percent of Black students attended one of these institutions. Half of all Hispanic college and university students (50 percent) attended an institution in which Hispanics represent 25 percent or more of the full-time equivalent undergraduate enrollment (sometimes referred to as “Hispanic serving institutions,” or HSIs). Tribally controlled institutions are, for the most part, located on reservations and controlled by a Native American tribe. Of the total American Indian/Alaska Native college and university enrollment, 7 percent attended one of these institutions in 2007.
Snapshot: Enrollment in Historically Black Colleges and Universities, Hispanic Serving Institutions, and Tribal Colleges
table 24.4. fall enrollment in degree-granting institutions that are historically Black colleges and universities, in institutions that serve large proportions of Hispanic students, and in tribally controlled institutions, by selected race/ethnicity: 2007
Institution and race/ethnicity Enrollment
Enrollment in historically Black colleges and universities (HBCUs) 306,515As a percentage of total enrollment 1.7
Black HBCU enrollment 253,415As a percentage of total Black enrollment 10.6
Enrollment in institutions that serve large proportions of Hispanic students 2,453,109As a percentage of total enrollment 13.4
Hispanic enrollment in institutions that serve large proportions of Hispanic students 1,034,762As a percentage of total Hispanic enrollment 49.8
Enrollment in tribally controlled institutions 17,418As a percentage of total enrollment 0.1
American Indian/Alaska Native enrollment in tribally controlled institutions 13,820As a percentage of total American Indian/Alaska Native enrollment 7.3
NOTE: Historically Black colleges and universities are degree-granting institutions established prior to 1964 with the principal mission of educating Black Americans. Federal regulations, 20 U.S. Code, Section 1061 (2), allow for certain exceptions to the founding date. Institutions that serve large proportions of Hispanic students are defined as institutions with a full-time-equivalent undergraduate enrollment of Hispanic students that represent 25 percent or more of the full-time-equivalent undergraduate enrollment of U.S. citizens. Tribally controlled institutions are, with a few exceptions, tribally controlled and located on reservations—they are all members of the American Indian Higher Education Consortium. SOURCE: U.S. Department of Education, National Center for Education Statistics, 2007 Integrated Postsecondary Education Data System (IPEDS), Spring 2008.

This page intentionally left blank.

Status and Trends in the Education of Racial and Ethnic Groups132
ind
icat
or
25 —
fin
anci
al A
id The cost of a postsecondary education is a potential barrier to completing an undergraduate degree. Financial aid can help ease this burden. Financial aid includes assistance in the form of grants, loans, work-study, or any other type of aid. In the 2007–08 school year, the percentage of full-time undergraduate students who received financial aid and the amount of financial aid received varied by racial/ethnic group.
In 2007–08, a higher percentage of Black full-time, full-year undergraduate students received financial aid than did White, Hispanic, Asian, and Native Hawaiian or Other Pacific Islander full-time, full-year undergraduates and full-time, full-year undergraduates of two or more races. Ninety-two percent of full-time, full-year Black undergraduate students received financial aid, compared to 85 percent of Hispanic students, 77 percent of White students, 68 percent of Asian students, 80 percent of Native Hawaiian or Other Pacific Islander students, and 83 percent of students or two or more races. The percentage of American Indian/Alaska Native students (85 percent) who received aid was not measurably different from the percentage of Black students who received aid, in part due to a large standard error.
Grants and loans are two primary forms of financial aid. Grants are a type of student financial aid that does not require repayment or employment. Grants include need-based grants, merit-only scholarships, tuition waivers, and employer tuition reimbursements. In contrast, loans require repayment and can be issued by federal, state, institutional, or private sector financial institutions. Loans also include federal PLUS loans30 to parents, but do not include loans from family or friends to the student or commercial loans to parents.
In 2007–08, among full-time, full-year students who received financial aid, Black students received higher average amounts of aid ($13,500), than White ($12,900), Hispanic ($11,400), Asian ($12,600), and American Indian/Alaska Native ($10,900) students. Hispanic students received a lower average amount of aid than White and Asian students. Asian students received the highest amount of aid in the form of grants ($8,800). However, Asian students received a lower amount of aid in the form of loans ($8,800) than did White students ($9,800).
25. financial Aid
30 Federal PLUS loans are available to parents of dependent undergraduate students and include Direct Loans from the federal government and loans from private lenders under the Federal Family Education Loan (FFEL) program.
table 25. Percentage of full-time, full-year undergraduates receiving financial aid and average amount of aid, by race/ethnicity and type of aid: 2007–08
Percent receiving aid Average amount of aid
Race/ethnicity Any aid Grants Loans Any aid Grants Loans Total1 79.5 64.4 53.3 $12,700 $7,100 $9,500
White 77.2 60.5 52.6 12,900 7,100 9,800Black 91.9 79.5 70.1 13,500 7,000 8,900Hispanic 85.2 74.0 49.2 11,400 6,500 9,000Asian 68.3 55.8 37.0 12,600 8,800 8,800Native Hawaiian/Pacific
Islander 80.3 68.4 53.1 13,400 6,100 11,100American Indian/Alaska Native 85.2 76.0 47.6 10,900 6,700 8,000Two or more races 82.7 67.0 57.6 13,600 8,200 8,9001 Total includes other race/ethnicity categories not separately shown.NOTE: Students may receive aid from multiple sources. Estimates include PLUS loans (loans to parents). Data include undergraduates in degree-granting and non-degree-granting institutions. Race categories exclude persons of Hispanic ethnicity.SOURCE: U.S. Department of Education, National Center for Education Statistics, 2007–08 National Postsecondary Student Aid Study (NPSAS:08).

Status and Trends in the Education of Racial and Ethnic Groups 133
Chap
ter 6 — P
ostseco
ndary E
ducatio
nfigure 25a. Percentage of full-time, full-year undergraduates receiving financial aid, by race/ethnicity:
2007–08
NOTE: Race categories exclude persons of Hispanic ethnicity. SOURCE: U.S. Department of Education, National Center for Education Statistics, 2007–08 National Postsecondary Student Aid Study (NPSAS:08).
figure 25b. Average amount of financial aid awarded to full-time, full-year undergraduates, by race/ethnicity and type of aid: 2007–08
NOTE: Aid averages are for those full-time, full-year students who received the specified type of aid. Students may receive aid from multiple sources. Figures include PLUS loans (loans to parents). Data include undergraduates in degree-granting and non-degree-granting institutions. Race categories exclude persons of Hispanic ethnicity. SOURCE: U.S. Department of Education, National Center for Education Statistics, 2007–08 National Postsecondary Student Aid Study (NPSAS:08).
30
White Black Hispanic Asian
Race/ethnicity
Native Hawaiian/
Pacific Islander
American Indian/
Alaska Native
Two or more races
0
10
20
40
50
60
70
80
90
100Percent
77
9285
68
8085 83
Total:80%
Any aid Grants
Type of aid
Loans0
3,000
6,000
9,000
12,000
$15,000Dollars
■ White ■ Black ■ Hispanic ■ Asian ■ Native Hawaiian/ ■ American Indian/ ■ Two or more Pacific Islander Alaska Native races

Status and Trends in the Education of Racial and Ethnic Groups134
ind
icat
or
26 —
Deg
rees
Aw
ard
ed Adults who graduate from a postsecondary institution have more stable employment patterns and higher earnings than adults without postsecondary degrees (indicators 28 and 29). This indicator provides a snapshot by race/ethnicity of the degrees conferred in the 2007–08 school year with a focus on the different types of degrees earned, the differences in the number of degrees earned by males and females, and the most common fields of study.
26.1. Types of Degrees
Over 3 million degrees were awarded in 2008; about half of these degrees (51 percent) were bachelor’s degrees. Twenty-four percent of all degrees conferred were associate’s degrees, 20 percent were master’s degrees, 3 percent were first-professional degrees, and 2 percent were doctor’s degrees. This overall distribution of degrees awarded was not the same for each racial/ethnic group.
Bachelor’s degrees were the most common degree conferred for all races/ethnicities shown: 54 percent of degrees conferred on Asians/Pacific Islanders were bachelor’s degrees, compared with 53 percent conferred on Whites, 48 percent conferred on
Hispanics, 47 percent conferred on Blacks, and 46 percent conferred on American Indians/Alaska Natives. In 2008, a higher percentage of the total degrees earned by Hispanics and American Indians/Alaska Natives were associate’s degrees compared with other racial/ethnic groups: 36 percent of degrees conferred on Hispanics and 35 percent of degrees conferred on American Indians/Alaska Natives were associate’s degrees, compared with 30 percent for Blacks, 23 percent for Whites, and 19 percent for Asians/Pacific Islanders.
Master’s degrees accounted for 19 to 20 percent of all degrees awarded to Whites, Blacks, and Asians/Pacific Islanders, whereas master’s degrees accounted for 15 percent of degrees of American Indians/Alaska Natives and 14 percent of degrees of Hispanics. The percentage of first-professional degrees conferred on Asians/Pacific Islanders (6 percent) was higher than the percentages of first-professional degrees conferred on all other racial/ethnic groups shown, including Whites (3 percent), American Indians/Alaska Natives (3 percent), Blacks (2 percent) and Hispanics (2 percent). The percentage of doctor’s degrees awarded ranged from 1 to 2 percent of all degrees conferred in 2007 for each race/ethnicity shown.
26. Degrees Awarded

Status and Trends in the Education of Racial and Ethnic Groups 135
Chap
ter 6 — P
ostseco
ndary E
ducatio
nTable 26.1. Number, percentage conferred on females, and percentage distribution of degrees awarded
by degree-granting institutions, by level of degree, race/ethnicity, and sex: 2007–08
Race/ethnicity and sex Total Associate’s Bachelor’s Master’sFirst-
professional1 Doctor’s
Number of degreesTotal2 3,093,277 750,164 1,563,069 625,023 91,309 63,712
White 2,134,839 501,079 1,122,675 409,312 65,383 36,390Male 892,057 194,099 492,137 155,035 34,618 16,168Female 1,242,782 306,980 630,538 254,277 30,765 20,222Percent female 58.2 61.3 56.2 62.1 47.1 55.6
Black 323,527 95,702 152,457 65,062 6,400 3,906Male 104,321 30,016 52,247 18,357 2,389 1,312Female 219,206 65,686 100,210 46,705 4,011 2,594Percent female 67.8 68.6 65.7 71.8 62.7 66.4
Hispanic 256,940 91,274 123,048 36,801 4,840 2,279Male 98,036 33,817 47,884 13,057 2,301 977Female 158,904 57,457 75,164 23,744 2,539 1,302Percent female 61.8 63.0 61.1 64.5 52.5 57.1
Asian/Pacific Islander 200,773 38,843 109,058 37,408 11,846 3,618Male 89,411 15,936 49,485 17,227 5,135 1,628Female 111,362 22,907 59,573 20,181 6,711 1,990Percent female 55.5 59.0 54.6 53.9 56.7 55.0
American Indian/Alaska Native 25,063 8,849 11,509 3,758 675 272
Male 9,264 3,003 4,523 1,280 343 115Female 15,799 5,846 6,986 2,478 332 157Percent female 63.0 66.1 60.7 65.9 49.2 57.7
Percentage distributionTotal2 100.0 24.3 50.5 20.2 3.0 2.1
White 100.0 23.5 52.6 19.2 3.1 1.7Male 100.0 21.8 55.2 17.4 3.9 1.8Female 100.0 24.7 50.7 20.5 2.5 1.6
Black 100.0 29.6 47.1 20.1 2.0 1.2Male 100.0 28.8 50.1 17.6 2.3 1.3Female 100.0 30.0 45.7 21.3 1.8 1.2
Hispanic 100.0 35.5 47.9 14.3 1.9 0.9Male 100.0 34.5 48.8 13.3 2.3 1.0Female 100.0 36.2 47.3 14.9 1.6 0.8
Asian/Pacific Islander 100.0 19.3 54.3 18.6 5.9 1.8Male 100.0 17.8 55.3 19.3 5.7 1.8Female 100.0 20.6 53.5 18.1 6.0 1.8
American Indian/Alaska Native 100.0 35.3 45.9 15.0 2.7 1.1
Male 100.0 32.4 48.8 13.8 3.7 1.2Female 100.0 37.0 44.2 15.7 2.1 1.0
1 Includes degrees that require at least 6 years of college work for completion (including at least 2 years of preprofessional training). By the National Center for Education Statistics’ definition, first-professional degrees are awarded in the fields of dentistry (D.D.S. or D.M.D.), medicine (M.D.), optometry (O.D.), osteopathic medicine (D.O.), pharmacy (D.Phar.), podiatric medicine (D.P.M.), veterinary medicine (D.V.M.), chiropractic (D.C. or D.C.M.), law (J.D.), and theological professions (M.Div. or M.H.L.).2 Includes degrees conferred to nonresident aliens not separately shown; therefore, numbers within each degree do not sum to totals.NOTE: Estimates in this table may differ from those reported in other publications due to a change in the level of award categories; see Appendix A: Guide to Sources for more information. Race categories exclude persons of Hispanic ethnicity. Detail may not sum to totals because of rounding.SOURCE: U.S. Department of Education, National Center for Education Statistics, 2007–08 Integrated Postsecondary Education Data System (IPEDS), Fall 2008.

Status and Trends in the Education of Racial and Ethnic Groups136
ind
icat
or
26 —
Deg
rees
Aw
ard
edWithin each racial/ethnic group shown, more females than males received degrees in 2008, which reflects the increased number of females enrolling in degree-granting institutions (see indicator 24). The difference in the number of degrees awarded to females and males was pronounced among Blacks, with Black females representing 68 percent of recipients and receiving over twice as many degrees (219,200) as Black males (104,300). This pattern was evident across the levels of degrees, with about twice as many degrees conferred on Black females as Black males at each level. The largest difference was seen at the master’s degree level: about 2.5 times as many Black females received master’s degrees as Black males. The difference in the number of degrees between
the sexes was also seen for other races/ethnicities: the percentage of degrees conferred on females was 63 percent for American Indians/Alaska Natives, 62 percent for Hispanics, 58 percent for Whites, and 55 percent for Asians/Pacific Islanders. Similar patterns were evident across levels of degree; for example, the percentage of bachelor’s degrees conferred on females was 66 percent for Blacks, 61 percent each for Hispanics and American Indians/Alaska Natives, 56 percent for Whites, and 55 percent for Asians/Pacific Islanders. The only exception to this overall pattern was seen among Whites earning first-professional degrees: in 2008, White males earned about 3,900 more first professional degrees than White females.
figure 26. Percentage distribution of bachelor’s degrees awarded by degree-granting institutions, by sex and race/ethnicity: 2007–08
NOTE: Race categories exclude persons of Hispanic ethnicity. Detail may not sum to totals because of rounding. SOURCE: U.S. Department of Education, National Center for Education Statistics, 2007–08 Integrated Postsecondary Education Data System (IPEDS), Fall 2008.
White Black Hispanic
Race/ethnicity
Asian/Pacific Islander
American Indian/Alaska Native
0
10
20
30
40
50
60
70
80
90
100Percent
56
44
66
34
61
39
55
45
61
39
■ Male ■ Female

Status and Trends in the Education of Racial and Ethnic Groups 137
Chap
ter 6 — P
ostseco
ndary E
ducatio
n26.2. Degrees by Level and Field of Study
In 2007–08, similarities and differences existed in the relative percentage of bachelor’s, master’s, and doctor’s degrees awarded in various fields of study among the races/ethnicities shown. This indicator discusses the 10 most popular fields of study as measured by the percentage of degrees awarded in those fields for each type of degree.
Business was the most popular bachelor’s degree for all racial/ethnic groups shown, followed by the social sciences and history. Of all racial/ethnic groups, Blacks had the highest percentage of bachelor’s degrees awarded in business (25 percent) and the lowest percentage awarded in engineering and engineering technologies (3 percent). Asians/Pacific Islanders received 12 percent of their bachelor’s degrees in the biological and biomedical sciences and 9 percent in engineering technologies; these were higher percentages than those of all other racial/ethnic groups shown. They also received the lowest percentage of degrees in education (2 percent) of any racial/ethnic group shown. American Indians/Alaska Natives and Whites had higher percentages of their bachelor’s degrees awarded in education (8 percent for both) than all other racial/ethnic groups shown.
The most popular master’s degrees were in education and business. This was true for all racial/ethnic groups shown, although the relative percentages varied. For example, although education was either the most
common or second most common field of study for all races/ethnicities shown, 12 percent of master’s degrees awarded to Asians/Pacific Islanders were in education, compared with the 33 percent awarded to Whites and 33 percent awarded to Hispanics. Asians/Pacific Islanders had higher percentages of their master’s degrees awarded in engineering and engineering technologies (11 percent), computer and information sciences and support services (5 percent), and biological and biomedical sciences (3 percent) than all other racial/ethnic groups shown. American Indians/Alaska Natives, Blacks, and Hispanics received higher percentages of master’s degrees in public administration and social services (8 to 9 percent) than all other racial/ethnic groups shown. Blacks earned the lowest percentage of their master’s degrees in engineering and engineering technologies (2 percent) of any racial/ethnic group shown.
There was also variation by race and ethnicity in the fields of study for doctor’s degrees. For example, 37 percent of all doctor’s degrees awarded to Blacks were in education, compared with 15 percent for Whites, 19 percent for Hispanics, 8 percent for Asians/Pacific Islanders, and 22 percent for American Indians/Alaska Natives. Also, 15 percent of degrees awarded to Asians/Pacific Islanders were in engineering and engineering technologies—this percentage was higher than the respective percentages for all other races/ethnicities shown (ranging from 4 to 6 percent).

Status and Trends in the Education of Racial and Ethnic Groups138
ind
icat
or
26 —
Deg
rees
Aw
ard
edtable 26.2. Percentage of degrees awarded by degree-granting institutions in the most popular fields of
study, by race/ethnicity and level of study: 2007–08
Level and field of study Total1 White Black Hispanic
Asian/Pacific
Islander
American Indian/ Alaska Native
Bachelor’s degreestotal 100.0 100.0 100.0 100.0 100.0 100.0
Biological and biomedical sciences 5.0 4.5 4.0 4.2 11.9 4.5Business 21.4 20.4 24.9 21.2 22.6 19.3Communication and communications
technologies 5.2 5.5 5.3 4.7 3.4 4.0Education 6.6 7.7 4.3 4.4 1.9 7.9Engineering and engineering technologies 5.3 5.2 3.0 4.4 8.7 4.2English language and literature/letters 3.5 3.9 2.8 3.1 2.4 3.2Health professions and related clinical sciences 7.1 7.3 8.4 5.5 6.5 7.2Psychology 5.9 5.7 7.2 7.2 5.8 5.9Social sciences and history 10.7 10.6 10.0 11.9 12.0 12.0Visual and performing arts 5.6 6.0 3.4 5.2 5.3 5.3
Master’s degreestotal 100.0 100.0 100.0 100.0 100.0 100.0
Biological and biomedical sciences 1.5 1.4 0.9 1.3 3.0 1.7Business 24.9 22.1 31.6 23.2 36.4 22.6Computer and information sciences 2.7 1.5 1.7 1.3 5.1 1.4Education 28.1 33.0 27.7 32.7 12.2 32.2Engineering and engineering technologies 5.5 3.4 1.9 3.5 10.6 2.7Health professions and related clinical sciences 9.3 10.1 9.4 8.9 11.1 10.8Psychology 3.4 3.7 4.5 4.6 2.4 3.4Public administration and social services 5.3 5.1 9.5 7.5 3.8 7.8Social sciences and history 3.0 2.9 2.0 2.6 2.5 2.4Visual and performing arts 2.3 2.4 1.0 1.8 2.3 1.4
Doctor’s degreestotal 100.0 100.0 100.0 100.0 100.0 100.0
Biological and biomedical sciences 10.9 10.1 6.2 11.1 16.4 6.3Business 3.3 2.8 5.8 2.6 3.2 5.5Computer and information sciences 2.7 1.4 0.8 0.6 2.8 0.0Education 13.3 15.4 36.8 19.4 7.8 22.4Engineering and engineering technologies 12.8 6.5 3.6 6.1 15.3 5.9Health professions and related clinical sciences 15.5 21.3 11.7 15.8 15.9 16.5Physical sciences and science technologies 7.5 6.1 2.4 5.3 6.7 2.9Psychology 8.3 10.8 9.2 14.3 8.8 16.2Social sciences and history 6.4 6.2 4.7 7.1 5.7 5.5Visual and performing arts 2.3 2.6 1.1 1.5 2.4 1.81 Includes degrees conferred to nonresident aliens not separately shown.NOTE: Reported racial/ethnic distributions of students by level of degree, field of degree, and sex were used to estimate race/ethnicity for students whose race/ethnicity was not reported. Detail does not sum to totals because degree-granting institutions conferred degrees in many other fields not shown separately. Race categories exclude persons of Hispanic ethnicity.SOURCE: U.S. Department of Education, National Center for Education Statistics, 2007–08 Integrated Postsecondary Education Data System (IPEDS), Fall 2008.

The final chapter of this report discusses three measures of educational outcomes in adults. Indicator 27 looks at educational attainment and completion. In 2008, about 29 percent of U.S. adults over the age of 25 had at least a bachelor’s degree, an increase of 6 percentage points from 1996. In 2008, 13 percent of Hispanic adults and 15 percent of American Indian/Alaska Native adults had obtained at least a bachelor’s degree, compared with 52 percent of Asians/Pacific Islanders, 33 percent of Whites, and 20 percent of Blacks.
Adults with higher levels of education had higher median incomes and lower unemployment rates than their less educated peers. In 2008, about 5 percent of the labor force ages 16 and over were unemployed. The unemployment rates for Hispanics (8 percent), Blacks (9 percent), American Indians/Alaska Natives
(10 percent) and persons of two or more races (10 percent) were higher than the unemployment rates for Asians and Whites (4 percent each) (indicator 28). In general, higher unemployment rates were associated with lower levels of education for each racial/ethnic group. For example, the unemployment rate for Blacks without a high school credential was 22 percent, compared with 11 percent for Blacks with a high school credential and 4 percent for Blacks with at least a bachelor’s degree. Finally, the median income in 2007 for all full-time, full-year workers ages 25 and over was $41,000 (indicator 29). White workers at all educational levels, other than doctorate or first-professional, had higher median incomes than Black workers at the same educational level. Similarly, Whites at all educational levels, other than master’s, had higher median incomes than Hispanics at the same level.
7
OutCOmEs Of EDuCAtiOn

Status and Trends in the Education of Racial and Ethnic Groups140
ind
icat
or
27 —
Ed
ucat
iona
l Att
ainm
ent
Educational attainment contributes to future earnings and employment opportunities. In 2008, about 87 percent of U.S. adults over the age of 25 had completed at least high school or the equivalent. This was a 5 percentage point increase from 1996. Similarly, in 2008, about 29 percent of U.S. adults over the age of 25 had at least a bachelor’s degree, an increase of 6 percentage points from 1996.
Overall, Hispanic adults in the United States had lower rates of high school attainment than adults of other racial/ethnic groups. In 2008, about 62 percent of Hispanic adults over the age of 25 had completed at least high school or the equivalent, while 92 percent of Whites, 89 percent of Asians/Pacific Islanders, 83 percent of Blacks, and 78 percent of American Indians/Alaska Natives had done so. Between 1996 and 2008, the percentage of adults who had completed at least high school increased for each race/ethnicity, and some gaps between racial/ethnic groups decreased. For example, the percentage of adults who had completed at least high school increased by 9 percentage points each for Blacks and Hispanics, compared with an increase of 5 percentage points each for Whites and Asians/Pacific Islanders.
In 2008, in terms of college education, 13 percent of Hispanic adults and 15 percent of American Indian/Alaska Native adults had obtained at least a bachelor’s degree; 52 percent of Asians/Pacific Islanders, 33 percent of Whites, and 20 percent of Blacks had done so. Although bachelor’s degree attainment rates for all racial/ethnic groups have increased over the past 12 years, gaps are not narrowing and, in some cases, they are widening. For example, between 1996 and 2008, the percentage of adults who had at least a bachelor’s degree increased by 10 percentage points for Asians/Pacific Islanders, by 7 percentage points for Whites, by 6 percentage points for Blacks, and by 4 percentage points each for Hispanics and American Indians/Alaska Natives.
In 2007, a higher percentage of White and Black adults (ages 25 to 29) that were born in the United States (refers to the 50 states and District of Columbia) had at least a bachelor’s degree (45 and 24 percent, respectively) than did White and Black adults in this age group that were born outside of the United States (32 and 16 percent, respectively). For Hispanics and Native Hawaiians/Pacific Islanders, a higher percentage of adults (ages 25 to 29) born in the United States had at least a bachelor’s degree (16 and 24 percent, respectively), than did adults born outside the United States (8 and 11 percent, respectively).
27. Educational Attainment
figure 27. Percentage of adults ages 25 and over who completed at least high school and percentage who have at least a bachelor’s degree, by race/ethnicity: selected years, 1996–2008
NOTE: “Completed high school” includes persons with a high school diploma or equivalent. Race categories exclude persons of Hispanic ethnicity. SOURCE: U.S. Department of Commerce, Census Bureau, Current Population Survey (CPS), Annual Demographic Supplement, 1996, 2000, 2004, and Annual Social and Economic Supplement, 2008.
1996 2000
Year Year
2004 2008 1996 2000 2004 20080
10
20
30
40
50
60
70
80
90
100
0
10
20
30
40
50
60
70
80
90
100Percent
Percent who have at least a bachelor’s degreePercent
Percent who completedat least high school
� � � �
� White � Black � Hispanic � Asian/Pacific Islander � American Indian/Alaska Native
� � � �
�� � �
�� �
�
� � � �
���
�
��� �
����� � � �� � � �

Status and Trends in the Education of Racial and Ethnic Groups 141
Chap
ter 7 — O
utcom
es of E
ducatio
ntable 27a. Percentage distribution of adults ages 25 and over according to highest level of educational
attainment, by race/ethnicity: selected years, 1996–2008
Race/ethnicity and year
Less than high
school comple-
tion
At least high school completion
Total
High school
comple-tion1
Some college
Asso-ciate’s degree
At least a bachelor’s degree
TotalBachelor’s
degreeMaster’s
degree
Doctorate or first-profes-
sional degree
Total1996 18.3 81.7 33.6 17.3 7.2 23.6 15.8 5.4 2.42000 15.9 84.1 33.1 17.6 7.8 25.6 17.0 5.9 2.62004 14.8 85.2 32.0 17.0 8.4 27.7 18.1 6.7 2.92008 13.4 86.6 31.2 17.2 8.8 29.4 19.1 7.5 2.8
White1996 14.0 86.0 34.7 17.8 7.6 25.9 17.2 6.0 2.72000 11.6 88.4 34.1 17.9 8.4 28.1 18.6 6.5 2.92004 10.0 90.0 32.8 17.6 9.0 30.6 19.8 7.6 3.22008 8.5 91.5 31.6 17.9 9.3 32.6 21.1 8.4 3.1
Black1996 25.4 74.6 35.3 18.8 6.7 13.8 10.1 2.9 0.82000 21.1 78.9 35.3 20.1 6.8 16.6 11.5 4.2 0.92004 18.9 81.1 36.2 19.3 7.9 17.7 12.4 4.1 1.22008 16.7 83.3 35.1 19.6 8.9 19.7 13.6 4.9 1.3
Hispanic1996 46.9 53.1 26.0 13.2 4.6 9.3 6.7 1.8 0.92000 43.0 57.0 27.9 13.5 5.0 10.6 7.3 2.2 1.22004 41.6 58.4 27.7 13.2 5.4 12.1 8.8 2.2 1.12008 37.7 62.3 29.6 13.3 6.1 13.3 9.4 2.9 1.0
Asian/Pacific Islander
1996 16.5 83.5 21.7 12.1 7.3 42.3 27.8 9.2 5.32000 14.3 85.7 22.0 12.4 7.0 44.4 28.9 9.5 5.92004 13.1 86.9 20.3 10.6 7.2 48.9 29.7 11.9 7.22008 11.0 89.0 20.0 10.2 6.9 51.9 31.6 14.0 6.4
American Indian/ Alaska Native
1996 27.6 72.4 33.6 20.4 7.2 11.2 5.9 3.7 1.6!2000 24.1 75.9 33.2 20.2 9.0 13.6 9.7 2.9 1.0!2004 22.2 77.8 31.0 21.5 11.0 14.3 9.2 3.6 1.5!2008 21.6 78.4 33.4 21.7 8.4 14.9 9.8 3.6 1.4
! Interpret data with caution.1 Includes high school diploma or equivalent.NOTE: Race categories exclude persons of Hispanic ethnicity. Detail may not sum to totals because of rounding.SOURCE: U.S. Department of Commerce, Census Bureau, Current Population Survey (CPS), Annual Demographic Supplement, 1996, 2000, 2004, and Annual Social and Economic Supplement, 2008.

Status and Trends in the Education of Racial and Ethnic Groups142
ind
icat
or
27 —
Ed
ucat
iona
l Att
ainm
ent
In the United States, 11 percent of Hispanic adults between the ages of 25 and 29 had at least a bachelor’s degree (compared with 27 percent of the total population, 33 percent of Whites, and 17 percent of Blacks in that age group) in 2008. However, there was variation among the different Hispanic subgroups. Cubans and South Americans had the highest rates of college attainment (30 and 28 percent, respectively), which were not measurably different from the average rate for the United States. Among the Hispanic subgroups, Salvadorans and Mexicans generally had the lowest rates of college attainment at 8 percent each. Among the Hispanic subgroups, Mexican Americans, Cubans, Salvadorans, other Central Americans and South Americans who were born in the United States (meaning within the 50 states and the District of Columbia) had higher rates of college attainment than adults of those subgroups born outside the United States. For example, within the Cuban subgroup, those who were born in the United States had a college attainment rate of 38 percent, while those who were born outside the United States had a rate of 18 percent.
Sixty percent of Asian adults ages 25 to 29 had at least a bachelor’s degree in 2008. Among Asian subgroups, Asian Indians had the highest percentage of adults with at least a bachelor’s degree (80 percent), while the Other Asian category generally had the lowest percentage (36 percent). The percentage of Native Hawaiians and other Pacific Islanders who had completed college (18 percent) was lower than the percentages for each of the Asian subgroups and lower than the U.S. average. U.S.-born members of the Chinese, Japanese, and Vietnamese subgroups had higher college attainment rates than members of the same subgroups that were born outside the United States. For example, within the Vietnamese subgroup, 57 percent of those who were born in the United States had a college degree, compared to 39 percent of those who were born outside the United States.
Snapshot of Hispanic and Asian Subgroups: Educational Attainment

Status and Trends in the Education of Racial and Ethnic Groups 143
Chap
ter 7 — O
utcom
es of E
ducatio
n
table 27b. number and percentage of persons ages 25 to 29 with at least a bachelor’s degree, by nativity and race/ethnicity with Hispanic and Asian subgroups: 2007
Race/ethnicity Population
Number with at least a
bachelor’s degree
Percentage
TotalBorn within the United States1
Born outside the United States1
total2 20,612,000 5,648,000 27.4 28.2 24.0White 12,341,000 4,025,000 32.6 32.1 44.5Black 2,661,000 457,000 17.2 16.3 24.3Hispanic 4,082,000 457,000 11.2 15.6 7.8
Mexican 2,768,000 234,000 8.5 13.4 4.6Puerto Rican 318,000 50,000 15.7 15.1 16.7Cuban 84,000 25,000 29.7 37.8 18.3Dominican 96,000 15,000 15.5 19.5 13.5Salvadoran 154,000 12,000 7.8 15.7 6.7Other Central American 225,000 23,000 10.2 23.7 8.1South American 205,000 58,000 28.2 35.3 26.0Other Hispanic or
Latino 230,000 41,000 17.6 17.6 17.6Asian 999,000 595,000 59.6 59.3 59.7
Asian Indian 276,000 221,000 80.0 81.6 79.7Chinese3 202,000 142,000 70.3 77.0 67.9Filipino 99,000 59,000 59.6 66.0 57.3Japanese 164,000 67,000 40.8 45.5 37.8Korean 38,000 20,000 54.0 48.6 58.7Vietnamese 83,000 37,000 44.6 57.3 38.7Other Asian 138,000 49,000 35.8 38.1 34.8
Native Hawaiian/Pacific Islander 36,000 6,000 18.0 23.9 10.7!
American Indian/Alaska Native 144,000 14,000 9.7 9.5 ‡
! Interpret data with caution.‡ Reporting standards not met.1 United States refers to the 50 states and District of Columbia.2 Total includes other race/ethnicity categories not separately shown.3 Excludes Taiwanese. Taiwanese is included in “Other Asian.” NOTE: Race categories exclude persons of Hispanic ethnicity. Detail may not sum to totals because of rounding.SOURCE: U.S. Department of Commerce, Census Bureau, American Community Survey, 2007.

Status and Trends in the Education of Racial and Ethnic Groups144
ind
icat
or
28 —
une
mp
loym
ent
rat
es The unemployment rate, one of the important labor market outcomes related to educational attainment, is the percentage of the total labor force population that is jobless, looking for a job, and available for work. People who have no job and are not looking for one, such as those who are going to school, who have retired, or who have a physical or mental disability
that prevents them from participating in the labor force are not included in the labor force and are not considered unemployed. In 2008, about 5 percent of the labor force ages 16 and over were unemployed; however, this rate varied by race/ethnicity and level of educational attainment.
28. unemployment rates
table 28. unemployment rates for persons ages 16 years and older, by educational attainment, age group, and race/ethnicity: 2008
Age group and race/ethnicity Total
Less than high school completion
High school completion1
Some college
Associate’s degree
At least a bachelor’s
degree
total,2 ages 16 and older 5.4 13.0 6.8 4.9 3.7 2.3
White 4.3 12.5 5.7 4.2 3.1 2.0Black 9.5 21.6 10.9 8.2 5.6 3.5Hispanic 7.5 10.9 7.6 5.2 4.9 3.3Asian 3.6 8.3 5.0 3.8! 3.3! 2.5Native Hawaiian/Pacific
Islander 5.6! ‡ 9.7! 3.5! ‡ ‡American Indian/Alaska
Native 10.0 19.5! 11.2 7.9! 3.4! 5.2!Two or more races 10.3 27.4 11.9 7.6! 12.0! 2.6!
Ages 16 to 242 11.5 20.2 13.3 6.3 4.6 4.3White 9.4 17.3 12.0 5.0 3.3! 3.9Black 20.2 33.3 20.0 13.5 12.2! 6.5!Hispanic 13.2 19.4 12.7 7.1 3.3! 8.3!Asian 6.6 16.1! 8.9! 5.5! ‡ 2.0!Native Hawaiian/Pacific
Islander ‡ ‡ ‡ ‡ ‡ ‡American Indian/Alaska
Native 20.3! ‡ ‡ ‡ ‡ ‡Two or more races 17.0 33.8 13.3! 6.8! ‡ ‡
Ages 25 and over2 4.4 9.8 5.7 4.4 3.6 2.2White 3.6 8.9 4.8 3.9 3.1 1.9Black 7.5 16.1 9.2 6.9 5.1 3.4Hispanic 6.3 9.0 6.4 4.6 5.1 3.0Asian 3.3 6.9! 4.6 3.0! 3.0! 2.5Native Hawaiian/Pacific
Islander 4.5! ‡ 6.0! ‡ ‡ ‡American Indian/Alaska
Native 8.3 14.2! 11.6! 5.3! 2.7! 5.3!Two or more races 8.1 17.9! 11.4 7.9! 11.0! 2.1!
! Interpret data with caution.‡ Reporting standards not met.1 Includes equivalency.2 Total includes other race/ethnicity categories not separately shown.NOTE: Race categories exclude persons of Hispanic ethnicity.SOURCE: U.S. Department of Commerce, Census Bureau, Current Population Survey (CPS), Annual Social and Economic Supplement, 2008.
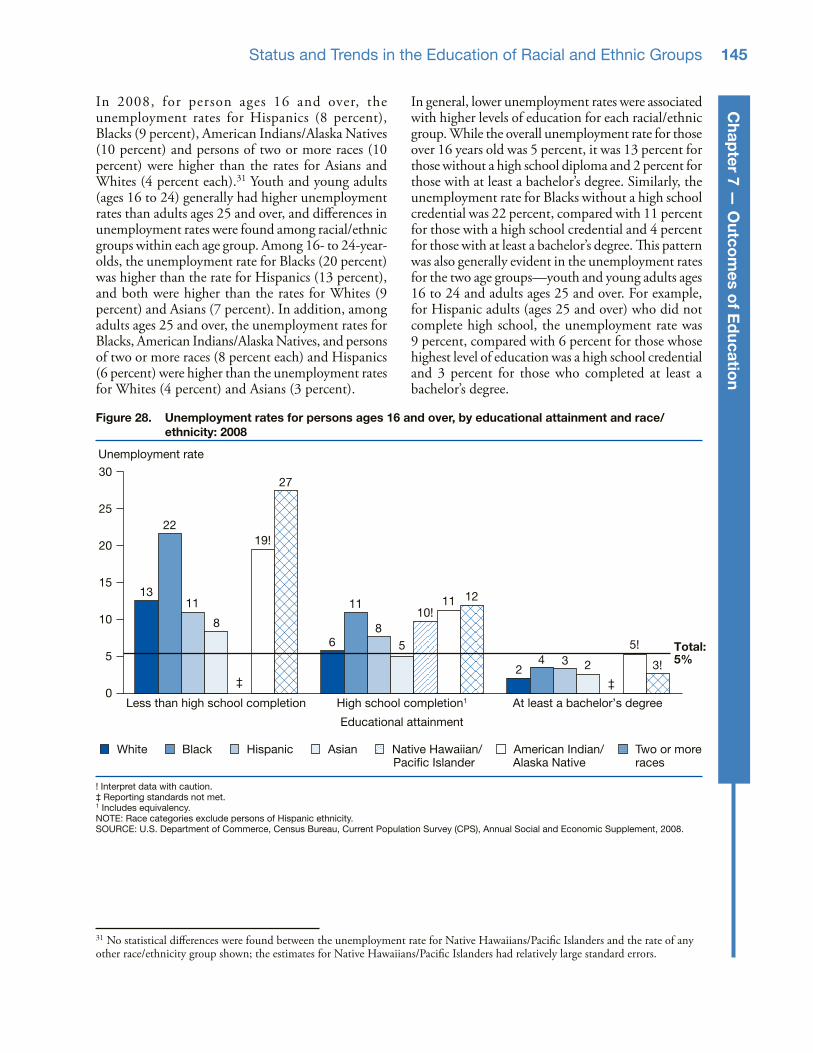
Status and Trends in the Education of Racial and Ethnic Groups 145
Chap
ter 7 — O
utcom
es of E
ducatio
nIn 2008, for person ages 16 and over, the unemployment rates for Hispanics (8 percent), Blacks (9 percent), American Indians/Alaska Natives (10 percent) and persons of two or more races (10 percent) were higher than the rates for Asians and Whites (4 percent each).31 Youth and young adults (ages 16 to 24) generally had higher unemployment rates than adults ages 25 and over, and differences in unemployment rates were found among racial/ethnic groups within each age group. Among 16- to 24-year-olds, the unemployment rate for Blacks (20 percent) was higher than the rate for Hispanics (13 percent), and both were higher than the rates for Whites (9 percent) and Asians (7 percent). In addition, among adults ages 25 and over, the unemployment rates for Blacks, American Indians/Alaska Natives, and persons of two or more races (8 percent each) and Hispanics (6 percent) were higher than the unemployment rates for Whites (4 percent) and Asians (3 percent).
In general, lower unemployment rates were associated with higher levels of education for each racial/ethnic group. While the overall unemployment rate for those over 16 years old was 5 percent, it was 13 percent for those without a high school diploma and 2 percent for those with at least a bachelor’s degree. Similarly, the unemployment rate for Blacks without a high school credential was 22 percent, compared with 11 percent for those with a high school credential and 4 percent for those with at least a bachelor’s degree. This pattern was also generally evident in the unemployment rates for the two age groups—youth and young adults ages 16 to 24 and adults ages 25 and over. For example, for Hispanic adults (ages 25 and over) who did not complete high school, the unemployment rate was 9 percent, compared with 6 percent for those whose highest level of education was a high school credential and 3 percent for those who completed at least a bachelor’s degree.
31 No statistical differences were found between the unemployment rate for Native Hawaiians/Pacific Islanders and the rate of any other race/ethnicity group shown; the estimates for Native Hawaiians/Pacific Islanders had relatively large standard errors.
figure 28. unemployment rates for persons ages 16 and over, by educational attainment and race/ethnicity: 2008
! Interpret data with caution. ‡ Reporting standards not met. 1 Includes equivalency. NOTE: Race categories exclude persons of Hispanic ethnicity. SOURCE: U.S. Department of Commerce, Census Bureau, Current Population Survey (CPS), Annual Social and Economic Supplement, 2008.
■ White ■ Black ■ Hispanic ■ Asian ■ Native Hawaiian/ ■ American Indian/ ■ Two or more Pacific Islander Alaska Native races
Less than high school completion High school completion1
Educational attainment
At least a bachelor’s degree0
5
10
15
20
25
30
Unemployment rate
13
22
11
8
19!
27
6
11
85
10!11 12
4 3 2
‡‡
5! Total:5%3!2

Status and Trends in the Education of Racial and Ethnic Groups146
ind
icat
or
29 —
med
ian
inco
me
This indicator compares the median income of different racial/ethnic groups in 2007 by educational attainment. Median income is the reported annual wage and salary earnings of full-time, full-year workers ages 25 years and over.
The median income in 2007 for all full-time, full-year workers ages 25 and over was $41,000. Generally, for both sexes and all races/ethnicities, higher median earnings were associated with higher educational attainment. For example, those with at least a bachelor’s degree had a median income of $58,900, while those who had completed high school had a median income of $32,000.
In 2007, the median income of male workers was higher than the median income of female workers ($48,000 vs. $36,000). Males generally had higher median incomes than females for each race/ethnicity and at each educational level, although the income gaps varied in size. For example, White males with at least a bachelor’s degree out-earned their female peers by $21,000. At the same level of educational attainment, Black males out-earned their female peers by $10,000. Among Blacks with a master’s degree, no measurable difference was found between the income of males and the income of females.
Among males, Asians and Whites had higher median incomes ($52,000 and $50,000, respectively) than males of other racial/ethnic groups, except Native Hawaiian or Other Pacific Islander males. 32 Hispanic males had a lower median income ($33,000) than Black males ($38,000), American Indian/Alaska Native males ($39,000), Native Hawaiian or Other
Pacific Islander males ($45,000), and males of two or more races ($45,000). At all levels of educational attainment, other than doctorate/first-professional, the median income for Black males was lower than the median income for White males. Similarly, at each level of educational attainment, other than master’s, the median income for Hispanic males was lower than the income for White males. Additionally, the median income of Asian males with at least a bachelor’s degree was higher than that of Black males and Hispanic males with the same level of educational attainment. Among those with at least a bachelor’s degree, the median income was $71,000 for White males and $69,000 for Asian males, compared with $55,000 for Black males and $54,000 for Hispanic males.
Among females, Asians had a higher median income ($42,000) than females of other racial/ethnic groups, except Native Hawaiian or Other Pacific Islanders.33
In addition, White females and females of two or more races had higher median incomes ($38,000 and $35,000, respectively) than Black ($31,000) and Hispanic ($30,000) females. White females who had completed high school, some college, or an associate’s degree had a higher median income than Black and Hispanic females with similar educational attainment. Asian females with at least a bachelor’s degree had higher median earnings ($54,000) compared to White females ($50,000), Black females ($45,000), and Hispanic females ($43,000). In addition, Asian females with a master’s degree had higher median earnings ($67,000) than other females with the same level of education (ranging between $52,500 and $55,000).
29. median income
32 There was no statistically significant difference between the median income of White males or Asian males and the median income of Native Hawaiian and Other Pacific Islander males, as the standard error for Native Hawaiian and Other Pacific Islander males was relatively large. 33 There were no statistically significant differences between the median income of Native Hawaiian and Other Pacific Islander females and females of any other racial/ethnic group, as the standard error for Native Hawaiian and Other Pacific Islander females was relatively large.

Status and Trends in the Education of Racial and Ethnic Groups 147
Chap
ter 7 — O
utcom
es of E
ducatio
nfigure 29. median annual earnings of full-time, full-year wage and salary workers ages 25 and older, by
sex, race/ethnicity, and educational attainment: 2007
‡ Reporting standards not met. 1 Includes equivalency. NOTE: Reporting standards for many of the educational attainment categories for Native Hawaiians or Other Pacific Islanders, American Indians/Alaska Natives, or persons of two or more races were not met; therefore, data for these groups are not shown on the figure. Race categories exclude persons of Hispanic ethnicity. SOURCE: U.S. Department of Commerce, Census Bureau, Current Population Survey (CPS), Annual Social and Economic Supplement, 2008.
White Black Hispanic
Male Female
Asian White Black Hispanic Asian0
20,000
40,000
60,000
$80,000Median earnings
‡
� Less than high school � High school � Associate’s � Bachelor’s or completion completion1 degree higher degree
�
�
�
��
��
�
�
��
�
�
�
�
�
��
�
�
�
�
�
��
�
�
��
�
�

Status and Trends in the Education of Racial and Ethnic Groups148
ind
icat
or
29 —
med
ian
inco
me
table 29. median annual earnings of full-time, full-year wage and salary workers ages 25 and older, by educational attainment, sex, and race/ethnicity: 2007
Sex and race/ethnicity Total
Less than high
school comple-
tion
High school
comple-tion1
Some college
Asso- ciate’s degree
Bachelor’s or higher degree
TotalBachelor’s
degreeMaster’s
degree
Doctorate or first- profes-
sional degree
total $41,000 $25,000 $32,000 $38,000 $41,700 $58,900 $53,000 $62,000 $86,000Male 48,000 28,000 37,200 45,000 49,000 69,000 61,000 75,000 100,000
White 50,000 32,000 40,000 47,000 50,000 71,000 65,000 75,500 100,000Black 38,000 27,000 32,000 37,000 41,000 55,000 50,000 60,000 95,000Hispanic 33,000 25,000 30,000 38,000 42,000 54,000 50,000 68,000 85,000Asian 52,000 28,000 32,000 44,000 41,000 69,000 60,000 75,000 95,000Native
Hawaiian/ Pacific Islander 45,000 ‡ ‡ ‡ ‡ ‡ ‡ ‡ ‡
American Indian/ Alaska Native 39,000 ‡ 35,000 ‡ ‡ ‡ ‡ ‡ ‡
Two or more races 45,000 ‡ 30,000 39,000 ‡ 78,000 75,600 ‡ ‡
Female 36,000 20,000 27,000 33,000 35,800 50,000 45,000 55,000 70,000White 38,000 20,800 29,000 34,000 38,000 50,000 46,000 55,000 70,000Black 31,000 20,000 25,000 30,000 33,000 45,000 42,000 55,000 65,400Hispanic 30,000 18,200 25,000 31,000 32,500 43,000 40,000 52,500 ‡Asian 42,000 ‡ 26,000 34,000 35,000 54,000 50,000 67,000 65,000Native
Hawaiian/ Pacific Islander 35,000 ‡ ‡ ‡ ‡ ‡ ‡ ‡ ‡
American Indian/ Alaska Native 30,000 ‡ ‡ ‡ ‡ ‡ ‡ ‡ ‡
Two or more races 35,000 ‡ 26,500 32,900 ‡ 50,000 ‡ ‡ ‡
‡ Reporting standards not met.1 Includes equivalency.NOTE: Race categories exclude persons of Hispanic ethnicity.SOURCE: U.S. Department of Commerce, Census Bureau, Current Population Survey (CPS), Annual Social and Economic Supplement, 2008.

ACT. (2008). ACT High School Profile Report. Retrieved May 10, 2009, from http://www.act.org/news/data/08/pdf/National2008.pdf.
Allen, J. and Scoming, J. (2005) “Using ACT Assessment Scores to Set Benchmarks for College Readiness,” ACT Research Report Series 2005-3. Retrieved August 2009 from http://www.act.org/research/researchers/reports/pdf/ACT_RR2005-3.pdf.
Brooks-Gunn, J., and Duncan, G. (1997). “Effects of Poverty on Children,” The Future of Children: Children and Poverty. Summer/Fall 1997, 55–71.
Bryant, A.L., and Zimmerman, M.A. (2002). Examining the Effects of Academic Beliefs and Behaviors on Changes in Substance Use Among Urban Adolescents. Journal of Educational Psychology, 94: 621–637.
Bryant, A.L., Schulenberg, J.E., O’Malley, P.M., Bachman, J.G., and Johnston, L.D. (2003). How Academic Achievement, Attitudes, and Behaviors Relate to the Course of Substance Use During Adolescence: A 6-Year, Multiwave National Longitudinal Study. Journal of Research on Adolescence, 13: 361–397.
Chandler, K.A., Chapman, C.D., Rand, M.R., and Taylor, B.M. (1998). Students’ Reports of School Crime: 1989 and 1995. U.S. Department of Education, National Center for Education Statistics; and U.S. Department of Justice, Office of Justice Programs, Bureau of Justice Statistics. Washington, DC: U.S. Government Printing Office.
Clotfelter, C., Ladd, H., and Vigdor, J. (2004). Do School Accountability Systems Make It More Difficult for Low Performing Schools to Attract and Retain High Quality Teachers? Journal of Policy Analysis and Management, 23(2), 251–271.
The College Board, Advanced Placement Program. (2008). The 5th Annual AP Report to the Nation, Appendix A. Retrieved September 25, 2009, from http://www.collegeboard.com/html/aprtn/pdf/ap_report_to_the_nation_data_at_a_glance_app_a.pdf.
Cooper, H., Robinson, J.C., and Patall, E. (2006). “Does Homework Improve Academic Achievement? A Synthesis of Research, 1987–2003,” Review of Educational Research, 76(1): 1–62.
DeVoe, J.F., and Darling-Churchill, K.E. (2008). Status and Trends in the Education of American Indians and Alaska Natives: 2008 (NCES 2008-084). National Center for Education Statistics, Institute of Education Sciences, U.S. Department of Education. Washington, DC.
DeSocio, J., VanCura, M., Nelson, L., Hewitt, G., Kitsman, H., and Cole, R. (2007). Engaging Truant Adolescents: Results From a Multifaceted Intervention Pilot, Preventing School Failure, 51(3), 3–9.
Evans, G.W., and Schamberg, M.A. (2009). “Childhood Poverty, Chronic Stress, and Adult Working Memory,” Proceedings of the National Academy of Sciences, 106(16): 6545–6549.
Gonzales, P., Williams, T., Jocelyn, L., Roey, S., Kastberg, D., and Brenwald, S. (2008). Highlights From TIMSS 2007: Mathematics and Science Achievement of U.S. Fourth- and Eighth-Grade Students in an International Context (NCES 2009-001). National Center for Education Statistics, Institute of Education Sciences, U.S. Department of Education. Washington, DC.
Hofferth, S.L., Reid, L., and Mott, F.L. (2001). The Effects of Early Childbearing on Schooling Over Time. Family Planning Perspectives, 33(6): 259–267.
rEfErEnCEs

Status and Trends in the Education of Racial and Ethnic Minorities
ref
eren
ces
150
Hoffman, K., and Llagas, C. (2003). Status and Trends in the Education of Blacks (NCES 2003-034). National Center for Education Statistics, U.S. Department of Education. Washington, DC.
Individuals with Disabilities Education Improvement Act of 2004. P.L. 108-446, 118 Stat. 2647. (2004).
KewalRamani, A., Gilbertson, L., Fox, M., and Provasnik, S. (2007). Status and Trends in the Education of Racial and Ethnic Minorities (NCES 2007-039), National Center for Education Statistics, Institute of Education Sciences, U.S. Department of Education. Washington, DC.
Llagas, C. (2003). Status and Trends in the Education of Hispanics (NCES 2003-008). National Center for Education Statistics, U.S. Department of Education. Washington, DC.
Office of Management and Budget. (1997). Revisions to the Standards for the Classification of Federal Data on Race and Ethnicity. Washington, DC: U.S. Government Printing Office.
Parker, J. et al. (2004). Bridging Between Two Standards for Collecting Information on Race and Ethnicity: An Application to Census 2000 and Vital Rates. Public Health Reports 119(2): 192–205.
SAT. (2008). 2008 College-Bound Seniors. Retrieved May 9, 2009, from http://professionals.collegeboard.com/data-reports-research/sat.
Singh, K., Change, M., and Dike, S. (2007). Effects of Part-Time Work on School Achievement During High School, The Journal of Education Research, 101(1), September-October 2007: 12–23.
Snyder, T.D., Dillow, S.A., and Hoffman, C.M. (2009). Digest of Education Statistics 2008 (NCES 2009-020), table 326. National Center for Education Statistics, Institute of Education Sciences, U.S. Department of Education. Washington, DC.
Tang, J., and Sable, J. (2009). Characteristics of the 100 Largest Public Elementary and Secondary School Districts in the United States: 2006–07 (NCES 2009-342). National Center for Education Statistics, Institute of Education Sciences, U.S. Department of Education. Washington, DC.
Tierney, J., Baldwin Grossman, J., and Resch, N. (1995). Making a Difference: An Impact Study of Big Brothers/Big Sisters. Philadelphia: Public/Private Ventures.
U.S. Department of Agriculture. (2005). Nutrition Program Facts, Food and Nutrition Service: National School Lunch Program. Retrieved December 13, 2005, from http://www.fns.usda.gov/cnd/Lunch/AboutLunch/NSLPFactSheet.pdf.
U.S. Department of Commerce, Census Bureau. (2001a). Overview of Race and Hispanic Origin. Washington, DC: U.S. Government Printing Office.
U.S. Department of Commerce, Census Bureau. (2001b). Statistical Abstract of the United States: 2000 (120 ed.). Washington, DC: Author.
U.S. Department of Commerce, Census Bureau. (2008). Methodology for the United States Resident Population Estimates by Age, Sex, Race, and Hispanic Origin (Vintage 2008): April 1, 2000, to July 1, 2008. Retrieved August 1, 2009 from http://www.census.gov/popest/topics/methodology/.
U.S. Department of Education, National Center for Education Statistics. (2009). The Condition of Education 2009 (NCES 2009-081), indicators 2, 3, 12, 13, and 20. Washington, DC: U.S. Government Printing Office.
U.S. Department of Education, Office for Civil Rights. (2005). The Rights of Limited-English Proficient Students, Questions and Answers. Retrieved January 14, 2005, from http://www.ed.gov/about/offices/list/ocr/qa-ell.html.
U.S. Department of Education, Office of Special Education and Rehabilitative Services. (n.d.). Building the Legacy: IDEA 2004. Retrieved September 4, 2009, from http://idea.ed.gov/.
U.S. Department of Education, Office of Special Education and Rehabilitative Services. (2000). A Guide to the Individualized Education Program. Retrieved December 20, 2005, from http://www.ed.gov/parents/needs/speced/iepguide/iepguide.pdf.
Zaff, J., Moore, K., Romano Papillo, A., and Williams, S. (2003). Implications of Extracurricular Activity Participation During Adolescence on Positive Outcomes. Journal of Adolescent Research, 18(6): 599–623.

The indicators in this report present data from a variety of sources. The sources and their definitions of key terms are described below. Most of these sources are federal surveys and many are conducted by the National Center for Education Statistics (NCES). The majority of the sources are sample surveys; these are the sources of the estimates for which standard errors are provided on the NCES website: http://nces.ed.gov/. A few sources are universe surveys, meaning that they collect information on the entire population of interest, and therefore there are no standard errors because there is no error introduced by sampling. All of the definitions of key terms appear after the description of the data source to which they apply.
Some of the indicators in this report use different data sources or different definitions of terms to present estimates on similar variables. It is important to note that comparisons between estimates with such differences should be made with caution, if at all, because differences in populations, methodologies, question phrasing, and other factors may compromise such comparisons.
American College testing Program (ACt)
ACT (formerly the American College Testing Program) is an independent, not-for-profit organization that provides services in the broad areas of education and workforce development. ACT scores represent a self-selecting sample, and therefore are not necessarily representative of the population as a whole.
Students taking the ACT college entrance exam are asked to self-select one of the following racial/ethnic groups to describe themselves: African-American/Black, American Indian/Alaskan Native, Caucasian-American/White, Mexican-American/Chicano, Asian-American/Pacific Islander, Puerto Rican/Hispanic, Other, Multiracial, or prefer not to respond.
Indicator 15.2 includes data on the ACT, presented for the following mutually exclusive race/ethnicity categories: White (non-Hispanic), Black (non-His-panic), Mexican-American, or Puerto Rican/Other Hispanic, Asian/Pacific Islander (non-Hispanic), and American Indian/Alaska Native (non-Hispanic). Since students could only select one racial/ethnic category, all persons of Hispanic origin are included in one of the two Hispanic categories, regardless of race. Data for students who selected the categories “Other,” “Multiracial,” or “Prefer not to respond” are not separately shown, but these data are included in the totals.
For more information on the ACT, see http://www.act.org/news/data.html.
the College Board
The College Board is a not-for-profit membership association whose mission is to connect students to college success and opportunity. The College Board conducts the SAT and Advanced Placement (AP) test-ing. Scores on tests conducted by the College Board are not necessarily representative of the population as a whole as test-takers are self-selected.
Advanced Placement (AP) Program
Students taking an AP test are asked to select one of the following categories to describe their race/ethnicity: American Indian/Alaskan; Asian/Asian American; Black/Afro-American; Latino: Chicano/Mexican, Puerto Rican, and Other Latino; White; and Other.
Indicator 14 presents data from the AP program, and presents data on the following mutually exclusive race/ethnicity categories: White (non-Hispanic), Black (non-Hispanic), Hispanic, Asian (non-Hispanic), and American Indian/Alaska Native (non-Hispanic). The
APPEnDix A: guiDE tO sOurCEs

Status and Trends in the Education of Racial and Ethnic Minorities
gui
de
to s
our
ces
152
category Hispanic includes the Chicano/Mexican, Puerto Rican, and Other Latino categories listed above. Since students could only select one racial/ethnic category, all persons of Hispanic origin are included in the Hispanic category, regardless of race. Data for students who selected the category “Other” are not separately shown, but these data are included in the totals.
SAT
Students taking the SAT are asked to select one of the following categories to describe their race/ethnicity: American Indian or Alaskan Native; Asian, Asian American, or Pacific Islander; African American or Black; Latino: Chicano/Mexican, Puerto Rican, and Other Latino; White; and Other.
Indicator 15.1 reports SAT data. This indicator uses the following mutually exclusive race/ethnicity cate-gories: White (non-Hispanic), Black (non-Hispanic), Mexican American, Puerto Rican, Other Hispanic/Latino, Asian/Pacific Islander (non-Hispanic), and American Indian/Alaska Native (non-Hispanic). In table 15.1a, Mexican American, Puerto Rican, and Other Hispanic/Latino were combined into the category labeled Hispanic. Since students could only select one racial/ethnic category, all persons of Hispanic origin are included in one of the three His-panic categories, regardless of race. Data for students who selected the category “Other” are not separately shown, but are included in the totals.
For more information on the College Board, see http://professionals.collegeboard.com/data-reports-research.
u.s. Department of Commerce, Census Bureau
American Community Survey (ACS)
The American Community Survey (ACS) is a sample survey conducted by the U.S. Census Bureau. The ACS was first implemented in 1996 and expanded in scope in subsequent years. The ACS will replace the long-form survey in the 2010 Decennial Census.
The race/ethnicity questions in the ACS are the same as in the Decennial Census (see p. 153). Therefore, prior to 1999, respondents could choose only one race, but from 2000 on respondents could choose one or more races. The ACS also asks respondents to write in their ancestry or ethnic origin.
Indicators 2, 3, 4, 8.2, 18.1b, and 27b present the following mutually exclusive race/ethnicity catego-ries: White (non-Hispanic), Black (non-Hispanic), Hispanic, Asian (non-Hispanic), Native Hawaiian or Other Pacific Islander (non-Hispanic), American Indian/Alaska Native (non-Hispanic), and Two or more races (non-Hispanic). Data on persons who identified themselves as “Some other race” are in-cluded in the totals, but these data are not separately shown. All persons of Hispanic origin are included in the Hispanic category regardless of the race option(s) chosen. Therefore, persons of Hispanic origin may be of any race.
Indicators 2, 4, 8.2, 18, and 27 include “Snapshots” that provide statistics on more detailed ancestry sub-groups for Hispanics and Asians. Due to sample size limitations, several subgroups have been combined into broader categories. The Hispanic ancestry cat-egories presented in this report are Mexican, Puerto Rican, Cuban, Dominican, Salvadoran, Other Cen-tral American (includes Costa Rican, Guatemalan, Honduran, Nicaraguan, Panamanian, and Other Central American), South American (includes Argen-tinean, Bolivian, Chilean, Colombian, Ecuadorian, Peruvian, Uruguayan, Venezuelan, and Other South American), and Other Hispanic or Latino (includes Spaniard and All other Spanish/Hispanic/Latino). The Asian ancestry categories presented in this report are Asian Indian, Chinese, Filipino, Japanese, Korean, Vietnamese, and Other Asian (includes Taiwanese, Bangladeshi, Cambodian, Hmong, Indonesian, Laotian, Malaysian, Pakistani, Sri Lankan, Thai, and Other Asian).
For more information on the American Community Survey, see http://www.census.gov/acs/www/.
Current Population Survey (CPS)
The Current Population Survey (CPS) is a monthly sample survey of households conducted by the Census Bureau for the Bureau of Labor Statistics to obtain information on the labor force characteristics of the U.S. population. Supplementary questions are often added to the CPS interview in a particular month to gather in-depth information on specific aspects of the labor force or other topics. For example, the Annual Social and Economic Supplement in March includes questions on income and work experience.
CPS respondents are asked to identify their race. Between 1979 and 2002, respondents were asked to choose one of the following race categories: White,

Status and Trends in the Education of Racial and Ethnic Minorities
Ap
pend
ix A
153
Black, Asian or Pacific Islander, or American Indian/Aleut/Eskimo. For 2003 and later years, respondents were asked to choose from White, Black or African American, Asian, Native Hawaiian or Other Pacific Islander, and American Indian/Alaska Native; respon-dents had the option to select more than one race category from that list. Also, in 2003 and subsequent years, respondents were asked to specify whether or not they were of Hispanic origin after answering the race question.
Indicators 5, 18.1a, 19, 23, 27a, 28, and 29 use data from the CPS. In each of these indicators, data are presented for the following mutually exclusive race/ethnicity categories: White (non-Hispanic), Black (non-Hispanic), Hispanic, Asian (non-Hispanic), Native Hawaiian/Pacific Islander (non-Hispanic), and American Indian/Alaska Native (non-Hispanic). All persons of Hispanic origin are included in the Hispanic category regardless of the race option(s) chosen. Therefore, persons of Hispanic origin may be of any race. In Indicators 18.1 and 27a, data for the categories Asian and Native Hawaiian or Other Pacific Islander are combined for 2003 and later years in order to provide continuity with previous years of data and in order for cell sizes to meet reporting standards.
For more information on the CPS, see http://www.census.gov/cps/.
Decennial Census, Population Estimates, and Population Projections
The Decennial Census is a universe survey mandated by the U.S. Constitution. It is a questionnaire sent to every household in the country, and it is composed of seven questions about the household and its members (name, sex, age, relationship, Hispanic origin, race, and whether the housing unit is owned or rented). The Census Bureau also produces annual estimates of the resident population by demographic charac-teristics (age, sex, race, and Hispanic origin) for the nation, states, and counties, as well as national and state projections for the resident population. The reference date for population estimates is July 1 of the given year. With each new issue of July 1 estimates, the Census Bureau revises estimates for each year back to the last census. Previously published estimates are superseded and archived.
Census respondents self-report race and ethnicity. In the 2000 Census, they were first asked, “Is this
person Spanish/Hispanic/Latino?” and then given the following options: No, not Spanish/Hispanic/Latino; Yes, Puerto Rican; Yes, Mexican, Mexican American, Chicano; Yes, Cuban; and Yes, other Spanish/Hispanic/Latino (with space to print the specific group). The next question was “What is this person’s race?”, and the options were White; Black, African American, or Negro; American Indian or Alaska Native (with space to print the name of enrolled or principal tribe); Asian Indian; Japanese; Native Hawaiian; Chinese; Korean; Guamanian or Chamorro; Filipino; Vietnamese; Samoan; Other Asian; Other Pacific Islander; and Some other race. The last three options included space to print the specific race. The 2000 Census was also the first time that respondents were given the option of choosing more than one race. The Census population estimates program modified the enumerated population from the 2000 Census to produce the population estimates base for 2000 and onward. As part of the modification, the Census Bureau recoded the “Some other race” responses from Census 2000 to one or more of the five OMB race categories used in the estimates program (U.S. Department of Commerce 2008). Prior to 2000, the Census Bureau combined the categories Asian and Native Hawaiian or Other Pacific Islander. For all years, all persons of Hispanic origin were included in the Hispanic category regardless of the race option(s) chosen. Therefore, persons of Hispanic origin may be of any race.
Indicators 1 and 2 use data from the Decennial Census and the Census population estimates and projections program.
For more information, see http://www.census.gov.
Decennial Census terms:
PovertyTo define poverty, the Census Bureau utilizes a set of money income thresholds that vary by family size and composition. A family, along with each individual in it, is considered poor if the family’s total income is less than that family’s threshold. The poverty thresholds do not vary geographi-cally and are updated annually for inflation using the Consumer Price Index. The official poverty definition counts money income before taxes and does not include capital gains and noncash benefits (such as public housing, Medicaid, and food stamps).

Status and Trends in the Education of Racial and Ethnic Minorities
gui
de
to s
our
ces
154
u.s. Department of Education
Office of Special Education Programs (OSEP)
The Office of Special Education Programs (OSEP) as-sesses progress in implementing the Individuals with Disabilities Education Act (IDEA), including state and local efforts to provide (1) free and appropriate public education to children with disabilities and (2) early intervention services to infants and toddlers with disabilities. Prior to the IDEA Amendments of 1997, disabled children whose parents enrolled them in private schools were also required to have Individualized Education Plans (IEPs). Beginning in 1997, parentally placed private school children were required to have “service plans,” rather than IEPs, to denote the fact that IEP is a term used in the defini-tion of Free Appropriate Public Education (FAPE), which does not apply to families who choose to place their children in private schools. Children who are placed in or referred to private schools by a public agency are still required to have IEPs (U.S. Depart-ment of Education, Office of Special Education and Rehabilitative Services 2000).
States are required to report counts of children who have IEPs or service plans. Each child can only be reported in one of the following race/ethnicity cat-egories: American Indian or Alaska Native, Asian or Pacific Islander, Black, Hispanic, and White. Since children may only be reported in one category, all children of Hispanic origin are reported as Hispanic, regardless of race, and are not included in any of the four race categories.
Indicator 8.1 reports OSEP data. The mutually exclusive race/ethnicity categories are White (non-Hispanic), Black (non-Hispanic), Hispanic, Asian/Pacific Islander (non-Hispanic), and American In-dian/Alaska Native (non-Hispanic).
For more information about OSEP, see http://www.ed.gov/about/offices/list/osers/index.html.
OSEP terms:
Child with a disability This term refers to a child “. . . having mental retardation, a hearing impairment including deafness, a speech or language impairment, a visual impairment including blindness, serious emotional disturbance (hereafter referred to as emotional disturbance), an orthopedic impair-ment, autism, traumatic brain injury, another health impairment, a specific learning disability,
deaf-blindness, or multiple disabilities, and who, by reason thereof, needs special education and related services.” (34 Code of Federal Regulations §300.7(a)(1))
Specific learning disability “. . . a disorder in one or more of the basic psy-chological processes involved in understanding or in using language, spoken or written, that may manifest itself in an imperfect ability to listen, think, speak, read, write, spell, or to do mathematical calculations, including conditions such as perceptual disabilities, brain injury, minimal brain dysfunction, dyslexia, and devel-opmental aphasia. The term does not include learning problems that are primarily the result of visual, hearing, or motor disabilities, of mental retardation, of emotional disturbance, or of envi-ronmental, cultural, or economic disadvantage.” (34 Code of Federal Regulations §300.7(c)(10))
Mental retardation “. . . significantly subaverage general intellectual functioning, existing concurrently with deficits in adaptive behavior and manifested during the developmental period, that adversely affects a child’s educational performance.” (34 Code of Federal Regulations §300.7(c)(6))
Speech or language impairment “. . . a communication disorder, such as stuttering, impaired articulation, a language impairment, or a voice impairment, that adversely affects a child’s educational performance.” (34 Code of Federal Regulations §300.7(c)(11))
Hearing impairment “. . . an impairment in hearing, whether perma-nent or fluctuating, that adversely affects a child’s educational performance but that is not included under the definition of deafness in this section.”
Although children and youth with deafness are not included in the definition of hearing impairment, they are counted in the hearing impairment category. (34 Code of Federal Regu-lations §300.7(c)(5))
Visual impairment including blindness “. . . an impairment in vision that, even with correction, adversely affects a child’s educational performance. The term includes both partial sight and blindness.” (34 Code of Federal Regula-tions §300.7(c)(13))

Status and Trends in the Education of Racial and Ethnic Minorities
Ap
pend
ix A
155
Autism “. . . a developmental disability significantly affecting verbal and nonverbal communication and social interaction, generally evident before age 3, that adversely affects a child’s educational performance. Other characteristics often associ-ated with autism are engagement in repetitive activities and stereotyped movements, resistance to environmental change or change in daily routines, and unusual responses to sensory ex-periences. The term does not apply if a child’s educational performance is adversely affected primarily because the child has an emotional disturbance, as defined in paragraph (b)(4) of this section.” (34 Code of Federal Regulations §300.7(c)(1)(i))
Emotional disturbance (previously termed serious emo-tional disturbance)
“The term means a condition exhibiting one or more of the following characteristics over a long period of time and to a marked degree that ad-versely affects a child’s educational performance: (A) An inability to learn that cannot be explained by intellectual, sensory, or health factors; (B) An inability to build or maintain satisfactory inter-personal relationships with peers and teachers; (C) Inappropriate types of behavior or feelings under normal circumstances; (D) A general pervasive mood of unhappiness or depression; or (E) A tendency to develop physical symp-toms or fears associated with personal or school problems. The term includes schizophrenia. The term does not apply to children who are socially maladjusted, unless it is determined that they have an emotional disturbance.” (34 Code of Federal Regulations §300.7(c)(4))
national Center for Education statistics (nCEs)
Common Core of Data (CCD), Public Elementary/Secondary School Universe Survey
The Common Core of Data (CCD) is a universe survey database with comprehensive, annually updated information. The Public Elementary/Sec-ondary School Universe Survey compiles data from state education agencies based on school records to provide a complete listing of all public elementary and secondary schools in the country and basic infor-
mation and descriptive statistics on all schools, their students, and their teachers. Data are collected for a particular school year via an online reporting system open to state education agencies during the school year. Beginning with the 2006–07 school year, nonfis-cal CCD data are collected through the Department of Education’s Education Data Exchange Network (EDEN). Since the CCD is a universe collection, CCD data are not subject to sampling errors.
Indicators 7 and 18.2 report CCD data. The mutu-ally exclusive race/ethnicity categories for CCD, which are presented in these indicators, are White (non-Hispanic), Black (non-Hispanic), Hispanic, Asian/Pacific Islander (non-Hispanic), and American Indian/Alaska Native (non-Hispanic). All students of Hispanic origin are included in the Hispanic category regardless of their race.
In 2006–07, Kentucky and New York did not report graduate counts by race/ethnicity. In addition, race/ethnicity graduate counts for the District of Columbia were suppressed due to inaccuracy. Further, the aver-aged freshman graduation rates (AFGR) (indicator 18.2) could not be calculated by race/ethnicity for Nevada as enrollments by race/ethnicity were not reported for the 2004–05 school year. Data for each of these states were included in the totals, but these data were excluded in the race/ethnicity categories for the AFGR, and data for the District of Columbia, Kentucky, and New York were excluded in the race/ethnicity categories for the number of graduates. In 2006–07, the number of graduates and the percent-age of total graduates were: 2,944 (0.1 percent) for the District of Columbia, 39,099 (1.4 percent) for Kentucky, 16,455 (0.6 percent) for Nevada, and 168,333 (5.8 percent) for New York.
For more information on the CCD, see http://nces.ed.gov/ccd/index.asp.
CCD terms:
LocaleA school’s locale is classified based on its address, according to a mix of classifications from the Office of Management and Budget (OMB) and the Census Bureau. The Census Bureau updated its classification system after the 2000 Decen-nial Census, and the CCD adopted these new standards for the 2002–03 data collection. The definitions are as follows:

Status and Trends in the Education of Racial and Ethnic Minorities
gui
de
to s
our
ces
156
CityLarge: Territory inside an urbanized area and inside a principal city with population of 250,000 or more
Midsize: Territory inside an urbanized area and inside a principal city with population less than 250,000 and greater than or equal to 100,000
Small: Territory inside an urbanized area and inside a principal city with population less than 100,000
SuburbLarge: Territory outside a principal city and inside an urbanized area with population of 250,000 or more
Midsize: Territory outside a principal city and in-side an urbanized area with population less than 250,000 and greater than or equal to 100,000
Small: Territory outside a principal city and inside an urbanized area with population less than 100,000
TownFringe: Territory inside an urban cluster that is less than or equal to 10 miles from an urbanized area
Distant: Territory inside an urban cluster that is more than 10 miles and less than or equal to 35 miles from an urbanized area
Remote: Territory inside an urban cluster that is more than 35 miles from an urbanized area
RuralFringe: Census-defined rural territory that is less than or equal to 5 miles from an urbanized area, as well as rural territory that is less than or equal to 2.5 miles from an urban cluster
Distant: Census-defined rural territory that is more than 5 miles but less than or equal to 25 miles from an urbanized area, as well as rural ter-ritory that is more than 2.5 miles but less than or equal to 10 miles from an urban cluster
Remote: Census-defined rural territory that is more than 25 miles from an urbanized area and is also more than 10 miles from an urban cluster
For more information on locale codes, see http://nces.ed.gov/ccd/rural_locales.asp.
Early Childhood Longitudinal Study, Birth Cohort of 2001
The Early Childhood Longitudinal Study, Birth Cohort (ECLS-B) is designed to provide decision-makers, researchers, child care providers, teachers, and parents with nationally representative information about children’s early learning experiences and the transition to child care and school. Children’s physi-cal and cognitive development, care, and learning experiences at home and school are measured from birth through kindergarten entry using standardized assessments.
At the 9-month parent interview, respondents indi-cated whether the child belonged to one or more of 14 race categories: (1) White, (2) Black or African American, (3) American Indian or Alaska Native, (4) Asian Indian, (5) Chinese, (6) Filipino, (7) Japanese, (8) Korean, (9) Vietnamese, (10) Other Asian, (11) Native Hawaiian, (12) Guamanian or Chamorro, (13) Samoan, and (14) Other Pacific Islander. Data were collected on Hispanic ethnicity as well; specifi-cally, respondents were asked whether the child was of Hispanic or Latino origin. A child’s ethnicity was classified as Hispanic if a parent respondent indicated the child’s ethnicity was Hispanic, regardless of the race identified. During the 2-year parent interview, for cases that were identified as being of American Indian/Alaska Native descent in the 9-month col-lection (by either the birth certificate data or during the parent interview), parent interview respondents were asked to confirm that the child was of American Indian/Alaska Native descent. If the parent interview respondent indicated “no,” the case was reclassified as the race/ethnicity specified by the parent interview respondent. Similar procedures were repeated at the preschool round.
Indicators 6 and 10 report ECLS-B data. The mutually exclusive race/ethnicity categories presented in these indicators are White (non-Hispanic), Black (non-Hispanic), Hispanic, Asian (non-Hispanic), Native Hawaiian or Other Pacific Islander (non-Hispanic), American Indian/Alaska Native (non-Hispanic), and Two or more races (non-Hispanic). All children of Hispanic origin are included in the Hispanic category regardless of the race option(s) chosen. Therefore, children of Hispanic origin may be of any race.
Further information on the ECLS-B may be obtained from http://nces.ed.gov/ecls/Birth.asp.

Status and Trends in the Education of Racial and Ethnic Minorities
Ap
pend
ix A
157
High School Transcript Study Tabulations
High school transcript studies have been conducted since 1982 and are associated with a major NCES data collection. The studies collect information that is contained in a student’s high school record—courses taken while attending secondary school, information on credits earned, when specific courses were taken, and final grades.
Studies were conducted of the coursetaking patterns of 1998, 2000, and 2005 high school graduates. For these studies, NCES collected high school transcripts from a nationally representative sample of both public and private schools that had been selected to participate in the National Assessment of Educational Progress (NAEP). A representative sample of graduating seniors within each school was selected. Most of the transcripts collected were those of students who participated in the NAEP assessments that year. After collection, the courses appearing on the student transcripts were coded using the Classification of Secondary School Courses, which contains over 2,200 course codes. Actual course content may vary widely among schools.
NAEP reports data on student race/ethnicity based on information obtained from school rosters. Indicator 13 reports the following race/ethnicity categories: White (non-Hispanic), Black (non-Hispanic), Hispanic, Asian American/Pacific Islander (non-Hispanic), American Indian (non-Hispanic), and Unclassified. Unclassified students are reported in the total, but not separately shown. All students of Hispanic origin are classified as Hispanic, regardless of race.
For more information on the High School Transcript Studies, see http://nces.ed.gov/surveys/hst.
Integrated Postsecondary Education Data System (IPEDS)
The Integrated Postsecondary Education Data System (IPEDS) and the postsecondary survey that preceded it, the Higher Education General Information Survey (HEGIS), are systems of universe surveys that collect data from all institutions whose primary mission is the provision of postsecondary education. The surveys collect institution-level data in such areas as enrollments, program completions, faculty, staff, and finances. HEGIS was conducted in 1980, 1984, and 1985, while IPEDS has been conducted annu-ally from 1986 on. This report uses the IPEDS Fall Enrollment survey and Completions survey.
Beginning in fall 2008, the IPEDS data collection began phasing out the category “first-professional” degree. Institutions had the option to report programs previously classified as first-professional programs and awards as first-professional as master’s degrees, if appropriate, or under one of three types of doctor’s degrees: doctor’s—research/scholarship, doctor’s—professional practice, or doctor’s—other. In this publication, table 26.1 provides estimates based on the old classification. Estimates from institutions who provided information based on the new classification were cross-walked back to the old categories. There-fore, estimates in table 26.1 may not match estimates reported in other publications.
IPEDS asks institutions to provide enrollment and completion data on students based on the following race/ethnicity categories: Black; American Indian/Alaska Native; Asian/Pacific Islander; Hispanic; and White. Each student may only be reported in one category.
Indicators 24 and 26 use data from IPEDS and its predecessor, HEGIS, with the following mutually exclusive race/ethnicity categories: White (non-His-panic), Black (non-Hispanic), Hispanic, Asian/Pacific Islander (non-Hispanic), and American Indian/Alas-ka Native (non-Hispanic). Persons of Hispanic origin may be of any race.
For more information on HEGIS/IPEDS, see http://nces.ed.gov/ipeds/.
National Assessment of Educational Progress (NAEP)
The National Assessment of Educational Progress (NAEP) is a nationally representative and continuing assessment of what America’s students know and can do in various subject areas. For over three decades, assessments have been conducted periodically in read-ing, mathematics, science, writing, history, geography, and other subjects.
NAEP reports data on student race/ethnicity based on information obtained from school rosters. Race/ethnicity categories are White, Black, Hispanic, Asian American/Pacific Islander, American Indian, and Unclassified. All students of Hispanic origin are classified as Hispanic, regardless of race. Information on student eligibility for free or reduced-price lunch (as presented in indicator 7.5) is reported by school administrators in the school background questionnaire.

Status and Trends in the Education of Racial and Ethnic Minorities
gui
de
to s
our
ces
158
Indicators 7.5, 11, and 16 provide data from NAEP, using the following mutually exclusive race/ethnicity categories: White (non-Hispanic), Black (non-Hispanic), Hispanic, Asian/Pacific Islander (non-Hispanic), and American Indian/Alaska Native (non-Hispanic). Data on unclassified students are included in the totals, but these data are not separately shown.
For more information on NAEP, see http://nces.ed.gov/nationsreportcard/.
NAEP terms:
Achievement levelsIn addition to reporting student scale scores, NAEP reports results in terms of achievement levels, which are intended to measure how well students’ actual achievement matches the achievement desired of them in different subjects assessed by NAEP.
BasicPartial mastery of prerequisite knowledge and skills that are fundamental for proficient work at each grade.
ProficientSolid academic performance for each grade assessed. Students reaching this level have dem-onstrated competency over challenging subject matter, including subject-matter knowledge, application of such knowledge to real-world situations, and analytical skills appropriate to the subject matter.
AdvancedSuperior performance.
The National Household Education Surveys (NHES) Program
The National Household Education Surveys Program (NHES) was developed by NCES to complement its institutional surveys. This program is the principal mechanism for addressing topics that cannot be addressed in institutional data collections. By collecting data directly from households, NHES enables NCES to gather data on a wide range of issues, such as early childhood care and education, children’s readiness for school, parent perceptions of school safety and discipline, before- and after-school activities of school-age children, participation in adult and continuing education, parent involvement in education, and civic involvement.
The 2007 NHES reports data on the following race categories: White, Black or African American, Asian, Native Hawaiian and Other Pacific Islander, American Indian or Alaska Native, and Other races. NHES allows respondents to choose more than one race. NHES also asked respondents about Hispanic origin; those who were Hispanic were classified as Hispanic, regardless of race.
Indicators 17 and 19 report NHES data on the fol-lowing mutually exclusive race/ethnicity categories: White (non-Hispanic), Black (non-Hispanic), Hispanic, Asian (non-Hispanic), American Indian/Alaska Native (non-Hispanic), and Two or more races (non-Hispanic). All persons of Hispanic origin were included in the Hispanic category regardless of race. Data on respondents who reported Native Hawaiian and Other Pacific Islander and “Other race” are included in the totals, but these data are not separately shown.
For more information on the NHES Program, see http://nces.ed.gov/nhes/.
National Postsecondary Student Aid Study (NPSAS)
The National Postsecondary Student Aid Study (NPSAS) is a comprehensive nationwide study designed to determine how students and their families pay for postsecondary education and describe some demographic and other characteristics of those enrolled. The study is based on a nationally representative sample of students in postsecondary education institutions, including undergraduate, graduate, and first-professional students. Students attending all types and levels of institutions are represented, including public and private not-for-profit and for-profit institutions, less-than-2-year institutions, 2-year institutions, and 4-year colleges and universities. The NPSAS surveys provide information on the price of postsecondary education, the distribution of financial aid, and the characteristics of both aided and nonaided students and their families.
NPSAS asks students to self-report race/ethnicity. Race/ethnicity categories are White, Black, Hispanic, Asian, American Indian, Pacific Islander, and Other. Students may select more than one race and students of Hispanic origin are classified as Hispanic regard-less of race.
Indicator 25 presents NPSAS data for the following mutually exclusive race/ethnicity categories: White (non-Hispanic), Black (non-Hispanic), Hispanic,

Status and Trends in the Education of Racial and Ethnic Minorities
Ap
pend
ix A
159
Asian/Pacific Islander (non-Hispanic), and American Indian/Alaska Native (non-Hispanic). Students who selected “Other” or specified more than one race are included in the totals, but these data are not separately shown.
For more information about NPSAS, see http://nces.ed.gov/surveys/npsas/.
NPSAS terms:
Total financial aid The total amount of financial aid received by a student. Includes grants, loans, work-study, or any other types of aid, as well as loans to parents under the PLUS program and veterans’ benefits and military education aid.
Total grants The total amount of grant and scholarship aid received from any source for the NPSAS year. A grant is a type of student financial aid that does not require repayment or employment. Grants include need-based grants, merit-only scholar-ships, tuition waivers, and employer tuition reimbursements.
Total loans The total amount of all student loans (federal, state, institutional, and private sector) and fed-eral PLUS loans to parents received during the NPSAS year. Does not include loans from family or friends to the student or commercial loans to parents (such as home equity loans).
School Crime Supplement to the National Crime Victimization Survey (SCS/NCVS)
Created as a supplement to the National Crime Vic-timization Survey (NCVS) and co-designed by the National Center for Education Statistics (NCES) and Bureau of Justice Statistics (BJS), the School Crime Supplement (SCS) survey collects information about school-related victimization, crime, and safety. The SCS is a national survey of about 8,300 students ages 12–18 in U.S. public and private elementary, middle, and high schools.
In the NCVS, a question on Hispanic origin is fol-lowed by a question on race. Race categories are White, Black, Asian, Native Hawaiian or Other Pacific Islander, and American Indian/Alaska Native. Respondents in 2007 were allowed to specify more than one race. Respondents who identified themselves as Hispanic were classified as Hispanic regardless of their race.
Indicator 22 reports data from the SCS. Table 22b reports the following mutually exclusive race/ethnicity categories: White (non-Hispanic), Black (non-Hispanic), Hispanic, Asian, and Other. The “Other” category in this case includes data on Native Hawaiians or Other Pacific Islanders, American Indians/Alaska Natives, and persons of two or more races which were combined due to data reporting issues for these groups.
For more information about the SCS, see http://nces.ed.gov/programs/crime/surveys.asp.
Schools and Staffing Survey (SASS)
This report draws upon data from the Schools and Staffing Survey (SASS), which provides national- and state-level data on public schools and national- and affiliation-level data on private schools. The 2007–08 SASS was collected by the U.S. Census Bureau and sponsored by the National Center for Education Statistics (NCES). SASS consists of five sets of linked surveys, including surveys of schools, the principal of each selected school, a subsample of teachers within each school, the public school district in which the sample school is located, and public school library media centers.
In 2007–08, there were three types each of teacher and school questionnaires: public (including public charter), private, and Bureau of Indian Education (BIE). For this report, public charter schools are in-cluded with public schools, but BIE schools are not. The public school sampling frames for the 2007–08 SASS were created using the 2005–06 NCES Com-mon Core of Data (CCD) Public School Universe Files. In SASS, a school was defined as an institution or part of an institution that provides classroom instruction to students; has one or more teachers to provide instruction; serves students in one or more of grades 1–12 or the ungraded equivalent; and is located in one or more buildings apart from a private home. It was possible for two or more schools to share the same building; in this case they were treated as different schools if they had different administrations (i.e., principals or school head).
Information on the racial and ethnic composition of schools was provided by the school questionnaire. Each respondent to the school questionnaire was asked how many students were in each of the fol-lowing categories: Hispanic, White (non-Hispanic), Black (non-Hispanic), Asian or Pacific Islander (non-Hispanic), and American Indian/Alaska Native (non-Hispanic). Each student had to be included in

Status and Trends in the Education of Racial and Ethnic Minorities
gui
de
to s
our
ces
160
only one of these categories. Based on these counts, the percentages of enrolled students who were White (non-Hispanic), Black (non-Hispanic), Hispanic, Asian/Pacific Islander (non-Hispanic), and American Indian/Alaska Native (non-Hispanic) were calculated.
Indicator 9 reports data from SASS, and results are shown separately for schools with varying percentages of White (non-Hispanic), Black (non-Hispanic), Hispanic, Asian/Pacific Islander (non-Hispanic), and American Indian/Alaska Native (non-Hispanic) enrollment.
For more information about the SASS, see http://nces.ed.gov/surveys/sass/.
Trends in International Mathematics and Science Study (TIMSS)
Trends in International Mathematics and Science Study (TIMSS) (formerly known as the Third In-ternational Mathematics and Science Study) is a cross-national comparative study of the performance and schooling contexts of 4th- and 8th-grade students in mathematics and science. TIMSS provides trend data on students’ mathematics and science achieve-ment from an international perspective. Through participation in TIMSS, the United States has gained reliable and timely data on the mathematics and science achievement of U.S. students compared to that of students in other jurisdictions. TIMSS is coordinated by the International Association for the Evaluation of Educational Achievement (IEA), with national sponsors in each participating jurisdiction.
Students’ races/ethnicities were obtained through student responses to a two-part question. Students were asked first whether they were Hispanic or Latino, and then whether they were members of the follow-ing racial groups: American Indian or Alaska Native, Asian, Black or African American, Native Hawaiian or other Pacific Islander, or White. Multiple responses to the race classification question were allowed. All students of Hispanic origin are classified as Hispanic, regardless of race. The small numbers of students indicating that they were American Indian or Alaska Native or Native Hawaiian or other Pacific Islander were combined into a group labeled “Other.” This category is reported as part of the total but is not reported separately.
Indicator 12 reports data from TIMSS, and results are shown separately for Whites (non-Hispanic), Blacks (non-Hispanic), Hispanics, Asians (non-Hispanic), and persons of two or more races (non-Hispanic).
For more information about the TIMSS, see http://nces.ed.gov/timss/.
u.s. Department of Health and Human services
Centers for Disease Control and Prevention
National Vital Statistics System (NVSS)
The National Vital Statistics System (NVSS) is the method by which data on births, deaths, marriages, and divorces are provided to the National Center for Health Statistics (NCHS), part of the Centers for Disease Control and Prevention (CDC). The data are provided to NCHS through the Vital Statistics Cooperative Program (VSCP). In 1984 and earlier years, the VSCP included varying numbers of states that provided data based on a 100-percent sample of their birth certificates. Data for states not in the VSCP were based on a 50-percent sample of birth certificates filed in those states. Population data used to compile birth rates are based on special estimation procedures and are not actual counts.
Race and Hispanic ethnicity are reported separately in the NVSS. Data are available for non-Hispanic Whites and non-Hispanic Blacks for 1990 and later; however, for 1980 and 1985, data for Whites and Blacks may include persons of Hispanic ethnicity. For all years, Asian/Pacific Islander and American Indian/Alaska Native categories include persons of Hispanic ethnicity. Indicator 21 uses NVSS natality data. Race/ethnicity categories are White, Black, Hispanic, Asian/Pacific Islander, and American Indian/Alaska Native. Data for specified Hispanic subgroups are shown for these groups: Mexican, Puerto Rican, Cuban, and Other Hispanic, which includes Central and South American and “other and unknown Hispanic.” This indicator excludes data from New Hampshire for 1990–1992 and from Oklahoma for 1990 because information on Hispanic ethnicity was not reported. Since 2003, respondents in 18 states and the District of Columbia had the option of selecting more than one Hispanic origin group. Those respondents who selected more than one Hispanic origin group are classified as “other Hispanic.” Changes in the reporting of Hispanic origin, including the reporting of more than one Hispanic origin, have affected the distribution of births among specified Hispanic categories, resulting in increases for “other and unknown Hispanic” and small decreases for the specified Hispanic origin groups.

Status and Trends in the Education of Racial and Ethnic Minorities
Ap
pend
ix A
161
For more information on the National Center for Health Statistics and the NVSS, see http://www.cdc.gov/nchs/nvss.htm.
Youth Risk Behavior Survey (YRBS)
The National School-Based Youth Risk Behavior Survey (YRBS) is one component of the Youth Risk Behavior Surveillance System (YRBSS), an epidemio-logical surveillance system developed to monitor the prevalence of youth behaviors that most influence health. The YRBS uses a three-stage cluster sampling design to produce a nationally representative sample of students in grades 9–12 in the United States.
Race/ethnicity was computed from two questions: (1) “Are you Hispanic or Latino?” (response options were “yes” and “no”); and (2) “What is your race?” (response options were “American Indian or Alaska Native,” “Asian,” “Black or African American,” “Native Hawaiian or Other Pacific Islander,” or “White”). For the second question, students could select more than one response option. Students were classified as “Hispanic” if they answered “yes” to the first question, regardless of how they answered the second question regarding race. Students who answered “no” to the first question and selected more than one race/ethnicity in the second category were classified as “Two or more races.” Students who answered “no” to the first question and selected only one race/ethnicity were classified as that race/ethnicity.
Indicator 22 uses data from the YRBS. The mutually exclusive race/ethnicity categories reported are White (non-Hispanic), Black (non-Hispanic), Hispanic, Asian (non-Hispanic), Native Hawaiian and Other Pacific Islander (non-Hispanic), American Indian/Alaska Native (non-Hispanic), and Two or more races (non-Hispanic).
For more information on the YRBS, see http://www.cdc.gov/yrbs.
National Survey on Drug Use and Health (NSDUH)
The Substance Abuse and Mental Health Services Administration’s National Survey on Drug Use and Health (NSDUH) collects information on the prevalence, patterns, and consequences of drug and alcohol use and abuse in the general U.S. civilian noninstitutionalized population ages 12 and over. NSDUH is an annual sample survey.
The survey asks separate questions about Hispanic ethnicity and race. Respondents’ race options are White, Black/African American, American Indian or Alaska Native, Native Hawaiian or Other Pacific Islander, and Asian. Respondents may choose more than one race.
Indicator 20 uses data from the NSDUH. The mutually exclusive race/ethnicity categories reported are White (non-Hispanic), Black (non-Hispanic), Hispanic, Asian (non-Hispanic), American Indian/Alaska Native (non-Hispanic), and Two or more races (non-Hispanic). The Substance Abuse and Mental Health Services Administration did not report estimates on drug use for Native Hawaiians or Other Pacific Islanders; therefore, data for this race group are included in the totals, but these data are not shown separately in indicator 20.
For more information on the NSDUH, see http://oas.samhsa.gov/nsduh.htm.