statistics report for october 2014 - auckland transport · statistics report october 2014 . page |...
TRANSCRIPT
P a g e | 1
Statistics Report October 2014
P a g e | 2
TABLE OF CONTENTS PUBLIC TRANSPORT ......................................................................................................................... 3
1. HIGHLIGHTS ................................................................................................................................ 3 2. PUBLIC TRANSPORT PATRONAGE .......................................................................................... 5 3. PUBLIC TRANSPORT SERVICE PERFORMANCE .................................................................. 16 4. SPECIAL EVENT PUBLIC TRANSPORT SERVICES ............................................................... 21 5. REGISTERED SERVICE NOTIFICATIONS UNDER THE LAND TRANSPORT
MANAGEMENT AMENDED ACT 2013 ...................................................................................... 22 6. PUBLIC TRANSPORT SERVICE DEVELOPMENT PROJECTS .............................................. 23 7. PUBLIC TRANSPORT PROMOTIONAL ACTIVITIES ............................................................... 24 8. PUBLIC TRANSPORT CUSTOMER SERVICE CHANNELS .................................................... 26 9. MONTHLY CYCLE MONITORING REPORT (October 2014) ................................................... 27
P a g e | 3
PUBLIC TRANSPORT
1. HIGHLIGHTS
Patronage Auckland public transport patronage totalled 74,506,244 passenger trips for the 12 months to Oct-2014, an increase of +0.7% on the 12 months to Sep-2014 and +7.7% on the 12 months to Oct-2013. October monthly patronage was 6,824,204, an increase of 548,755 boardings or +8.7% on Oct-2013, normalised to ~ +8.8% accounting for special event patronage. There are the same number of business and weekend days in Oct-2014 compared to Oct-2013. Financial year to date patronage has grown by +8.6%.
Rail patronage totalled 12,124,025 passenger trips for the 12 months to Oct-2014, an increase of +1.7% on the 12 months to Sep-2014 and +17.6% on the 12 months to Oct-2013. Patronage for Oct-2014 was 1,165,057, an increase of 200,678 boardings or +20.8% on Oct-2013, normalised to ~ +20.7%. Financial year to date rail patronage has grown by +17.8%.
The Northern Express bus service carried 2,580,225 passenger trips for the 12 months to Oct-2014, an increase of +1.6% on the 12 months to Sep-2014 and +12.4% on the 12 months to Oct-2013. Northern Express bus service patronage for Oct-2014 was 246,472, an increase of 40,207 boardings or +19.5% on Oct-2013, normalised to ~ +19.9%. Financial year to date Northern Express patronage has grown by +18.8%.
Bus services excluding Northern Express carried 54,713,200 passenger trips for the 12 months to Oct-2014, an increase of +0.6% on the 12 months to Sep-2014 and +6.2% on the 12 months to Oct-2013. Bus services excluding Northern Express patronage for Oct-2014 was 4,980,532, an increase of 325,791 boardings or +7.0% on Oct-2013, normalised to ~ +7.1%. Financial year to date bus services excluding Northern Express patronage has grown by +7.0%.
Ferry services carried 5,088,794 passenger trips for the 12 months to Oct-2014, a decrease of -0.4% on the 12 months to Sep-2014 and an increase +0.5% on the 12 months to Oct-2013. Ferry services patronage for Oct-2014 was 432,143, a decrease of -17,921 boardings or -4.0% on Oct-2013, normalised to ~ -3.9%. Financial year to date ferry patronage has decreased by -1.3%. This fall is attributed to the poor weather conditions throughout October, decreasing the number of non-commuter/tourism related passenger trips.
Service Performance For rail, service punctuality in Oct-2014 was 90.0%, compared to the average for the 12 months to Oct-2014 of 88.1%. Service delivery was 98.4%, compared to the average for the 12 months to Oct-2014 of 97.3%.
For bus, service punctuality in Oct-2014 was 91.4%. Service delivery was 96.5%.
For ferry, service punctuality in Oct-2014 was 99.8%. Service delivery was 99.9%. Ferry service punctuality and reliability remain operator self-reported.
Initiatives • New simplified bus network for Pukekohe and Waiuku consultation has been taking place
between 22 September to 17 October. • The ‘Get on board with Jerome’ campaign is a brand campaign for Public Transport. The
campaign runs through October and November, primary objective of the campaign is to encourage increased use of public transport.
• New Discovery Day Pass aimed at the Visitor market will be launched end October.

P a g e | 4
• Retailer promotions programme targeted at a large number of public transport users that are still paying cash fares at locations within close proximity to Customer Service Centres and retail outlets. Several similar stops across Auckland have been identified and will be targeted with this campaign to increase awareness of the retailer close by.
• A new rail timetable from the 8th December will present Manukau services only operating on the Eastern Line and all Papakura / Pukekohe services operating via the Southern Line. Also Onehunga weekend service frequency will increase from 8th December with trains departing every 30 minutes.
• Fullers Group commissioned a new vessel, Te Kotuku, on 31st October, which will operate across a number of Fullers’ services including Waiheke.
P a g e | 5
2. PUBLIC TRANSPORT PATRONAGE
Network Wide Summary Normalising factors used on actual patronage counts in this report for Oct-2014 include:
• Additional patronage for special events across bus and rail.
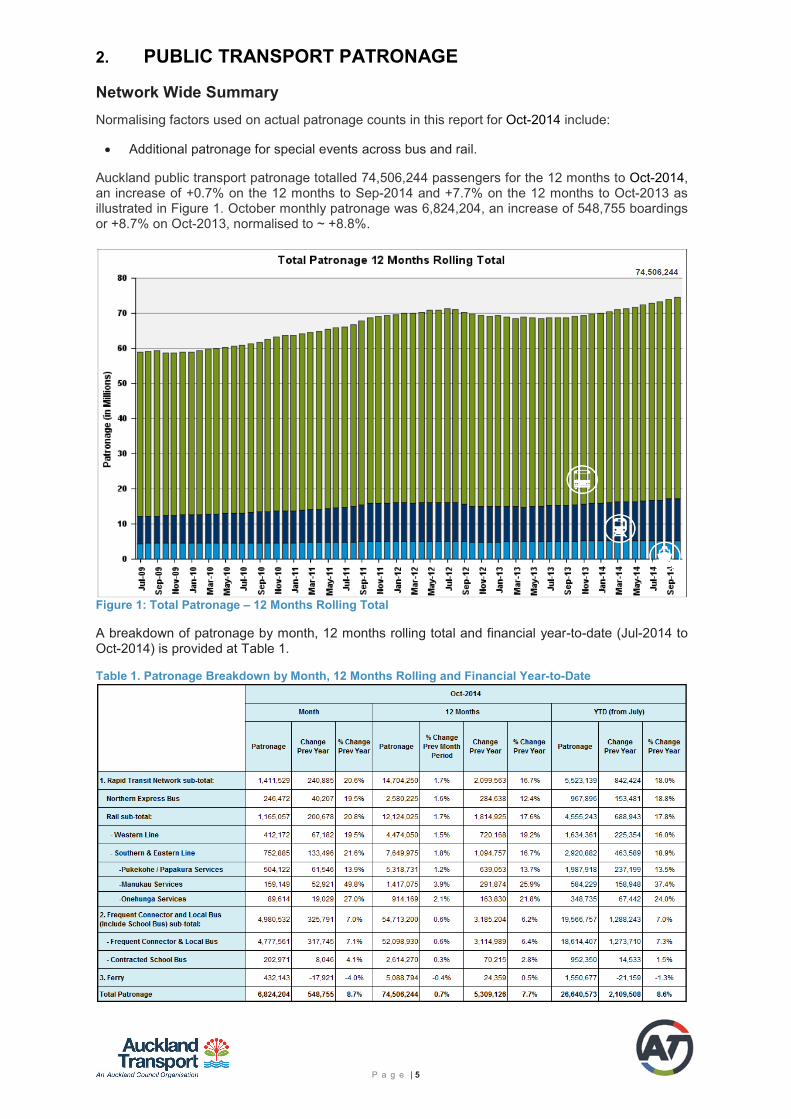
Auckland public transport patronage totalled 74,506,244 passengers for the 12 months to Oct-2014, an increase of +0.7% on the 12 months to Sep-2014 and +7.7% on the 12 months to Oct-2013 as illustrated in Figure 1. October monthly patronage was 6,824,204, an increase of 548,755 boardings or +8.7% on Oct-2013, normalised to ~ +8.8%.
Figure 1: Total Patronage – 12 Months Rolling Total
A breakdown of patronage by month, 12 months rolling total and financial year-to-date (Jul-2014 to Oct-2014) is provided at Table 1.
Table 1. Patronage Breakdown by Month, 12 Months Rolling and Financial Year-to-Date
P a g e | 6
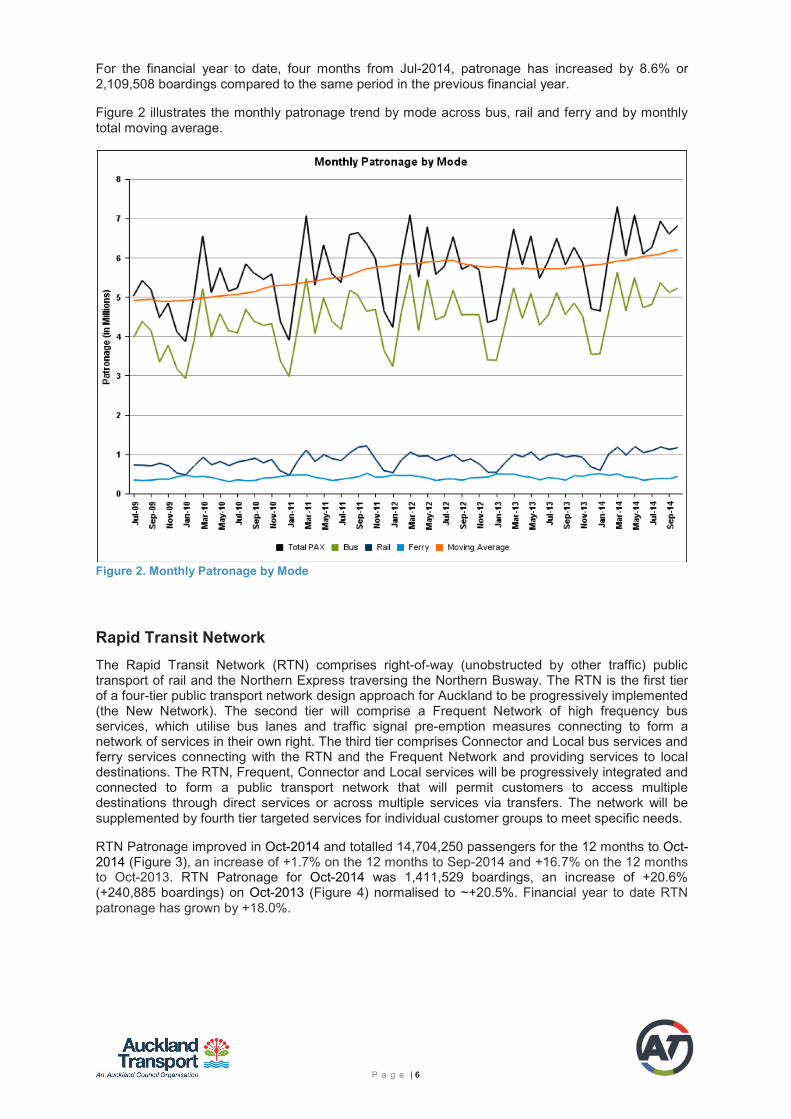
For the financial year to date, four months from Jul-2014, patronage has increased by 8.6% or 2,109,508 boardings compared to the same period in the previous financial year.
Figure 2 illustrates the monthly patronage trend by mode across bus, rail and ferry and by monthly total moving average.
Figure 2. Monthly Patronage by Mode
Rapid Transit Network The Rapid Transit Network (RTN) comprises right-of-way (unobstructed by other traffic) public transport of rail and the Northern Express traversing the Northern Busway. The RTN is the first tier of a four-tier public transport network design approach for Auckland to be progressively implemented (the New Network). The second tier will comprise a Frequent Network of high frequency bus services, which utilise bus lanes and traffic signal pre-emption measures connecting to form a network of services in their own right. The third tier comprises Connector and Local bus services and ferry services connecting with the RTN and the Frequent Network and providing services to local destinations. The RTN, Frequent, Connector and Local services will be progressively integrated and connected to form a public transport network that will permit customers to access multiple destinations through direct services or across multiple services via transfers. The network will be supplemented by fourth tier targeted services for individual customer groups to meet specific needs.
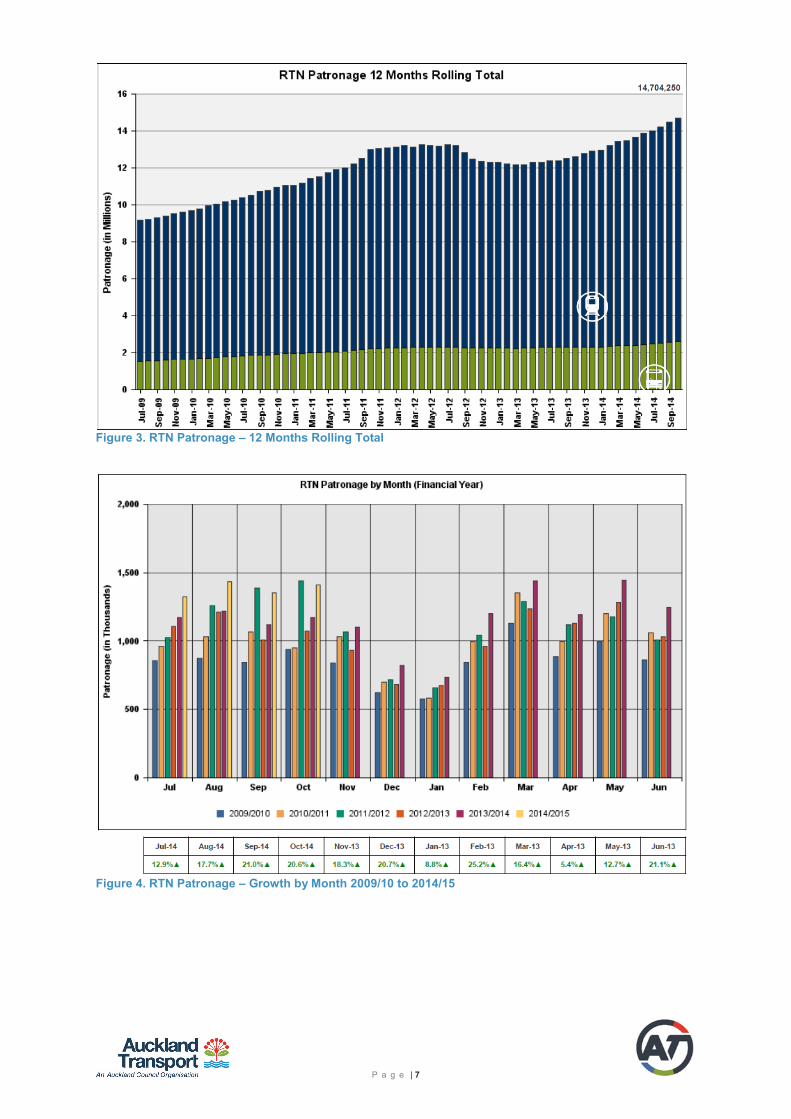
RTN Patronage improved in Oct-2014 and totalled 14,704,250 passengers for the 12 months to Oct-2014 (Figure 3), an increase of +1.7% on the 12 months to Sep-2014 and +16.7% on the 12 months to Oct-2013. RTN Patronage for Oct-2014 was 1,411,529 boardings, an increase of +20.6% (+240,885 boardings) on Oct-2013 (Figure 4) normalised to ~+20.5%. Financial year to date RTN patronage has grown by +18.0%.
P a g e | 7
Figure 3. RTN Patronage – 12 Months Rolling Total
Figure 4. RTN Patronage – Growth by Month 2009/10 to 2014/15
P a g e | 8
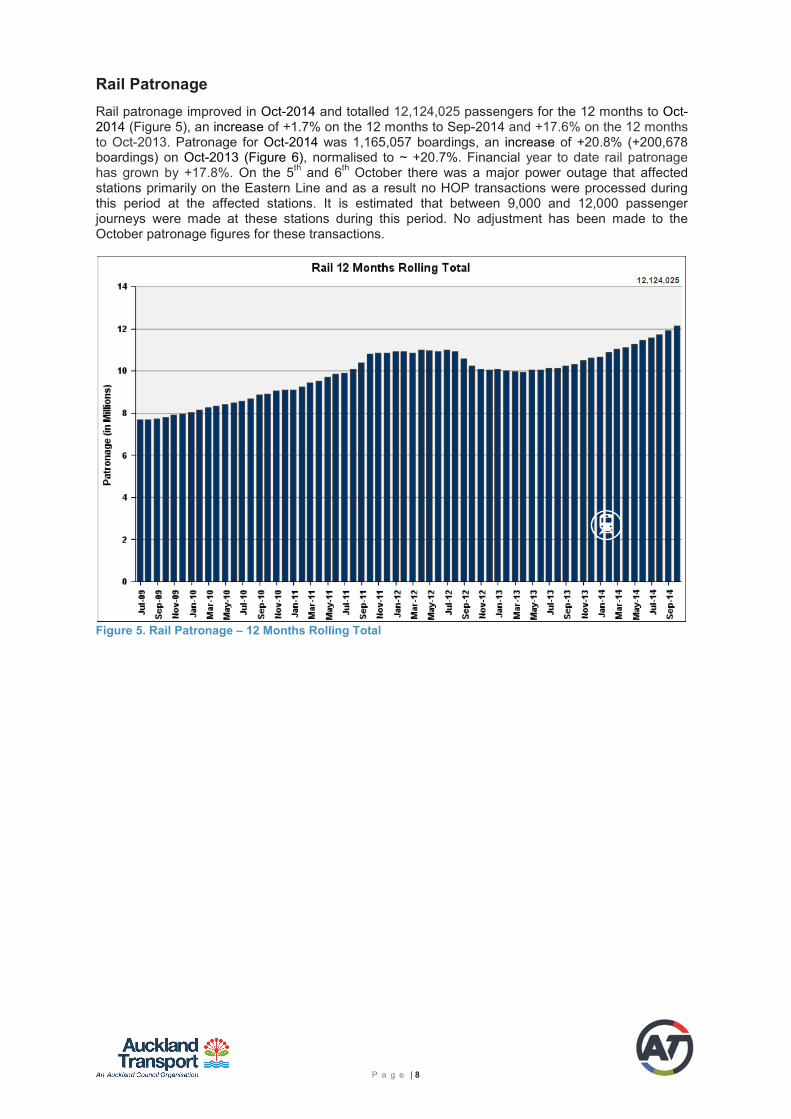
Rail Patronage Rail patronage improved in Oct-2014 and totalled 12,124,025 passengers for the 12 months to Oct-2014 (Figure 5), an increase of +1.7% on the 12 months to Sep-2014 and +17.6% on the 12 months to Oct-2013. Patronage for Oct-2014 was 1,165,057 boardings, an increase of +20.8% (+200,678 boardings) on Oct-2013 (Figure 6), normalised to ~ +20.7%. Financial year to date rail patronage has grown by +17.8%. On the 5th and 6th October there was a major power outage that affected stations primarily on the Eastern Line and as a result no HOP transactions were processed during this period at the affected stations. It is estimated that between 9,000 and 12,000 passenger journeys were made at these stations during this period. No adjustment has been made to the October patronage figures for these transactions.
Figure 5. Rail Patronage – 12 Months Rolling Total
P a g e | 9
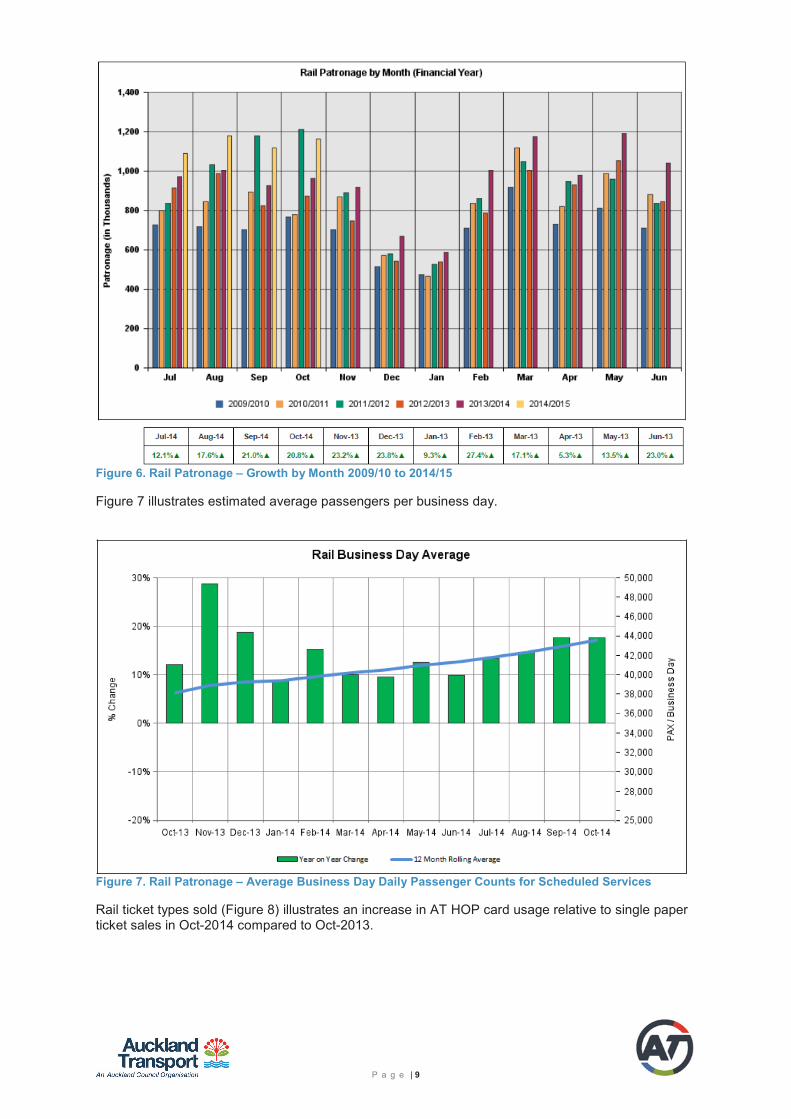
Figure 6. Rail Patronage – Growth by Month 2009/10 to 2014/15
Figure 7 illustrates estimated average passengers per business day.
Figure 7. Rail Patronage – Average Business Day Daily Passenger Counts for Scheduled Services
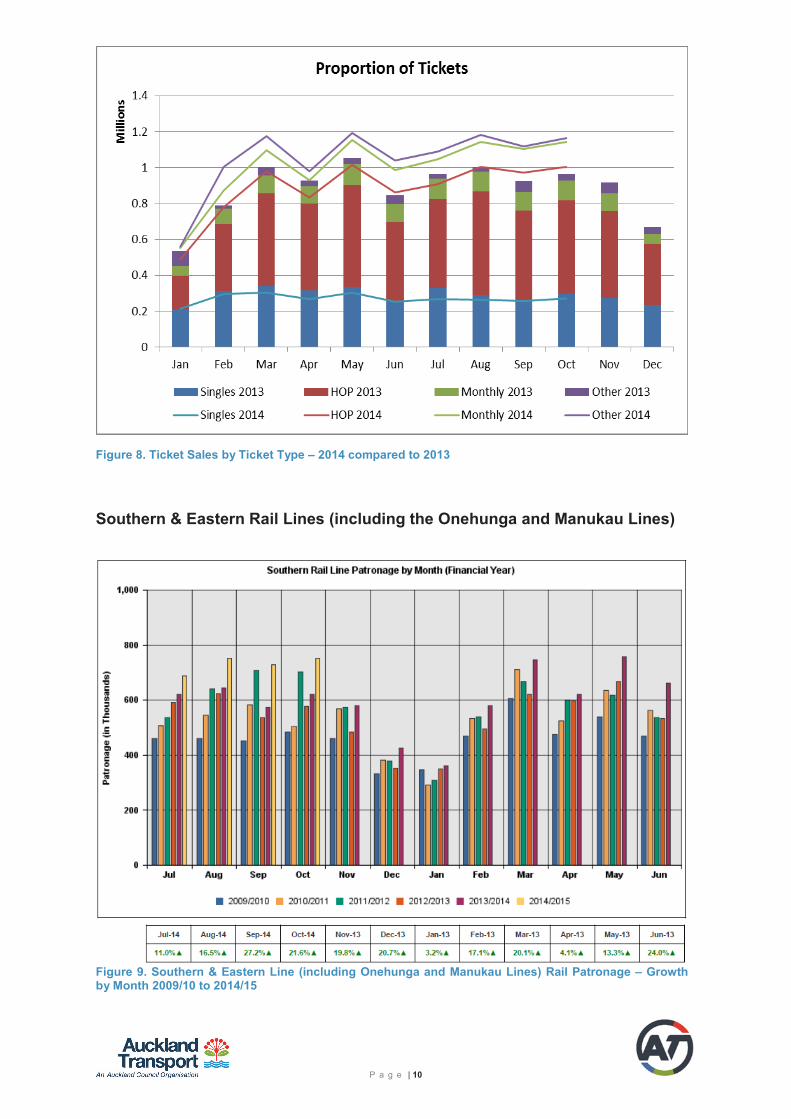
Rail ticket types sold (Figure 8) illustrates an increase in AT HOP card usage relative to single paper ticket sales in Oct-2014 compared to Oct-2013.
P a g e | 10
Figure 8. Ticket Sales by Ticket Type – 2014 compared to 2013
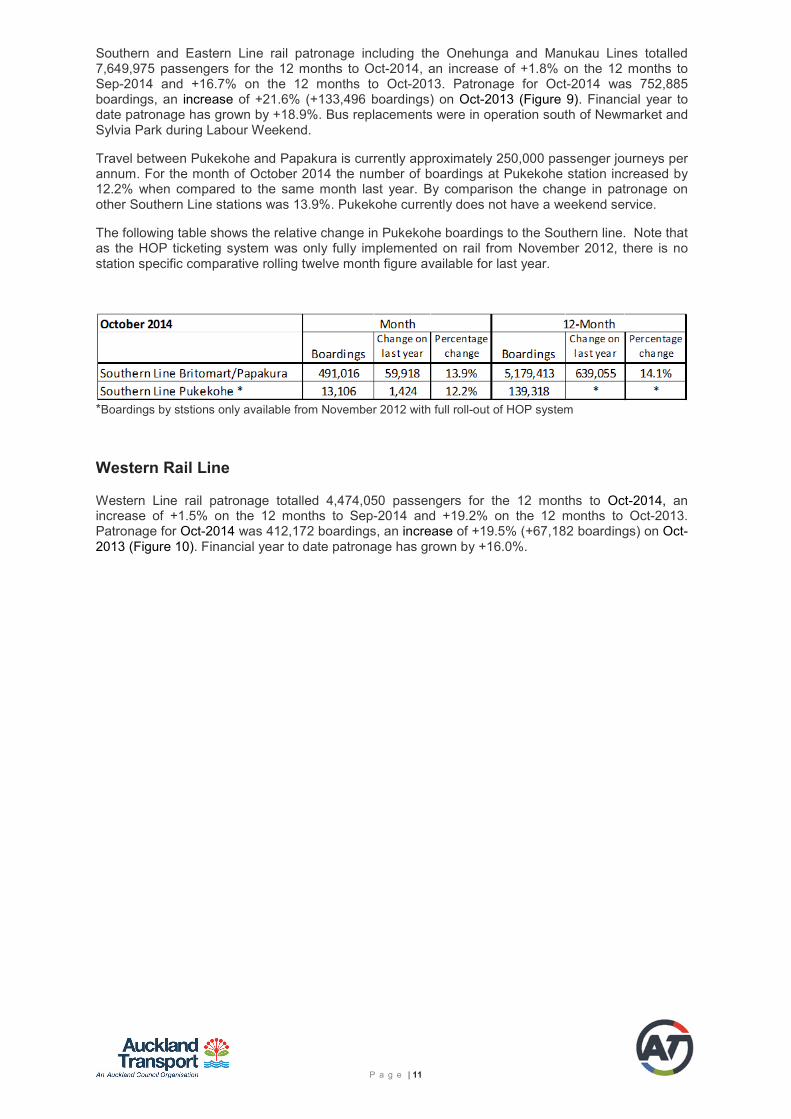
Southern & Eastern Rail Lines (including the Onehunga and Manukau Lines)
Figure 9. Southern & Eastern Line (including Onehunga and Manukau Lines) Rail Patronage – Growth by Month 2009/10 to 2014/15
P a g e | 11
Southern and Eastern Line rail patronage including the Onehunga and Manukau Lines totalled 7,649,975 passengers for the 12 months to Oct-2014, an increase of +1.8% on the 12 months to Sep-2014 and +16.7% on the 12 months to Oct-2013. Patronage for Oct-2014 was 752,885 boardings, an increase of +21.6% (+133,496 boardings) on Oct-2013 (Figure 9). Financial year to date patronage has grown by +18.9%. Bus replacements were in operation south of Newmarket and Sylvia Park during Labour Weekend.
Travel between Pukekohe and Papakura is currently approximately 250,000 passenger journeys per annum. For the month of October 2014 the number of boardings at Pukekohe station increased by 12.2% when compared to the same month last year. By comparison the change in patronage on other Southern Line stations was 13.9%. Pukekohe currently does not have a weekend service.
The following table shows the relative change in Pukekohe boardings to the Southern line. Note that as the HOP ticketing system was only fully implemented on rail from November 2012, there is no station specific comparative rolling twelve month figure available for last year.
*Boardings by ststions only available from November 2012 with full roll-out of HOP system
Western Rail Line
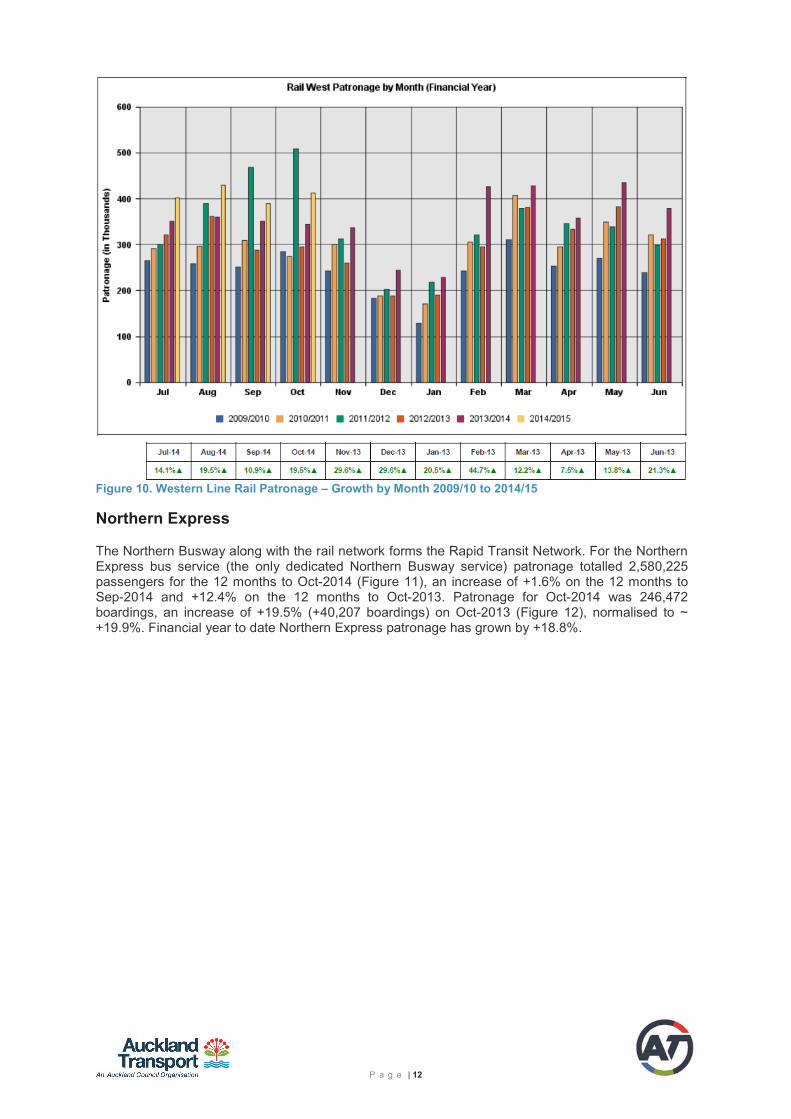
Western Line rail patronage totalled 4,474,050 passengers for the 12 months to Oct-2014, an increase of +1.5% on the 12 months to Sep-2014 and +19.2% on the 12 months to Oct-2013. Patronage for Oct-2014 was 412,172 boardings, an increase of +19.5% (+67,182 boardings) on Oct-2013 (Figure 10). Financial year to date patronage has grown by +16.0%.
P a g e | 12
Figure 10. Western Line Rail Patronage – Growth by Month 2009/10 to 2014/15
Northern Express
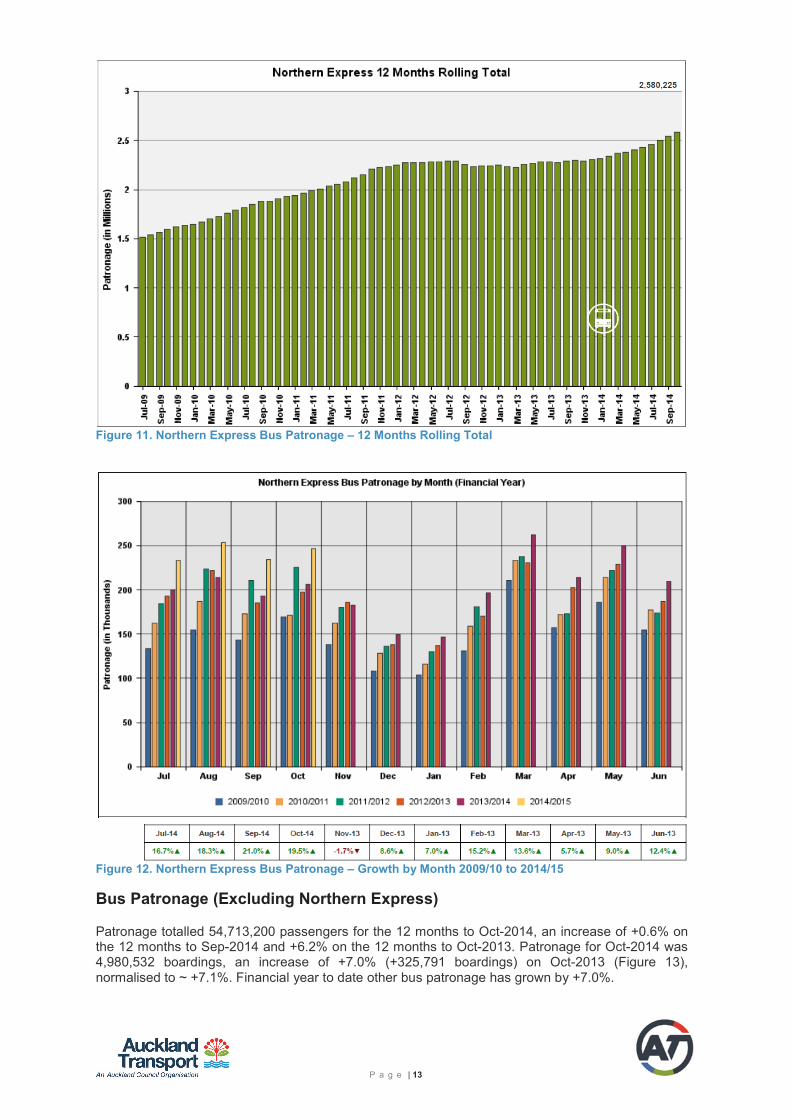
The Northern Busway along with the rail network forms the Rapid Transit Network. For the Northern Express bus service (the only dedicated Northern Busway service) patronage totalled 2,580,225 passengers for the 12 months to Oct-2014 (Figure 11), an increase of +1.6% on the 12 months to Sep-2014 and +12.4% on the 12 months to Oct-2013. Patronage for Oct-2014 was 246,472 boardings, an increase of +19.5% (+40,207 boardings) on Oct-2013 (Figure 12), normalised to ~ +19.9%. Financial year to date Northern Express patronage has grown by +18.8%.
P a g e | 13
Figure 11. Northern Express Bus Patronage – 12 Months Rolling Total
Figure 12. Northern Express Bus Patronage – Growth by Month 2009/10 to 2014/15
Bus Patronage (Excluding Northern Express)
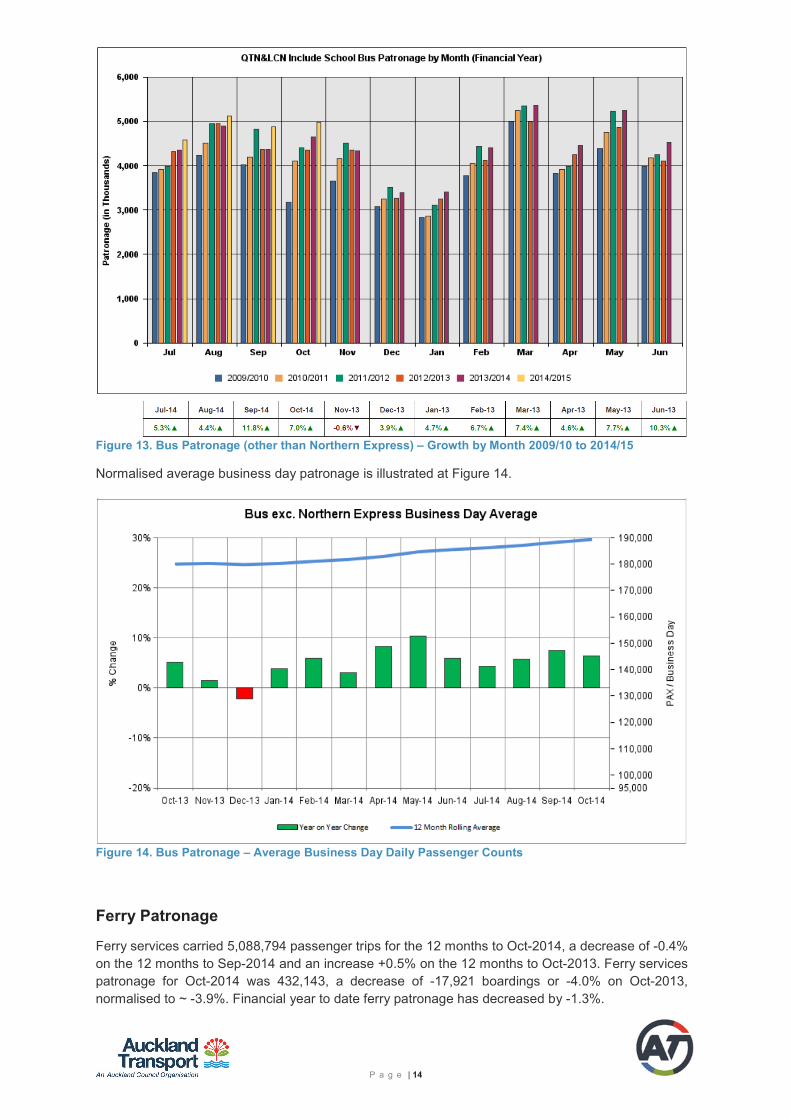
Patronage totalled 54,713,200 passengers for the 12 months to Oct-2014, an increase of +0.6% on the 12 months to Sep-2014 and +6.2% on the 12 months to Oct-2013. Patronage for Oct-2014 was 4,980,532 boardings, an increase of +7.0% (+325,791 boardings) on Oct-2013 (Figure 13), normalised to ~ +7.1%. Financial year to date other bus patronage has grown by +7.0%.
P a g e | 14
Figure 13. Bus Patronage (other than Northern Express) – Growth by Month 2009/10 to 2014/15
Normalised average business day patronage is illustrated at Figure 14.
Figure 14. Bus Patronage – Average Business Day Daily Passenger Counts
Ferry Patronage
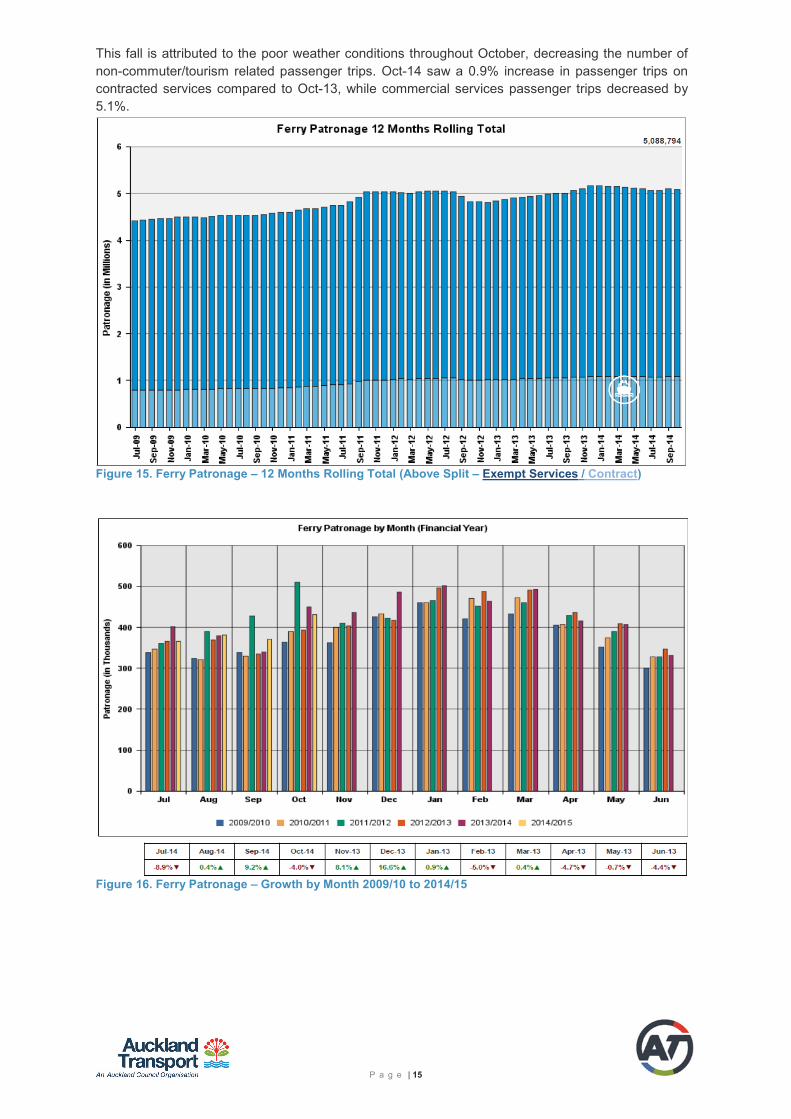
Ferry services carried 5,088,794 passenger trips for the 12 months to Oct-2014, a decrease of -0.4% on the 12 months to Sep-2014 and an increase +0.5% on the 12 months to Oct-2013. Ferry services patronage for Oct-2014 was 432,143, a decrease of -17,921 boardings or -4.0% on Oct-2013, normalised to ~ -3.9%. Financial year to date ferry patronage has decreased by -1.3%.
P a g e | 15
This fall is attributed to the poor weather conditions throughout October, decreasing the number of non-commuter/tourism related passenger trips. Oct-14 saw a 0.9% increase in passenger trips on contracted services compared to Oct-13, while commercial services passenger trips decreased by 5.1%.
Figure 15. Ferry Patronage – 12 Months Rolling Total (Above Split – Exempt Services / Contract)
Figure 16. Ferry Patronage – Growth by Month 2009/10 to 2014/15
P a g e | 16
3. PUBLIC TRANSPORT SERVICE PERFORMANCE
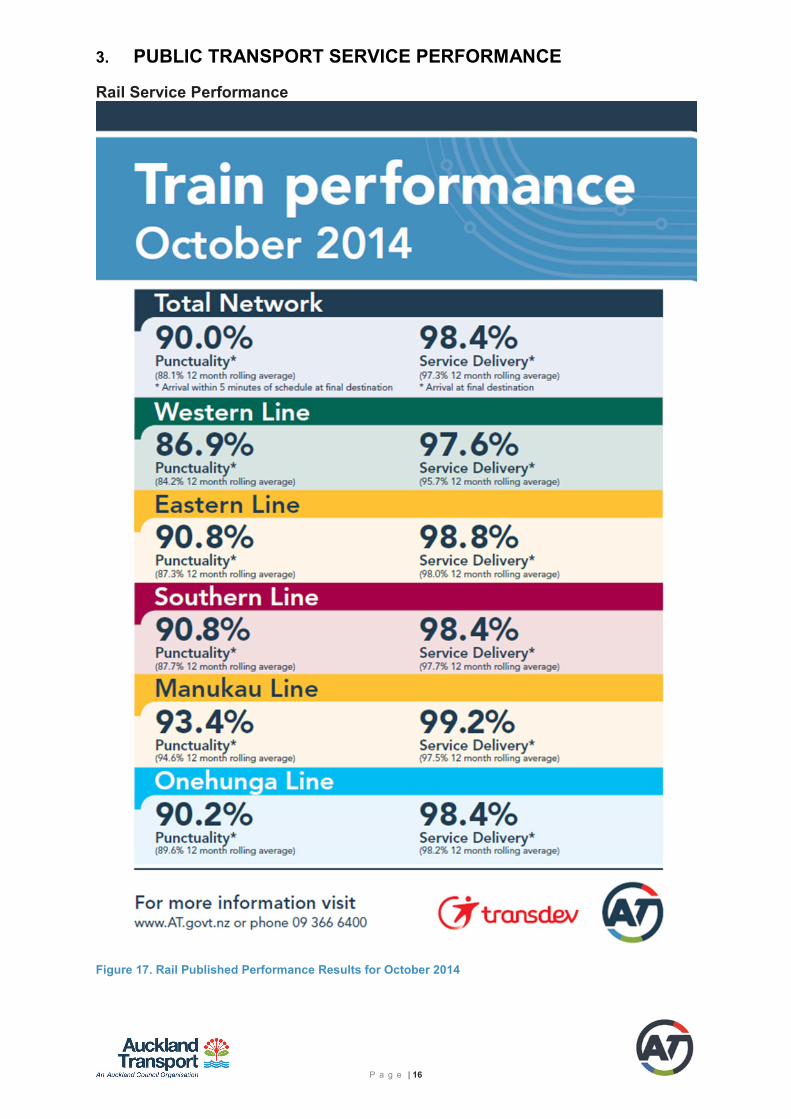
Rail Service Performance
Figure 17. Rail Published Performance Results for October 2014
P a g e | 17
Service delivery (or reliability) is the proportion of trains that are not cancelled in full or part and arrive at their final destination. Punctuality is the proportion of trains that were not cancelled in full or part and that arrived at their final destination within five minutes of the scheduled time regardless of whether the train departed its origin on time.
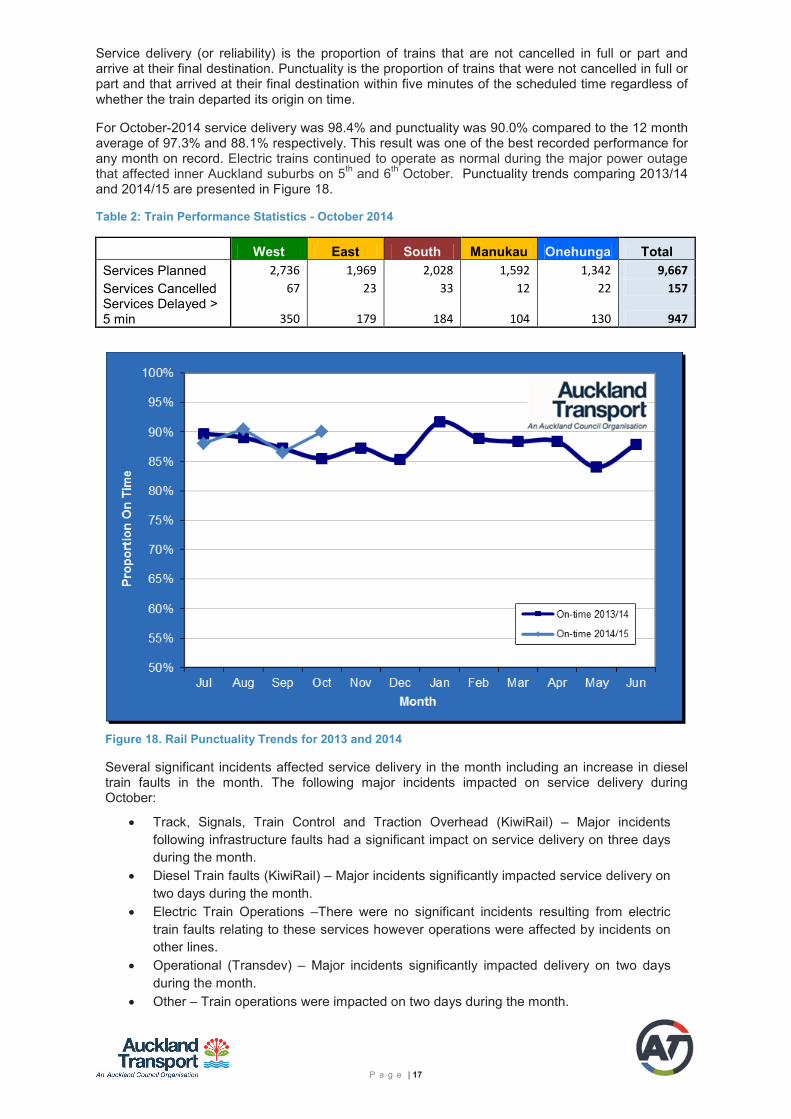
For October-2014 service delivery was 98.4% and punctuality was 90.0% compared to the 12 month average of 97.3% and 88.1% respectively. This result was one of the best recorded performance for any month on record. Electric trains continued to operate as normal during the major power outage that affected inner Auckland suburbs on 5th and 6th October. Punctuality trends comparing 2013/14 and 2014/15 are presented in Figure 18.
Table 2: Train Performance Statistics - October 2014
West East South Manukau Onehunga Total Services Planned 2,736 1,969 2,028 1,592 1,342 9,667 Services Cancelled 67 23 33 12 22 157 Services Delayed > 5 min 350 179 184 104 130 947
Figure 18. Rail Punctuality Trends for 2013 and 2014
Several significant incidents affected service delivery in the month including an increase in diesel train faults in the month. The following major incidents impacted on service delivery during October:
• Track, Signals, Train Control and Traction Overhead (KiwiRail) – Major incidents following infrastructure faults had a significant impact on service delivery on three days during the month.
• Diesel Train faults (KiwiRail) – Major incidents significantly impacted service delivery on two days during the month.
• Electric Train Operations –There were no significant incidents resulting from electric train faults relating to these services however operations were affected by incidents on other lines.
• Operational (Transdev) – Major incidents significantly impacted delivery on two days during the month.
• Other – Train operations were impacted on two days during the month.
P a g e | 18
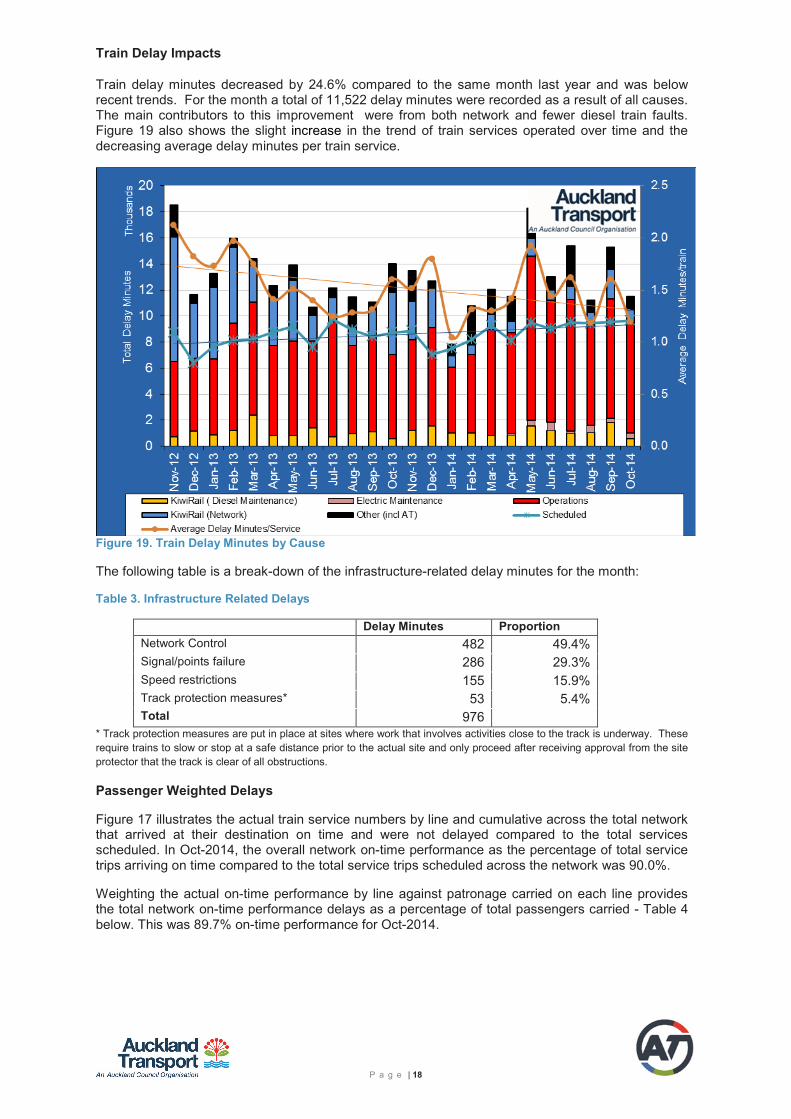
Train Delay Impacts
Train delay minutes decreased by 24.6% compared to the same month last year and was below recent trends. For the month a total of 11,522 delay minutes were recorded as a result of all causes. The main contributors to this improvement were from both network and fewer diesel train faults. Figure 19 also shows the slight increase in the trend of train services operated over time and the decreasing average delay minutes per train service.
Figure 19. Train Delay Minutes by Cause
The following table is a break-down of the infrastructure-related delay minutes for the month:
Table 3. Infrastructure Related Delays
Delay Minutes Proportion Network Control 482 49.4% Signal/points failure 286 29.3% Speed restrictions 155 15.9% Track protection measures* 53 5.4% Total 976
* Track protection measures are put in place at sites where work that involves activities close to the track is underway. These require trains to slow or stop at a safe distance prior to the actual site and only proceed after receiving approval from the site protector that the track is clear of all obstructions.
Passenger Weighted Delays
Figure 17 illustrates the actual train service numbers by line and cumulative across the total network that arrived at their destination on time and were not delayed compared to the total services scheduled. In Oct-2014, the overall network on-time performance as the percentage of total service trips arriving on time compared to the total service trips scheduled across the network was 90.0%.
Weighting the actual on-time performance by line against patronage carried on each line provides the total network on-time performance delays as a percentage of total passengers carried - Table 4 below. This was 89.7% on-time performance for Oct-2014.
P a g e | 19
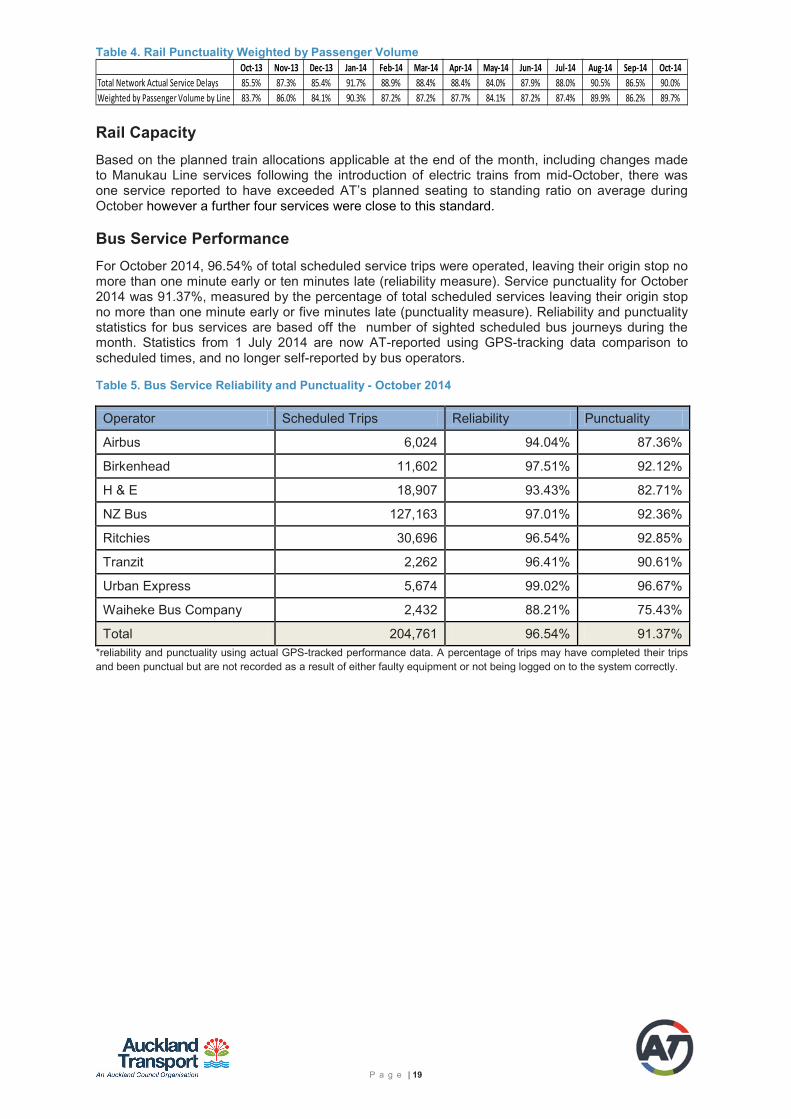
Table 4. Rail Punctuality Weighted by Passenger Volume
Rail Capacity Based on the planned train allocations applicable at the end of the month, including changes made to Manukau Line services following the introduction of electric trains from mid-October, there was one service reported to have exceeded AT’s planned seating to standing ratio on average during October however a further four services were close to this standard.
Bus Service Performance For October 2014, 96.54% of total scheduled service trips were operated, leaving their origin stop no more than one minute early or ten minutes late (reliability measure). Service punctuality for October 2014 was 91.37%, measured by the percentage of total scheduled services leaving their origin stop no more than one minute early or five minutes late (punctuality measure). Reliability and punctuality statistics for bus services are based off the number of sighted scheduled bus journeys during the month. Statistics from 1 July 2014 are now AT-reported using GPS-tracking data comparison to scheduled times, and no longer self-reported by bus operators.
Table 5. Bus Service Reliability and Punctuality - October 2014
Operator Scheduled Trips Reliability Punctuality
Airbus 6,024 94.04% 87.36%
Birkenhead 11,602 97.51% 92.12%
H & E 18,907 93.43% 82.71%
NZ Bus 127,163 97.01% 92.36%
Ritchies 30,696 96.54% 92.85%
Tranzit 2,262 96.41% 90.61%
Urban Express 5,674 99.02% 96.67%
Waiheke Bus Company 2,432 88.21% 75.43%
Total 204,761 96.54% 91.37% *reliability and punctuality using actual GPS-tracked performance data. A percentage of trips may have completed their trips and been punctual but are not recorded as a result of either faulty equipment or not being logged on to the system correctly.
Oct-13 Nov-13 Dec-13 Jan-14 Feb-14 Mar-14 Apr-14 May-14 Jun-14 Jul-14 Aug-14 Sep-14 Oct-14Total Network Actual Service Delays 85.5% 87.3% 85.4% 91.7% 88.9% 88.4% 88.4% 84.0% 87.9% 88.0% 90.5% 86.5% 90.0%Weighted by Passenger Volume by Line 83.7% 86.0% 84.1% 90.3% 87.2% 87.2% 87.7% 84.1% 87.2% 87.4% 89.9% 86.2% 89.7%
P a g e | 20
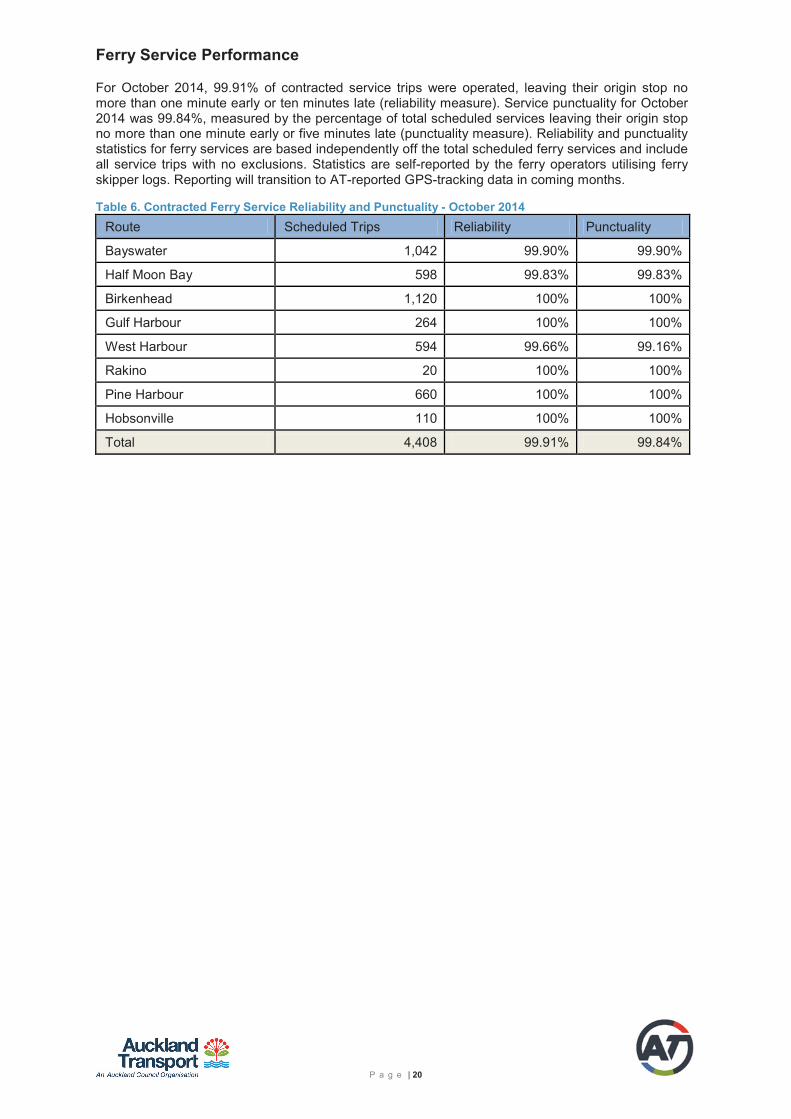
Ferry Service Performance
For October 2014, 99.91% of contracted service trips were operated, leaving their origin stop no more than one minute early or ten minutes late (reliability measure). Service punctuality for October 2014 was 99.84%, measured by the percentage of total scheduled services leaving their origin stop no more than one minute early or five minutes late (punctuality measure). Reliability and punctuality statistics for ferry services are based independently off the total scheduled ferry services and include all service trips with no exclusions. Statistics are self-reported by the ferry operators utilising ferry skipper logs. Reporting will transition to AT-reported GPS-tracking data in coming months.
Table 6. Contracted Ferry Service Reliability and Punctuality - October 2014 Route Scheduled Trips Reliability Punctuality Bayswater 1,042 99.90% 99.90% Half Moon Bay 598 99.83% 99.83% Birkenhead 1,120 100% 100% Gulf Harbour 264 100% 100% West Harbour 594 99.66% 99.16% Rakino 20 100% 100% Pine Harbour 660 100% 100% Hobsonville 110 100% 100%
Total 4,408 99.91% 99.84%
P a g e | 21
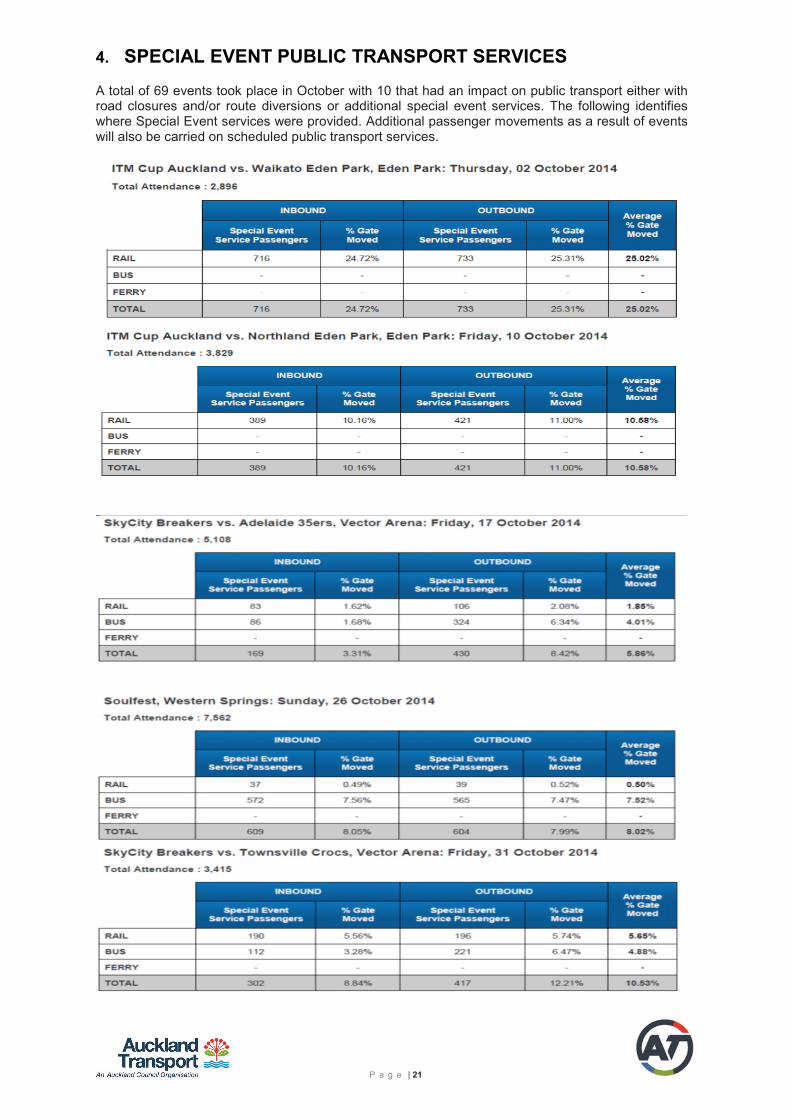
4. SPECIAL EVENT PUBLIC TRANSPORT SERVICES
A total of 69 events took place in October with 10 that had an impact on public transport either with road closures and/or route diversions or additional special event services. The following identifies where Special Event services were provided. Additional passenger movements as a result of events will also be carried on scheduled public transport services.
P a g e | 22
5. REGISTERED SERVICE NOTIFICATIONS UNDER THE LAND TRANSPORT MANAGEMENT AMENDED ACT 2013 Under the Land Transport Management Amendment Act 2003, the following applications for exempt public transport services have been approved during October 2014:
• Sealink Pine Harbour Limited: Notification to register an Exempt PT service from Pine Harbour to Matiatia wharf, Waiheke. Approved 20-Oct-14.
• Sealink Pine Harbour Limited: Notification to register an Exempt PT service from Auckland to Matiatia wharf, Waiheke. Approved 20-Oct-14.
• Waiheke Executive Transport 2009 Limited: Notification to register an Exempt PT service from Matiatia wharf to Oneroa Library on Waiheke Island. Approved 20-Oct-14.
• Sealink Travel Group Limited: Notification to vary an Exempt PT service registration to operate a summer timetable from Downtown (Pier 3) to Tryphena wharf, Great Barrier Island (Labour weekend services). Approved 21-Oct-14.
• Sealink Travel Group Limited: Notification to vary an Exempt PT service registration to operate a summer timetable from Wynyard Wharf, Downtown to Tryphena Wharf, Great Barrier (Dec-April timetable). Approved 21-Oct-14.
• Manabus.com Limited: Notification to register an Exempt PT service to operate an express Intercity service. Approved 30-Oct-14.
P a g e | 23
6. PUBLIC TRANSPORT SERVICE DEVELOPMENT PROJECTS
Projects Implemented
• Pukekohe and Waiuku – consultation on the bus New Network was completed on the 17th of October 2014.
• North Star services were adjusted from 12 October 2014 to improve timetable reliability and punctuality.
• The Business Case for Zonal Integrated Fares has received AT Board approval.
Projects in Progress
• West Auckland – consultation on the bus New Network has commenced and will finish on 1 December 2014.
• Howick and Eastern services will be adjusted to improve timetable reliability and punctuality and the planned go live date is 14 December 2014.
• The bus replacement of the Saturday Waitakere to Swanson Rail link is planned with a go live date of 13 December 2014.
• The Swanson Park and Ride tendering process is underway with construction expected to start before Xmas 2014.
• A new timetable from the 8th December will present Manukau services only operating on the Eastern Line and all Papakura / Pukekohe services operating via the Southern Line. A full 10 minute peak EMU service with 20 minute inter-peak and 30 off-peak services will be introduced on the Eastern Line to Manukau and complete the introduction of the Eastern Line electrified timetable service.
• Onehunga weekend service frequency will also increase from 8th December with trains departing every 30 minutes rather than every 60 minutes, making Onehunga a consistent 30 minute frequency seven days a week.
• Pukekohe weekend rail services will be introduce from 13th December.
Projects in Planning
• Timetables for Birkenheadand Ritchies are being reviewed to improve timetable reliability and punctuality.
P a g e | 24
7. PUBLIC TRANSPORT PROMOTIONAL ACTIVITIES “Get on board with Jerome” campaign
The ‘Get on board with Jerome’ campaign is a brand campaign for Public Transport. The primary objective of the campaign is to encourage increased use of public transport. The campaign runs through October and November, with the AT HOP sales promotion running in November. The campaign is intended to be long term through 2015. See www.at.govt.nz/onboard
Campaign objectives:
• Increase patronage on trains, buses and ferries
• Increase use of the Journey Planner
• Increase sales and use of the AT HOP card
• Increase registration rates on the AT HOP card
Best Fare The Best Fare campaign was launched to encourage greater use of AT HOP and online top-ups:
• by encouraging parents to take a more active role than giving their kid’s cash.
• educate parents on the savings they can make by registering the AT HOP card under their child’s name and loading a child concession.
The campaign has been in the market since mid-September and the message has been communicated via newspaper ads, posters on board trains and buses, at AT HOP retailers and customer service centres. Information has also been sent to schools via the Travel Demand Management team to add to their newsletter and website.
Extended hours for Waiheke Customer Service Centre In order to increase the level of service to Waiheke Island customers we are providing dedicated Customer Services facilities for processing of concessions on the island. The Customer Service Centre will be open on the last Tuesday of each month, starting from the 28th October.
Discovery Day Pass The AT HOP Discovery Day Pass is a product aimed for the visitor market. Development has been based on key customer requirements identified in the Visitor Market Segment research. These include more targeted and specific information on routes, pricing, concessions, easy to view summaries of transport options and easy to use network/route information maps.
This pilot marketing project has a key objective to introduce and promote a recognisable electronic ‘One Day Pass’, plus promoting the Inner/Outer LINK and Ferry Services with a starter destination visitor guide/pass that provides interconnected public transport routes to key destinations. The pass will be launched via two key sites, iSITE at the International Airport and the Britomart Transport Centre in the city centre on 28th October.
Inner Link 28 September – 26 October This campaign focusses on residents of Ponsonby who either commute or regularly travel to the CBD by car. Using a creative style that was successful in launching the increased frequency of service for the City Link, the advertising repeats points of strength for Inner Link.
Outer Link 28 September – 26 October Similarly for residents in Westmere we have focussed on the benefits of the Outer Link service while highlighting the frustrations of driving.
Titirangi, Laingholm and South Lynn acquisition campaign 1 September - 5 October
A campaign to increase patronage for the recently improved bus services in the Titirangi, Laingholm and South Lynn areas. Newspaper advertising in the Western Leader, addressed mail delivery to

P a g e | 25
21,000 households in the area, advertising on the back of buses, posters in Adshel spaces on Titirangi Rd and a mobile billboard on Seabrook Ave alongside one of the routes. Also visited local cafes, dairies, schools, libraries and community centres to explain the changes and install posters.
New Network Consultation – Pukekohe and Waiuku 22 September to 17 October Marketing materials informing the public of the New Network consultation have been in market since 22 September. These include press, online, digital screens, and PT posters.
New Network Consultation – West Auckland 21 October to 1 December Marketing materials for the New Network consultation in West Auckland are currently in market – includes press (English and ethnic papers), mail-drop to Western households, adshels and online advertising.
The New Network promo videos are also in market. Their launch was timed to coincide with the West consultation. Their primary aim is to increase awareness of the New Network, which in turn should translate into a higher response rate for the West consultation.
New Movers Each month a personal, welcome to the neighbourhood pack with public transport information is sent to all ‘new movers’ (people changing residential address). The program is being revised to incorporate personal journey planning and the opportunity for qualifying individuals to trial public transport using a ‘give it a go’ pass.
Retailer promotions A large number of public transport users are still paying cash fares even at locations within close proximity to Customer Service Centres and retail outlets. For example at stop 7045 Queen St near Customs St West, 4,490 cash sales were made within a week. Several similar stops across Auckland have been identified and will be targeted with this campaign to increase awareness of the retailer close by.
The aim of this campaign is to target frequent public transport users who may not be aware of where to get a card and highlight the convenience of getting a card and the 20% savings they receive on their travel by using an AT HOP card. Phase 1 of this campaign is now live. This is an on-going campaign and will run until the end of the year.
P a g e | 26
8. PUBLIC TRANSPORT CUSTOMER SERVICE CHANNELS Walk-In-Centres
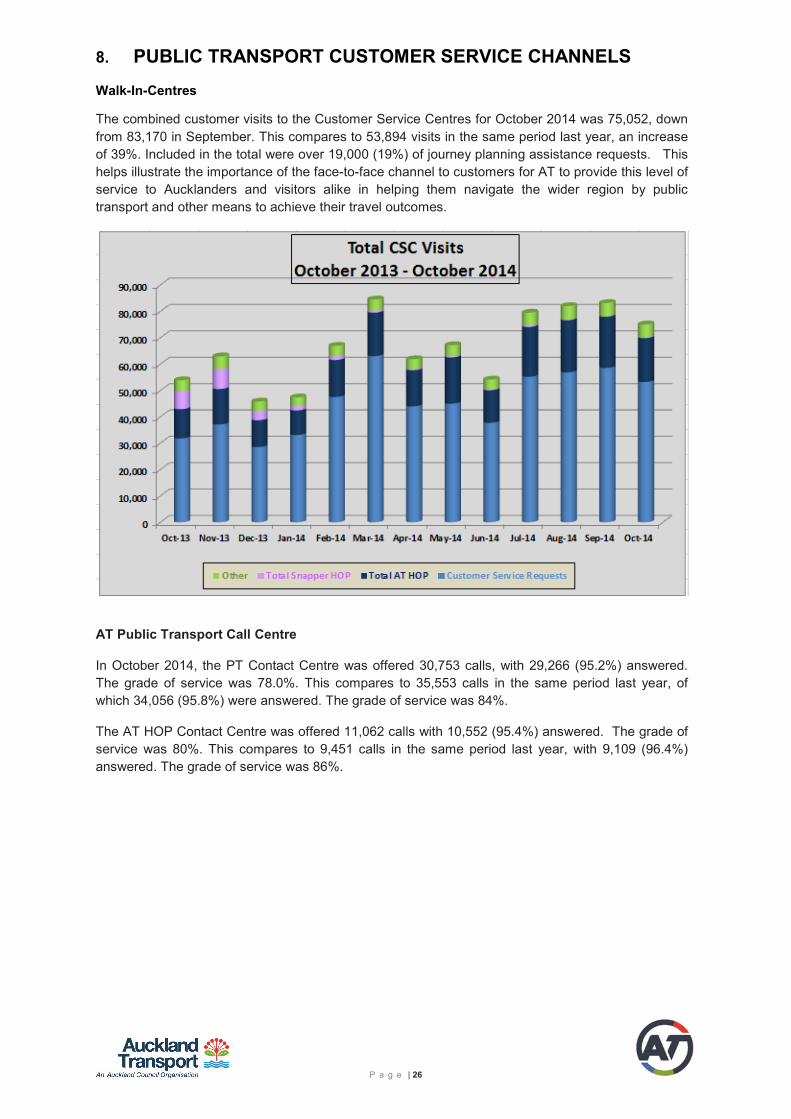
The combined customer visits to the Customer Service Centres for October 2014 was 75,052, down from 83,170 in September. This compares to 53,894 visits in the same period last year, an increase of 39%. Included in the total were over 19,000 (19%) of journey planning assistance requests. This helps illustrate the importance of the face-to-face channel to customers for AT to provide this level of service to Aucklanders and visitors alike in helping them navigate the wider region by public transport and other means to achieve their travel outcomes.
AT Public Transport Call Centre
In October 2014, the PT Contact Centre was offered 30,753 calls, with 29,266 (95.2%) answered. The grade of service was 78.0%. This compares to 35,553 calls in the same period last year, of which 34,056 (95.8%) were answered. The grade of service was 84%.
The AT HOP Contact Centre was offered 11,062 calls with 10,552 (95.4%) answered. The grade of service was 80%. This compares to 9,451 calls in the same period last year, with 9,109 (96.4%) answered. The grade of service was 86%.
P a g e | 27
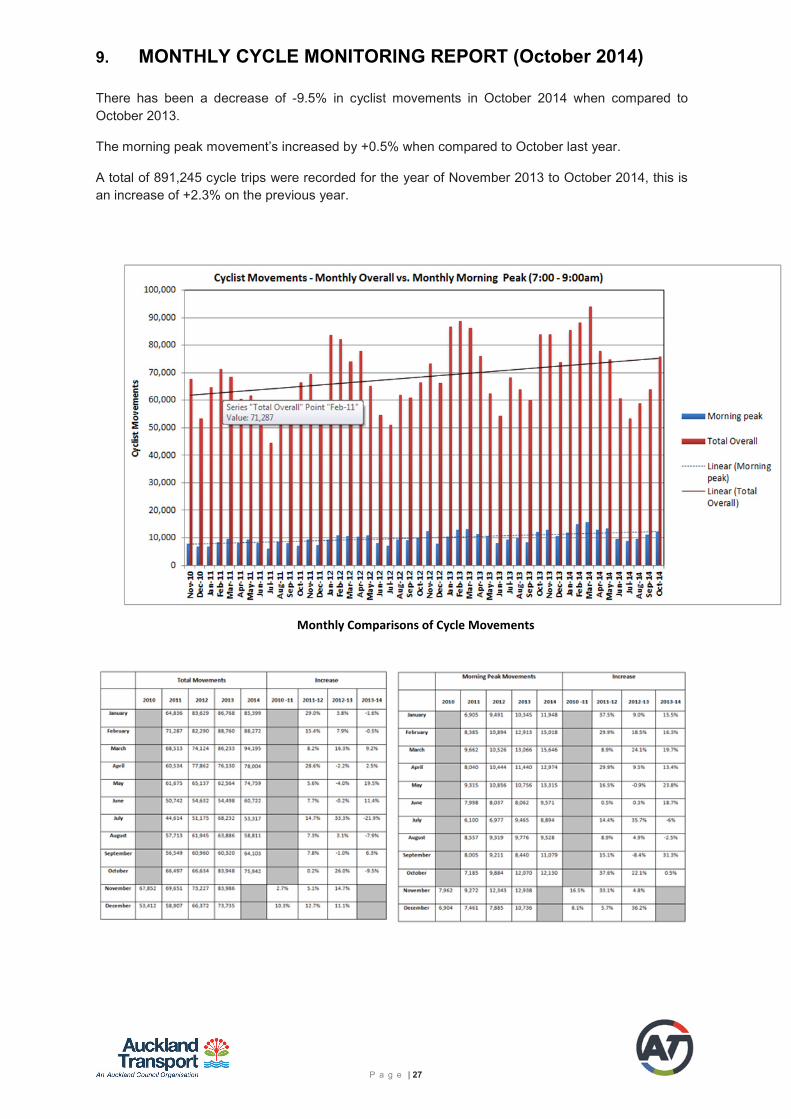
9. MONTHLY CYCLE MONITORING REPORT (October 2014) There has been a decrease of -9.5% in cyclist movements in October 2014 when compared to October 2013.
The morning peak movement’s increased by +0.5% when compared to October last year.
A total of 891,245 cycle trips were recorded for the year of November 2013 to October 2014, this is an increase of +2.3% on the previous year.
Monthly Comparisons of Cycle Movements