statistics on industrial disputes, closures, retrenchments and...
TRANSCRIPT
lR;eso t;rs
STATISTICS
ON
INDUSTRIAL DISPUTES,
CLOSURES, RETRENCHMENTS AND LAY-OFFS
IN INDIA
DURING THE YEAR, 2009
GOVERNMENT OF INDIA MINISTRY OF LABOUR & EMPLOYMENT
LABOUR BUREAU SHIMLA/CHANDIGARH
lR;eso t;rs
STATISTICS
ON
INDUSTRIAL DISPUTES,
CLOSURES, RETRENCHMENTS AND LAY-OFFS
IN INDIA
DURING THE YEAR, 2009
GOVERNMENT OF INDIA MINISTRY OF LABOUR & EMPLOYMENT
LABOUR BUREAU SHIMLA/CHANDIGARH

PREFACE
Statistics on work-stoppages, closures, retrenchments and lockouts play a crucial role in making policies for maintaining cordial and harmonious relations between the management and the workers and also meeting the demand for historical data and information on industrial conflicts and their causes by the planners, policy makers and decision makers in industry and government. With a view to meet the growing demand from these users, Labour Bureau has started compiling and publishing these statistics in its annual publication titled, ‘Industrial Disputes, Closures, Retrenchments and Lay-Offs in industries in India’. 2. The current edition of this publication presents statistics of Industrial Disputes resulting in temporary work-stoppages, permanent closures, retrenchments and lay-offs during the year 2009. Though every effort has been made by the Bureau to bring out this publication in time, there has been delay which is primarily due to delay in submission of primary returns by the State and Central Agencies. Labour Bureau is however committed to reduce the time lag with the active co-operation of these Agencies. 3. I express my sincere thanks to the State Governments as well as the Regional Labour Commissioners (Central) for their support and cooperation in furnishing the requisite data as without which it would have not been possible for us to bring out this publication. I also take this opportunity to thank a team of officers (Annexure I) for the efforts put in by them in bringing out this edition of the publication. 4. I earnestly solicit suggestions for improvements in the scope, content and presentation of the publication so as to make the same more useful to the users. .
D.S.KOLAMKAR Shimla DIRECTOR GENERAL November, 2012
ii
CONTENTS Page Summary of Main Findings
Vii
Introduction
1
CHAPTER-1 SIGNIFICANT TRENDS IN INDUSTRIAL DISPUTES AND THE RESULTANT MANDAYS LOST
5
CHAPTER-2 INDUSTRIAL DISPUTES IN THE PUBLIC AND PRIVATE SECTORS (COMBINED)
7
Analysis by Months 7 Analysis by States 7 Analysis by Industries 7 Analysis of Time-loss per 1,000 Workers 8 Analysis of Lockouts 8 Analysis of Major Industrial Disputes 8 Analysis by Causes 9 Analysis by Duration 9 Analysis by Methods of Settlements and Results 9 Analysis of All India Strikes / Lockouts
9
CHAPTER-3 INDUSTRIAL DISPUTES IN THE PUBLIC SECTOR
10
Analysis by Months 10 Analysis by States 10 Analysis by Industries 10 Analysis by Causes 10 Analysis by Duration
11
CHAPTER-4 POLITICAL / SYMPATHETIC STRIKES AND DISPUTES DUE TO REASONS OTHER THAN INDUSTRIAL DISPUTES
12
Analysis of Political and Sympathetic Strikes 12 Analysis of Disputes due to reasons other than industrial disputes
12
CHAPTER-5 CLOSURES
13
Analysis by States, Causes, Industry Groups, Sectors and Months 13 Analysis by States 13 Analysis by Causes 13 Analysis by Industry Groups 13 Analysis by Sectors 14 Analysis by Months
14
CHAPTER-6 RETRENCHMENTS
15
Analysis by States, Causes, Industry Groups, Sectors and months 15 Analysis by States 15 Analysis by Causes 15 Analysis by Industry Groups 15 Analysis by Sectors 16 Analysis by Months
16
iii
Page CHAPTER-7 LAY-OFFS 17 Analysis by States, Causes, Industry Groups, Sectors and Months 17 Analysis by States 17 Analysis by Causes 17 Analysis by Industry Groups 18 Analysis by Sectors 18 Analysis by Months 18
STATISTICAL TABLES
CHAPTER-1: Significant Trends in Industrial Disputes and the Resultant Mandays Lost
Table-1(i) Sector/Sphere-wise Number of Disputes, Workers Involved, Man-days Lost,
Wages Lost and Value of Production Loss due to Industrial Disputes during 2009 19
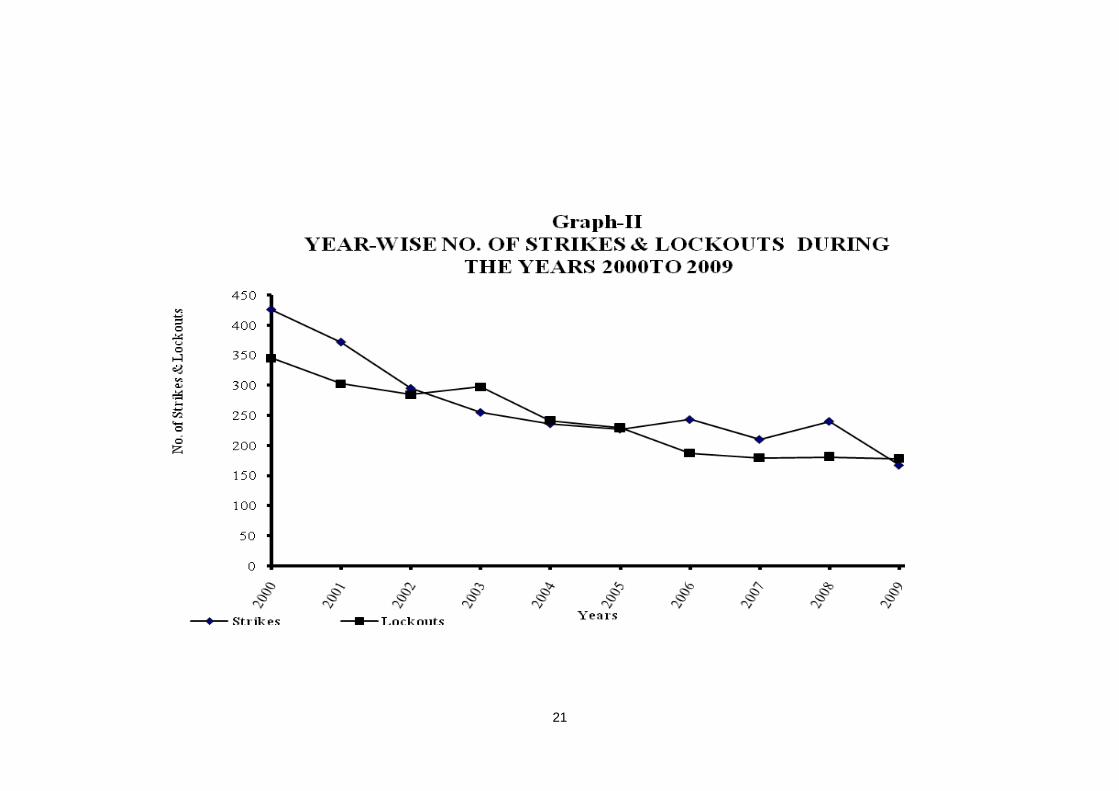
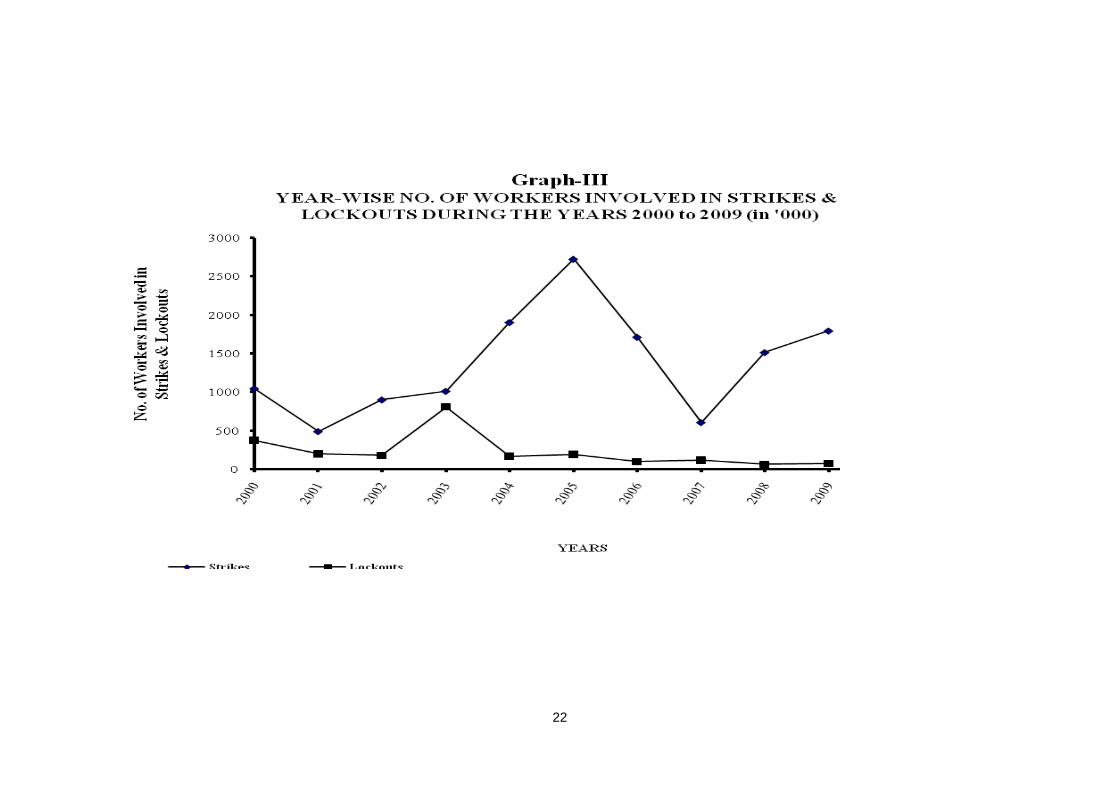
Graph-I Sector-wise Total Number of Disputes during 2008 and 2009 20 Graph-II Year-wise Number of Strikes & Lockouts during the years 2000 to 2009 21 Graph-III Year-wise Number of Workers Involved in Strikes & Lockouts during the Year
2000 to 2009 (in’000) 22
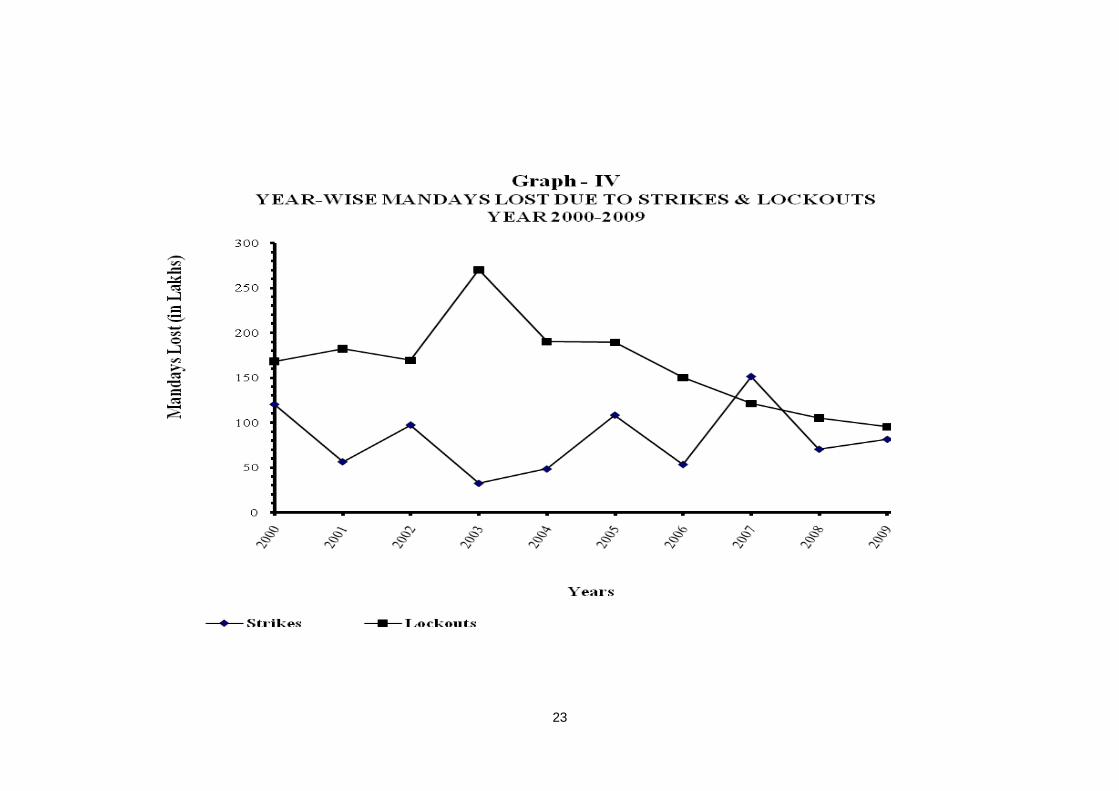
Graph- IV Year-wise Mandays Lost Due to Strikes and Lockouts during the years 2000 to 2009
23
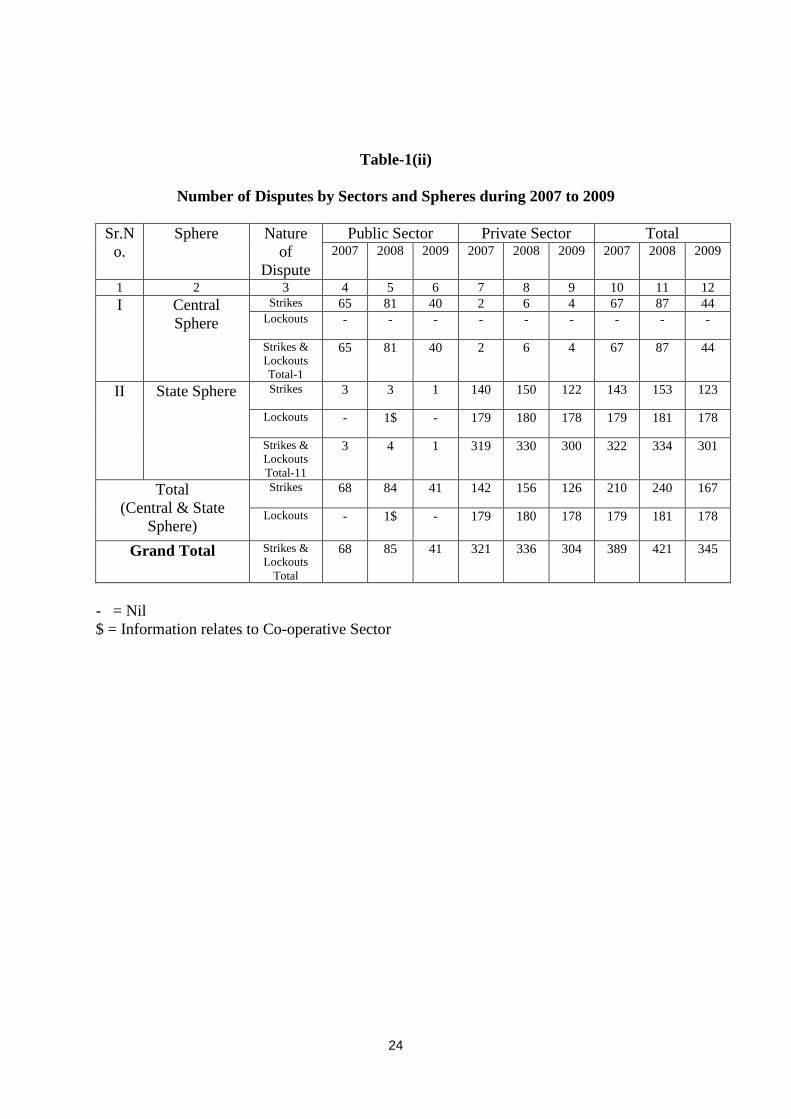
Table-1(ii) Number of disputes by Sectors and Spheres during 2007 to 2009 24 Table-1(iii) Time-loss (Number of Mandays Lost) by Sector / Sphere during 2007 to 2009 by
Strikes and Lockouts 25
Table-1(iv) Percentage of Mandays Lost due to Strikes and Lockouts by Sector/Sphere during 2007 to 2009
26
Table-1(v) Average Time Loss per Dispute, Workers Involved per Dispute and Average Number of Man-days Lost per Worker Due to Industrial Disputes during the years 2008 and 2009
26
CHAPTER-2: Industrial Disputes in the Public and Private Sectors - Combined
Table-2(i)(a) Industrial Disputes (All Strikes and Lockouts) during the year 2009 (By Months) 27 Table-2(i)(b) Industrial Disputes (Strikes and Lockouts) in the Central Sphere during the year
2009 (By Months) 28
Table-2(i)(c) Industrial Disputes (Strikes and Lockouts) in the State Sphere during the year 2009 (By Months)
29
Table-2(i)(d) All Strikes during the year 2009 (By Months) 30 Table-2(i)(e) Strikes in the Central Sphere during the year 2009 (By Months) 31 Table-2(i)(f) Strikes in the State Sphere during the year 2009 (By Months) 32 Table-2(i)(g) All Lockouts during the year 2009 (By Months) 33 Table-2(i)(h) Lockouts in the State Sphere during the year 2009 (By Months) 34 Table-2(ii)(a) Industrial Disputes (All Strikes and Lockouts) during the year 2009
(By States) 35
Graph-V State-wise Major contributing to Mandays Lost due to Work-stoppages during the years 2008 and 2009
36
Table-2(ii)(b) Industrial Disputes (Strikes and Lockouts) in Central Sphere during the year 2009 (By States)
37
Table-2(ii)(c) Industrial Disputes (Strikes and Lockouts) in the State Sphere during the year 2009 (By States)
38
Table-2(ii)(d) All Strikes during the year 2009 (By States) 39 Table-2(ii)(e) Strikes in the Central Sphere during the year 2009 (By States) 40 Table-2(ii)(f) Strikes in the State Sphere during the year 2009 (By States) 41 Table-2(ii)(g) All Lockouts during the year 2009 (By States) 42 Table-2(ii)(h) Lockouts in the State Sphere during the year 2009 (By States) 43
iv
Page Table-2(ii)(i) Time-loss (Central and State Spheres combined) due to Industrial Disputes during
the Year 2009 (By States and Months) 44
Graph-VI Time Loss (in lakhs) during the year 2009 (By Month) 45 Table-2(ii)(j) Time-loss (Central Sphere) due to Industrial Disputes during the year 2009
(By States and Months) 46
Table-2(ii)(k) Time-loss (State Sphere) due to Industrial Disputes during the year 2009 (By States and Months)
47
Table-2(iii)(a) All Industrial Disputes Classified by Industries during the year 2009. 48 Table-2(iii)(b) Strikes Classified by Industries during the year 2009 52 Table-2(iii)(c) Lockouts Classified by Industries during the year 2009
55
Table-2(iii)(d) Industrial Disputes in the Central Sphere Undertakings during the year 2009 (By Industry Groups)
58
Table-2(iv) Time-loss due to Industrial Disputes in different Sectors (per 1,000 Workers employed) during the years 2000 to 2009
59
Table-2(v)(a) Lockouts declared during the year 2009 (By States) 60 Table-2(v)(b) Number of Workers involved and Man-days Lost separately for the period of
Strikes and Lockouts in Industrial Disputes in which Lockouts were preceded / succeeded by Strikes during the Year 2009 (By States)
61
Table-2(vi) Details of major Industrial Disputes (i.e. Strikes and Lockouts) involving a Time-loss of 50,000 or more man-days during the year 2009
62
Table-2(vii)(a) Industrial Disputes Classified by Causes (State and Central Spheres) during the year 2009
64
Graph- VII Cause-wise Comparison of Mandays Lost Due to Strikes and Lockouts during the years 2008 and 2009
65
Table-2(vii)(b) Industrial Disputes Classified by Causes (Central Sphere) during the year 2009 66 Table-2(vii)(c) Industrial Disputes Classified by Causes (State Sphere) during the year 2009 66 Table-2(vii)(d) Lockouts Classified by Causes during the year 2009 67 Table-2(vii)(e) Strikes Classified by Causes in the State Sphere during the year 2009 68 Table-2(viii) Terminated Disputes by Duration during the year 2009 68 Table-2(ix) Terminated Disputes Classified by Method of Settlement and Result during the
year 2009 69
Table-2(x) All -India Strikes / Lockouts during the year 2009
69
CHAPTER-3: Industrial Disputes in the Public Sector
Table-3(i)(a) Industrial Disputes (All Strikes and Lockouts) in Public Sector (both in State and Central Sphere) during the year 2009 (By Months)
70
Table-3(i)(b) Industrial Disputes in Public Sector (Strikes and Lockouts) in the Central Sphere during the year 2009 (By Months)
71
Table-3(i)(c) Industrial Disputes in Public Sector (Strikes and Lockouts) in the State Sphere during the year 2009 (By Months)
72
Table-3(i)(d) All Strikes in Public Sector during the year 2009 (By Months) 73 Table-3(i)(e) Strikes in Public Sector in the Central Sphere during the year 2009 (By Months) 74 Table-3(i)(f) Strikes in the Public Sector in the State Sphere during the year 2009 (By Months) 75 Table-3(ii)(a) Industrial Disputes in the Public Sector (All Strikes and Lockouts) during the
year 2009 (By States) 76
Table-3(ii)(b) Industrial Disputes in the Public Sector (Central Sphere) during the year 2009 (By States)
77
Table-3(ii)(c) Industrial Disputes in the Public Sector (State Sphere) during the year 2009 (By States)
78
Table-3(ii)(d) Strikes in the Public Sector (Central and State Spheres) during the year 2009 (By States)
79
Table-3(ii)(e) Strikes in the Public Sector (Central Sphere) during the year 2009 (By States) 80 Table-3(ii)(f) Strikes in the Public Sector (State Sphere) during the year 2009 (By States) 81 Table-3(iii)(a) Industrial Disputes in the Public Sector Classified by Industries during the year
2009 82
v
Page Table-3(iii)(b) Strikes in Public Sector Classified by Industries during the year 2009 83 Table-3(iii)(c) Industrial Disputes in Public Sector Undertakings in the Central Sphere during the
year 2009 (By Industry Groups) 84
Table-3(iv) Industrial Disputes in Public Sector Classified by Causes during the year 2009 85 Table-3(v) Terminated Disputes in the Public Sector by duration during the year 2009 86
CHAPTER-4: Political / Sympathetic Strikes and Disputes due to reasons
Other than Disputes Table-4(i) Political / Sympathetic Strikes during the year 2009 (By Months and Spheres) 87 Table-4(ii) Political / Sympathetic Strikes during the year 2009 (By States and Spheres) 87 Table-4(iii) State-wise and Cause-wise Number of disputes due to reasons Other than
Industrial Disputes, Workers affected thereby and Mandays lost during the year 2009 (By States)
88
Table-4(iv) Industry-wise Number of disputes due to reasons other than Industrial Disputes, Workers affected thereby and Mandays lost during the year 2009
90
CHAPTER-5: Closures
Table-5(i) Number of Permanent Closures and Workers Affected therein during the
years, 2000 to 2009 92
Graph-VIII Number of Permanent Closures during the years 2000 to 2009 93 Graph-IX Number of Workers Affected due to Closures during the years 2000 to 2009 94 Table-5(i)(a) State and Cause-wise number of Permanent Closures and Workers affected during
the year, 2009 95
Graph-X State-wise number of workers affected due to Permanent Closures during the year, 2009
99
Table-5(i)(b) State and Industry-wise number of Permanent Closures and Workers affected during the year, 2009
100
Table-5(i)(c ) Industry and Cause-wise number of Permanent Closures and Workers affected during the year, 2009
102
Table-5(i)(d) State-wise number of Permanent Closures and workers Affected by Sectors and Spheres during the year, 2009
106
Table-5(i)(e) Cause-wise number of Permanent Closures and workers Affected by Sectors and Spheres during the year, 2009
107
Table-5(i)(f) Industry-wise number of Permanent Closures and workers Affected by Sectors and Spheres during the year, 2009
108
Table-5(i)(g) Month-wise number of Permanent Closures and workers Affected during the year, 2009
109
CHAPTER-6: Retrenchments
Table-6(i) Number of units effecting Retrenchment and workers Retrenched therein during the years 2000 to 2009 by Spheres
110
Graph-XI Number of units affecting Retrenchment during the years 2003 to 2009 111
Graph-XII Workers affected due to Retrenchment during the years 2003 to 2009 112
Table-6(i)(a) State and Cause-wise number of Cases of Retrenchments and workers Retrenched during the year, 2009
113
Graph-XIII State -wise Number of Workers Affected due to Retrenchments during the year 2009
114

vi
Page
Table-6(i)(b) State and Industry-wise number of Cases of Retrenchments and workers Retrenched during the year, 2009
115
Table-6(i)(c) Industry and Cause-wise number of Cases of Retrenchments and workers Retrenched during the year, 2009
117
Table-6(i)(d) State-wise number of Cases of Retrenchments and workers Retrenched by Sectors and Spheres during the year, 2009
118
Table-6(i)(e) Cause-wise number of Cases of Retrenchments and workers Retrenched by Sectors and Spheres during the year, 2009
119
Table-6(i)(f) Industry-wise number of Cases of Retrenchments and workers Retrenched by Sectors and Spheres during the year, 2009
120
Table-6(i)(g) Month-wise number of Cases of Retrenchments and workers Retrenched during the year, 2009
121
CHAPTER-7: Lay-Offs Table-7(i) Number of units effecting Lay-off, workers Laid-off and Mandays lost therein
during the years, 2000 to 2009 by Spheres 122
Graph-XIV Year-wise number of Mandays lost due to Lay-offs during the years, 2000 to 2009 123 Table-7(i)(a) State and Cause-wise number of Cases of Lay-off, workers Laid-off and Mandays
lost during the year, 2009 124
Graph-XV State-wise Mandays lost due to Lay-offs during the year, 2009 127 Table-7(i)(b) State and Industry-wise number of Cases of Lay-off, workers Laid-off and
Mandays lost during the year, 2009 128
Table-7(i)(c) Industry and Cause-wise number of Cases of Lay-off, workers Laid-off and Mandays lost during the year,2009
130
Table-7(i)(d) State-wise number of Cases of Lay-off, workers Laid-off and Mandays lost by Sectors and Spheres during the year, 2009
133
Tabale-7(i)(e) Cause-wise number of Cases of Lay-off, workers Laid-off and Mandays lost by Sectors and Spheres during the year, 2009
135
Table-7(i)(f) Industry-wise number of Cases of Lay-off, workers Laid-off and Mandays lost by Sectors and Spheres during the year, 2009
137
Table-7(i)(g) Month-wise number of Cases of Lay-off, workers Laid-off and Mandays lost in State and Central Spheres during the year, 2009
139
Graph-XVI Month-wise number of Mandays lost due to Lay-offs during the year, 2009 140
ANNEXURES
Annexure-I National Industrial Classification - 2004 141 Annexure-II Proforma for submission of voluntary returns under Industrial Disputes Act, 1947
by States to Labour Bureau by 25th of the succeeding month 151
Annexure-III Proforma for submission of returns on Closures, Retrenchment and Lay-off by States to Labour Bureau
156
Annexure-IV Position of non-receipt of monthly voluntary returns during the year 2009 159
Annexure-V List of Officers and Officials of Labour Bureau Shimla associated with the Publication
160
vii
Summary of Main Findings
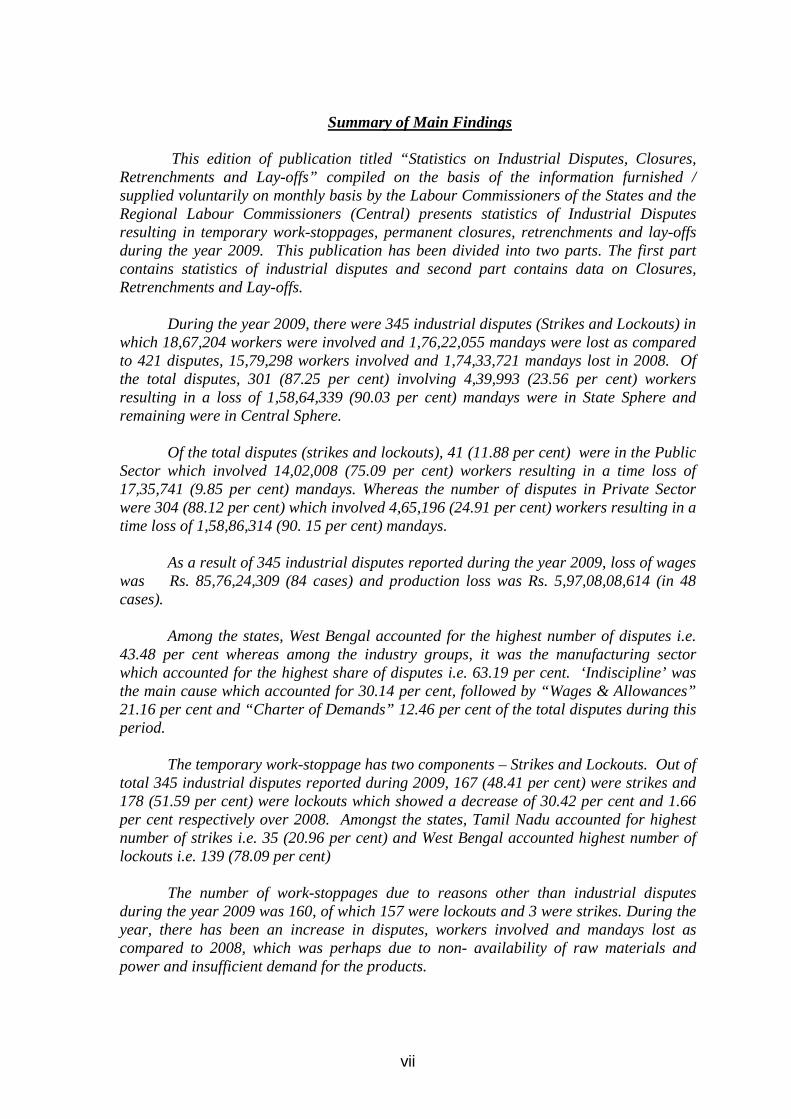
This edition of publication titled “Statistics on Industrial Disputes, Closures, Retrenchments and Lay-offs” compiled on the basis of the information furnished / supplied voluntarily on monthly basis by the Labour Commissioners of the States and the Regional Labour Commissioners (Central) presents statistics of Industrial Disputes resulting in temporary work-stoppages, permanent closures, retrenchments and lay-offs during the year 2009. This publication has been divided into two parts. The first part contains statistics of industrial disputes and second part contains data on Closures, Retrenchments and Lay-offs.
During the year 2009, there were 345 industrial disputes (Strikes and Lockouts) in
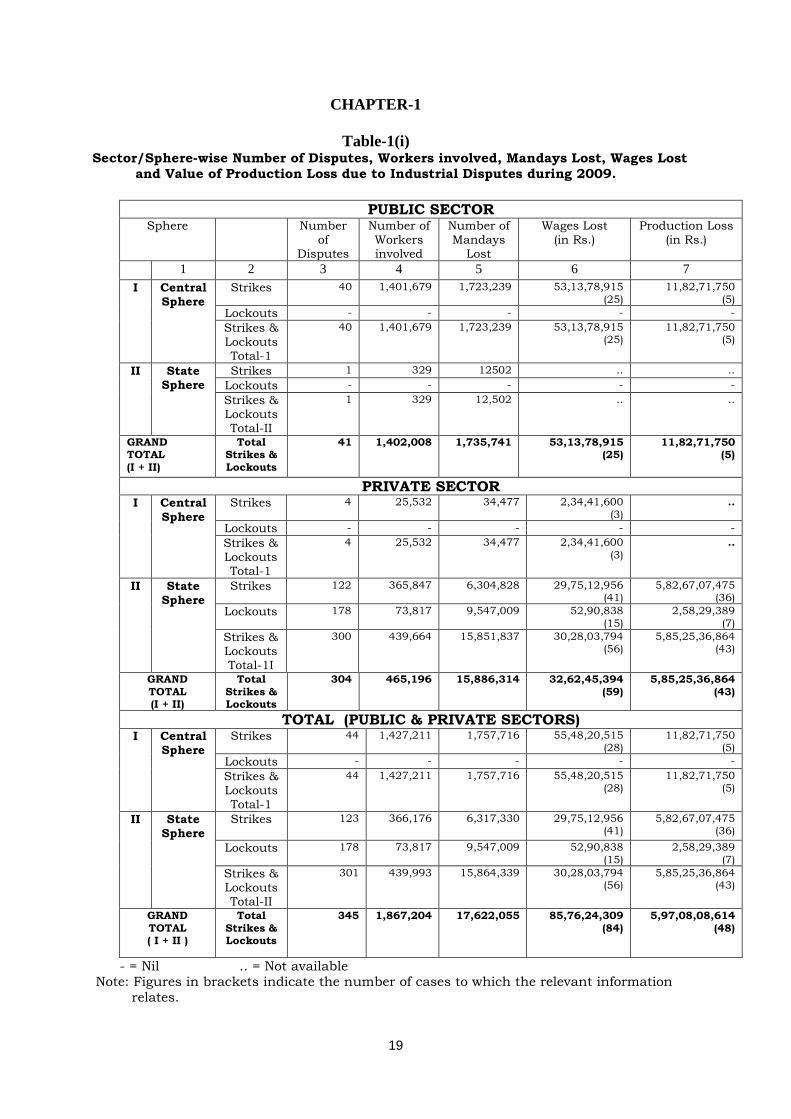
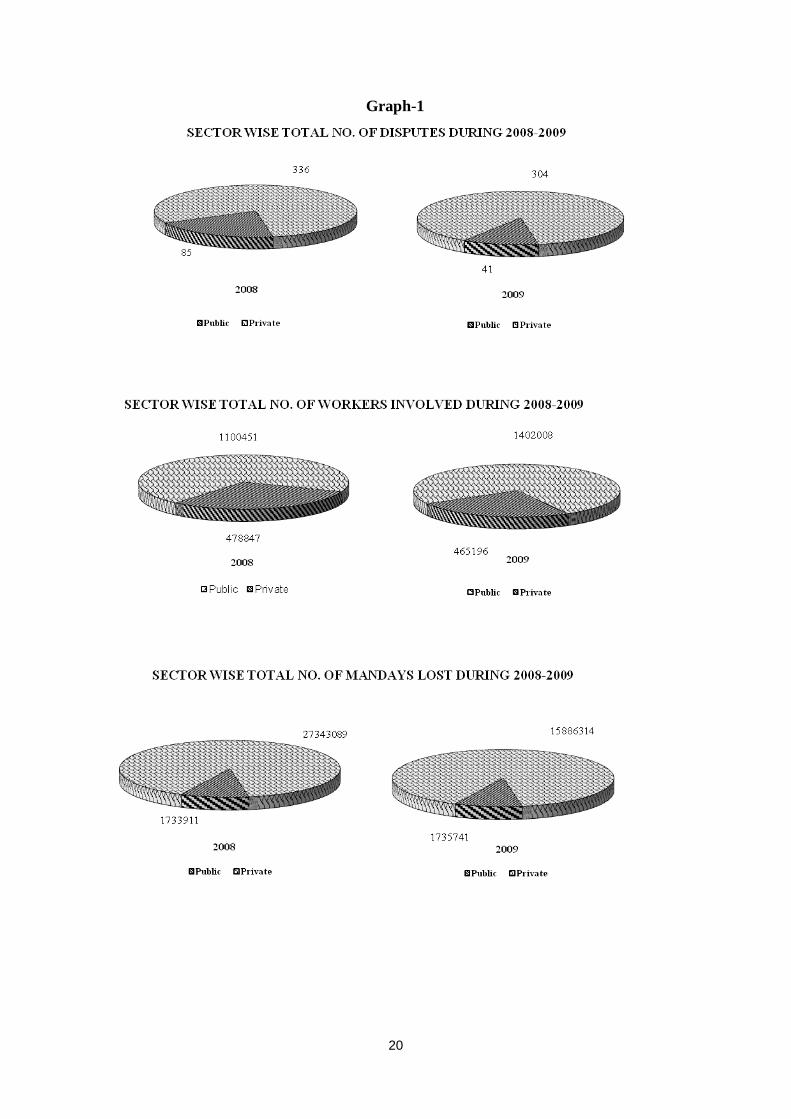
which 18,67,204 workers were involved and 1,76,22,055 mandays were lost as compared to 421 disputes, 15,79,298 workers involved and 1,74,33,721 mandays lost in 2008. Of the total disputes, 301 (87.25 per cent) involving 4,39,993 (23.56 per cent) workers resulting in a loss of 1,58,64,339 (90.03 per cent) mandays were in State Sphere and remaining were in Central Sphere.
Of the total disputes (strikes and lockouts), 41 (11.88 per cent) were in the Public
Sector which involved 14,02,008 (75.09 per cent) workers resulting in a time loss of 17,35,741 (9.85 per cent) mandays. Whereas the number of disputes in Private Sector were 304 (88.12 per cent) which involved 4,65,196 (24.91 per cent) workers resulting in a time loss of 1,58,86,314 (90. 15 per cent) mandays.
As a result of 345 industrial disputes reported during the year 2009, loss of wages
was Rs. 85,76,24,309 (84 cases) and production loss was Rs. 5,97,08,08,614 (in 48 cases).
Among the states, West Bengal accounted for the highest number of disputes i.e.
43.48 per cent whereas among the industry groups, it was the manufacturing sector which accounted for the highest share of disputes i.e. 63.19 per cent. ‘Indiscipline’ was the main cause which accounted for 30.14 per cent, followed by “Wages & Allowances” 21.16 per cent and “Charter of Demands” 12.46 per cent of the total disputes during this period.
The temporary work-stoppage has two components – Strikes and Lockouts. Out of
total 345 industrial disputes reported during 2009, 167 (48.41 per cent) were strikes and 178 (51.59 per cent) were lockouts which showed a decrease of 30.42 per cent and 1.66 per cent respectively over 2008. Amongst the states, Tamil Nadu accounted for highest number of strikes i.e. 35 (20.96 per cent) and West Bengal accounted highest number of lockouts i.e. 139 (78.09 per cent)
The number of work-stoppages due to reasons other than industrial disputes
during the year 2009 was 160, of which 157 were lockouts and 3 were strikes. During the year, there has been an increase in disputes, workers involved and mandays lost as compared to 2008, which was perhaps due to non- availability of raw materials and power and insufficient demand for the products.
viii
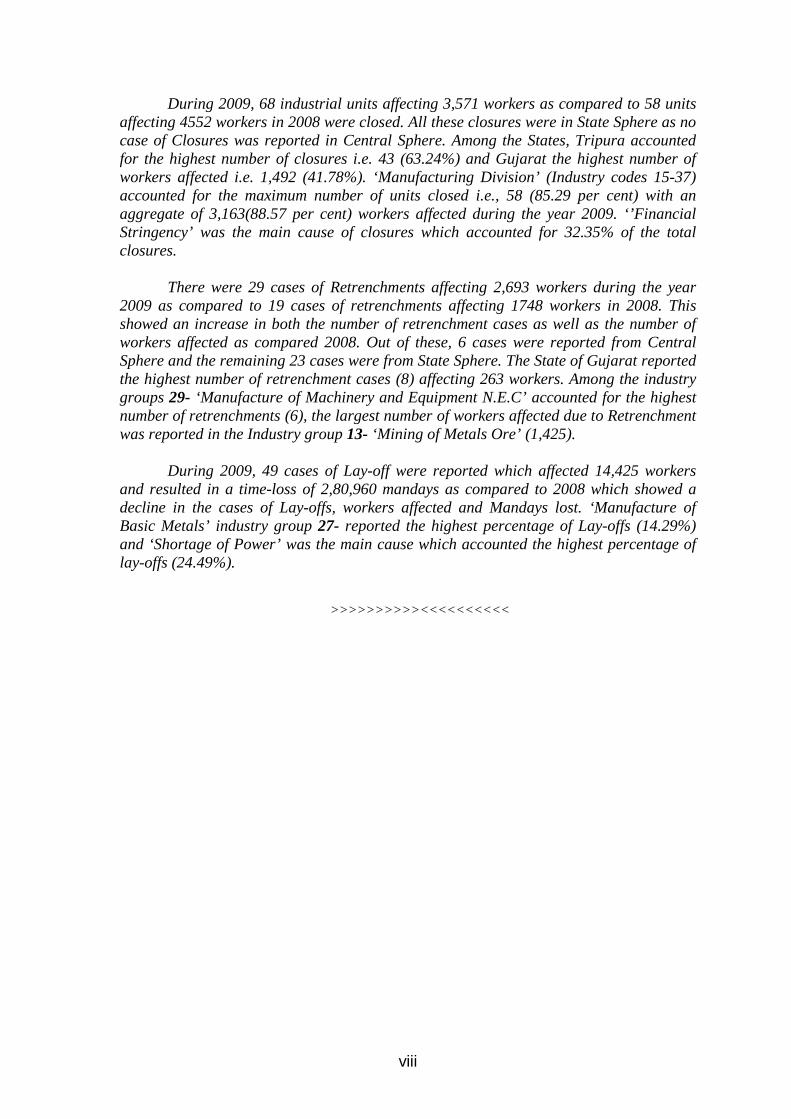
During 2009, 68 industrial units affecting 3,571 workers as compared to 58 units affecting 4552 workers in 2008 were closed. All these closures were in State Sphere as no case of Closures was reported in Central Sphere. Among the States, Tripura accounted for the highest number of closures i.e. 43 (63.24%) and Gujarat the highest number of workers affected i.e. 1,492 (41.78%). ‘Manufacturing Division’ (Industry codes 15-37) accounted for the maximum number of units closed i.e., 58 (85.29 per cent) with an aggregate of 3,163(88.57 per cent) workers affected during the year 2009. ‘’Financial Stringency’ was the main cause of closures which accounted for 32.35% of the total closures.
There were 29 cases of Retrenchments affecting 2,693 workers during the year
2009 as compared to 19 cases of retrenchments affecting 1748 workers in 2008. This showed an increase in both the number of retrenchment cases as well as the number of workers affected as compared 2008. Out of these, 6 cases were reported from Central Sphere and the remaining 23 cases were from State Sphere. The State of Gujarat reported the highest number of retrenchment cases (8) affecting 263 workers. Among the industry groups 29- ‘Manufacture of Machinery and Equipment N.E.C’ accounted for the highest number of retrenchments (6), the largest number of workers affected due to Retrenchment was reported in the Industry group 13- ‘Mining of Metals Ore’ (1,425).
During 2009, 49 cases of Lay-off were reported which affected 14,425 workers
and resulted in a time-loss of 2,80,960 mandays as compared to 2008 which showed a decline in the cases of Lay-offs, workers affected and Mandays lost. ‘Manufacture of Basic Metals’ industry group 27- reported the highest percentage of Lay-offs (14.29%) and ‘Shortage of Power’ was the main cause which accounted the highest percentage of lay-offs (24.49%).
>>>>>>>>>><<<<<<<<<<
1
INTRODUCTION
Labour Bureau has been bringing out Statistics on “Industrial Disputes, Closures, Retrenchments and Lay-offs in India” based on the voluntary returns received every month from the Labour Departments of the States and Union Territories and the Regional Labour Commissioners (Central). The present edition, which has two parts, is for year 2009. The first part deals with industrial disputes which include strikes and lockouts whereas second part deals with Closures, Retrenchments and Lay-offs. The industrial disputes, which resulted in temporary stoppage of work either by the employees of an establishment to express a grievance or to enforce a demand known as ‘strikes’or by an employer (or a group of employers) who withhold work from the employees in an establishment known as ‘Lockout’, in connection with matters relating to employment or non-employment or terms and conditions of employment take place as and when there is lack of mutual understanding, difference of opinion and failure to settle the disputes between the managements and the workers / labour trade unions. As the managements and workers both strive to rationalize their gains and losses in economic activities the conflicts are bound to occur.
The Departments of Labour in the States/Union Territories and Regional Labour Commissioners (Central) are responsible for collecting the basic information in respect of the work stoppages from the affected Primary Units in the State and Central Spheres respectively whenever such occurrence of a work-stoppage becomes known either directly or from the supplementary sources like police records etc. as per the practice in vogue in different States / areas. They collect the required information in standard formats laid down for the purpose from the units under their on a voluntary basis and furnished the same in consolidated monthly returns to the Labour Bureau on or before 25th of the each succeeding month. The statistics on industrial disputes brought out by the Labour Bureau includes information in respect of those temporary work-stoppages only which include (a) strikes, (b) lockouts, and (c) gheraos followed by lockouts and involving 10 or more workers, whether directly and/or indirectly as work-stoppages which involve less than 10 workers are not included / accounted for. Similarly, political strikes, sympathetic demonstrations etc., are also not included, as they are not connected with any specific dispute, grievance or demand of the workers and are beyond the competence of their employers to redress. The data for such work- stoppages is presented separately in Chapter-4 of the publication.
This publication contains various important components of the statistics on Industrial
Disputes such as the maximum number of workers affected directly or indirectly on any day during the entire period of the work-stoppage; the number of mandays lost which are calculated by adding up the actual resultant absences caused directly or indirectly by the work stoppages, in each shift of the potential working day (excluding weekly off and other scheduled holidays when the establishments would have otherwise remained closed even if no work stoppages had taken place); the number of disputes; duration of disputes; wages lost; and the value of production loss. The statistics relating to the number of disputes, workers involved and duration are independent variables whereas the statistics of mandays lost, wages lost and the value of production loss are mainly dependent on them.
The statistics on industrial disputes have been presented in four chapters. ‘Chapter-1’ presents a brief comparison of the industrial disputes and the resultant man-days lost which
2
occurred in the country during the years 2008 and 2009. ‘Chapter-2’ presents a detailed analysis of the work stoppages during the year 2009, by months, by states/union territories and by industries etc. for the public and private sectors taken together. In addition to this, all India Strikes / Lockouts have also been presented. ‘Chapter-3’ contains the information on the work-stoppages during the year 2009 in the Public Sector alone. ‘Chapter-4’ deals with the statistics relating to Political / Sympathetic Strikes and disputes due to reasons other than industrial disputes.
The data on Closures, Retrenchments and Lay-offs have been presented in three chapters. ‘Chapter-5’ contains data on Closures of industrial establishments, sphere, sector, state, cause and year-wise. A closure (permanent closure) of an industrial establishment may be due to industrial dispute and / or reasons other than industrial disputes like financial stringency, lack of demand for the products, shortage of raw materials etc. Chapter-6 presents data on Retrenchments of workers in industrial establishments by years, spheres, sectors, states and cause-wise. Chapter-7 contains data on Lay-Offs of workers during 2009.
The glossary of terms and concepts used in this edition as defined in the Industrial
Disputes Act, 1947 are given below
• WORK STOPPAGE:
Work stoppage means a temporary stoppage of normal activity in an industrial unit as a result of which the workers employed in the unit are forced to remain away from their usual duties. Such a work stoppage may be either due to industrial dispute or for reasons other than industrial disputes, viz. financial stringency, strategic considerations, breakdown of machinery, natural calamities, accumulation of stock, lack of demand, shortage of raw materials, or failure of power, legal disputes. Thus, the work stoppages are generally known as strikes and lockouts.
• INDUSTRY:
Section 2(j) of the Industrial Disputes Act, 1947 defines industry as any business, trade, undertaking, manufacture or calling of employers and includes any calling, service, employment, handicraft, or industrial occupation or avocation of workmen.
• INDUSTRIAL DISPUTE:
The Act defines the industrial dispute as a dispute between: i) a) employers and employers; b) employers and workmen; c) workmen and workmen; ii) The dispute or difference should be connected with the (a) employment or non- employment, or (b) terms of employment or conditions of labour of any workmen; iii) The dispute may be in relation to any workman or workmen or any other person in whom they are interested as a body.
3
• STRIKE:
The section 2(q) of the Act defines the term ‘strike’ as cessation of work by a body of persons employed in any industry acting in combination, or a concerted refusal, or a refusal, under a common understanding of any number of persons who are or have been so employed to continue to work or to accept employment.
• LOCKOUT:
‘Lockout’ as defined in Section 2(l) means the temporary closing of a place of employment, or the suspension of work, or the refusal by an employer to continue to employ any number of persons employed by him.
• WORKER:
Section 2(s) of the Act defines “workman” as any person (including an apprentice) employed in any industry to do any manual unskilled , skilled, technical, operational, clerical or supervisory work for hire or reward, whether the terms of employment be express or implied, and for the purposes of any proceedings under this Act in relation to an industrial dispute, includes any such person who has been dismissed, discharged or retrenched in connection with, or as a consequence of, that dispute, or whose dismissal / discharge or retrenchment has led to that dispute.
• EMPLOYER
As per section 2(g) of the Act the ‘employer’ means (i) in relation to any industry carried on by or under the authority of any department of the Central Government or a State Government, the authority prescribed in this behalf, or where no authority is prescribed the head of the department; (ii) in relation to an industry carried on by or on behalf of a local authority, the chief executive officer of that authority.
• GHERAO:
In addition to strikes and lockouts, another form of industrial dispute that has gained eminence lately is “Gherao” which means physical blockade, partial or complete, of a target either by encirclement intended to block the regress and ingress from and to a particular office, workshop, factory or even residence or forcible occupation of such premises. The target may be a place or a person or persons, usually the managerial or supervisory staff of an industrial establishment.
• CLOSURE:
Closure under section 2(cc) of the Industrial Disputes Act, 1947 means the permanent closing down of a place of employment or part thereof.
• RETRENCHMENT:
Under section 2(oo) of the Act “retrenchment” means the termination by the employer of the service of a workman for any reason whatsoever, otherwise than as a punishment by way of disciplinary action, but does not include – (a) Voluntary retirement of a workman; or
4
(b) retirement of the workman on reaching the age of superannuation if the contract of employment between the employer and the workman concerned contains a stipulation in that behalf; or (c) termination of the service of a workman on the ground of continued ill-health.
• LAY-OFF:
As per section 2(kkk) of the Act ‘Lay-offs” means the failure, refusal or inability of an employer on account of shortage of coal, power or raw materials or the accumulation of stocks or the breakdown of machinery or natural calamity or for any other connected reason to give employment to a workman whose name is borne on the muster rolls of his industrial establishment and who has not been retrenched.
• SPHERE:
The sphere refers to the jurisdiction of the State or Central Agencies to execute the provision of the Act, act as arbitrators for settlement of disputes between the workers and the employers, enforce the settlement of disputes in their jurisdiction and report the occurrence of such disputes.
• POLITICAL/SYMPETHETIC STRIKES:
The strikes resorted to by workers of an industrial establishments not because of any disputes connected with industrial disputes, grievance, or demand of the workers and are beyond the competence of the employer to redress. Generally such strikes are resorted to for some political cause or in sympathy of workers of other industrial establishments as solidarity.
• LIMITATIONS:
This publication is based on the monthly returns submitted by the concerned authorities and includes all supplementary information received in the Bureau. Though the Labour Bureau tries its best to include information from all the concerned agencies, at times, it may not be possible to include every information in the publication either due to inconsistencies in the data or non submission of return by concerned agencies. Labour Bureau endeavours to elicit the desired information and also to get the clarifications corrected through electronic communication system and also through regular correspondences and visits etc. The concerned authorities are however not that reactive to furnish the information well in time. Since the Bureau has to compile and disseminate the statistics within a reasonable period of time, it finalizes the same on the basis of the available data without waiting for pending returns / clarifications. The Labour Bureau is, however, committed to bridge the gap in data by making every possible effort.
5
Chapter-1
‘SIGNIFICANT TRENDS IN INDUSTRIAL DISPUTES AND THE RESULTANT MANDAYS LOST DURING THE YEAR 2009’
1.1 Industrial Disputes in the Central and State Spheres on All-India Basis: During the year 2009, there were 345 industrial disputes (Strikes and Lockouts) in which 18,67,204 workers were involved and 1,76,22,055 mandays were lost. Of the total disputes, 301 (87.25 per cent) involving 4,39,993 (23.56 per cent) workers and 1,58,64,339 (90.03 per cent) mandays lost were in state sphere.
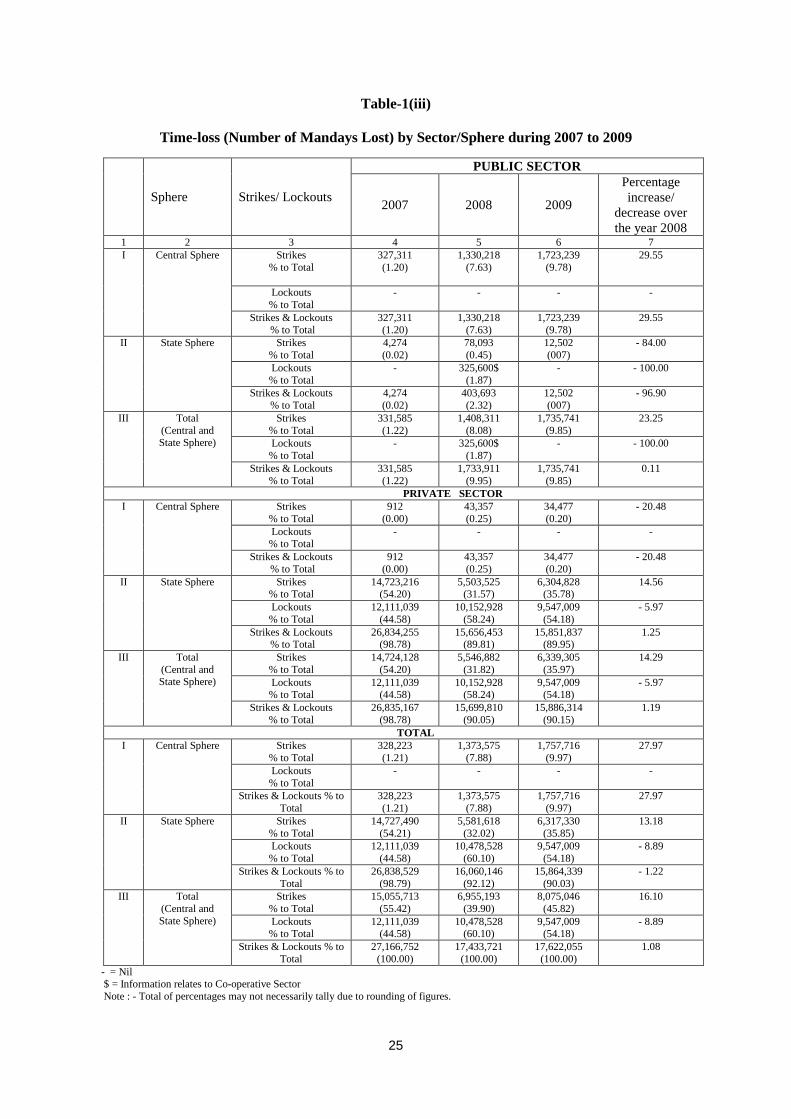
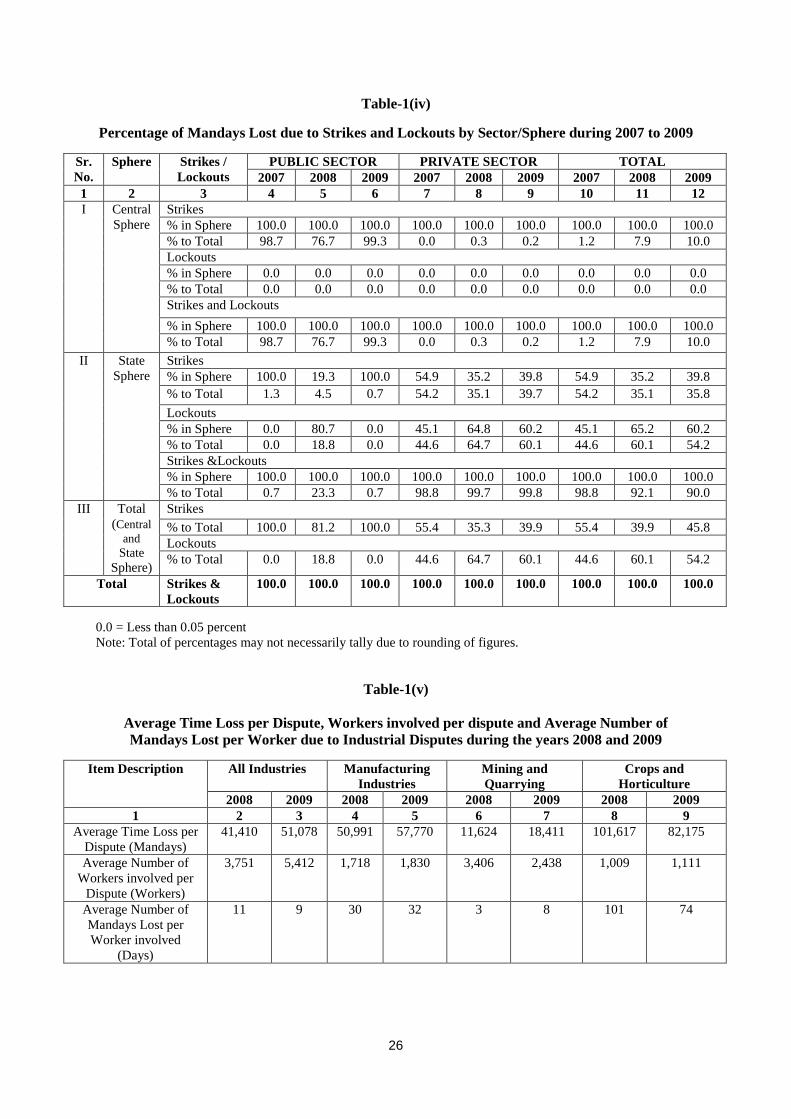
1.2 Industrial Disputes in the Public and Private Sectors of both Central and State Spheres: Of the total disputes (Strikes and Lockouts), 41 (11.88 per cent), involving 14,02,008 (75.09 per cent) workers and time loss of 17,35,741 (9.85 per cent) mandays, were in the Public Sector. Whereas the number of disputes in Private Sector were 304 (88.12 per cent) which involved 4,65,196 (24.91 per cent) workers and time loss of 1,58,86,314 (90.15 per cent) mandays. 1.3 Industrial Disputes in 2009 vis-à-vis 2007 and 2008: Table-1(ii) shows the number of strikes and lockouts during 2007 to 2009 in different sectors and spheres. The total numbers of disputes reported during the year 2009 were 345 which showed a decrease of 18.05 and 11.31 per cent as compared to the years 2008 and 2007 respectively. The total numbers of strikes reported during 2009 were 167 (41 in public sector and 126 in private sectors) which showed a decrease of 30.42 per cent as compared to the previous year. Similarly, the number of lockouts reported during the year were178 which showed an increase of about 1.11 per cent (2). All the (178) lockouts belong to Private Sector only. 1.4 Time-loss due to Industrial Disputes in 2008 and 2009: During the year 2009 as compared to 2008, the total time-loss (Central and State Sphere) due to Strikes and lockouts in Public and Private Sector combined registered an increase of 1.08 per cent (188,334). However, at disaggregated level, it increased by 16.10 per cent (11,19,853) in case of strikes and decreased by 8.89 per cent (9,31,519) in case of lockouts. While in Central Sphere, the time-loss due to Strikes and Lockouts in Public and Private Sector combined registered an increase of 27.97 per cent (3,84,141 man-days), it registered a decline of 1.22 percent (1,95,807 man-days) in State Sphere. However, at disaggregated level, in State Sphere, it experienced an increase of 13.18 per cent in case of strikes and decline of 8.89 per cent in case of lockouts. Average time-loss per dispute increased from 41,410 mandays in 2008 to 51,078 mandays in 2009. While in case of strikes it increased considerably from 28,980 to 48,354 mandays, it decreased to 53,635 mandays from 57,892 in case of Lockouts during the same period {Ref. Tables 1(ii) and 1(iii)}. 1.4.1 The percentage of mandays lost due to strikes and lockouts by sector / sphere during 2007 to 2009 are presented in Tables 1(iii) and 1(iv). It can be seen from these tables that while in Central Sphere time-loss in public sector due to strikes has increased by 29.55 per cent, in State Sphere, it decreased by 84.00 per cent (i.e. 65,591 man-days). So far as the private sector is concerned, the time-loss due to Strikes in Central Sphere has decreased by 20.48 per cent (8,880), it, however, increased by 14.56 per cent (8,01,303 man-days) in State Sphere as compared to 2008. The Time-loss due to Lockouts under Private sector in State Sphere has declined by 5.97 per cent (6,05,919 man-days) over the year 2008. Table 1(iv) shows percentage time-loss by sectors and spheres due to strikes and lockouts for the years 2007 to 2009.
6
1.4.2 Table 1(v) reveals average time-loss and average number of workers involved per dispute as well as average time-loss per worker in important economic activities on account of Industrial disputes during the year 2009. Average time-loss per dispute is highest in “Crops and Horticulture” (i.e. 82,175) and average number of workers involved per dispute is highest in “Mining & Quarrying” (i.e. 2,438). Average time-loss per dispute is lowest in the “Mining & Quarrying” (i.e. 18,411) and average number of workers involved per dispute is lowest in the “Crops and Horticulture” (i.e. 1,111). The time-loss per worker involved is recorded highest in “Crops and Horticulture” (i.e. 74 days) and lowest in “Mining and Quarrying” (i.e. 8 days).
7
Chapter-2
INDUSTRIAL DISPUTES IN THE PUBLIC AND PRIVATE SECTORS (COMBINED)
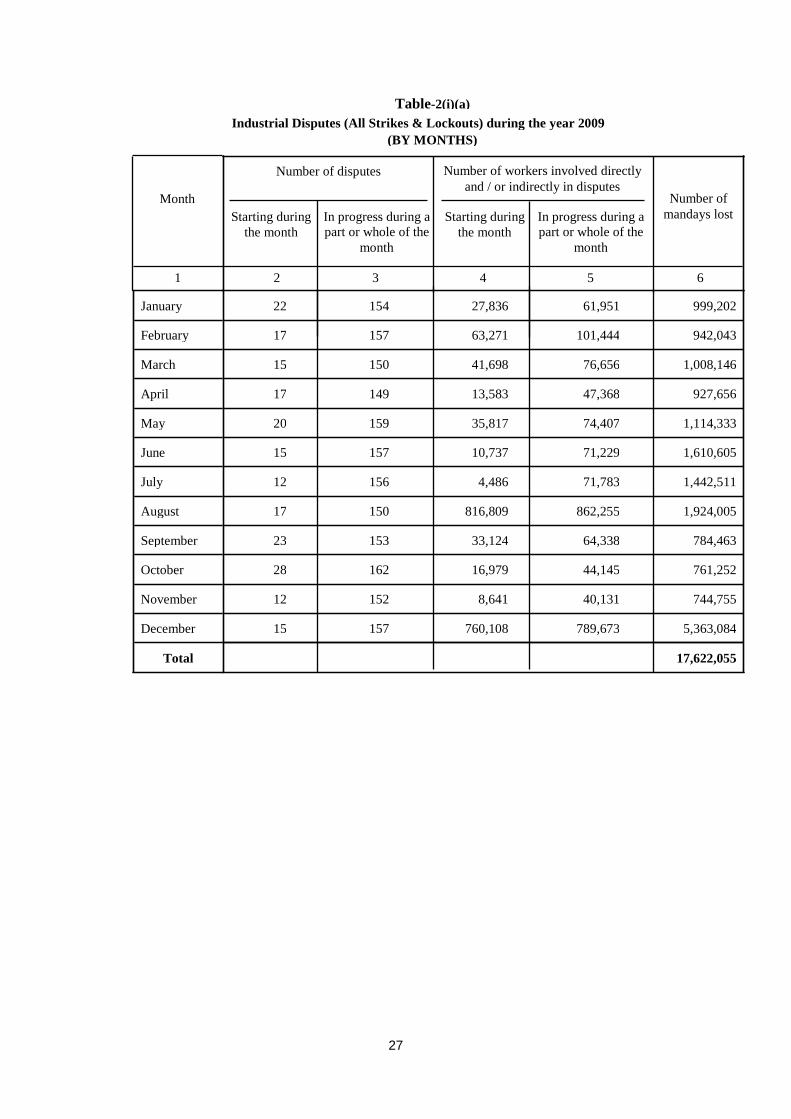
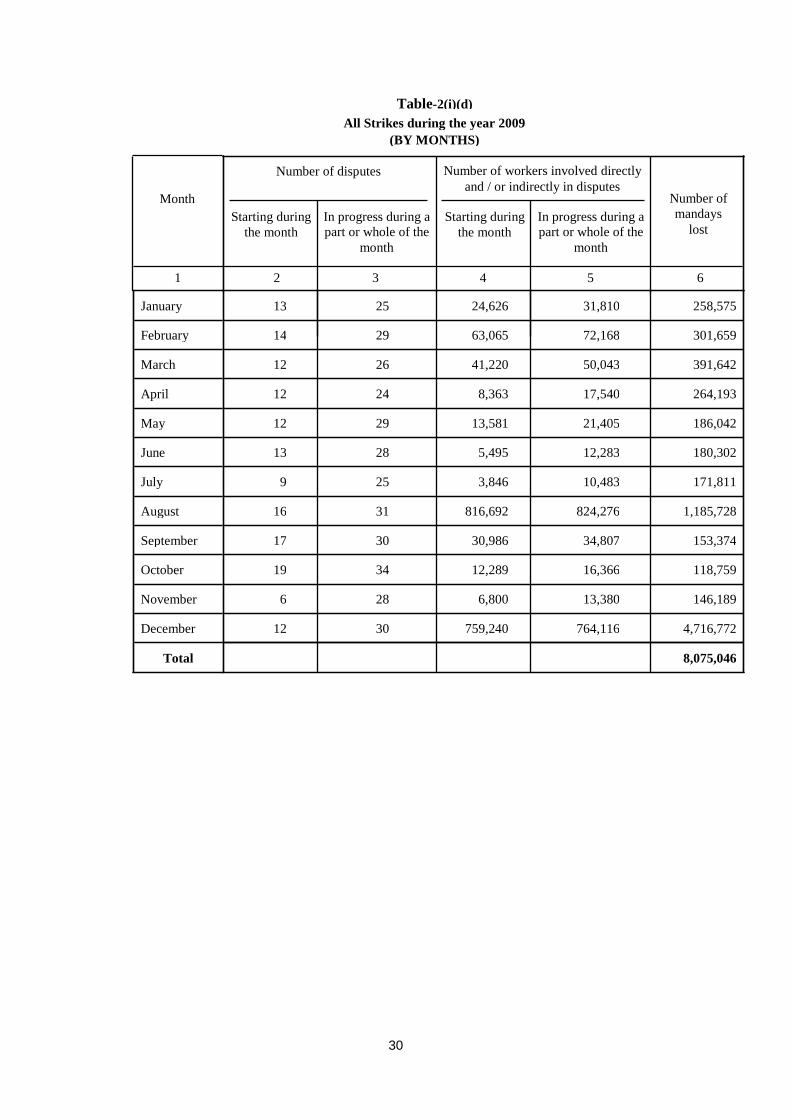
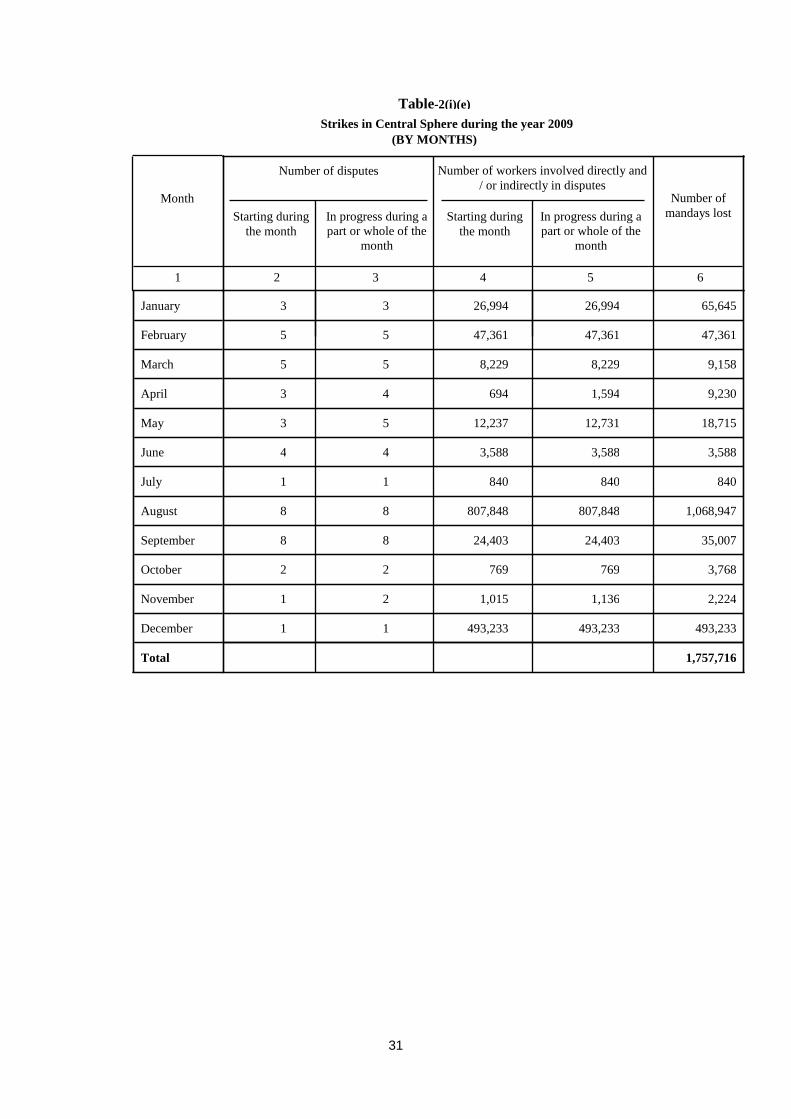
2.1 Analysis by Months: Month-wise statistics of industrial disputes, workers involved therein and mandays lost thereby during the year 2009 have been presented in Tables 2(i)(a) to 2(i)(h).
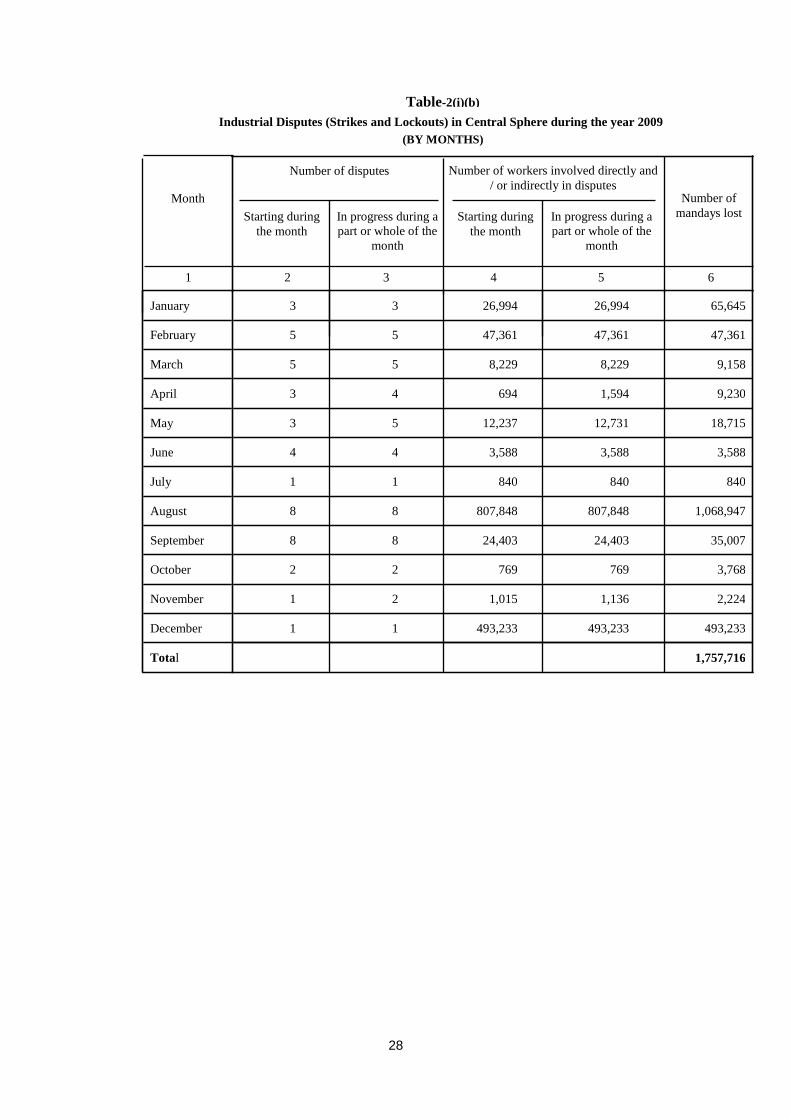
2.1.1 This is evident from Table 2(i)(a) that during the year 2009, the highest number of disputes (All Strikes and Lockouts) started during the month of October (28) and the lowest number of disputes started in the months of July and November (12) each. Table 2(i)(b) shows that the highest number of disputes in Central Sphere started in the months of August and September (8) and the lowest number of disputes (1 each) started in the months of July, November and December. On the other hand, Table 2(i)(c) reveals that the highest number of disputes in State Sphere started in the month of October (26) and the lowest (9) in the month of August. Table 2(i)(d) shows that the maximum number of strikes, under both the spheres, started in the month of October (19) and lowest (6) in November. Table 2(i)(g) reveals that the maximum number of Lockouts started in the months of January and October (9 each) and the lowest (1) in August. 2.2 Analysis by States: The statistics of Industrial Disputes by States and Union Territories during the year 2009 are presented in Tables 2(ii)(a) to 2(ii)(h).
2.2.1 Table 2(ii)(a) indicates that amongst the States, West Bengal, accounted for the highest time-loss (1,33,76,275 mandays) during 2009 followed by Andhra Pradesh (13,25,094 mandays), Maharashtra (9,86,700 mandays), Tamil Nadu (5,14,065 mandays), Rajasthan (3,72,652 mandays) and Kerala (3,68,266 mandays). These Six States together accounted for as much as 275 (79.71 per cent) of the total number of disputes, 16,72,204 (89.56 per cent) of the total number of workers involved and 1,69,43,052 (96.15 per cent) of the total time-loss during the year 2009.
2.2.2 The statistics on Industrial Disputes during the year 2009 in Central Sphere by States are presented in Table 2(ii)(b). The highest number of disputes (12), was recorded in Kerala whereas, Workers involved and mandays lost were highest in Maharashtra as 9,73,991 workers and 9,86,700 mandays respectively. The Central Sphere accounted for 12.75 per cent of the total number of disputes, 76.44 per cent of the total number of workers involved and 9.97 per cent of the total time-loss in the country. There was no case of lockout reported in Central Sphere during the year 2009.
2.2.3 State-wise and month-wise data (State and Central Spheres combined and also separately) on time-loss during the year 2009 are presented in Table 2(ii)(i) to 2(ii)(k). It reveals that the highest time-loss (in Mandays) was recorded in the month of December (53,63,084) followed by August (19,24,005) and the lowest was recorded in the month of November (744,755).
2.3 Analysis by Industries: Statistics pertaining to the number of disputes, workers involved, mandays lost, wages lost and production loss by industry in both Central as well as State sphere have been presented in Tables 2(iii) (a) to 2(iii) (c) up to three digit level as per the National Industrial Classification (NIC) – 2004. Table 2(iii)(d) shows industry-wise
8
disputes, workers involved, mandays lost, wages lost and production loss in the Central Sphere only. 2.3.1 Table 2(iii) (a) reveals that amongst the industry groups, ‘Manufacturing Division’ (Industry Codes 15 to 37) accounted for the highest number of disputes i.e. 218 (63.19 per cent) with a time loss of 1,25,93,877 mandays (71.47 per cent of the total time-loss). Within this group, the division ‘Manufacture of Textiles’ (Industry Code 17) accounted for the largest time-loss of 1,02,12,903 mandays (57.96 per cent of the total time-loss) followed by industry group(s), ‘Manufacture of Basic Metals’ (Industry Code 27) and Manufacture of Fabricated Metal Products except Machinery & Equipments (Industry Code 28) which together accounted for a time-loss of 10,15,020 mandays or 5.76 per cent of the total time-loss. 2.3.2 Industrial disputes by industries in respect of the Central Sphere have been shown in Table 2(iii)(d). It reveals that ‘Banks’ accounted for the highest number of disputes (21), having 13,72,459 workers involved and highest time-loss of 16,36,184 mandays whereas, ‘Coal Mines” and ‘Oil Fields’ reported least number (one each) of disputes. 2.4 Analysis of Time-loss per 1,000 workers: Data on time-loss per 1,000 workers employed in Manufacturing, Plantations (figures from 2008 onwards relate to Crops, Market Gardening and Horticulture as per NIC – 2004) and Coal Mines Sector have been presented in Table 2(iv). It can be seen from the Table that the relative volume of time-loss has decreased in all sectors except ‘Manufacturing’ during the year 2009 as compared to 2008. The said decrease is 0.47 per cent in Plantations, 90.51 per cent in Coal Mines (Crops, Market gardening and Horticulture ) whereas Manufacturing recorded an increase of 14.85 per cent. 2.5 Analysis of Lockouts: Table 2(v) (a) shows that during the year 2009, out of total 178 lockouts, as many as 176 (98.88 per cent) were pure lockouts (i.e., lockouts originating and terminating as lockouts) which were responsible for a time-loss of 95,45,756 mandays (99.99 per cent) of the total time-loss. Amongst the states, West Bengal reported the highest number with 139 lockouts (i.e.78.09 per cent) accounting for a time-loss of 91,48,786 mandays which works out to 95.83 per cent of the total time-loss due to lockouts. 2.5.1 Table 2(v)(b) reveals that total time-loss due to mixed lockouts was 1,253 mandays during the year 2009. There were only two disputes in which lockouts were preceded / succeeded by strike, which occurred in the state of Gujarat. 2.6 Analysis of Major Industrial Disputes: Major Industrial Disputes mean those disputes, which involve a time-loss of 50,000 or more mandays. Table 2(vi) reveals that during the year 2009, as many as 56 major industrial disputes took place, which accounted for a time-loss of 1,08,48,603 mandays. Out of these 56 major industrial disputes, only 5 occurred in Public Sector with a time-loss of 12,22,099 mandays (11.27 per cent). Though the major industrial disputes contributed only 16.23 per cent of the total disputes, they were responsible for 61.56 per cent of the total time-loss in the country. Among the states, West Bengal was on the top with a share of 73.40 per cent of the total time-loss in these major industrial disputes in both the Spheres.
9
2.7 Analysis by Causes: Cause-wise distribution of Industrial disputes along with the number of workers involved and mandays lost have been presented in Tables 2(vii)(a) to 2(vii)(e). In those cases of work-stoppages which occurred due to several causes, the immediate cause is taken into consideration. 2.7.1 Table 2(vii) (a) & (b) reveals that during the year 2009, disputes due to ‘Wages and Allowances’ and ‘Bonus’ accounted for 16.96 per cent (29,87,889 mandays) of the total time-loss. While non-monetary cause groups ‘Indiscipline’ and ‘Charter of Demands’ accounted for 34.92 per cent (61,53,042 mandays ) and 27.53 per cent (48,51,974 mandays ) respectively to the total time-loss. Table 2(vii)(b) reveals that in the Central Sphere, ‘Wages and Allowances’ and ‘Charter of Demands’ accounted for 62.72 per cent (11,02,361 mandays) and 3.75 per cent (65,994 mandays) of the total time-loss. The ‘Government Economic Policy’ accounted for 32.32 per cent (5,68,048 mandays) and ‘Personnel’ 0.28 per cent ( 5,002 mandays) of the total time loss in Central Sphere. So far as the number of disputes in State and Central spheres combined is concerned, the highest number of disputes 104(30.14 per cent) were due to ‘Indiscipline’ whereas in the Central Sphere it was due to ‘Wages & Allowances’ (21) which accounted for 47.73 per cent of the total disputes. 2.7.2 Table 2(vii)(c) reveals that in the State Sphere maximum number of disputes (104) and time loss (6,153,042 mandays) were due to “Indiscipline” which accounted for 34.55 per cent of total number of disputes and 38.79 per cent of total time loss in the said sphere. 2.7.3 Table 2(vii)(d) shows the Lockouts classified by Cause during the year 2009. It can be seen from the table that majority of the lockouts (96) were due to ‘Indiscipline’ which accounted for 53.93 per cent of the total lockouts and 63.85 per cent (60,95,612 mandays) of total time-loss. This was followed by ‘Charter of Demands’ with 19 lockouts (10.67 per cent) accounting for a time loss of 3,91,191 (4.10 per cent). 2.7.4 In the State Sphere as revealed by the Table 2(vii)(e), ‘Wages and Allowances’ accounted for maximum number of strikes 34 (27.64 per cent) followed by ‘Other reasons’ with 27 (21.95 per cent) strikes. The highest time loss of 43,94,789 mandays (69.57 per cent) was however caused by the ‘Charter of Demands’. 2.8 Analysis by Duration: Table 2(viii) reveals that among all the class-intervals of duration, the percentage share of disputes to the total disputes which lasted for ‘a day or less’ and ‘more than a day upto 5 days’ (38 each) was the highest 21.97 per cent followed by ‘More than 30 days’ (30) which accounted for 17.34 per cent. 2.9 Analysis by Methods of Settlements and Results: Table-2(ix) reveals the statistics relating to number of disputes terminated by different methods of settlement and their results. It is interesting to note that ‘Government Intervention’ and ‘Mutual Settlement / Direct Negotiation’ played a significant role in bringing about successful settlements of disputes during the year 2009. 2.10 Analysis of All India Strikes / Lockouts: It can be seen from the Table 2(x)that during 2009 four (4) all India Strikes took place ( 07-01-2009 to 09-01-2009, 17-02-2009, 06-08-2009 to 07-08-2009 and 16-12-2009) in ‘Oil industry’ and ‘Nationalized Banks’ on account of ‘Wages & Allowances’ and ‘Government Economic Policy’ which involved 13,21,531 workers and resulted into a time loss of 16,03,883 mandays.
10
Chapter-3
INDUSTRIAL DISPUTES IN THE PUBLIC SECTOR
3.1 Analysis by Months: Statistics in respect of Industrial Disputes in the Public Sector by months are presented in Tables 3(i)(a) to 3(i)(f). 3.1.1 It is evident from Tables 3(i)(a) and 3(i)(b) that a time-loss of 17,35,741 mandays was recorded in the Public Sector both in State and Central Spheres, of which Central Sphere had a share of 17,23,239 mandays. The highest number of disputes (7) started during the month of August followed by (6 each) in February and September whereas, the least number of disputes was recorded (1 each) in July, November and December, 2009. 3.2 Analysis by States: Tables 3(ii)(a) to 3(ii)(f) analyze Industrial Disputes in the Public Sector by States during the year 2009. 3.2.1 It can be seen from Table 3(ii)(a) that in the Public Sector while Kerala state accounted for the highest number of disputes (10), Maharashtra accounted for the highest share of time loss i.e 56.64 per cent (9,83,195 mandays) followed by West Bengal 11.37 per cent ( 1,97,334 mandays). 3.3 Analysis by Industries: Tables 3(iii)(a) to 3(iii)(c) present Industrial Disputes by Industries in Public Sector during the year 2009.
3.3.1 It is revealed from Table 3(iii)(a) that during the year 2009, Financial intermediation except Insurance and Pension (Industry code 65 ) accounted for the highest number of disputes (18) involving 13,43,724 workers and a time-loss of 16,01,308 mandays followed by “Post & Telecommunications” (Industry code 64) accounted for 6 disputes involving 19,342 workers and a time-loss of 34,280 mandays. The Manufacturing Division (Industry code 15 to 37) accounted for a time-loss of 22,904 mandays with an involvement of 6,523 workers in 4 Industrial Disputes.
3.3.2 Out of the total 41 disputes in the Public Sector, the information on production loss was available in respect of 5 disputes only. The production loss per dispute, for which relevant information was available, worked out to Rs. 2,36,54,350. The data on wage loss which pertain to 25 disputes show that the wages loss per dispute worked out to Rs.2,12,55,157. As shown in Table 3(iii)(b), the production loss and wages loss per strike for which relevant information was available worked out to the same aforesaid values. 3.3.3 Table 3(iii)(c) reveals that the ‘Banks’ in the Central Sphere accounted for the highest number of disputes, i.e. 18 or 45per cent of the total number of disputes, involving 13,47,628 workers (96.14 per cent) and accounted for a time loss of 93.15 per cent (1,605,212 mandays ) of the total time-loss. 3.4 Analysis by Causes: Cause-wise distribution of data on industrial disputes, workers involved therein and mandays lost thereby during the year 2009 in Public Sector have been shown in Tables 3(iv)(a).
11
3.4.1 The “Wages & Allowances” accounted for the maximum time loss of 63.16 per cent (10,96,362 mandays) of the total time-loss in all disputes, followed by ‘Govt. Economic Policy” and ‘Charter of Demands’ with 32per cent (5,55,500 mandays) and 3.80 per cent (65,994 mandays) respectively. The percentage of disputes owing to “Wages & Allowances”, “Charter of Demands” and “Govt. Economic Policy” together accounted for 78.05 per cent (32) to the total number of disputes (41) in Public Sector in both Central as well as State Spheres. “Wages & Allowances” and “Govt. Economic Policy” in the Central Sphere recorded a time-loss of 1,083,860 (62.90 per cent) and 555,500 (32.24 per cent) mandays respectively in Public Sector during the year 2009.
3.5 Analysis by Duration: Table 3(v) presents the number of terminated disputes in Public Sector by duration during the year 2009. It can be seen that during 2009, 70per cent of the total terminated disputes lasted for ‘a day or less’, while 22.50 per cent of the total terminated disputes lasted for more than a day up to 5 days.
12
Chapter-4
POLITICAL / SYMPATHETIC STRIKES AND DISPUTES DUE TO REASONS
OTHER THAN INDUSTRIAL DISPUTES ___________________________________________________________________________ 4.1 Analysis of Political and Sympathetic Strikes: Month-wise and Sphere-wise statistics on Political and Sympathetic Strikes during the year 2009 have been presented in Table 4(i). It reveals that, in the Central Sphere, there was only one strike accounted for a time-loss of 951 mandays while there was no such strike in the State Sphere. 4.2 Analysis of Disputes due to reasons other than Industrial Disputes: Tables 4(iii) and 4(iv) present State-wise, Cause-wise and Industry-wise statistics of disputes due to reasons other than Industrial Disputes during the year 2009.
4.2.1 It can be seen from Table 4(iii) that ‘Financial Stringency’ was responsible for maximum number of 133 disputes resulting in a time-loss of 60,58,148 mandays which accounted for 78.60 per cent of the total time-loss during the year 2009. The State of West Bengal had the maximum number of disputes (127) affecting 21,348 workers and resulting in a time-loss of 59,41,787 mandays. In the State Sphere, Private sector alone was responsible for the time-loss during the year, as there was no time-loss in Public Sector in both State and Central Spheres.
4.2.2 Industry-wise details of such disputes are given in Table 4(iv). The Industry group ‘Manufacturing of Textiles’ (Industry Code 17) in the State Sphere was responsible for the highest time loss of 32,37,099 mandays which was 42per cent of the total time-loss due to strikes and lockouts. Second in the order was the ‘Manufacturing of Basic Metals (Industry Code 27) which was responsible for a time-loss of 8,94,725 mandays or 11.61 per cent of the total time-loss. 4.2.3 Out of the total 160 disputes, there were 157 cases of Lockouts (98.13 per cent) and 3 cases of Strike (1.87 per cent). Lockouts accounted for 77,00,406 mandays or 99.91 per cent of the time-loss, while 7,073 mandays or 0.09 per cent of the time-loss was due to strikes.
13
CHAPTER - 5
CLOSURES IN INDUSTRIES DURING THE YEAR 2009
___________________________________________________________________
Analysis by States, Causes, Industry Groups Sectors and Months
5.1.1 During the year 2009, 68 cases of Closures affecting 3,571 workers were reported. During this period, though there has been an increase in the number of closures (17.24 per cent) but the number of workers affected decreased by 21.55 percent as compared to the previous year. All the 68 of Closures were in State Sphere and no case of Closures was reported in Central Sphere.
5.1.2 Tables-5(i) (a) to 5 (i) (g) present the number of Closures and workers affected thereby by States, Causes, Industries, Sectors and Months during the year 2009.
Analysis by States
5.2.1 State Sphere: Table-5 (i) (a) reveals that the maximum number of Closures i.e. 43 (63.24 percent) took place in the state of Tripura followed 8 (11.76 percent) in Kerala and 4 each (5.88 percent) in Gujarat and Himachal Pradesh. The maximum number of workers affected due to Closures were 1,492 (41.78 percent) in Gujarat followed by 1,103 (30.89 percent) in Tripura and 500 (14 per cent) in Kerala.
5.2.2 Central Sphere: No case of closure was reported in the Central Sphere. Analysis by Causes 5.3 State Sphere: ‘Financial Stringency’ was responsible for the maximum number of Closures (22 or 32.35 percent) followed by ‘Lack of Demand for Products’ (15 or 22.06 percent) and ‘Others’ (9 or 13.24 percent). The maximum number of workers affected due to Closures were 1,250 (35 percent) caused by ‘Shortage of Power’ followed by ‘Financial Stringency’ 771 (21.59 percent), and ‘Others’ 379 (10.61 per cent). 5.3.1 Central Sphere: No case of Closure was reported in the Central Sphere. Analysis by Industry Groups 5.4.1 State Sphere: Table- 5(i) (c) reveal that maximum number of units i.e. 58 (85.29 percent) were Closed in “Manufacturing Division” (Industry codes 15 to 37) with an aggregate of 3,163 workers (88.57 percent) affected during the year 2009. 5.4.2 Central Sphere: No case of Closure was reported in the Central Sphere.
14
Analysis by sectors 5.5 State Sphere: Table-5 (i) (d) shows that all the 68 Closures, affecting 3,571 workers, were in the Private Sector as there was no case of Closure reported in Public, Co-operative and Joint Sectors. 5.5.1 Central Sphere: No case of Closure was reported in the Central Sphere. Analysis by Months 5.6 State Sphere: Table- 5(i)(g) shows that the maximum number of Closures i.e. 13 (19.12 percent) were reported in the month of March followed by 12 (17.65 percent) in September , 10 (14.71 percent) in August 7 (10.29 percent) in June and 5each (7.35 percent) in February and July 2009. 5.6.1 Central Sphere: No case of Closure was reported in the Central Sphere.
15
CHAPTER – 6
RETRENCHMENTS IN INDUSTRIES DURING THE YEAR 2009
Analysis by States, Causes, Industry Groups, Sectors and Months 6.1.1 In all there were 29 cases of retrenchments in which 2,693 workers were affected during the year. This reflects an increase of 52.63 percent in respect of retrenchments as well as 54.06 percent in respect of the number of workers retrenched over the previous year. Out of these 29 cases, 23 (79.31 percent) affecting 1,215 (or 45.12 percent) workers were in the State Sphere while 6 (20.69 percent) cases of retrenchments, affecting 1,478 (54.88 percent) workers were reported from the Central Sphere.
6.1.2 Tables- 6 (i) (a) to 6 (i) (g) present statistics relating to retrenchment of workers by States, Causes, Industries, Sectors and Months during the year 2009.
Analysis by States
6.2.1 Table-6(i) (a) shows that the maximum number of retrenchments 8 (27.59 percent) were reported in the State of Gujarat followed by 5 cases (17.24 percent) in West Bengal in State Sphere and 5 cases (17.24 percent) in Orissa in Central Sphere. The maximum number of workers, 1,458 (54.14 percent) retrenched in Orissa in Central Sphere followed by 665 (24.69 percent) in Himachal Pradesh and 263 (9.77 percent) in Gujarat in State Sphere. The highest numbers of retrenchments i.e. 23 cases (79.31 percent) were reported in the State Sphere while highest number of workers affected i.e. 1,478 (54.88 percent) were reported in Central Sphere. Analysis by Causes 6.3.1 State Sphere: The monetary cause group i.e., ‘Financial Stringency’ accounted for two retrenchments (8.70 percent) affecting12 workers (0.99 percent). The non-financial cause groups viz., ‘Lack of Demand for Products’, ‘Others’ and ‘Cause not Known’ taken together were responsible for 21 retrenchments (91.30 percent) which affected workers 1,203 (99.01 percent) during the year. 6.3.2 Central Sphere: In Central Sphere 6 cases of retrenchments affecting 1,478 workers were due to causes classified as ‘Financial Stringency’ ( One Case affecting 1140 workers) and ‘Others’ ( 5 Cases affecting 338 workers) during the year 2009. Analysis by Industry Groups 6.4.1 State Sphere: It may be seen from Table- 6 (i)(c) that 13 cases (56.52 percent) of retrenchments were in the ‘Manufacturing Division’ (Industry Codes 15 to 37) wherein 365 (30.04 percent) workers were retrenched. In Industry Group 40 –‘Electricity, Gas, Steam & Hot Water Supply’ and Industry Group 65– ‘Financial Intermediation except Insurance and Pension’ two units each (8.70 percent) reported retrenchment in which 665 (54.73 percent) and 2 (0.16 percent) workers respectively were affected.
16
6.4.2 Central Sphere: Four cases (66.67 percent) of retrenchment affecting 1,425 (96.41 percent) workers in the Industry Group 13 – ‘Mining of Metal Ore’, and two cases (33.33 percent) of retrenchment affecting 53 (3.59 percent) workers were reported in the Industry Group 14 – ‘Other Mining and Quarrying’.
Analysis by Sectors
6.5.1 State Sphere: Table-6 (i)(d) reveals that all 23 cases of retrenchments affecting 1,215 workers were reported in the private sector 6.5.2 Central Sphere: All 6 cases of retrenchment affecting 1,478 workers were in the Private Sector and no case of retrenchment was in the Public, Cooperative and Joint sectors during 2009. Analysis by Months 6.6.1 State Sphere: It may be seen from Table- 6 (i)(g) that the maximum 7 cases (30.43 percent) occurred in the month of April followed by 5 cases (21.74 percent) in the month of January and 2 cases each (8.70 percent) in the months of August, September and December, 2009. The maximum number of workers affected due to retrenchment were 678 (55.80 percent) in the month of January followed by 141 (11.60 percent) in the month of April during the year 2009. 6.6.2 Central Sphere: Two cases each (33.33 percent) of retrenchments occurred in the months of May and December affecting 53 (3.59 percent) and 104 (7.04 percent) workers respectively. One case each (16.67 percent) occurred during the months of February and March, affecting 181 (12.24 percent) and 1140 (77.13 percent) workers respectively during this period.
17
CHAPTER – 7
LAY-OFFS IN INDUSTRIES DURING THE YEAR 2009 Analysis By States, Causes, Industry Groups, Sectors And Months
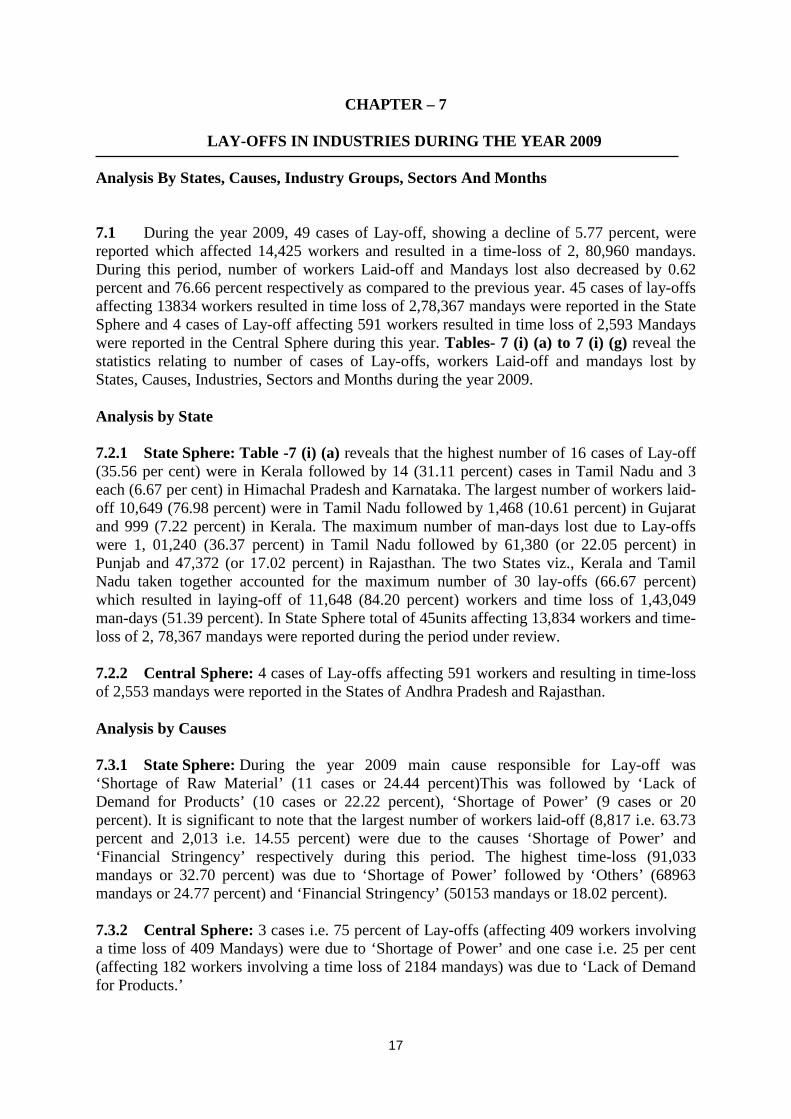
7.1 During the year 2009, 49 cases of Lay-off, showing a decline of 5.77 percent, were reported which affected 14,425 workers and resulted in a time-loss of 2, 80,960 mandays. During this period, number of workers Laid-off and Mandays lost also decreased by 0.62 percent and 76.66 percent respectively as compared to the previous year. 45 cases of lay-offs affecting 13834 workers resulted in time loss of 2,78,367 mandays were reported in the State Sphere and 4 cases of Lay-off affecting 591 workers resulted in time loss of 2,593 Mandays were reported in the Central Sphere during this year. Tables- 7 (i) (a) to 7 (i) (g) reveal the statistics relating to number of cases of Lay-offs, workers Laid-off and mandays lost by States, Causes, Industries, Sectors and Months during the year 2009. Analysis by State 7.2.1 State Sphere: Table -7 (i) (a) reveals that the highest number of 16 cases of Lay-off (35.56 per cent) were in Kerala followed by 14 (31.11 percent) cases in Tamil Nadu and 3 each (6.67 per cent) in Himachal Pradesh and Karnataka. The largest number of workers laid-off 10,649 (76.98 percent) were in Tamil Nadu followed by 1,468 (10.61 percent) in Gujarat and 999 (7.22 percent) in Kerala. The maximum number of man-days lost due to Lay-offs were 1, 01,240 (36.37 percent) in Tamil Nadu followed by 61,380 (or 22.05 percent) in Punjab and 47,372 (or 17.02 percent) in Rajasthan. The two States viz., Kerala and Tamil Nadu taken together accounted for the maximum number of 30 lay-offs (66.67 percent) which resulted in laying-off of 11,648 (84.20 percent) workers and time loss of 1,43,049 man-days (51.39 percent). In State Sphere total of 45units affecting 13,834 workers and time-loss of 2, 78,367 mandays were reported during the period under review. 7.2.2 Central Sphere: 4 cases of Lay-offs affecting 591 workers and resulting in time-loss of 2,553 mandays were reported in the States of Andhra Pradesh and Rajasthan. Analysis by Causes 7.3.1 State Sphere: During the year 2009 main cause responsible for Lay-off was ‘Shortage of Raw Material’ (11 cases or 24.44 percent)This was followed by ‘Lack of Demand for Products’ (10 cases or 22.22 percent), ‘Shortage of Power’ (9 cases or 20 percent). It is significant to note that the largest number of workers laid-off (8,817 i.e. 63.73 percent and 2,013 i.e. 14.55 percent) were due to the causes ‘Shortage of Power’ and ‘Financial Stringency’ respectively during this period. The highest time-loss (91,033 mandays or 32.70 percent) was due to ‘Shortage of Power’ followed by ‘Others’ (68963 mandays or 24.77 percent) and ‘Financial Stringency’ (50153 mandays or 18.02 percent). 7.3.2 Central Sphere: 3 cases i.e. 75 percent of Lay-offs (affecting 409 workers involving a time loss of 409 Mandays) were due to ‘Shortage of Power’ and one case i.e. 25 per cent (affecting 182 workers involving a time loss of 2184 mandays) was due to ‘Lack of Demand for Products.’
18
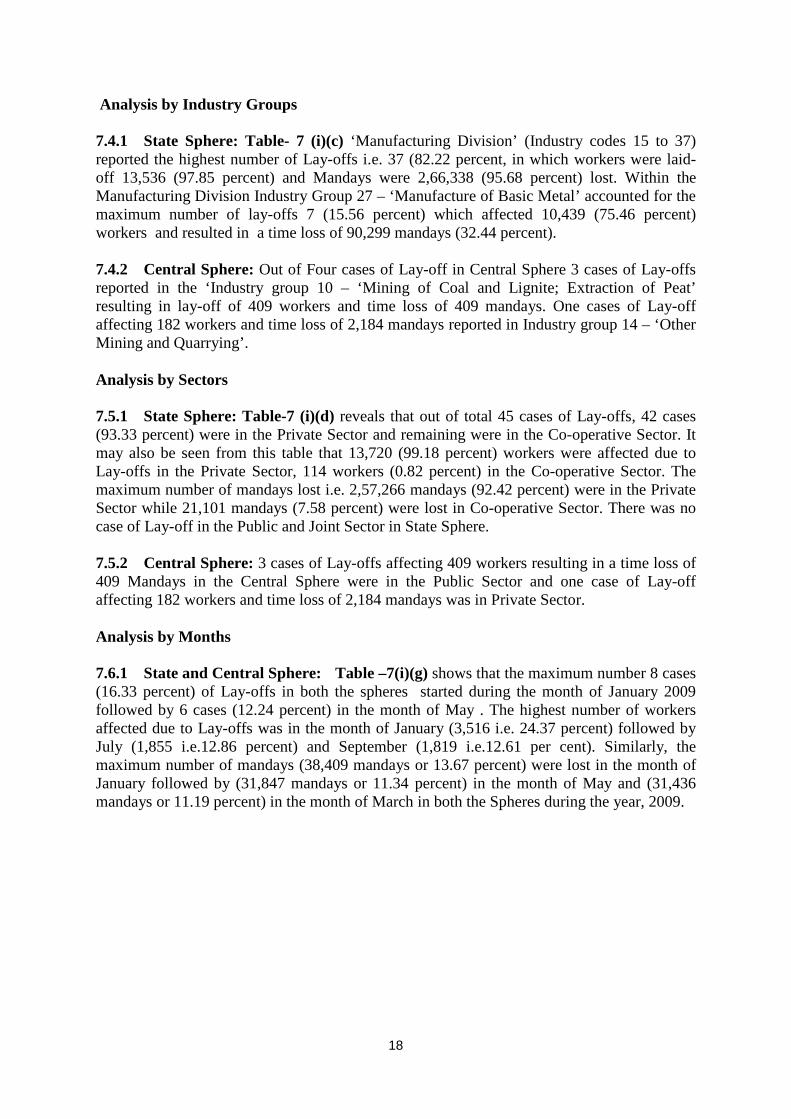
Analysis by Industry Groups 7.4.1 State Sphere: Table- 7 (i)(c) ‘Manufacturing Division’ (Industry codes 15 to 37) reported the highest number of Lay-offs i.e. 37 (82.22 percent, in which workers were laid-off 13,536 (97.85 percent) and Mandays were 2,66,338 (95.68 percent) lost. Within the Manufacturing Division Industry Group 27 – ‘Manufacture of Basic Metal’ accounted for the maximum number of lay-offs 7 (15.56 percent) which affected 10,439 (75.46 percent) workers and resulted in a time loss of 90,299 mandays (32.44 percent). 7.4.2 Central Sphere: Out of Four cases of Lay-off in Central Sphere 3 cases of Lay-offs reported in the ‘Industry group 10 – ‘Mining of Coal and Lignite; Extraction of Peat’ resulting in lay-off of 409 workers and time loss of 409 mandays. One cases of Lay-off affecting 182 workers and time loss of 2,184 mandays reported in Industry group 14 – ‘Other Mining and Quarrying’. Analysis by Sectors 7.5.1 State Sphere: Table-7 (i)(d) reveals that out of total 45 cases of Lay-offs, 42 cases (93.33 percent) were in the Private Sector and remaining were in the Co-operative Sector. It may also be seen from this table that 13,720 (99.18 percent) workers were affected due to Lay-offs in the Private Sector, 114 workers (0.82 percent) in the Co-operative Sector. The maximum number of mandays lost i.e. 2,57,266 mandays (92.42 percent) were in the Private Sector while 21,101 mandays (7.58 percent) were lost in Co-operative Sector. There was no case of Lay-off in the Public and Joint Sector in State Sphere. 7.5.2 Central Sphere: 3 cases of Lay-offs affecting 409 workers resulting in a time loss of 409 Mandays in the Central Sphere were in the Public Sector and one case of Lay-off affecting 182 workers and time loss of 2,184 mandays was in Private Sector. Analysis by Months 7.6.1 State and Central Sphere: Table –7(i)(g) shows that the maximum number 8 cases (16.33 percent) of Lay-offs in both the spheres started during the month of January 2009 followed by 6 cases (12.24 percent) in the month of May . The highest number of workers affected due to Lay-offs was in the month of January (3,516 i.e. 24.37 percent) followed by July (1,855 i.e.12.86 percent) and September (1,819 i.e.12.61 per cent). Similarly, the maximum number of mandays (38,409 mandays or 13.67 percent) were lost in the month of January followed by (31,847 mandays or 11.34 percent) in the month of May and (31,436 mandays or 11.19 percent) in the month of March in both the Spheres during the year, 2009.
19
CHAPTER-1
Table-1(i) Sector/Sphere-wise Number of Disputes, Workers involved, Mandays Lost, Wages Lost
and Value of Production Loss due to Industrial Disputes during 2009.
PUBLIC SECTOR Sphere
Number
of Disputes
Number of Workers involved
Number of Mandays
Lost
Wages Lost (in Rs.)
Production Loss (in Rs.)
1 2 3 4 5 6 7 I Central
Sphere Strikes 40 1,401,679 1,723,239 53,13,78,915
(25) 11,82,71,750
(5) Lockouts - - - - - Strikes & Lockouts Total-1
40 1,401,679 1,723,239 53,13,78,915 (25)
11,82,71,750 (5)
II State Sphere
Strikes 1 329 12502 .. .. Lockouts - - - - - Strikes & Lockouts Total-II
1 329 12,502 .. ..
GRAND TOTAL (I + II)
Total Strikes & Lockouts
41 1,402,008 1,735,741 53,13,78,915 (25)
11,82,71,750 (5)
PRIVATE SECTOR I Central
Sphere Strikes 4 25,532 34,477 2,34,41,600
(3) ..
Lockouts - - - - - Strikes & Lockouts Total-1
4 25,532 34,477 2,34,41,600 (3)
..
II State Sphere
Strikes 122 365,847 6,304,828 29,75,12,956 (41)
5,82,67,07,475 (36)
Lockouts 178 73,817 9,547,009 52,90,838 (15)
2,58,29,389 (7)
Strikes & Lockouts Total-1I
300 439,664 15,851,837 30,28,03,794 (56)
5,85,25,36,864 (43)
GRAND TOTAL (I + II)
Total Strikes & Lockouts
304 465,196 15,886,314 32,62,45,394 (59)
5,85,25,36,864 (43)
TOTAL (PUBLIC & PRIVATE SECTORS) I Central
Sphere Strikes 44 1,427,211 1,757,716 55,48,20,515
(28) 11,82,71,750
(5) Lockouts - - - - - Strikes & Lockouts Total-1
44 1,427,211 1,757,716 55,48,20,515 (28)
11,82,71,750 (5)
II State Sphere
Strikes
123 366,176 6,317,330 29,75,12,956 (41)
5,82,67,07,475 (36)
Lockouts 178 73,817 9,547,009 52,90,838 (15)
2,58,29,389 (7)
Strikes & Lockouts Total-II
301 439,993 15,864,339 30,28,03,794 (56)
5,85,25,36,864 (43)
GRAND TOTAL ( I + II )
Total Strikes & Lockouts
345 1,867,204 17,622,055 85,76,24,309 (84)
5,97,08,08,614 (48)
- = Nil .. = Not available Note: Figures in brackets indicate the number of cases to which the relevant information
relates.
20
Graph-1
21
22
23
24
Table-1(ii)
Number of Disputes by Sectors and Spheres during 2007 to 2009
Sr.No.
Sphere Nature of
Dispute
Public Sector Private Sector Total 2007 2008 2009 2007 2008 2009 2007 2008 2009
1 2 3 4 5 6 7 8 9 10 11 12 I Central
Sphere Strikes 65 81 40 2 6 4 67 87 44
Lockouts
- - - - - - - - -
Strikes & Lockouts Total-1
65 81 40 2 6 4 67 87 44
II State Sphere Strikes
3 3 1 140 150 122 143 153 123
Lockouts
- 1$ - 179 180 178 179 181 178
Strikes & Lockouts Total-11
3 4 1 319 330 300 322 334 301
Total (Central & State
Sphere)
Strikes
68 84 41 142 156 126 210 240 167
Lockouts
- 1$ - 179 180 178 179 181 178
Grand Total Strikes & Lockouts
Total
68 85 41 321 336 304 389 421 345
- = Nil $ = Information relates to Co-operative Sector
25
Table-1(iii)
Time-loss (Number of Mandays Lost) by Sector/Sphere during 2007 to 2009
Sphere Strikes/ Lockouts
PUBLIC SECTOR
2007 2008 2009
Percentage increase/
decrease over the year 2008
1 2 3 4 5 6 7 I Central Sphere Strikes
% to Total 327,311 (1.20)
1,330,218 (7.63)
1,723,239 (9.78)
29.55
Lockouts % to Total
- - - -
Strikes & Lockouts % to Total
327,311 (1.20)
1,330,218 (7.63)
1,723,239 (9.78)
29.55
II State Sphere Strikes % to Total
4,274 (0.02)
78,093 (0.45)
12,502 (007)
- 84.00
Lockouts % to Total
- 325,600$ (1.87)
- - 100.00
Strikes & Lockouts % to Total
4,274 (0.02)
403,693 (2.32)
12,502 (007)
- 96.90
III Total (Central and State Sphere)
Strikes % to Total
331,585 (1.22)
1,408,311 (8.08)
1,735,741 (9.85)
23.25
Lockouts % to Total
- 325,600$ (1.87)
- - 100.00
Strikes & Lockouts % to Total
331,585 (1.22)
1,733,911 (9.95)
1,735,741 (9.85)
0.11
PRIVATE SECTOR I Central Sphere Strikes
% to Total 912
(0.00) 43,357 (0.25)
34,477 (0.20)
- 20.48
Lockouts % to Total
- - - -
Strikes & Lockouts % to Total
912 (0.00)
43,357 (0.25)
34,477 (0.20)
- 20.48
II State Sphere Strikes % to Total
14,723,216 (54.20)
5,503,525 (31.57)
6,304,828 (35.78)
14.56
Lockouts % to Total
12,111,039 (44.58)
10,152,928 (58.24)
9,547,009 (54.18)
- 5.97
Strikes & Lockouts % to Total
26,834,255 (98.78)
15,656,453 (89.81)
15,851,837 (89.95)
1.25
III Total (Central and State Sphere)
Strikes % to Total
14,724,128 (54.20)
5,546,882 (31.82)
6,339,305 (35.97)
14.29
Lockouts % to Total
12,111,039 (44.58)
10,152,928 (58.24)
9,547,009 (54.18)
- 5.97
Strikes & Lockouts % to Total
26,835,167 (98.78)
15,699,810 (90.05)
15,886,314 (90.15)
1.19
TOTAL I Central Sphere Strikes
% to Total 328,223 (1.21)
1,373,575 (7.88)
1,757,716 (9.97)
27.97
Lockouts % to Total
- - - -
Strikes & Lockouts % to Total
328,223 (1.21)
1,373,575 (7.88)
1,757,716 (9.97)
27.97
II State Sphere Strikes % to Total
14,727,490 (54.21)
5,581,618 (32.02)
6,317,330 (35.85)
13.18
Lockouts % to Total
12,111,039 (44.58)
10,478,528 (60.10)
9,547,009 (54.18)
- 8.89
Strikes & Lockouts % to Total
26,838,529 (98.79)
16,060,146 (92.12)
15,864,339 (90.03)
- 1.22
III Total (Central and State Sphere)
Strikes % to Total
15,055,713 (55.42)
6,955,193 (39.90)
8,075,046 (45.82)
16.10
Lockouts % to Total
12,111,039 (44.58)
10,478,528 (60.10)
9,547,009 (54.18)
- 8.89
Strikes & Lockouts % to Total
27,166,752 (100.00)
17,433,721 (100.00)
17,622,055 (100.00)
1.08
- = Nil $ = Information relates to Co-operative Sector Note : - Total of percentages may not necessarily tally due to rounding of figures.
26
Table-1(iv)
Percentage of Mandays Lost due to Strikes and Lockouts by Sector/Sphere during 2007 to 2009
Sr. No.
Sphere Strikes / Lockouts
PUBLIC SECTOR PRIVATE SECTOR TOTAL 2007 2008 2009 2007 2008 2009 2007 2008 2009
1 2 3 4 5 6 7 8 9 10 11 12 I Central
Sphere Strikes % in Sphere 100.0 100.0 100.0 100.0 100.0 100.0 100.0 100.0 100.0 % to Total 98.7 76.7 99.3 0.0 0.3 0.2 1.2 7.9 10.0 Lockouts % in Sphere 0.0 0.0 0.0 0.0 0.0 0.0 0.0 0.0 0.0 % to Total 0.0 0.0 0.0 0.0 0.0 0.0 0.0 0.0 0.0 Strikes and Lockouts % in Sphere 100.0 100.0 100.0 100.0 100.0 100.0 100.0 100.0 100.0 % to Total 98.7 76.7 99.3 0.0 0.3 0.2 1.2 7.9 10.0
II State Sphere
Strikes % in Sphere 100.0 19.3 100.0 54.9 35.2 39.8 54.9 35.2 39.8 % to Total 1.3 4.5 0.7 54.2 35.1 39.7 54.2 35.1 35.8 Lockouts % in Sphere 0.0 80.7 0.0 45.1 64.8 60.2 45.1 65.2 60.2 % to Total 0.0 18.8 0.0 44.6 64.7 60.1 44.6 60.1 54.2 Strikes &Lockouts % in Sphere 100.0 100.0 100.0 100.0 100.0 100.0 100.0 100.0 100.0 % to Total 0.7 23.3 0.7 98.8 99.7 99.8 98.8 92.1 90.0
III Total (Central
and State
Sphere)
Strikes % to Total 100.0 81.2 100.0 55.4 35.3 39.9 55.4 39.9 45.8 Lockouts % to Total 0.0 18.8 0.0 44.6 64.7 60.1 44.6 60.1 54.2
Total Strikes & Lockouts
100.0 100.0 100.0 100.0 100.0 100.0 100.0 100.0 100.0
0.0 = Less than 0.05 percent Note: Total of percentages may not necessarily tally due to rounding of figures.
Table-1(v)
Average Time Loss per Dispute, Workers involved per dispute and Average Number of Mandays Lost per Worker due to Industrial Disputes during the years 2008 and 2009
Item Description All Industries Manufacturing
Industries Mining and Quarrying
Crops and Horticulture
2008 2009 2008 2009 2008 2009 2008 2009 1 2 3 4 5 6 7 8 9
Average Time Loss per Dispute (Mandays)
41,410 51,078 50,991 57,770 11,624 18,411 101,617 82,175
Average Number of Workers involved per
Dispute (Workers)
3,751 5,412 1,718 1,830 3,406 2,438 1,009 1,111
Average Number of Mandays Lost per Worker involved
(Days)
11 9 30
32 3 8 101 74
27
January 22 154 27,836 61,951 999,202
February 17 157 63,271 101,444 942,043
March 15 150 41,698 76,656 1,008,146
April 17 149 13,583 47,368 927,656
May 20 159 35,817 74,407 1,114,333
June 15 157 10,737 71,229 1,610,605
July 12 156 4,486 71,783 1,442,511
August 17 150 816,809 862,255 1,924,005
September 23 153 33,124 64,338 784,463
October 28 162 16,979 44,145 761,252
November 12 152 8,641 40,131 744,755
December 15 157 760,108 789,673 5,363,084
Total
17,622,055
Starting during the month
Starting during the month
Number of mandays lost In progress during a
part or whole of the month
Month
Number of disputes Number of workers involved directly and / or indirectly in disputes
Industrial Disputes (All Strikes & Lockouts) during the year 2009 (BY MONTHS)
Table-2(i)(a)
2 3 1 4 5 6
In progress during a part or whole of the
month
28
January 3 3 26,994 26,994 65,645
February 5 5 47,361 47,361 47,361
March 5 5 8,229 8,229 9,158
April 3 4 694 1,594 9,230
May 3 5 12,237 12,731 18,715
June 4 4 3,588 3,588 3,588
July 1 1 840 840 840
August 8 8 807,848 807,848 1,068,947
September 8 8 24,403 24,403 35,007
October 2 2 769 769 3,768
November 1 2 1,015 1,136 2,224
December 1 1 493,233 493,233 493,233
Total 1,757,716
Starting during the month
Starting during the month
Number of mandays lost In progress during a
part or whole of the month
Month
Number of disputes Number of workers involved directly and / or indirectly in disputes
Industrial Disputes (Strikes and Lockouts) in Central Sphere during the year 2009 (BY MONTHS)
Table-2(i)(b)
2 3 1 4 5 6
In progress during a part or whole of the
month
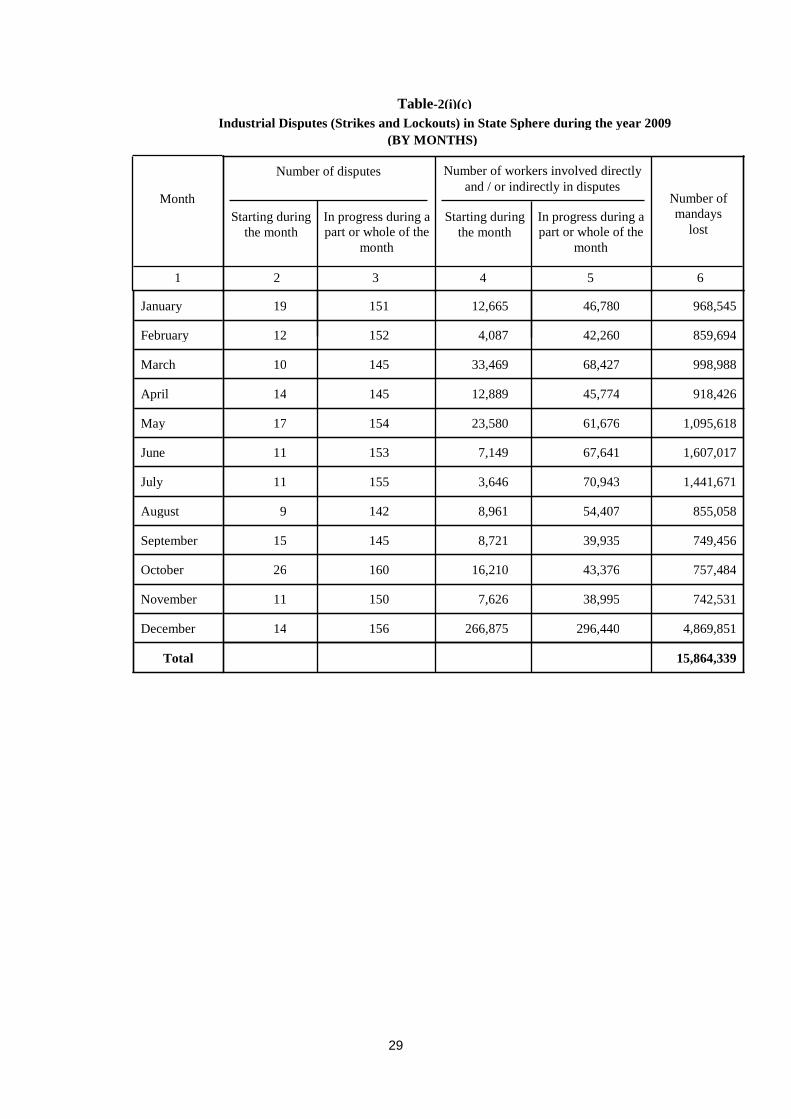
29
January 19 151 12,665 46,780 968,545
February 12 152 4,087 42,260 859,694
March 10 145 33,469 68,427 998,988
April 14 145 12,889 45,774 918,426
May 17 154 23,580 61,676 1,095,618
June 11 153 7,149 67,641 1,607,017
July 11 155 3,646 70,943 1,441,671
August 9 142 8,961 54,407 855,058
September 15 145 8,721 39,935 749,456
October 26 160 16,210 43,376 757,484
November 11 150 7,626 38,995 742,531
December 14 156 266,875 296,440 4,869,851
Total 15,864,339
Starting during the month
Starting during the month
Number of mandays
lost In progress during a part or whole of the
month
Month
Number of disputes Number of workers involved directly and / or indirectly in disputes
Industrial Disputes (Strikes and Lockouts) in State Sphere during the year 2009 (BY MONTHS)
Table-2(i)(c)
2 3 1 4 5 6
In progress during a part or whole of the
month
30
January 13 25 24,626 31,810 258,575
February 14 29 63,065 72,168 301,659
March 12 26 41,220 50,043 391,642
April 12 24 8,363 17,540 264,193
May 12 29 13,581 21,405 186,042
June 13 28 5,495 12,283 180,302
July 9 25 3,846 10,483 171,811
August 16 31 816,692 824,276 1,185,728
September 17 30 30,986 34,807 153,374
October 19 34 12,289 16,366 118,759
November 6 28 6,800 13,380 146,189
December 12 30 759,240 764,116 4,716,772
Total 8,075,046
Starting during the month
Starting during the month
Number of mandays
lost In progress during a part or whole of the
month
Month
Number of disputes Number of workers involved directly and / or indirectly in disputes
All Strikes during the year 2009 (BY MONTHS)
Table-2(i)(d)
2 3 1 4 5 6
In progress during a part or whole of the
month
31
January 3 3 26,994 26,994 65,645
February 5 5 47,361 47,361 47,361
March 5 5 8,229 8,229 9,158
April 3 4 694 1,594 9,230
May 3 5 12,237 12,731 18,715
June 4 4 3,588 3,588 3,588
July 1 1 840 840 840
August 8 8 807,848 807,848 1,068,947
September 8 8 24,403 24,403 35,007
October 2 2 769 769 3,768
November 1 2 1,015 1,136 2,224
December 1 1 493,233 493,233 493,233
Total 1,757,716
Starting during the month
Starting during the month
Number of mandays lost In progress during a
part or whole of the month
Month
Number of disputes Number of workers involved directly and / or indirectly in disputes
Strikes in Central Sphere during the year 2009 (BY MONTHS)
Table-2(i)(e)
2 3 1 4 5 6
In progress during a part or whole of the
month

32
January 10 22 9,455 16,639 227,918
February 9 24 3,881 12,984 219,310
March 7 21 32,991 41,814 382,484
April 9 20 7,669 15,946 254,963
May 9 24 1,344 8,674 167,327
June 9 24 1,907 8,695 176,714
July 8 24 3,006 9,643 170,971
August 8 23 8,844 16,428 116,781
September 9 22 6,583 10,404 118,367
October 17 32 11,520 15,597 114,991
November 5 26 5,785 12,244 143,965
December 11 29 266,007 270,883 4,223,539
Total 6,317,330
Starting during the month
Starting during the month
Number of mandays lost In progress during a
part or whole of the month
Month
Number of disputes Number of workers involved directly and / or indirectly in disputes
Strikes in State Sphere during the year 2009 (BY MONTHS)
Table-2(i)(f)
2 3 1 4 5 6
In progress during a part or whole of the
month

33
January 9 129 3,210 30,141 740,627
February 3 128 206 29,276 640,384
March 3 124 478 26,613 616,504
April 5 125 5,220 29,828 663,463
May 8 130 22,236 53,002 928,291
June 2 129 5,242 58,946 1,430,303
July 3 131 640 61,300 1,270,700
August 1 119 117 37,979 738,277
September 6 123 2,138 29,531 631,089
October 9 128 4,690 27,779 642,493
November 6 124 1,841 26,751 598,566
December 3 127 868 25,557 646,312
Total 9,547,009
Starting during the month
Starting during the month
Number of mandays
lost In progress during a part or whole of the
month
Month
Number of disputes Number of workers involved directly and / or indirectly in disputes
All Lockouts during the year 2009 (BY MONTHS)
Table-2(i)(g)
2 3 1 4 5 6
In progress during a part or whole of the
month
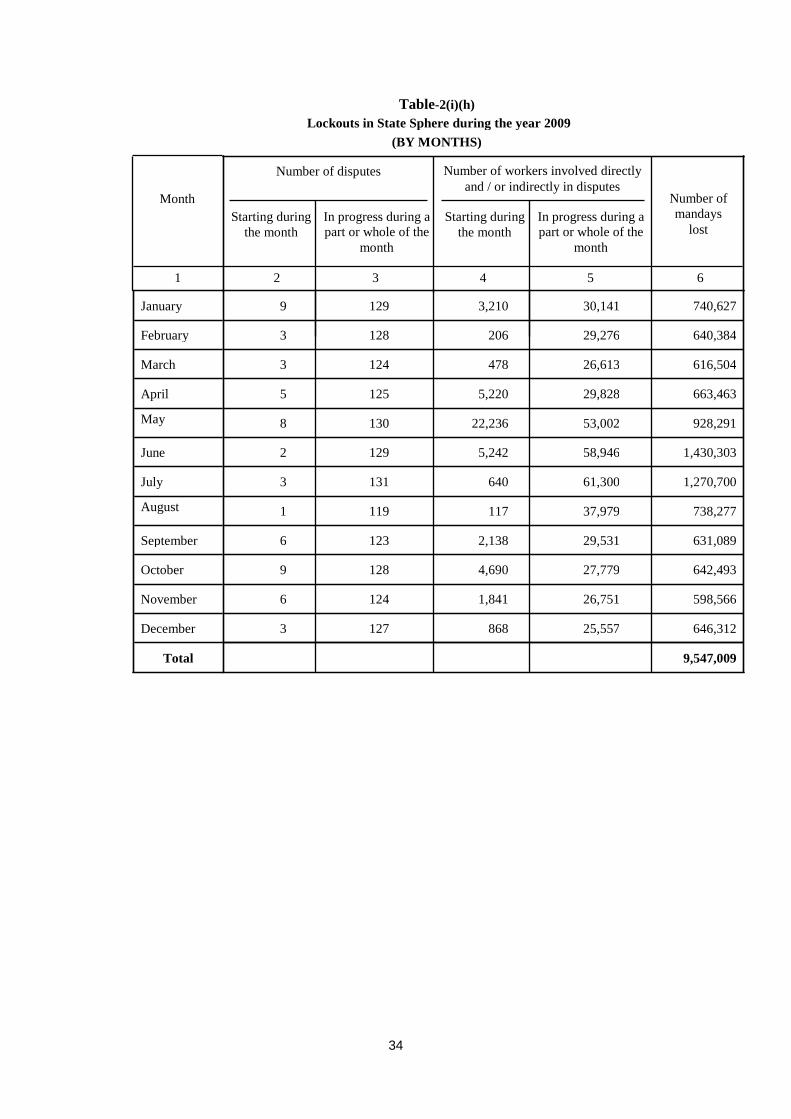
34
January 9 129 3,210 30,141 740,627
February 3 128 206 29,276 640,384
March 3 124 478 26,613 616,504
April 5 125 5,220 29,828 663,463
May 8 130 22,236 53,002 928,291
June 2 129 5,242 58,946 1,430,303
July 3 131 640 61,300 1,270,700
August 1 119 117 37,979 738,277
September 6 123 2,138 29,531 631,089
October 9 128 4,690 27,779 642,493
November 6 124 1,841 26,751 598,566
December 3 127 868 25,557 646,312
Total 9,547,009
Starting during the month
Starting during the month
Number of mandays
lost In progress during a part or whole of the
month
Month
Number of disputes Number of workers involved directly and / or indirectly in disputes
Lockouts in State Sphere during the year 2009 (BY MONTHS)
Table-2(i)(h)
2 3 1 4 5 6
In progress during a part or whole of the
month
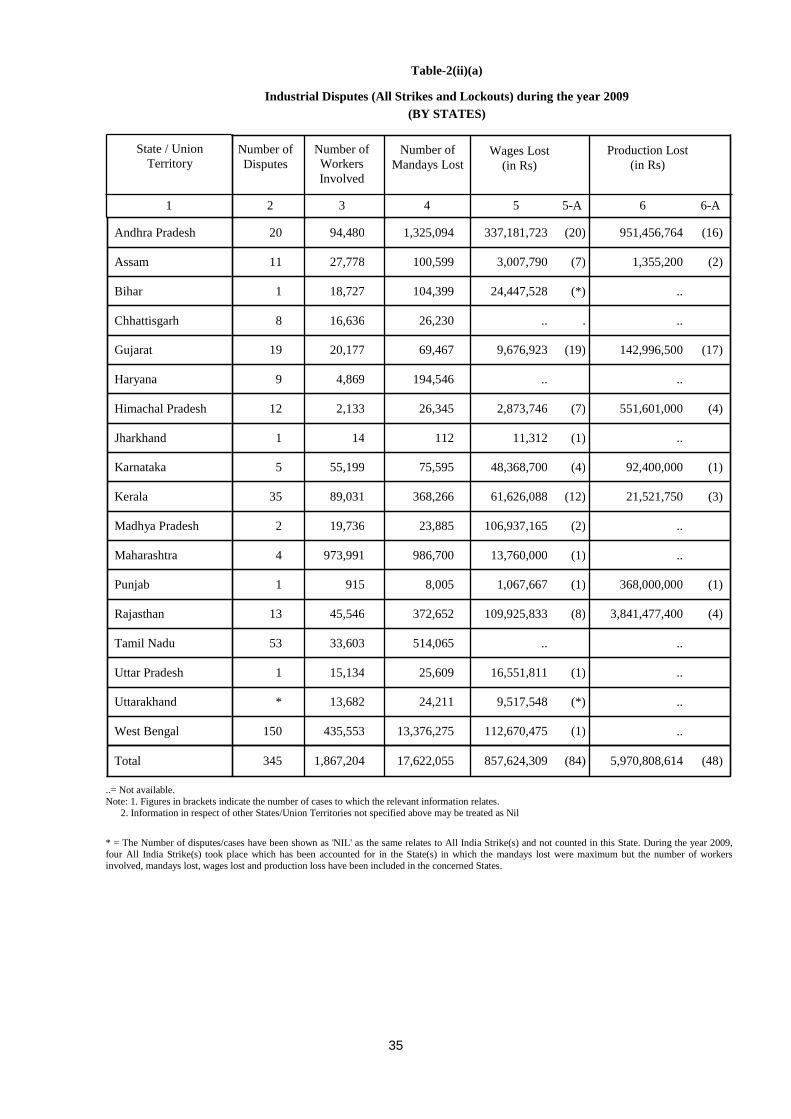
35
Andhra Pradesh 20 94,480 1,325,094 337,181,723 (20) 951,456,764 (16)
Assam 11 27,778 100,599 3,007,790 (7) 1,355,200 (2)
Bihar 1 18,727 104,399 24,447,528 (*) ..
Chhattisgarh 8 16,636 26,230 .. . ..
Gujarat 19 20,177 69,467 9,676,923 (19) 142,996,500 (17)
Haryana 9 4,869 194,546 .. ..
Himachal Pradesh 12 2,133 26,345 2,873,746 (7) 551,601,000 (4)
Jharkhand 1 14 112 11,312 (1) ..
Karnataka 5 55,199 75,595 48,368,700 (4) 92,400,000 (1)
Kerala 35 89,031 368,266 61,626,088 (12) 21,521,750 (3)
Madhya Pradesh 2 19,736 23,885 106,937,165 (2) ..
Maharashtra 4 973,991 986,700 13,760,000 (1) ..
Punjab 1 915 8,005 1,067,667 (1) 368,000,000 (1)
Rajasthan 13 45,546 372,652 109,925,833 (8) 3,841,477,400 (4)
Tamil Nadu 53 33,603 514,065 .. ..
Uttar Pradesh 1 15,134 25,609 16,551,811 (1) ..
Uttarakhand * 13,682 24,211 9,517,548 (*) ..
West Bengal 150 435,553 13,376,275 112,670,475 (1) ..
Total 345 1,867,204 17,622,055 857,624,309 (84) 5,970,808,614 (48)
Production Lost (in Rs)
Wages Lost (in Rs)
Number of Mandays Lost
Number of Workers Involved
Number of Disputes
Industrial Disputes (All Strikes and Lockouts) during the year 2009 Table-2(ii)(a)
(BY STATES)
State / Union Territory
6-A 6 5-A 5 4 3 2 1
..= Not available. Note: 1. Figures in brackets indicate the number of cases to which the relevant information relates. 2. Information in respect of other States/Union Territories not specified above may be treated as Nil * = The Number of disputes/cases have been shown as 'NIL' as the same relates to All India Strike(s) and not counted in this State. During the year 2009, four All India Strike(s) took place which has been accounted for in the State(s) in which the mandays lost were maximum but the number of workers involved, mandays lost, wages lost and production loss have been included in the concerned States.
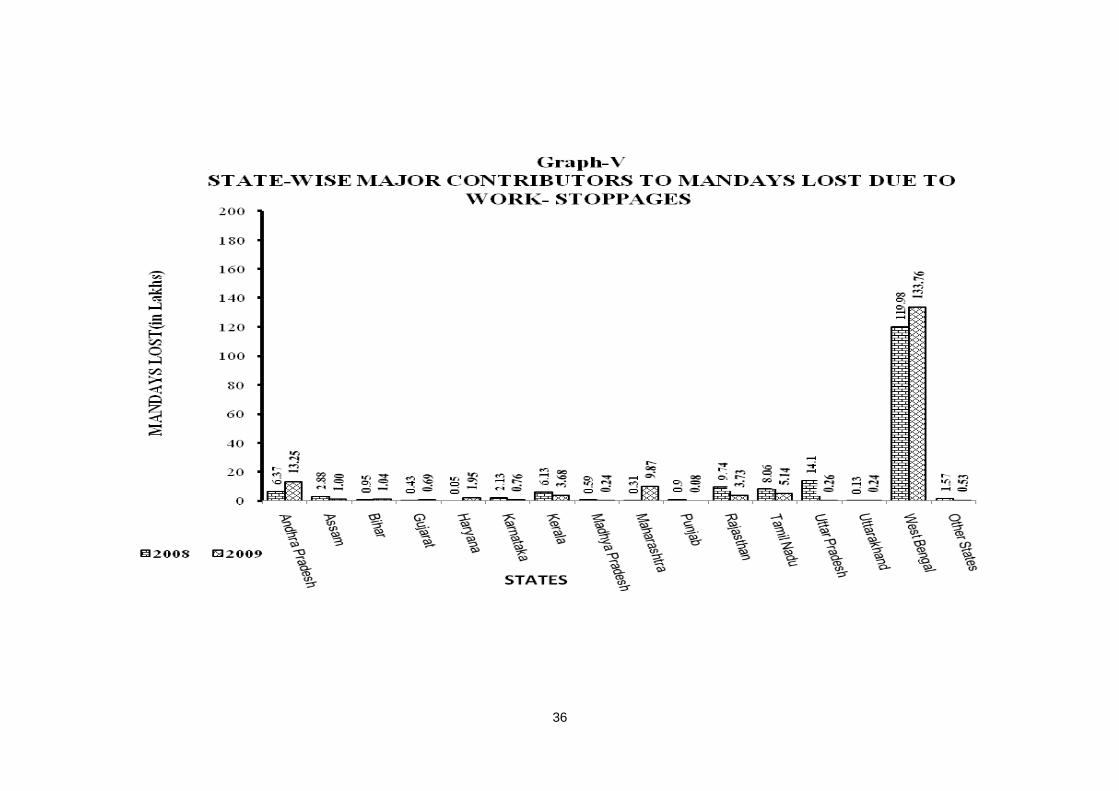
36
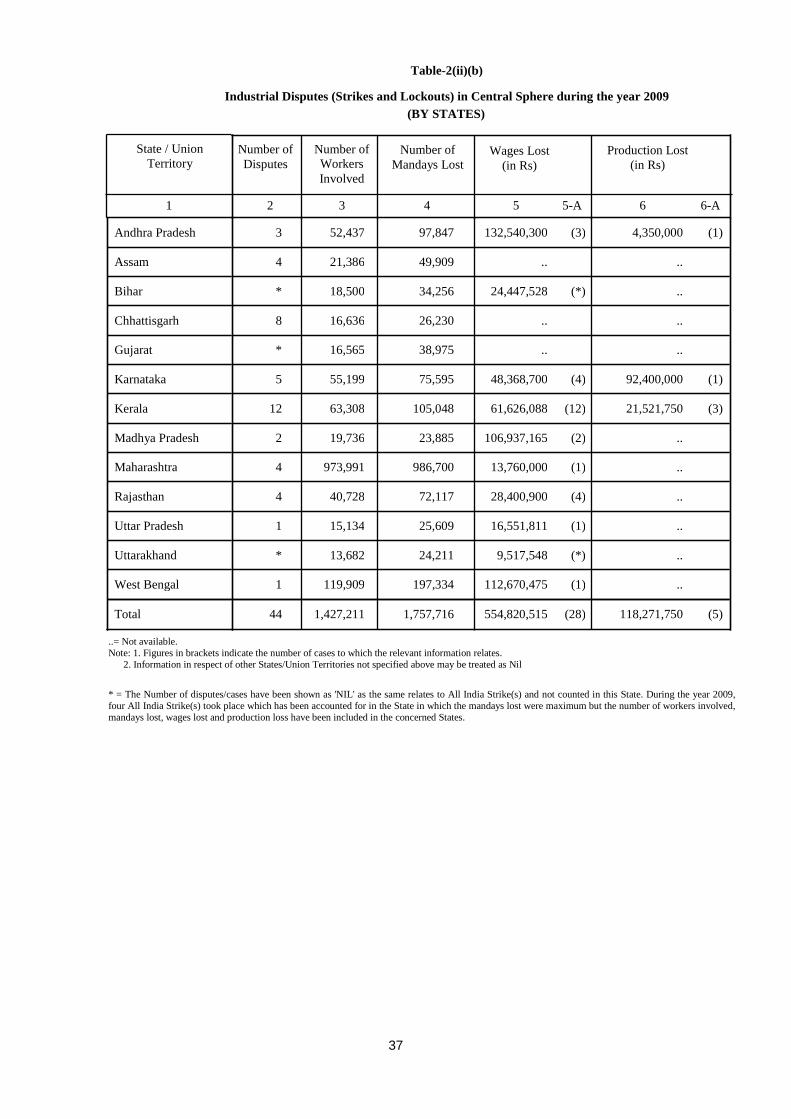
37
Andhra Pradesh 3 52,437 97,847 132,540,300 (3) 4,350,000 (1)
Assam 4 21,386 49,909 .. ..
Bihar * 18,500 34,256 24,447,528 (*) ..
Chhattisgarh 8 16,636 26,230 .. ..
Gujarat * 16,565 38,975 .. ..
Karnataka 5 55,199 75,595 48,368,700 (4) 92,400,000 (1)
Kerala 12 63,308 105,048 61,626,088 (12) 21,521,750 (3)
Madhya Pradesh 2 19,736 23,885 106,937,165 (2) ..
Maharashtra 4 973,991 986,700 13,760,000 (1) ..
Rajasthan 4 40,728 72,117 28,400,900 (4) ..
Uttar Pradesh 1 15,134 25,609 16,551,811 (1) ..
Uttarakhand * 13,682 24,211 9,517,548 (*) ..
West Bengal 1 119,909 197,334 112,670,475 (1) ..
Total 44 1,427,211 1,757,716 554,820,515 (28) 118,271,750 (5)
Production Lost (in Rs)
Wages Lost (in Rs)
Number of Mandays Lost
Number of Workers Involved
Number of Disputes
Industrial Disputes (Strikes and Lockouts) in Central Sphere during the year 2009 Table-2(ii)(b)
(BY STATES)
State / Union Territory
6-A 6 5-A 5 4 3 2 1
..= Not available. Note: 1. Figures in brackets indicate the number of cases to which the relevant information relates. 2. Information in respect of other States/Union Territories not specified above may be treated as Nil * = The Number of disputes/cases have been shown as 'NIL' as the same relates to All India Strike(s) and not counted in this State. During the year 2009, four All India Strike(s) took place which has been accounted for in the State in which the mandays lost were maximum but the number of workers involved, mandays lost, wages lost and production loss have been included in the concerned States.
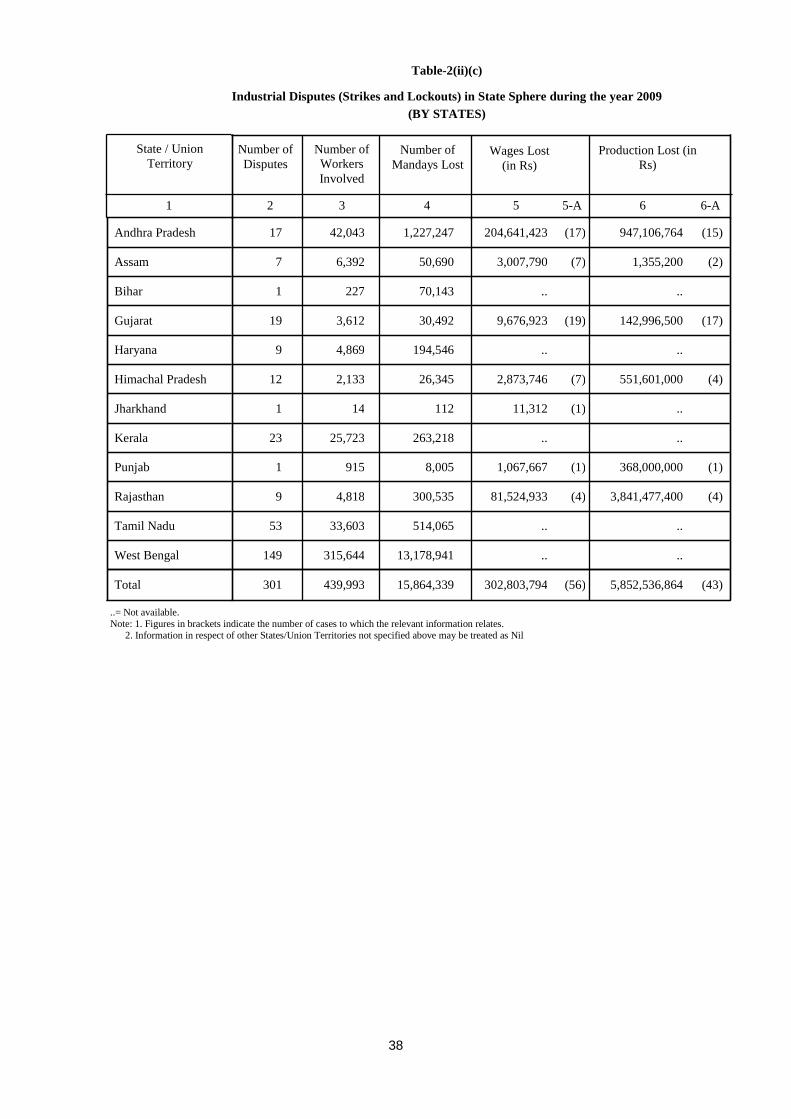
38
Andhra Pradesh 17 42,043 1,227,247 204,641,423 (17) 947,106,764 (15)
Assam 7 6,392 50,690 3,007,790 (7) 1,355,200 (2)
Bihar 1 227 70,143 .. ..
Gujarat 19 3,612 30,492 9,676,923 (19) 142,996,500 (17)
Haryana 9 4,869 194,546 .. ..
Himachal Pradesh 12 2,133 26,345 2,873,746 (7) 551,601,000 (4)
Jharkhand 1 14 112 11,312 (1) ..
Kerala 23 25,723 263,218 .. ..
Punjab 1 915 8,005 1,067,667 (1) 368,000,000 (1)
Rajasthan 9 4,818 300,535 81,524,933 (4) 3,841,477,400 (4)
Tamil Nadu 53 33,603 514,065 .. ..
West Bengal 149 315,644 13,178,941 .. ..
Total 301 439,993 15,864,339 302,803,794 (56) 5,852,536,864 (43)
Production Lost (in Rs)
Wages Lost (in Rs)
Number of Mandays Lost
Number of Workers Involved
Number of Disputes
Industrial Disputes (Strikes and Lockouts) in State Sphere during the year 2009 Table-2(ii)(c)
(BY STATES)
State / Union Territory
6-A 6 5-A 5 4 3 2 1
..= Not available. Note: 1. Figures in brackets indicate the number of cases to which the relevant information relates. 2. Information in respect of other States/Union Territories not specified above may be treated as Nil
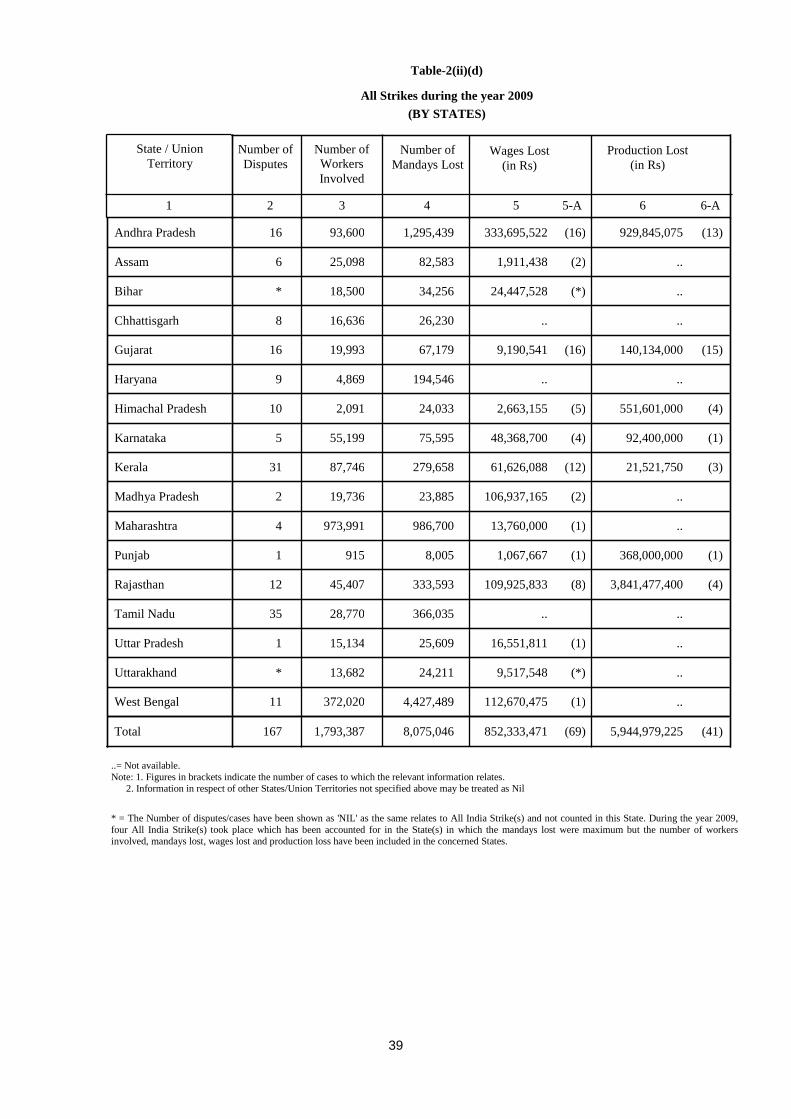
39
Andhra Pradesh 16 93,600 1,295,439 333,695,522 (16) 929,845,075 (13)
Assam 6 25,098 82,583 1,911,438 (2) ..
Bihar * 18,500 34,256 24,447,528 (*) ..
Chhattisgarh 8 16,636 26,230 .. ..
Gujarat 16 19,993 67,179 9,190,541 (16) 140,134,000 (15)
Haryana 9 4,869 194,546 .. ..
Himachal Pradesh 10 2,091 24,033 2,663,155 (5) 551,601,000 (4)
Karnataka 5 55,199 75,595 48,368,700 (4) 92,400,000 (1)
Kerala 31 87,746 279,658 61,626,088 (12) 21,521,750 (3)
Madhya Pradesh 2 19,736 23,885 106,937,165 (2) ..
Maharashtra 4 973,991 986,700 13,760,000 (1) ..
Punjab 1 915 8,005 1,067,667 (1) 368,000,000 (1)
Rajasthan 12 45,407 333,593 109,925,833 (8) 3,841,477,400 (4)
Tamil Nadu 35 28,770 366,035 .. ..
Uttar Pradesh 1 15,134 25,609 16,551,811 (1) ..
Uttarakhand * 13,682 24,211 9,517,548 (*) ..
West Bengal 11 372,020 4,427,489 112,670,475 (1) ..
Total 167 1,793,387 8,075,046 852,333,471 (69) 5,944,979,225 (41)
Production Lost (in Rs)
Wages Lost (in Rs)
Number of Mandays Lost
Number of Workers Involved
Number of Disputes
All Strikes during the year 2009 Table-2(ii)(d)
(BY STATES)
State / Union Territory
6-A 6 5-A 5 4 3 2 1
..= Not available. Note: 1. Figures in brackets indicate the number of cases to which the relevant information relates. 2. Information in respect of other States/Union Territories not specified above may be treated as Nil * = The Number of disputes/cases have been shown as 'NIL' as the same relates to All India Strike(s) and not counted in this State. During the year 2009, four All India Strike(s) took place which has been accounted for in the State(s) in which the mandays lost were maximum but the number of workers involved, mandays lost, wages lost and production loss have been included in the concerned States.
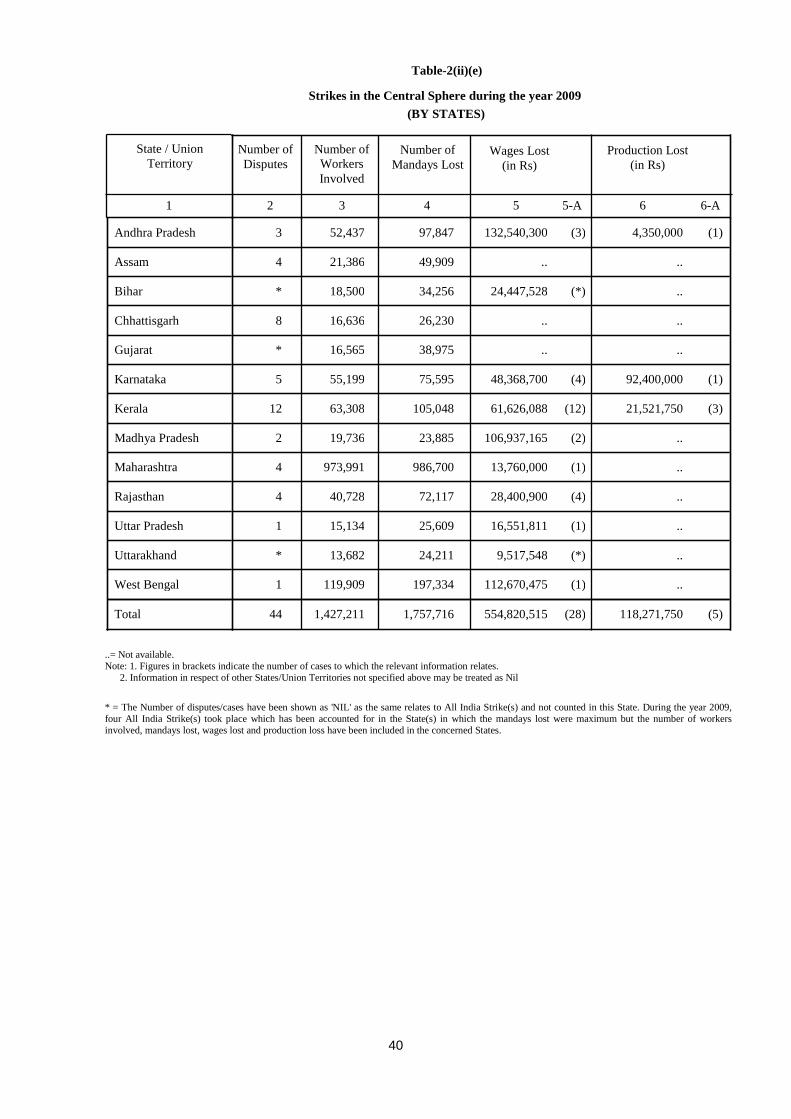
40
Andhra Pradesh 3 52,437 97,847 132,540,300 (3) 4,350,000 (1)
Assam 4 21,386 49,909 .. ..
Bihar * 18,500 34,256 24,447,528 (*) ..
Chhattisgarh 8 16,636 26,230 .. ..
Gujarat * 16,565 38,975 .. ..
Karnataka 5 55,199 75,595 48,368,700 (4) 92,400,000 (1)
Kerala 12 63,308 105,048 61,626,088 (12) 21,521,750 (3)
Madhya Pradesh 2 19,736 23,885 106,937,165 (2) ..
Maharashtra 4 973,991 986,700 13,760,000 (1) ..
Rajasthan 4 40,728 72,117 28,400,900 (4) ..
Uttar Pradesh 1 15,134 25,609 16,551,811 (1) ..
Uttarakhand * 13,682 24,211 9,517,548 (*) ..
West Bengal 1 119,909 197,334 112,670,475 (1) ..
Total 44 1,427,211 1,757,716 554,820,515 (28) 118,271,750 (5)
Production Lost (in Rs)
Wages Lost (in Rs)
Number of Mandays Lost
Number of Workers Involved
Number of Disputes
Strikes in the Central Sphere during the year 2009 Table-2(ii)(e)
(BY STATES)
State / Union Territory
6-A 6 5-A 5 4 3 2 1
..= Not available. Note: 1. Figures in brackets indicate the number of cases to which the relevant information relates. 2. Information in respect of other States/Union Territories not specified above may be treated as Nil * = The Number of disputes/cases have been shown as 'NIL' as the same relates to All India Strike(s) and not counted in this State. During the year 2009, four All India Strike(s) took place which has been accounted for in the State(s) in which the mandays lost were maximum but the number of workers involved, mandays lost, wages lost and production loss have been included in the concerned States.

41
Andhra Pradesh 13 41,163 1,197,592 201,155,222 (13) 925,495,075 (12)
Assam 2 3,712 32,674 1,911,438 (2) ..
Gujarat 16 3,428 28,204 9,190,541 (16) 140,134,000 (15)
Haryana 9 4,869 194,546 .. ..
Himachal Pradesh 10 2,091 24,033 2,663,155 (5) 551,601,000 (4)
Kerala 19 24,438 174,610 .. ..
Punjab 1 915 8,005 1,067,667 (1) 368,000,000 (1)
Rajasthan 8 4,679 261,476 81,524,933 (4) 3,841,477,400 (4)
Tamil Nadu 35 28,770 366,035 .. ..
West Bengal 10 252,111 4,030,155 .. ..
Total 123 366,176 6,317,330 297,512,956 (41) 5,826,707,475 (36)
Production Lost (in Rs)
Wages Lost (in Rs)
Number of Mandays Lost
Number of Workers Involved
Number of Disputes
Strikes in the State Sphere during the year 2009 Table-2(ii)(f)
(BY STATES)
State / Union Territory
6-A 6 5-A 5 4 3 2 1
..= Not available. Note: 1. Figures in brackets indicate the number of cases to which the relevant information relates. 2. Information in respect of other States/Union Territories not specified above may be treated as Nil
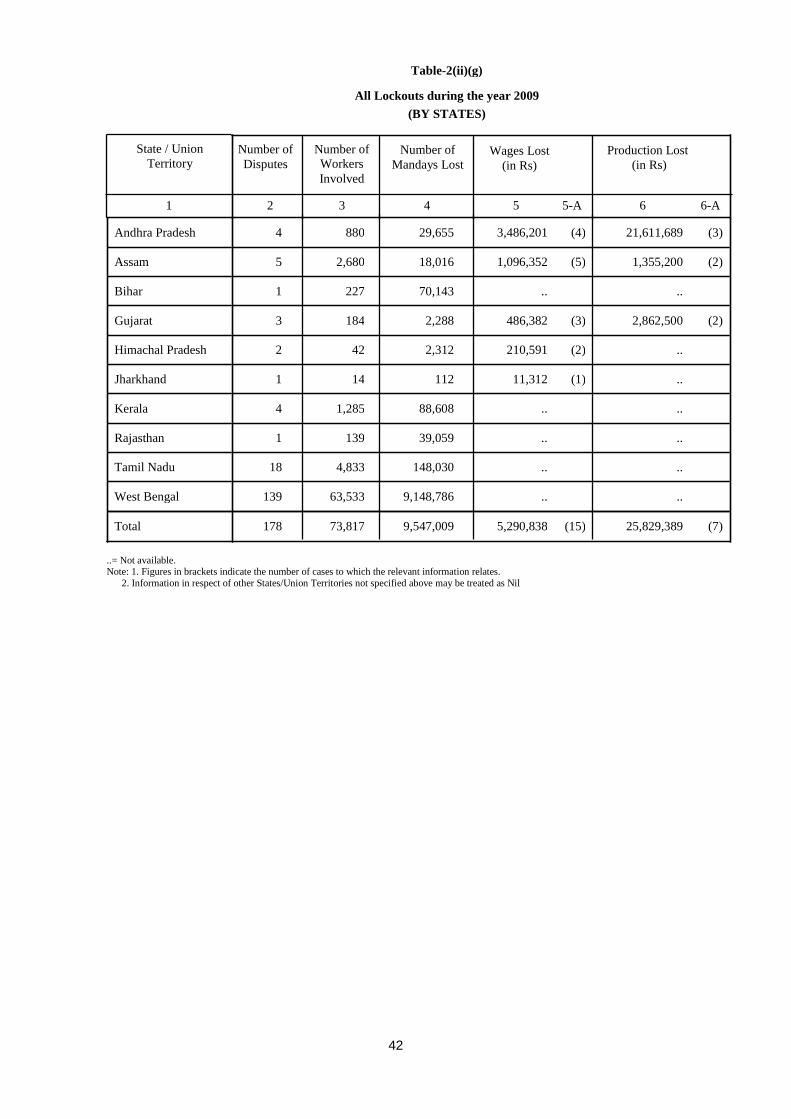
42
Andhra Pradesh 4 880 29,655 3,486,201 (4) 21,611,689 (3)
Assam 5 2,680 18,016 1,096,352 (5) 1,355,200 (2)
Bihar 1 227 70,143 .. ..
Gujarat 3 184 2,288 486,382 (3) 2,862,500 (2)
Himachal Pradesh 2 42 2,312 210,591 (2) ..
Jharkhand 1 14 112 11,312 (1) ..
Kerala 4 1,285 88,608 .. ..
Rajasthan 1 139 39,059 .. ..
Tamil Nadu 18 4,833 148,030 .. ..
West Bengal 139 63,533 9,148,786 .. ..
Total 178 73,817 9,547,009 5,290,838 (15) 25,829,389 (7)
Production Lost (in Rs)
Wages Lost (in Rs)
Number of Mandays Lost
Number of Workers Involved
Number of Disputes
All Lockouts during the year 2009 Table-2(ii)(g)
(BY STATES)
State / Union Territory
6-A 6 5-A 5 4 3 2 1
..= Not available. Note: 1. Figures in brackets indicate the number of cases to which the relevant information relates. 2. Information in respect of other States/Union Territories not specified above may be treated as Nil
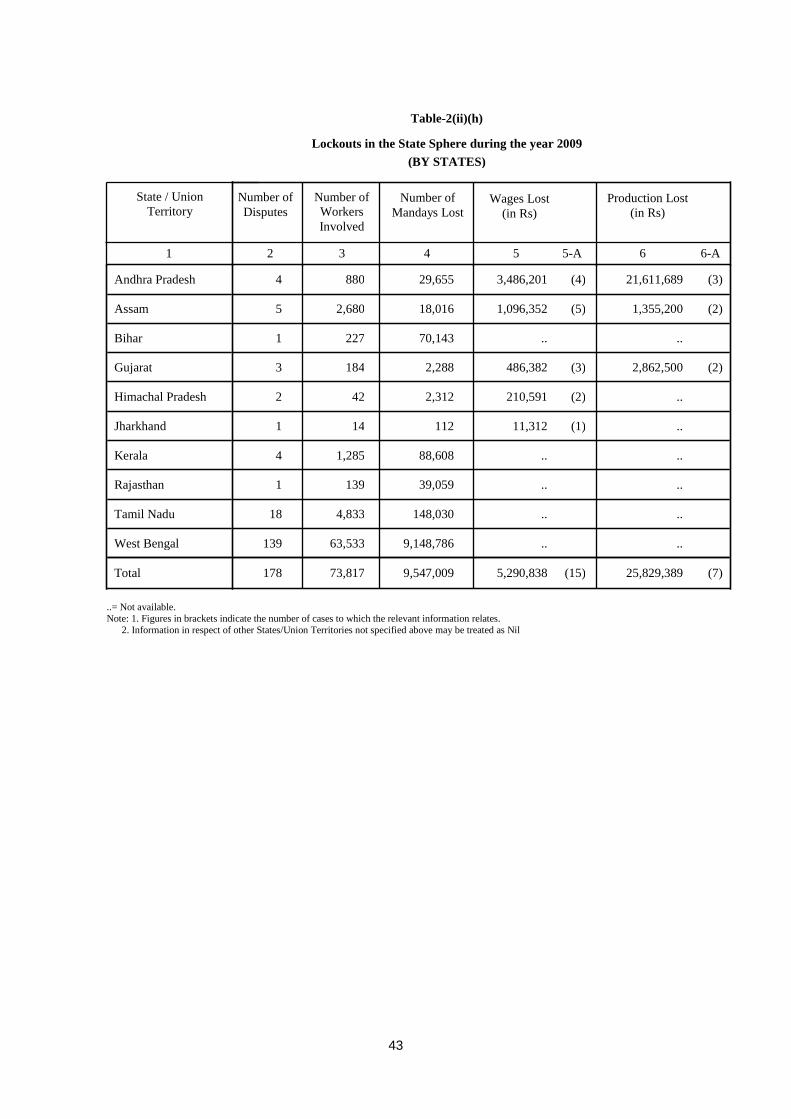
43
Andhra Pradesh 4 880 29,655 3,486,201 (4) 21,611,689 (3)
Assam 5 2,680 18,016 1,096,352 (5) 1,355,200 (2)
Bihar 1 227 70,143 .. ..
Gujarat 3 184 2,288 486,382 (3) 2,862,500 (2)
Himachal Pradesh 2 42 2,312 210,591 (2) ..
Jharkhand 1 14 112 11,312 (1) ..
Kerala 4 1,285 88,608 .. ..
Rajasthan 1 139 39,059 .. ..
Tamil Nadu 18 4,833 148,030 .. ..
West Bengal 139 63,533 9,148,786 .. ..
Total 178 73,817 9,547,009 5,290,838 (15) 25,829,389 (7)
Production Lost (in Rs)
Wages Lost (in Rs)
Number of Mandays Lost
Number of Workers Involved
Number of Disputes
Lockouts in the State Sphere during the year 2009 Table-2(ii)(h)
(BY STATES)
State / Union Territory
6-A 6 5-A 5 4 3 2 1
..= Not available. Note: 1. Figures in brackets indicate the number of cases to which the relevant information relates. 2. Information in respect of other States/Union Territories not specified above may be treated as Nil
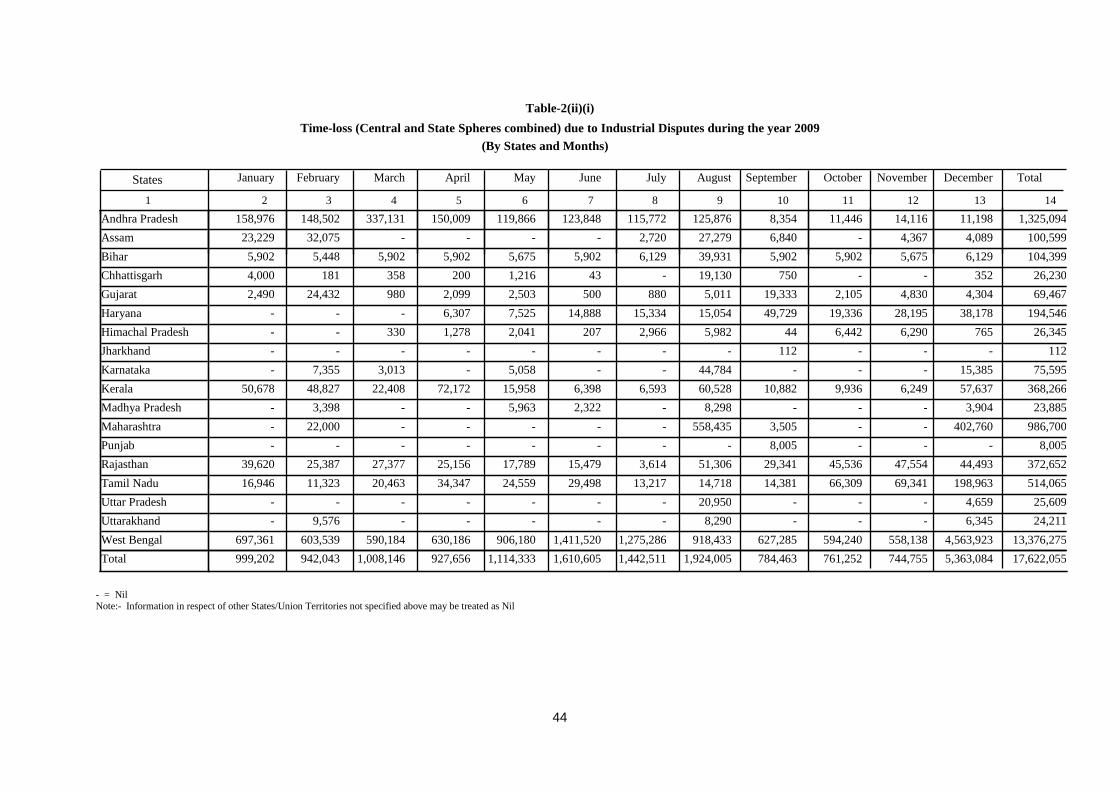
44
- = Nil Note:- Information in respect of other States/Union Territories not specified above may be treated as Nil
January February March April May June July August September October November December Total
Andhra Pradesh 158,976 148,502 337,131 150,009 119,866 123,848 115,772 125,876 8,354 11,446 14,116 11,198 1,325,094 Assam 23,229 32,075 - - - - 2,720 27,279 6,840 - 4,367 4,089 100,599 Bihar 5,902 5,448 5,902 5,902 5,675 5,902 6,129 39,931 5,902 5,902 5,675 6,129 104,399 Chhattisgarh 4,000 181 358 200 1,216 43 - 19,130 750 - - 352 26,230 Gujarat 2,490 24,432 980 2,099 2,503 500 880 5,011 19,333 2,105 4,830 4,304 69,467 Haryana -
- - 6,307 7,525 14,888 15,334 15,054 49,729 19,336 28,195 38,178 194,546
Himachal Pradesh - - 330 1,278 2,041 207 2,966 5,982 44 6,442 6,290 765 26,345 Jharkhand - - - - - - - - 112 - - - 112 Karnataka - 7,355 3,013 - 5,058 - - 44,784 - - - 15,385 75,595 Kerala 50,678 48,827 22,408 72,172 15,958 6,398 6,593 60,528 10,882 9,936 6,249 57,637 368,266 Madhya Pradesh - 3,398 - - 5,963 2,322 - 8,298 - - - 3,904 23,885 Maharashtra - 22,000 - - - - - 558,435 3,505 - - 402,760 986,700 Punjab - - - - - - - - 8,005 - - - 8,005 Rajasthan 39,620 25,387 27,377 25,156 17,789 15,479 3,614 51,306 29,341 45,536 47,554 44,493 372,652 Tamil Nadu 16,946 11,323 20,463 34,347 24,559 29,498 13,217 14,718 14,381 66,309 69,341 198,963 514,065 Uttar Pradesh - - - - - - - 20,950 - - - 4,659 25,609 Uttarakhand - 9,576 - - - - - 8,290 - - - 6,345 24,211 West Bengal 697,361 603,539 590,184 630,186 906,180 1,411,520 1,275,286 918,433 627,285 594,240 558,138 4,563,923 13,376,275 Total 999,202 942,043 1,008,146 927,656 1,114,333 1,610,605 1,442,511 1,924,005 784,463 761,252 744,755 5,363,084 17,622,055
Time-loss (Central and State Spheres combined) due to Industrial Disputes during the year 2009
States
Table-2(ii)(i)
(By States and Months)
2 1 3 4 5 6 7 8 9 10 11 12 13 14
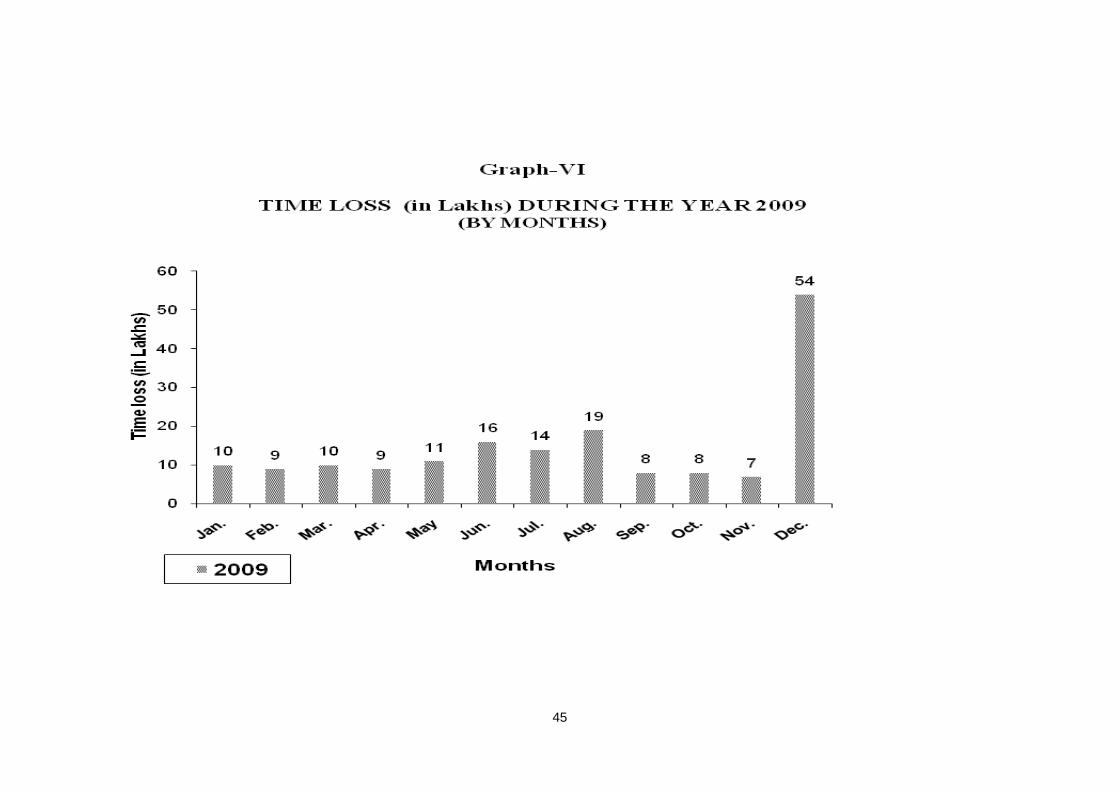
45
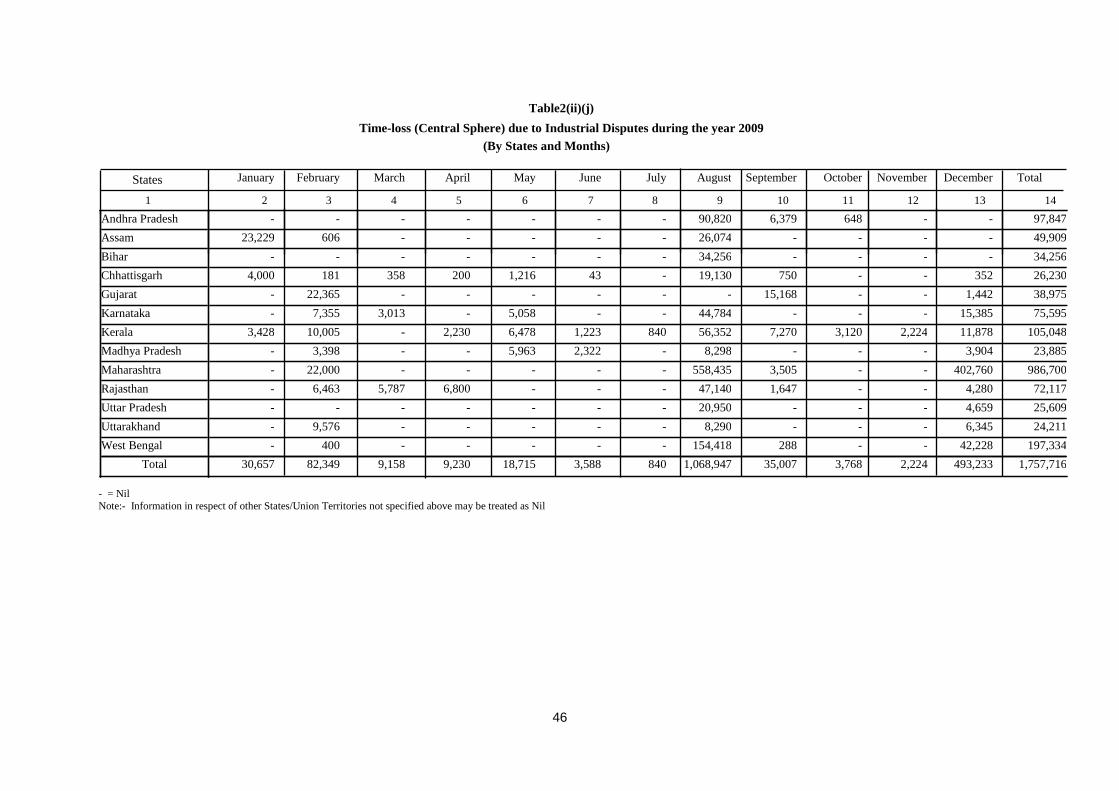
46
- = Nil Note:- Information in respect of other States/Union Territories not specified above may be treated as Nil
January February March April May June July August September October November December Total
Andhra Pradesh - - - - - - - 90,820 6,379 648 - - 97,847 Assam 23,229 606 - - - - - 26,074 - - - - 49,909 Bihar - - - - - - - 34,256 - - - - 34,256 Chhattisgarh 4,000 181 358 200 1,216 43 - 19,130 750 - - 352 26,230 Gujarat - 22,365 - - - - - - 15,168 - - 1,442 38,975 Karnataka - 7,355 3,013 - 5,058 - - 44,784 - - - 15,385 75,595 Kerala 3,428 10,005 - 2,230 6,478 1,223 840 56,352 7,270 3,120 2,224 11,878 105,048 Madhya Pradesh - 3,398 - - 5,963 2,322 - 8,298 - - - 3,904 23,885 Maharashtra - 22,000 - - - - - 558,435 3,505 - - 402,760 986,700 Rajasthan - 6,463 5,787 6,800 - - - 47,140 1,647 - - 4,280 72,117 Uttar Pradesh - - - - - - - 20,950 - - - 4,659 25,609 Uttarakhand - 9,576 - - - - - 8,290 - - - 6,345 24,211 West Bengal - 400 - - - - - 154,418 288 - - 42,228 197,334
Total 30,657 82,349 9,158 9,230 18,715 3,588 840 1,068,947 35,007 3,768 2,224 493,233 1,757,716
Time-loss (Central Sphere) due to Industrial Disputes during the year 2009
States
Table2(ii)(j)
(By States and Months)
2 1 3 4 5 6 7 8 9 10 11 12 13 14
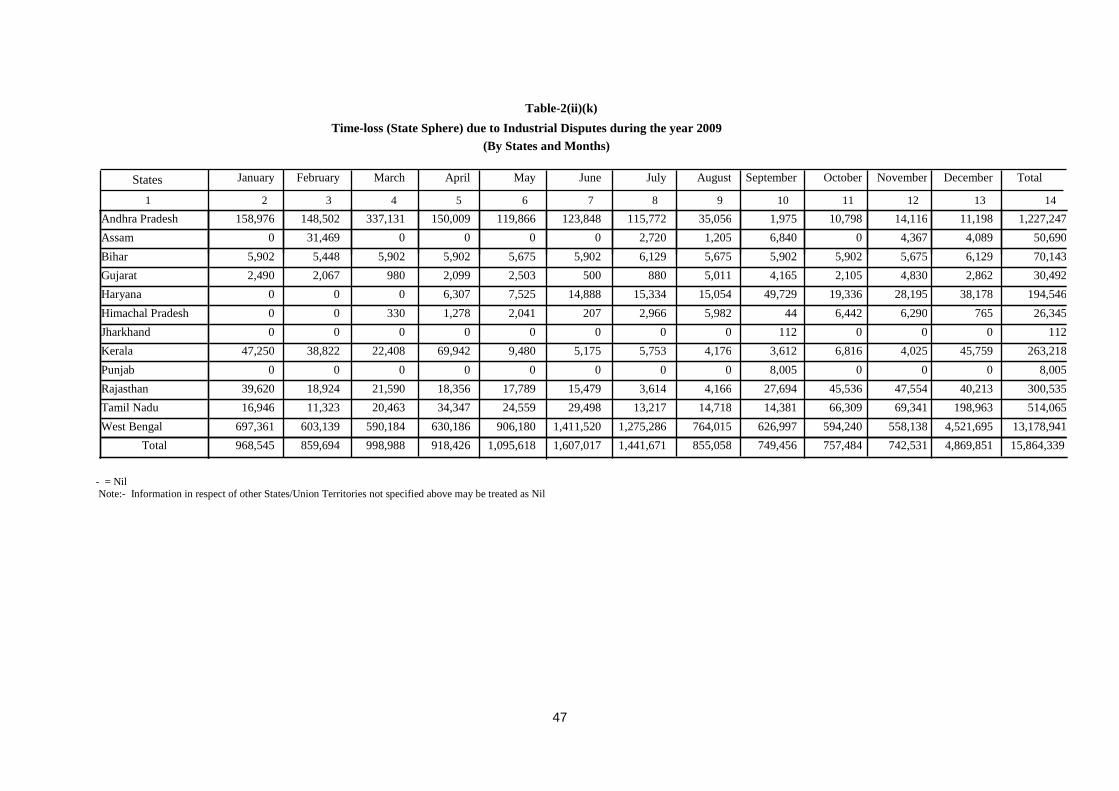
47
- = Nil Note:- Information in respect of other States/Union Territories not specified above may be treated as Nil
January February March April May June July August September October November December Total
Andhra Pradesh 158,976 148,502 337,131 150,009 119,866 123,848 115,772 35,056 1,975 10,798 14,116 11,198 1,227,247 Assam 0 31,469 0 0 0 0 2,720 1,205 6,840 0 4,367 4,089 50,690 Bihar 5,902 5,448 5,902 5,902 5,675 5,902 6,129 5,675 5,902 5,902 5,675 6,129 70,143 Gujarat 2,490 2,067 980 2,099 2,503 500 880 5,011 4,165 2,105 4,830 2,862 30,492 Haryana 0 0 0 6,307 7,525 14,888 15,334 15,054 49,729 19,336 28,195 38,178 194,546 Himachal Pradesh 0 0 330 1,278 2,041 207 2,966 5,982 44 6,442 6,290 765 26,345 Jharkhand 0 0 0 0 0 0 0 0 112 0 0 0 112 Kerala 47,250 38,822 22,408 69,942 9,480 5,175 5,753 4,176 3,612 6,816 4,025 45,759 263,218 Punjab 0 0 0 0 0 0 0 0 8,005 0 0 0 8,005 Rajasthan 39,620 18,924 21,590 18,356 17,789 15,479 3,614 4,166 27,694 45,536 47,554 40,213 300,535 Tamil Nadu 16,946 11,323 20,463 34,347 24,559 29,498 13,217 14,718 14,381 66,309 69,341 198,963 514,065 West Bengal 697,361 603,139 590,184 630,186 906,180 1,411,520 1,275,286 764,015 626,997 594,240 558,138 4,521,695 13,178,941
Total 968,545 859,694 998,988 918,426 1,095,618 1,607,017 1,441,671 855,058 749,456 757,484 742,531 4,869,851 15,864,339
Time-loss (State Sphere) due to Industrial Disputes during the year 2009
States
Table-2(ii)(k)
(By States and Months)
2 1 3 4 5 6 7 8 9 10 11 12 13 14
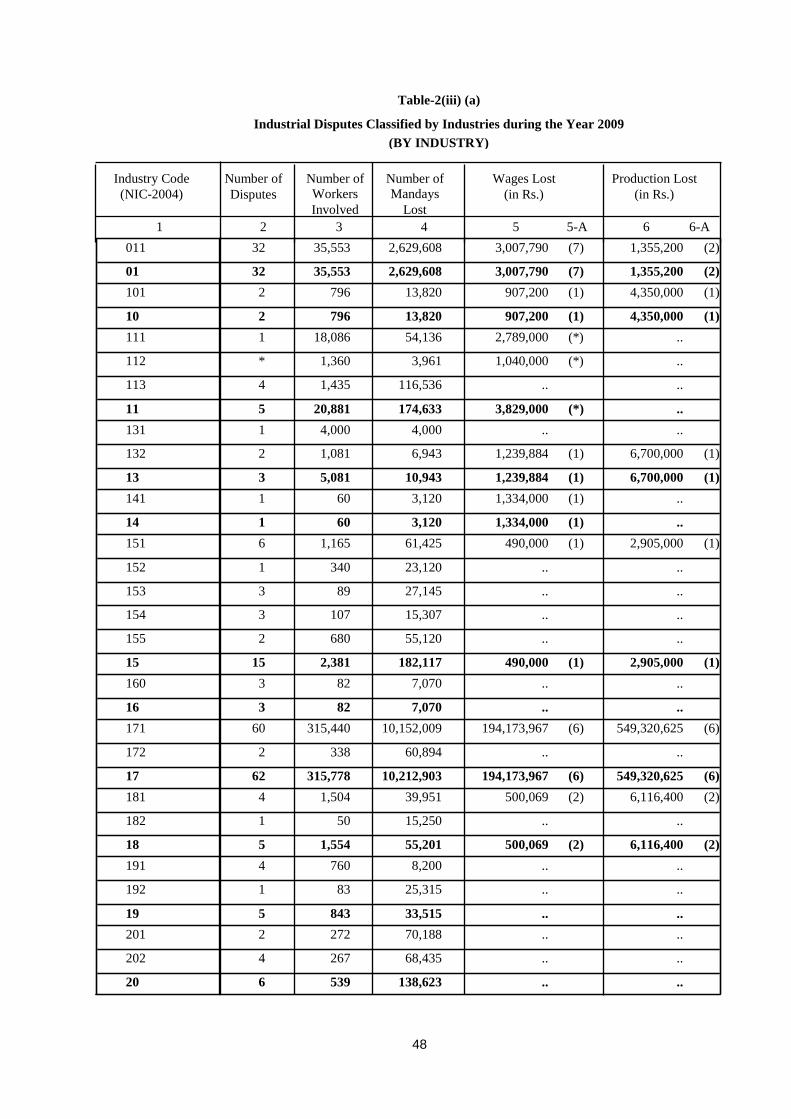
48
011 32 35,553 2,629,608 3,007,790 (7) 1,355,200 (2)
01 32 35,553 2,629,608 3,007,790 (7) 1,355,200 (2) 101 2 796 13,820 907,200 (1) 4,350,000 (1)
10 2 796 13,820 907,200 (1) 4,350,000 (1) 111 1 18,086 54,136 2,789,000 (*) ..
112 * 1,360 3,961 1,040,000 (*) ..
113 4 1,435 116,536 .. ..
11 5 20,881 174,633 3,829,000 (*) .. 131 1 4,000 4,000 .. ..
132 2 1,081 6,943 1,239,884 (1) 6,700,000 (1)
13 3 5,081 10,943 1,239,884 (1) 6,700,000 (1) 141 1 60 3,120 1,334,000 (1) ..
14 1 60 3,120 1,334,000 (1) .. 151 6 1,165 61,425 490,000 (1) 2,905,000 (1)
152 1 340 23,120 .. ..
153 3 89 27,145 .. ..
154 3 107 15,307 .. ..
155 2 680 55,120 .. ..
15 15 2,381 182,117 490,000 (1) 2,905,000 (1) 160 3 82 7,070 .. ..
16 3 82 7,070 .. .. 171 60 315,440 10,152,009 194,173,967 (6) 549,320,625 (6)
172 2 338 60,894 .. ..
17 62 315,778 10,212,903 194,173,967 (6) 549,320,625 (6) 181 4 1,504 39,951 500,069 (2) 6,116,400 (2)
182 1 50 15,250 .. ..
18 5 1,554 55,201 500,069 (2) 6,116,400 (2) 191 4 760 8,200 .. ..
192 1 83 25,315 .. ..
19 5 843 33,515 .. .. 201 2 272 70,188 .. ..
202 4 267 68,435 .. ..
20 6 539 138,623 .. ..
Production Lost (in Rs.)
Wages Lost (in Rs.)
Number of Mandays
Lost
Number of Workers Involved
Number of Disputes
Industrial Disputes Classified by Industries during the Year 2009
Table-2(iii) (a)
(BY INDUSTRY)
Industry Code (NIC-2004)
6-A 6 5-A 5 4 3 2 1
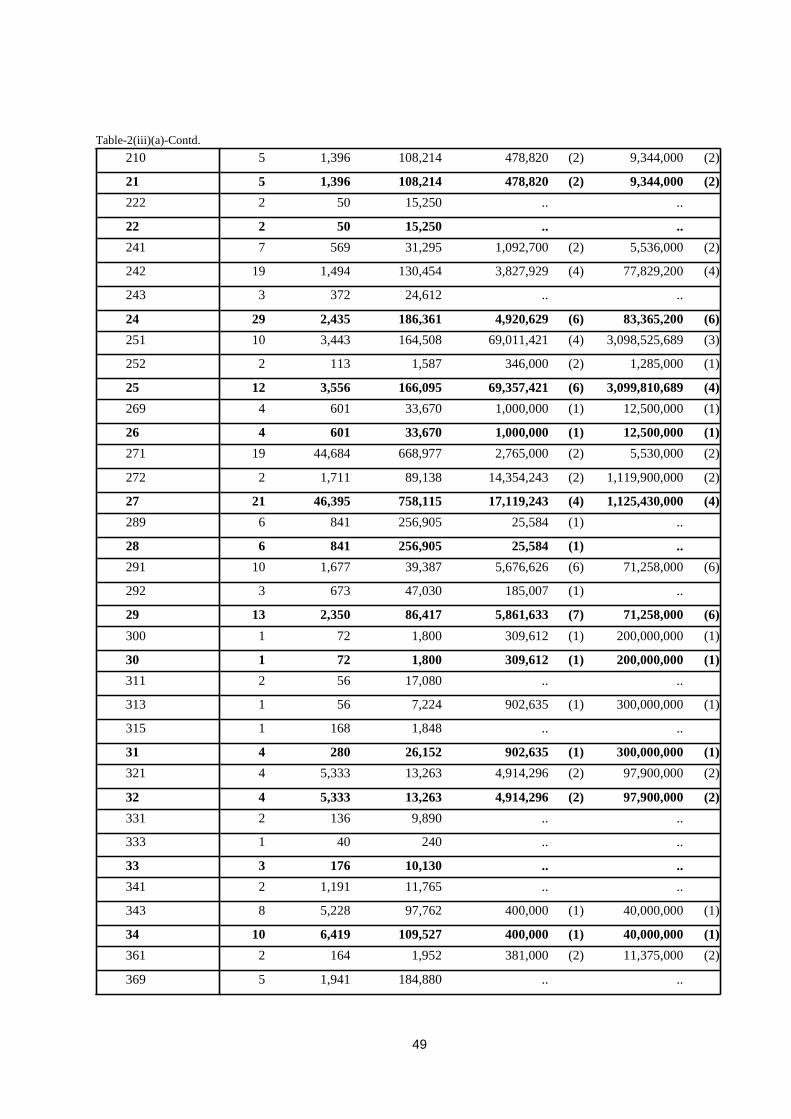
49
Table-2(iii)(a)-Contd.
210 5 1,396 108,214 478,820 (2) 9,344,000 (2)
21 5 1,396 108,214 478,820 (2) 9,344,000 (2) 222 2 50 15,250 .. ..
22 2 50 15,250 .. .. 241 7 569 31,295 1,092,700 (2) 5,536,000 (2)
242 19 1,494 130,454 3,827,929 (4) 77,829,200 (4)
243 3 372 24,612 .. ..
24 29 2,435 186,361 4,920,629 (6) 83,365,200 (6) 251 10 3,443 164,508 69,011,421 (4) 3,098,525,689 (3)
252 2 113 1,587 346,000 (2) 1,285,000 (1)
25 12 3,556 166,095 69,357,421 (6) 3,099,810,689 (4) 269 4 601 33,670 1,000,000 (1) 12,500,000 (1)
26 4 601 33,670 1,000,000 (1) 12,500,000 (1) 271 19 44,684 668,977 2,765,000 (2) 5,530,000 (2)
272 2 1,711 89,138 14,354,243 (2) 1,119,900,000 (2)
27 21 46,395 758,115 17,119,243 (4) 1,125,430,000 (4) 289 6 841 256,905 25,584 (1) ..
28 6 841 256,905 25,584 (1) .. 291 10 1,677 39,387 5,676,626 (6) 71,258,000 (6)
292 3 673 47,030 185,007 (1) ..
29 13 2,350 86,417 5,861,633 (7) 71,258,000 (6) 300 1 72 1,800 309,612 (1) 200,000,000 (1)
30 1 72 1,800 309,612 (1) 200,000,000 (1) 311 2 56 17,080 .. ..
313 1 56 7,224 902,635 (1) 300,000,000 (1)
315 1 168 1,848 .. ..
31 4 280 26,152 902,635 (1) 300,000,000 (1) 321 4 5,333 13,263 4,914,296 (2) 97,900,000 (2)
32 4 5,333 13,263 4,914,296 (2) 97,900,000 (2) 331 2 136 9,890 .. ..
333 1 40 240 .. ..
33 3 176 10,130 .. .. 341 2 1,191 11,765 .. ..
343 8 5,228 97,762 400,000 (1) 40,000,000 (1)
34 10 6,419 109,527 400,000 (1) 40,000,000 (1) 361 2 164 1,952 381,000 (2) 11,375,000 (2)
369 5 1,941 184,880 .. ..
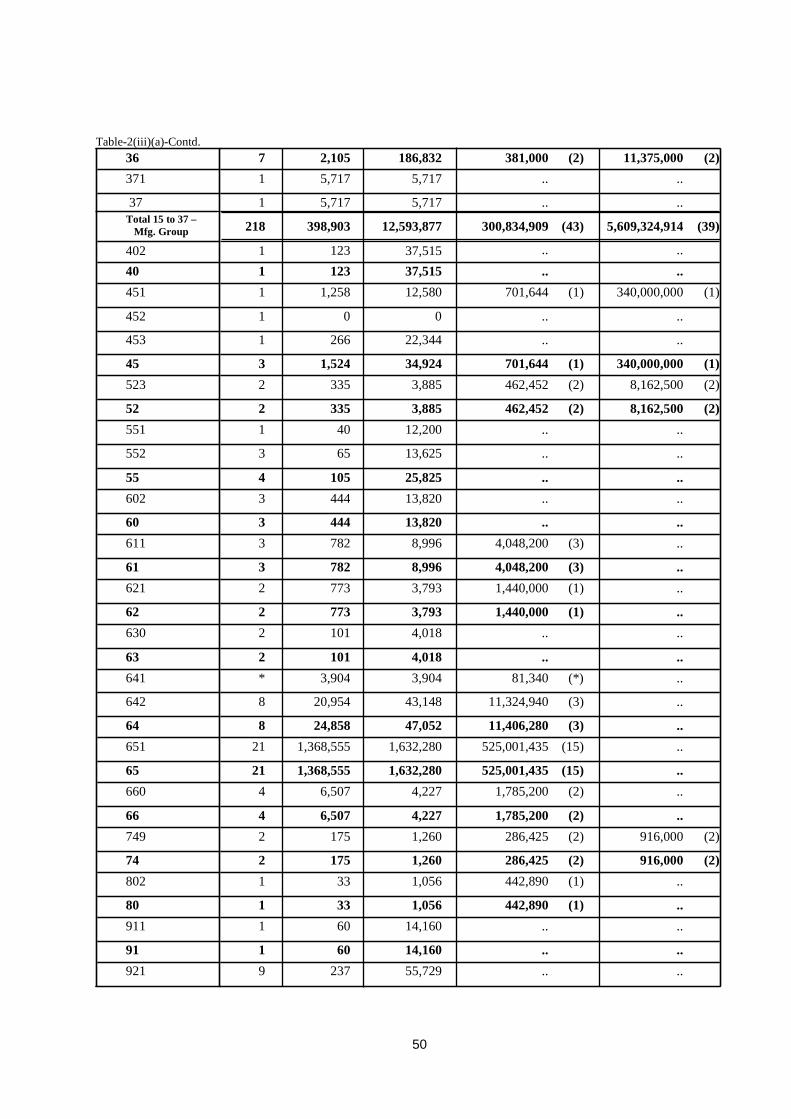
50
Table-2(iii)(a)-Contd.
36 7 2,105 186,832 381,000 (2) 11,375,000 (2) 371 1 5,717 5,717 .. ..
37 1 5,717 5,717 .. .. Total 15 to 37 –
Mfg. Group 218 398,903 12,593,877 300,834,909 (43) 5,609,324,914 (39)
402 1 123 37,515 .. .. 40 1 123 37,515 .. .. 451 1 1,258 12,580 701,644 (1) 340,000,000 (1)
452 1 0 0 .. ..
453 1 266 22,344 .. ..
45 3 1,524 34,924 701,644 (1) 340,000,000 (1) 523 2 335 3,885 462,452 (2) 8,162,500 (2)
52 2 335 3,885 462,452 (2) 8,162,500 (2) 551 1 40 12,200 .. ..
552 3 65 13,625 .. ..
55 4 105 25,825 .. .. 602 3 444 13,820 .. ..
60 3 444 13,820 .. .. 611 3 782 8,996 4,048,200 (3) ..
61 3 782 8,996 4,048,200 (3) .. 621 2 773 3,793 1,440,000 (1) ..
62 2 773 3,793 1,440,000 (1) .. 630 2 101 4,018 .. ..
63 2 101 4,018 .. .. 641 * 3,904 3,904 81,340 (*) ..
642 8 20,954 43,148 11,324,940 (3) ..
64 8 24,858 47,052 11,406,280 (3) .. 651 21 1,368,555 1,632,280 525,001,435 (15) ..
65 21 1,368,555 1,632,280 525,001,435 (15) .. 660 4 6,507 4,227 1,785,200 (2) ..
66 4 6,507 4,227 1,785,200 (2) .. 749 2 175 1,260 286,425 (2) 916,000 (2)
74 2 175 1,260 286,425 (2) 916,000 (2) 802 1 33 1,056 442,890 (1) ..
80 1 33 1,056 442,890 (1) .. 911 1 60 14,160 .. ..
91 1 60 14,160 .. .. 921 9 237 55,729 .. ..
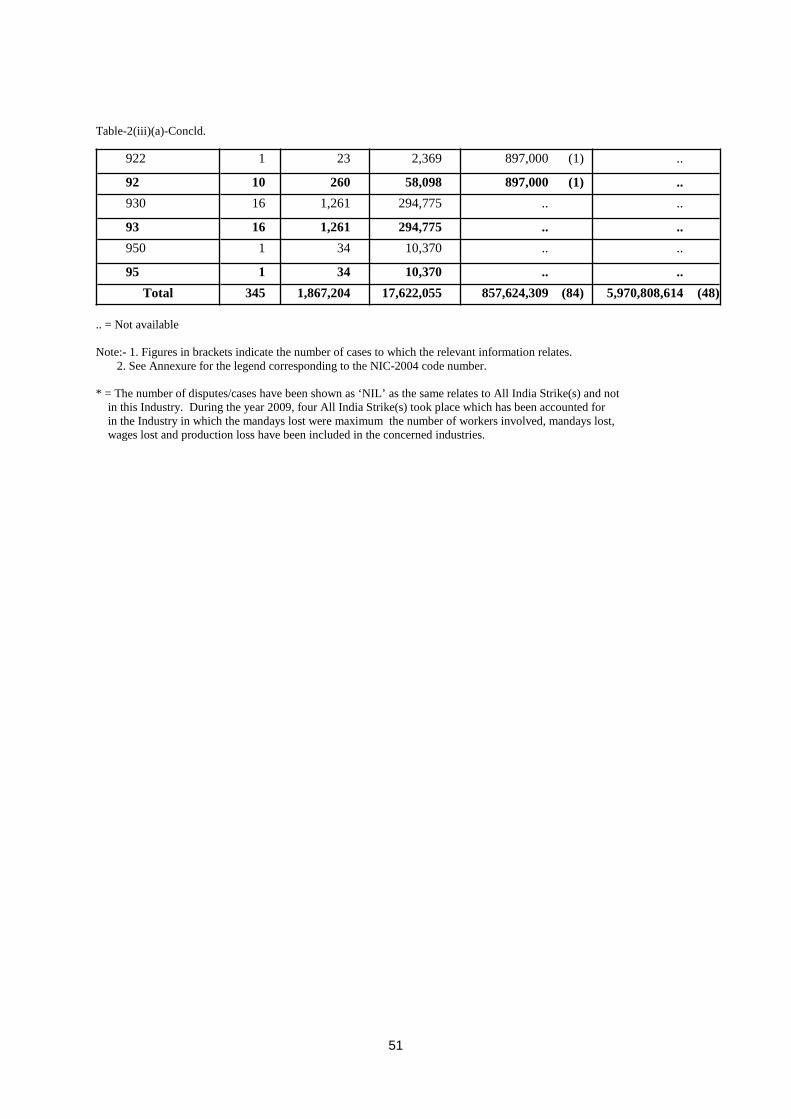
51
Table-2(iii)(a)-Concld.
.. = Not available
Note:- 1. Figures in brackets indicate the number of cases to which the relevant information relates. 2. See Annexure for the legend corresponding to the NIC-2004 code number. * = The number of disputes/cases have been shown as ‘NIL’ as the same relates to All India Strike(s) and not in this Industry. During the year 2009, four All India Strike(s) took place which has been accounted for in the Industry in which the mandays lost were maximum the number of workers involved, mandays lost, wages lost and production loss have been included in the concerned industries.
922 1 23 2,369 897,000 (1) ..
92 10 260 58,098 897,000 (1) .. 930 16 1,261 294,775 .. ..
93 16 1,261 294,775 .. .. 950 1 34 10,370 .. ..
95 1 34 10,370 .. .. Total 345 1,867,204 17,622,055 857,624,309 (84) 5,970,808,614 (48)
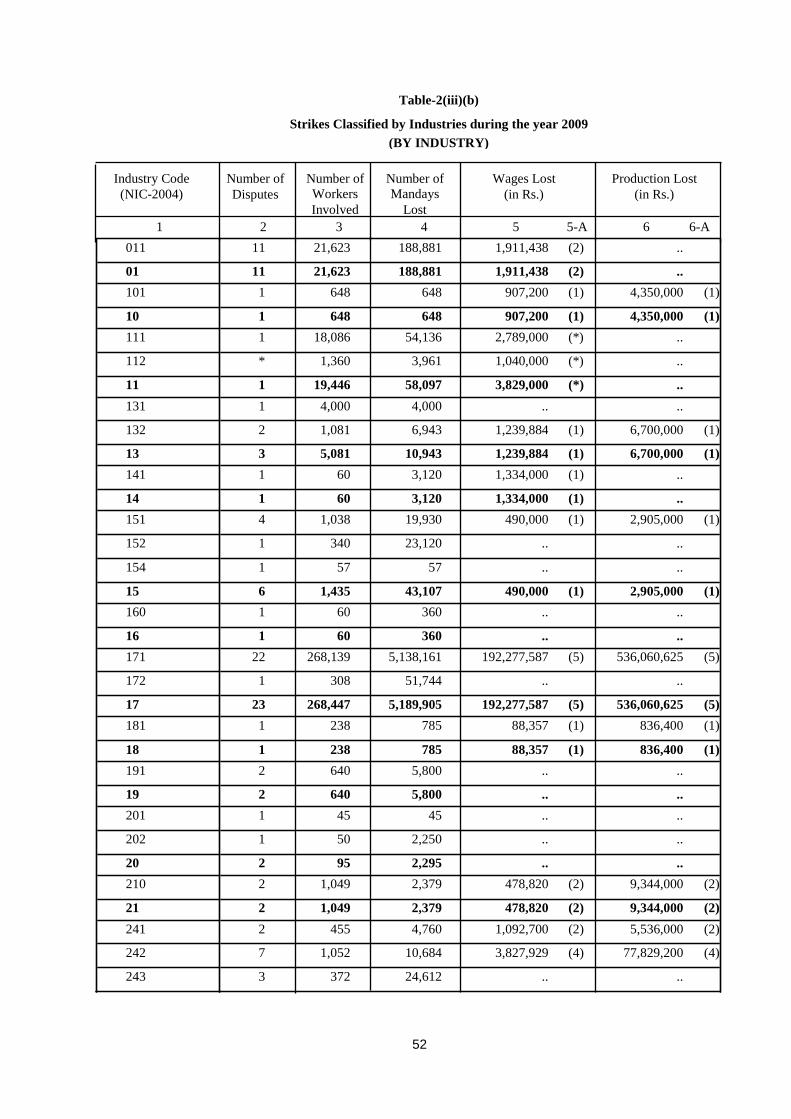
52
011 11 21,623 188,881 1,911,438 (2) ..
01 11 21,623 188,881 1,911,438 (2) .. 101 1 648 648 907,200 (1) 4,350,000 (1)
10 1 648 648 907,200 (1) 4,350,000 (1) 111 1 18,086 54,136 2,789,000 (*) ..
112 * 1,360 3,961 1,040,000 (*) ..
11 1 19,446 58,097 3,829,000 (*) .. 131 1 4,000 4,000 .. ..
132 2 1,081 6,943 1,239,884 (1) 6,700,000 (1)
13 3 5,081 10,943 1,239,884 (1) 6,700,000 (1) 141 1 60 3,120 1,334,000 (1) ..
14 1 60 3,120 1,334,000 (1) .. 151 4 1,038 19,930 490,000 (1) 2,905,000 (1)
152 1 340 23,120 .. ..
154 1 57 57 .. ..
15 6 1,435 43,107 490,000 (1) 2,905,000 (1) 160 1 60 360 .. ..
16 1 60 360 .. .. 171 22 268,139 5,138,161 192,277,587 (5) 536,060,625 (5)
172 1 308 51,744 .. ..
17 23 268,447 5,189,905 192,277,587 (5) 536,060,625 (5) 181 1 238 785 88,357 (1) 836,400 (1)
18 1 238 785 88,357 (1) 836,400 (1) 191 2 640 5,800 .. ..
19 2 640 5,800 .. .. 201 1 45 45 .. ..
202 1 50 2,250 .. ..
20 2 95 2,295 .. .. 210 2 1,049 2,379 478,820 (2) 9,344,000 (2)
21 2 1,049 2,379 478,820 (2) 9,344,000 (2) 241 2 455 4,760 1,092,700 (2) 5,536,000 (2)
242 7 1,052 10,684 3,827,929 (4) 77,829,200 (4)
243 3 372 24,612 .. ..
Production Lost (in Rs.)
Wages Lost (in Rs.)
Number of Mandays
Lost
Number of Workers Involved
Number of Disputes
Strikes Classified by Industries during the year 2009
Table-2(iii)(b)
(BY INDUSTRY)
Industry Code (NIC-2004)
6-A 6 5-A 5 4 3 2 1
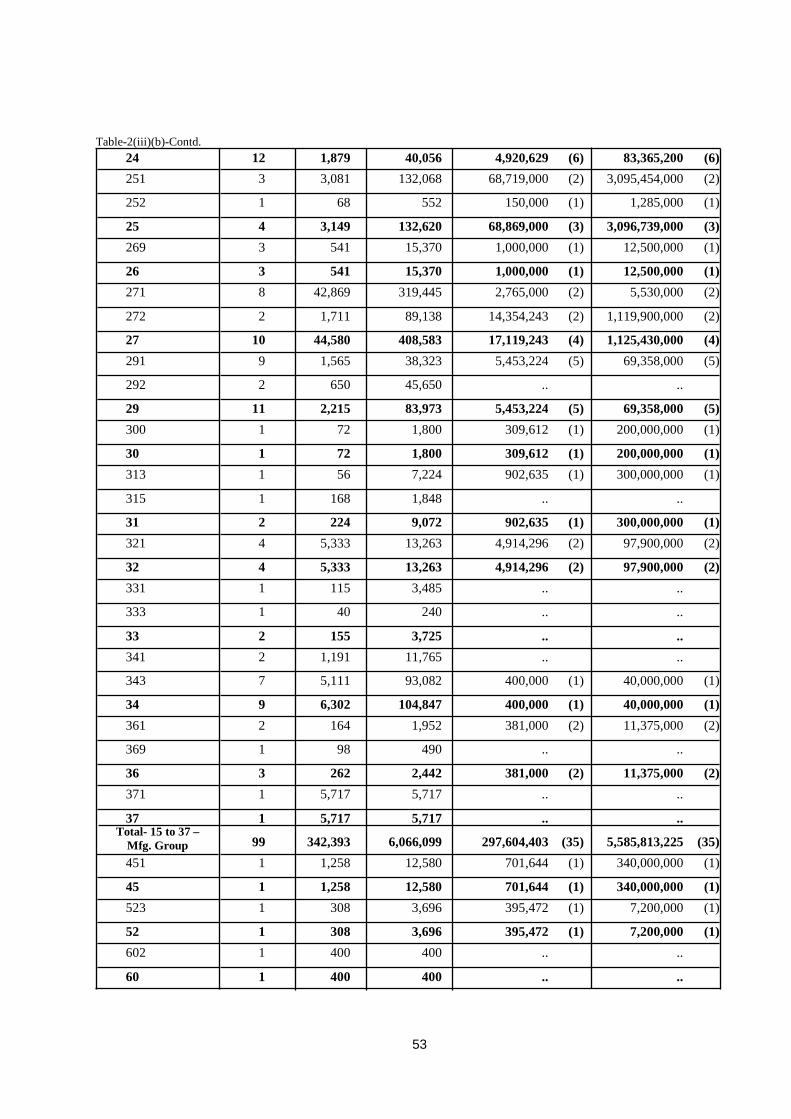
53
Table-2(iii)(b)-Contd.
24 12 1,879 40,056 4,920,629 (6) 83,365,200 (6) 251 3 3,081 132,068 68,719,000 (2) 3,095,454,000 (2)
252 1 68 552 150,000 (1) 1,285,000 (1)
25 4 3,149 132,620 68,869,000 (3) 3,096,739,000 (3) 269 3 541 15,370 1,000,000 (1) 12,500,000 (1)
26 3 541 15,370 1,000,000 (1) 12,500,000 (1) 271 8 42,869 319,445 2,765,000 (2) 5,530,000 (2)
272 2 1,711 89,138 14,354,243 (2) 1,119,900,000 (2)
27 10 44,580 408,583 17,119,243 (4) 1,125,430,000 (4) 291 9 1,565 38,323 5,453,224 (5) 69,358,000 (5)
292 2 650 45,650 .. ..
29 11 2,215 83,973 5,453,224 (5) 69,358,000 (5) 300 1 72 1,800 309,612 (1) 200,000,000 (1)
30 1 72 1,800 309,612 (1) 200,000,000 (1) 313 1 56 7,224 902,635 (1) 300,000,000 (1)
315 1 168 1,848 .. ..
31 2 224 9,072 902,635 (1) 300,000,000 (1) 321 4 5,333 13,263 4,914,296 (2) 97,900,000 (2)
32 4 5,333 13,263 4,914,296 (2) 97,900,000 (2) 331 1 115 3,485 .. ..
333 1 40 240 .. ..
33 2 155 3,725 .. .. 341 2 1,191 11,765 .. ..
343 7 5,111 93,082 400,000 (1) 40,000,000 (1)
34 9 6,302 104,847 400,000 (1) 40,000,000 (1) 361 2 164 1,952 381,000 (2) 11,375,000 (2)
369 1 98 490 .. ..
36 3 262 2,442 381,000 (2) 11,375,000 (2) 371 1 5,717 5,717 .. ..
37 1 5,717 5,717 .. ..
99 342,393 6,066,099 297,604,403 (35) 5,585,813,225 (35) 451 1 1,258 12,580 701,644 (1) 340,000,000 (1)
45 1 1,258 12,580 701,644 (1) 340,000,000 (1) 523 1 308 3,696 395,472 (1) 7,200,000 (1)
52 1 308 3,696 395,472 (1) 7,200,000 (1) 602 1 400 400 .. ..
60 1 400 400 .. ..
Total- 15 to 37 – Mfg. Group
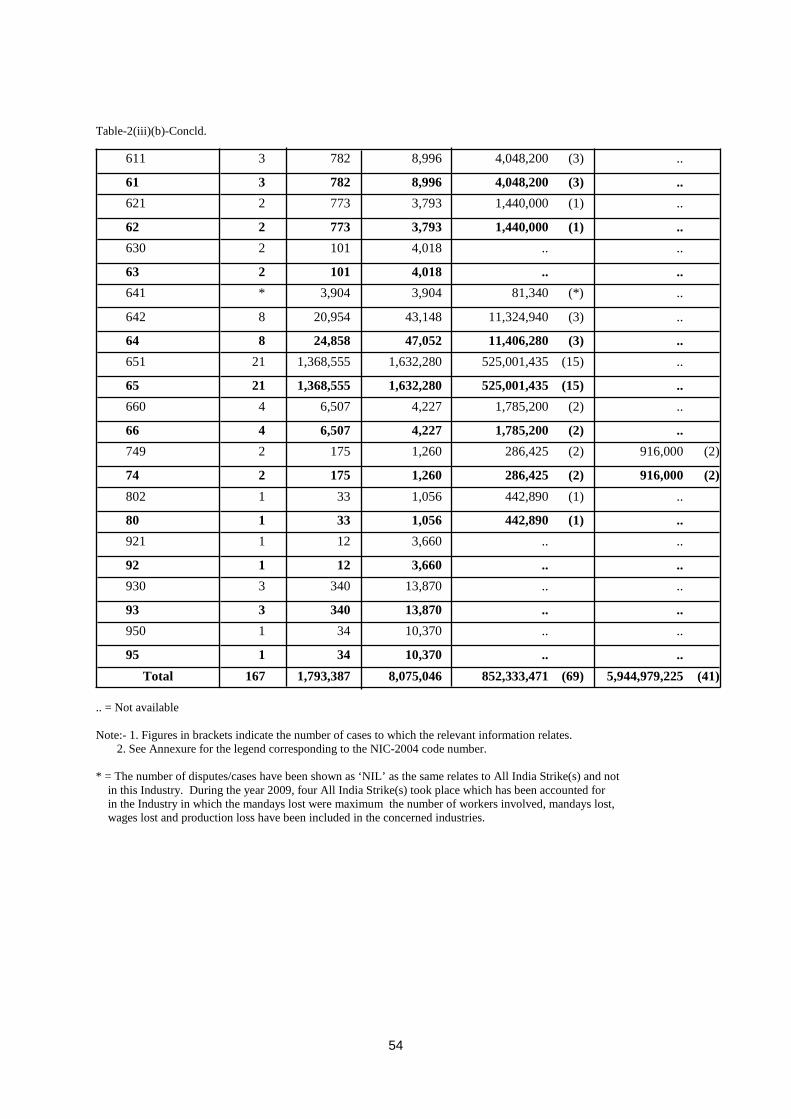
54
Table-2(iii)(b)-Concld.
.. = Not available
Note:- 1. Figures in brackets indicate the number of cases to which the relevant information relates. 2. See Annexure for the legend corresponding to the NIC-2004 code number. * = The number of disputes/cases have been shown as ‘NIL’ as the same relates to All India Strike(s) and not in this Industry. During the year 2009, four All India Strike(s) took place which has been accounted for in the Industry in which the mandays lost were maximum the number of workers involved, mandays lost, wages lost and production loss have been included in the concerned industries.
611 3 782 8,996 4,048,200 (3) ..
61 3 782 8,996 4,048,200 (3) .. 621 2 773 3,793 1,440,000 (1) ..
62 2 773 3,793 1,440,000 (1) .. 630 2 101 4,018 .. ..
63 2 101 4,018 .. .. 641 * 3,904 3,904 81,340 (*) ..
642 8 20,954 43,148 11,324,940 (3) ..
64 8 24,858 47,052 11,406,280 (3) .. 651 21 1,368,555 1,632,280 525,001,435 (15) ..
65 21 1,368,555 1,632,280 525,001,435 (15) .. 660 4 6,507 4,227 1,785,200 (2) ..
66 4 6,507 4,227 1,785,200 (2) .. 749 2 175 1,260 286,425 (2) 916,000 (2)
74 2 175 1,260 286,425 (2) 916,000 (2) 802 1 33 1,056 442,890 (1) ..
80 1 33 1,056 442,890 (1) .. 921 1 12 3,660 .. ..
92 1 12 3,660 .. .. 930 3 340 13,870 .. ..
93 3 340 13,870 .. .. 950 1 34 10,370 .. ..
95 1 34 10,370 .. .. Total 167 1,793,387 8,075,046 852,333,471 (69) 5,944,979,225 (41)
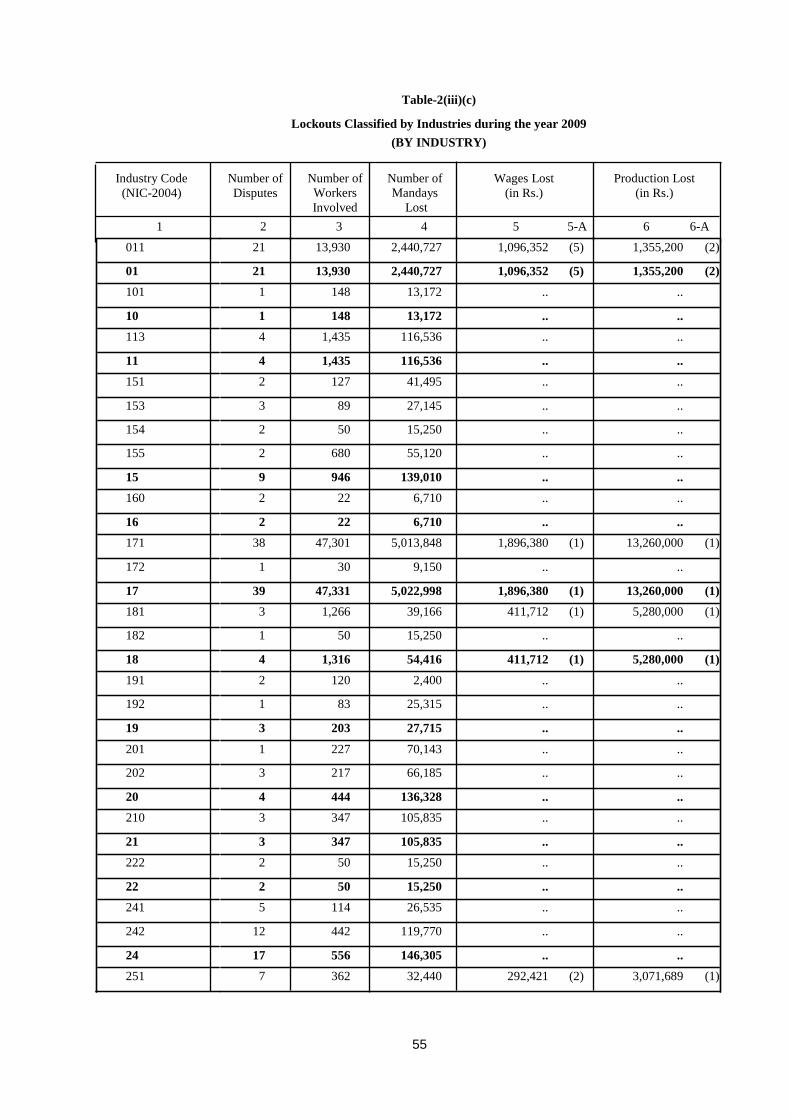
55
011 21 13,930 2,440,727 1,096,352 (5) 1,355,200 (2) 01 21 13,930 2,440,727 1,096,352 (5) 1,355,200 (2) 101 1 148 13,172 .. .. 10 1 148 13,172 .. .. 113 4 1,435 116,536 .. .. 11 4 1,435 116,536 .. .. 151 2 127 41,495 .. .. 153 3 89 27,145 .. .. 154 2 50 15,250 .. .. 155 2 680 55,120 .. .. 15 9 946 139,010 .. .. 160 2 22 6,710 .. .. 16 2 22 6,710 .. .. 171 38 47,301 5,013,848 1,896,380 (1) 13,260,000 (1) 172 1 30 9,150 .. .. 17 39 47,331 5,022,998 1,896,380 (1) 13,260,000 (1) 181 3 1,266 39,166 411,712 (1) 5,280,000 (1) 182 1 50 15,250 .. .. 18 4 1,316 54,416 411,712 (1) 5,280,000 (1) 191 2 120 2,400 .. .. 192 1 83 25,315 .. .. 19 3 203 27,715 .. .. 201 1 227 70,143 .. .. 202 3 217 66,185 .. .. 20 4 444 136,328 .. .. 210 3 347 105,835 .. .. 21 3 347 105,835 .. .. 222 2 50 15,250 .. .. 22 2 50 15,250 .. .. 241 5 114 26,535 .. .. 242 12 442 119,770 .. .. 24 17 556 146,305 .. .. 251 7 362 32,440 292,421 (2) 3,071,689 (1)
Production Lost (in Rs.)
Wages Lost (in Rs.)
Number of Mandays
Lost
Number of Workers Involved
Number of Disputes
Lockouts Classified by Industries during the year 2009 Table-2(iii)(c)
(BY INDUSTRY)
Industry Code (NIC-2004)
6-A 6 5-A 5 4 3 2 1
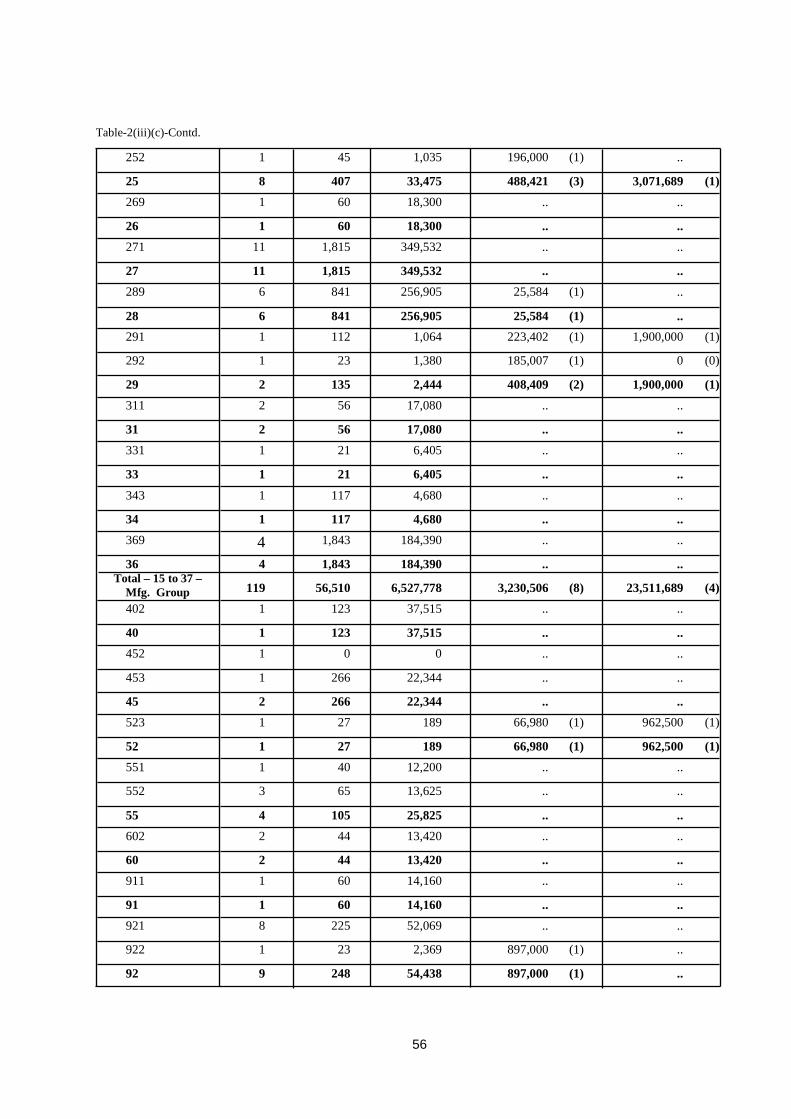
56
Table-2(iii)(c)-Contd.
252 1 45 1,035 196,000 (1) .. 25 8 407 33,475 488,421 (3) 3,071,689 (1) 269 1 60 18,300 .. .. 26 1 60 18,300 .. .. 271 11 1,815 349,532 .. .. 27 11 1,815 349,532 .. .. 289 6 841 256,905 25,584 (1) .. 28 6 841 256,905 25,584 (1) .. 291 1 112 1,064 223,402 (1) 1,900,000 (1) 292 1 23 1,380 185,007 (1) 0 (0) 29 2 135 2,444 408,409 (2) 1,900,000 (1) 311 2 56 17,080 .. .. 31 2 56 17,080 .. .. 331 1 21 6,405 .. .. 33 1 21 6,405 .. .. 343 1 117 4,680 .. .. 34 1 117 4,680 .. .. 369 4 1,843 184,390 .. .. 36 4 1,843 184,390 .. ..
Total – 15 to 37 – Mfg. Group 119 56,510 6,527,778 3,230,506 (8) 23,511,689 (4) 402 1 123 37,515 .. .. 40 1 123 37,515 .. .. 452 1 0 0 .. .. 453 1 266 22,344 .. .. 45 2 266 22,344 .. .. 523 1 27 189 66,980 (1) 962,500 (1) 52 1 27 189 66,980 (1) 962,500 (1) 551 1 40 12,200 .. .. 552 3 65 13,625 .. .. 55 4 105 25,825 .. .. 602 2 44 13,420 .. .. 60 2 44 13,420 .. .. 911 1 60 14,160 .. .. 91 1 60 14,160 .. .. 921 8 225 52,069 .. .. 922 1 23 2,369 897,000 (1) .. 92 9 248 54,438 897,000 (1) ..
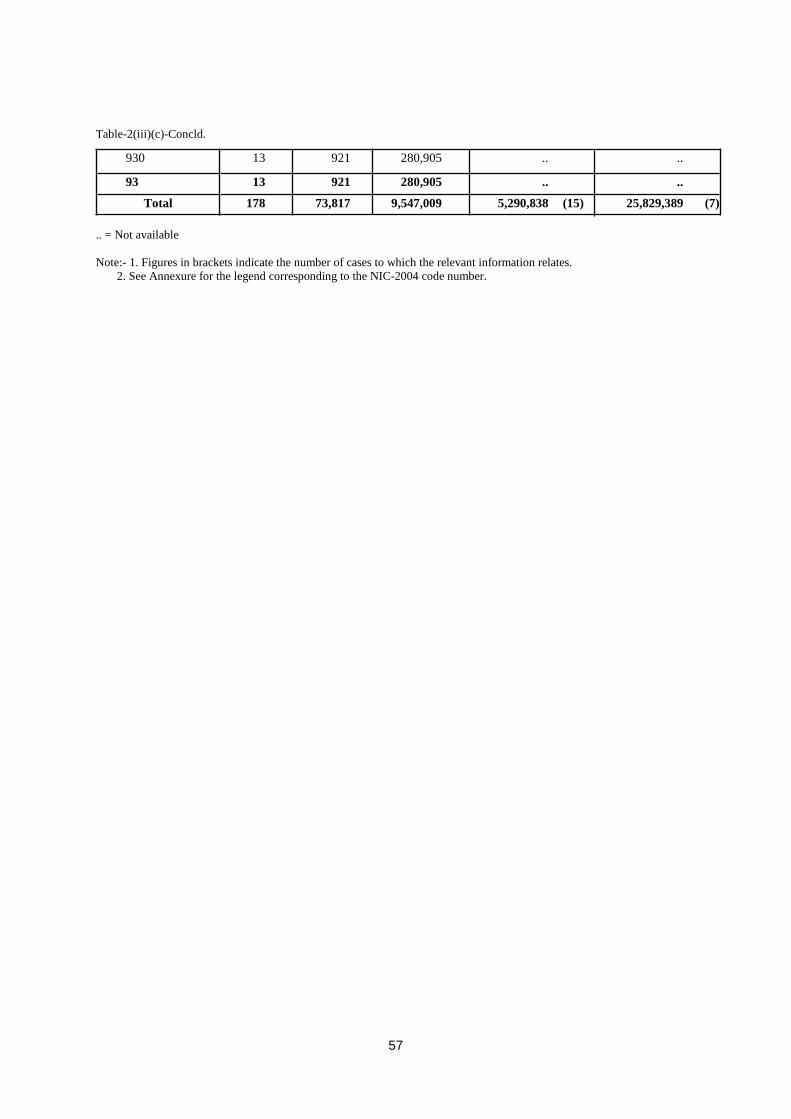
57
Table-2(iii)(c)-Concld.
.. = Not available
Note:- 1. Figures in brackets indicate the number of cases to which the relevant information relates. 2. See Annexure for the legend corresponding to the NIC-2004 code number.
930 13 921 280,905 .. .. 93 13 921 280,905 .. ..
Total 178 73,817 9,547,009 5,290,838 (15) 25,829,389 (7)
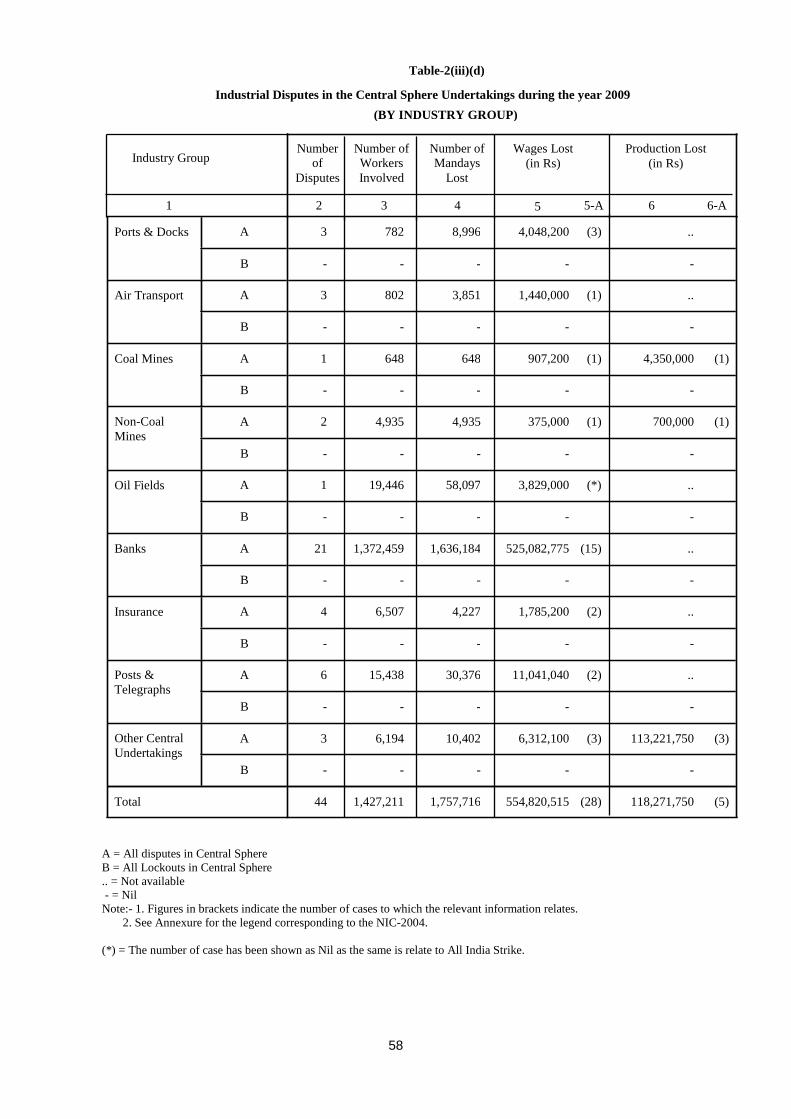
58
A = All disputes in Central Sphere B = All Lockouts in Central Sphere .. = Not available - = Nil Note:- 1. Figures in brackets indicate the number of cases to which the relevant information relates. 2. See Annexure for the legend corresponding to the NIC-2004. (*) = The number of case has been shown as Nil as the same is relate to All India Strike.
Ports & Docks A 3 782 8,996 4,048,200 (3) ..
B - - - - -
Air Transport A 3 802 3,851 1,440,000 (1) ..
B - - - - -
Coal Mines A 1 648 648 907,200 (1) 4,350,000 (1)
B - - - - -
Non-Coal Mines
A 2 4,935 4,935 375,000 (1) 700,000 (1)
B - - - - -
Oil Fields A 1 19,446 58,097 3,829,000 (*) ..
B - - - - -
Banks A 21 1,372,459 1,636,184 525,082,775 (15) ..
B - - - - -
Insurance A 4 6,507 4,227 1,785,200 (2) ..
B - - - - -
Posts & Telegraphs
A 6 15,438 30,376 11,041,040 (2) ..
B - - - - -
Other Central Undertakings
A 3 6,194 10,402 6,312,100 (3) 113,221,750 (3)
B - - - - -
Total 44 1,427,211 1,757,716 554,820,515 (28) 118,271,750 (5)
Production Lost (in Rs)
Wages Lost (in Rs)
Number of Mandays
Lost
Number of Workers Involved
Number of
Disputes
Industrial Disputes in the Central Sphere Undertakings during the year 2009 Table-2(iii)(d)
(BY INDUSTRY GROUP)
Industry Group
6-A 6 5-A 5 4 3 2 1
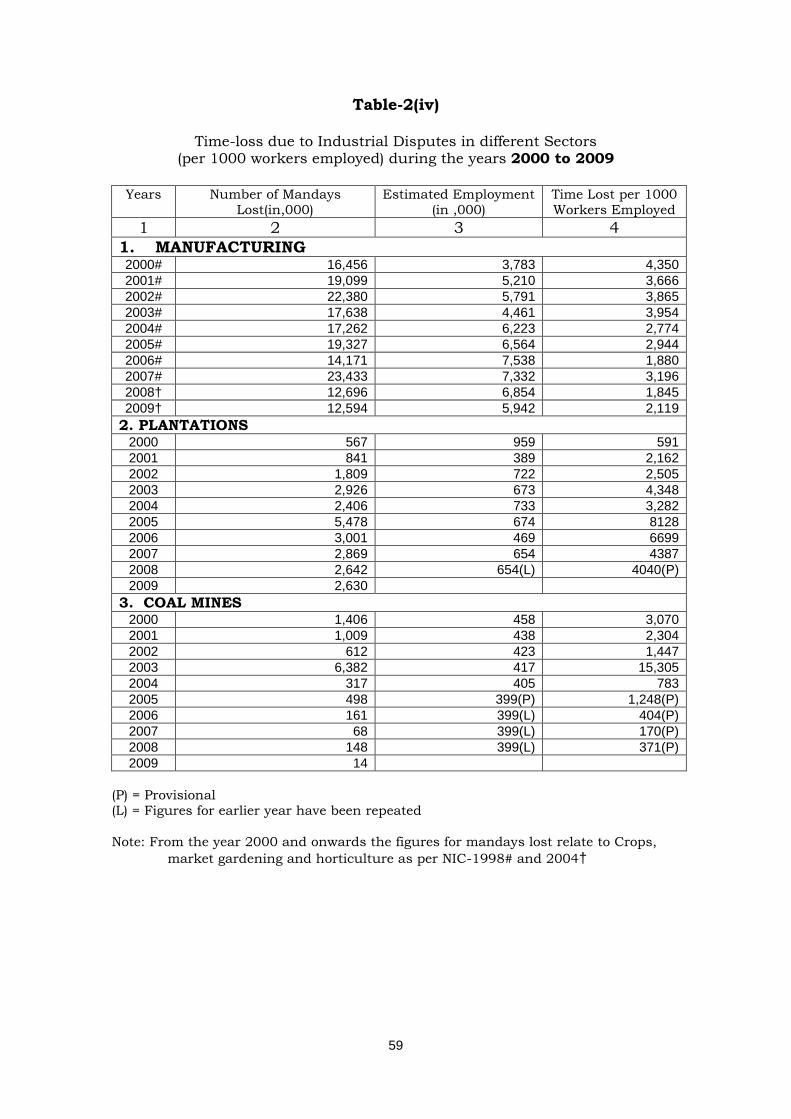
59
Table-2(iv)
Time-loss due to Industrial Disputes in different Sectors (per 1000 workers employed) during the years 2000 to 2009
Years Number of Mandays
Lost(in,000) Estimated Employment
(in ,000) Time Lost per 1000 Workers Employed
1 2 3 4 1. MANUFACTURING 2000# 16,456 3,783 4,350 2001# 19,099 5,210 3,666 2002# 22,380 5,791 3,865 2003# 17,638 4,461 3,954 2004# 17,262 6,223 2,774 2005# 19,327 6,564 2,944 2006# 14,171 7,538 1,880 2007# 23,433 7,332 3,196 2008† 12,696 6,854 1,845 2009† 12,594 5,942 2,119
2. PLANTATIONS 2000 567 959 591 2001 841 389 2,162 2002 1,809 722 2,505 2003 2,926 673 4,348 2004 2,406 733 3,282 2005 5,478 674 8128 2006 3,001 469 6699 2007 2,869 654 4387 2008 2,642 654(L) 4040(P) 2009 2,630
3. COAL MINES 2000 1,406 458 3,070 2001 1,009 438 2,304 2002 612 423 1,447 2003 6,382 417 15,305 2004 317 405 783 2005 498 399(P) 1,248(P) 2006 161 399(L) 404(P) 2007 68 399(L) 170(P) 2008 148 399(L) 371(P) 2009 14
(P) = Provisional (L) = Figures for earlier year have been repeated Note: From the year 2000 and onwards the figures for mandays lost relate to Crops,
market gardening and horticulture as per NIC-1998# and 2004†
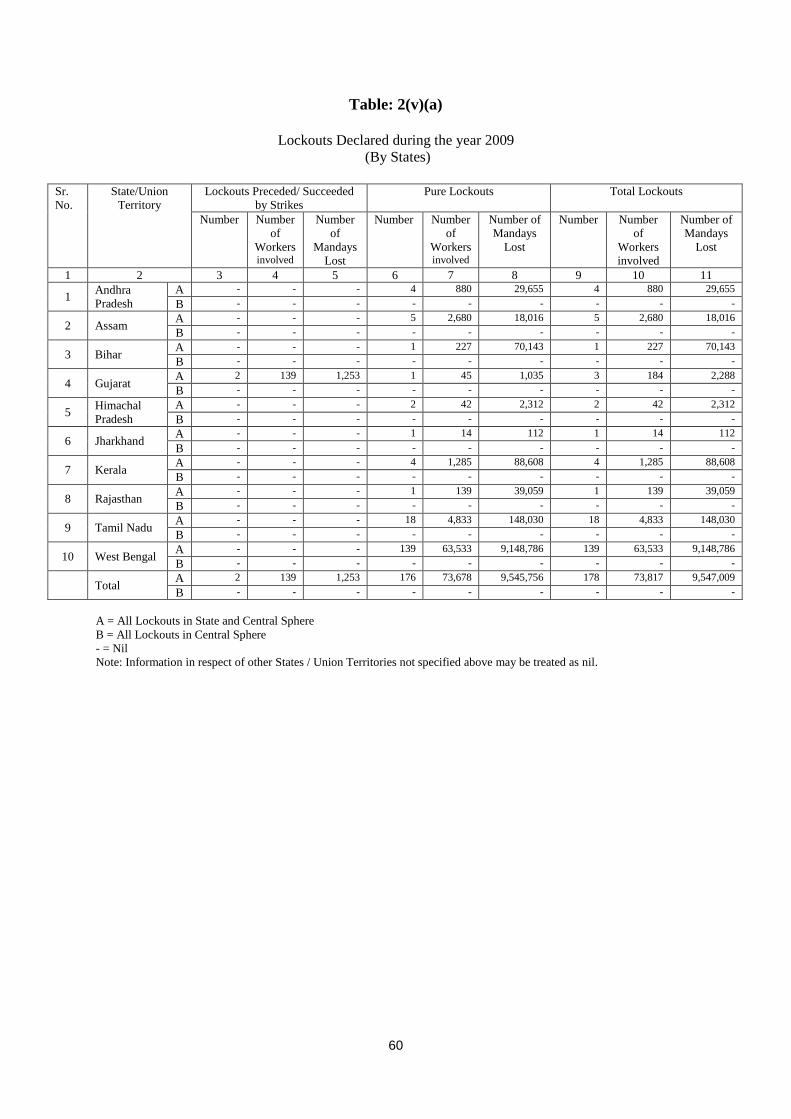
60
Table: 2(v)(a)
Lockouts Declared during the year 2009 (By States)
Sr. No.
State/Union Territory
Lockouts Preceded/ Succeeded by Strikes
Pure Lockouts Total Lockouts
Number Number of
Workers involved
Number of
Mandays Lost
Number Number of
Workers involved
Number of Mandays
Lost
Number Number of
Workers involved
Number of Mandays
Lost
1 2 3 4 5 6 7 8 9 10 11
1 Andhra Pradesh
A - - - 4 880 29,655 4 880 29,655 B - - - - - - - - -
2 Assam A - - - 5 2,680 18,016 5 2,680 18,016 B - - - - - - - - -
3 Bihar A - - - 1 227 70,143 1 227 70,143 B - - - - - - - - -
4 Gujarat A 2 139 1,253 1 45 1,035 3 184 2,288 B - - - - - - - - -
5 Himachal Pradesh
A - - - 2 42 2,312 2 42 2,312 B - - - - - - - - -
6 Jharkhand A - - - 1 14 112 1 14 112 B - - - - - - - - -
7 Kerala A - - - 4 1,285 88,608 4 1,285 88,608 B - - - - - - - - -
8 Rajasthan A - - - 1 139 39,059 1 139 39,059 B - - - - - - - - -
9 Tamil Nadu A - - - 18 4,833 148,030 18 4,833 148,030 B - - - - - - - - -
10 West Bengal A - - - 139 63,533 9,148,786 139 63,533 9,148,786 B - - - - - - - - -
Total A 2 139 1,253 176 73,678 9,545,756 178 73,817 9,547,009 B - - - - - - - - -
A = All Lockouts in State and Central Sphere B = All Lockouts in Central Sphere - = Nil Note: Information in respect of other States / Union Territories not specified above may be treated as nil.
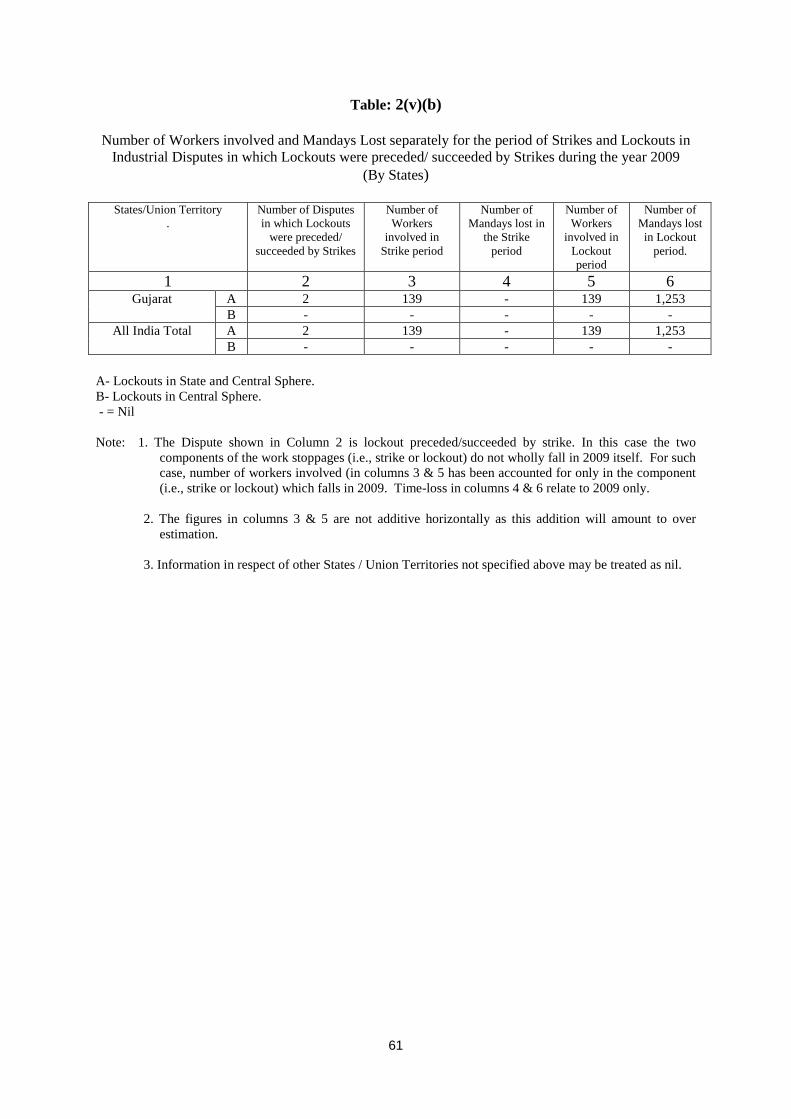
61
Table: 2(v)(b)
Number of Workers involved and Mandays Lost separately for the period of Strikes and Lockouts in Industrial Disputes in which Lockouts were preceded/ succeeded by Strikes during the year 2009
(By States)
States/Union Territory .
Number of Disputes in which Lockouts
were preceded/ succeeded by Strikes
Number of Workers
involved in Strike period
Number of Mandays lost in
the Strike period
Number of Workers
involved in Lockout period
Number of Mandays lost in Lockout
period.
1 2 3 4 5 6 Gujarat A 2 139 - 139 1,253
B - - - - - All India Total A 2 139 - 139 1,253
B - - - - -
A- Lockouts in State and Central Sphere. B- Lockouts in Central Sphere. - = Nil Note: 1. The Dispute shown in Column 2 is lockout preceded/succeeded by strike. In this case the two
components of the work stoppages (i.e., strike or lockout) do not wholly fall in 2009 itself. For such case, number of workers involved (in columns 3 & 5 has been accounted for only in the component (i.e., strike or lockout) which falls in 2009. Time-loss in columns 4 & 6 relate to 2009 only.
2. The figures in columns 3 & 5 are not additive horizontally as this addition will amount to over
estimation.
3. Information in respect of other States / Union Territories not specified above may be treated as nil.
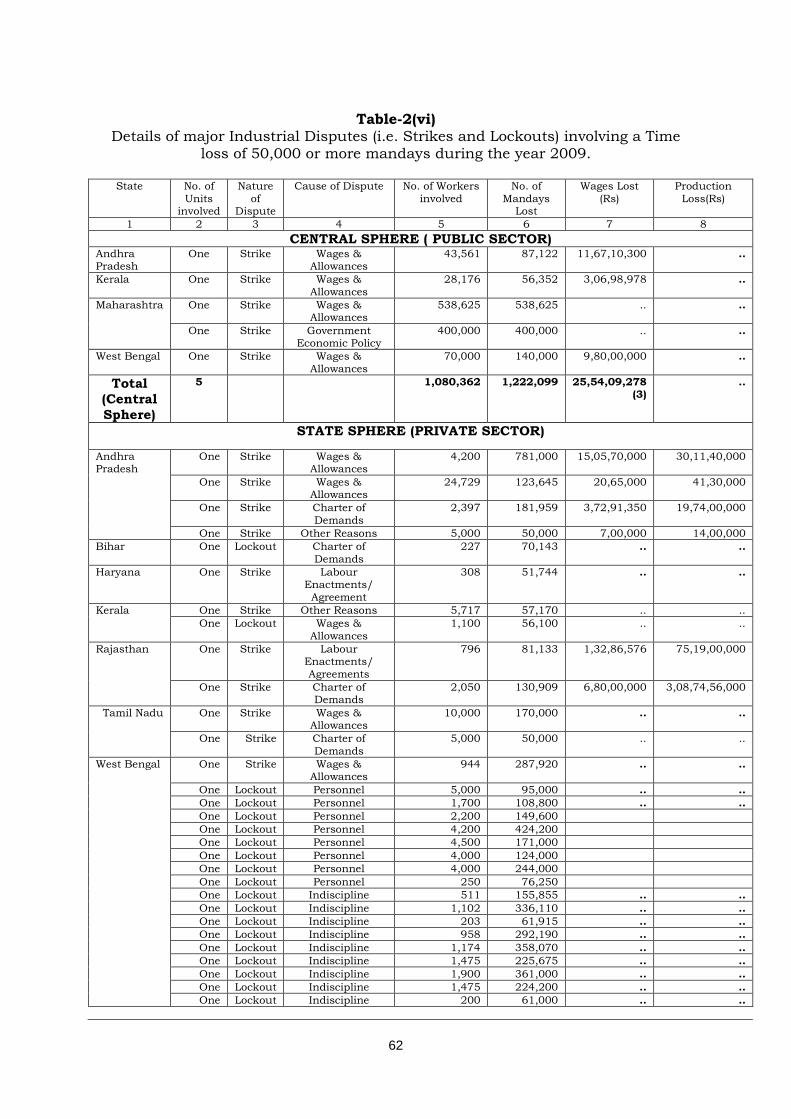
62
Table-2(vi)
Details of major Industrial Disputes (i.e. Strikes and Lockouts) involving a Time loss of 50,000 or more mandays during the year 2009.
State No. of
Units involved
Nature of
Dispute
Cause of Dispute No. of Workers involved
No. of Mandays
Lost
Wages Lost (Rs)
Production Loss(Rs)
1 2 3 4 5 6 7 8 CENTRAL SPHERE ( PUBLIC SECTOR)
Andhra Pradesh
One Strike Wages & Allowances
43,561 87,122 11,67,10,300 ..
Kerala One Strike Wages & Allowances
28,176 56,352 3,06,98,978 ..
Maharashtra One Strike Wages & Allowances
538,625 538,625 .. ..
One Strike Government Economic Policy
400,000 400,000 .. ..
West Bengal One Strike Wages & Allowances
70,000 140,000 9,80,00,000 ..
Total (Central Sphere)
5 1,080,362 1,222,099 25,54,09,278 (3)
..
STATE SPHERE (PRIVATE SECTOR)
Andhra Pradesh
One Strike Wages & Allowances
4,200 781,000 15,05,70,000 30,11,40,000
One Strike Wages & Allowances
24,729 123,645 20,65,000 41,30,000
One Strike Charter of Demands
2,397 181,959 3,72,91,350 19,74,00,000
One Strike Other Reasons 5,000 50,000 7,00,000 14,00,000 Bihar One Lockout Charter of
Demands 227 70,143 .. ..
Haryana One Strike Labour Enactments/
Agreement
308 51,744 .. ..
Kerala One Strike Other Reasons 5,717 57,170 .. .. One Lockout Wages &
Allowances 1,100 56,100 .. ..
Rajasthan One Strike Labour Enactments/ Agreements
796 81,133 1,32,86,576 75,19,00,000
One Strike Charter of Demands
2,050 130,909 6,80,00,000 3,08,74,56,000
Tamil Nadu One Strike Wages & Allowances
10,000 170,000 .. ..
One Strike Charter of Demands
5,000 50,000 .. ..
West Bengal One Strike Wages & Allowances
944 287,920 .. ..
One Lockout Personnel 5,000 95,000 .. .. One Lockout Personnel 1,700 108,800 .. .. One Lockout Personnel 2,200 149,600 One Lockout Personnel 4,200 424,200 One Lockout Personnel 4,500 171,000 One Lockout Personnel 4,000 124,000 One Lockout Personnel 4,000 244,000 One Lockout Personnel 250 76,250 One Lockout Indiscipline 511 155,855 .. .. One Lockout Indiscipline 1,102 336,110 .. .. One Lockout Indiscipline 203 61,915 .. .. One Lockout Indiscipline 958 292,190 .. .. One Lockout Indiscipline 1,174 358,070 .. .. One Lockout Indiscipline 1,475 225,675 .. .. One Lockout Indiscipline 1,900 361,000 .. .. One Lockout Indiscipline 1,475 224,200 .. .. One Lockout Indiscipline 200 61,000 .. ..
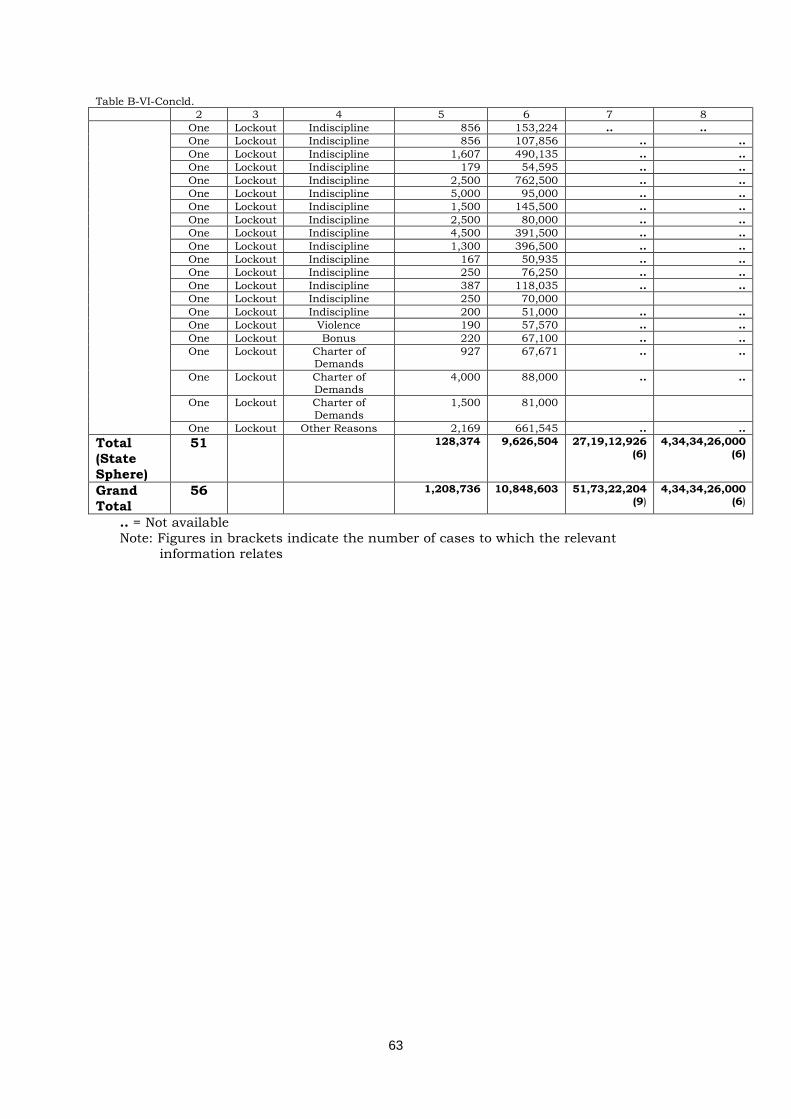
63
Table B-VI-Concld. 2 3 4 5 6 7 8 One Lockout Indiscipline 856 153,224 .. ..
One Lockout Indiscipline 856 107,856 .. .. One Lockout Indiscipline 1,607 490,135 .. .. One Lockout Indiscipline 179 54,595 .. .. One Lockout Indiscipline 2,500 762,500 .. .. One Lockout Indiscipline 5,000 95,000 .. .. One Lockout Indiscipline 1,500 145,500 .. .. One Lockout Indiscipline 2,500 80,000 .. .. One Lockout Indiscipline 4,500 391,500 .. .. One Lockout Indiscipline 1,300 396,500 .. .. One Lockout Indiscipline 167 50,935 .. .. One Lockout Indiscipline 250 76,250 .. .. One Lockout Indiscipline 387 118,035 .. .. One Lockout Indiscipline 250 70,000 One Lockout Indiscipline 200 51,000 .. .. One Lockout Violence 190 57,570 .. .. One Lockout Bonus 220 67,100 .. .. One Lockout Charter of
Demands 927 67,671 .. ..
One Lockout Charter of Demands
4,000 88,000 .. ..
One Lockout Charter of Demands
1,500 81,000
One Lockout Other Reasons 2,169 661,545 .. .. Total (State Sphere)
51 128,374 9,626,504 27,19,12,926 (6)
4,34,34,26,000 (6)
Grand Total
56 1,208,736 10,848,603 51,73,22,204 (9)
4,34,34,26,000 (6)
.. = Not available Note: Figures in brackets indicate the number of cases to which the relevant
information relates
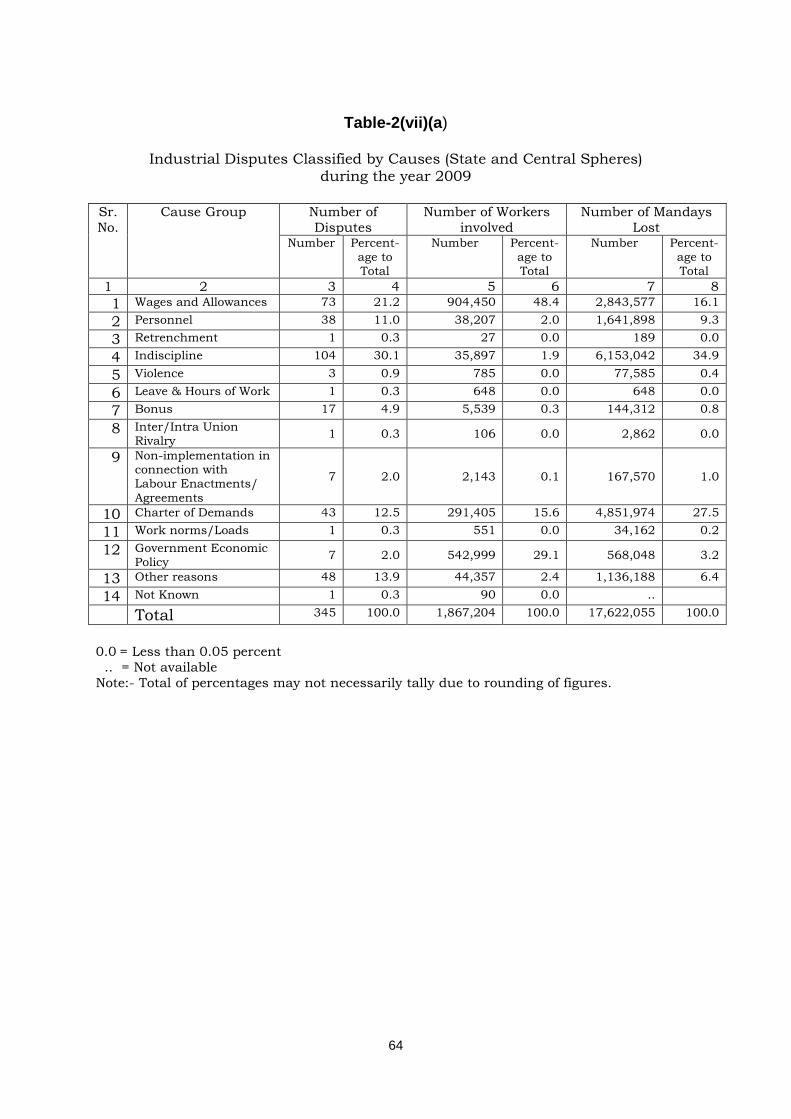
64
Table-2(vii)(a)
Industrial Disputes Classified by Causes (State and Central Spheres)
during the year 2009
Sr.No.
Cause Group Number of Disputes
Number of Workers involved
Number of Mandays Lost
Number Percent- age to Total
Number Percent- age to Total
Number Percent- age to Total
1 2 3 4 5 6 7 8 1 Wages and Allowances 73 21.2 904,450 48.4 2,843,577 16.1
2 Personnel 38 11.0 38,207 2.0 1,641,898 9.3
3 Retrenchment 1 0.3 27 0.0 189 0.0
4 Indiscipline 104 30.1 35,897 1.9 6,153,042 34.9
5 Violence 3 0.9 785 0.0 77,585 0.4
6 Leave & Hours of Work 1 0.3 648 0.0 648 0.0
7 Bonus 17 4.9 5,539 0.3 144,312 0.8
8 Inter/Intra Union Rivalry 1 0.3 106 0.0 2,862 0.0
9 Non-implementation in connection with Labour Enactments/ Agreements
7 2.0 2,143 0.1 167,570 1.0
10 Charter of Demands 43 12.5 291,405 15.6 4,851,974 27.5
11 Work norms/Loads 1 0.3 551 0.0 34,162 0.2
12 Government Economic Policy 7 2.0 542,999 29.1 568,048 3.2
13 Other reasons 48 13.9 44,357 2.4 1,136,188 6.4
14 Not Known 1 0.3 90 0.0 ..
Total 345 100.0 1,867,204 100.0 17,622,055 100.0
0.0 = Less than 0.05 percent .. = Not available Note:- Total of percentages may not necessarily tally due to rounding of figures.
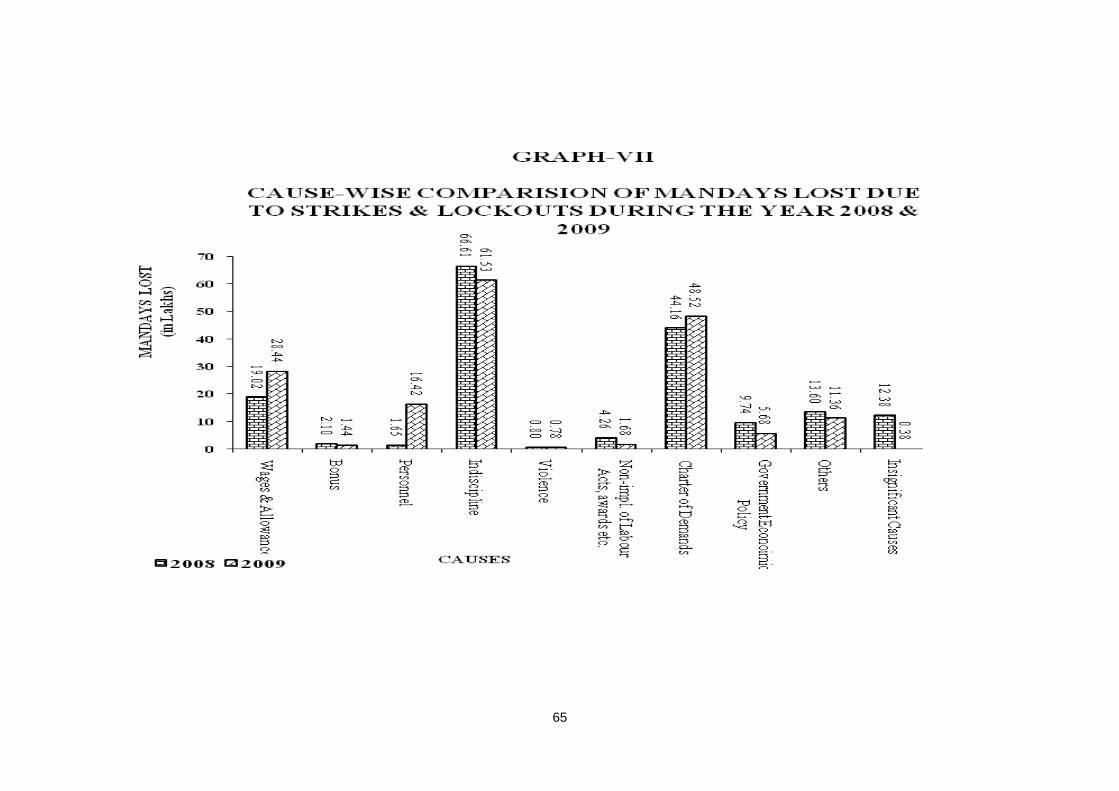
65
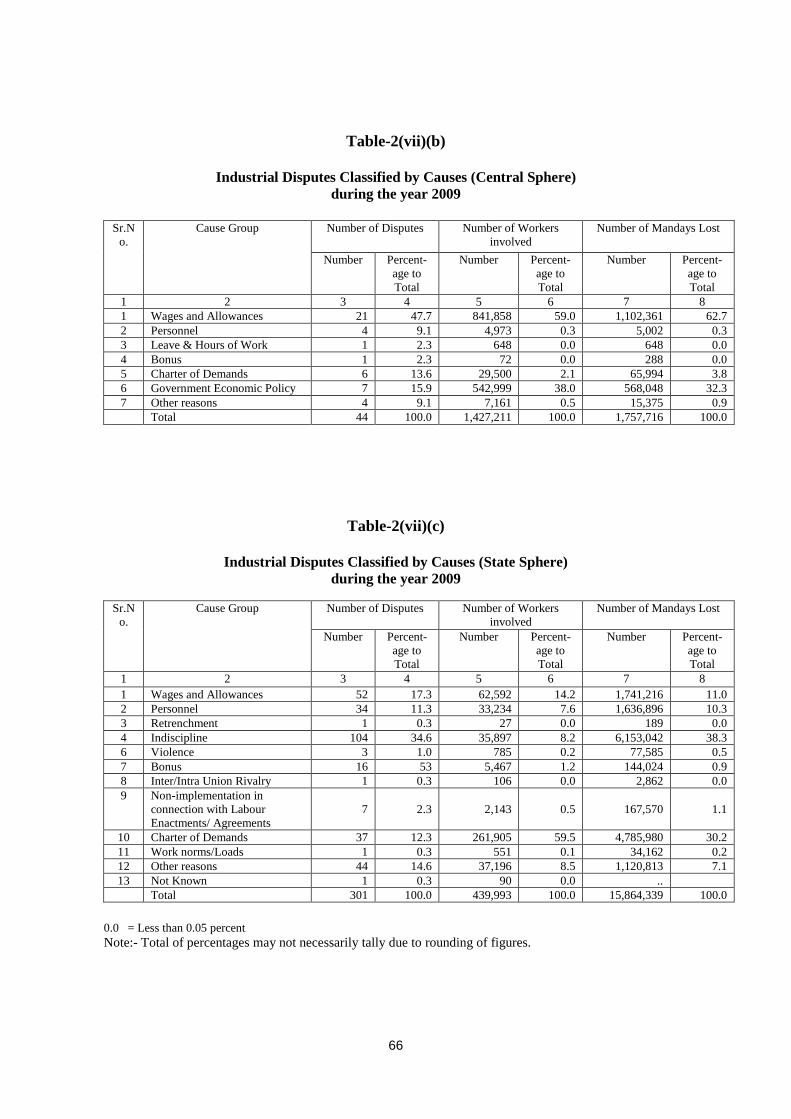
66
Table-2(vii)(b)
Industrial Disputes Classified by Causes (Central Sphere) during the year 2009
Sr.N
o. Cause Group Number of Disputes Number of Workers
involved Number of Mandays Lost
Number Percent- age to Total
Number Percent- age to Total
Number Percent- age to Total
1 2 3 4 5 6 7 8 1 Wages and Allowances 21 47.7 841,858 59.0 1,102,361 62.7 2 Personnel 4 9.1 4,973 0.3 5,002 0.3 3 Leave & Hours of Work 1 2.3 648 0.0 648 0.0 4 Bonus 1 2.3 72 0.0 288 0.0 5 Charter of Demands 6 13.6 29,500 2.1 65,994 3.8 6 Government Economic Policy 7 15.9 542,999 38.0 568,048 32.3 7 Other reasons 4 9.1 7,161 0.5 15,375 0.9 Total 44 100.0 1,427,211 100.0 1,757,716 100.0
Table-2(vii)(c)
Industrial Disputes Classified by Causes (State Sphere) during the year 2009
Sr.N
o. Cause Group Number of Disputes Number of Workers
involved Number of Mandays Lost
Number Percent- age to Total
Number Percent- age to Total
Number Percent- age to Total
1 2 3 4 5 6 7 8 1 Wages and Allowances 52 17.3 62,592 14.2 1,741,216 11.0 2 Personnel 34 11.3 33,234 7.6 1,636,896 10.3 3 Retrenchment 1 0.3 27 0.0 189 0.0 4 Indiscipline 104 34.6 35,897 8.2 6,153,042 38.3 6 Violence 3 1.0 785 0.2 77,585 0.5 7 Bonus 16 53 5,467 1.2 144,024 0.9 8 Inter/Intra Union Rivalry 1 0.3 106 0.0 2,862 0.0 9 Non-implementation in
connection with Labour Enactments/ Agreements
7 2.3 2,143 0.5 167,570 1.1
10 Charter of Demands 37 12.3 261,905 59.5 4,785,980 30.2 11 Work norms/Loads 1 0.3 551 0.1 34,162 0.2 12 Other reasons 44 14.6 37,196 8.5 1,120,813 7.1 13 Not Known 1 0.3 90 0.0 ..
Total 301 100.0 439,993 100.0 15,864,339 100.0
0.0 = Less than 0.05 percent Note:- Total of percentages may not necessarily tally due to rounding of figures.
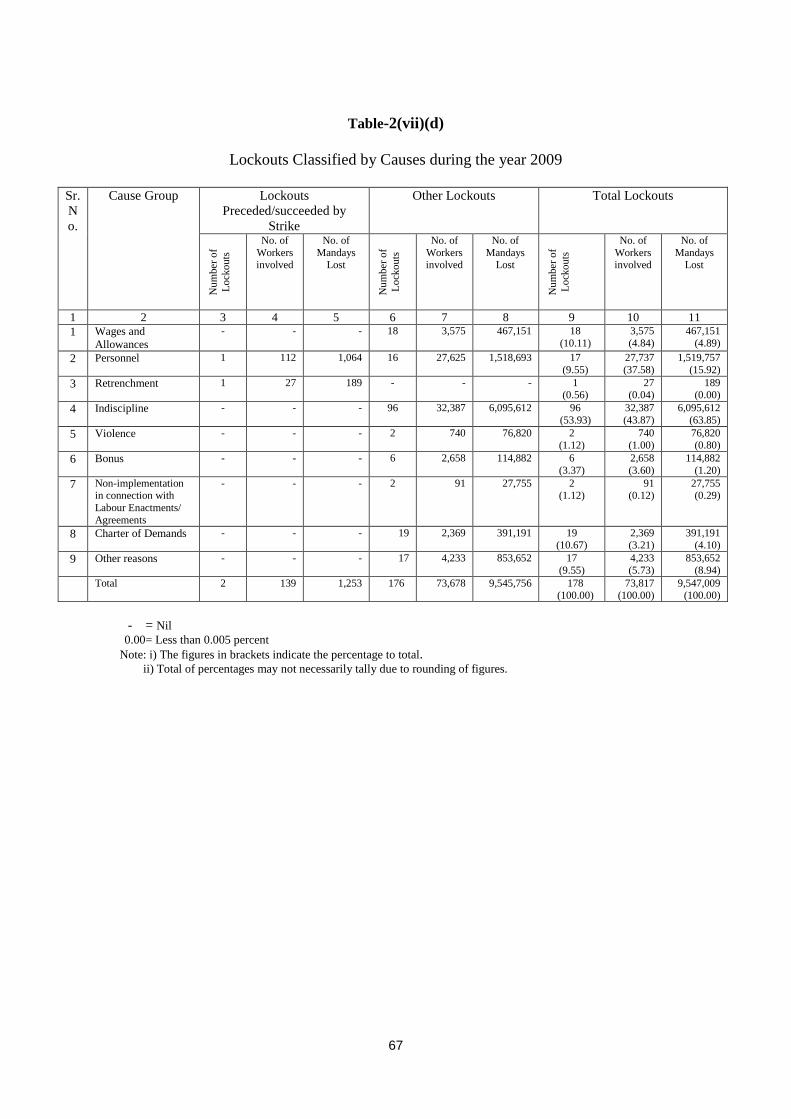
67
Table-2(vii)(d)
Lockouts Classified by Causes during the year 2009
Sr. No.
Cause Group Lockouts Preceded/succeeded by
Strike
Other Lockouts Total Lockouts N
umbe
r of
Lock
outs
No. of
Workers involved
No. of Mandays
Lost
Num
ber o
f Lo
ckou
ts
No. of Workers involved
No. of Mandays
Lost
Num
ber o
f Lo
ckou
ts
No. of Workers involved
No. of Mandays
Lost
1 2 3 4 5 6 7 8 9 10 11 1 Wages and
Allowances - - - 18 3,575 467,151 18
(10.11) 3,575 (4.84)
467,151 (4.89)
2 Personnel 1 112 1,064 16 27,625 1,518,693 17 (9.55)
27,737 (37.58)
1,519,757 (15.92)
3 Retrenchment 1 27 189 - - - 1 (0.56)
27 (0.04)
189 (0.00)
4 Indiscipline - - - 96 32,387 6,095,612 96 (53.93)
32,387 (43.87)
6,095,612 (63.85)
5 Violence - - - 2 740 76,820 2 (1.12)
740 (1.00)
76,820 (0.80)
6 Bonus - - - 6 2,658 114,882 6 (3.37)
2,658 (3.60)
114,882 (1.20)
7 Non-implementation in connection with Labour Enactments/ Agreements
- - - 2 91 27,755 2 (1.12)
91 (0.12)
27,755 (0.29)
8 Charter of Demands - - - 19 2,369 391,191 19 (10.67)
2,369 (3.21)
391,191 (4.10)
9 Other reasons - - - 17 4,233 853,652 17 (9.55)
4,233 (5.73)
853,652 (8.94)
Total 2 139 1,253 176 73,678 9,545,756 178 (100.00)
73,817 (100.00)
9,547,009 (100.00)
- = Nil 0.00= Less than 0.005 percent
Note: i) The figures in brackets indicate the percentage to total. ii) Total of percentages may not necessarily tally due to rounding of figures.
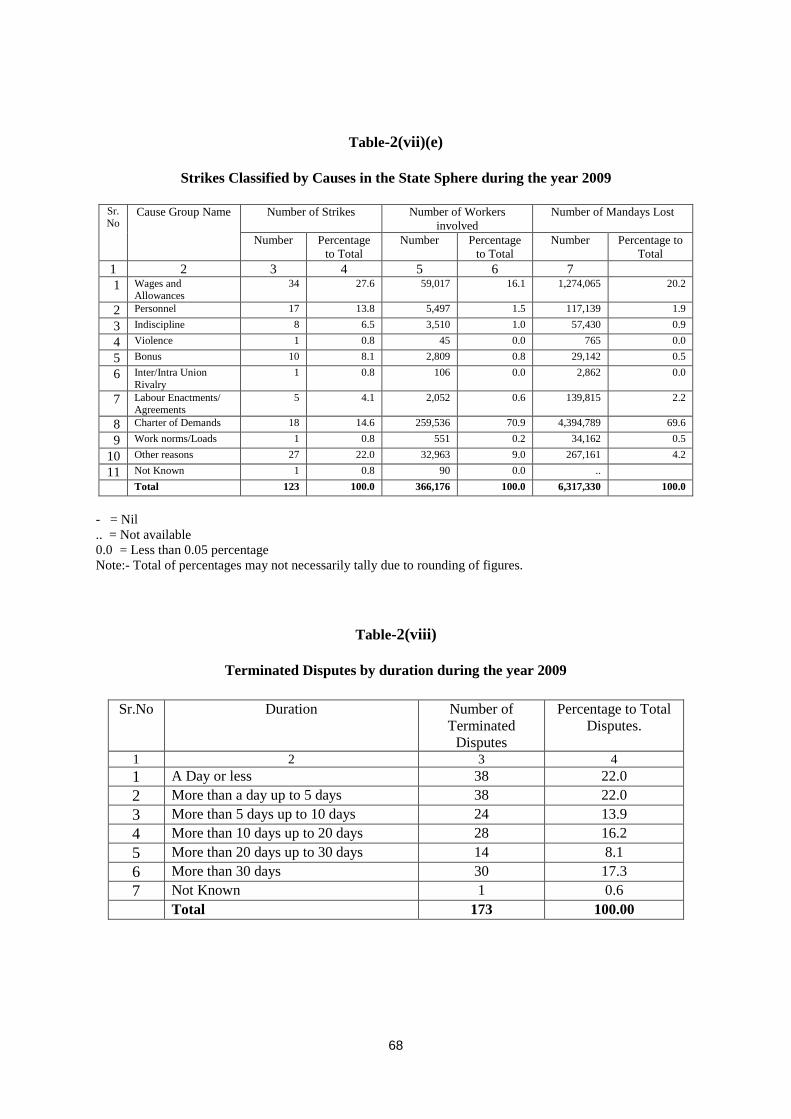
68
Table-2(vii)(e)
Strikes Classified by Causes in the State Sphere during the year 2009
Sr. No
Cause Group Name Number of Strikes Number of Workers involved
Number of Mandays Lost
Number Percentage to Total
Number Percentage to Total
Number Percentage to Total
1 2 3 4 5 6 7 1 Wages and
Allowances 34 27.6 59,017 16.1 1,274,065 20.2
2 Personnel 17 13.8 5,497 1.5 117,139 1.9
3 Indiscipline 8 6.5 3,510 1.0 57,430 0.9
4 Violence 1 0.8 45 0.0 765 0.0
5 Bonus 10 8.1 2,809 0.8 29,142 0.5
6 Inter/Intra Union Rivalry
1 0.8 106 0.0 2,862 0.0
7 Labour Enactments/ Agreements
5 4.1 2,052 0.6 139,815 2.2
8 Charter of Demands 18 14.6 259,536 70.9 4,394,789 69.6
9 Work norms/Loads 1 0.8 551 0.2 34,162 0.5
10 Other reasons 27 22.0 32,963 9.0 267,161 4.2
11 Not Known 1 0.8 90 0.0 ..
Total 123 100.0 366,176 100.0 6,317,330 100.0
- = Nil .. = Not available 0.0 = Less than 0.05 percentage Note:- Total of percentages may not necessarily tally due to rounding of figures.
Table-2(viii)
Terminated Disputes by duration during the year 2009
Sr.No Duration Number of Terminated
Disputes
Percentage to Total Disputes.
1 2 3 4 1 A Day or less 38 22.0 2 More than a day up to 5 days 38 22.0 3 More than 5 days up to 10 days 24 13.9 4 More than 10 days up to 20 days 28 16.2 5 More than 20 days up to 30 days 14 8.1 6 More than 30 days 30 17.3 7 Not Known 1 0.6 Total 173 100.00
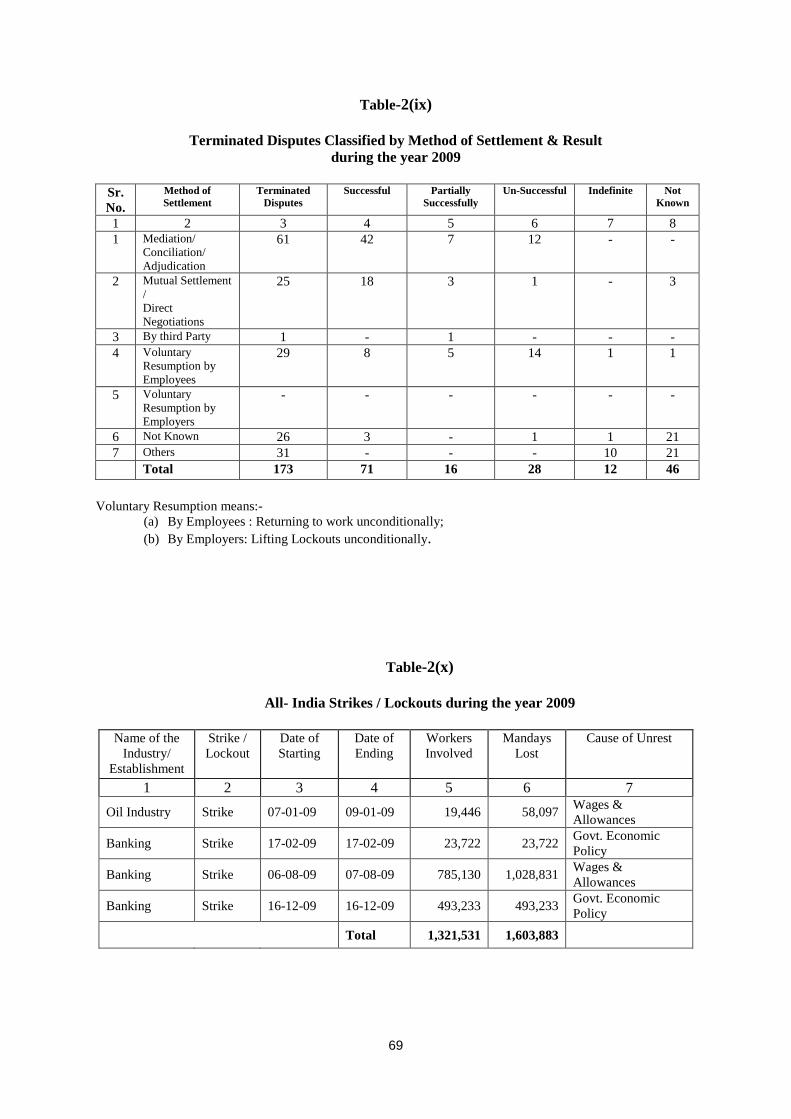
69
Table-2(ix)
Terminated Disputes Classified by Method of Settlement & Result during the year 2009
Sr. No.
Method of Settlement
Terminated Disputes
Successful Partially Successfully
Un-Successful Indefinite Not Known
1 2 3 4 5 6 7 8 1 Mediation/
Conciliation/ Adjudication
61 42 7 12 - -
2 Mutual Settlement / Direct Negotiations
25 18 3 1 - 3
3 By third Party 1 - 1 - - - 4 Voluntary
Resumption by Employees
29 8 5 14 1 1
5 Voluntary Resumption by Employers
- - - - - -
6 Not Known 26 3 - 1 1 21 7 Others 31 - - - 10 21 Total 173 71 16 28 12 46
Voluntary Resumption means:-
(a) By Employees : Returning to work unconditionally; (b) By Employers: Lifting Lockouts unconditionally.
Table-2(x)
All- India Strikes / Lockouts during the year 2009
Name of the Industry/
Establishment
Strike / Lockout
Date of Starting
Date of Ending
Workers Involved
Mandays Lost
Cause of Unrest
1 2 3 4 5 6 7 Oil Industry Strike 07-01-09 09-01-09 19,446 58,097 Wages &
Allowances
Banking Strike 17-02-09 17-02-09 23,722 23,722 Govt. Economic Policy
Banking Strike 06-08-09 07-08-09 785,130 1,028,831 Wages & Allowances
Banking Strike 16-12-09 16-12-09 493,233 493,233 Govt. Economic Policy
Total 1,321,531 1,603,883
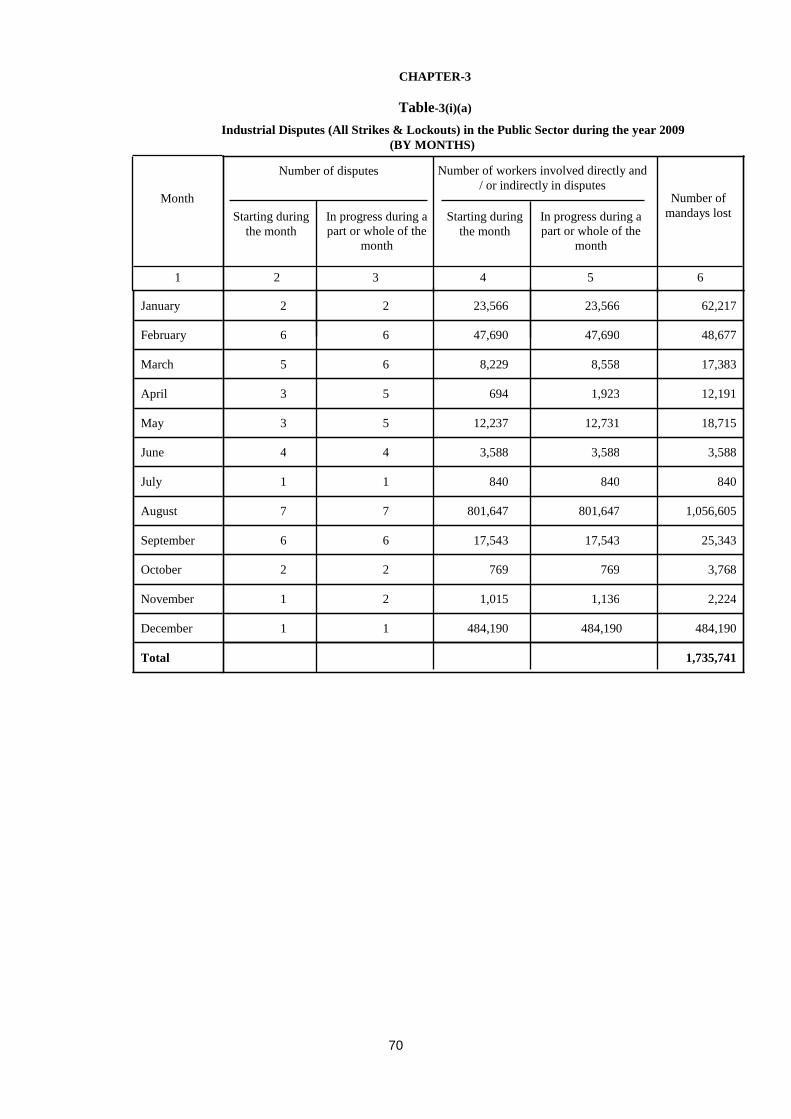
70
January 2 2 23,566 23,566 62,217
February 6 6 47,690 47,690 48,677
March 5 6 8,229 8,558 17,383
April 3 5 694 1,923 12,191
May 3 5 12,237 12,731 18,715
June 4 4 3,588 3,588 3,588
July 1 1 840 840 840
August 7 7 801,647 801,647 1,056,605
September 6 6 17,543 17,543 25,343
October 2 2 769 769 3,768
November 1 2 1,015 1,136 2,224
December 1 1 484,190 484,190 484,190
Total 1,735,741
Starting during the month
Starting during the month
Number of mandays lost In progress during a
part or whole of the month
Month
Number of disputes Number of workers involved directly and / or indirectly in disputes
(BY MONTHS)
CHAPTER-3
Table-3(i)(a)
2 3 1 4 5 6
In progress during a part or whole of the
month
Industrial Disputes (All Strikes & Lockouts) in the Public Sector during the year 2009
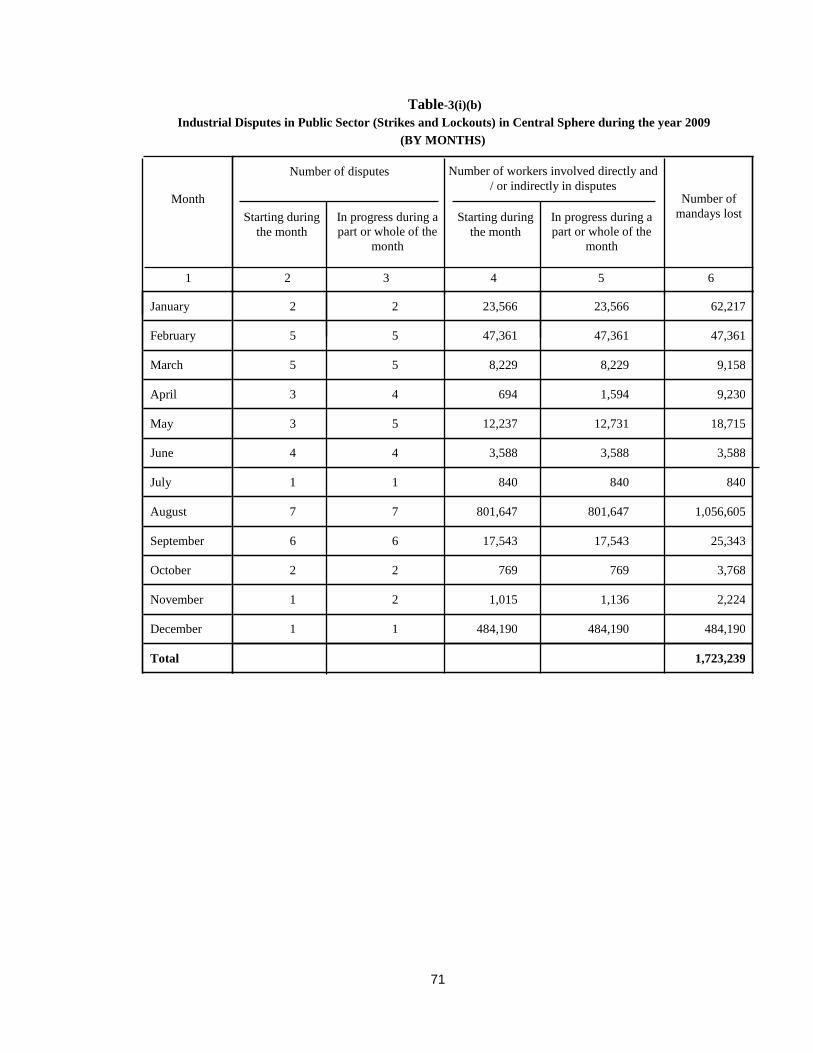
71
January 2 2 23,566 23,566 62,217
February 5 5 47,361 47,361 47,361
March 5 5 8,229 8,229 9,158
April 3 4 694 1,594 9,230
May 3 5 12,237 12,731 18,715
June 4 4 3,588 3,588 3,588
July 1 1 840 840 840
August 7 7 801,647 801,647 1,056,605
September 6 6 17,543 17,543 25,343
October 2 2 769 769 3,768
November 1 2 1,015 1,136 2,224
December 1 1 484,190 484,190 484,190
Total 1,723,239
Starting during the month
Starting during the month
Number of mandays lost In progress during a
part or whole of the month
Month
Number of disputes Number of workers involved directly and / or indirectly in disputes
(BY MONTHS)
Table-3(i)(b)
2 3 1 4 5 6
In progress during a part or whole of the
month
Industrial Disputes in Public Sector (Strikes and Lockouts) in Central Sphere during the year 2009
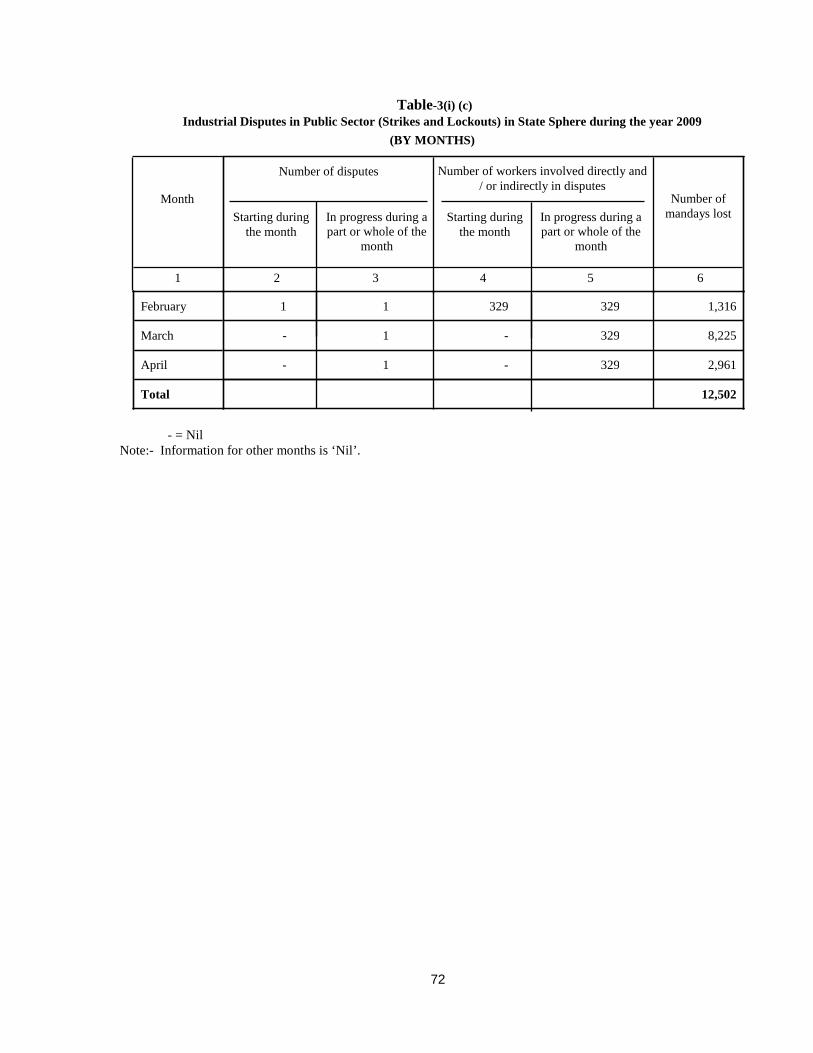
72
- = Nil Note:- Information for other months is ‘Nil’.
February 1 1 329 329 1,316
March - 1 - 329 8,225
April - 1 - 329 2,961
Total 12,502
Starting during the month
Starting during the month
Number of mandays lost In progress during a
part or whole of the month
Month
Number of disputes Number of workers involved directly and / or indirectly in disputes
(BY MONTHS)
Table-3(i) (c)
2 3 1 4 5 6
In progress during a part or whole of the
month
Industrial Disputes in Public Sector (Strikes and Lockouts) in State Sphere during the year 2009
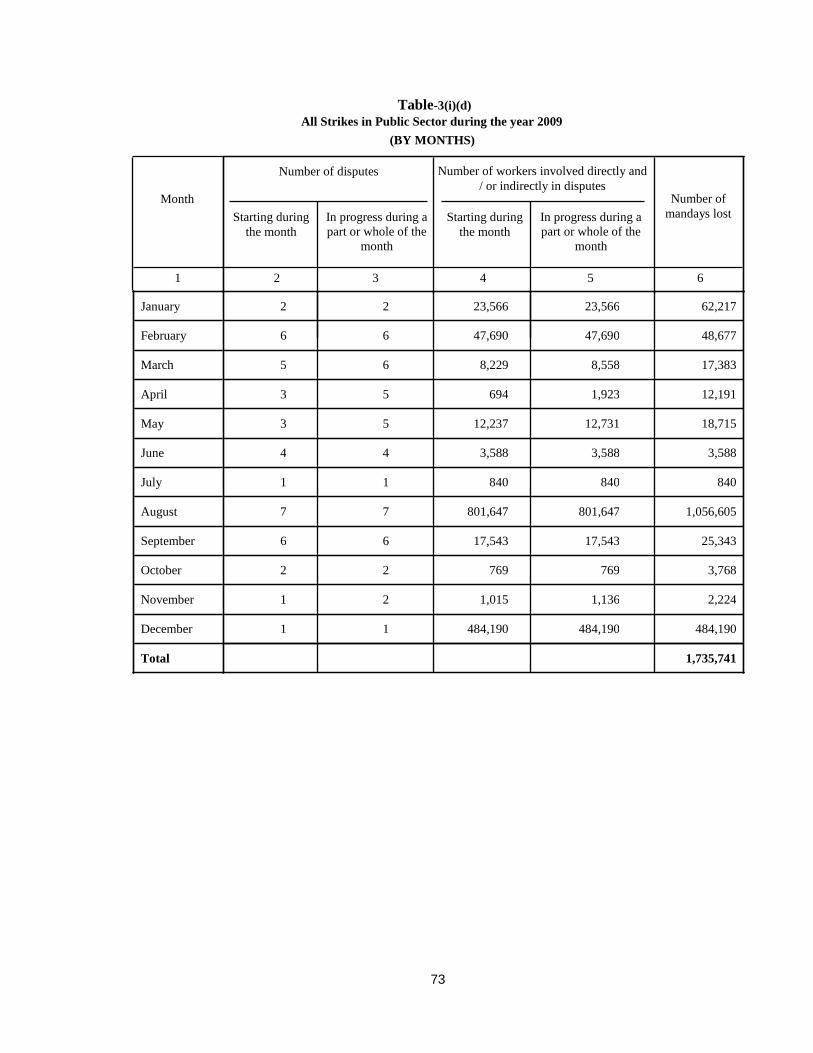
73
January 2 2 23,566 23,566 62,217
February 6 6 47,690 47,690 48,677
March 5 6 8,229 8,558 17,383
April 3 5 694 1,923 12,191
May 3 5 12,237 12,731 18,715
June 4 4 3,588 3,588 3,588
July 1 1 840 840 840
August 7 7 801,647 801,647 1,056,605
September 6 6 17,543 17,543 25,343
October 2 2 769 769 3,768
November 1 2 1,015 1,136 2,224
December 1 1 484,190 484,190 484,190
Total 1,735,741
Starting during the month
Starting during the month
Number of mandays lost In progress during a
part or whole of the month
Month
Number of disputes Number of workers involved directly and / or indirectly in disputes
(BY MONTHS)
Table-3(i)(d)
2 3 1 4 5 6
In progress during a part or whole of the
month
All Strikes in Public Sector during the year 2009
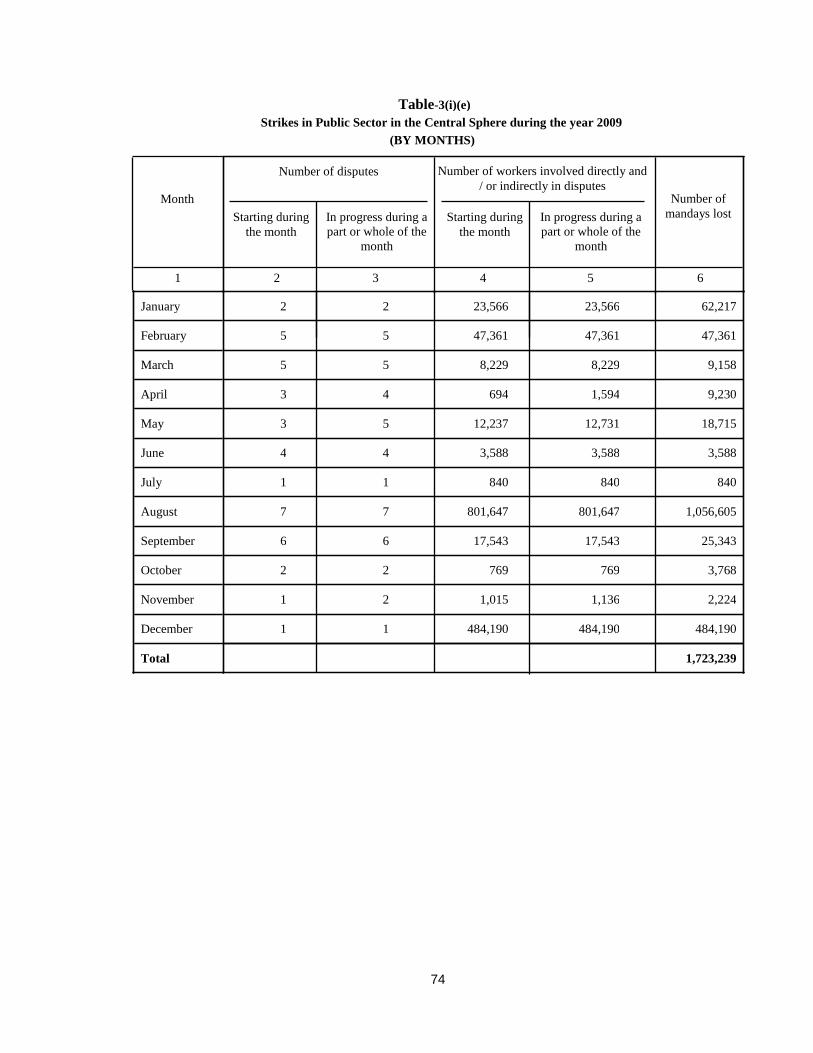
74
January 2 2 23,566 23,566 62,217
February 5 5 47,361 47,361 47,361
March 5 5 8,229 8,229 9,158
April 3 4 694 1,594 9,230
May 3 5 12,237 12,731 18,715
June 4 4 3,588 3,588 3,588
July 1 1 840 840 840
August 7 7 801,647 801,647 1,056,605
September 6 6 17,543 17,543 25,343
October 2 2 769 769 3,768
November 1 2 1,015 1,136 2,224
December 1 1 484,190 484,190 484,190
Total 1,723,239
Starting during the month
Starting during the month
Number of mandays lost In progress during a
part or whole of the month
Month
Number of disputes Number of workers involved directly and / or indirectly in disputes
(BY MONTHS)
Table-3(i)(e)
2 3 1 4 5 6
In progress during a part or whole of the
month
Strikes in Public Sector in the Central Sphere during the year 2009
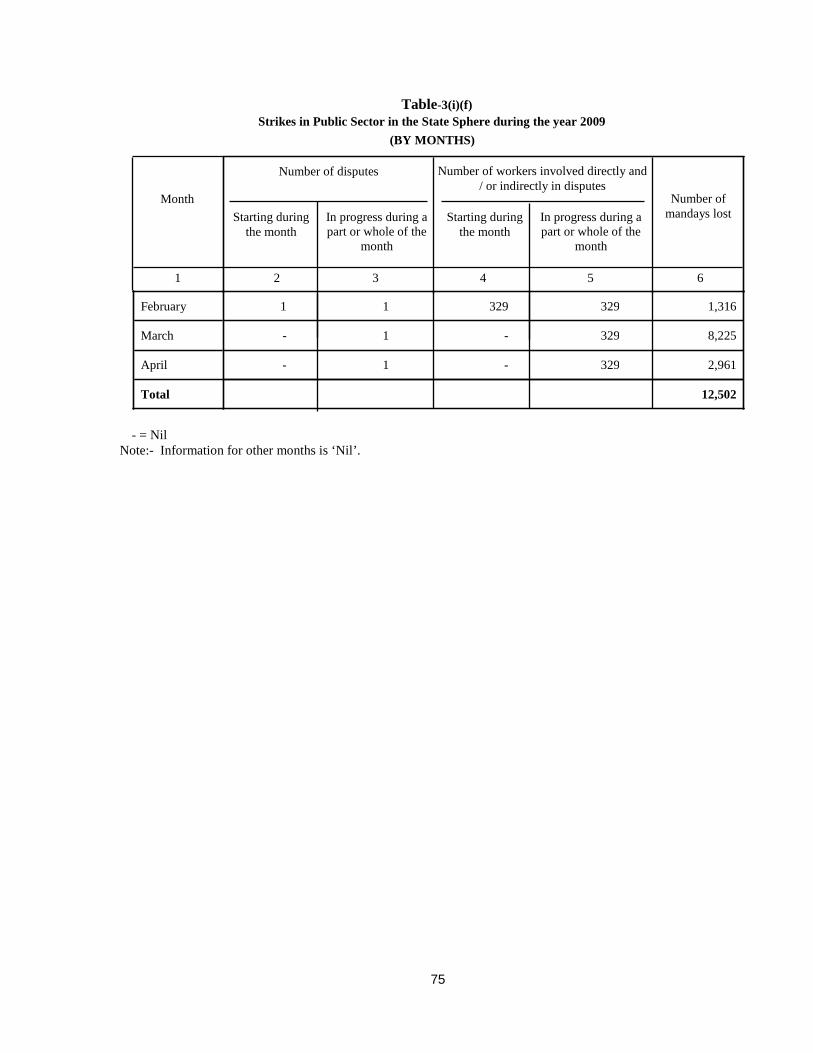
75
- = Nil Note:- Information for other months is ‘Nil’.
February 1 1 329 329 1,316
March - 1 - 329 8,225
April - 1 - 329 2,961
Total 12,502
Starting during the month
Starting during the month
Number of mandays lost In progress during a
part or whole of the month
Month
Number of disputes Number of workers involved directly and / or indirectly in disputes
(BY MONTHS)
Table-3(i)(f)
2 3 1 4 5 6
In progress during a part or whole of the
month
Strikes in Public Sector in the State Sphere during the year 2009
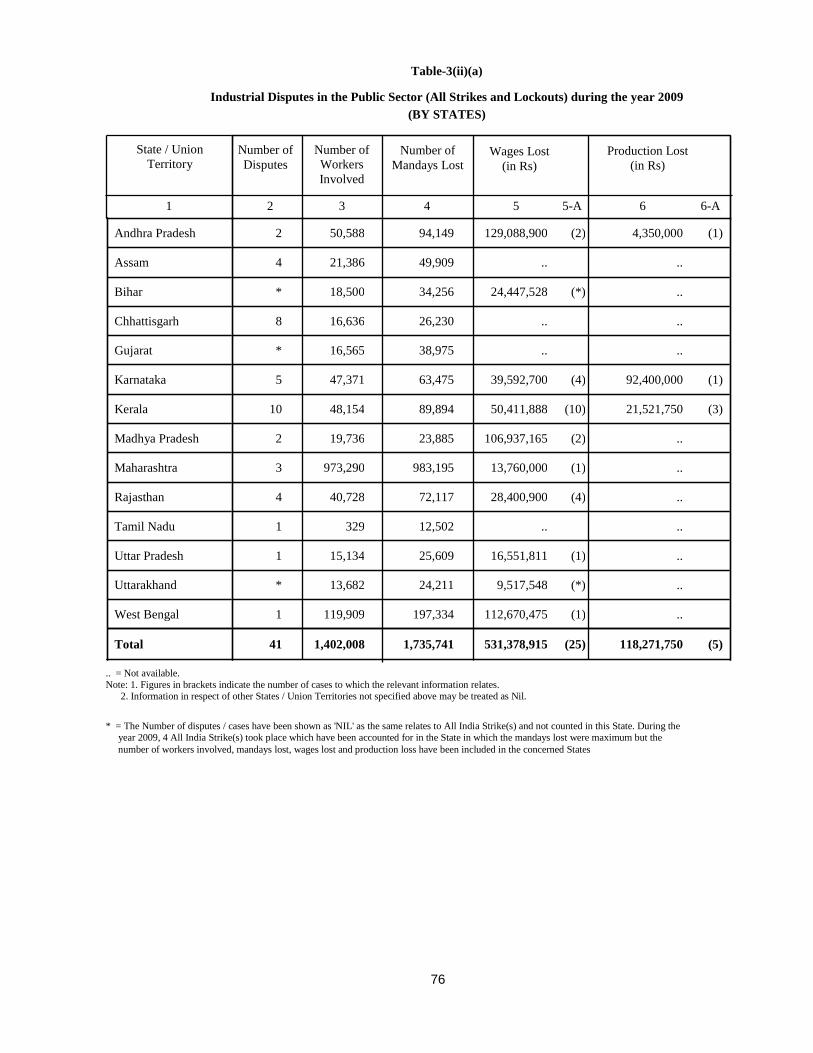
76
Andhra Pradesh 2 50,588 94,149 129,088,900 (2) 4,350,000 (1)
Assam 4 21,386 49,909 .. ..
Bihar * 18,500 34,256 24,447,528 (*) ..
Chhattisgarh 8 16,636 26,230 .. ..
Gujarat * 16,565 38,975 .. ..
Karnataka 5 47,371 63,475 39,592,700 (4) 92,400,000 (1)
Kerala 10 48,154 89,894 50,411,888 (10) 21,521,750 (3)
Madhya Pradesh 2 19,736 23,885 106,937,165 (2) ..
Maharashtra 3 973,290 983,195 13,760,000 (1) ..
Rajasthan 4 40,728 72,117 28,400,900 (4) ..
Tamil Nadu 1 329 12,502 .. ..
Uttar Pradesh 1 15,134 25,609 16,551,811 (1) ..
Uttarakhand * 13,682 24,211 9,517,548 (*) ..
West Bengal 1 119,909 197,334 112,670,475 (1) ..
Total 41 1,402,008 1,735,741 531,378,915 (25) 118,271,750 (5)
Production Lost (in Rs)
Wages Lost (in Rs)
Number of Mandays Lost
Number of Workers Involved
Number of Disputes
Industrial Disputes in the Public Sector (All Strikes and Lockouts) during the year 2009 Table-3(ii)(a)
(BY STATES)
State / Union Territory
6-A 6 5-A 5 4 3 2 1
.. = Not available. Note: 1. Figures in brackets indicate the number of cases to which the relevant information relates. 2. Information in respect of other States / Union Territories not specified above may be treated as Nil.
* = The Number of disputes / cases have been shown as 'NIL' as the same relates to All India Strike(s) and not counted in this State. During the year 2009, 4 All India Strike(s) took place which have been accounted for in the State in which the mandays lost were maximum but the number of workers involved, mandays lost, wages lost and production loss have been included in the concerned States
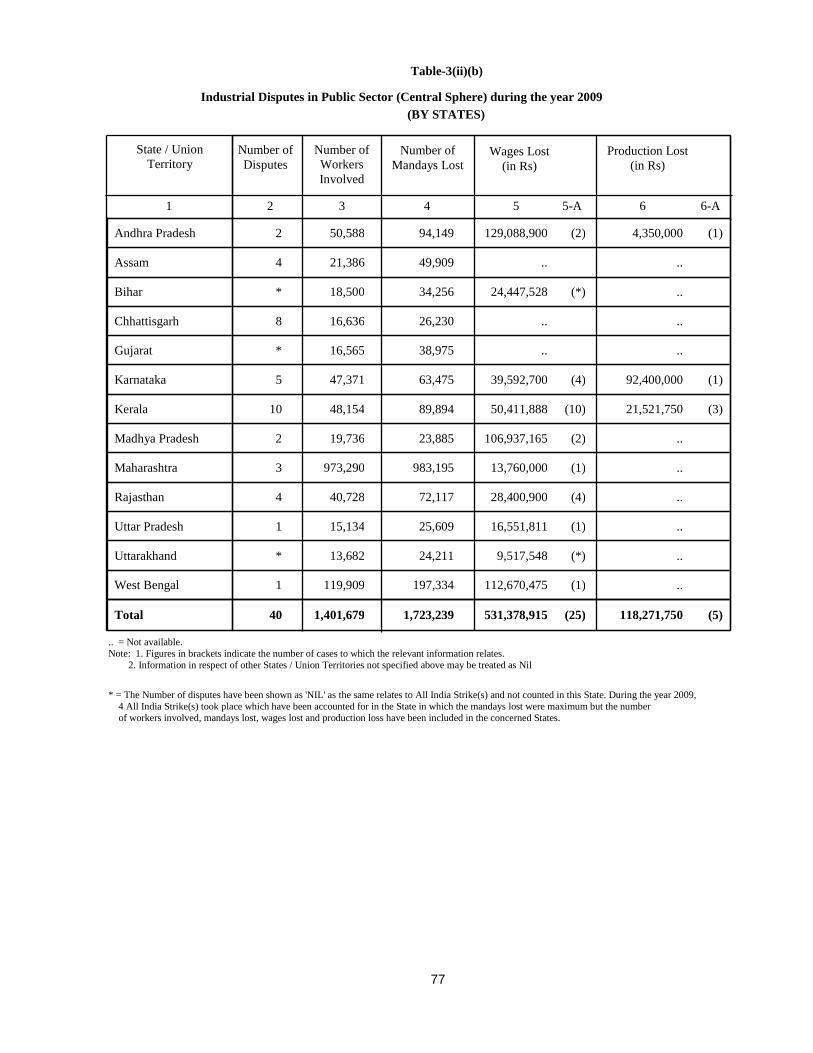
77
Andhra Pradesh 2 50,588 94,149 129,088,900 (2) 4,350,000 (1)
Assam 4 21,386 49,909 .. ..
Bihar * 18,500 34,256 24,447,528 (*) ..
Chhattisgarh 8 16,636 26,230 .. ..
Gujarat * 16,565 38,975 .. ..
Karnataka 5 47,371 63,475 39,592,700 (4) 92,400,000 (1)
Kerala 10 48,154 89,894 50,411,888 (10) 21,521,750 (3)
Madhya Pradesh 2 19,736 23,885 106,937,165 (2) ..
Maharashtra 3 973,290 983,195 13,760,000 (1) ..
Rajasthan 4 40,728 72,117 28,400,900 (4) ..
Uttar Pradesh 1 15,134 25,609 16,551,811 (1) ..
Uttarakhand * 13,682 24,211 9,517,548 (*) ..
West Bengal 1 119,909 197,334 112,670,475 (1) ..
Total 40 1,401,679 1,723,239 531,378,915 (25) 118,271,750 (5)
Production Lost (in Rs)
Wages Lost (in Rs)
Number of Mandays Lost
Number of Workers Involved
Number of Disputes
Industrial Disputes in Public Sector (Central Sphere) during the year 2009 Table-3(ii)(b)
(BY STATES)
State / Union Territory
6-A 6 5-A 5 4 3 2 1
.. = Not available. Note: 1. Figures in brackets indicate the number of cases to which the relevant information relates. 2. Information in respect of other States / Union Territories not specified above may be treated as Nil * = The Number of disputes have been shown as 'NIL' as the same relates to All India Strike(s) and not counted in this State. During the year 2009, 4 All India Strike(s) took place which have been accounted for in the State in which the mandays lost were maximum but the number of workers involved, mandays lost, wages lost and production loss have been included in the concerned States.
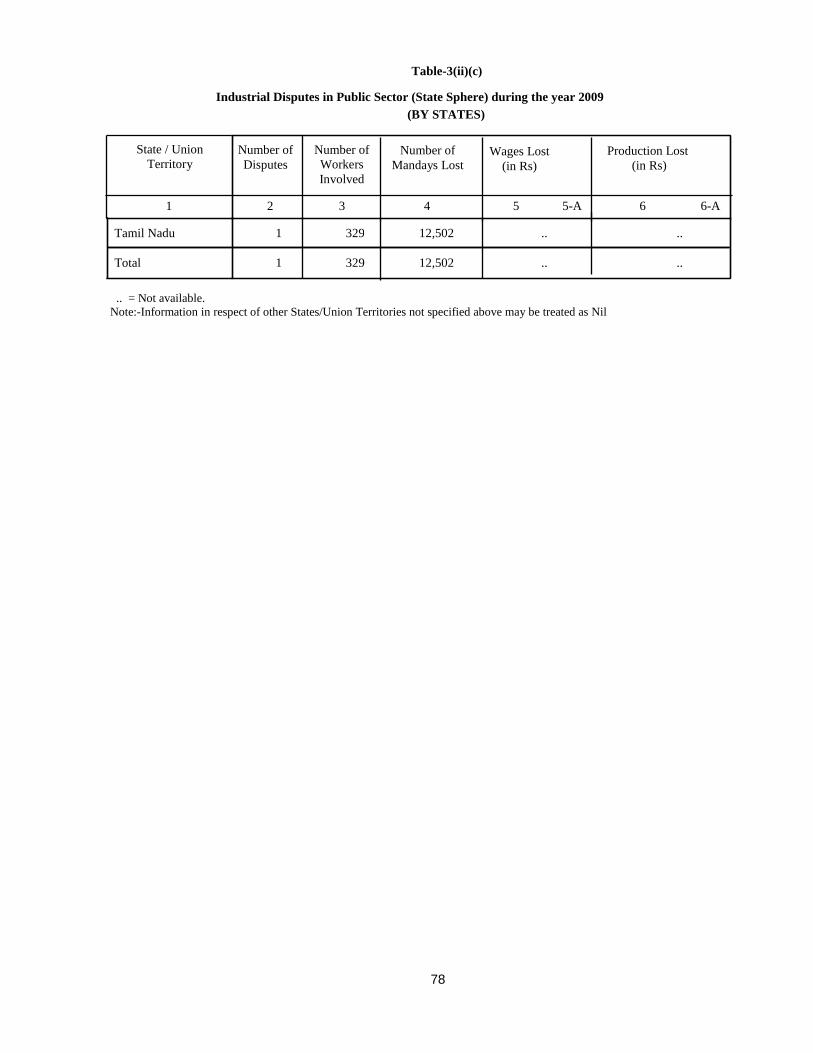
78
Tamil Nadu 1 329 12,502 .. ..
Total 1 329 12,502 .. ..
Production Lost (in Rs)
Wages Lost (in Rs)
Number of Mandays Lost
Number of Workers Involved
Number of Disputes
Industrial Disputes in Public Sector (State Sphere) during the year 2009 Table-3(ii)(c)
(BY STATES)
State / Union Territory
6-A 6 5-A 5 4 3 2 1
.. = Not available. Note:-Information in respect of other States/Union Territories not specified above may be treated as Nil

79
Andhra Pradesh 2 50,588 94,149 129,088,900 (2) 4,350,000 (1)
Assam 4 21,386 49,909 .. ..
Bihar * 18,500 34,256 24,447,528 (*) ..
Chhattisgarh 8 16,636 26,230 .. ..
Gujarat * 16,565 38,975 .. ..
Karnataka 5 47,371 63,475 39,592,700 (4) 92,400,000 (1)
Kerala 10 48,154 89,894 50,411,888 (10) 21,521,750 (3)
Madhya Pradesh 2 19,736 23,885 106,937,165 (2) ..
Maharashtra 3 973,290 983,195 13,760,000 (1) ..
Rajasthan 4 40,728 72,117 28,400,900 (4) ..
Tamil Nadu 1 329 12,502 0 ..
Uttar Pradesh 1 15,134 25,609 16,551,811 (1) ..
Uttarakhand * 13,682 24,211 9,517,548 (*) ..
West Bengal 1 119,909 197,334 112,670,475 (1) ..
Total 41 1,402,008 1,735,741 531,378,915 (25) 118,271,750 (5)
Production Lost (in Rs)
Wages Lost (in Rs)
Number of Mandays Lost
Number of Workers Involved
Number of Disputes
Strikes in Public Sector (Central and State Spheres) during the year 2009 Table-3(ii)(d)
(BY STATES)
State / Union Territory
6-A 6 5-A 5 4 3 2 1
.. = Not available. Note: 1. Figures in brackets indicate the number of cases to which the relevant information relates. 2. Information in respect of other States / Union Territories not specified above may be treated as Nil. * = The Number of disputes / cases have been shown as 'NIL' as the same relates to All India Strike(s) and not counted in this States. During the year 2009, 4 All India Strike(s) took place which have been accounted for in the State in which the mandays lost were maximum but the number of workers involved, mandays lost, wages lost and production loss have been included in the concerned States.
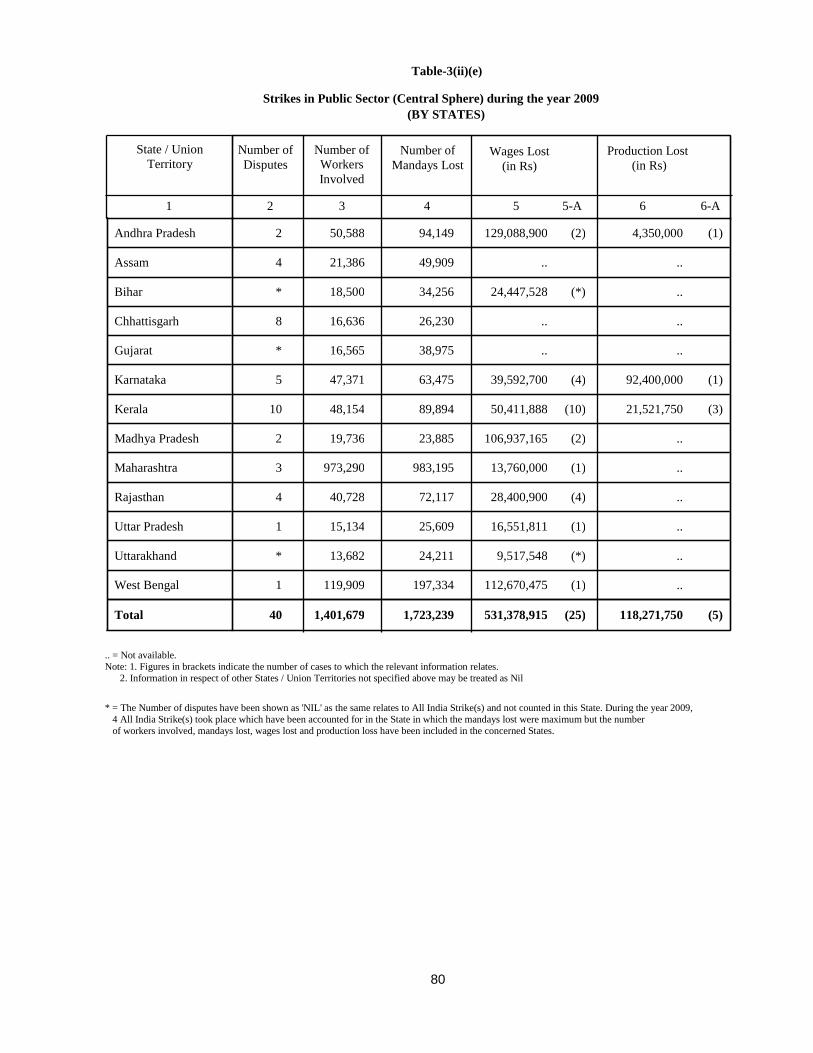
80
Andhra Pradesh 2 50,588 94,149 129,088,900 (2) 4,350,000 (1)
Assam 4 21,386 49,909 .. ..
Bihar * 18,500 34,256 24,447,528 (*) ..
Chhattisgarh 8 16,636 26,230 .. ..
Gujarat * 16,565 38,975 .. ..
Karnataka 5 47,371 63,475 39,592,700 (4) 92,400,000 (1)
Kerala 10 48,154 89,894 50,411,888 (10) 21,521,750 (3)
Madhya Pradesh 2 19,736 23,885 106,937,165 (2) ..
Maharashtra 3 973,290 983,195 13,760,000 (1) ..
Rajasthan 4 40,728 72,117 28,400,900 (4) ..
Uttar Pradesh 1 15,134 25,609 16,551,811 (1) ..
Uttarakhand * 13,682 24,211 9,517,548 (*) ..
West Bengal 1 119,909 197,334 112,670,475 (1) ..
Total 40 1,401,679 1,723,239 531,378,915 (25) 118,271,750 (5)
Production Lost (in Rs)
Wages Lost (in Rs)
Number of Mandays Lost
Number of Workers Involved
Number of Disputes
Strikes in Public Sector (Central Sphere) during the year 2009
Table-3(ii)(e)
(BY STATES)
State / Union Territory
6-A 6 5-A 5 4 3 2 1
.. = Not available. Note: 1. Figures in brackets indicate the number of cases to which the relevant information relates. 2. Information in respect of other States / Union Territories not specified above may be treated as Nil * = The Number of disputes have been shown as 'NIL' as the same relates to All India Strike(s) and not counted in this State. During the year 2009, 4 All India Strike(s) took place which have been accounted for in the State in which the mandays lost were maximum but the number of workers involved, mandays lost, wages lost and production loss have been included in the concerned States.
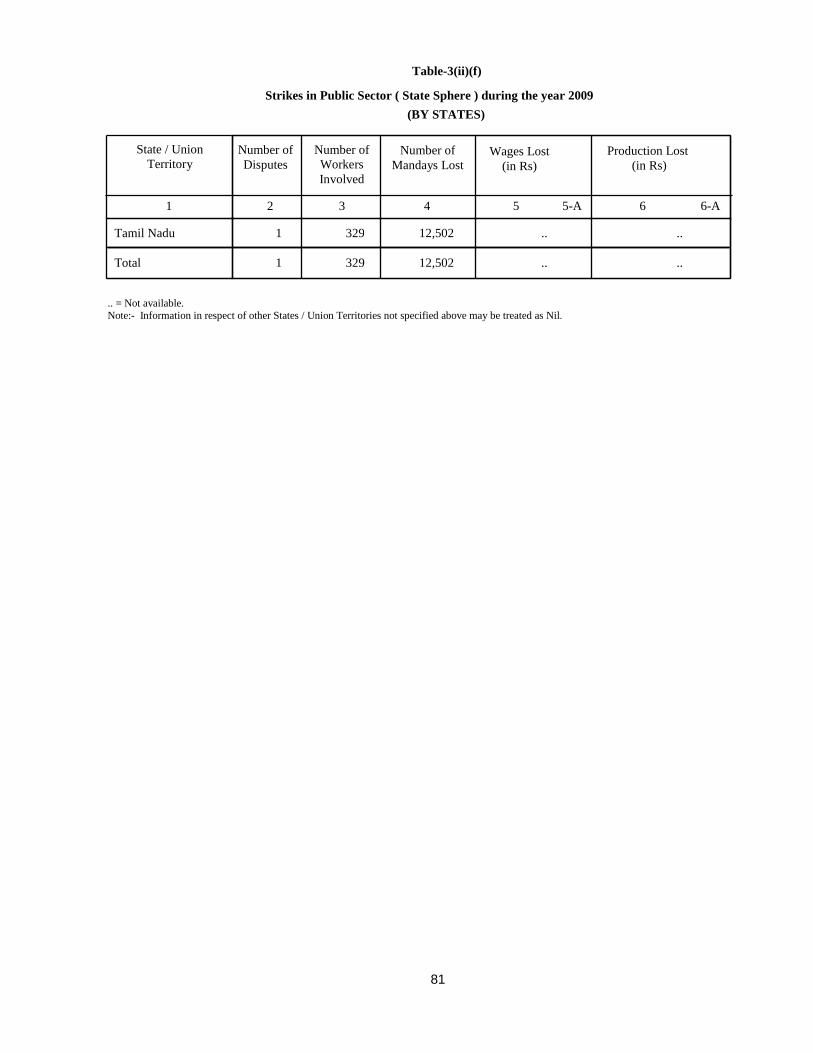
81
Tamil Nadu 1 329 12,502 .. ..
Total 1 329 12,502 .. ..
Production Lost (in Rs)
Wages Lost (in Rs)
Number of Mandays Lost
Number of Workers Involved
Number of Disputes
Strikes in Public Sector ( State Sphere ) during the year 2009 Table-3(ii)(f)
(BY STATES)
State / Union Territory
6-A 6 5-A 5 4 3 2 1
.. = Not available. Note:- Information in respect of other States / Union Territories not specified above may be treated as Nil.

82
.. = Not available Note:- 1. Figures in brackets indicate the number of cases to which the relevant information relates. 2. See Annexure for the legend corresponding to the NIC-2004 code number. * = The Number of disputes/cases have been shown as 'NIL' as the same relates to All India Strike(s) and not counted in this Industry. During the year
2009, four All India Strike(s) took place which have been accounted for in the Industry in which the mandays lost were maximum but the number of workers involved, mandays lost, wages lost and production loss have been included in the concerned Industries.
101 1 648 648 907,200 (1) 4,350,000 (1) 10 1 648 648 907,200 (1) 4,350,000 (1) 111 1 18,086 54,136 2,789,000 (*) .. 112 * 1,360 3,961 1,040,000 (*) .. 11 1 19,446 58,097 3,829,000 (*) .. 131 1 4,000 4,000 .. .. 132 1 935 935 375,000 (1) 700,000 (1) 13 2 4,935 4,935 375,000 (1) 700,000 (1) 171 2 450 16,831 758,100 (1) 12,823,750 (1) 17 2 450 16,831 758,100 (1) 12,823,750 (1) 251 1 1,015 1,015 719,000 (1) 7,998,000 (1) 25 1 1,015 1,015 719,000 (1) 7,998,000 (1) 321 1 5,058 5,058 4,835,000 (1) 92,400,000 (1) 32 1 5,058 5,058 4,835,000 (1) 92,400,000 (1)
Total - 15 to 37- Mfg. Group 4 6,523 22,904 6,312,100 (3) 113,221,750 (3) 611 3 782 8,996 4,048,200 (3) .. 61 3 782 8,996 4,048,200 (3) .. 621 1 72 288 1,440,000 (1) .. 62 1 72 288 1,440,000 (1) .. 630 1 29 58 .. .. 63 1 29 58 .. .. 641 * 3,904 3,904 81,340 (*) .. 642 6 15,438 30,376 11,041,040 (2) .. 64 6 19,342 34,280 11,122,380 (2) .. 651 18 1,343,724 1,601,308 501,559,835 (13) .. 65 18 1,343,724 1,601,308 501,559,835 (12) .. 660 4 6,507 4,227 1,785,200 (2) .. 66 4 6,507 4,227 1,785,200 (2) ..
Total 41 1,402,008 1,735,741 531,378,915 (25) 118,271,750 (5)
Production Lost (in Rs.)
Wages Lost (in Rs.)
Number of Mandays Lost
Number of Workers Involved
Number of Disputes
Industrial Disputes in Public Sector Classified by Industries during the year 2009 Table-3(iii)(a)
(BY INDUSTRY)
Industry Code (NIC-2004)
6-A 6 5-A 5 4 3 2 1
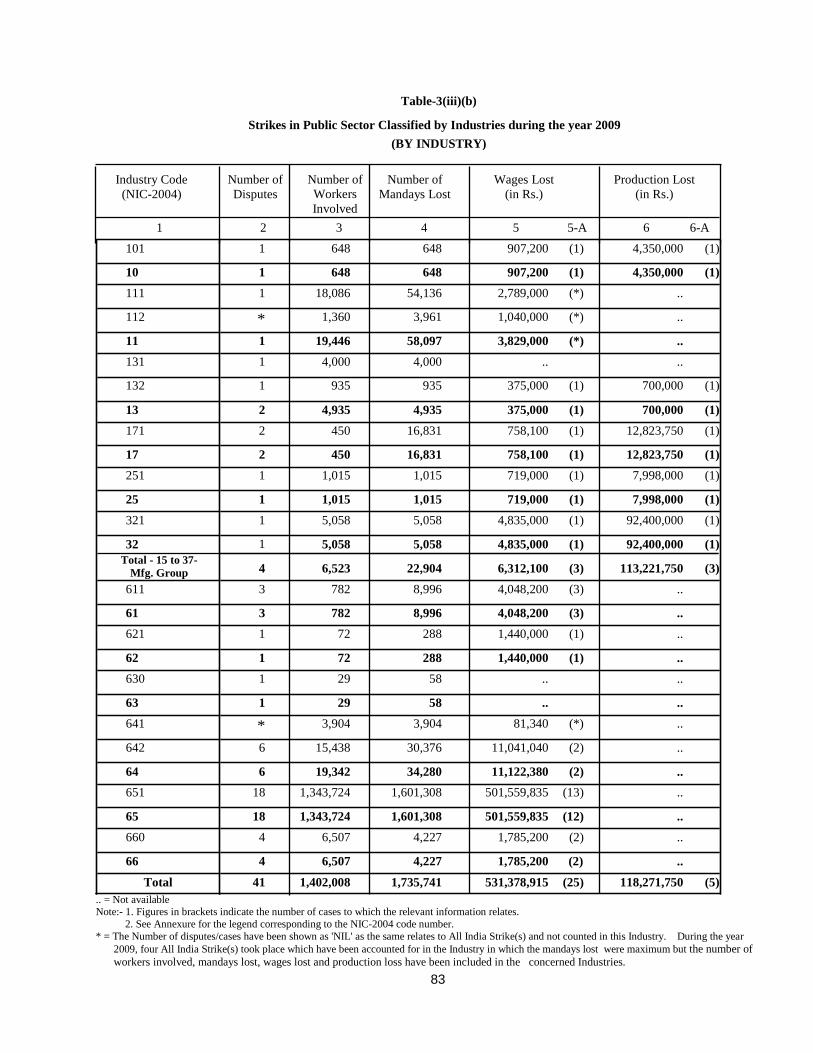
83
.. = Not available Note:- 1. Figures in brackets indicate the number of cases to which the relevant information relates. 2. See Annexure for the legend corresponding to the NIC-2004 code number. * = The Number of disputes/cases have been shown as 'NIL' as the same relates to All India Strike(s) and not counted in this Industry. During the year
2009, four All India Strike(s) took place which have been accounted for in the Industry in which the mandays lost were maximum but the number of workers involved, mandays lost, wages lost and production loss have been included in the concerned Industries.
101 1 648 648 907,200 (1) 4,350,000 (1) 10 1 648 648 907,200 (1) 4,350,000 (1) 111 1 18,086 54,136 2,789,000 (*) .. 112 * 1,360 3,961 1,040,000 (*) .. 11 1 19,446 58,097 3,829,000 (*) .. 131 1 4,000 4,000 .. .. 132 1 935 935 375,000 (1) 700,000 (1) 13 2 4,935 4,935 375,000 (1) 700,000 (1) 171 2 450 16,831 758,100 (1) 12,823,750 (1) 17 2 450 16,831 758,100 (1) 12,823,750 (1) 251 1 1,015 1,015 719,000 (1) 7,998,000 (1) 25 1 1,015 1,015 719,000 (1) 7,998,000 (1) 321 1 5,058 5,058 4,835,000 (1) 92,400,000 (1) 32 1 5,058 5,058 4,835,000 (1) 92,400,000 (1)
Total - 15 to 37- Mfg. Group 4 6,523 22,904 6,312,100 (3) 113,221,750 (3)
611 3 782 8,996 4,048,200 (3) .. 61 3 782 8,996 4,048,200 (3) .. 621 1 72 288 1,440,000 (1) .. 62 1 72 288 1,440,000 (1) .. 630 1 29 58 .. .. 63 1 29 58 .. .. 641 * 3,904 3,904 81,340 (*) .. 642 6 15,438 30,376 11,041,040 (2) .. 64 6 19,342 34,280 11,122,380 (2) .. 651 18 1,343,724 1,601,308 501,559,835 (13) .. 65 18 1,343,724 1,601,308 501,559,835 (12) .. 660 4 6,507 4,227 1,785,200 (2) .. 66 4 6,507 4,227 1,785,200 ..
Total 41 1,402,008 1,735,741 531,378,915 (25) 118,271,750 (5)
Production Lost (in Rs.)
Wages Lost (in Rs.)
Number of Mandays Lost
Number of Workers Involved
Number of Disputes
Strikes in Public Sector Classified by Industries during the year 2009 Table-3(iii)(b)
(BY INDUSTRY)
Industry Code (NIC-2004)
6-A 6 5-A 5 4 3 2 1
(2)
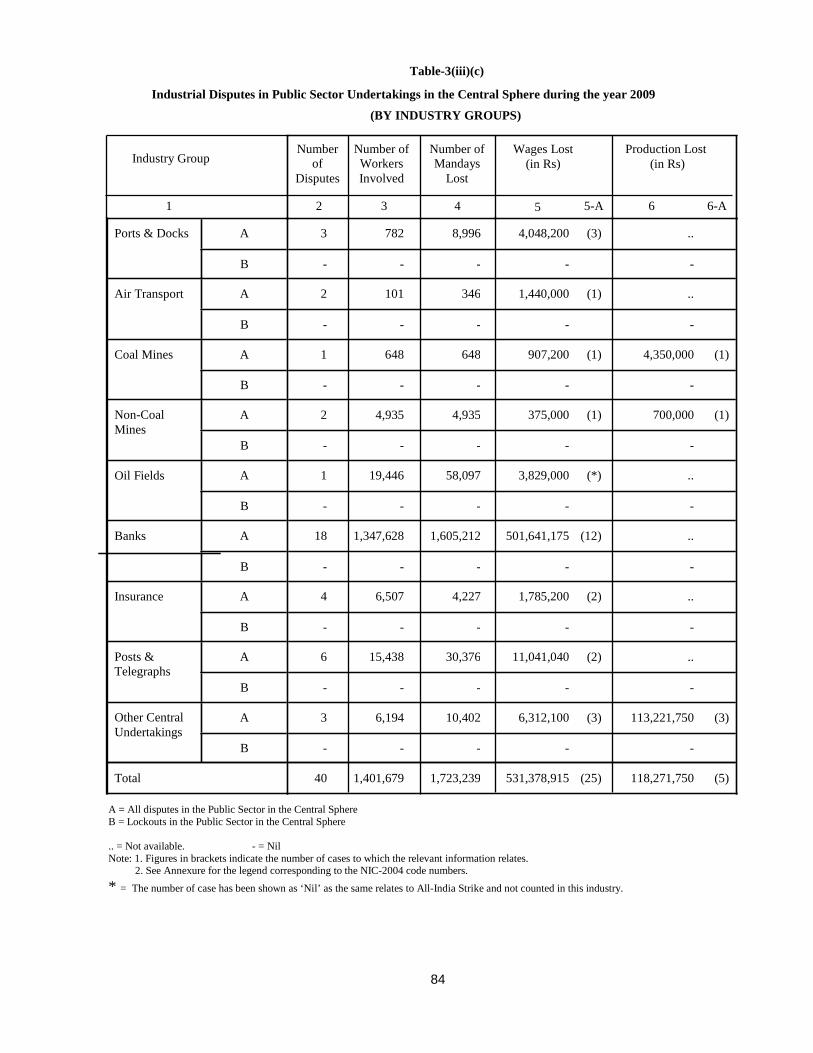
84
Ports & Docks A 3 782 8,996 4,048,200 (3) ..
B - - - - -
Air Transport A 2 101 346 1,440,000 (1) ..
B - - - - -
Coal Mines A 1 648 648 907,200 (1) 4,350,000 (1)
B - - - - -
Non-Coal Mines
A 2 4,935 4,935 375,000 (1) 700,000 (1)
B - - - - -
Oil Fields A 1 19,446 58,097 3,829,000 (*) ..
B - - - - -
Banks A 18 1,347,628 1,605,212 501,641,175 (12) ..
B - - - - -
Insurance A 4 6,507 4,227 1,785,200 (2) ..
B - - - - -
Posts & Telegraphs
A 6 15,438 30,376 11,041,040 (2) ..
B - - - - -
Other Central Undertakings
A 3 6,194 10,402 6,312,100 (3) 113,221,750 (3)
B - - - - -
Total 40 1,401,679 1,723,239 531,378,915 (25) 118,271,750 (5)
Production Lost (in Rs)
Wages Lost (in Rs)
Number of Mandays
Lost
Number of Workers Involved
Number of
Disputes
Industrial Disputes in Public Sector Undertakings in the Central Sphere during the year 2009 Table-3(iii)(c)
(BY INDUSTRY GROUPS)
Industry Group
6-A 6 5-A 5 4 3 2 1
A = All disputes in the Public Sector in the Central Sphere B = Lockouts in the Public Sector in the Central Sphere .. = Not available. - = Nil Note: 1. Figures in brackets indicate the number of cases to which the relevant information relates. 2. See Annexure for the legend corresponding to the NIC-2004 code numbers.
* = The number of case has been shown as ‘Nil’ as the same relates to All-India Strike and not counted in this industry.
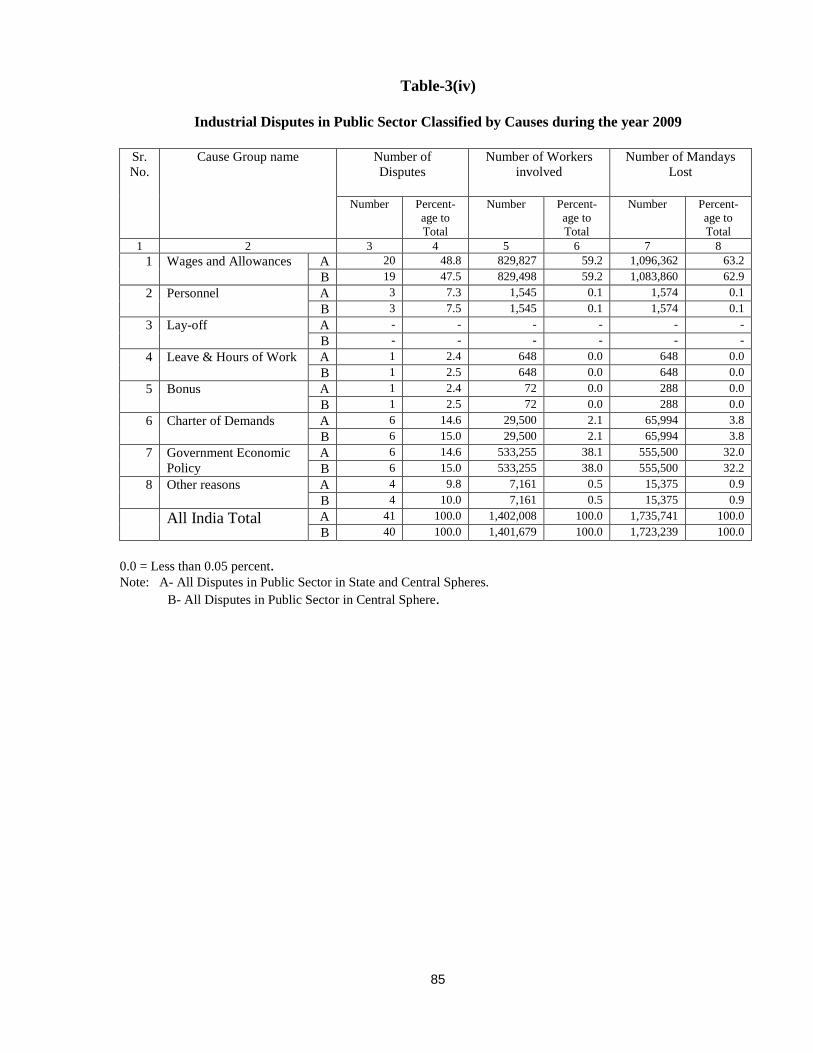
85
Table-3(iv)
Industrial Disputes in Public Sector Classified by Causes during the year 2009
Sr. No.
Cause Group name
Number of Disputes
Number of Workers involved
Number of Mandays Lost
Number Percent-age to Total
Number Percent- age to Total
Number Percent-age to Total
1 2 3 4 5 6 7 8 1 Wages and Allowances A 20 48.8 829,827 59.2 1,096,362 63.2
B 19 47.5 829,498 59.2 1,083,860 62.9 2 Personnel A 3 7.3 1,545 0.1 1,574 0.1
B 3 7.5 1,545 0.1 1,574 0.1 3 Lay-off A - - - - - -
B - - - - - - 4 Leave & Hours of Work A 1 2.4 648 0.0 648 0.0
B 1 2.5 648 0.0 648 0.0 5 Bonus A 1 2.4 72 0.0 288 0.0
B 1 2.5 72 0.0 288 0.0 6 Charter of Demands A 6 14.6 29,500 2.1 65,994 3.8
B 6 15.0 29,500 2.1 65,994 3.8 7 Government Economic
Policy A 6 14.6 533,255 38.1 555,500 32.0 B 6 15.0 533,255 38.0 555,500 32.2
8 Other reasons A 4 9.8 7,161 0.5 15,375 0.9 B 4 10.0 7,161 0.5 15,375 0.9
All India Total A 41 100.0 1,402,008 100.0 1,735,741 100.0 B 40 100.0 1,401,679 100.0 1,723,239 100.0
0.0 = Less than 0.05 percent. Note: A- All Disputes in Public Sector in State and Central Spheres. B- All Disputes in Public Sector in Central Sphere.
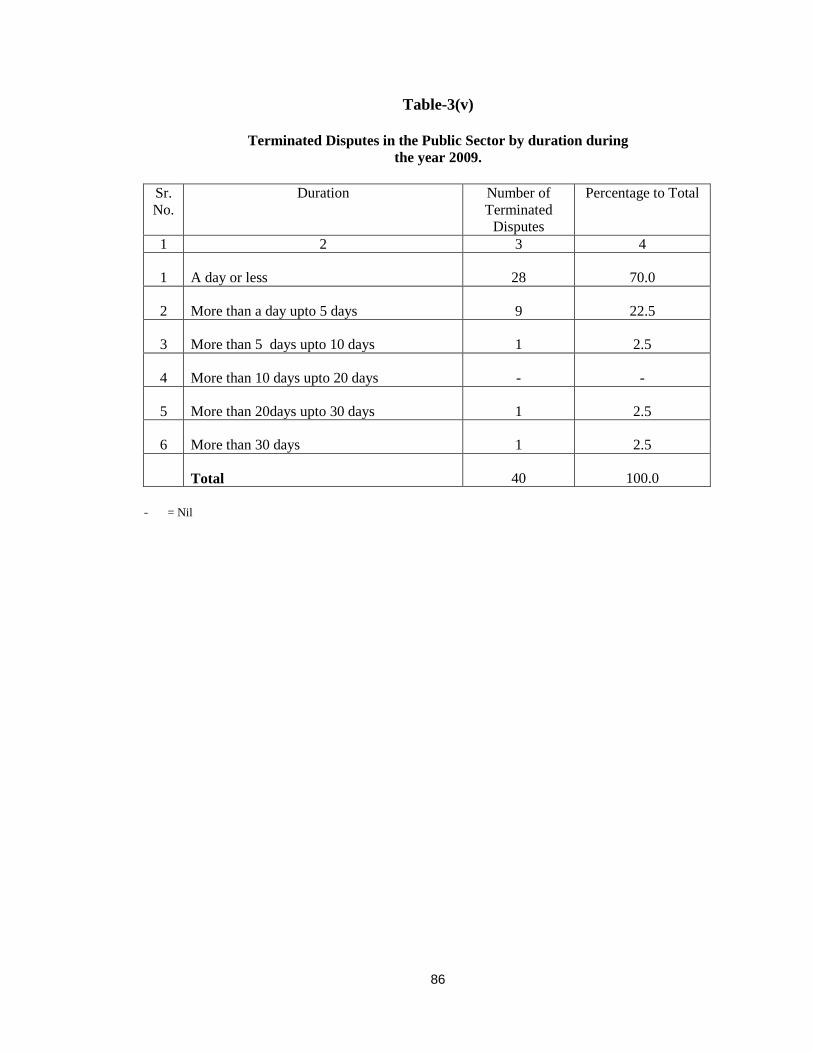
86
Table-3(v)
Terminated Disputes in the Public Sector by duration during
the year 2009.
Sr.No.
Duration Number of Terminated
Disputes
Percentage to Total
1 2 3 4
1 A day or less 28 70.0
2 More than a day upto 5 days 9 22.5
3 More than 5 days upto 10 days 1 2.5
4 More than 10 days upto 20 days - -
5 More than 20days upto 30 days 1 2.5
6 More than 30 days 1 2.5
Total 40 100.0
- = Nil
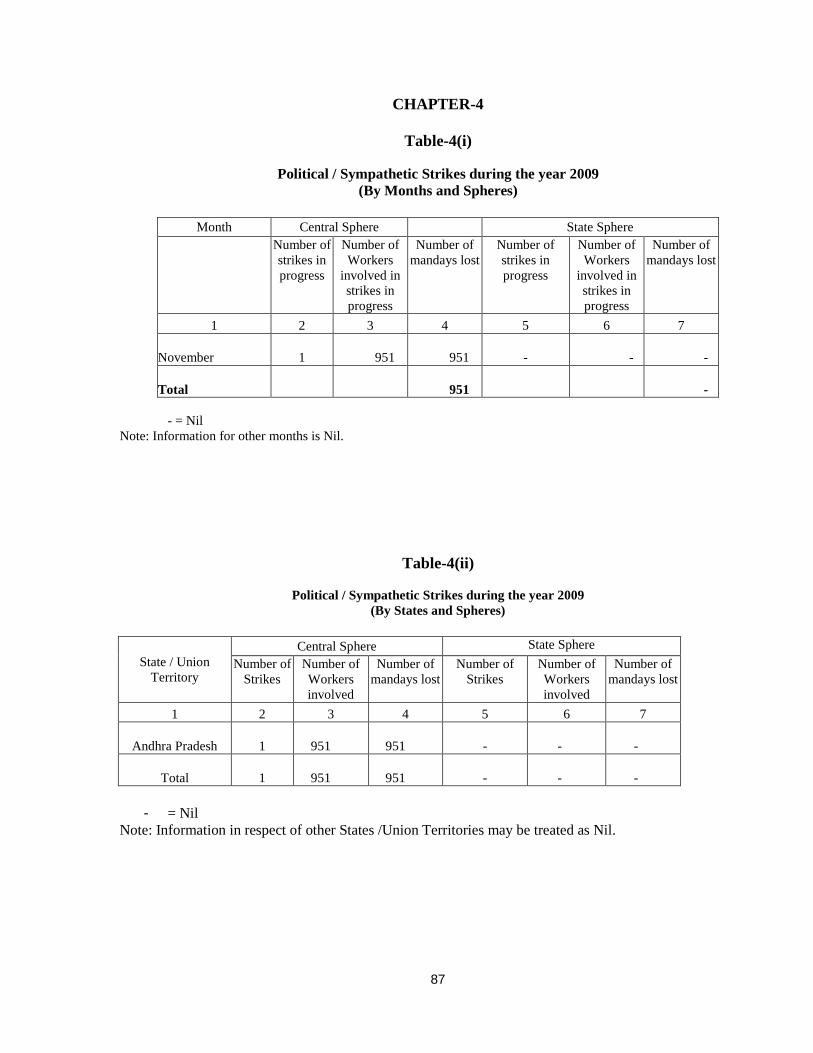
87
CHAPTER-4
Table-4(i)
Political / Sympathetic Strikes during the year 2009
(By Months and Spheres)
Month Central Sphere State Sphere
Number of strikes in progress
Number of Workers
involved in strikes in progress
Number of mandays lost
Number of strikes in progress
Number of Workers
involved in strikes in progress
Number of mandays lost
1 2 3 4 5 6 7
November 1 951 951 - - -
Total 951 -
- = Nil Note: Information for other months is Nil.
Table-4(ii)
Political / Sympathetic Strikes during the year 2009 (By States and Spheres)
State / Union Territory
Central Sphere State Sphere Number of
Strikes Number of Workers involved
Number of mandays lost
Number of Strikes
Number of Workers involved
Number of mandays lost
1 2 3 4 5 6 7
Andhra Pradesh 1 951 951 - - -
Total 1 951 951 - - -
- = Nil Note: Information in respect of other States /Union Territories may be treated as Nil.
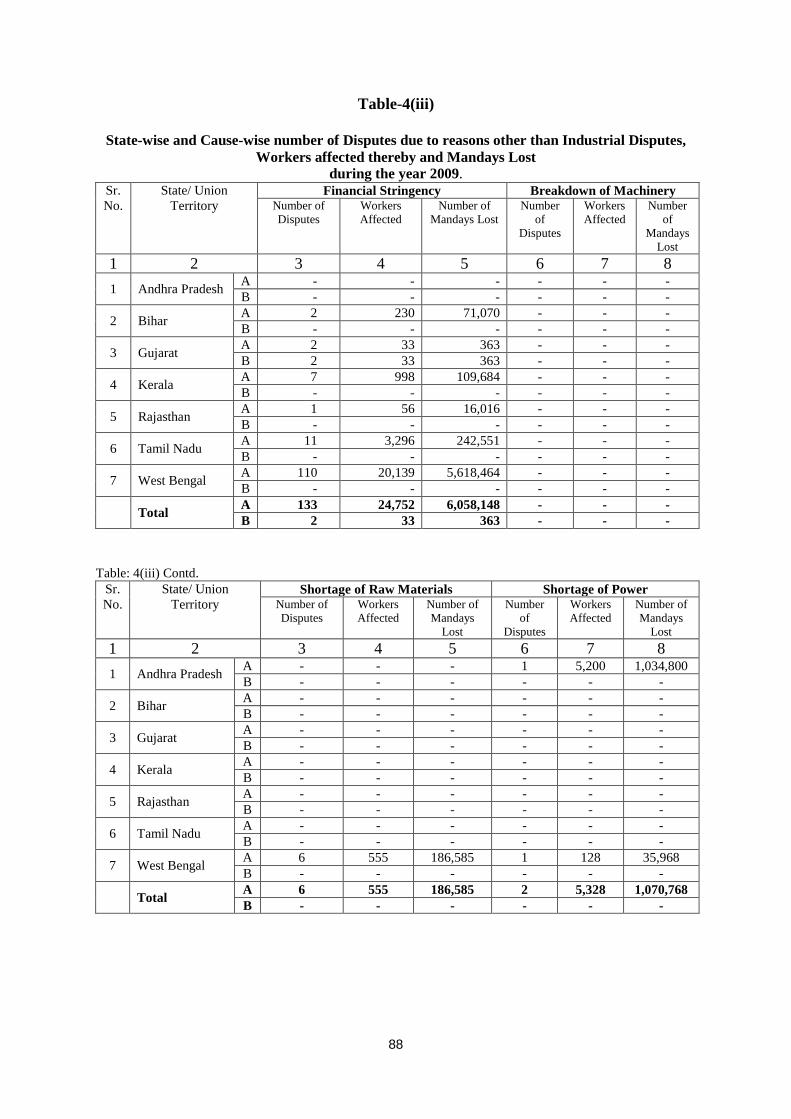
88
Table-4(iii)
State-wise and Cause-wise number of Disputes due to reasons other than Industrial Disputes, Workers affected thereby and Mandays Lost
during the year 2009. Sr. No.
State/ Union Territory
Financial Stringency Breakdown of Machinery Number of Disputes
Workers Affected
Number of Mandays Lost
Number of
Disputes
Workers Affected
Number of
Mandays Lost
1 2 3 4 5 6 7 8 1 Andhra Pradesh A - - - - - -
B - - - - - -
2 Bihar A 2 230 71,070 - - - B - - - - - -
3 Gujarat A 2 33 363 - - - B 2 33 363 - - -
4 Kerala A 7 998 109,684 - - - B - - - - - -
5 Rajasthan A 1 56 16,016 - - - B - - - - - -
6 Tamil Nadu A 11 3,296 242,551 - - - B - - - - - -
7 West Bengal A 110 20,139 5,618,464 - - - B - - - - - -
Total A 133 24,752 6,058,148 - - - B 2 33 363 - - -
Table: 4(iii) Contd.
Sr. No.
State/ Union Territory
Shortage of Raw Materials Shortage of Power Number of Disputes
Workers Affected
Number of Mandays
Lost
Number of
Disputes
Workers Affected
Number of Mandays
Lost 1 2 3 4 5 6 7 8 1 Andhra Pradesh A - - - 1 5,200 1,034,800
B - - - - - -
2 Bihar A - - - - - - B - - - - - -
3 Gujarat A - - - - - - B - - - - - -
4 Kerala A - - - - - - B - - - - - -
5 Rajasthan A - - - - - - B - - - - - -
6 Tamil Nadu A - - - - - - B - - - - - -
7 West Bengal A 6 555 186,585 1 128 35,968 B - - - - - -
Total A 6 555 186,585 2 5,328 1,070,768 B - - - - - -
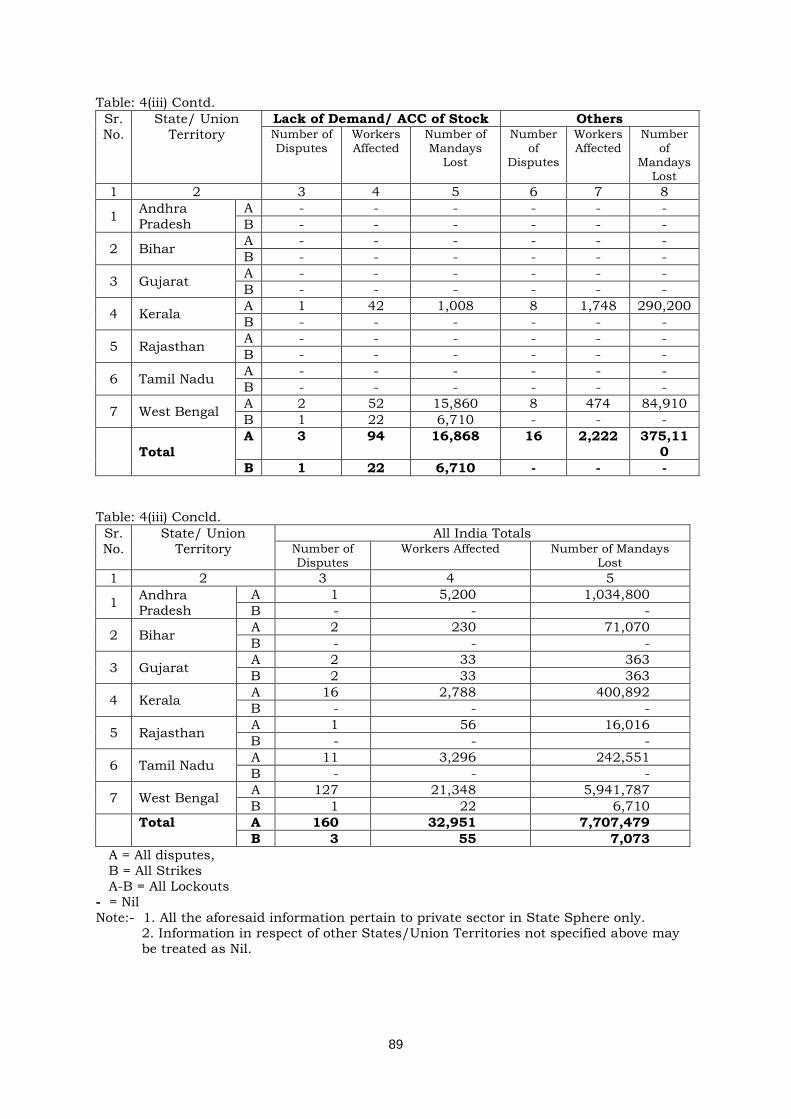
89
Table: 4(iii) Contd. Sr. No.
State/ Union Territory
Lack of Demand/ ACC of Stock Others Number of Disputes
Workers Affected
Number of Mandays
Lost
Number of
Disputes
Workers Affected
Number of
Mandays Lost
1 2 3 4 5 6 7 8
1 Andhra Pradesh
A - - - - - - B - - - - - -
2 Bihar A - - - - - - B - - - - - -
3 Gujarat A - - - - - - B - - - - - -
4 Kerala A 1 42 1,008 8 1,748 290,200 B - - - - - -
5 Rajasthan A - - - - - - B - - - - - -
6 Tamil Nadu A - - - - - - B - - - - - -
7 West Bengal A 2 52 15,860 8 474 84,910 B 1 22 6,710 - - -
Total A 3 94 16,868 16 2,222 375,11
0 B 1 22 6,710 - - -
Table: 4(iii) Concld. Sr. No.
State/ Union Territory
All India Totals Number of Disputes
Workers Affected Number of Mandays Lost
1 2 3 4 5
1 Andhra Pradesh
A 1 5,200 1,034,800 B - - -
2 Bihar A 2 230 71,070 B - - -
3 Gujarat A 2 33 363 B 2 33 363
4 Kerala A 16 2,788 400,892 B - - -
5 Rajasthan A 1 56 16,016 B - - -
6 Tamil Nadu A 11 3,296 242,551 B - - -
7 West Bengal A 127 21,348 5,941,787 B 1 22 6,710
Total A 160 32,951 7,707,479 B 3 55 7,073
A = All disputes, B = All Strikes A-B = All Lockouts - = Nil Note:- 1. All the aforesaid information pertain to private sector in State Sphere only.
2. Information in respect of other States/Union Territories not specified above may be treated as Nil.
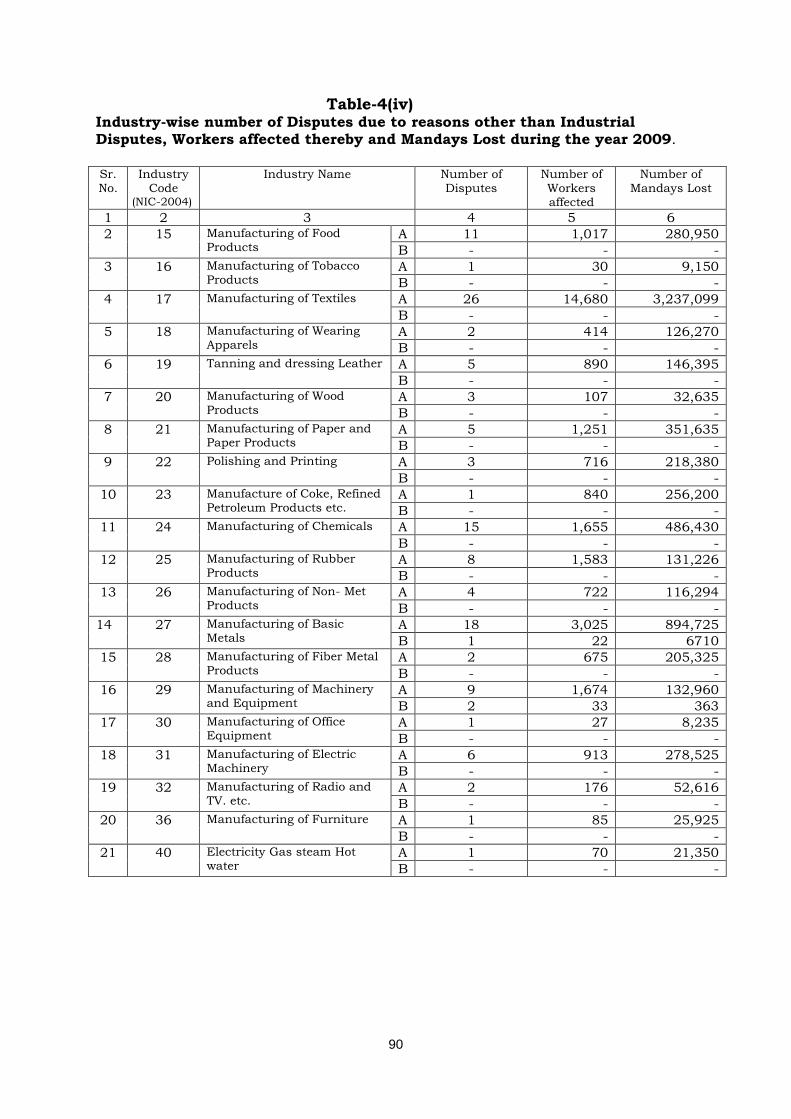
90
Table-4(iv) Industry-wise number of Disputes due to reasons other than Industrial Disputes, Workers affected thereby and Mandays Lost during the year 2009.
Sr. No.
Industry Code
(NIC-2004)
Industry Name Number of Disputes
Number of Workers affected
Number of Mandays Lost
1 2 3 4 5 6 2 15 Manufacturing of Food
Products A 11 1,017 280,950 B - - -
3 16 Manufacturing of Tobacco Products
A 1 30 9,150 B - - -
4 17 Manufacturing of Textiles A 26 14,680 3,237,099 B - - -
5 18 Manufacturing of Wearing Apparels
A 2 414 126,270 B - - -
6 19 Tanning and dressing Leather A 5 890 146,395 B - - -
7 20 Manufacturing of Wood Products
A 3 107 32,635 B - - -
8 21 Manufacturing of Paper and Paper Products
A 5 1,251 351,635 B - - -
9 22 Polishing and Printing A 3 716 218,380 B - - -
10 23 Manufacture of Coke, Refined Petroleum Products etc.
A 1 840 256,200 B - - -
11 24 Manufacturing of Chemicals A 15 1,655 486,430 B - - -
12
25 Manufacturing of Rubber Products
A 8 1,583 131,226 B - - -
13 26 Manufacturing of Non- Met Products
A 4 722 116,294 B - - -
14 27 Manufacturing of Basic Metals
A 18 3,025 894,725 B 1 22 6710
15 28 Manufacturing of Fiber Metal Products
A 2 675 205,325 B - - -
16 29 Manufacturing of Machinery and Equipment
A 9 1,674 132,960 B 2 33 363
17 30 Manufacturing of Office Equipment
A 1 27 8,235 B - - -
18 31 Manufacturing of Electric Machinery
A 6 913 278,525 B - - -
19 32 Manufacturing of Radio and TV. etc.
A 2 176 52,616 B - - -
20 36 Manufacturing of Furniture A 1 85 25,925 B - - -
21 40 Electricity Gas steam Hot water
A 1 70 21,350 B - - -
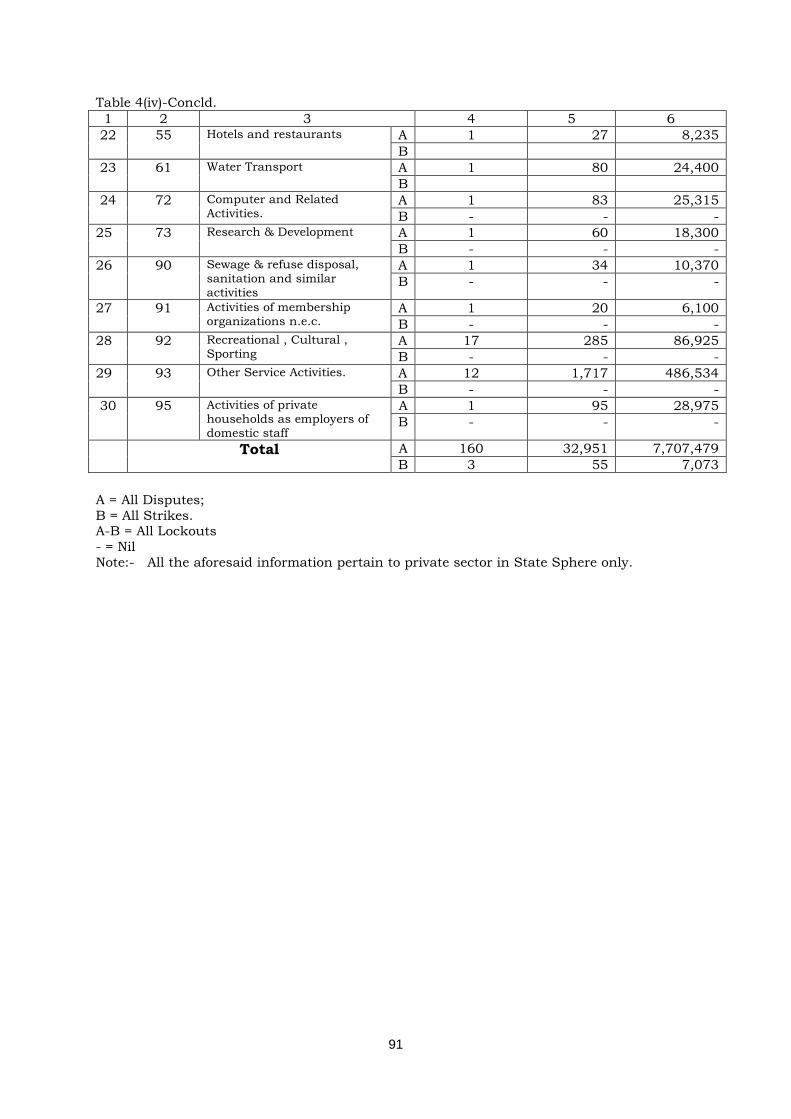
91
Table 4(iv)-Concld. 1 2 3 4 5 6 22 55 Hotels and restaurants A 1 27 8,235
B 23 61 Water Transport A 1 80 24,400
B 24 72 Computer and Related
Activities. A 1 83 25,315 B - - -
25 73 Research & Development A 1 60 18,300 B - - -
26 90 Sewage & refuse disposal, sanitation and similar activities
A 1 34 10,370 B - - -
27 91 Activities of membership organizations n.e.c.
A 1 20 6,100 B - - -
28 92 Recreational , Cultural , Sporting
A 17 285 86,925 B - - -
29 93 Other Service Activities. A 12 1,717 486,534 B - - -
30 95 Activities of private households as employers of domestic staff
A 1 95 28,975 B - - -
Total A 160 32,951 7,707,479 B 3 55 7,073
A = All Disputes; B = All Strikes. A-B = All Lockouts - = Nil Note:- All the aforesaid information pertain to private sector in State Sphere only.
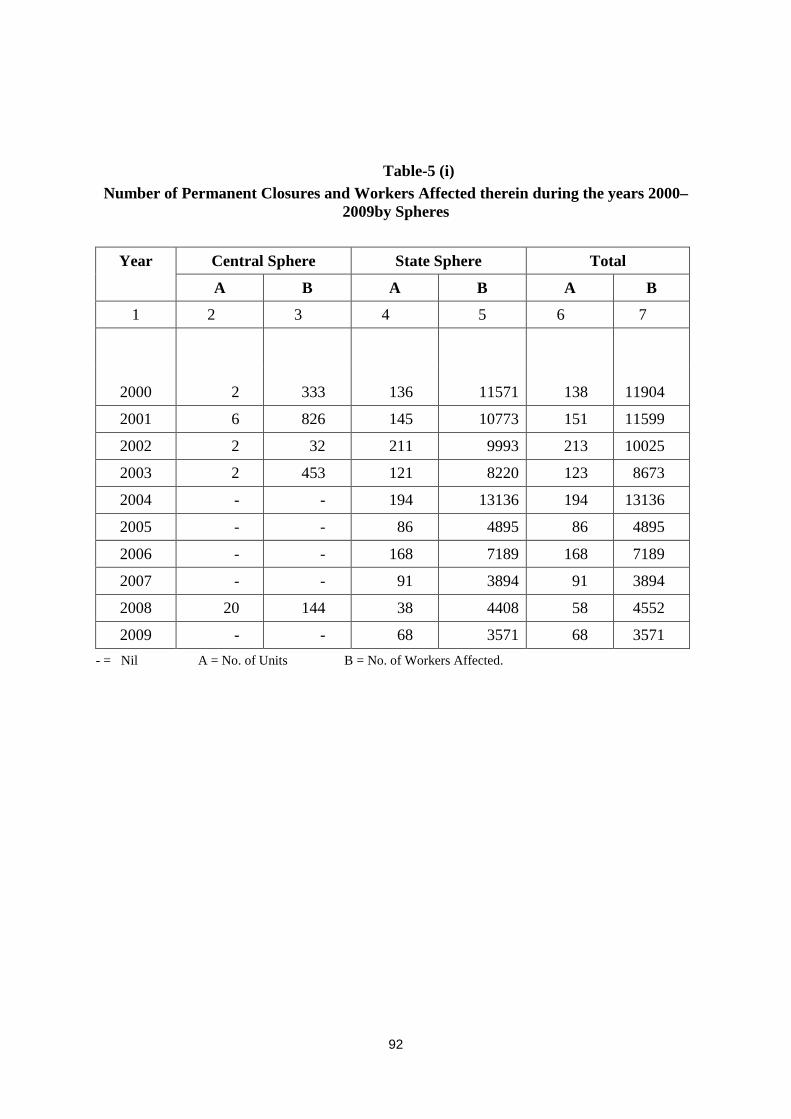
92
Table-5 (i)
Number of Permanent Closures and Workers Affected therein during the years 2000–2009by Spheres
Year Central Sphere State Sphere Total
A B A B A B
1 2 3 4 5 6 7
2000 2 333 136 11571 138 11904
2001 6 826 145 10773 151 11599
2002 2 32 211 9993 213 10025
2003 2 453 121 8220 123 8673
2004 - - 194 13136 194 13136
2005 - - 86 4895 86 4895
2006 - - 168 7189 168 7189
2007 - - 91 3894 91 3894
2008 20 144 38 4408 58 4552
2009 - - 68 3571 68 3571 - = Nil A = No. of Units B = No. of Workers Affected.
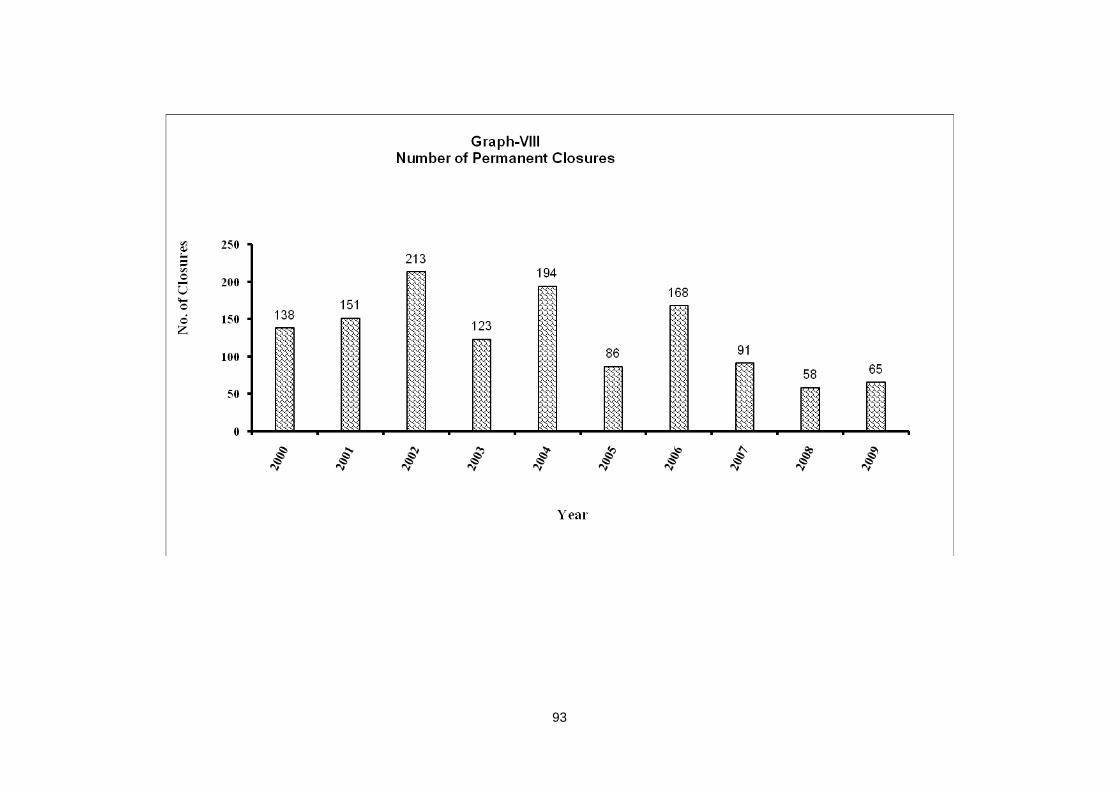
93
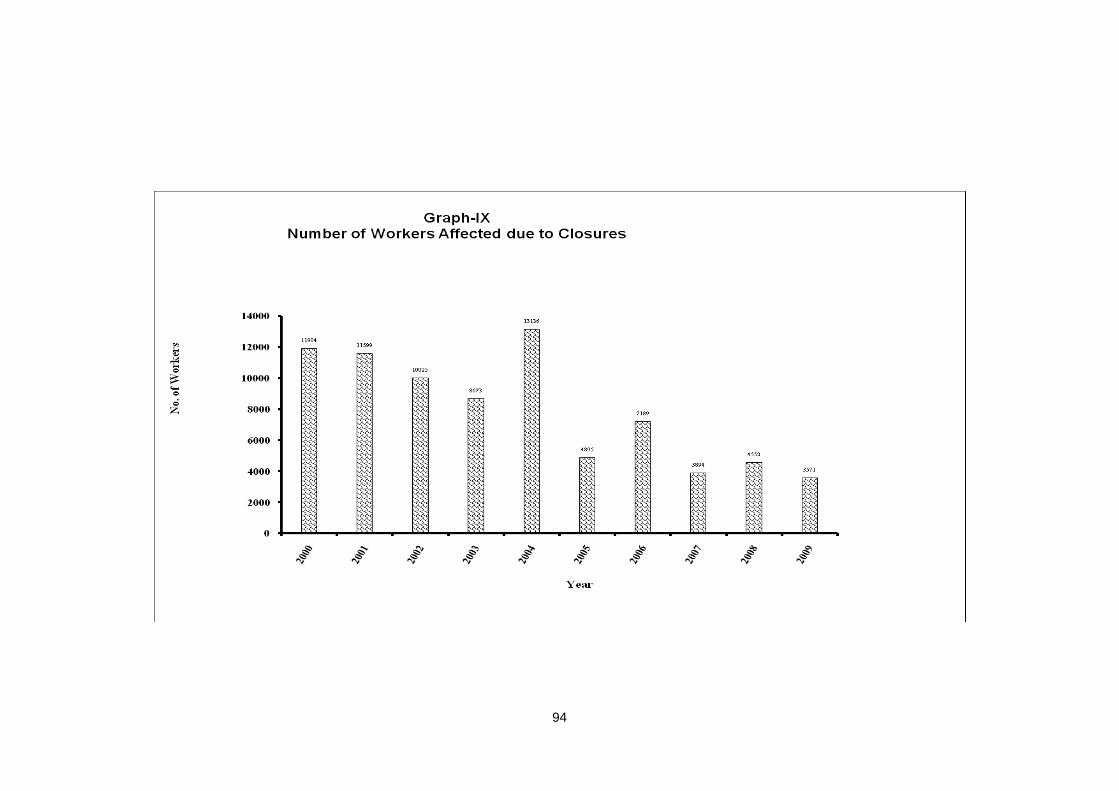
94
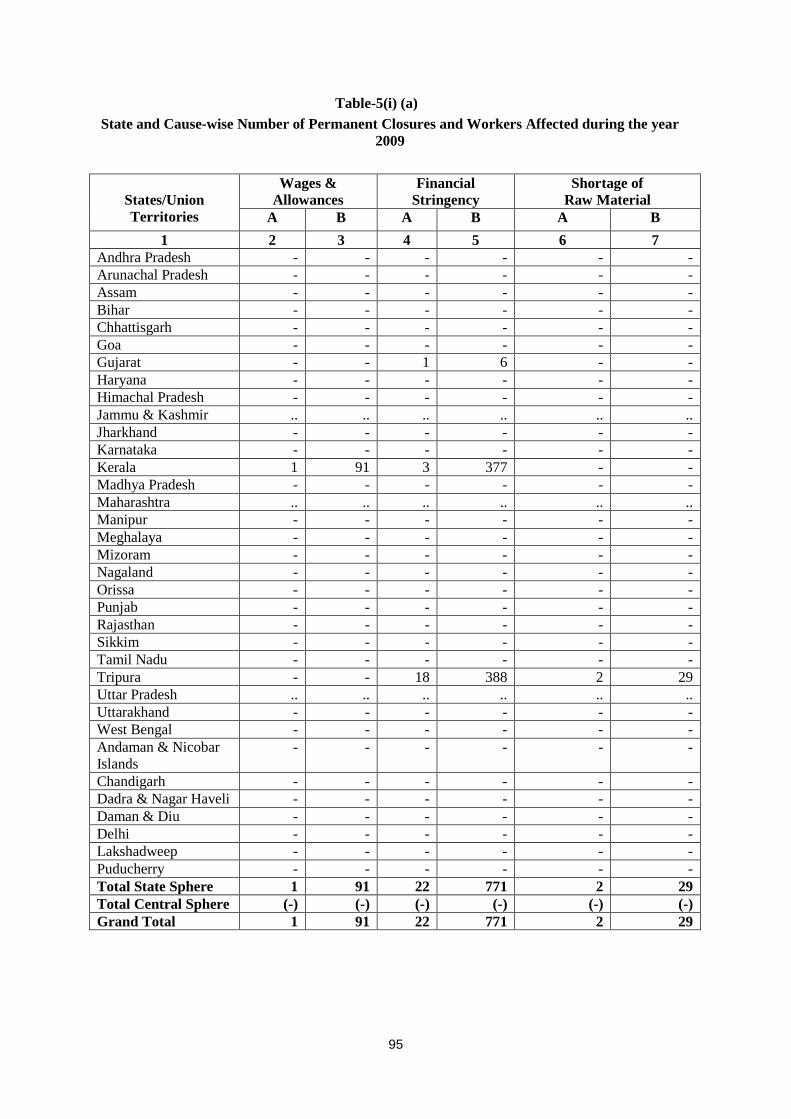
95
Table-5(i) (a) State and Cause-wise Number of Permanent Closures and Workers Affected during the year
2009
States/Union Territories
Wages & Allowances
Financial Stringency
Shortage of Raw Material
A B A B A B 1 2 3 4 5 6 7
Andhra Pradesh - - - - - - Arunachal Pradesh - - - - - - Assam - - - - - - Bihar - - - - - - Chhattisgarh - - - - - - Goa - - - - - - Gujarat - - 1 6 - - Haryana - - - - - - Himachal Pradesh - - - - - - Jammu & Kashmir .. .. .. .. .. .. Jharkhand - - - - - - Karnataka - - - - - - Kerala 1 91 3 377 - - Madhya Pradesh - - - - - - Maharashtra .. .. .. .. .. .. Manipur - - - - - - Meghalaya - - - - - - Mizoram - - - - - - Nagaland - - - - - - Orissa - - - - - - Punjab - - - - - - Rajasthan - - - - - - Sikkim - - - - - - Tamil Nadu - - - - - - Tripura - - 18 388 2 29 Uttar Pradesh .. .. .. .. .. .. Uttarakhand - - - - - - West Bengal - - - - - - Andaman & Nicobar Islands
- - - - - -
Chandigarh - - - - - - Dadra & Nagar Haveli - - - - - - Daman & Diu - - - - - - Delhi - - - - - - Lakshadweep - - - - - - Puducherry - - - - - - Total State Sphere 1 91 22 771 2 29 Total Central Sphere (-) (-) (-) (-) (-) (-) Grand Total 1 91 22 771 2 29
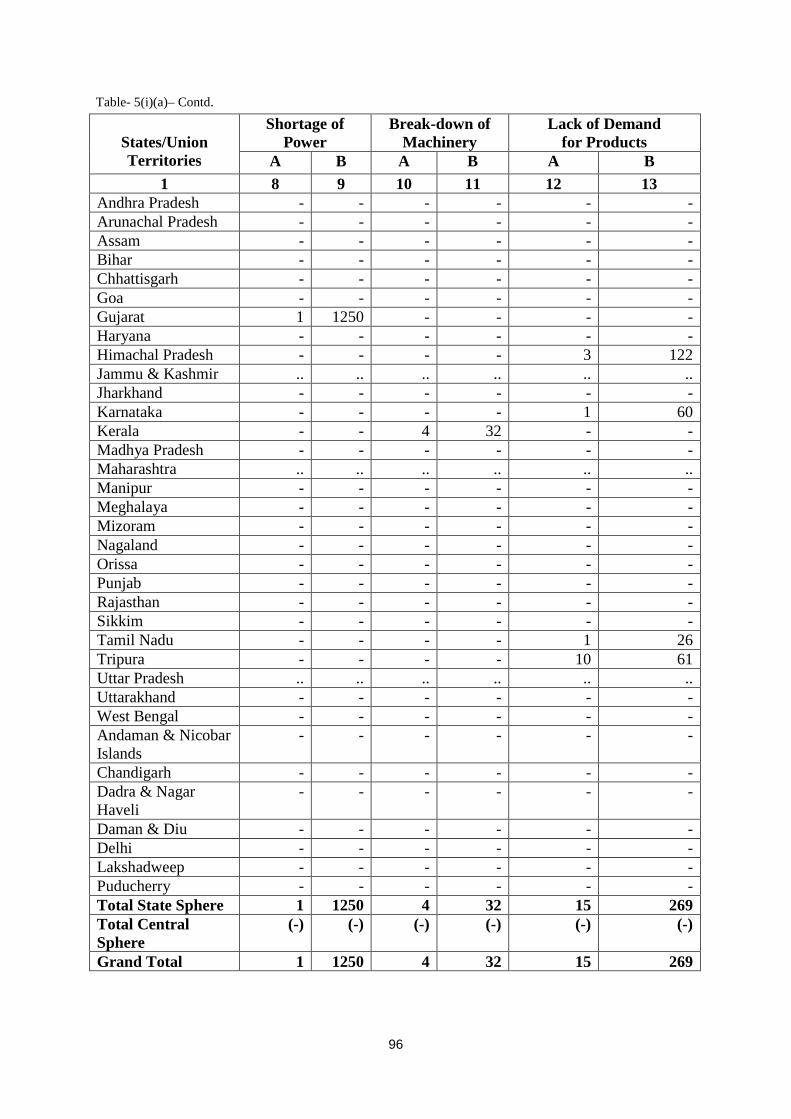
96
Table- 5(i)(a)– Contd.
States/Union Territories
Shortage of Power
Break-down of Machinery
Lack of Demand for Products
A B A B A B 1 8 9 10 11 12 13
Andhra Pradesh - - - - - - Arunachal Pradesh - - - - - - Assam - - - - - - Bihar - - - - - - Chhattisgarh - - - - - - Goa - - - - - - Gujarat 1 1250 - - - - Haryana - - - - - - Himachal Pradesh - - - - 3 122 Jammu & Kashmir .. .. .. .. .. .. Jharkhand - - - - - - Karnataka - - - - 1 60 Kerala - - 4 32 - - Madhya Pradesh - - - - - - Maharashtra .. .. .. .. .. .. Manipur - - - - - - Meghalaya - - - - - - Mizoram - - - - - - Nagaland - - - - - - Orissa - - - - - - Punjab - - - - - - Rajasthan - - - - - - Sikkim - - - - - - Tamil Nadu - - - - 1 26 Tripura - - - - 10 61 Uttar Pradesh .. .. .. .. .. .. Uttarakhand - - - - - - West Bengal - - - - - - Andaman & Nicobar Islands
- - - - - -
Chandigarh - - - - - - Dadra & Nagar Haveli
- - - - - -
Daman & Diu - - - - - - Delhi - - - - - - Lakshadweep - - - - - - Puducherry - - - - - - Total State Sphere 1 1250 4 32 15 269 Total Central Sphere
(-) (-) (-) (-) (-) (-)
Grand Total 1 1250 4 32 15 269
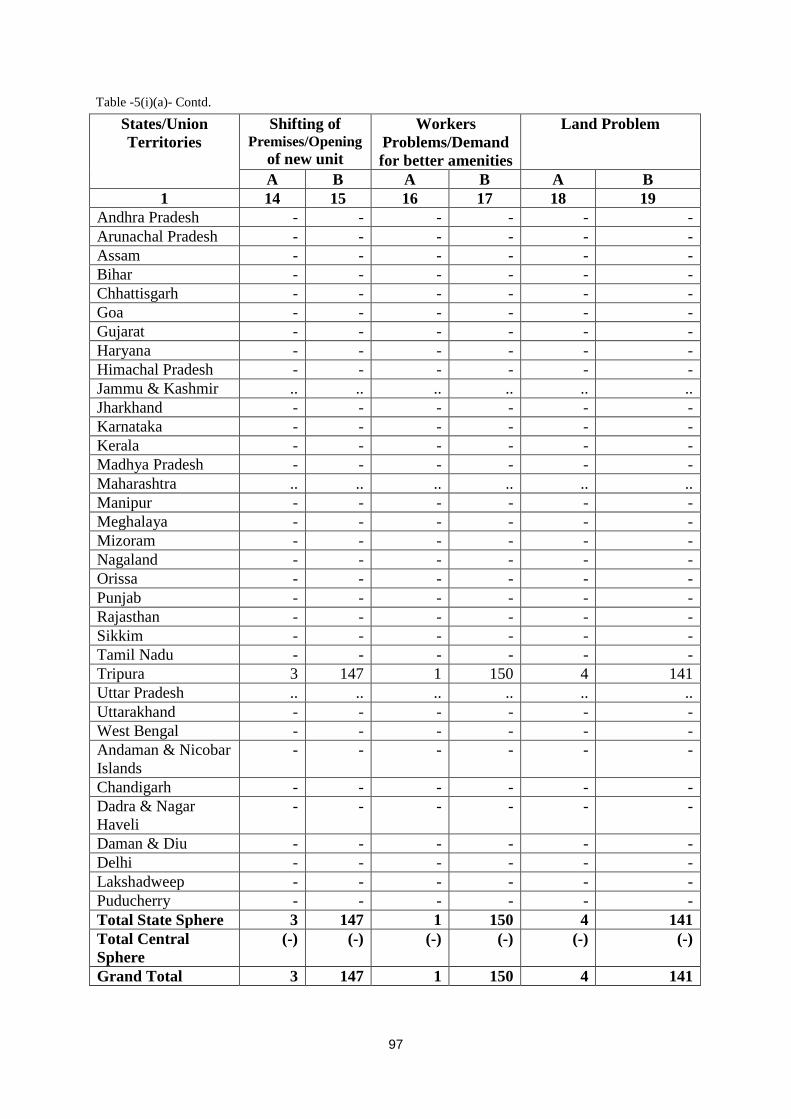
97
Table -5(i)(a)- Contd.
States/Union Territories
Shifting of Premises/Opening
of new unit
Workers Problems/Demand for better amenities
Land Problem
A B A B A B 1 14 15 16 17 18 19
Andhra Pradesh - - - - - - Arunachal Pradesh - - - - - - Assam - - - - - - Bihar - - - - - - Chhattisgarh - - - - - - Goa - - - - - - Gujarat - - - - - - Haryana - - - - - - Himachal Pradesh - - - - - - Jammu & Kashmir .. .. .. .. .. .. Jharkhand - - - - - - Karnataka - - - - - - Kerala - - - - - - Madhya Pradesh - - - - - - Maharashtra .. .. .. .. .. .. Manipur - - - - - - Meghalaya - - - - - - Mizoram - - - - - - Nagaland - - - - - - Orissa - - - - - - Punjab - - - - - - Rajasthan - - - - - - Sikkim - - - - - - Tamil Nadu - - - - - - Tripura 3 147 1 150 4 141 Uttar Pradesh .. .. .. .. .. .. Uttarakhand - - - - - - West Bengal - - - - - - Andaman & Nicobar Islands
- - - - - -
Chandigarh - - - - - - Dadra & Nagar Haveli
- - - - - -
Daman & Diu - - - - - - Delhi - - - - - - Lakshadweep - - - - - - Puducherry - - - - - - Total State Sphere 3 147 1 150 4 141 Total Central Sphere
(-) (-) (-) (-) (-) (-)
Grand Total 3 147 1 150 4 141
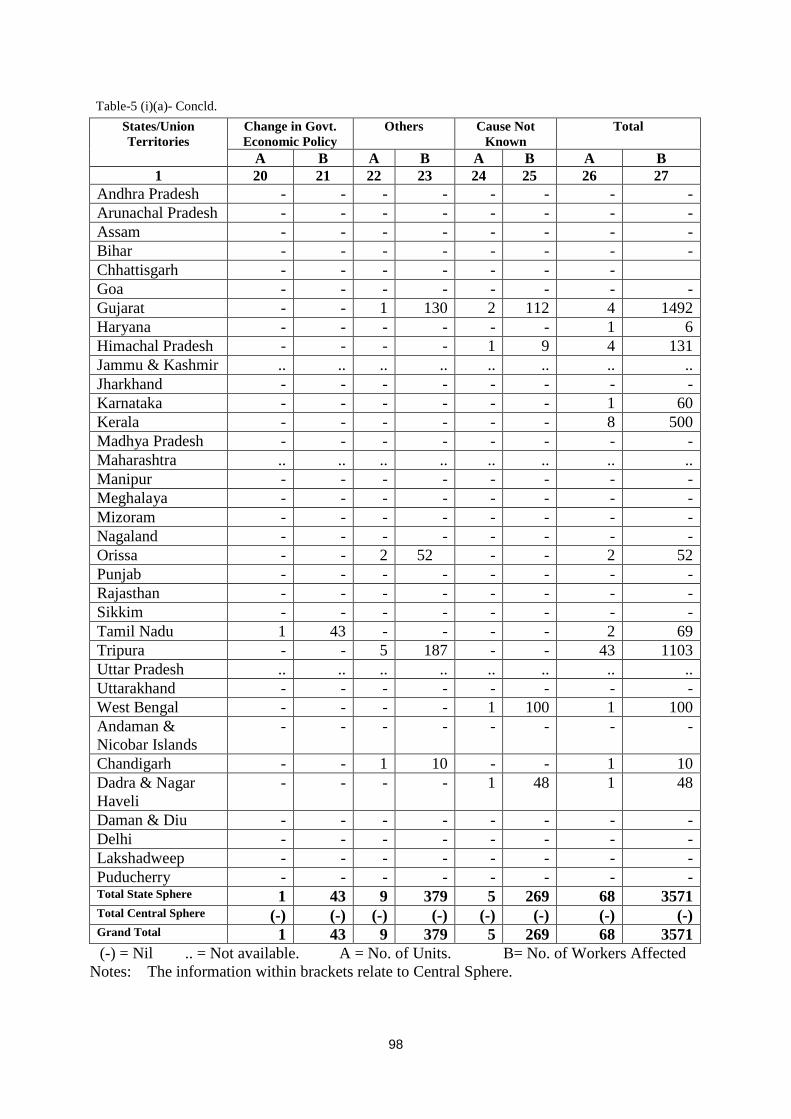
98
Table-5 (i)(a)- Concld. States/Union Territories
Change in Govt. Economic Policy
Others Cause Not Known
Total
A B A B A B A B 1 20 21 22 23 24 25 26 27
Andhra Pradesh - - - - - - - - Arunachal Pradesh - - - - - - - - Assam - - - - - - - - Bihar - - - - - - - - Chhattisgarh - - - - - - - Goa - - - - - - - - Gujarat - - 1 130 2 112 4 1492 Haryana - - - - - - 1 6 Himachal Pradesh - - - - 1 9 4 131 Jammu & Kashmir .. .. .. .. .. .. .. .. Jharkhand - - - - - - - - Karnataka - - - - - - 1 60 Kerala - - - - - - 8 500 Madhya Pradesh - - - - - - - - Maharashtra .. .. .. .. .. .. .. .. Manipur - - - - - - - - Meghalaya - - - - - - - - Mizoram - - - - - - - - Nagaland - - - - - - - - Orissa - - 2 52 - - 2 52 Punjab - - - - - - - - Rajasthan - - - - - - - - Sikkim - - - - - - - - Tamil Nadu 1 43 - - - - 2 69 Tripura - - 5 187 - - 43 1103 Uttar Pradesh .. .. .. .. .. .. .. .. Uttarakhand - - - - - - - - West Bengal - - - - 1 100 1 100 Andaman & Nicobar Islands
- - - - - - - -
Chandigarh - - 1 10 - - 1 10 Dadra & Nagar Haveli
- - - - 1 48 1 48
Daman & Diu - - - - - - - - Delhi - - - - - - - - Lakshadweep - - - - - - - - Puducherry - - - - - - - - Total State Sphere 1 43 9 379 5 269 68 3571 Total Central Sphere (-) (-) (-) (-) (-) (-) (-) (-) Grand Total 1 43 9 379 5 269 68 3571 (-) = Nil .. = Not available. A = No. of Units. B= No. of Workers Affected
Notes: The information within brackets relate to Central Sphere.
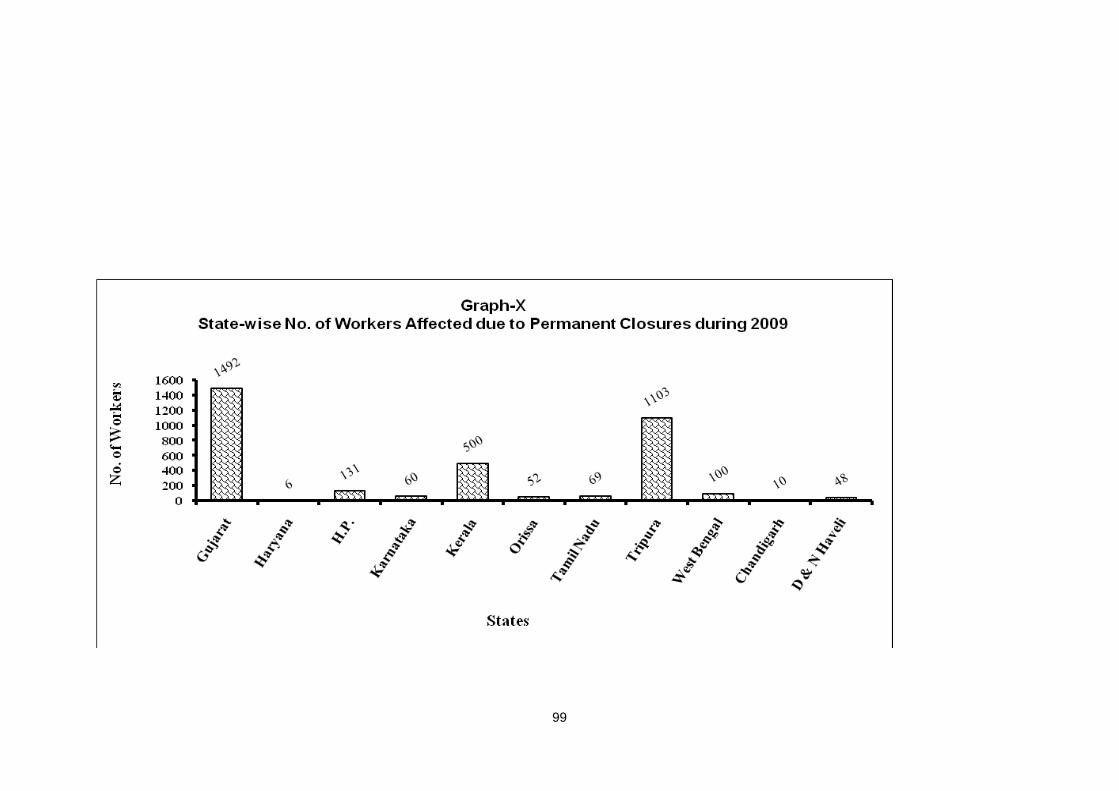
99
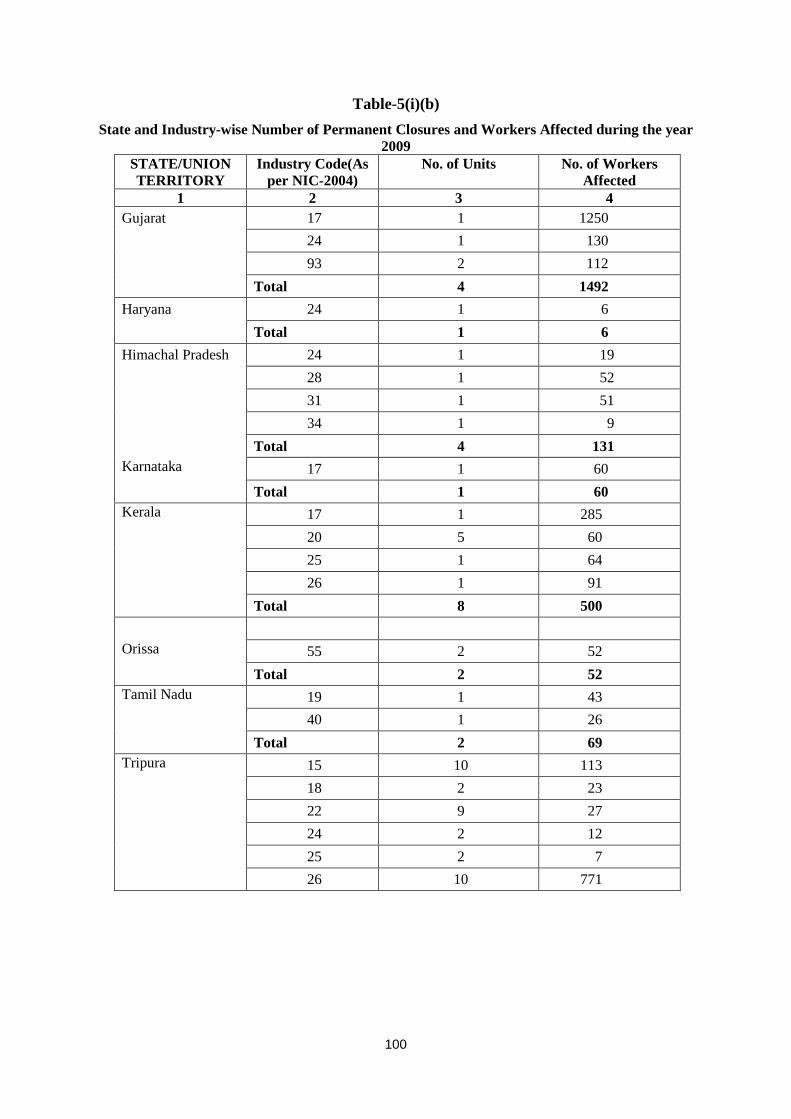
100
Table-5(i)(b) State and Industry-wise Number of Permanent Closures and Workers Affected during the year
2009 STATE/UNION TERRITORY
Industry Code(As per NIC-2004)
No. of Units No. of Workers Affected
1 2 3 4 Gujarat 17 1 1250 24 1 130 93 2 112 Total 4 1492 Haryana 24 1 6 Total 1 6 Himachal Pradesh 24 1 19
28 1 52 31 1 51 34 1 9
Total 4 131 Karnataka 17 1 60 Total 1 60 Kerala 17 1 285 20 5 60 25 1 64 26 1 91 Total 8 500 Orissa 55 2 52 Total 2 52 Tamil Nadu 19 1 43 40 1 26 Total 2 69 Tripura 15 10 113 18 2 23 22 9 27 24 2 12 25 2 7 26 10 771
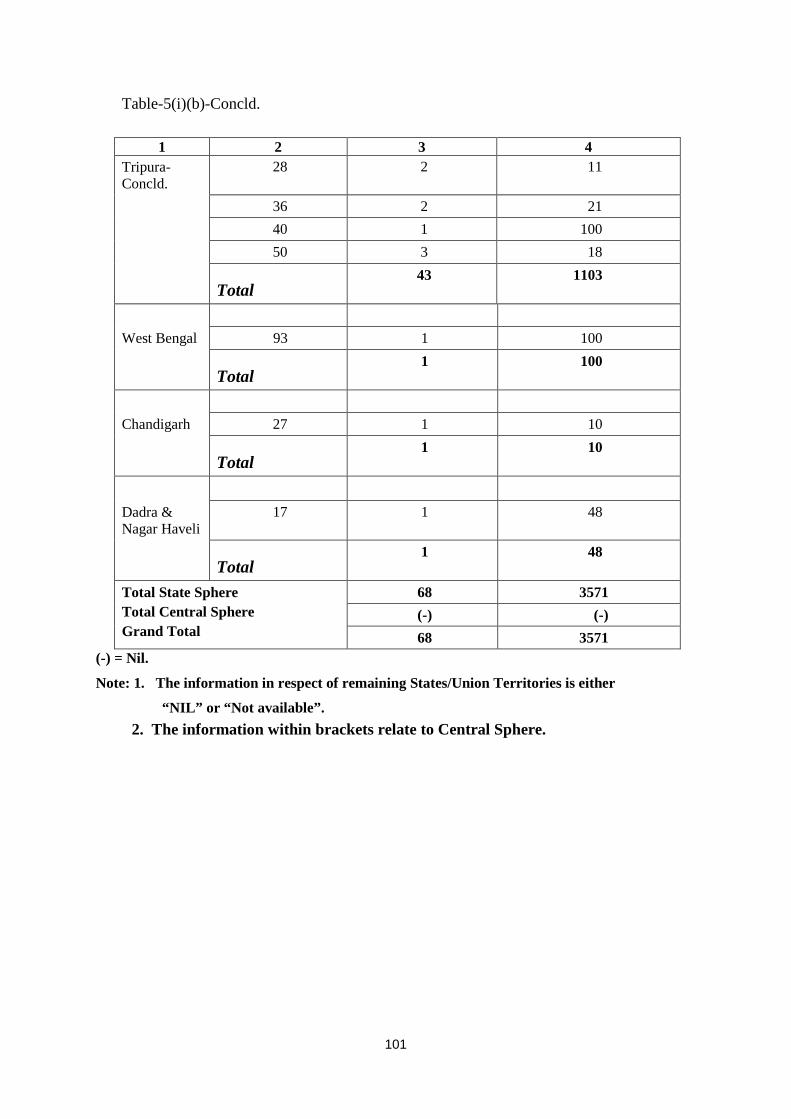
101
Table-5(i)(b)-Concld.
1 2 3 4 Tripura-Concld.
28 2 11
36 2 21 40 1 100 50 3 18
Total 43 1103
West Bengal 93 1 100
Total 1 100
Chandigarh 27 1 10
Total 1 10
Dadra & Nagar Haveli
17 1 48
Total
1 48
Total State Sphere Total Central Sphere Grand Total
68 3571 (-) (-) 68 3571
(-) = Nil. Note: 1. The information in respect of remaining States/Union Territories is either
“NIL” or “Not available”. 2. The information within brackets relate to Central Sphere.
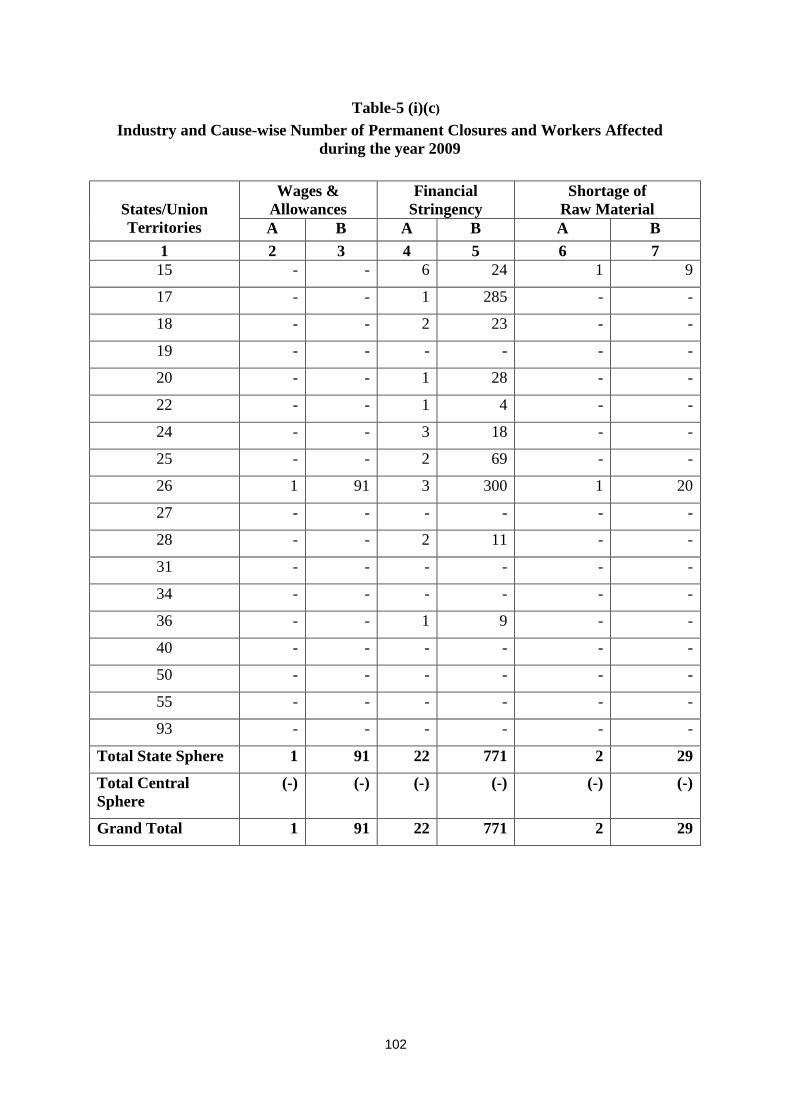
102
Table-5 (i)(c)
Industry and Cause-wise Number of Permanent Closures and Workers Affected during the year 2009
States/Union Territories
Wages & Allowances
Financial Stringency
Shortage of Raw Material
A B A B A B 1 2 3 4 5 6 7 15 - - 6 24 1 9
17 - - 1 285 - -
18 - - 2 23 - -
19 - - - - - -
20 - - 1 28 - -
22 - - 1 4 - -
24 - - 3 18 - -
25 - - 2 69 - -
26 1 91 3 300 1 20
27 - - - - - -
28 - - 2 11 - -
31 - - - - - -
34 - - - - - -
36 - - 1 9 - -
40 - - - - - -
50 - - - - - -
55 - - - - - -
93 - - - - - -
Total State Sphere 1 91 22 771 2 29
Total Central Sphere
(-) (-) (-) (-) (-) (-)
Grand Total 1 91 22 771 2 29
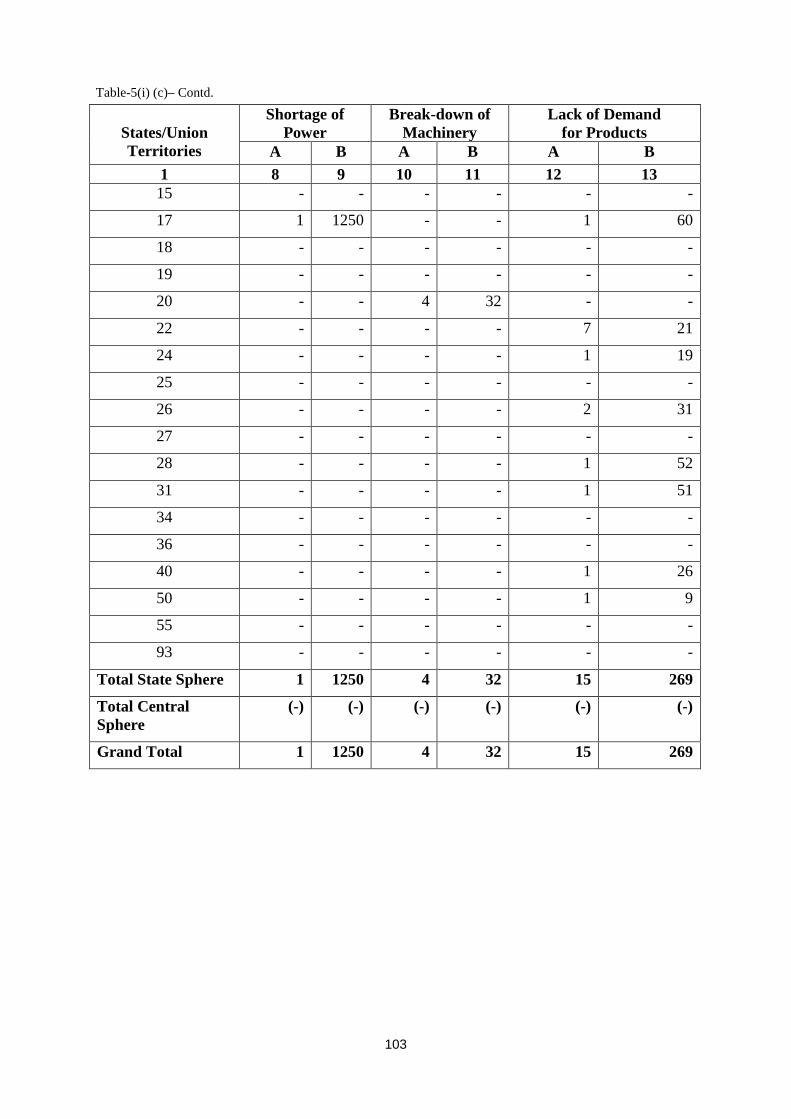
103
Table-5(i) (c)– Contd.
States/Union Territories
Shortage of Power
Break-down of Machinery
Lack of Demand for Products
A B A B A B 1 8 9 10 11 12 13 15 - - - - - -
17 1 1250 - - 1 60
18 - - - - - -
19 - - - - - -
20 - - 4 32 - -
22 - - - - 7 21
24 - - - - 1 19
25 - - - - - -
26 - - - - 2 31
27 - - - - - -
28 - - - - 1 52
31 - - - - 1 51
34 - - - - - -
36 - - - - - -
40 - - - - 1 26
50 - - - - 1 9
55 - - - - - -
93 - - - - - -
Total State Sphere 1 1250 4 32 15 269
Total Central Sphere
(-) (-) (-) (-) (-) (-)
Grand Total 1 1250 4 32 15 269
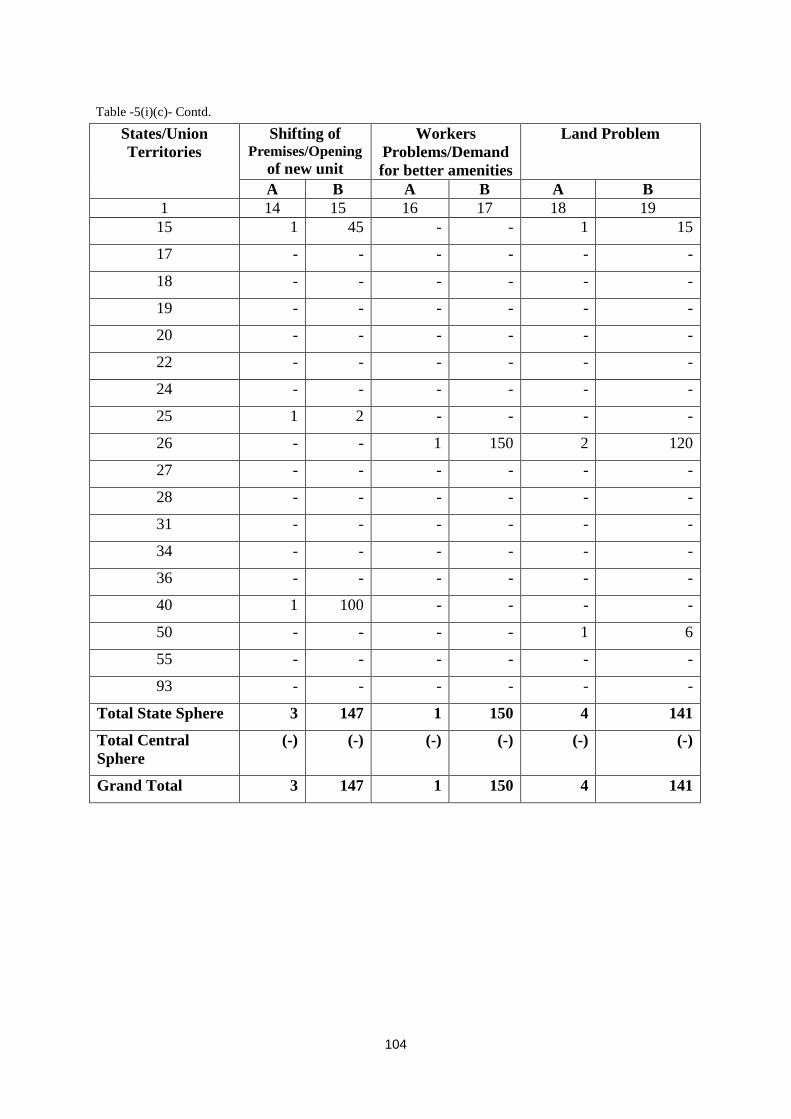
104
Table -5(i)(c)- Contd.
States/Union Territories
Shifting of Premises/Opening
of new unit
Workers Problems/Demand for better amenities
Land Problem
A B A B A B 1 14 15 16 17 18 19 15 1 45 - - 1 15
17 - - - - - -
18 - - - - - -
19 - - - - - -
20 - - - - - -
22 - - - - - -
24 - - - - - -
25 1 2 - - - -
26 - - 1 150 2 120
27 - - - - - -
28 - - - - - -
31 - - - - - -
34 - - - - - -
36 - - - - - -
40 1 100 - - - -
50 - - - - 1 6
55 - - - - - -
93 - - - - - -
Total State Sphere 3 147 1 150 4 141
Total Central Sphere
(-) (-) (-) (-) (-) (-)
Grand Total 3 147 1 150 4 141
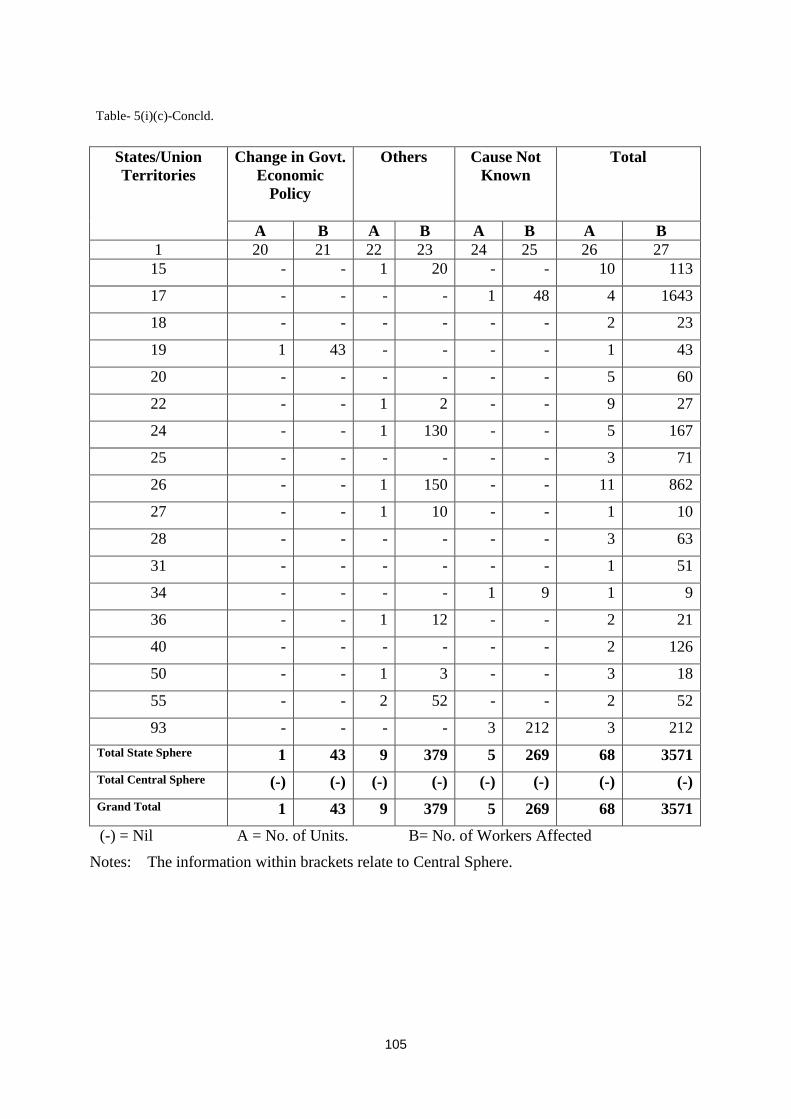
105
Table- 5(i)(c)-Concld.
States/Union Territories
Change in Govt. Economic
Policy
Others Cause Not Known
Total
A B A B A B A B 1 20 21 22 23 24 25 26 27 15 - - 1 20 - - 10 113
17 - - - - 1 48 4 1643
18 - - - - - - 2 23
19 1 43 - - - - 1 43
20 - - - - - - 5 60
22 - - 1 2 - - 9 27
24 - - 1 130 - - 5 167
25 - - - - - - 3 71
26 - - 1 150 - - 11 862
27 - - 1 10 - - 1 10
28 - - - - - - 3 63
31 - - - - - - 1 51
34 - - - - 1 9 1 9
36 - - 1 12 - - 2 21
40 - - - - - - 2 126
50 - - 1 3 - - 3 18
55 - - 2 52 - - 2 52
93 - - - - 3 212 3 212 Total State Sphere 1 43 9 379 5 269 68 3571 Total Central Sphere (-) (-) (-) (-) (-) (-) (-) (-) Grand Total 1 43 9 379 5 269 68 3571
(-) = Nil A = No. of Units. B= No. of Workers Affected
Notes: The information within brackets relate to Central Sphere.
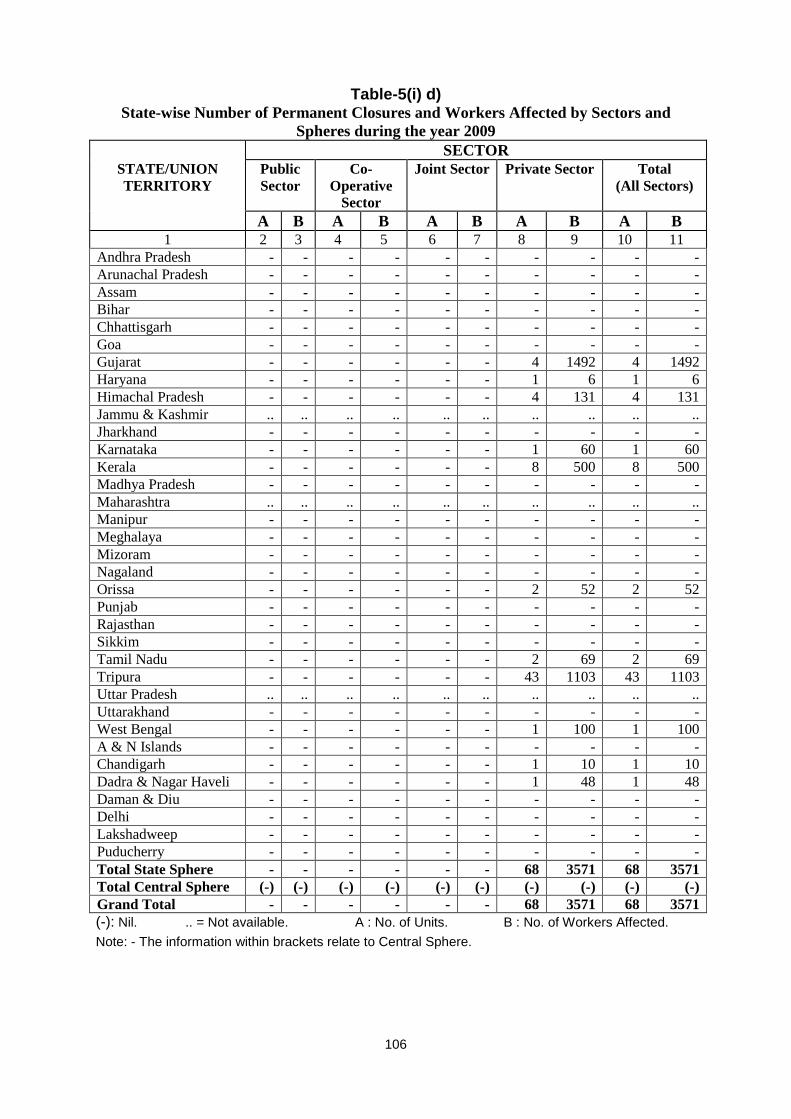
106
Table-5(i) d) State-wise Number of Permanent Closures and Workers Affected by Sectors and
Spheres during the year 2009 SECTOR
STATE/UNION TERRITORY
Public Sector
Co-Operative
Sector
Joint Sector Private Sector Total (All Sectors)
A B A B A B A B A B 1 2 3 4 5 6 7 8 9 10 11
Andhra Pradesh - - - - - - - - - - Arunachal Pradesh - - - - - - - - - - Assam - - - - - - - - - - Bihar - - - - - - - - - - Chhattisgarh - - - - - - - - - - Goa - - - - - - - - - - Gujarat - - - - - - 4 1492 4 1492 Haryana - - - - - - 1 6 1 6 Himachal Pradesh - - - - - - 4 131 4 131 Jammu & Kashmir .. .. .. .. .. .. .. .. .. .. Jharkhand - - - - - - - - - - Karnataka - - - - - - 1 60 1 60 Kerala - - - - - - 8 500 8 500 Madhya Pradesh - - - - - - - - - - Maharashtra .. .. .. .. .. .. .. .. .. .. Manipur - - - - - - - - - - Meghalaya - - - - - - - - - - Mizoram - - - - - - - - - - Nagaland - - - - - - - - - - Orissa - - - - - - 2 52 2 52 Punjab - - - - - - - - - - Rajasthan - - - - - - - - - - Sikkim - - - - - - - - - - Tamil Nadu - - - - - - 2 69 2 69 Tripura - - - - - - 43 1103 43 1103 Uttar Pradesh .. .. .. .. .. .. .. .. .. .. Uttarakhand - - - - - - - - - - West Bengal - - - - - - 1 100 1 100 A & N Islands - - - - - - - - - - Chandigarh - - - - - - 1 10 1 10 Dadra & Nagar Haveli - - - - - - 1 48 1 48 Daman & Diu - - - - - - - - - - Delhi - - - - - - - - - - Lakshadweep - - - - - - - - - - Puducherry - - - - - - - - - - Total State Sphere - - - - - - 68 3571 68 3571 Total Central Sphere (-) (-) (-) (-) (-) (-) (-) (-) (-) (-) Grand Total - - - - - - 68 3571 68 3571 (-): Nil. .. = Not available. A : No. of Units. B : No. of Workers Affected. Note: - The information within brackets relate to Central Sphere.
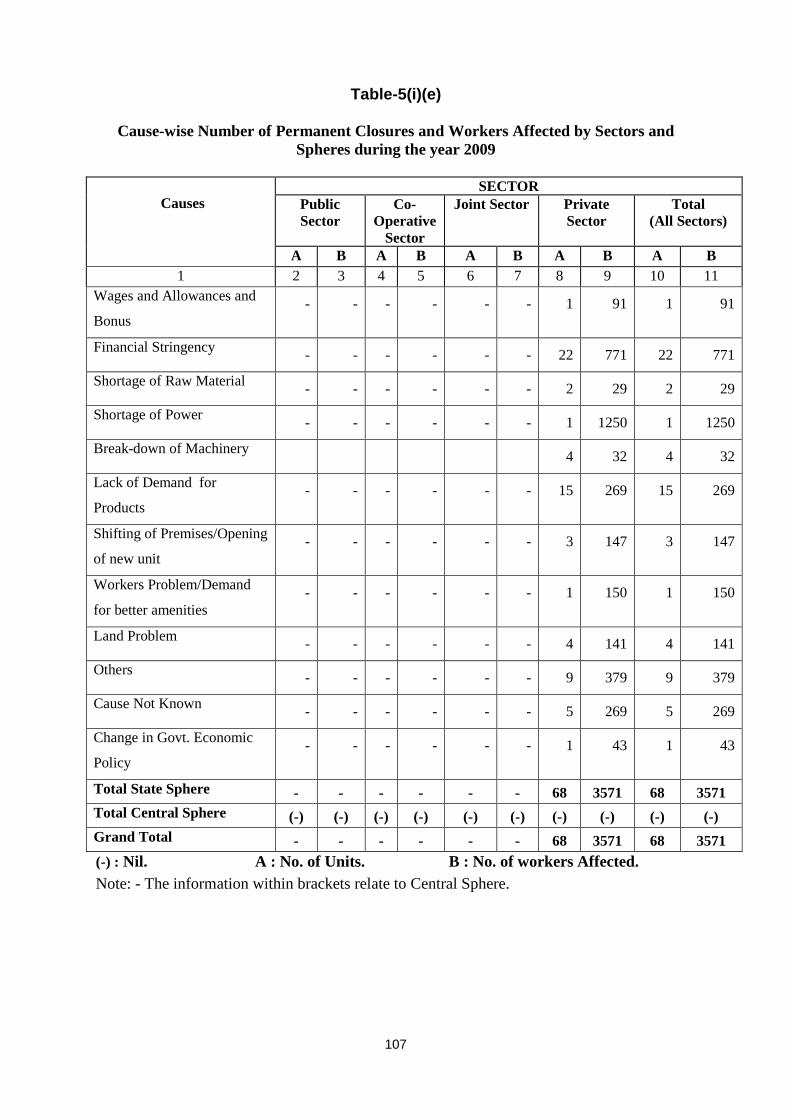
107
Table-5(i)(e)
Cause-wise Number of Permanent Closures and Workers Affected by Sectors and Spheres during the year 2009
Causes SECTOR
Public Sector
Co-Operative
Sector
Joint Sector Private Sector
Total (All Sectors)
A B A B A B A B A B 1 2 3 4 5 6 7 8 9 10 11
Wages and Allowances and
Bonus - - - - - - 1 91 1 91
Financial Stringency - - - - - - 22 771 22 771
Shortage of Raw Material - - - - - - 2 29 2 29
Shortage of Power - - - - - - 1 1250 1 1250
Break-down of Machinery 4 32 4 32
Lack of Demand for
Products - - - - - - 15 269 15 269
Shifting of Premises/Opening
of new unit - - - - - - 3 147 3 147
Workers Problem/Demand
for better amenities - - - - - - 1 150 1 150
Land Problem - - - - - - 4 141 4 141
Others - - - - - - 9 379 9 379
Cause Not Known - - - - - - 5 269 5 269
Change in Govt. Economic
Policy - - - - - - 1 43 1 43
Total State Sphere - - - - - - 68 3571 68 3571 Total Central Sphere (-) (-) (-) (-) (-) (-) (-) (-) (-) (-) Grand Total - - - - - - 68 3571 68 3571 (-) : Nil. A : No. of Units. B : No. of workers Affected. Note: - The information within brackets relate to Central Sphere.
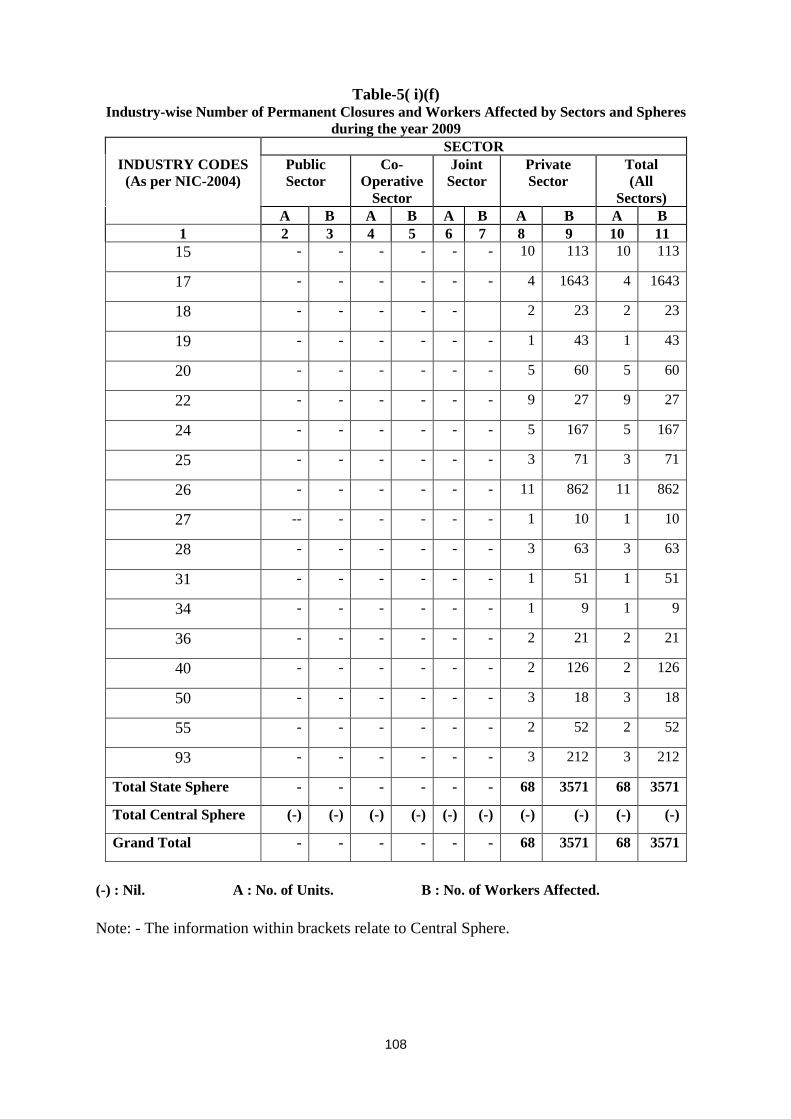
108
Table-5( i)(f) Industry-wise Number of Permanent Closures and Workers Affected by Sectors and Spheres
during the year 2009 SECTOR
INDUSTRY CODES (As per NIC-2004)
Public Sector
Co-Operative
Sector
Joint Sector
Private Sector
Total (All
Sectors) A B A B A B A B A B
1 2 3 4 5 6 7 8 9 10 11 15 - - - - - - 10 113 10 113
17 - - - - - - 4 1643 4 1643
18 - - - - - 2 23 2 23
19 - - - - - - 1 43 1 43
20 - - - - - - 5 60 5 60
22 - - - - - - 9 27 9 27
24 - - - - - - 5 167 5 167
25 - - - - - - 3 71 3 71
26 - - - - - - 11 862 11 862
27 -- - - - - - 1 10 1 10
28 - - - - - - 3 63 3 63
31 - - - - - - 1 51 1 51
34 - - - - - - 1 9 1 9
36 - - - - - - 2 21 2 21
40 - - - - - - 2 126 2 126
50 - - - - - - 3 18 3 18
55 - - - - - - 2 52 2 52
93 - - - - - - 3 212 3 212
Total State Sphere - - - - - - 68 3571 68 3571
Total Central Sphere (-) (-) (-) (-) (-) (-) (-) (-) (-) (-)
Grand Total - - - - - - 68 3571 68 3571
(-) : Nil. A : No. of Units. B : No. of Workers Affected. Note: - The information within brackets relate to Central Sphere.
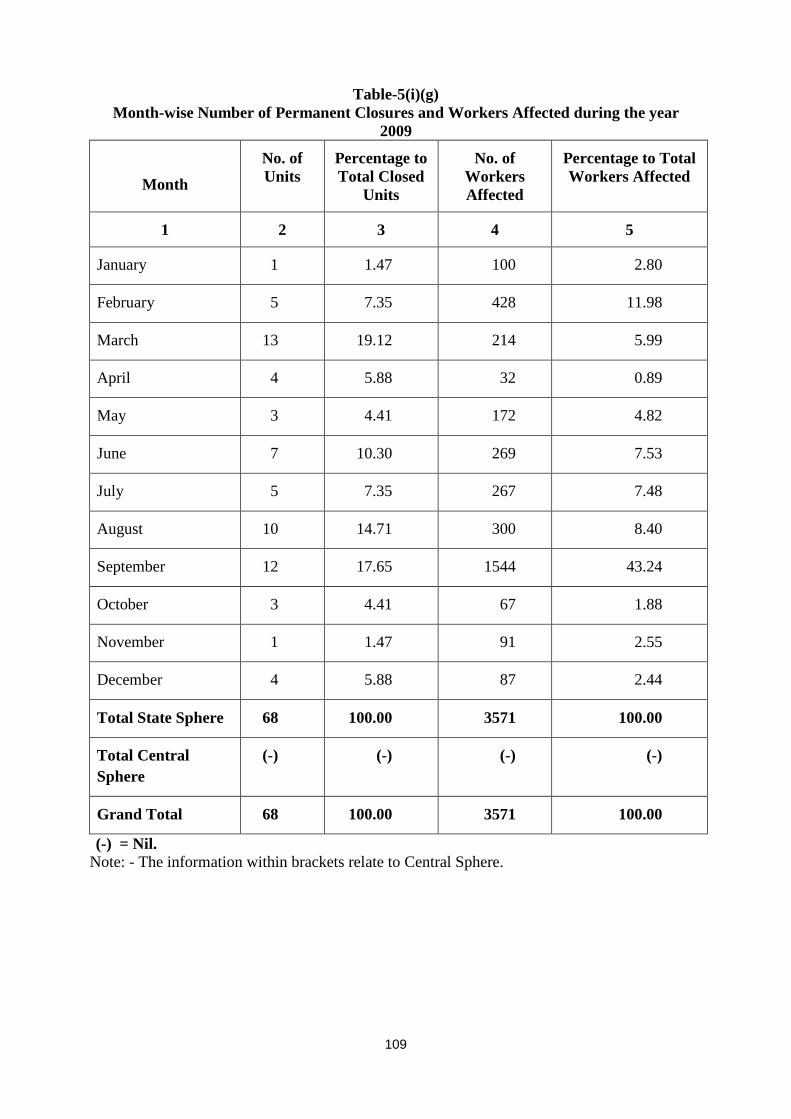
109
Table-5(i)(g) Month-wise Number of Permanent Closures and Workers Affected during the year
2009
(-) = Nil. Note: - The information within brackets relate to Central Sphere.
Month
No. of Units
Percentage to Total Closed
Units
No. of Workers Affected
Percentage to Total Workers Affected
1 2 3 4 5
January 1 1.47 100 2.80
February 5 7.35 428 11.98
March 13 19.12 214 5.99
April 4 5.88 32 0.89
May 3 4.41 172 4.82
June 7 10.30 269 7.53
July 5 7.35 267 7.48
August 10 14.71 300 8.40
September 12 17.65 1544 43.24
October 3 4.41 67 1.88
November 1 1.47 91 2.55
December 4 5.88 87 2.44
Total State Sphere 68 100.00 3571 100.00
Total Central Sphere
(-) (-) (-) (-)
Grand Total 68 100.00 3571 100.00
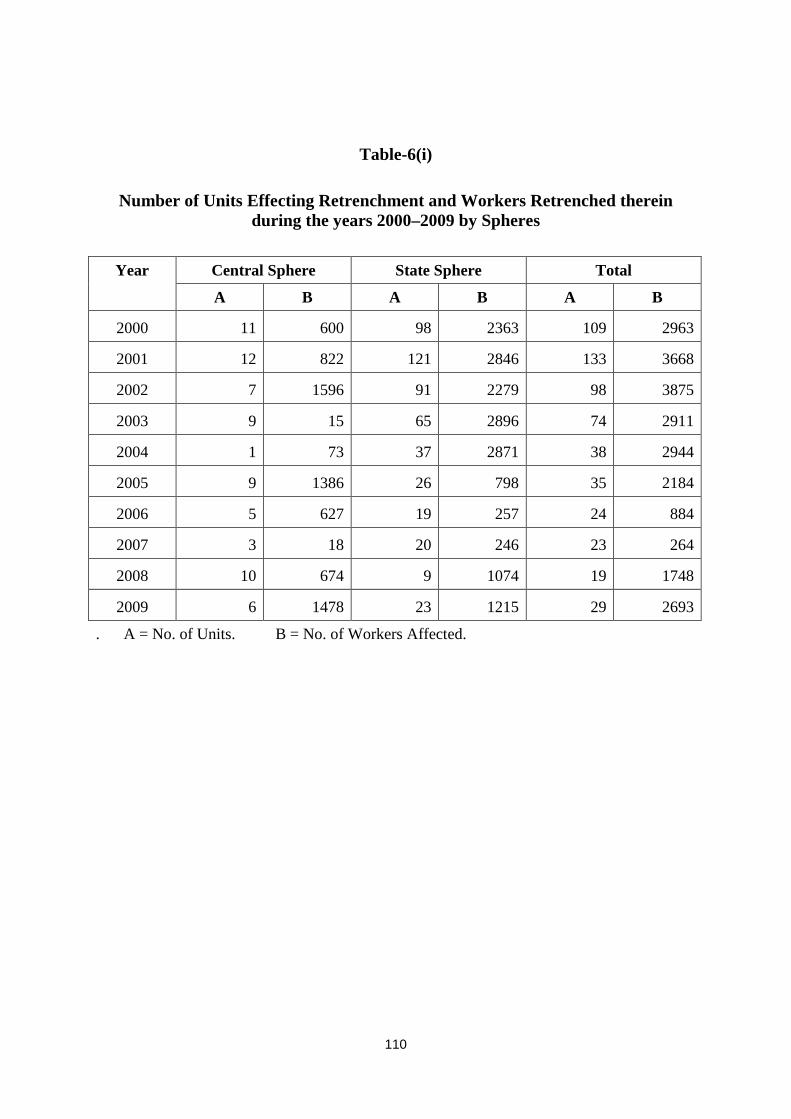
110
Table-6(i)
Number of Units Effecting Retrenchment and Workers Retrenched therein during the years 2000–2009 by Spheres
Year Central Sphere State Sphere Total
A B A B A B
2000 11 600 98 2363 109 2963
2001 12 822 121 2846 133 3668
2002 7 1596 91 2279 98 3875
2003 9 15 65 2896 74 2911
2004 1 73 37 2871 38 2944
2005 9 1386 26 798 35 2184
2006 5 627 19 257 24 884
2007 3 18 20 246 23 264
2008 10 674 9 1074 19 1748
2009 6 1478 23 1215 29 2693
. A = No. of Units. B = No. of Workers Affected.
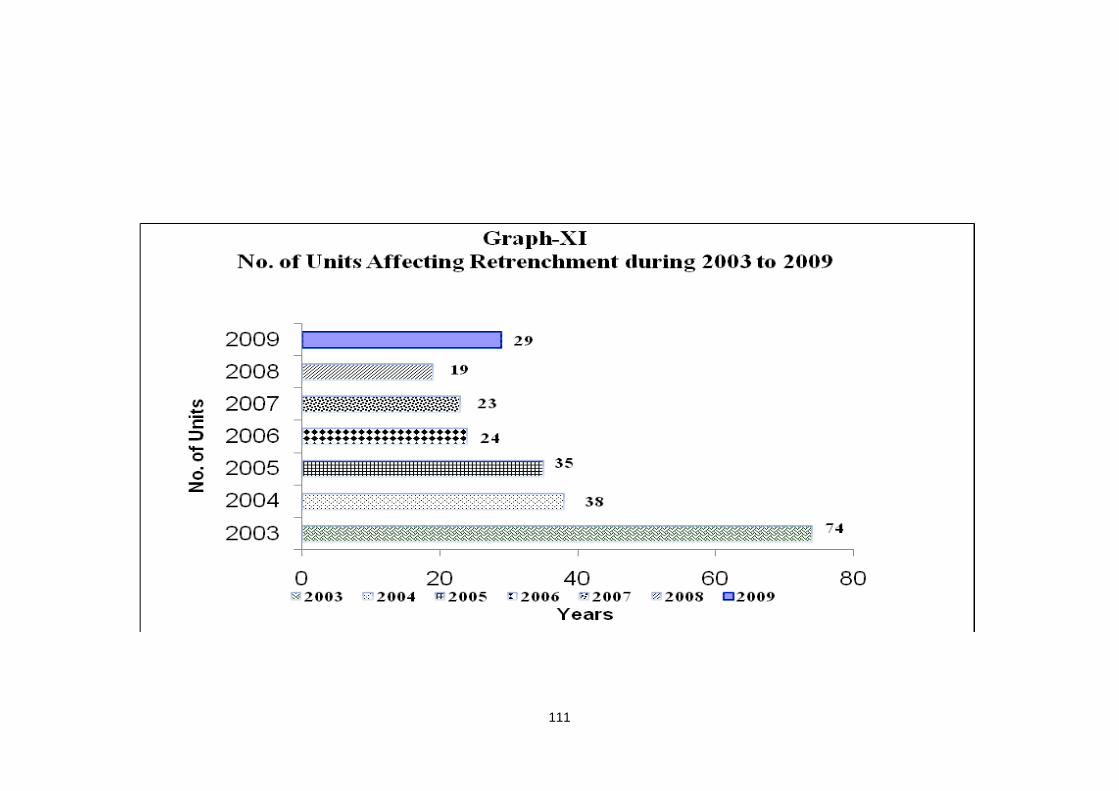
111
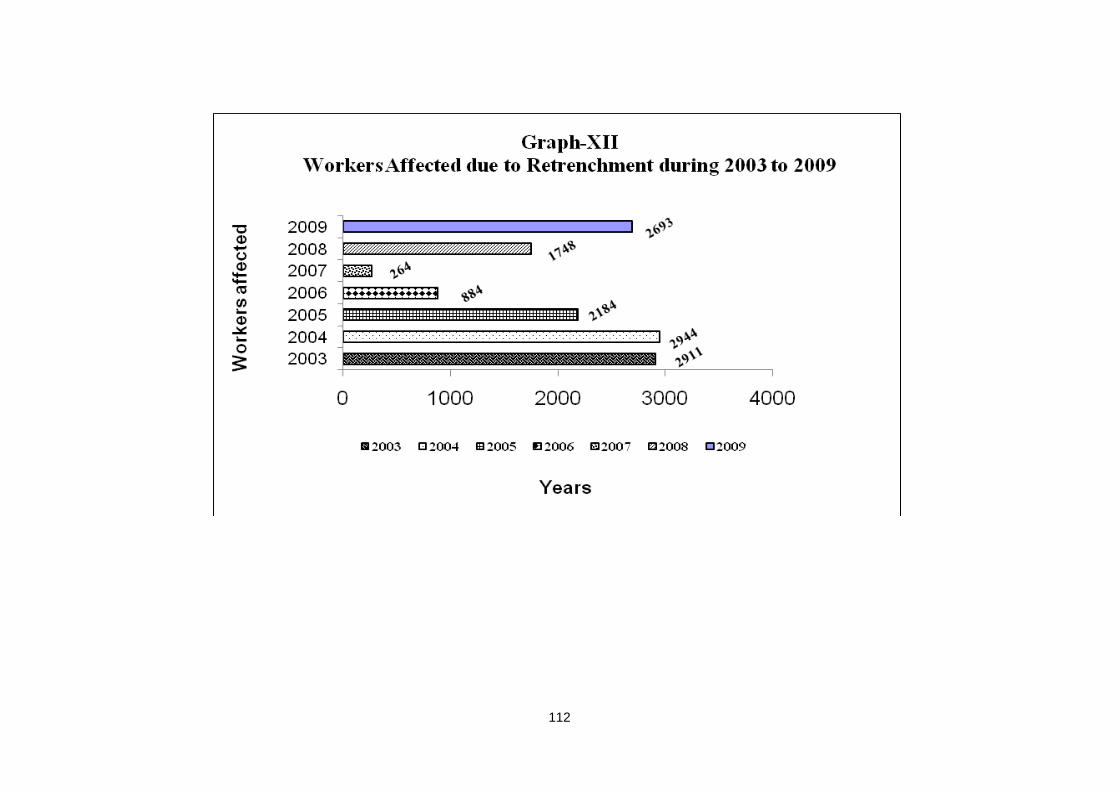
112
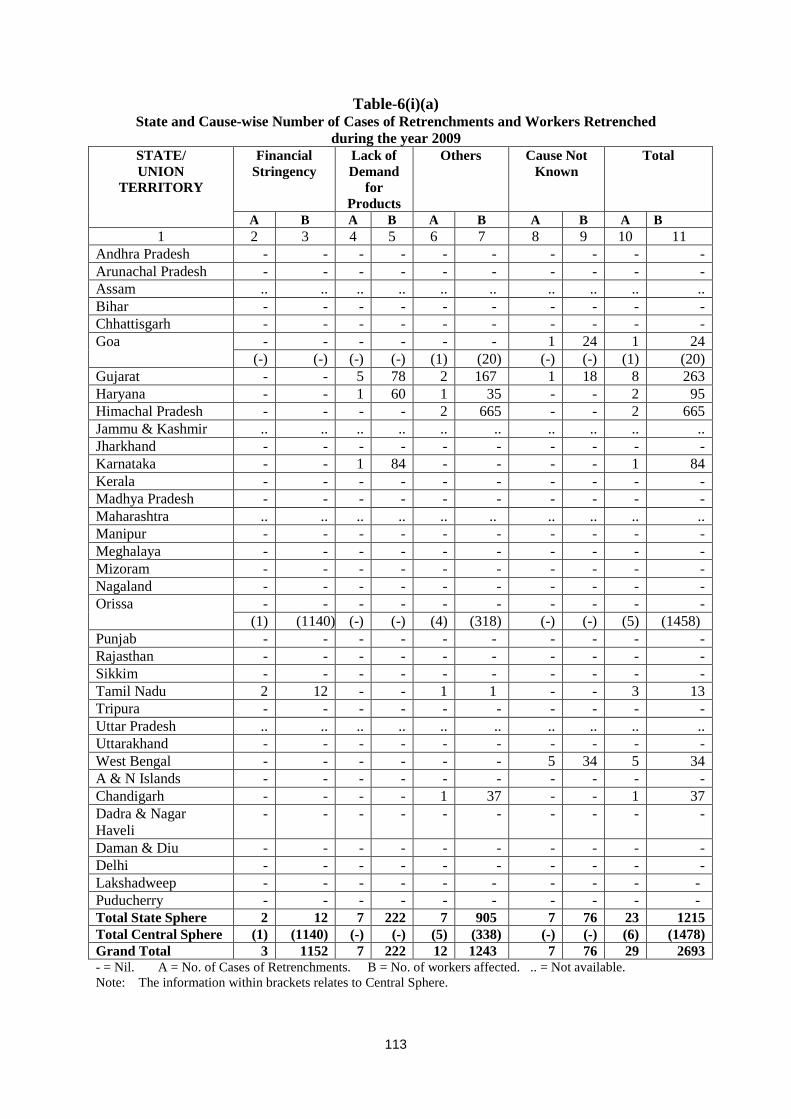
113
Table-6(i)(a) State and Cause-wise Number of Cases of Retrenchments and Workers Retrenched
during the year 2009 STATE/ UNION
TERRITORY
Financial Stringency
Lack of Demand
for Products
Others Cause Not Known
Total
A B A B A B A B A B 1 2 3 4 5 6 7 8 9 10 11
Andhra Pradesh - - - - - - - - - - Arunachal Pradesh - - - - - - - - - - Assam .. .. .. .. .. .. .. .. .. .. Bihar - - - - - - - - - - Chhattisgarh - - - - - - - - - - Goa - - - - - - 1 24 1 24 (-) (-) (-) (-) (1) (20) (-) (-) (1) (20) Gujarat - - 5 78 2 167 1 18 8 263 Haryana - - 1 60 1 35 - - 2 95 Himachal Pradesh - - - - 2 665 - - 2 665 Jammu & Kashmir .. .. .. .. .. .. .. .. .. .. Jharkhand - - - - - - - - - - Karnataka - - 1 84 - - - - 1 84 Kerala - - - - - - - - - - Madhya Pradesh - - - - - - - - - - Maharashtra .. .. .. .. .. .. .. .. .. .. Manipur - - - - - - - - - - Meghalaya - - - - - - - - - - Mizoram - - - - - - - - - - Nagaland - - - - - - - - - - Orissa - - - - - - - - - - (1) (1140) (-) (-) (4) (318) (-) (-) (5) (1458) Punjab - - - - - - - - - - Rajasthan - - - - - - - - - - Sikkim - - - - - - - - - - Tamil Nadu 2 12 - - 1 1 - - 3 13 Tripura - - - - - - - - - - Uttar Pradesh .. .. .. .. .. .. .. .. .. .. Uttarakhand - - - - - - - - - - West Bengal - - - - - - 5 34 5 34 A & N Islands - - - - - - - - - - Chandigarh - - - - 1 37 - - 1 37 Dadra & Nagar Haveli
- - - - - - - - - -
Daman & Diu - - - - - - - - - - Delhi - - - - - - - - - - Lakshadweep - - - - - - - - - - Puducherry - - - - - - - - - - Total State Sphere 2 12 7 222 7 905 7 76 23 1215 Total Central Sphere (1) (1140) (-) (-) (5) (338) (-) (-) (6) (1478) Grand Total 3 1152 7 222 12 1243 7 76 29 2693 - = Nil. A = No. of Cases of Retrenchments. B = No. of workers affected. .. = Not available. Note: The information within brackets relates to Central Sphere.
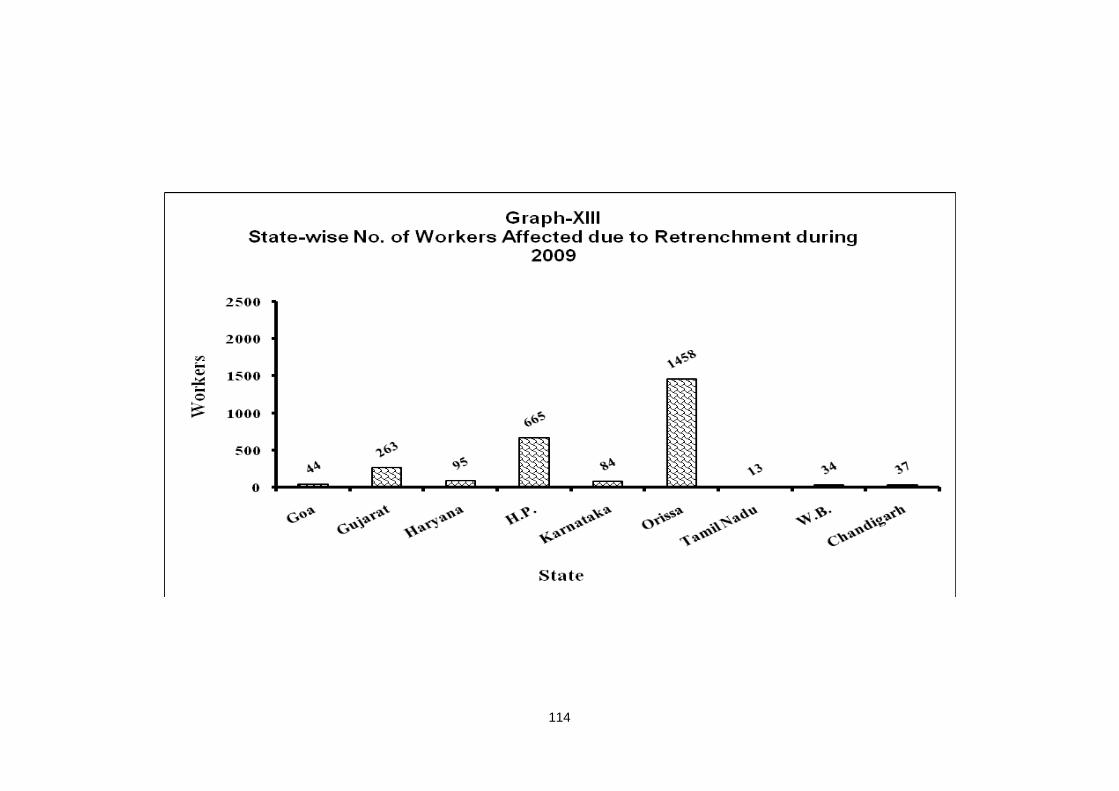
114
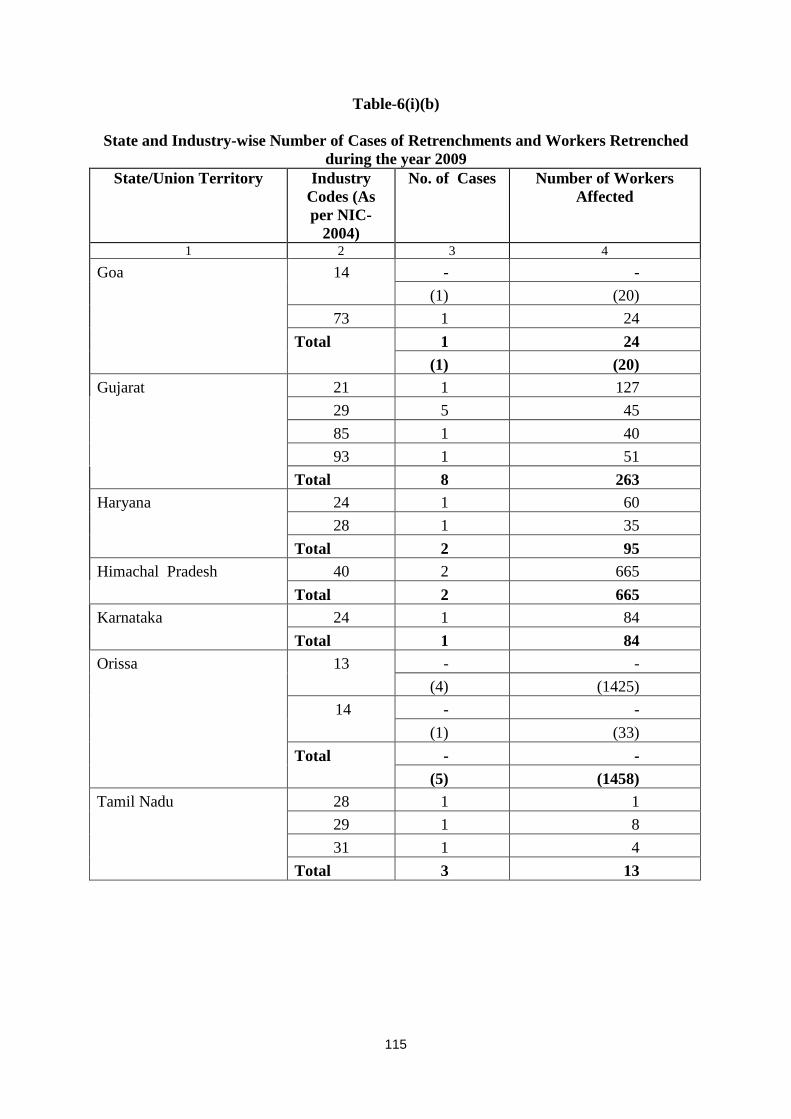
115
Table-6(i)(b)
State and Industry-wise Number of Cases of Retrenchments and Workers Retrenched during the year 2009
State/Union Territory Industry Codes (As per NIC-
2004)
No. of Cases Number of Workers Affected
1 2 3 4
Goa 14 - - (1) (20) 73 1 24 Total 1 24 (1) (20) Gujarat 21 1 127
29 5 45 85 1 40 93 1 51 Total 8 263
Haryana 24 1 60 28 1 35 Total 2 95
Himachal Pradesh 40 2 665 Total 2 665
Karnataka 24 1 84 Total 1 84 Orissa 13 - - (4) (1425) 14 - - (1) (33) Total - - (5) (1458) Tamil Nadu 28 1 1 29 1 8 31 1 4 Total 3 13
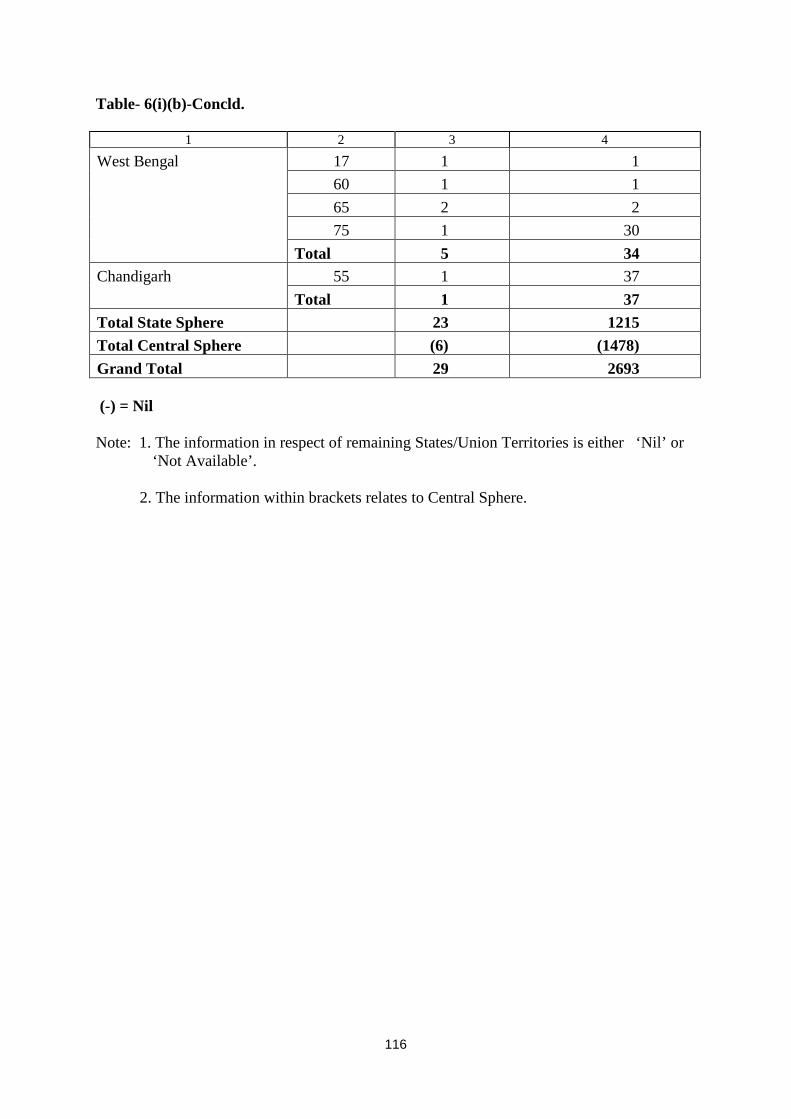
116
Table- 6(i)(b)-Concld.
1 2 3 4
West Bengal 17 1 1 60 1 1 65 2 2 75 1 30 Total 5 34 Chandigarh 55 1 37
Total 1 37 Total State Sphere 23 1215 Total Central Sphere (6) (1478) Grand Total 29 2693 (-) = Nil Note: 1. The information in respect of remaining States/Union Territories is either ‘Nil’ or
‘Not Available’. 2. The information within brackets relates to Central Sphere.
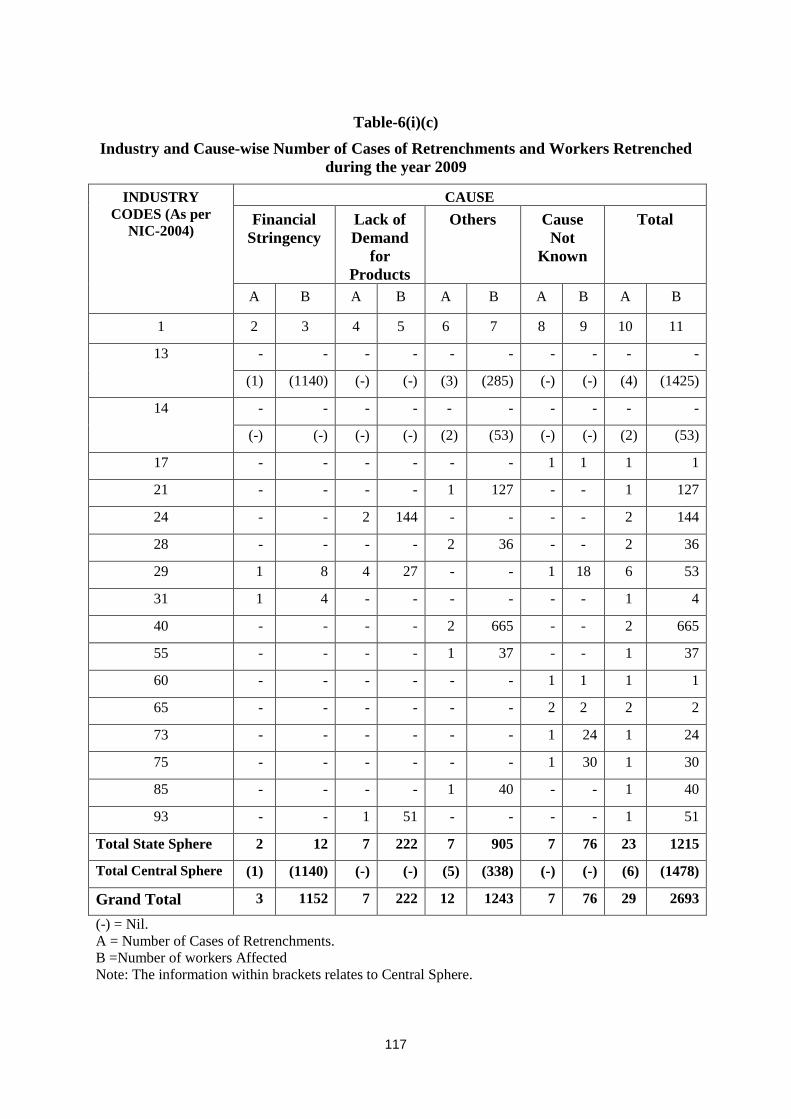
117
Table-6(i)(c)
Industry and Cause-wise Number of Cases of Retrenchments and Workers Retrenched during the year 2009
INDUSTRY CODES (As per
NIC-2004)
CAUSE Financial
Stringency Lack of Demand
for Products
Others Cause Not
Known
Total
A B A B A B A B A B
1 2 3 4 5 6 7 8 9 10 11
13 - - - - - - - - - -
(1) (1140) (-) (-) (3) (285) (-) (-) (4) (1425)
14 - - - - - - - - - -
(-) (-) (-) (-) (2) (53) (-) (-) (2) (53)
17 - - - - - - 1 1 1 1
21 - - - - 1 127 - - 1 127
24 - - 2 144 - - - - 2 144
28 - - - - 2 36 - - 2 36
29 1 8 4 27 - - 1 18 6 53
31 1 4 - - - - - - 1 4
40 - - - - 2 665 - - 2 665
55 - - - - 1 37 - - 1 37
60 - - - - - - 1 1 1 1
65 - - - - - - 2 2 2 2
73 - - - - - - 1 24 1 24
75 - - - - - - 1 30 1 30
85 - - - - 1 40 - - 1 40
93 - - 1 51 - - - - 1 51
Total State Sphere 2 12 7 222 7 905 7 76 23 1215
Total Central Sphere (1) (1140) (-) (-) (5) (338) (-) (-) (6) (1478)
Grand Total 3 1152 7 222 12 1243 7 76 29 2693
(-) = Nil. A = Number of Cases of Retrenchments. B =Number of workers Affected Note: The information within brackets relates to Central Sphere.
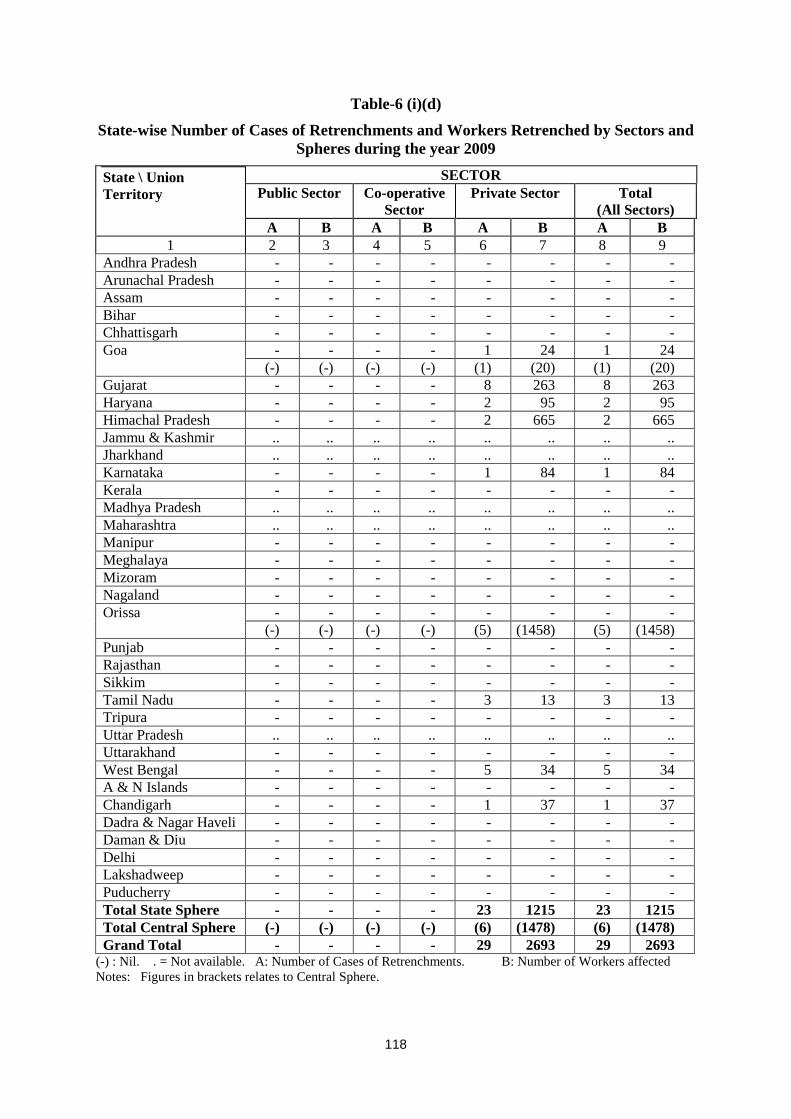
118
Table-6 (i)(d) State-wise Number of Cases of Retrenchments and Workers Retrenched by Sectors and
Spheres during the year 2009
State \ Union Territory
SECTOR Public Sector Co-operative
Sector Private Sector Total
(All Sectors) A B A B A B A B
1 2 3 4 5 6 7 8 9 Andhra Pradesh - - - - - - - - Arunachal Pradesh - - - - - - - - Assam - - - - - - - - Bihar - - - - - - - - Chhattisgarh - - - - - - - - Goa - - - - 1 24 1 24 (-) (-) (-) (-) (1) (20) (1) (20) Gujarat - - - - 8 263 8 263 Haryana - - - - 2 95 2 95 Himachal Pradesh - - - - 2 665 2 665 Jammu & Kashmir .. .. .. .. .. .. .. .. Jharkhand .. .. .. .. .. .. .. .. Karnataka - - - - 1 84 1 84 Kerala - - - - - - - - Madhya Pradesh .. .. .. .. .. .. .. .. Maharashtra .. .. .. .. .. .. .. .. Manipur - - - - - - - - Meghalaya - - - - - - - - Mizoram - - - - - - - - Nagaland - - - - - - - - Orissa - - - - - - - - (-) (-) (-) (-) (5) (1458) (5) (1458) Punjab - - - - - - - - Rajasthan - - - - - - - - Sikkim - - - - - - - - Tamil Nadu - - - - 3 13 3 13 Tripura - - - - - - - - Uttar Pradesh .. .. .. .. .. .. .. .. Uttarakhand - - - - - - - - West Bengal - - - - 5 34 5 34 A & N Islands - - - - - - - - Chandigarh - - - - 1 37 1 37 Dadra & Nagar Haveli - - - - - - - - Daman & Diu - - - - - - - - Delhi - - - - - - - - Lakshadweep - - - - - - - - Puducherry - - - - - - - - Total State Sphere - - - - 23 1215 23 1215 Total Central Sphere (-) (-) (-) (-) (6) (1478) (6) (1478) Grand Total - - - - 29 2693 29 2693
(-) : Nil. . = Not available. A: Number of Cases of Retrenchments. B: Number of Workers affected Notes: Figures in brackets relates to Central Sphere.
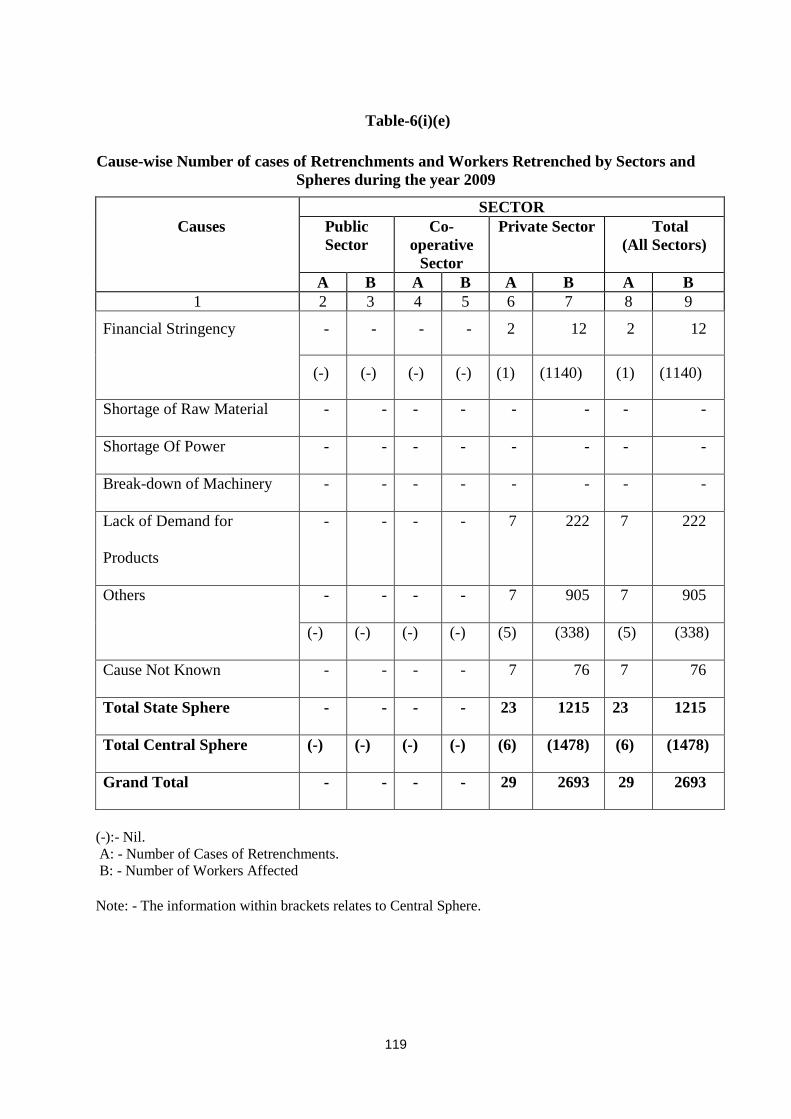
119
Table-6(i)(e)
Cause-wise Number of cases of Retrenchments and Workers Retrenched by Sectors and
Spheres during the year 2009
SECTOR Causes Public
Sector Co-
operative Sector
Private Sector Total (All Sectors)
A B A B A B A B 1 2 3 4 5 6 7 8 9
Financial Stringency - - - - 2 12 2 12
(-) (-) (-) (-) (1) (1140) (1) (1140)
Shortage of Raw Material - - - - - - - -
Shortage Of Power - - - - - - - -
Break-down of Machinery - - - - - - - -
Lack of Demand for
Products
- - - - 7 222 7 222
Others - - - - 7 905 7 905
(-) (-) (-) (-) (5) (338) (5) (338)
Cause Not Known - - - - 7 76 7 76
Total State Sphere - - - - 23 1215 23 1215
Total Central Sphere (-) (-) (-) (-) (6) (1478) (6) (1478)
Grand Total - - - - 29 2693 29 2693
(-):- Nil. A: - Number of Cases of Retrenchments. B: - Number of Workers Affected Note: - The information within brackets relates to Central Sphere.
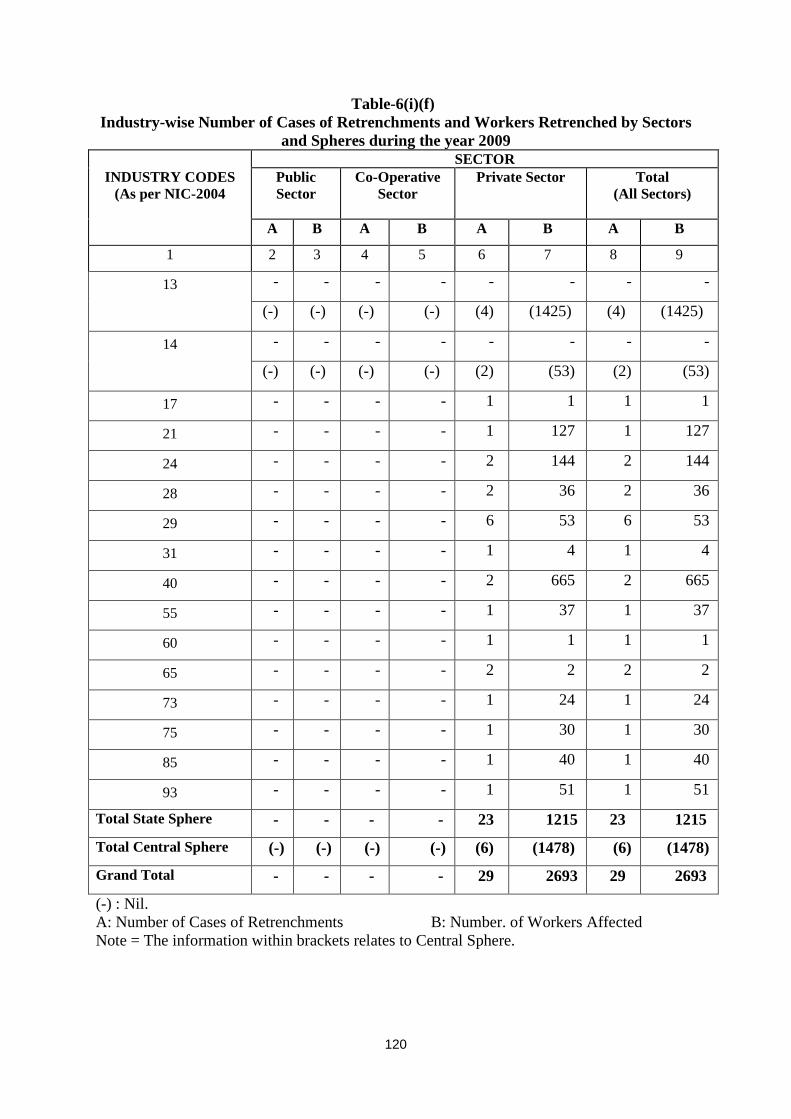
120
Table-6(i)(f) Industry-wise Number of Cases of Retrenchments and Workers Retrenched by Sectors
and Spheres during the year 2009 SECTOR
INDUSTRY CODES (As per NIC-2004
Public Sector
Co-Operative Sector
Private Sector
Total (All Sectors)
A B A B A B A B
1 2 3 4 5 6 7 8 9
13 - - - - - - - -
(-) (-) (-) (-) (4) (1425) (4) (1425)
14 - - - - - - - -
(-) (-) (-) (-) (2) (53) (2) (53)
17 - - - - 1 1 1 1
21 - - - - 1 127 1 127
24 - - - - 2 144 2 144
28 - - - - 2 36 2 36
29 - - - - 6 53 6 53
31 - - - - 1 4 1 4
40 - - - - 2 665 2 665
55 - - - - 1 37 1 37
60 - - - - 1 1 1 1
65 - - - - 2 2 2 2
73 - - - - 1 24 1 24
75 - - - - 1 30 1 30
85 - - - - 1 40 1 40
93 - - - - 1 51 1 51
Total State Sphere - - - - 23 1215 23 1215
Total Central Sphere (-) (-) (-) (-) (6) (1478) (6) (1478)
Grand Total - - - - 29 2693 29 2693
(-) : Nil. A: Number of Cases of Retrenchments B: Number. of Workers Affected Note = The information within brackets relates to Central Sphere.
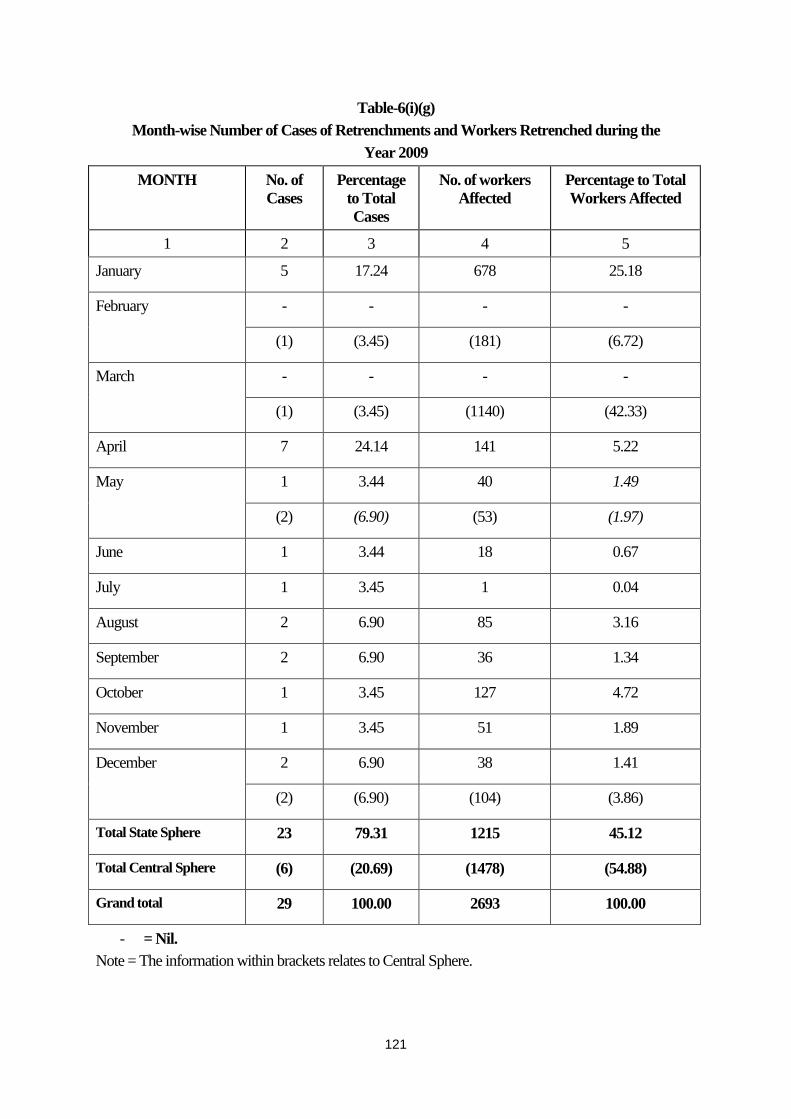
121
Table-6(i)(g) Month-wise Number of Cases of Retrenchments and Workers Retrenched during the
Year 2009
MONTH No. of Cases
Percentage to Total Cases
No. of workers Affected
Percentage to Total Workers Affected
1 2 3 4 5
January 5 17.24 678 25.18
February - - - -
(1) (3.45) (181) (6.72)
March - - - -
(1) (3.45) (1140) (42.33)
April 7 24.14 141 5.22
May 1 3.44 40 1.49
(2) (6.90) (53) (1.97)
June 1 3.44 18 0.67
July 1 3.45 1 0.04
August 2 6.90 85 3.16
September 2 6.90 36 1.34
October 1 3.45 127 4.72
November 1 3.45 51 1.89
December 2 6.90 38 1.41
(2) (6.90) (104) (3.86)
Total State Sphere 23 79.31 1215 45.12
Total Central Sphere (6) (20.69) (1478) (54.88)
Grand total 29 100.00 2693 100.00
- = Nil. Note = The information within brackets relates to Central Sphere.
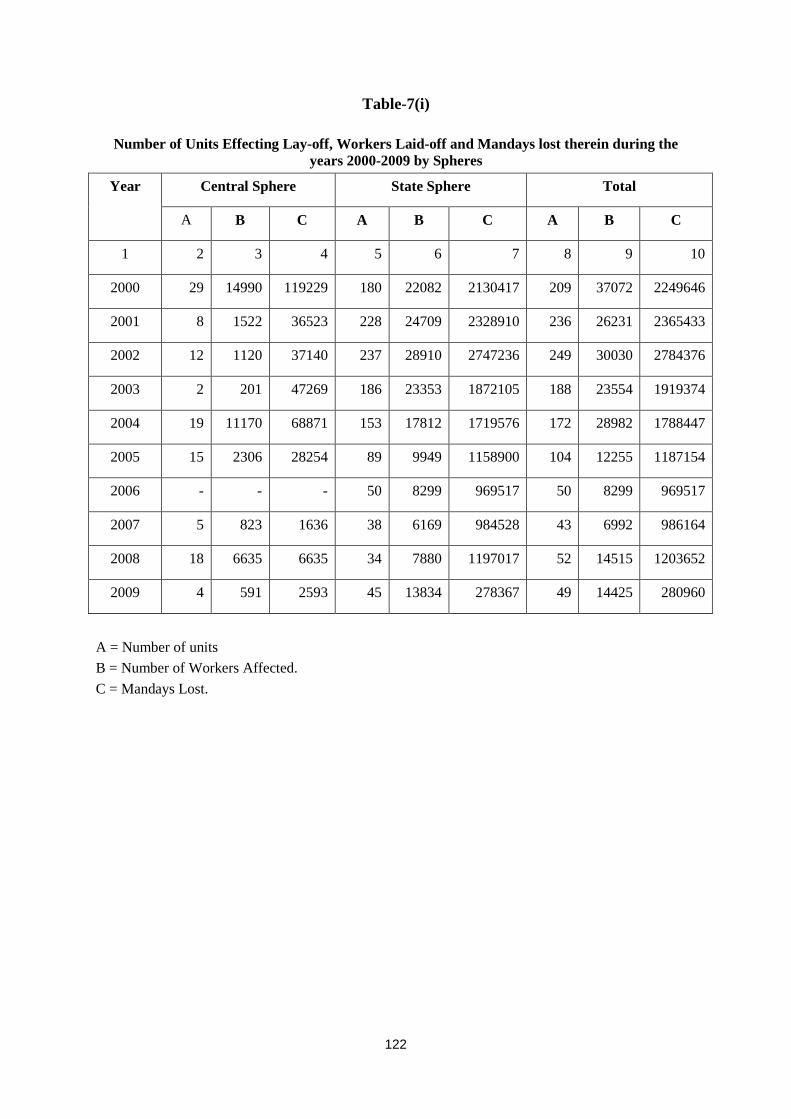
122
Table-7(i)
Number of Units Effecting Lay-off, Workers Laid-off and Mandays lost therein during the years 2000-2009 by Spheres
Year Central Sphere State Sphere Total
A B C A B C A B C
1 2 3 4 5 6 7 8 9 10
2000 29 14990 119229 180 22082 2130417 209 37072 2249646
2001 8 1522 36523 228 24709 2328910 236 26231 2365433
2002 12 1120 37140 237 28910 2747236 249 30030 2784376
2003 2 201 47269 186 23353 1872105 188 23554 1919374
2004 19 11170 68871 153 17812 1719576 172 28982 1788447
2005 15 2306 28254 89 9949 1158900 104 12255 1187154
2006 - - - 50 8299 969517 50 8299 969517
2007 5 823 1636 38 6169 984528 43 6992 986164
2008 18 6635 6635 34 7880 1197017 52 14515 1203652
2009 4 591 2593 45 13834 278367 49 14425 280960
A = Number of units B = Number of Workers Affected. C = Mandays Lost.
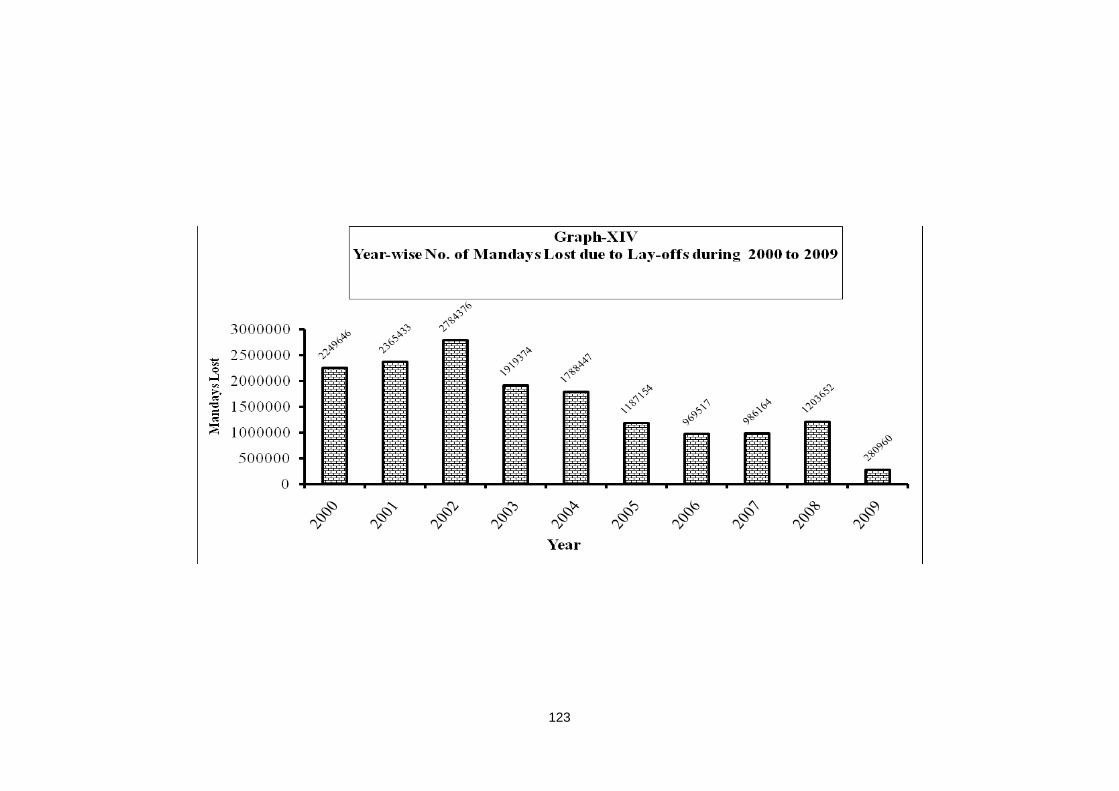
123
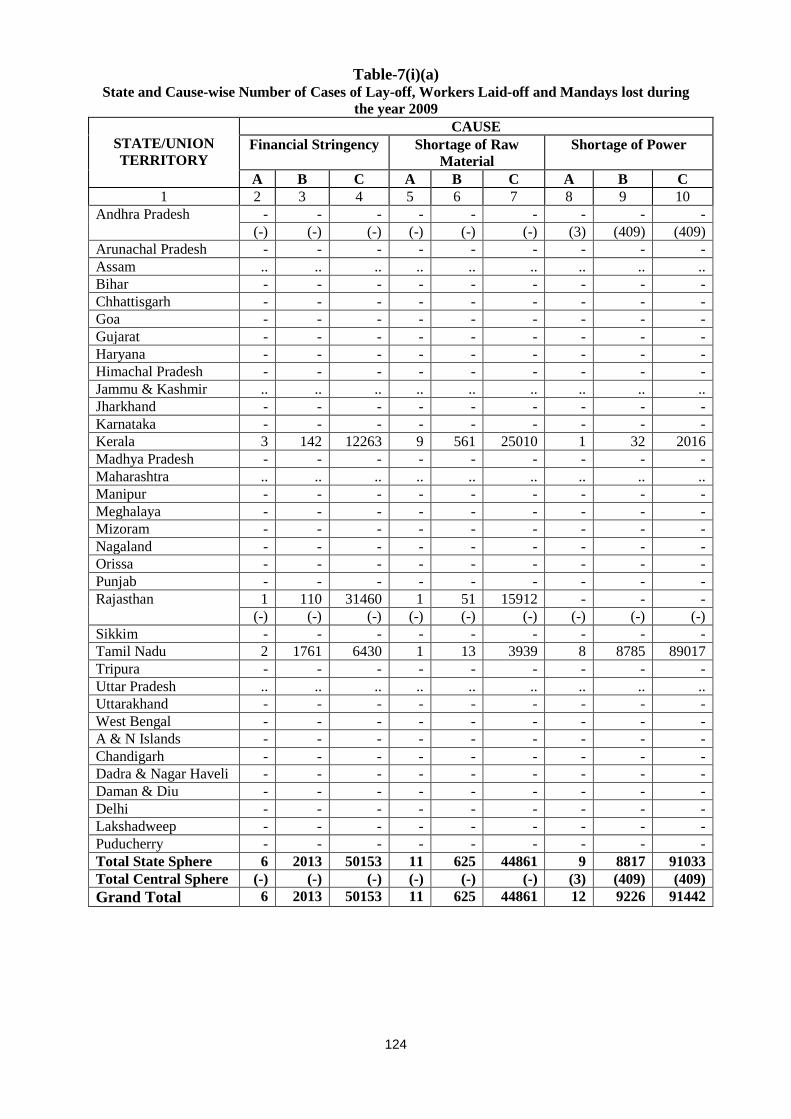
124
Table-7(i)(a) State and Cause-wise Number of Cases of Lay-off, Workers Laid-off and Mandays lost during
the year 2009
STATE/UNION TERRITORY
CAUSE Financial Stringency Shortage of Raw
Material Shortage of Power
A B C A B C A B C 1 2 3 4 5 6 7 8 9 10
Andhra Pradesh - - - - - - - - - (-) (-) (-) (-) (-) (-) (3) (409) (409) Arunachal Pradesh - - - - - - - - - Assam .. .. .. .. .. .. .. .. .. Bihar - - - - - - - - - Chhattisgarh - - - - - - - - - Goa - - - - - - - - - Gujarat - - - - - - - - - Haryana - - - - - - - - - Himachal Pradesh - - - - - - - - - Jammu & Kashmir .. .. .. .. .. .. .. .. .. Jharkhand - - - - - - - - - Karnataka - - - - - - - - - Kerala 3 142 12263 9 561 25010 1 32 2016 Madhya Pradesh - - - - - - - - - Maharashtra .. .. .. .. .. .. .. .. .. Manipur - - - - - - - - - Meghalaya - - - - - - - - - Mizoram - - - - - - - - - Nagaland - - - - - - - - - Orissa - - - - - - - - - Punjab - - - - - - - - - Rajasthan 1 110 31460 1 51 15912 - - - (-) (-) (-) (-) (-) (-) (-) (-) (-) Sikkim - - - - - - - - - Tamil Nadu 2 1761 6430 1 13 3939 8 8785 89017 Tripura - - - - - - - - - Uttar Pradesh .. .. .. .. .. .. .. .. .. Uttarakhand - - - - - - - - - West Bengal - - - - - - - - - A & N Islands - - - - - - - - - Chandigarh - - - - - - - - - Dadra & Nagar Haveli - - - - - - - - - Daman & Diu - - - - - - - - - Delhi - - - - - - - - - Lakshadweep - - - - - - - - - Puducherry - - - - - - - - - Total State Sphere 6 2013 50153 11 625 44861 9 8817 91033 Total Central Sphere (-) (-) (-) (-) (-) (-) (3) (409) (409) Grand Total 6 2013 50153 11 625 44861 12 9226 91442
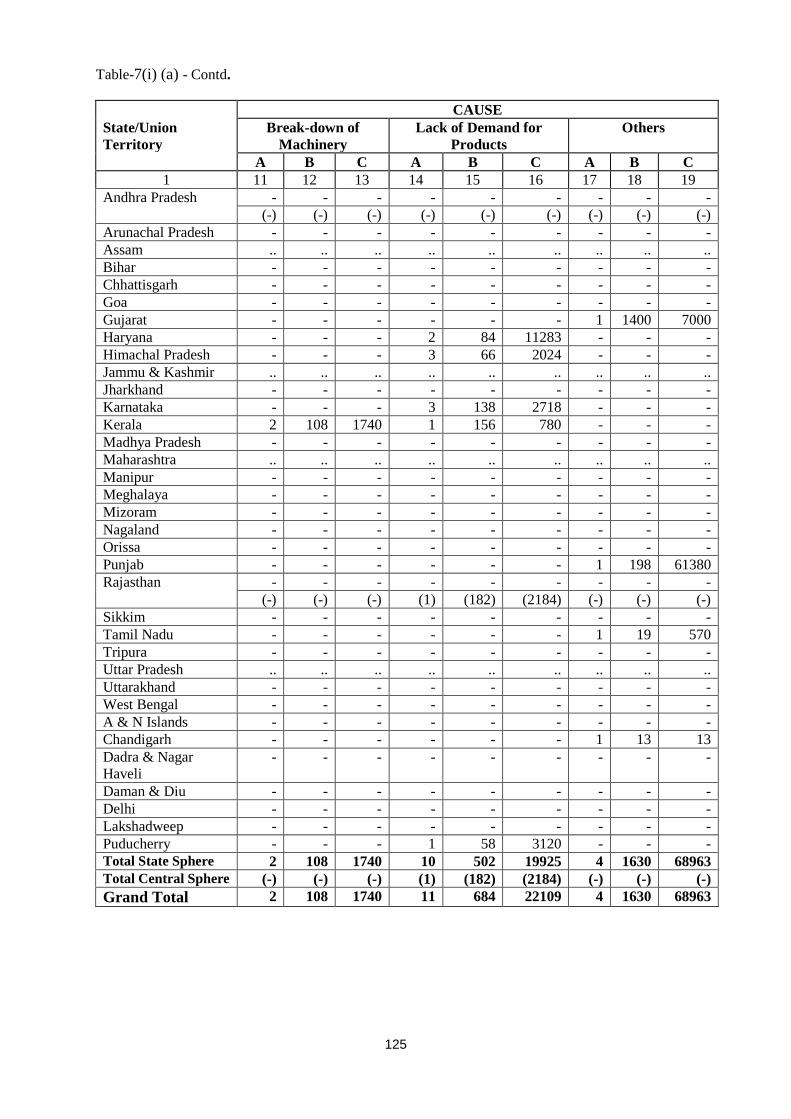
125
Table-7(i) (a) - Contd. CAUSE State/Union Territory
Break-down of Machinery
Lack of Demand for Products
Others
A B C A B C A B C 1 11 12 13 14 15 16 17 18 19
Andhra Pradesh - - - - - - - - - (-) (-) (-) (-) (-) (-) (-) (-) (-) Arunachal Pradesh - - - - - - - - - Assam .. .. .. .. .. .. .. .. .. Bihar - - - - - - - - - Chhattisgarh - - - - - - - - - Goa - - - - - - - - - Gujarat - - - - - - 1 1400 7000 Haryana - - - 2 84 11283 - - - Himachal Pradesh - - - 3 66 2024 - - - Jammu & Kashmir .. .. .. .. .. .. .. .. .. Jharkhand - - - - - - - - - Karnataka - - - 3 138 2718 - - - Kerala 2 108 1740 1 156 780 - - - Madhya Pradesh - - - - - - - - - Maharashtra .. .. .. .. .. .. .. .. .. Manipur - - - - - - - - - Meghalaya - - - - - - - - - Mizoram - - - - - - - - - Nagaland - - - - - - - - - Orissa - - - - - - - - - Punjab - - - - - - 1 198 61380 Rajasthan - - - - - - - - - (-) (-) (-) (1) (182) (2184) (-) (-) (-) Sikkim - - - - - - - - - Tamil Nadu - - - - - - 1 19 570 Tripura - - - - - - - - - Uttar Pradesh .. .. .. .. .. .. .. .. .. Uttarakhand - - - - - - - - - West Bengal - - - - - - - - - A & N Islands - - - - - - - - - Chandigarh - - - - - - 1 13 13 Dadra & Nagar Haveli
- - - - - - - - -
Daman & Diu - - - - - - - - - Delhi - - - - - - - - - Lakshadweep - - - - - - - - - Puducherry - - - 1 58 3120 - - - Total State Sphere 2 108 1740 10 502 19925 4 1630 68963 Total Central Sphere (-) (-) (-) (1) (182) (2184) (-) (-) (-) Grand Total 2 108 1740 11 684 22109 4 1630 68963
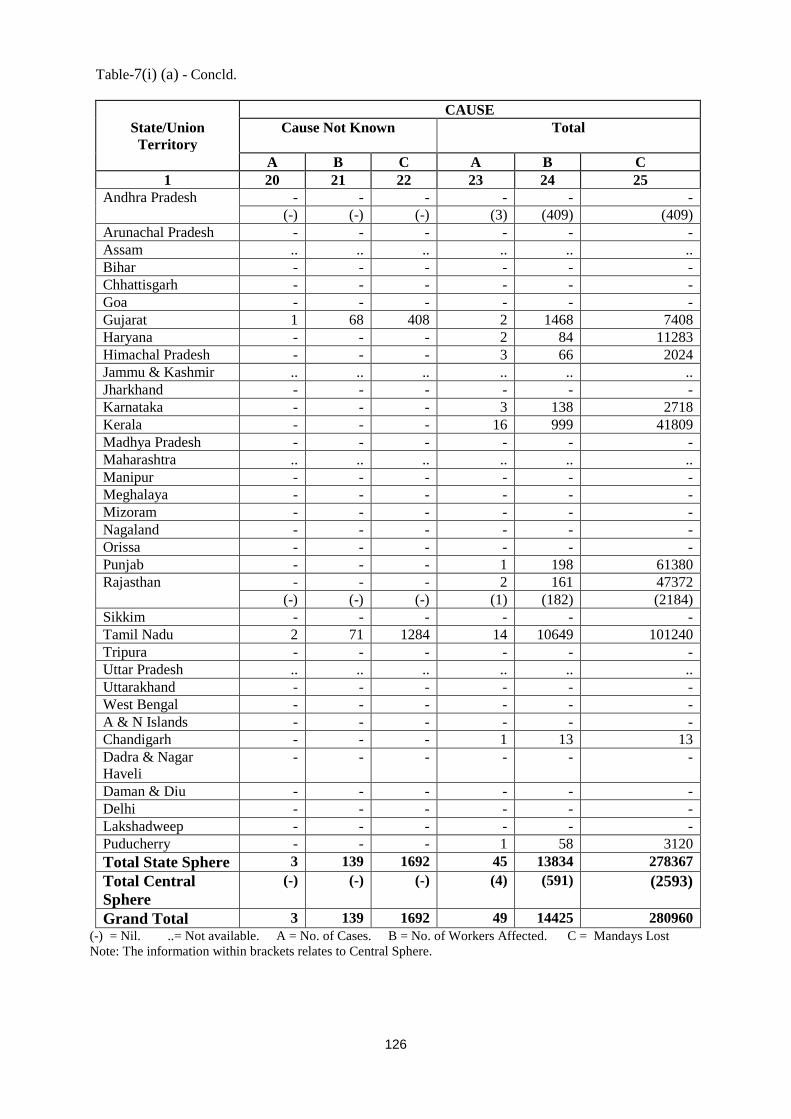
126
Table-7(i) (a) - Concld. CAUSE
State/Union Territory
Cause Not Known Total
A B C A B C 1 20 21 22 23 24 25
Andhra Pradesh - - - - - - (-) (-) (-) (3) (409) (409) Arunachal Pradesh - - - - - - Assam .. .. .. .. .. .. Bihar - - - - - - Chhattisgarh - - - - - - Goa - - - - - - Gujarat 1 68 408 2 1468 7408 Haryana - - - 2 84 11283 Himachal Pradesh - - - 3 66 2024 Jammu & Kashmir .. .. .. .. .. .. Jharkhand - - - - - - Karnataka - - - 3 138 2718 Kerala - - - 16 999 41809 Madhya Pradesh - - - - - - Maharashtra .. .. .. .. .. .. Manipur - - - - - - Meghalaya - - - - - - Mizoram - - - - - - Nagaland - - - - - - Orissa - - - - - - Punjab - - - 1 198 61380 Rajasthan - - - 2 161 47372 (-) (-) (-) (1) (182) (2184) Sikkim - - - - - - Tamil Nadu 2 71 1284 14 10649 101240 Tripura - - - - - - Uttar Pradesh .. .. .. .. .. .. Uttarakhand - - - - - - West Bengal - - - - - - A & N Islands - - - - - - Chandigarh - - - 1 13 13 Dadra & Nagar Haveli
- - - - - -
Daman & Diu - - - - - - Delhi - - - - - - Lakshadweep - - - - - - Puducherry - - - 1 58 3120 Total State Sphere 3 139 1692 45 13834 278367 Total Central Sphere
(-) (-) (-) (4) (591) (2593)
Grand Total 3 139 1692 49 14425 280960 (-) = Nil. ..= Not available. A = No. of Cases. B = No. of Workers Affected. C = Mandays Lost Note: The information within brackets relates to Central Sphere.
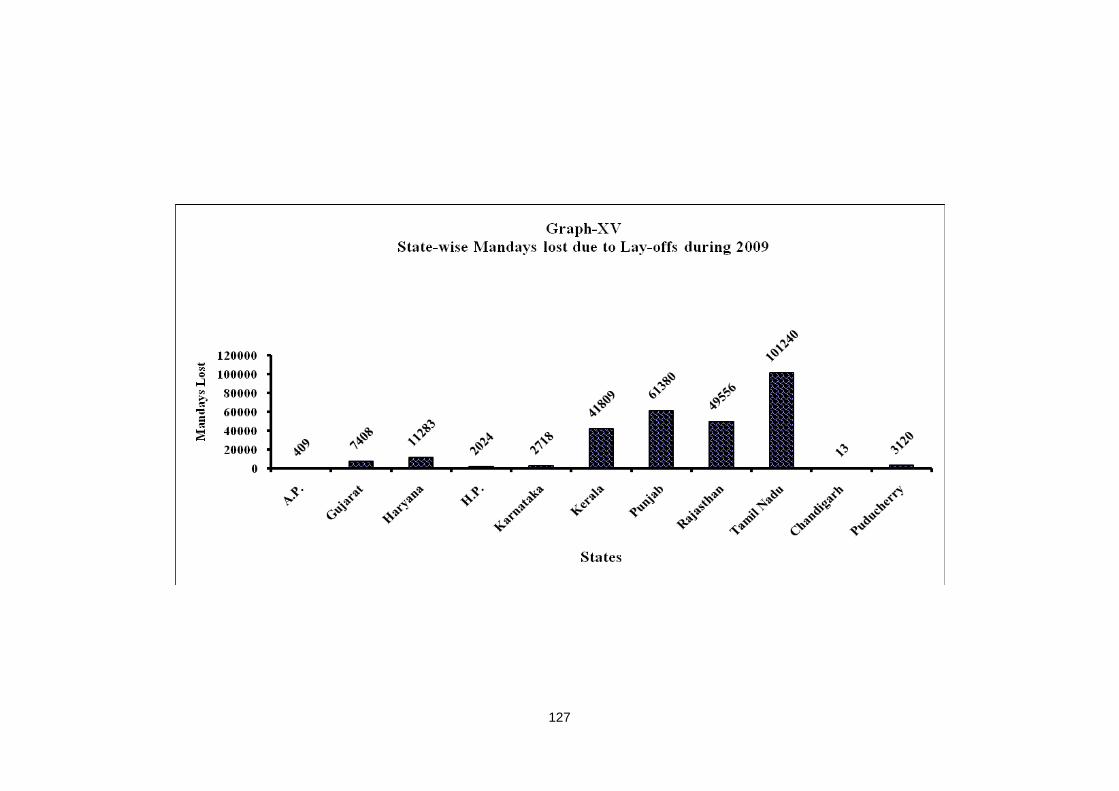
127
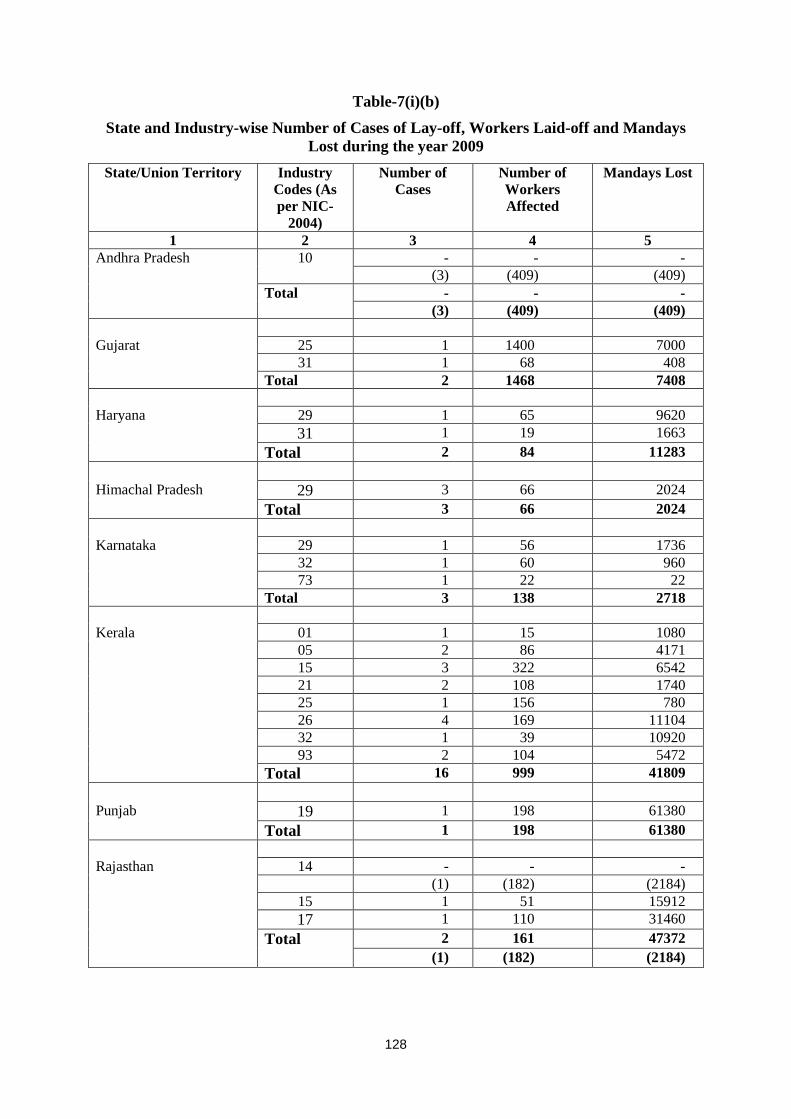
128
Table-7(i)(b)
State and Industry-wise Number of Cases of Lay-off, Workers Laid-off and Mandays Lost during the year 2009
State/Union Territory Industry Codes (As per NIC-
2004)
Number of Cases
Number of Workers Affected
Mandays Lost
1 2 3 4 5 Andhra Pradesh 10 - - - (3) (409) (409) Total - - - (3) (409) (409) Gujarat 25 1 1400 7000 31 1 68 408 Total 2 1468 7408 Haryana 29 1 65 9620 31 1 19 1663 Total 2 84 11283 Himachal Pradesh 29 3 66 2024 Total 3 66 2024 Karnataka 29 1 56 1736 32 1 60 960 73 1 22 22 Total 3 138 2718 Kerala 01 1 15 1080 05 2 86 4171 15 3 322 6542 21 2 108 1740 25 1 156 780 26 4 169 11104 32 1 39 10920 93 2 104 5472 Total 16 999 41809 Punjab 19 1 198 61380 Total 1 198 61380 Rajasthan 14 - - - (1) (182) (2184) 15 1 51 15912 17 1 110 31460 Total 2 161 47372 (1) (182) (2184)
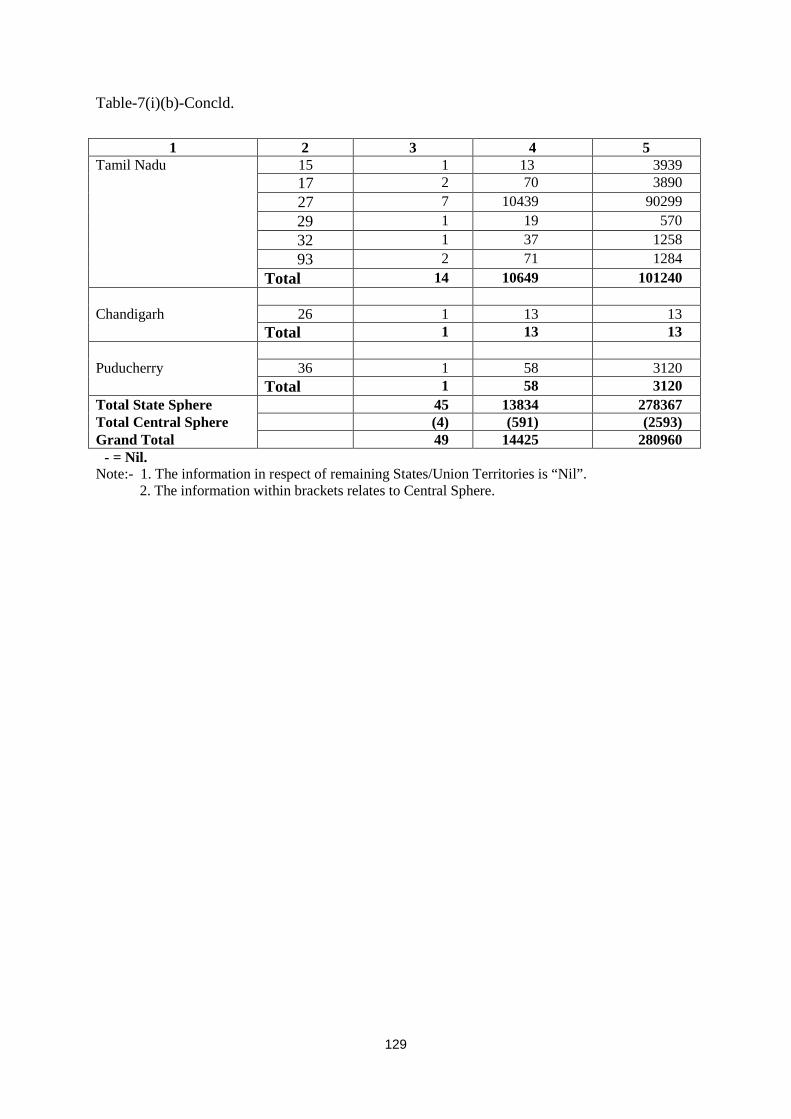
129
Table-7(i)(b)-Concld.
1 2 3 4 5
Tamil Nadu 15 1 13 3939 17 2 70 3890 27 7 10439 90299 29 1 19 570 32 1 37 1258
93 2 71 1284 Total 14 10649 101240 Chandigarh 26 1 13 13
Total 1 13 13 Puducherry 36 1 58 3120 Total 1 58 3120 Total State Sphere 45 13834 278367 Total Central Sphere (4) (591) (2593) Grand Total 49 14425 280960
- = Nil. Note:- 1. The information in respect of remaining States/Union Territories is “Nil”. 2. The information within brackets relates to Central Sphere.
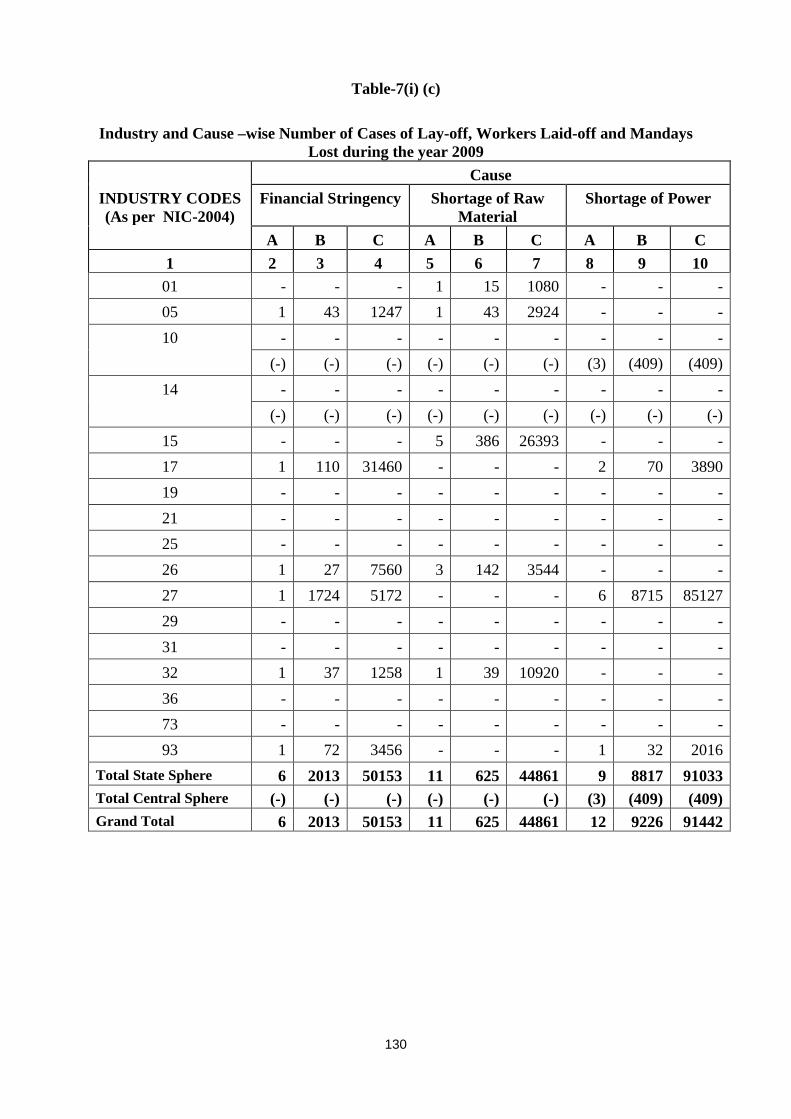
130
Table-7(i) (c)
Industry and Cause –wise Number of Cases of Lay-off, Workers Laid-off and Mandays Lost during the year 2009
Cause INDUSTRY CODES (As per NIC-2004)
Financial Stringency Shortage of Raw Material
Shortage of Power
A B C A B C A B C 1 2 3 4 5 6 7 8 9 10 01 - - - 1 15 1080 - - - 05 1 43 1247 1 43 2924 - - - 10 - - - - - - - - - (-) (-) (-) (-) (-) (-) (3) (409) (409)
14 - - - - - - - - - (-) (-) (-) (-) (-) (-) (-) (-) (-)
15 - - - 5 386 26393 - - - 17 1 110 31460 - - - 2 70 3890 19 - - - - - - - - - 21 - - - - - - - - - 25 - - - - - - - - - 26 1 27 7560 3 142 3544 - - - 27 1 1724 5172 - - - 6 8715 85127 29 - - - - - - - - - 31 - - - - - - - - - 32 1 37 1258 1 39 10920 - - - 36 - - - - - - - - - 73 - - - - - - - - - 93 1 72 3456 - - - 1 32 2016
Total State Sphere 6 2013 50153 11 625 44861 9 8817 91033 Total Central Sphere (-) (-) (-) (-) (-) (-) (3) (409) (409) Grand Total 6 2013 50153 11 625 44861 12 9226 91442
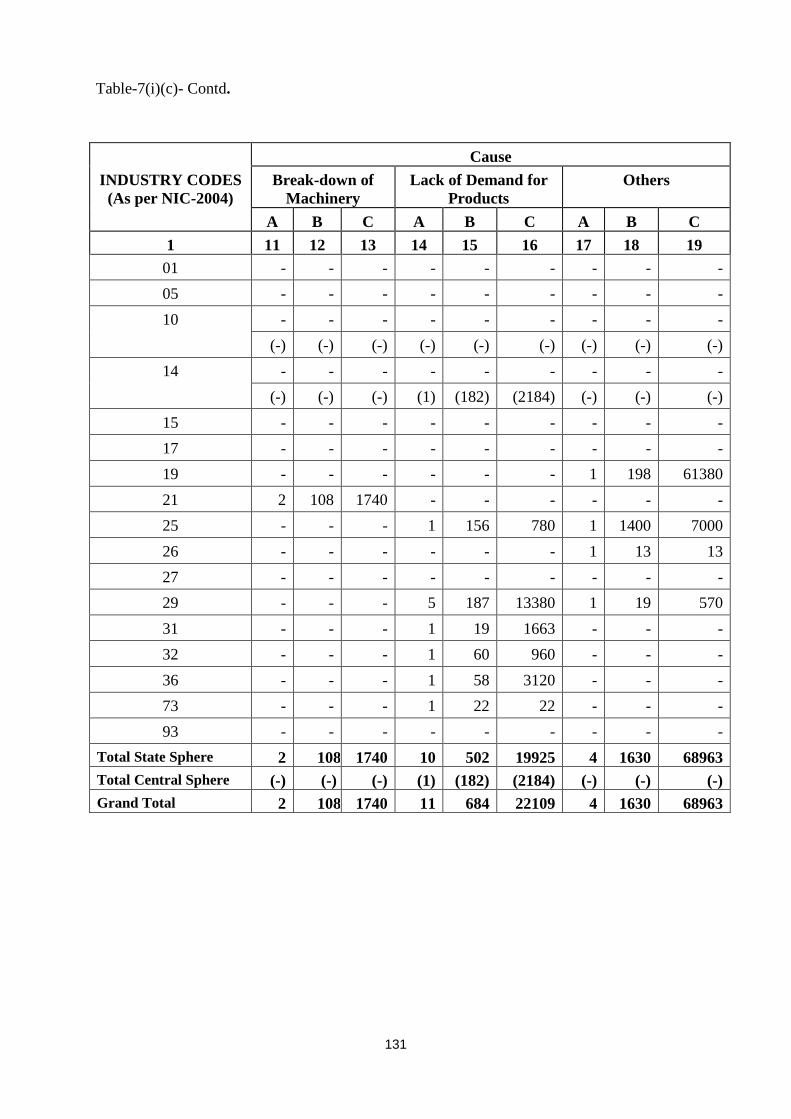
131
Table-7(i)(c)- Contd.
Cause INDUSTRY CODES
(As per NIC-2004) Break-down of
Machinery Lack of Demand for
Products Others
A B C A B C A B C 1 11 12 13 14 15 16 17 18 19
01 - - - - - - - - - 05 - - - - - - - - - 10 - - - - - - - - - (-) (-) (-) (-) (-) (-) (-) (-) (-)
14 - - - - - - - - - (-) (-) (-) (1) (182) (2184) (-) (-) (-)
15 - - - - - - - - - 17 - - - - - - - - - 19 - - - - - - 1 198 61380 21 2 108 1740 - - - - - - 25 - - - 1 156 780 1 1400 7000 26 - - - - - - 1 13 13 27 - - - - - - - - - 29 - - - 5 187 13380 1 19 570 31 - - - 1 19 1663 - - - 32 - - - 1 60 960 - - - 36 - - - 1 58 3120 - - - 73 - - - 1 22 22 - - - 93 - - - - - - - - -
Total State Sphere 2 108 1740 10 502 19925 4 1630 68963 Total Central Sphere (-) (-) (-) (1) (182) (2184) (-) (-) (-) Grand Total 2 108 1740 11 684 22109 4 1630 68963
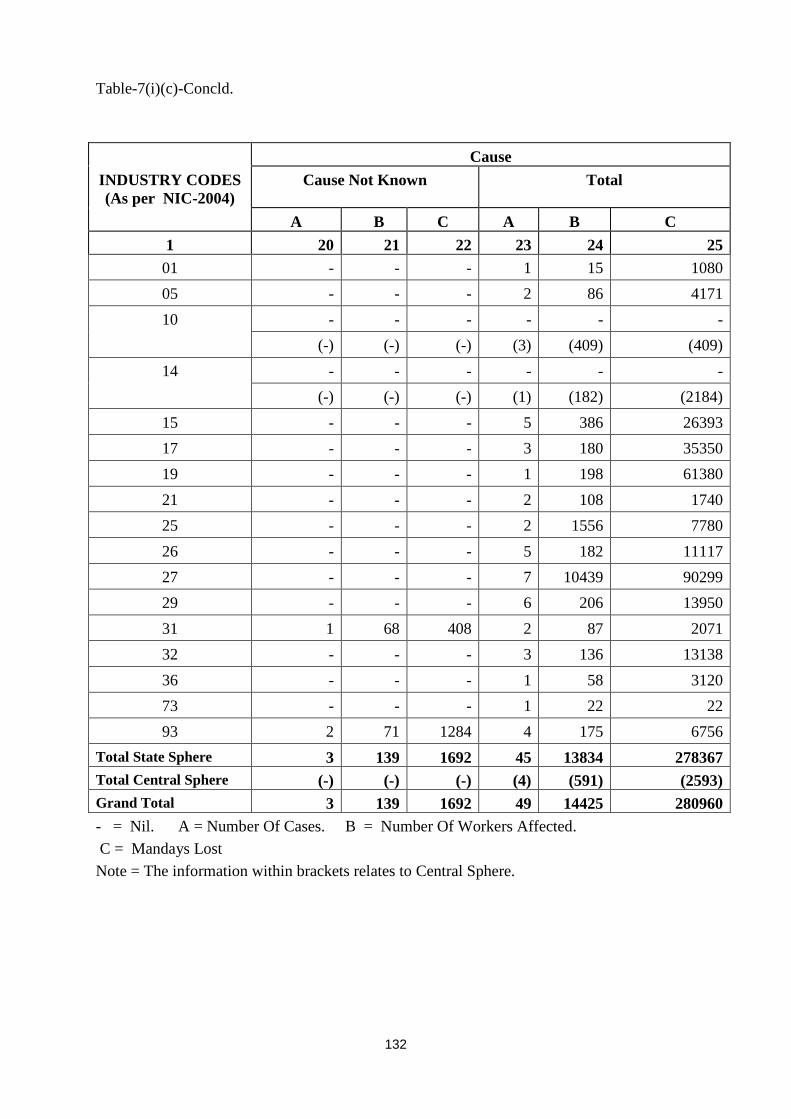
132
Table-7(i)(c)-Concld.
Cause INDUSTRY CODES (As per NIC-2004)
Cause Not Known Total
A B C A B C 1 20 21 22 23 24 25 01 - - - 1 15 1080 05 - - - 2 86 4171 10 - - - - - - (-) (-) (-) (3) (409) (409)
14 - - - - - - (-) (-) (-) (1) (182) (2184)
15 - - - 5 386 26393 17 - - - 3 180 35350 19 - - - 1 198 61380 21 - - - 2 108 1740 25 - - - 2 1556 7780 26 - - - 5 182 11117 27 - - - 7 10439 90299 29 - - - 6 206 13950 31 1 68 408 2 87 2071 32 - - - 3 136 13138 36 - - - 1 58 3120 73 - - - 1 22 22 93 2 71 1284 4 175 6756
Total State Sphere 3 139 1692 45 13834 278367 Total Central Sphere (-) (-) (-) (4) (591) (2593) Grand Total 3 139 1692 49 14425 280960 - = Nil. A = Number Of Cases. B = Number Of Workers Affected. C = Mandays Lost Note = The information within brackets relates to Central Sphere.
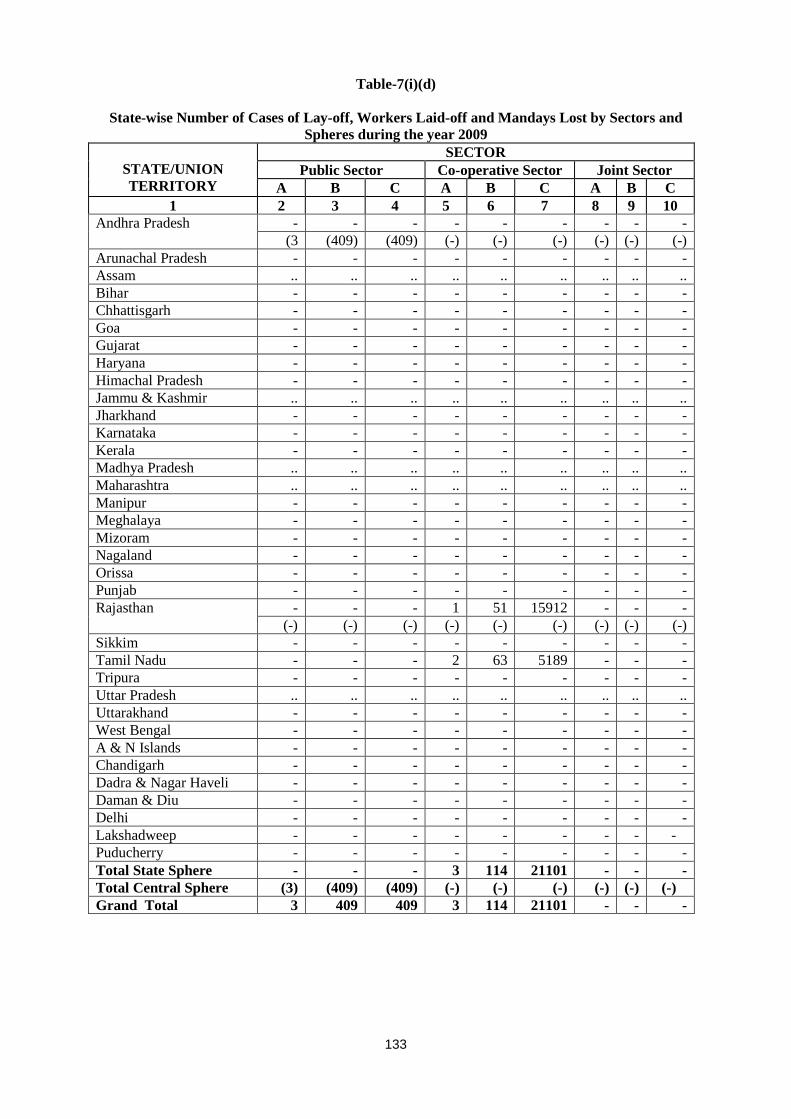
133
Table-7(i)(d)
State-wise Number of Cases of Lay-off, Workers Laid-off and Mandays Lost by Sectors and Spheres during the year 2009
STATE/UNION TERRITORY
SECTOR Public Sector Co-operative Sector Joint Sector
A B C A B C A B C 1 2 3 4 5 6 7 8 9 10
Andhra Pradesh - - - - - - - - - (3 (409) (409) (-) (-) (-) (-) (-) (-) Arunachal Pradesh - - - - - - - - - Assam .. .. .. .. .. .. .. .. .. Bihar - - - - - - - - - Chhattisgarh - - - - - - - - - Goa - - - - - - - - - Gujarat - - - - - - - - - Haryana - - - - - - - - - Himachal Pradesh - - - - - - - - - Jammu & Kashmir .. .. .. .. .. .. .. .. .. Jharkhand - - - - - - - - - Karnataka - - - - - - - - - Kerala - - - - - - - - - Madhya Pradesh .. .. .. .. .. .. .. .. .. Maharashtra .. .. .. .. .. .. .. .. .. Manipur - - - - - - - - - Meghalaya - - - - - - - - - Mizoram - - - - - - - - - Nagaland - - - - - - - - - Orissa - - - - - - - - - Punjab - - - - - - - - - Rajasthan - - - 1 51 15912 - - - (-) (-) (-) (-) (-) (-) (-) (-) (-) Sikkim - - - - - - - - - Tamil Nadu - - - 2 63 5189 - - - Tripura - - - - - - - - - Uttar Pradesh .. .. .. .. .. .. .. .. .. Uttarakhand - - - - - - - - - West Bengal - - - - - - - - - A & N Islands - - - - - - - - - Chandigarh - - - - - - - - - Dadra & Nagar Haveli - - - - - - - - - Daman & Diu - - - - - - - - - Delhi - - - - - - - - - Lakshadweep - - - - - - - - - Puducherry - - - - - - - - - Total State Sphere - - - 3 114 21101 - - - Total Central Sphere (3) (409) (409) (-) (-) (-) (-) (-) (-) Grand Total 3 409 409 3 114 21101 - - -
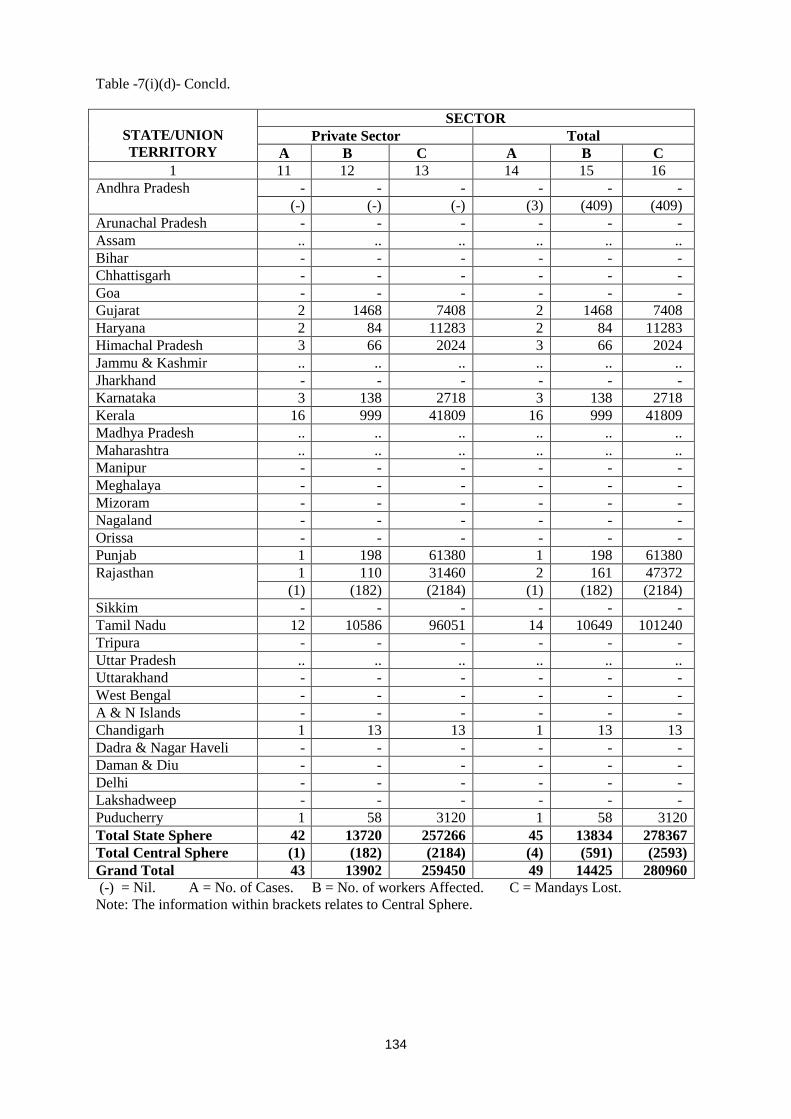
134
Table -7(i)(d)- Concld.
STATE/UNION TERRITORY
SECTOR Private Sector Total
A B C A B C 1 11 12 13 14 15 16
Andhra Pradesh - - - - - - (-) (-) (-) (3) (409) (409) Arunachal Pradesh - - - - - - Assam .. .. .. .. .. .. Bihar - - - - - - Chhattisgarh - - - - - - Goa - - - - - - Gujarat 2 1468 7408 2 1468 7408 Haryana 2 84 11283 2 84 11283 Himachal Pradesh 3 66 2024 3 66 2024 Jammu & Kashmir .. .. .. .. .. .. Jharkhand - - - - - - Karnataka 3 138 2718 3 138 2718 Kerala 16 999 41809 16 999 41809 Madhya Pradesh .. .. .. .. .. .. Maharashtra .. .. .. .. .. .. Manipur - - - - - - Meghalaya - - - - - - Mizoram - - - - - - Nagaland - - - - - - Orissa - - - - - - Punjab 1 198 61380 1 198 61380 Rajasthan 1 110 31460 2 161 47372 (1) (182) (2184) (1) (182) (2184) Sikkim - - - - - - Tamil Nadu 12 10586 96051 14 10649 101240 Tripura - - - - - - Uttar Pradesh .. .. .. .. .. .. Uttarakhand - - - - - - West Bengal - - - - - - A & N Islands - - - - - - Chandigarh 1 13 13 1 13 13 Dadra & Nagar Haveli - - - - - - Daman & Diu - - - - - - Delhi - - - - - - Lakshadweep - - - - - - Puducherry 1 58 3120 1 58 3120 Total State Sphere 42 13720 257266 45 13834 278367 Total Central Sphere (1) (182) (2184) (4) (591) (2593) Grand Total 43 13902 259450 49 14425 280960 (-) = Nil. A = No. of Cases. B = No. of workers Affected. C = Mandays Lost. Note: The information within brackets relates to Central Sphere.
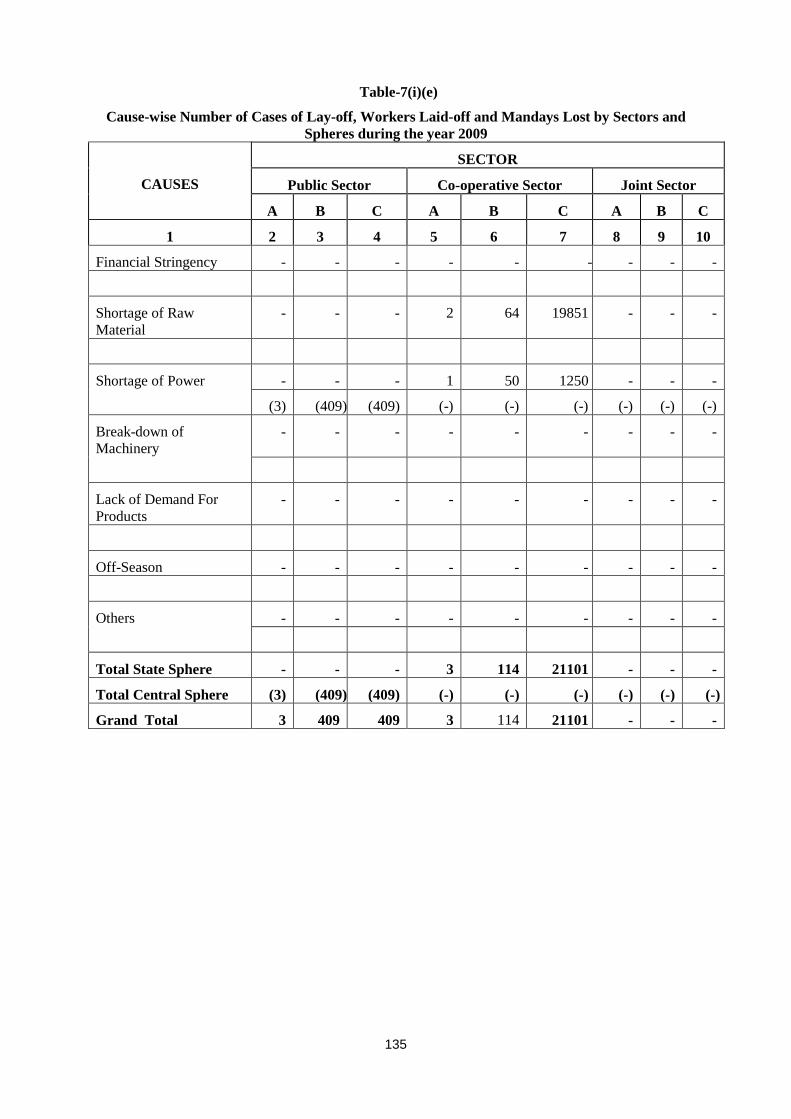
135
Table-7(i)(e)
Cause-wise Number of Cases of Lay-off, Workers Laid-off and Mandays Lost by Sectors and Spheres during the year 2009
CAUSES
SECTOR
Public Sector Co-operative Sector Joint Sector
A B C A B C A B C
1 2 3 4 5 6 7 8 9 10
Financial Stringency - - - - - - - - -
Shortage of Raw Material
- - - 2 64 19851 - - -
Shortage of Power - - - 1 50 1250 - - -
(3) (409) (409) (-) (-) (-) (-) (-) (-)
Break-down of Machinery
- - - - - - - - -
Lack of Demand For Products
- - - - - - - - -
Off-Season - - - - - - - - -
Others - - - - - - - - -
Total State Sphere - - - 3 114 21101 - - -
Total Central Sphere (3) (409) (409) (-) (-) (-) (-) (-) (-)
Grand Total 3 409 409 3 114 21101 - - -
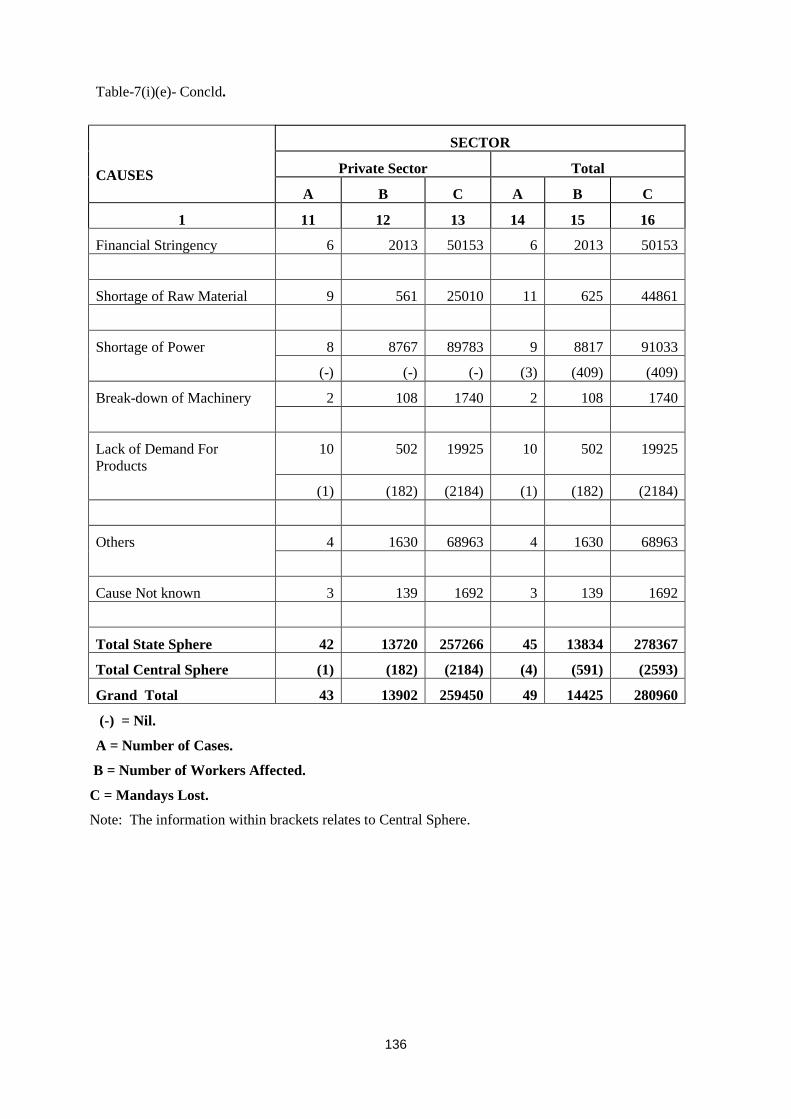
136
Table-7(i)(e)- Concld.
CAUSES
SECTOR
Private Sector Total
A B C A B C
1 11 12 13 14 15 16
Financial Stringency 6 2013 50153 6 2013 50153
Shortage of Raw Material 9 561 25010 11 625 44861
Shortage of Power 8 8767 89783 9 8817 91033
(-) (-) (-) (3) (409) (409)
Break-down of Machinery 2 108 1740 2 108 1740
Lack of Demand For Products
10 502 19925 10 502 19925
(1) (182) (2184) (1) (182) (2184)
Others 4 1630 68963 4 1630 68963
Cause Not known 3 139 1692 3 139 1692
Total State Sphere 42 13720 257266 45 13834 278367
Total Central Sphere (1) (182) (2184) (4) (591) (2593)
Grand Total 43 13902 259450 49 14425 280960
(-) = Nil.
A = Number of Cases.
B = Number of Workers Affected.
C = Mandays Lost.
Note: The information within brackets relates to Central Sphere.
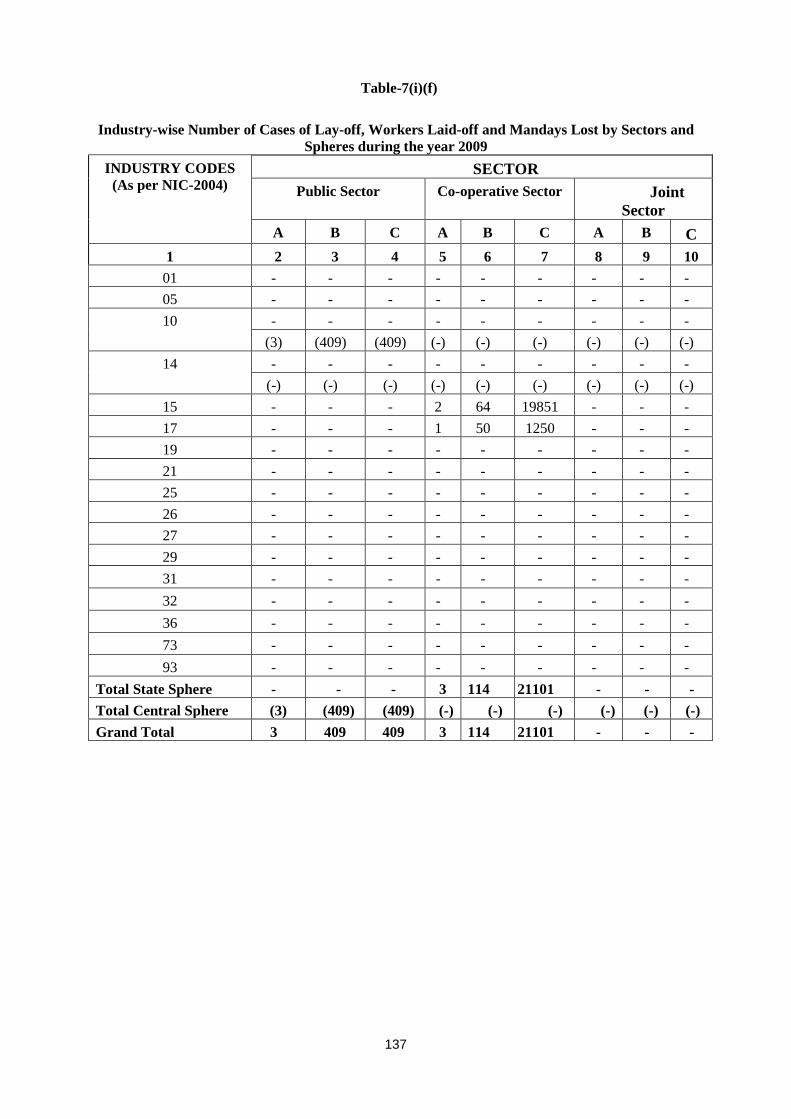
137
Table-7(i)(f)
Industry-wise Number of Cases of Lay-off, Workers Laid-off and Mandays Lost by Sectors and Spheres during the year 2009
INDUSTRY CODES (As per NIC-2004)
SECTOR Public Sector Co-operative Sector Joint
Sector A B C A B C A B C
1 2 3 4 5 6 7 8 9 10 01 - - - - - - - - - 05 - - - - - - - - - 10 - - - - - - - - -
(3) (409) (409) (-) (-) (-) (-) (-) (-) 14 - - - - - - - - -
(-) (-) (-) (-) (-) (-) (-) (-) (-) 15 - - - 2 64 19851 - - - 17 - - - 1 50 1250 - - - 19 - - - - - - - - - 21 - - - - - - - - - 25 - - - - - - - - - 26 - - - - - - - - - 27 - - - - - - - - - 29 - - - - - - - - - 31 - - - - - - - - - 32 - - - - - - - - - 36 - - - - - - - - - 73 - - - - - - - - - 93 - - - - - - - - -
Total State Sphere - - - 3 114 21101 - - - Total Central Sphere (3) (409) (409) (-) (-) (-) (-) (-) (-) Grand Total 3 409 409 3 114 21101 - - -
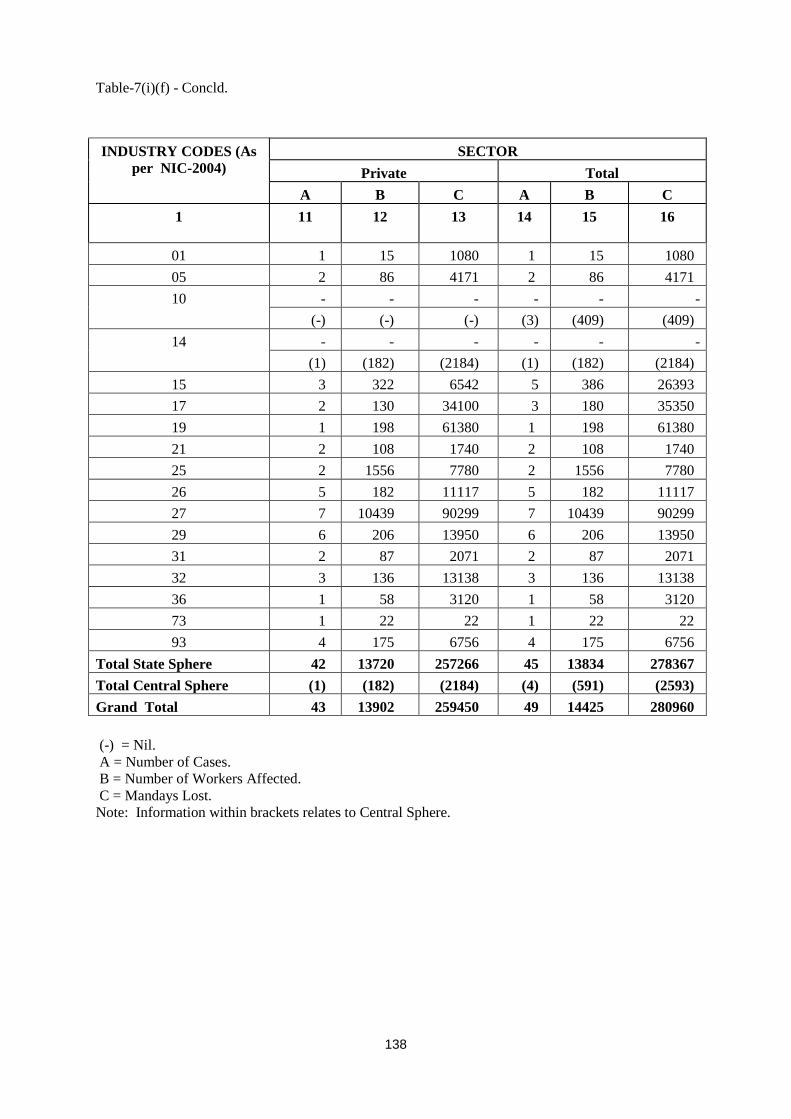
138
Table-7(i)(f) - Concld. INDUSTRY CODES (As
per NIC-2004)
SECTOR Private Total
A B C A B C 1 11 12 13 14 15 16
01 1 15 1080 1 15 1080 05 2 86 4171 2 86 4171 10 - - - - - -
(-) (-) (-) (3) (409) (409) 14 - - - - - -
(1) (182) (2184) (1) (182) (2184) 15 3 322 6542 5 386 26393 17 2 130 34100 3 180 35350 19 1 198 61380 1 198 61380 21 2 108 1740 2 108 1740 25 2 1556 7780 2 1556 7780 26 5 182 11117 5 182 11117 27 7 10439 90299 7 10439 90299 29 6 206 13950 6 206 13950 31 2 87 2071 2 87 2071 32 3 136 13138 3 136 13138 36 1 58 3120 1 58 3120 73 1 22 22 1 22 22 93 4 175 6756 4 175 6756
Total State Sphere 42 13720 257266 45 13834 278367 Total Central Sphere (1) (182) (2184) (4) (591) (2593) Grand Total 43 13902 259450 49 14425 280960 (-) = Nil. A = Number of Cases. B = Number of Workers Affected. C = Mandays Lost. Note: Information within brackets relates to Central Sphere.
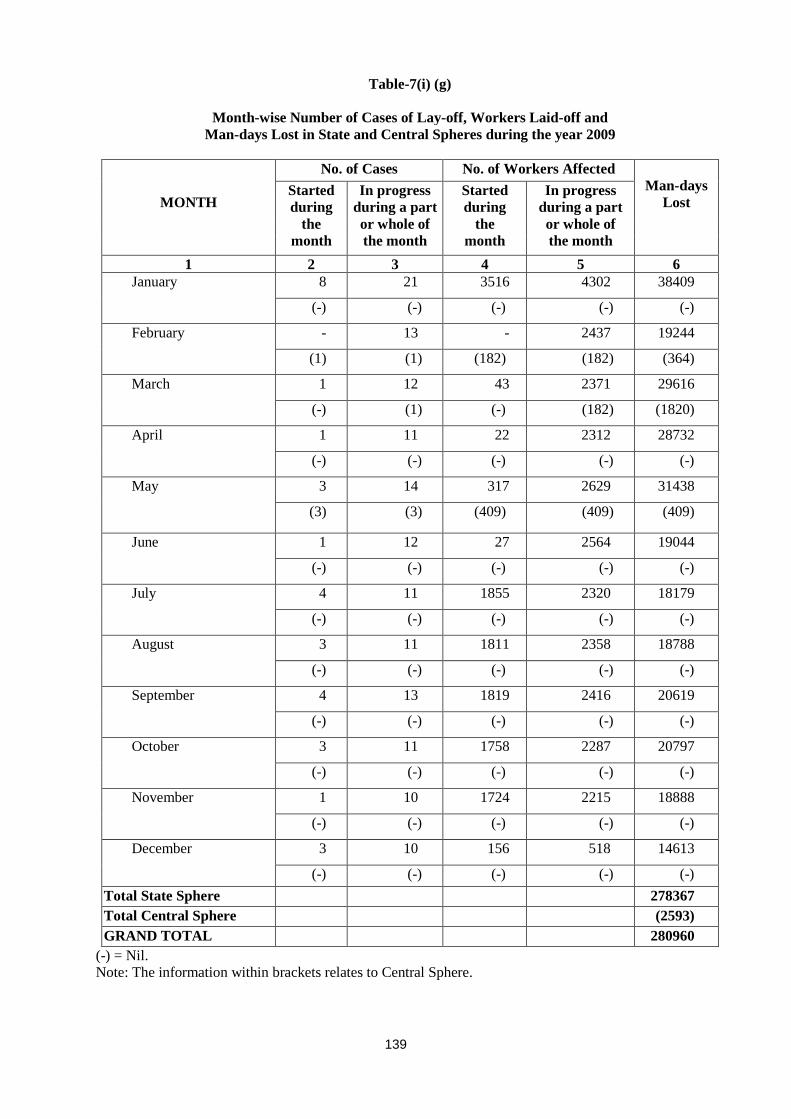
139
Table-7(i) (g)
Month-wise Number of Cases of Lay-off, Workers Laid-off and Man-days Lost in State and Central Spheres during the year 2009
MONTH
No. of Cases No. of Workers Affected Man-days
Lost Started during
the month
In progress during a part or whole of the month
Started during
the month
In progress during a part or whole of the month
1 2 3 4 5 6 January 8 21 3516 4302 38409
(-) (-) (-) (-) (-)
February - 13 - 2437 19244
(1) (1) (182) (182) (364)
March 1 12 43 2371 29616
(-) (1) (-) (182) (1820)
April 1 11 22 2312 28732
(-) (-) (-) (-) (-)
May 3 14 317 2629 31438
(3) (3) (409) (409) (409)
June 1 12 27 2564 19044
(-) (-) (-) (-) (-)
July 4 11 1855 2320 18179
(-) (-) (-) (-) (-)
August 3 11 1811 2358 18788
(-) (-) (-) (-) (-)
September 4 13 1819 2416 20619
(-) (-) (-) (-) (-)
October 3 11 1758 2287 20797
(-) (-) (-) (-) (-)
November 1 10 1724 2215 18888
(-) (-) (-) (-) (-)
December 3 10 156 518 14613
(-) (-) (-) (-) (-) Total State Sphere 278367 Total Central Sphere (2593) GRAND TOTAL 280960
(-) = Nil. Note: The information within brackets relates to Central Sphere.
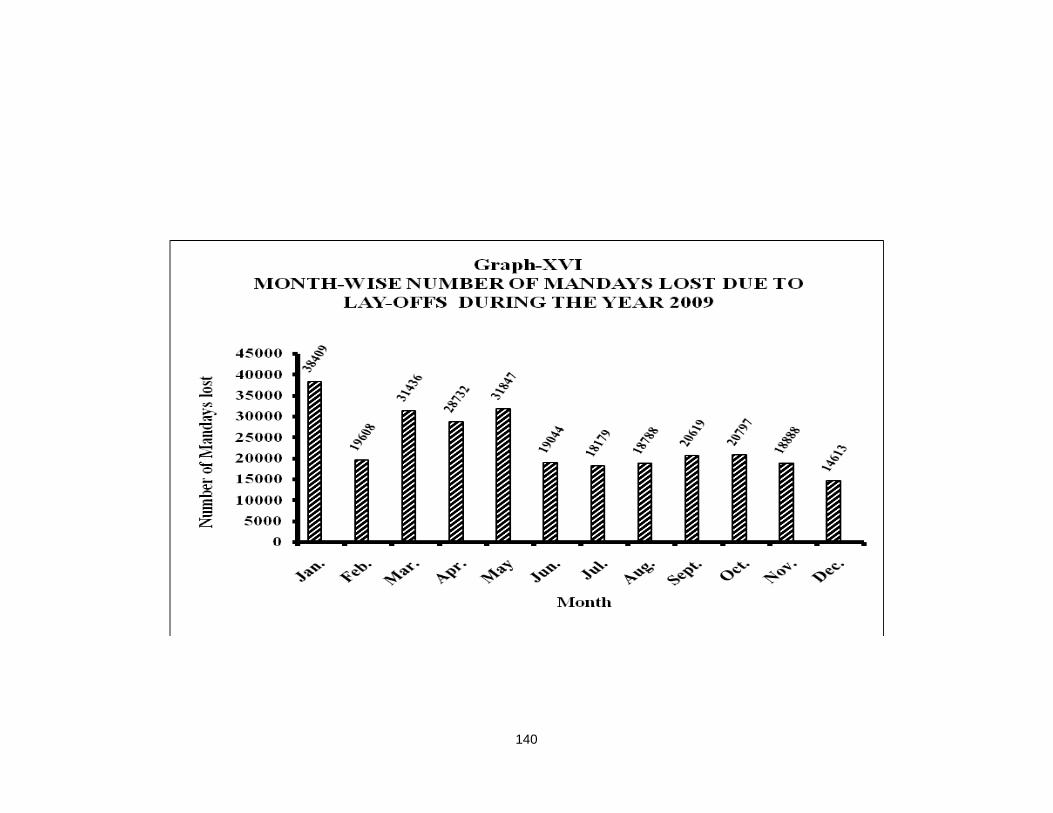
140
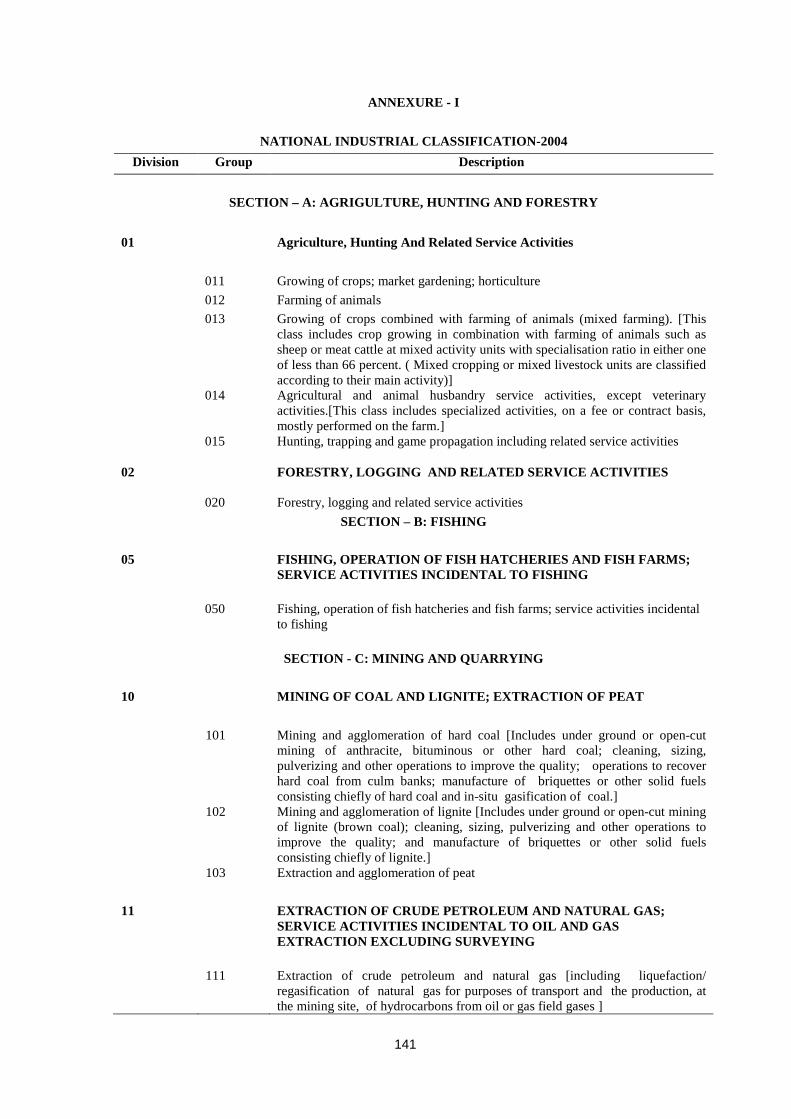
141
ANNEXURE - I
NATIONAL INDUSTRIAL CLASSIFICATION-2004 Division Group Description
SECTION – A: AGRIGULTURE, HUNTING AND FORESTRY
01 Agriculture, Hunting And Related Service Activities 011 Growing of crops; market gardening; horticulture 012 Farming of animals 013 Growing of crops combined with farming of animals (mixed farming). [This
class includes crop growing in combination with farming of animals such as sheep or meat cattle at mixed activity units with specialisation ratio in either one of less than 66 percent. ( Mixed cropping or mixed livestock units are classified according to their main activity)]
014 Agricultural and animal husbandry service activities, except veterinary activities.[This class includes specialized activities, on a fee or contract basis, mostly performed on the farm.]
015 Hunting, trapping and game propagation including related service activities
02 FORESTRY, LOGGING AND RELATED SERVICE ACTIVITIES
020 Forestry, logging and related service activities SECTION – B: FISHING
05 FISHING, OPERATION OF FISH HATCHERIES AND FISH FARMS;
SERVICE ACTIVITIES INCIDENTAL TO FISHING 050 Fishing, operation of fish hatcheries and fish farms; service activities incidental
to fishing
SECTION - C: MINING AND QUARRYING 10 MINING OF COAL AND LIGNITE; EXTRACTION OF PEAT 101 Mining and agglomeration of hard coal [Includes under ground or open-cut
mining of anthracite, bituminous or other hard coal; cleaning, sizing, pulverizing and other operations to improve the quality; operations to recover hard coal from culm banks; manufacture of briquettes or other solid fuels consisting chiefly of hard coal and in-situ gasification of coal.]
102 Mining and agglomeration of lignite [Includes under ground or open-cut mining of lignite (brown coal); cleaning, sizing, pulverizing and other operations to improve the quality; and manufacture of briquettes or other solid fuels consisting chiefly of lignite.]
103 Extraction and agglomeration of peat 11 EXTRACTION OF CRUDE PETROLEUM AND NATURAL GAS;
SERVICE ACTIVITIES INCIDENTAL TO OIL AND GAS EXTRACTION EXCLUDING SURVEYING
111 Extraction of crude petroleum and natural gas [including liquefaction/
regasification of natural gas for purposes of transport and the production, at the mining site, of hydrocarbons from oil or gas field gases ]
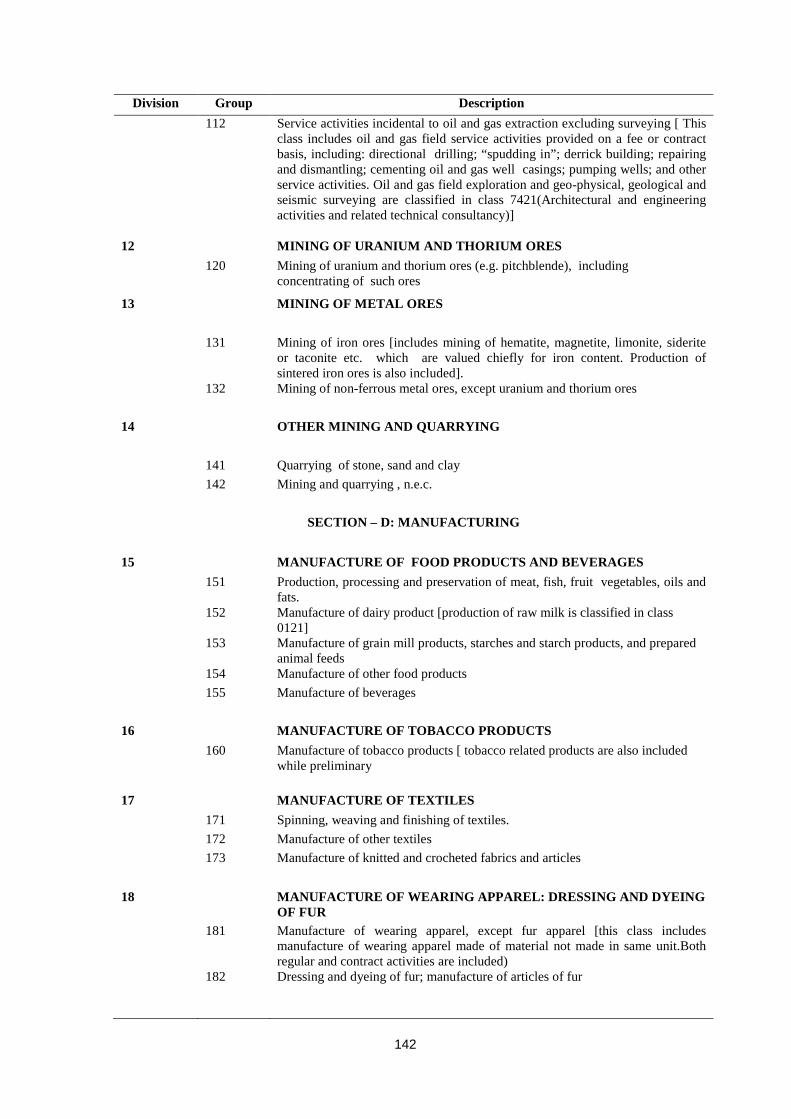
142
Division Group Description 112 Service activities incidental to oil and gas extraction excluding surveying [ This
class includes oil and gas field service activities provided on a fee or contract basis, including: directional drilling; “spudding in”; derrick building; repairing and dismantling; cementing oil and gas well casings; pumping wells; and other service activities. Oil and gas field exploration and geo-physical, geological and seismic surveying are classified in class 7421(Architectural and engineering activities and related technical consultancy)]
12 MINING OF URANIUM AND THORIUM ORES 120 Mining of uranium and thorium ores (e.g. pitchblende), including
concentrating of such ores
13 MINING OF METAL ORES 131 Mining of iron ores [includes mining of hematite, magnetite, limonite, siderite
or taconite etc. which are valued chiefly for iron content. Production of sintered iron ores is also included].
132 Mining of non-ferrous metal ores, except uranium and thorium ores 14 OTHER MINING AND QUARRYING 141 Quarrying of stone, sand and clay 142 Mining and quarrying , n.e.c.
SECTION – D: MANUFACTURING 15 MANUFACTURE OF FOOD PRODUCTS AND BEVERAGES 151 Production, processing and preservation of meat, fish, fruit vegetables, oils and
fats. 152 Manufacture of dairy product [production of raw milk is classified in class
0121] 153 Manufacture of grain mill products, starches and starch products, and prepared
animal feeds 154 Manufacture of other food products 155 Manufacture of beverages 16 MANUFACTURE OF TOBACCO PRODUCTS 160 Manufacture of tobacco products [ tobacco related products are also included
while preliminary 17 MANUFACTURE OF TEXTILES 171 Spinning, weaving and finishing of textiles. 172 Manufacture of other textiles 173 Manufacture of knitted and crocheted fabrics and articles 18 MANUFACTURE OF WEARING APPAREL: DRESSING AND DYEING
OF FUR 181 Manufacture of wearing apparel, except fur apparel [this class includes
manufacture of wearing apparel made of material not made in same unit.Both regular and contract activities are included)
182 Dressing and dyeing of fur; manufacture of articles of fur
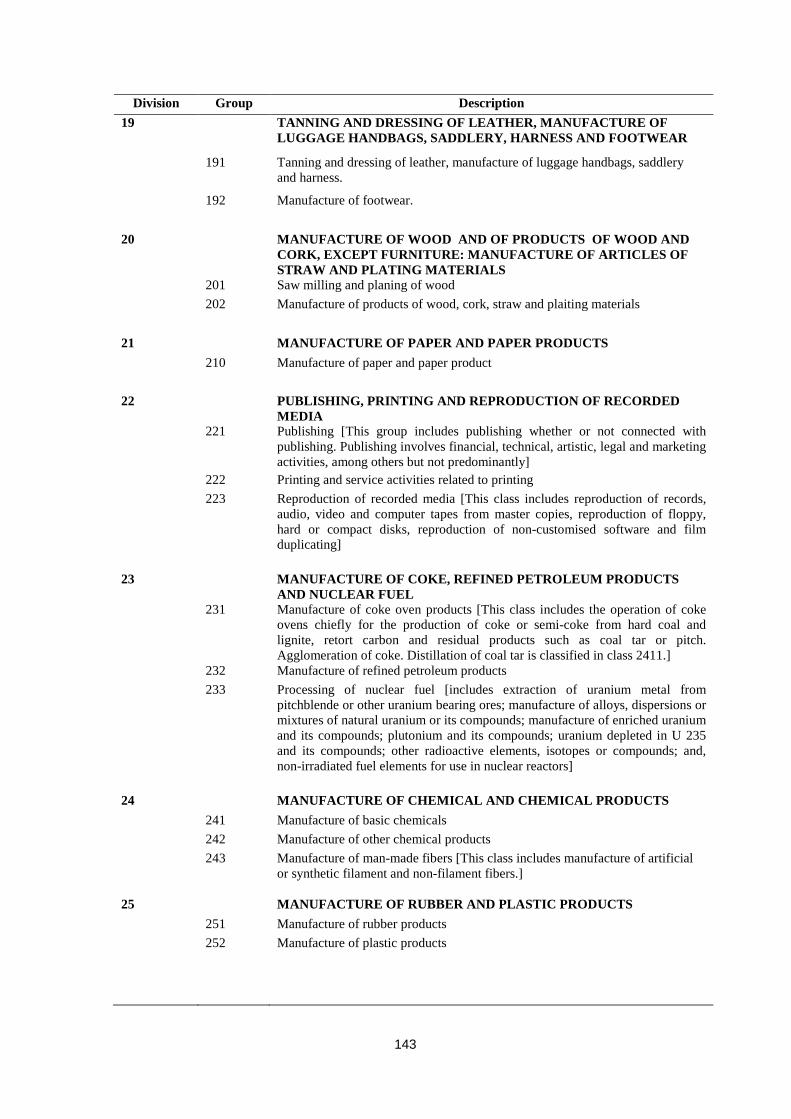
143
Division Group Description 19 TANNING AND DRESSING OF LEATHER, MANUFACTURE OF
LUGGAGE HANDBAGS, SADDLERY, HARNESS AND FOOTWEAR
191 Tanning and dressing of leather, manufacture of luggage handbags, saddlery and harness.
192 Manufacture of footwear. 20 MANUFACTURE OF WOOD AND OF PRODUCTS OF WOOD AND
CORK, EXCEPT FURNITURE: MANUFACTURE OF ARTICLES OF STRAW AND PLATING MATERIALS
201 Saw milling and planing of wood 202 Manufacture of products of wood, cork, straw and plaiting materials 21 MANUFACTURE OF PAPER AND PAPER PRODUCTS 210 Manufacture of paper and paper product 22 PUBLISHING, PRINTING AND REPRODUCTION OF RECORDED
MEDIA 221 Publishing [This group includes publishing whether or not connected with
publishing. Publishing involves financial, technical, artistic, legal and marketing activities, among others but not predominantly]
222 Printing and service activities related to printing 223 Reproduction of recorded media [This class includes reproduction of records,
audio, video and computer tapes from master copies, reproduction of floppy, hard or compact disks, reproduction of non-customised software and film duplicating]
23 MANUFACTURE OF COKE, REFINED PETROLEUM PRODUCTS
AND NUCLEAR FUEL 231 Manufacture of coke oven products [This class includes the operation of coke
ovens chiefly for the production of coke or semi-coke from hard coal and lignite, retort carbon and residual products such as coal tar or pitch. Agglomeration of coke. Distillation of coal tar is classified in class 2411.]
232 Manufacture of refined petroleum products 233 Processing of nuclear fuel [includes extraction of uranium metal from
pitchblende or other uranium bearing ores; manufacture of alloys, dispersions or mixtures of natural uranium or its compounds; manufacture of enriched uranium and its compounds; plutonium and its compounds; uranium depleted in U 235 and its compounds; other radioactive elements, isotopes or compounds; and, non-irradiated fuel elements for use in nuclear reactors]
24 MANUFACTURE OF CHEMICAL AND CHEMICAL PRODUCTS 241 Manufacture of basic chemicals 242 Manufacture of other chemical products 243 Manufacture of man-made fibers [This class includes manufacture of artificial
or synthetic filament and non-filament fibers.]
25 MANUFACTURE OF RUBBER AND PLASTIC PRODUCTS 251 Manufacture of rubber products 252 Manufacture of plastic products
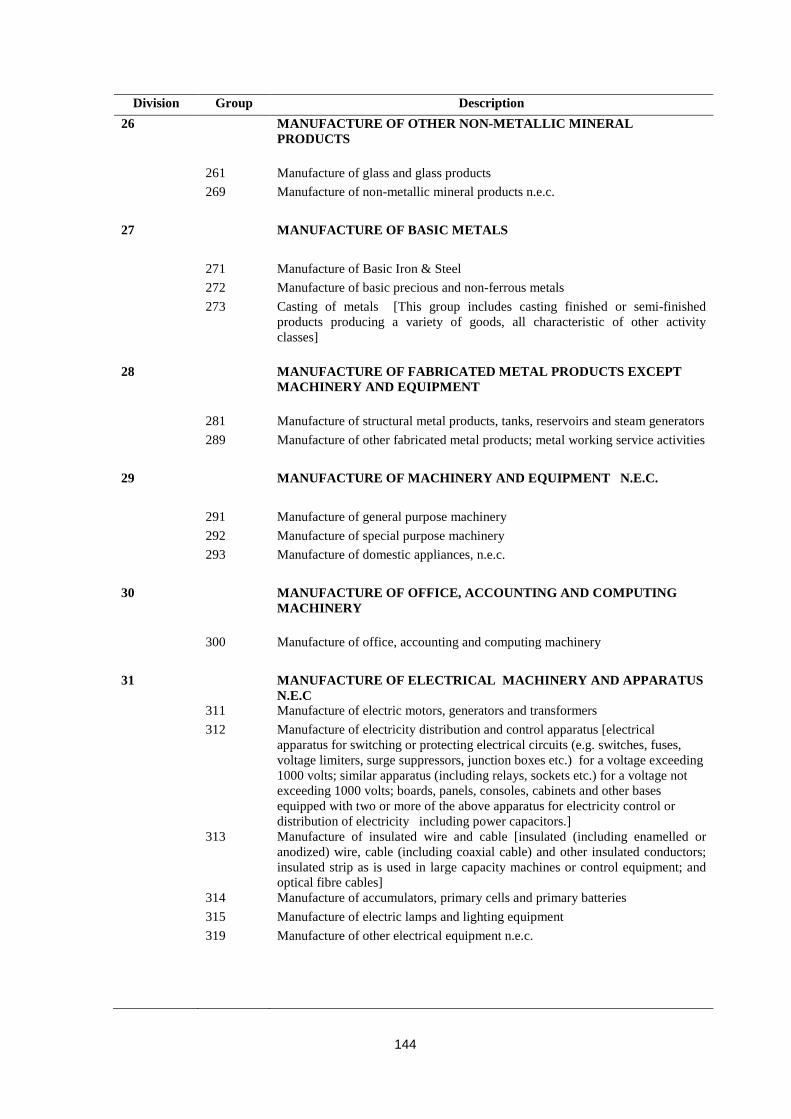
144
Division Group Description 26 MANUFACTURE OF OTHER NON-METALLIC MINERAL
PRODUCTS 261 Manufacture of glass and glass products 269 Manufacture of non-metallic mineral products n.e.c. 27 MANUFACTURE OF BASIC METALS 271 Manufacture of Basic Iron & Steel 272 Manufacture of basic precious and non-ferrous metals 273 Casting of metals [This group includes casting finished or semi-finished
products producing a variety of goods, all characteristic of other activity classes]
28 MANUFACTURE OF FABRICATED METAL PRODUCTS EXCEPT
MACHINERY AND EQUIPMENT 281 Manufacture of structural metal products, tanks, reservoirs and steam generators 289 Manufacture of other fabricated metal products; metal working service activities 29 MANUFACTURE OF MACHINERY AND EQUIPMENT N.E.C. 291 Manufacture of general purpose machinery 292 Manufacture of special purpose machinery 293 Manufacture of domestic appliances, n.e.c. 30 MANUFACTURE OF OFFICE, ACCOUNTING AND COMPUTING
MACHINERY 300 Manufacture of office, accounting and computing machinery 31 MANUFACTURE OF ELECTRICAL MACHINERY AND APPARATUS
N.E.C 311 Manufacture of electric motors, generators and transformers 312 Manufacture of electricity distribution and control apparatus [electrical
apparatus for switching or protecting electrical circuits (e.g. switches, fuses, voltage limiters, surge suppressors, junction boxes etc.) for a voltage exceeding 1000 volts; similar apparatus (including relays, sockets etc.) for a voltage not exceeding 1000 volts; boards, panels, consoles, cabinets and other bases equipped with two or more of the above apparatus for electricity control or distribution of electricity including power capacitors.]
313 Manufacture of insulated wire and cable [insulated (including enamelled or anodized) wire, cable (including coaxial cable) and other insulated conductors; insulated strip as is used in large capacity machines or control equipment; and optical fibre cables]
314 Manufacture of accumulators, primary cells and primary batteries 315 Manufacture of electric lamps and lighting equipment 319 Manufacture of other electrical equipment n.e.c.
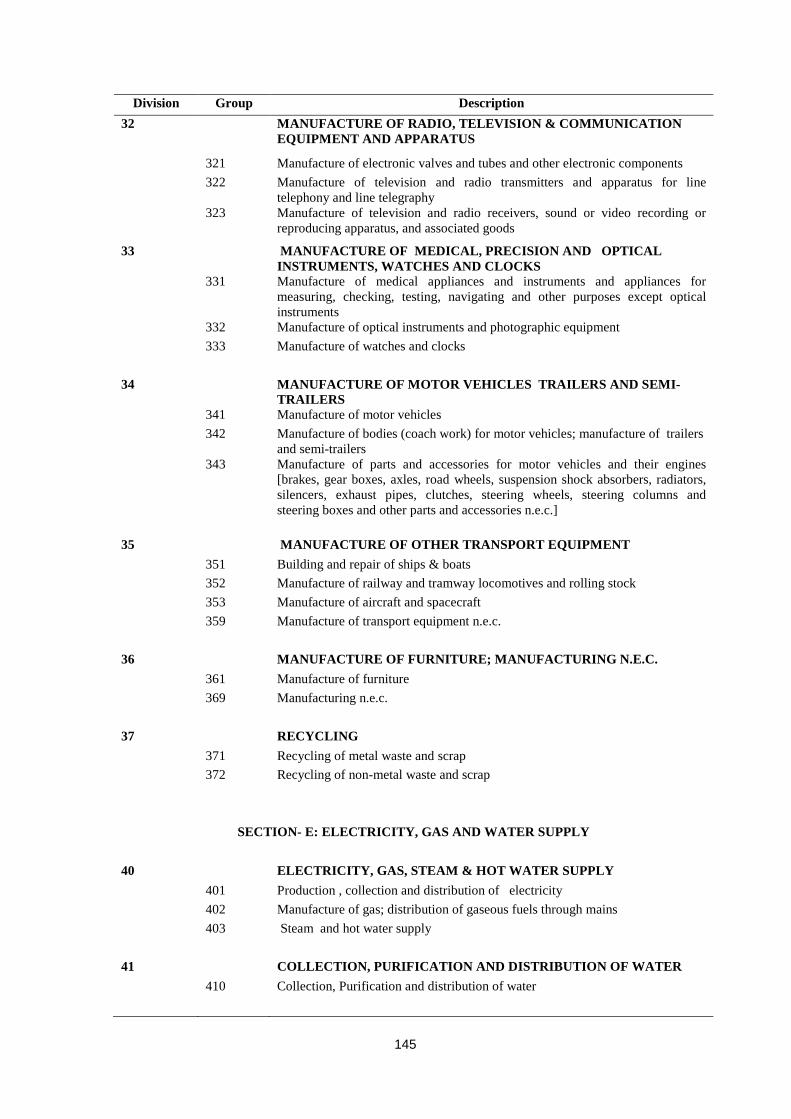
145
Division Group Description 32 MANUFACTURE OF RADIO, TELEVISION & COMMUNICATION
EQUIPMENT AND APPARATUS
321 Manufacture of electronic valves and tubes and other electronic components 322 Manufacture of television and radio transmitters and apparatus for line
telephony and line telegraphy 323 Manufacture of television and radio receivers, sound or video recording or
reproducing apparatus, and associated goods
33 MANUFACTURE OF MEDICAL, PRECISION AND OPTICAL INSTRUMENTS, WATCHES AND CLOCKS
331 Manufacture of medical appliances and instruments and appliances for measuring, checking, testing, navigating and other purposes except optical instruments
332 Manufacture of optical instruments and photographic equipment 333 Manufacture of watches and clocks 34 MANUFACTURE OF MOTOR VEHICLES TRAILERS AND SEMI-
TRAILERS 341 Manufacture of motor vehicles 342 Manufacture of bodies (coach work) for motor vehicles; manufacture of trailers
and semi-trailers 343 Manufacture of parts and accessories for motor vehicles and their engines
[brakes, gear boxes, axles, road wheels, suspension shock absorbers, radiators, silencers, exhaust pipes, clutches, steering wheels, steering columns and steering boxes and other parts and accessories n.e.c.]
35 MANUFACTURE OF OTHER TRANSPORT EQUIPMENT 351 Building and repair of ships & boats 352 Manufacture of railway and tramway locomotives and rolling stock 353 Manufacture of aircraft and spacecraft 359 Manufacture of transport equipment n.e.c. 36 MANUFACTURE OF FURNITURE; MANUFACTURING N.E.C. 361 Manufacture of furniture 369 Manufacturing n.e.c. 37 RECYCLING 371 Recycling of metal waste and scrap 372 Recycling of non-metal waste and scrap
SECTION- E: ELECTRICITY, GAS AND WATER SUPPLY 40 ELECTRICITY, GAS, STEAM & HOT WATER SUPPLY 401 Production , collection and distribution of electricity 402 Manufacture of gas; distribution of gaseous fuels through mains 403 Steam and hot water supply 41 COLLECTION, PURIFICATION AND DISTRIBUTION OF WATER 410 Collection, Purification and distribution of water
146
Division Group Description SECTION –F: CONSTRUCTION
45 CONSTRUCTION 451 Site preparation 452 Building of complete constructions or parts thereof; civil engineering 453 Building installation [These activities are usually performed at the site of
construction, although parts of the job may be carried out in a special shop. Repair of installations are also included in the corresponding sub-classes.]
454 Building completion [Includes activities that contribute to the completion or finishing of a construction. Repairs of the same type are also included in the corresponding sub-classes]
455 Renting of construction or demolition equipment with operator [Renting of machinery and equipment without operator is classified under Division 71]
SECTION – G: WHOLESALE AND RETAIL TRADE; REPAIR OF MOTOR VEHICLES,
MOTORCYCLES AND PERSONAL AND HOUSEHOLD GOODS 50 SALE, MAINTENANCE AND REPAIR OF MOTOR VEHICLES AND
MOTORCYCLES; RETAIL SALE OF AUTOMOTIVE FUEL 501 Sale of motor vehicles [Includes wholesale and retail sale of new and used
passenger motor vehicles and lorries, trailers and semi trailers].
502 Maintenance and repair of motor vehicles [including washing and polishing etc.]
503 Sale of motor vehicle parts and accessories [Includes wholesale and retail sale of all kinds of parts , components, and accessories for motor vehicles, when not combined with sale of such vehicles themselves.]
504 Sale, maintenance and repair of motorcycles and related parts and accessories 505 Retail sale of automotive fuel [ includes the activity of petrol filling stations.
This activity is often combined with sales of lubricating products, cleaning and all other kinds of products for motor vehicles. If the main object, however, is the sale of automotive fuel or lubricants, they remain classified here.]
51 WHOLESALE, TRADE & COMMISSION TRADE EXCEPT OF
MOTOR VEHICLES AND MOTORCYCLES 511 Wholesale on a fee or contract basis. [Includes commission agents, commodity
brokers and auctioneers and all other wholesalers who trade on behalf and on the account of others)
512 Wholesale of agricultural raw material, live animals, food beverages and tobacco.
513 Wholesale of household goods 514 Wholesale of non-agricultural intermediate products, waste and scrap 515 Wholesale of machinery, equipment and supplies 519 Other wholesale [Includes specialized wholesale not covered in any one of the
previous categories and wholesale in a variety of goods without any particular specialization.]
52 RETAIL TRADE EXCEPT OF MOTOR VEHICLES AND
MOTORCYCLES; REPAIR OF PERSONAL AND HOUSEHOLD GOODS
521 Non-specialized retail trade in stores 522 Retail sale of food, beverages and tobacco in specialized stores 523 Other retail trade of new goods in specialized stores 524 Retail sale of second-hand goods in stores [includes the pawn shops]
147
Division Group Description 525 Retail trade not in stores 526 Repair of personal and household goods [Includes repair of personal and
household goods when not done in combination with manufacture or wholesale or retail sale of these goods]
SECTION – H: HOTELS AND RESTAURANTS
55 HOTELS & RESTAURANTS 551 Hotels; camping sites and other provision of short-stay accommodation
[Restaurant facilities operated in connection with the provision of lodging remain classified in this group. Also included are the operation of sleeping cars when carried on by separate units]
552 Restaurants, bars and canteens [ Sales through vending machines is classified in Sub-class 52599]
SECTION – I : TRANSPORT, STORAGE AND COMMUNICATION
60 LAND TRANSPORT; TRANSPORT VIA PIPELINES 601 Transport via railways [Includes passenger and freight transport by inter-urban
railways. Also covers related activities such as shunting and switching]
602 Other land transport 603 Transport via pipelines [Includes transport of gases, liquids, slurry and other
commodities via pipelines. Included are the incidental activities like operation of pump stations and maintenance of the pipeline.]
61 Water Transport 611 Sea and coastal water transport 612 Inland water transport 62 AIR TRANSPORT 621 Scheduled air transport 622 Non-scheduled air transport 63 SUPPORTING & AUXILIARY TRANSPORT ACTIVITIES;
ACTIVITIES OF TRAVEL AGENCIES 630 Supporting and auxiliary transport activities; activities of travel agencies 64 POST AND TELECOMMUNICATIONS 641 Post and courier activities 642 Telecommunications [Production of radio and television programmes, whether
or not combined with broadcasting, is classified under class 9213.]
SECTION – J : FINANCIAL INTERMEDIATION
65 FINANCIAL INTERMEDIATION EXCEPT INSURANCE AND
PENSION 651 Monetary Intermediation [This group includes the obtaining of funds in the
form of deposits]
148
Division Group Description 659 Other financial intermediation. (This group includes financial intermediation
other than that conducted by monetary institutions)
66 INSURANCE AND PENSION FUNDING, EXCEPT COMPULSORY SOCIAL SECURITY.
660 Insurance and pension funding, except compulsory social security. 67 ACTIVITIES AUXILIARY TO FINANCIAL INTERMEDIATION 671 Activities auxiliary to financial intermediation, except insurance and pension
funding.[This Group includes activities involved in or closely related to financial inter-mediation other than insurance and pension funding but not themselves involving financial inter-mediation].
672 Activities auxiliary to insurance and pension funding
SECTION – K : REAL ESTATE, RENTING AND BUSINESS ACTIVITIES 70 REAL ESTATE ACTIVITIES 701 Real estate activities with own or leased property. 702 Real estate activities on a fee or contract basis. [This class includes buying,
selling, renting managing and appraising real estate on a fee or contract basis].
71 RENTING OF MACHINERY AND EQUIPMENT WITHOUT
OPERATOR AND OF PERSONAL AND HOUSEHOLD GOODS 711 Renting of transport equipment 712 Renting of other machinery and equipment 713 Renting of personal and household goods n.e.c. [ includes renting of all kinds of
personal and household goods, whether the customers are household or industries]
72 COMPUTER AND RELATED ACTIVITIES 721 Hardware consultancy.[This class includes consultancy on type and
configuration of hardware with or without associated software application.(Similar activities carried out by units selling computers are classified in class 3000)].
722 Software consultancy and supply. [This class includes activities in connection with analysis, design and programming of systems ready to use. This usually involves the analysis of the users’ needs and problems, consultancy on the most economic solution and producing the necessary software to realize this solution. Also included is the simple writing of programmes following directives of the user. Specifically these activities involve development, production, supply and documentation of order-made software based on orders from specific users and easy-order and ready-made (non-customized) software.(Reproduction of non-customized software is classified in class 2230 and the software consultancy provided in conjunction with hardware consultancy is classified in class 7210)].
723 Data processing. [This includes the processing or tabulation of all types of data. Provision of such services on (i) an hourly or time-share basis, and (ii) management or operation of data processing facilities of others on a time sharing basis; on a fee or contract basis].
724 Database activities. [This includes data base development, data storage and data base availability. The provision of data in a certain order/sequence, accessible to everybody or to limited users and can be sorted on demand.(computerised documentation activities provided by libraries and archives are classified in class 9231)].
149
Division Group Description 725 Maintenance and repair of office, accounting and computing machinery 729 Other computer related activities [for example activities of development of
multimedia presentation on account of others, maintenance of websites on account of others etc.(communication through e-mail, internet and data transmission are classified in class 6420)]
73 RESEARCH AND DEVELOPMENT 731 Research and experimental development on natural sciences and engineering
(NSE). [This class includes systematic creative work in the fields of research and development in natural sciences, medical sciences, agriculture and engineering & technology].
732 Research and experimental development on social sciences and humanities (SSH). [This class includes systematic creative work in the fields of research and development in social sciences and humanities.(Market research is classified in class 7413)].
74 OTHER BUSINESS ACTIVITIES 741 Legal, accounting, book-keeping and auditing activities; tax consultancy;
market research and public opinion polling; business and management consultancy
742 Architectural, engineering and other technical activities. 743 Advertising.[Printing of advertising material is classified in class 2221, Market
research in class 7413, Public relations activities in class 7414, Direct mailing activities in class 7499, Production of commercial messages for radio, television and film are classified in the appropriate class of group 921].
749 Business activities n.e.c. SECTION – L : PUPBLIC ADMINISTRATION AND DEFENCE; COMPPULSORY SOCIAL SECURITY 75 PUBLIC ADMINISTRATION AND DEFENCE: COMPULSORY
SOCIAL SECURITY 751 Administration of the State and the economic and social policy of the
community 752 Provision of services to the community as a whole 753 Compulsory social security activities. [Includes funding and administration of
government provided social security programmes, e.g. old age pension schemes, unemployment insurance schemes etc. ]
SECTION – M : EDUCATION
80 EDUCATION 801 Primary education 802 Secondary education 803 Higher education [Includes post-secondary/senior secondary sub-degree level
education that leads to university degree or equivalent.]
809 Adult and other education
SECTION – N : HEALTH AND SOCIAL WORK 85 Health and Social Work 851 Human health activities
150
Division Group Description 852 Veterinary activities [including clinico-pathological and other diagnostic
activities pertaining to animals and birds]. 853 Social work activities
SECTION – O : OTHER COMMUNITY, SOCIAL AND PERSONAL SERVICE ACTIVITIES 90 SEWAGE AND REFUSE DISPOSAL, SANITATION AND SIMILAR
ACTIVITIES 900 Sewage and refuse disposal, sanitation and similar activities 91 ACTIVITIES OF MEMBERSHIP ORGANISATIONS N.E.C. 911 Activities of business, employers and professional organisations 912 Activities of trade unions [Includes activities of associations whose members
are mainly employees, including government employees, interested chiefly in the representation of their views concerning their work situation.]
919 Activities of other membership organisations 92 RECREATIONAL, CULTURAL AND SPORTING ACTIVITIES 921 Motion picture, radio, television and other entertainment activities 922 News agency activities 923 Library, archives, museums and other cultural activities 924 Sporting and other recreational activities 93 OTHER SERVICE ACTIVITIES 930 Other service activities
SECTION – P : ACTIVITIES OF PRIVATE HOUSEHOLDS AS EMPLOYERS AND UNDIFFERENTIATED PRODUCTION ACTIVITIES OF PRIVATE HOUSEHOLDS
95 PRIVATE HOUSEHOLDS WITH EMPLOYED PERSONS 950 Private households with employed persons. [Includes the activities of private
households employing all kinds of domestic personnel such as maids, cooks, gardeners, gatekeepers, secretaries, governess, baby sitters etc. ]
SECTION – Q : EXTRATERRITORIAL ORGANIZATIONS AND BODIES
99 EXTRA TERRITORIAL ORGANIZATIONS AND BODIES 990 Extra territorial organizations and bodies [Includes the activities of international
organisations such as the United Nations and its agencies, regional bodies etc., IMF, World Bank, European Commission, OPEC etc.]
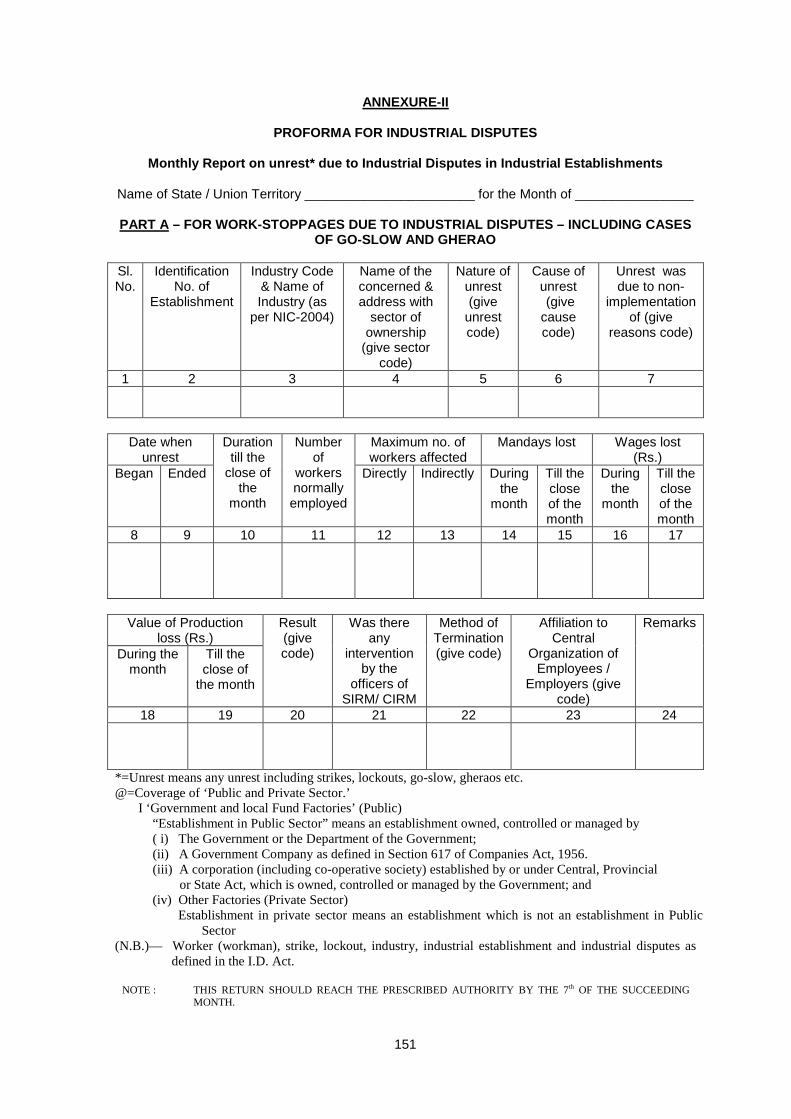
151
ANNEXURE-II
PROFORMA FOR INDUSTRIAL DISPUTES
Monthly Report on unrest* due to Industrial Disputes in Industrial Establishments Name of State / Union Territory _______________________ for the Month of ________________
PART A
– FOR WORK-STOPPAGES DUE TO INDUSTRIAL DISPUTES – INCLUDING CASES OF GO-SLOW AND GHERAO
Sl. No.
Identification No. of
Establishment
Industry Code & Name of Industry (as
per NIC-2004)
Name of the concerned & address with
sector of ownership
(give sector code)
Nature of unrest (give
unrest code)
Cause of unrest (give cause code)
Unrest was due to non-
implementation of (give
reasons code)
1 2 3 4 5 6 7
Date when
unrest Duration
till the close of
the month
Number of
workers normally employed
Maximum no. of workers affected
Mandays lost Wages lost (Rs.)
Began Ended Directly Indirectly During the
month
Till the close of the month
During the
month
Till the close of the month
8 9 10 11 12 13 14 15 16 17
Value of Production
loss (Rs.) Result (give code)
Was there any
intervention by the
officers of SIRM/ CIRM
Method of Termination (give code)
Affiliation to Central
Organization of Employees /
Employers (give code)
Remarks
During the month
Till the close of
the month
18 19 20 21 22 23 24
*=Unrest means any unrest including strikes, lockouts, go-slow, gheraos etc. @=Coverage of ‘Public and Private Sector.’ I ‘Government and local Fund Factories’ (Public)
“Establishment in Public Sector” means an establishment owned, controlled or managed by ( i) The Government or the Department of the Government; (ii) A Government Company as defined in Section 617 of Companies Act, 1956. (iii) A corporation (including co-operative society) established by or under Central, Provincial
or State Act, which is owned, controlled or managed by the Government; and (iv) Other Factories (Private Sector)
Establishment in private sector means an establishment which is not an establishment in Public Sector
(N.B.)— Worker (workman), strike, lockout, industry, industrial establishment and industrial disputes as defined in the I.D. Act.
NOTE : THIS RETURN SHOULD REACH THE PRESCRIBED AUTHORITY BY THE 7th OF THE SUCCEEDING
MONTH.
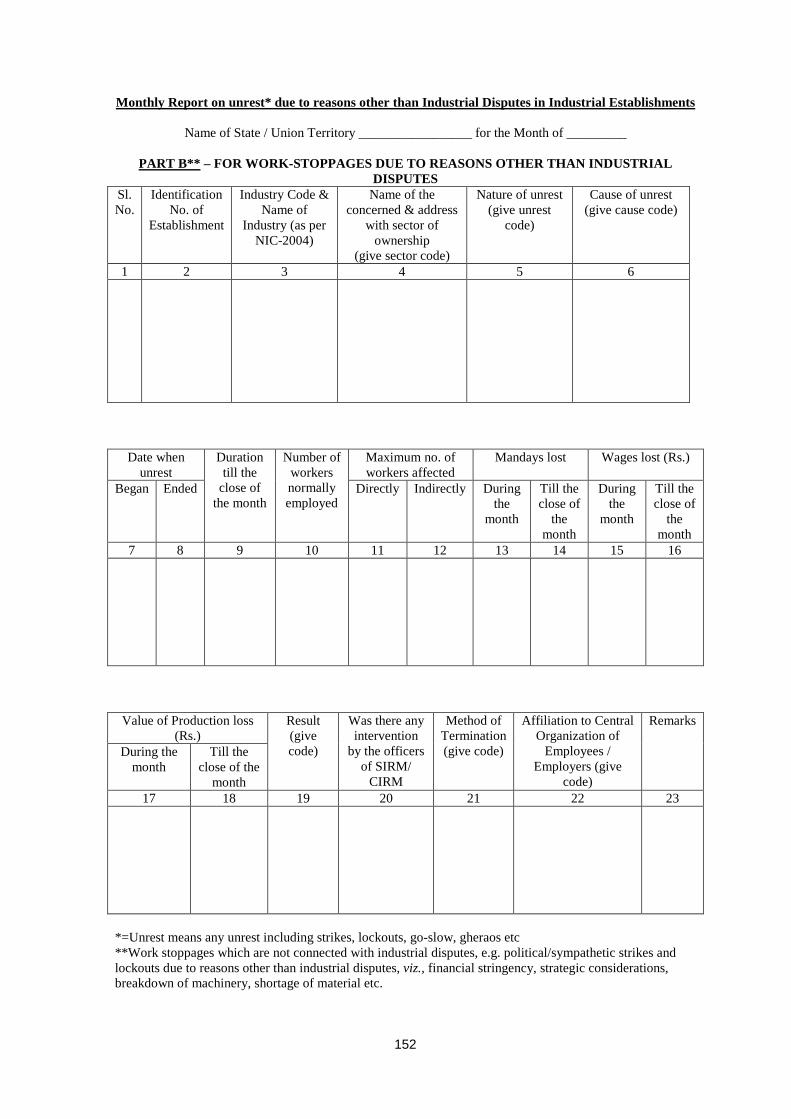
152
Monthly Report on unrest* due to reasons other than Industrial Disputes in Industrial Establishments
Name of State / Union Territory _________________ for the Month of _________
PART B**
Sl. No.
– FOR WORK-STOPPAGES DUE TO REASONS OTHER THAN INDUSTRIAL DISPUTES
Identification No. of
Establishment
Industry Code & Name of
Industry (as per NIC-2004)
Name of the concerned & address
with sector of ownership
(give sector code)
Nature of unrest (give unrest
code)
Cause of unrest (give cause code)
1 2 3 4 5 6
Date when unrest
Duration till the
close of the month
Number of workers normally employed
Maximum no. of workers affected
Mandays lost Wages lost (Rs.)
Began Ended Directly Indirectly During the
month
Till the close of
the month
During the
month
Till the close of
the month
7 8 9 10 11 12 13 14 15 16
Value of Production loss (Rs.)
Result (give code)
Was there any intervention
by the officers of SIRM/
CIRM
Method of Termination (give code)
Affiliation to Central Organization of
Employees / Employers (give
code)
Remarks
During the month
Till the close of the
month 17 18 19 20 21 22 23
*=Unrest means any unrest including strikes, lockouts, go-slow, gheraos etc **Work stoppages which are not connected with industrial disputes, e.g. political/sympathetic strikes and lockouts due to reasons other than industrial disputes, viz., financial stringency, strategic considerations, breakdown of machinery, shortage of material etc.
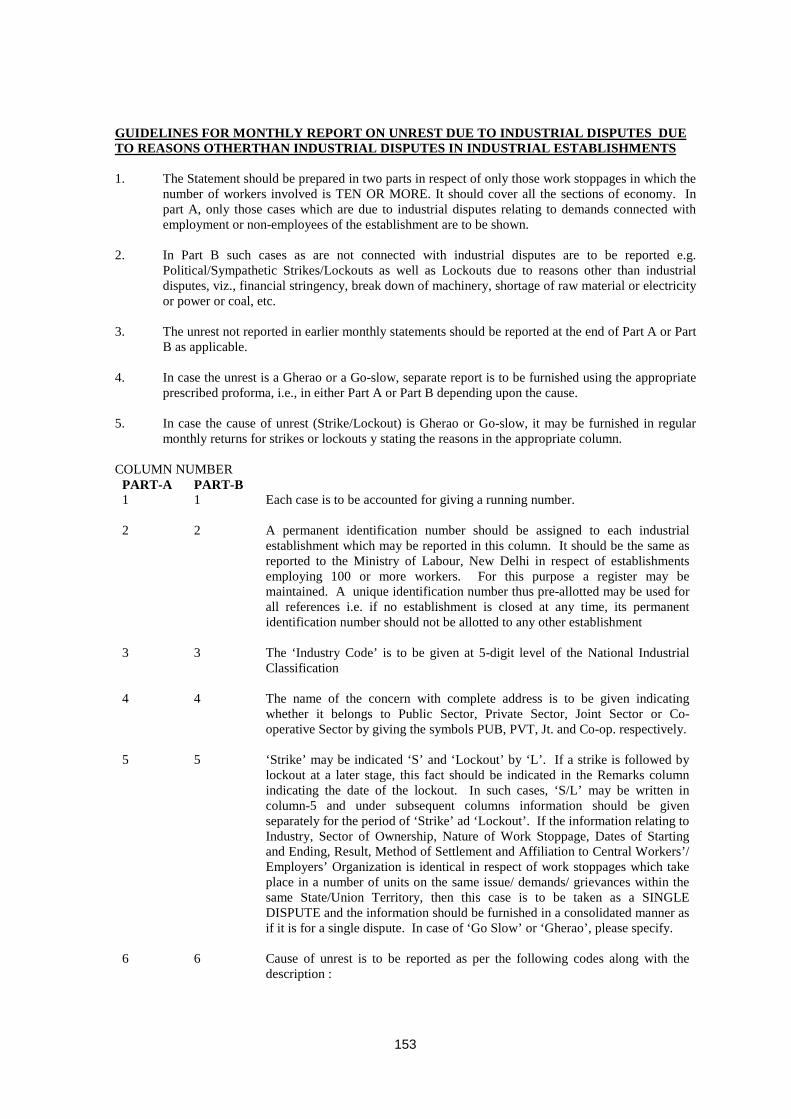
153
GUIDELINES FOR MONTHLY REPORT ON UNREST DUE TO INDUSTRIAL DISPUTES DUE TO REASONS OTHERTHAN INDUSTRIAL DISPUTES IN INDUSTRIAL ESTABLISHMENTS
1. The Statement should be prepared in two parts in respect of only those work stoppages in which the number of workers involved is TEN OR MORE. It should cover all the sections of economy. In part A, only those cases which are due to industrial disputes relating to demands connected with employment or non-employees of the establishment are to be shown.
2. In Part B such cases as are not connected with industrial disputes are to be reported e.g.
Political/Sympathetic Strikes/Lockouts as well as Lockouts due to reasons other than industrial disputes, viz., financial stringency, break down of machinery, shortage of raw material or electricity or power or coal, etc.
3. The unrest not reported in earlier monthly statements should be reported at the end of Part A or Part
B as applicable. 4. In case the unrest is a Gherao or a Go-slow, separate report is to be furnished using the appropriate
prescribed proforma, i.e., in either Part A or Part B depending upon the cause. 5. In case the cause of unrest (Strike/Lockout) is Gherao or Go-slow, it may be furnished in regular
monthly returns for strikes or lockouts y stating the reasons in the appropriate column. COLUMN NUMBER
PART-A PART-B 1 1 Each case is to be accounted for giving a running number.
2 2 A permanent identification number should be assigned to each industrial
establishment which may be reported in this column. It should be the same as reported to the Ministry of Labour, New Delhi in respect of establishments employing 100 or more workers. For this purpose a register may be maintained. A unique identification number thus pre-allotted may be used for all references i.e. if no establishment is closed at any time, its permanent identification number should not be allotted to any other establishment
3 3 The ‘Industry Code’ is to be given at 5-digit level of the National Industrial Classification
4 4 The name of the concern with complete address is to be given indicating whether it belongs to Public Sector, Private Sector, Joint Sector or Co-operative Sector by giving the symbols PUB, PVT, Jt. and Co-op. respectively.
5 5 ‘Strike’ may be indicated ‘S’ and ‘Lockout’ by ‘L’. If a strike is followed by lockout at a later stage, this fact should be indicated in the Remarks column indicating the date of the lockout. In such cases, ‘S/L’ may be written in column-5 and under subsequent columns information should be given separately for the period of ‘Strike’ ad ‘Lockout’. If the information relating to Industry, Sector of Ownership, Nature of Work Stoppage, Dates of Starting and Ending, Result, Method of Settlement and Affiliation to Central Workers’/ Employers’ Organization is identical in respect of work stoppages which take place in a number of units on the same issue/ demands/ grievances within the same State/Union Territory, then this case is to be taken as a SINGLE DISPUTE and the information should be furnished in a consolidated manner as if it is for a single dispute. In case of ‘Go Slow’ or ‘Gherao’, please specify.
6
6
Cause of unrest is to be reported as per the following codes along with the description :
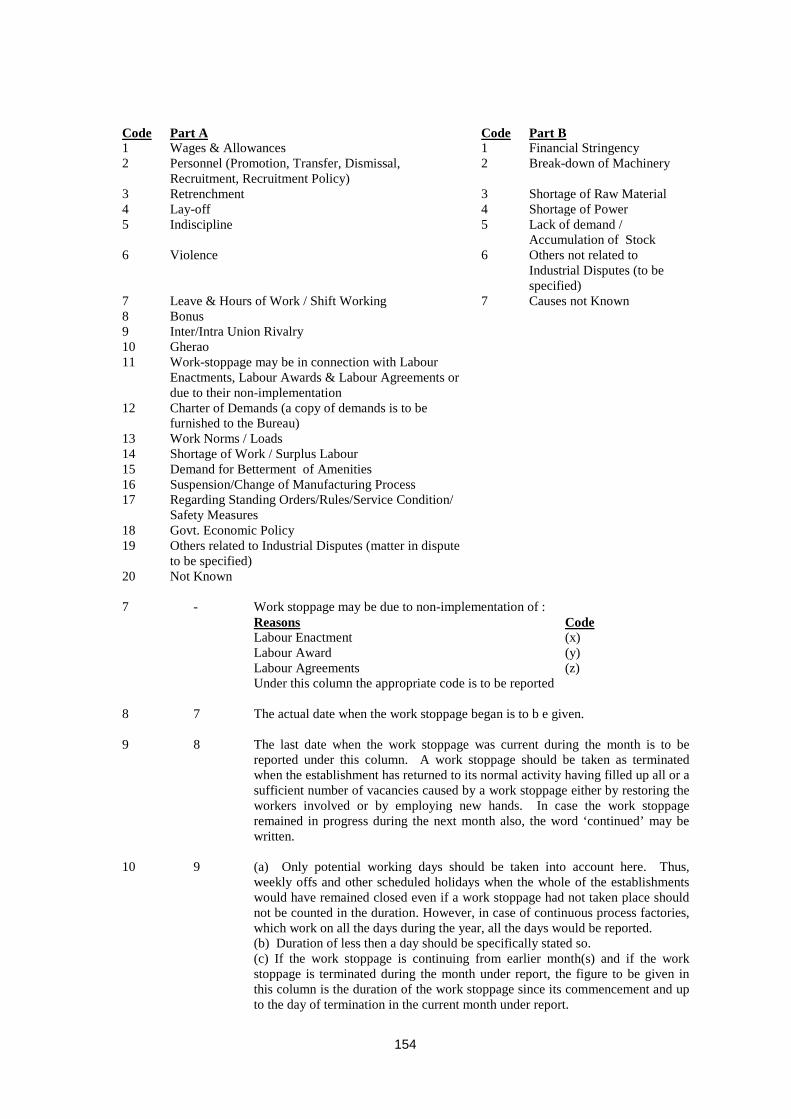
154
Code Part A Code 1
Part B Wages & Allowances 1 Financial Stringency
2 Personnel (Promotion, Transfer, Dismissal, Recruitment, Recruitment Policy)
2 Break-down of Machinery
3 Retrenchment 3 Shortage of Raw Material 4 Lay-off 4 Shortage of Power 5 Indiscipline 5 Lack of demand /
Accumulation of Stock 6 Violence 6 Others not related to
Industrial Disputes (to be specified)
7 Leave & Hours of Work / Shift Working 7 Causes not Known 8 Bonus 9 Inter/Intra Union Rivalry 10 Gherao 11 Work-stoppage may be in connection with Labour
Enactments, Labour Awards & Labour Agreements or due to their non-implementation
12 Charter of Demands (a copy of demands is to be furnished to the Bureau)
13 Work Norms / Loads 14 Shortage of Work / Surplus Labour 15 Demand for Betterment of Amenities 16 Suspension/Change of Manufacturing Process 17 Regarding Standing Orders/Rules/Service Condition/
Safety Measures
18 Govt. Economic Policy 19 Others related to Industrial Disputes (matter in dispute
to be specified)
20 Not Known
7 - Work stoppage may be due to non-implementation of : Reasons
Labour Enactment Code (x)
Labour Award (y) Labour Agreements (z)
Under this column the appropriate code is to be reported
8 7 The actual date when the work stoppage began is to b e given.
9 8 The last date when the work stoppage was current during the month is to be reported under this column. A work stoppage should be taken as terminated when the establishment has returned to its normal activity having filled up all or a sufficient number of vacancies caused by a work stoppage either by restoring the workers involved or by employing new hands. In case the work stoppage remained in progress during the next month also, the word ‘continued’ may be written.
10 9 (a) Only potential working days should be taken into account here. Thus, weekly offs and other scheduled holidays when the whole of the establishments would have remained closed even if a work stoppage had not taken place should not be counted in the duration. However, in case of continuous process factories, which work on all the days during the year, all the days would be reported. (b) Duration of less then a day should be specifically stated so. (c) If the work stoppage is continuing from earlier month(s) and if the work stoppage is terminated during the month under report, the figure to be given in this column is the duration of the work stoppage since its commencement and up to the day of termination in the current month under report.
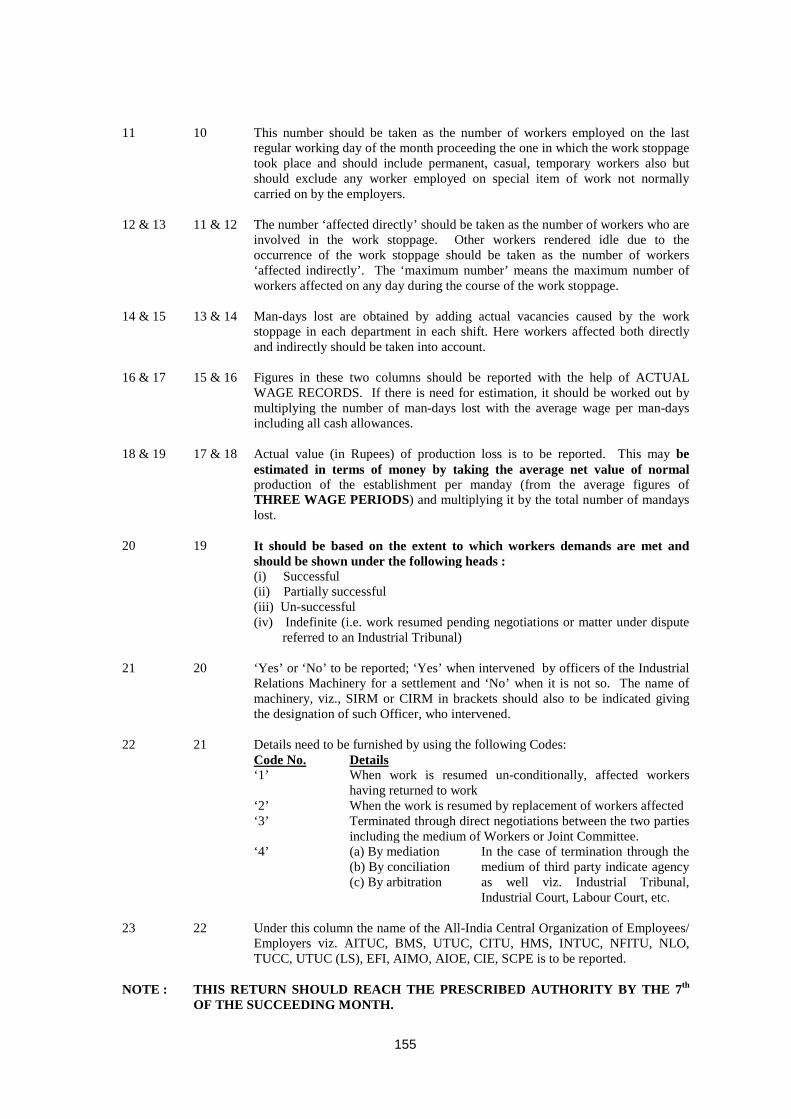
155
11 10 This number should be taken as the number of workers employed on the last regular working day of the month proceeding the one in which the work stoppage took place and should include permanent, casual, temporary workers also but should exclude any worker employed on special item of work not normally carried on by the employers.
12 & 13 11 & 12 The number ‘affected directly’ should be taken as the number of workers who are involved in the work stoppage. Other workers rendered idle due to the occurrence of the work stoppage should be taken as the number of workers ‘affected indirectly’. The ‘maximum number’ means the maximum number of workers affected on any day during the course of the work stoppage.
14 & 15 13 & 14 Man-days lost are obtained by adding actual vacancies caused by the work stoppage in each department in each shift. Here workers affected both directly and indirectly should be taken into account.
16 & 17 15 & 16 Figures in these two columns should be reported with the help of ACTUAL WAGE RECORDS. If there is need for estimation, it should be worked out by multiplying the number of man-days lost with the average wage per man-days including all cash allowances.
18 & 19 17 & 18 Actual value (in Rupees) of production loss is to be reported. This may be estimated in terms of money by taking the average net value of normal production of the establishment per manday (from the average figures of THREE WAGE PERIODS) and multiplying it by the total number of mandays lost.
20 19 It should be based on the extent to which workers demands are met and should be shown under the following heads :
(i) Successful (ii) Partially successful (iii) Un-successful (iv) Indefinite (i.e. work resumed pending negotiations or matter under dispute
referred to an Industrial Tribunal)
21 20 ‘Yes’ or ‘No’ to be reported; ‘Yes’ when intervened by officers of the Industrial Relations Machinery for a settlement and ‘No’ when it is not so. The name of machinery, viz., SIRM or CIRM in brackets should also to be indicated giving the designation of such Officer, who intervened.
22 21 Details need to be furnished by using the following Codes: Code No.
‘1’ Details When work is resumed un-conditionally, affected workers having returned to work
‘2’ When the work is resumed by replacement of workers affected ‘3’ Terminated through direct negotiations between the two parties
including the medium of Workers or Joint Committee. ‘4’ (a) By mediation In the case of termination through the
medium of third party indicate agency as well viz. Industrial Tribunal, Industrial Court, Labour Court, etc.
(b) By conciliation (c) By arbitration
23 22 Under this column the name of the All-India Central Organization of Employees/ Employers viz. AITUC, BMS, UTUC, CITU, HMS, INTUC, NFITU, NLO, TUCC, UTUC (LS), EFI, AIMO, AIOE, CIE, SCPE is to be reported.
NOTE : THIS RETURN SHOULD REACH THE PRESCRIBED AUTHORITY BY THE 7th OF THE SUCCEEDING MONTH.
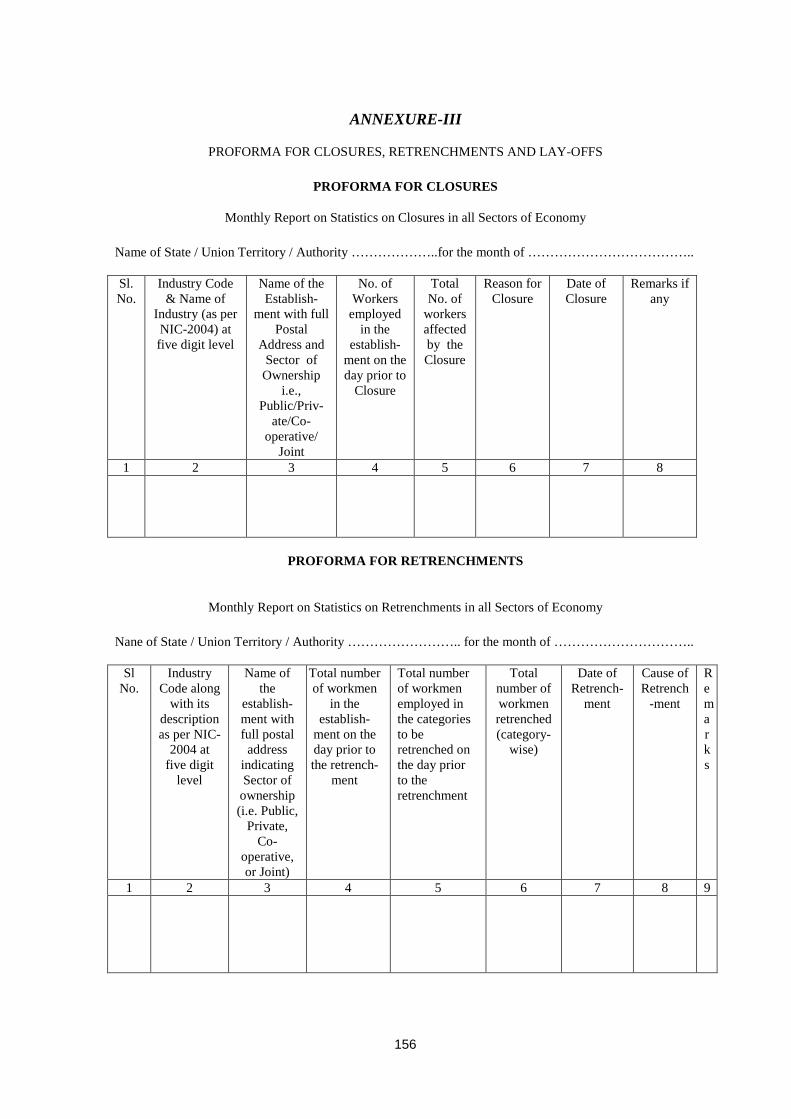
156
ANNEXURE-III
PROFORMA FOR CLOSURES, RETRENCHMENTS AND LAY-OFFS
PROFORMA FOR CLOSURES
Monthly Report on Statistics on Closures in all Sectors of Economy Name of State / Union Territory / Authority ………………..for the month of ……………………………….. Sl. No.
Industry Code & Name of
Industry (as per NIC-2004) at five digit level
Name of the Establish-
ment with full Postal
Address and Sector of
Ownership i.e.,
Public/Priv-ate/Co-
operative/ Joint
No. of Workers
employed in the
establish-ment on the day prior to
Closure
Total No. of
workers affected by the Closure
Reason for Closure
Date of Closure
Remarks if any
1 2 3 4 5 6 7 8
PROFORMA FOR RETRENCHMENTS
Monthly Report on Statistics on Retrenchments in all Sectors of Economy Nane of State / Union Territory / Authority …………………….. for the month of …………………………..
Sl No.
Industry Code along
with its description as per NIC-
2004 at five digit
level
Name of the
establish-ment with full postal
address indicating Sector of
ownership (i.e. Public,
Private, Co-
operative, or Joint)
Total number of workmen
in the establish-
ment on the day prior to the retrench-
ment
Total number of workmen employed in the categories to be retrenched on the day prior to the retrenchment
Total number of workmen retrenched (category-
wise)
Date of Retrench-
ment
Cause of Retrench
-ment
Remarks
1 2 3 4 5 6 7 8 9
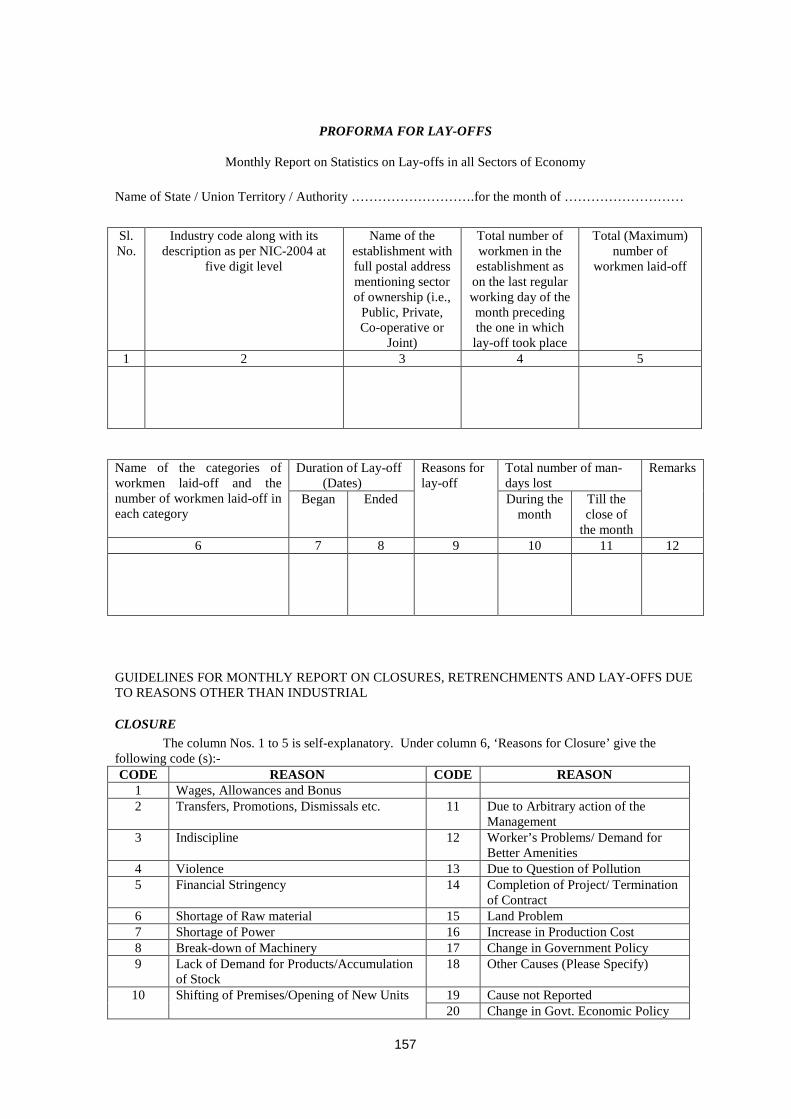
157
PROFORMA FOR LAY-OFFS
Monthly Report on Statistics on Lay-offs in all Sectors of Economy Name of State / Union Territory / Authority ……………………….for the month of ………………………
Sl. No.
Industry code along with its description as per NIC-2004 at
five digit level
Name of the establishment with full postal address mentioning sector of ownership (i.e.,
Public, Private, Co-operative or
Joint)
Total number of workmen in the establishment as
on the last regular working day of the month preceding the one in which lay-off took place
Total (Maximum) number of
workmen laid-off
1 2 3 4 5
Name of the categories of workmen laid-off and the number of workmen laid-off in each category
Duration of Lay-off (Dates)
Reasons for lay-off
Total number of man-days lost
Remarks
Began Ended During the month
Till the close of
the month 6 7 8 9 10 11 12
GUIDELINES FOR MONTHLY REPORT ON CLOSURES, RETRENCHMENTS AND LAY-OFFS DUE TO REASONS OTHER THAN INDUSTRIAL
CLOSURE The column Nos. 1 to 5 is self-explanatory. Under column 6, ‘Reasons for Closure’ give the
following code (s):- CODE REASON CODE REASON
1 Wages, Allowances and Bonus 2 Transfers, Promotions, Dismissals etc. 11 Due to Arbitrary action of the
Management 3 Indiscipline 12 Worker’s Problems/ Demand for
Better Amenities 4 Violence 13 Due to Question of Pollution 5 Financial Stringency 14 Completion of Project/ Termination
of Contract 6 Shortage of Raw material 15 Land Problem 7 Shortage of Power 16 Increase in Production Cost 8 Break-down of Machinery 17 Change in Government Policy 9 Lack of Demand for Products/Accumulation
of Stock 18 Other Causes (Please Specify)
10 Shifting of Premises/Opening of New Units 19 Cause not Reported 20 Change in Govt. Economic Policy
158
RETRENCHMENT The column Nos. 1 to 7 is self-explanatory. Under column 8 ‘Cause of Retrenchment’,
give the following code (s)
Code 1 Financial Stringency 2 Shortage of Raw Material 3 Shortage of Power 4 Break-down of Machinery 5 Lack of Demand for Products (Accumulation of Stock) 6 Off Season 7 Others (Please Specify) 8 Cause Not Known
LAY-OFFS The columns Nos. 1 to 4 are self-explanatory. Under column 5, give the total number of workers laid-off. This should be assured by taking the maximum number of workers laid-off for all categories on any day during the month. The total number of workmen laid-off in a particular unit should not exceed the total given in column 4. The Reason and Code for Lay-off are the same as for Retrenchment and so, under column 9, give the code as applicable for the reason for Retrenchment given above. In column 10 give the total number of man-days lost due to lay-off during the month. Man-days lost are obtain by adding up the actual man-days lost during the month on potential working days ( i.e. excluding weekly holidays and other offs). For calculating the man-days lost, follow the method used for calculating man-days lost for unrest. In column 11 give cumulative total of the man-days lost during the entire period of lay-off. In case of continuing lay-off, it will be the cumulative total of man-days lost from the date of commencement till the close of the month. The information in respect of lay-off should be given separately for (a) New cases (i.e. the cases of lay-off which started during the month for which the return relates) and (b) old cases (i.e. the cases of lay-off which started in the previous month and continued during the whole of the current month or a part of the current month. If a case of lay-off could not be reported in the return of the month in which it took place and is reported in a later month, month-wise break-up of man-days lost and workers affected should invariably be furnished. NOTE : The returns should reach the Labour Bureau by the 25th of the succeeding month even if the
information is ‘Nil’.
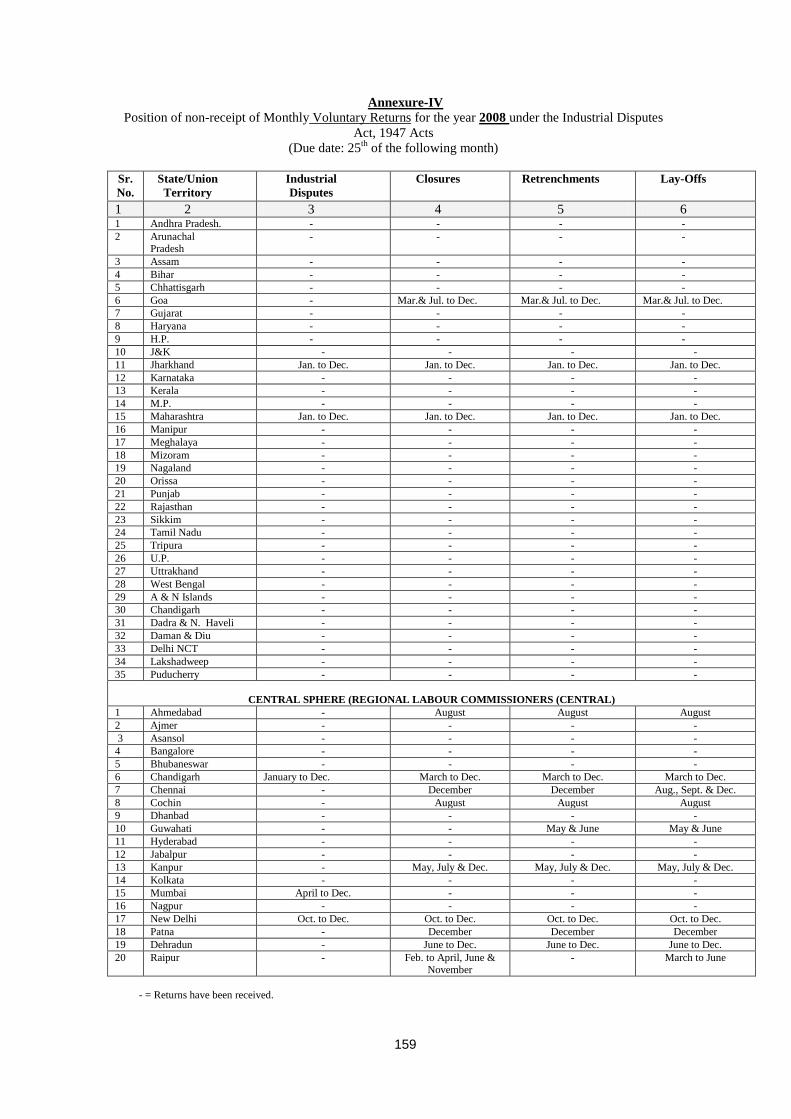
159
Position of non-receipt of MonthlyAnnexure-IV
Voluntary Returns for the year 2008
(Due date: 25th of the following month)
under the Industrial Disputes Act, 1947 Acts
Sr.No.
State/Union Territory
Industrial Disputes
Closures Retrenchments Lay-Offs
1 2 3 4 5 6 1 Andhra Pradesh. - - - - 2 Arunachal
Pradesh - - - -
3 Assam - - - - 4 Bihar - - - - 5 Chhattisgarh - - - - 6 Goa - Mar.& Jul. to Dec. Mar.& Jul. to Dec. Mar.& Jul. to Dec. 7 Gujarat - - - - 8 Haryana - - - - 9 H.P. - - - - 10 J&K - - - - 11 Jharkhand Jan. to Dec. Jan. to Dec. Jan. to Dec. Jan. to Dec. 12 Karnataka - - - - 13 Kerala - - - - 14 M.P. - - - - 15 Maharashtra Jan. to Dec. Jan. to Dec. Jan. to Dec. Jan. to Dec. 16 Manipur - - - - 17 Meghalaya - - - - 18 Mizoram - - - - 19 Nagaland - - - - 20 Orissa - - - - 21 Punjab - - - - 22 Rajasthan - - - - 23 Sikkim - - - - 24 Tamil Nadu - - - - 25 Tripura - - - - 26 U.P. - - - - 27 Uttrakhand - - - - 28 West Bengal - - - - 29 A & N Islands - - - - 30 Chandigarh - - - - 31 Dadra & N. Haveli - - - - 32 Daman & Diu - - - - 33 Delhi NCT - - - - 34 Lakshadweep - - - - 35 Puducherry - - - -
CENTRAL SPHERE (REGIONAL LABOUR COMMISSIONERS (CENTRAL)
1 Ahmedabad - August August August 2 Ajmer - - - - 3 Asansol - - - - 4 Bangalore - - - - 5 Bhubaneswar - - - - 6 Chandigarh January to Dec. March to Dec. March to Dec. March to Dec. 7 Chennai - December December Aug., Sept. & Dec. 8 Cochin - August August August 9 Dhanbad - - - - 10 Guwahati - - May & June May & June 11 Hyderabad - - - - 12 Jabalpur - - - - 13 Kanpur - May, July & Dec. May, July & Dec. May, July & Dec. 14 Kolkata - - - - 15 Mumbai April to Dec. - - - 16 Nagpur - - - - 17 New Delhi Oct. to Dec. Oct. to Dec. Oct. to Dec. Oct. to Dec. 18 Patna - December December December 19 Dehradun - June to Dec. June to Dec. June to Dec. 20 Raipur - Feb. to April, June &
November - March to June
- = Returns have been received.
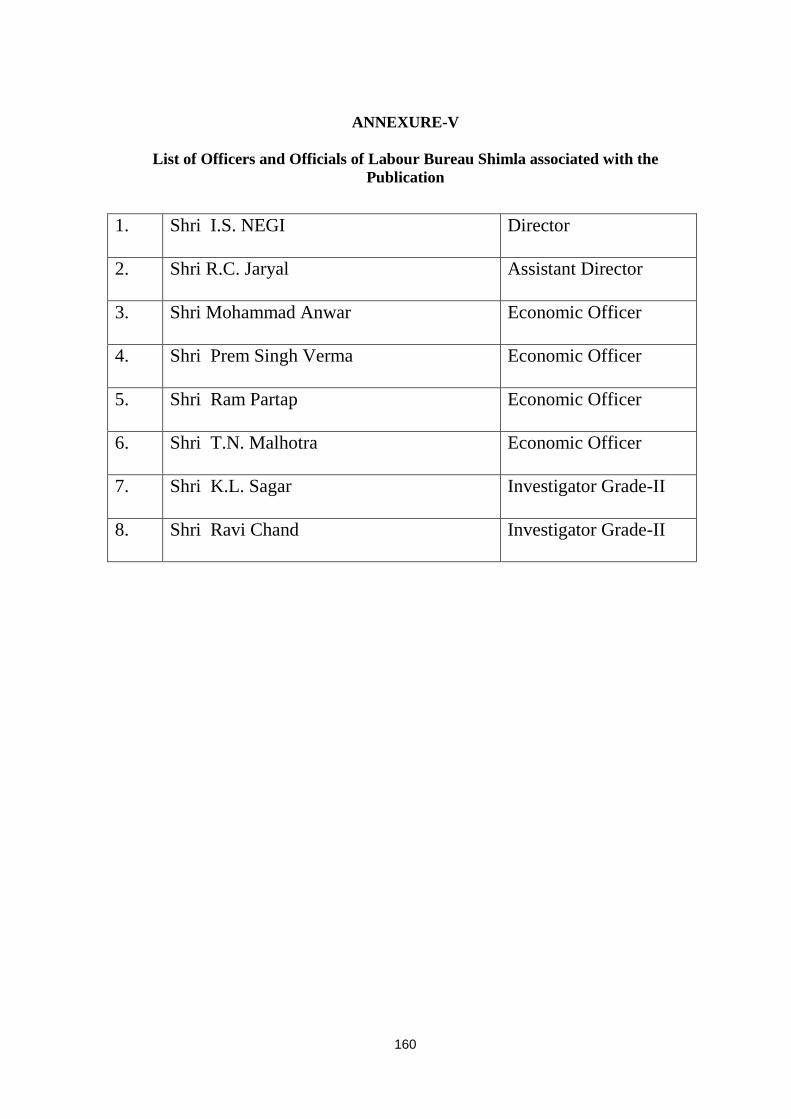
160
ANNEXURE-V
List of Officers and Officials of Labour Bureau Shimla associated with the
Publication
1. Shri I.S. NEGI Director
2. Shri R.C. Jaryal Assistant Director
3. Shri Mohammad Anwar Economic Officer
4. Shri Prem Singh Verma Economic Officer
5. Shri Ram Partap Economic Officer
6. Shri T.N. Malhotra Economic Officer
7. Shri K.L. Sagar Investigator Grade-II
8. Shri Ravi Chand Investigator Grade-II

©Government of India
2012 Printed by the Printing Unit, Labour Bureau, Shimla-171 004