statistical signal detection in clinical trial data · 2019-08-27 · statistical signal detection...
TRANSCRIPT
Statistical signal detection in Clinical Trial data
PROTECT Symposium February 19-20 2015
Christiane Ahlers, Andreas Brueckner, Anngret Mallick, Nils Opitz, Vlasta Pinkston,
Bruno Tran, Janet Scott, Harry Southworth, Bruno Tran, Lionel Van Holle, Nicola
Wallis
Disclaimer
The views expressed in this talk are those of the author.
They do not necessarily represent those of Novartis.
• The research leading to these results was conducted as part of the PROTECT consortium (Pharmacoepidemiological Research on Outcomes of Therapeutics by a European ConsorTium, www.imi-protect.eu) which is a public-private partnership coordinated by the European Medicines Agency.
• The PROTECT project has received support from the Innovative Medicine Initiative Joint Undertaking (www.imi.europa.eu) under Grant Agreement n° 115004, resources of which are composed of financial contribution from the European Union's Seventh Framework Programme (FP7/2007-2013) and EFPIA companies’ in kind contribution.
3
Acknowledgements
IMI PROTECT WP 3 – Signal Detection
4
5
WP 3.9 Improving Signal Detection in Clinical Trials
Focus on evaluation and comparison of statistical methods for signal detection in different databases using:
Adverse Event Data Screening
Laboratory Data Modelling
Signal Detection in Clinical Trial AE data
6
Multiple Testing Problem
• Potential for a multiplicity issue in the monitoring of clinical trial safety events.
• Multiple tests for several hundred, several thousand events.
• Challenging issue whether multiplicity adjustment should be applied or not.
7
Real Life Example
In an vaccination clinical trial (1993), in a comparison of the relative frequencies for each AE, one of the 92 p-values attained ‘statistical significance’ (unadjusted p = 0.016). The AE in question was unusual high-pitched crying (UHPC), with an incidence of 6.7% and 2.3% for treatments A and B, respectively.
No medical rationale or biological plausibility seemed apparent for this unexpected finding. Accordingly, the researchers posited that the finding was a spurious chance event, a statistical artifact of drawing inferences from multiple p-values.
Nevertheless, because of concerns about the potential signal being real due to an unobservable cause, regulators mandated a follow-up study to prospectively compare the incidence of UHPC between the two treatments.
In the resulting trial, the incidence of UHPC was similar for the two groups (A: 5.1%, versus B: 4.3%; p = 0.532), indicating that the UHPC finding in the initial study was a false discovery.
8
A safety and immunogenicity trial of a candidate quadrivalent vaccine against measles, mumps, rubella and varicella (MMRV) conducted in 296 healthy toddlers, 12–18 months of age.
Participants were randomly assigned to receive the quadrivalent MMRV on day 0 (Group 1) or the trivalent MMR on day 0 followed by varicella (V) on day 42 (Group 2).
9
Another Real Life Example
Mehrotra DV and Heyse JF. (2004). Use of the false discovery rate for evaluating clinical safety data.
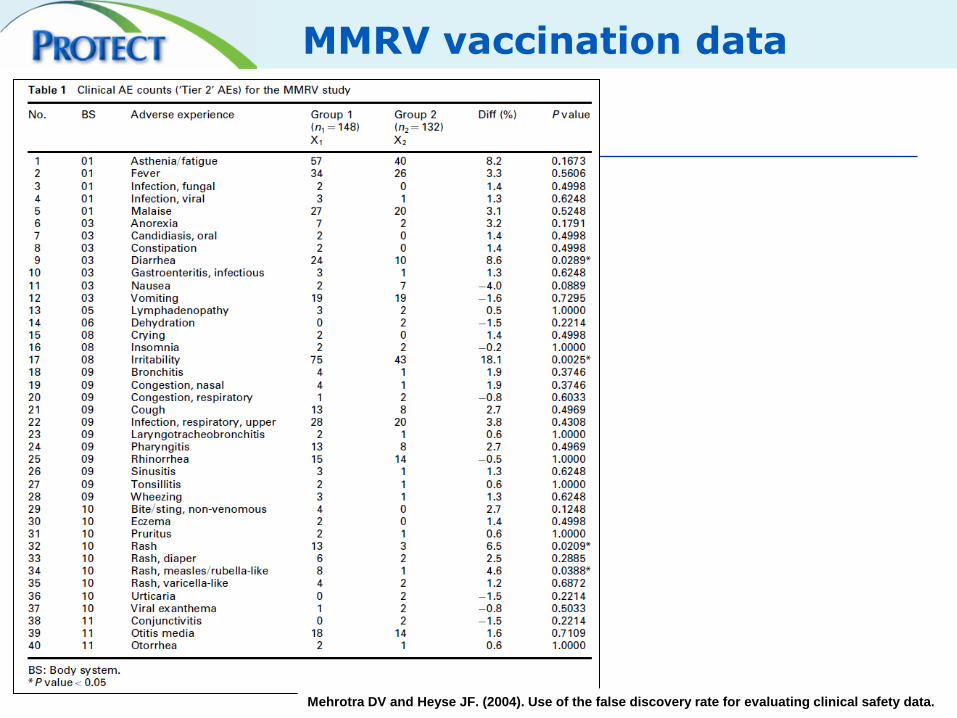
MMRV vaccination data
10 Mehrotra DV and Heyse JF. (2004). Use of the false discovery rate for evaluating clinical safety data.
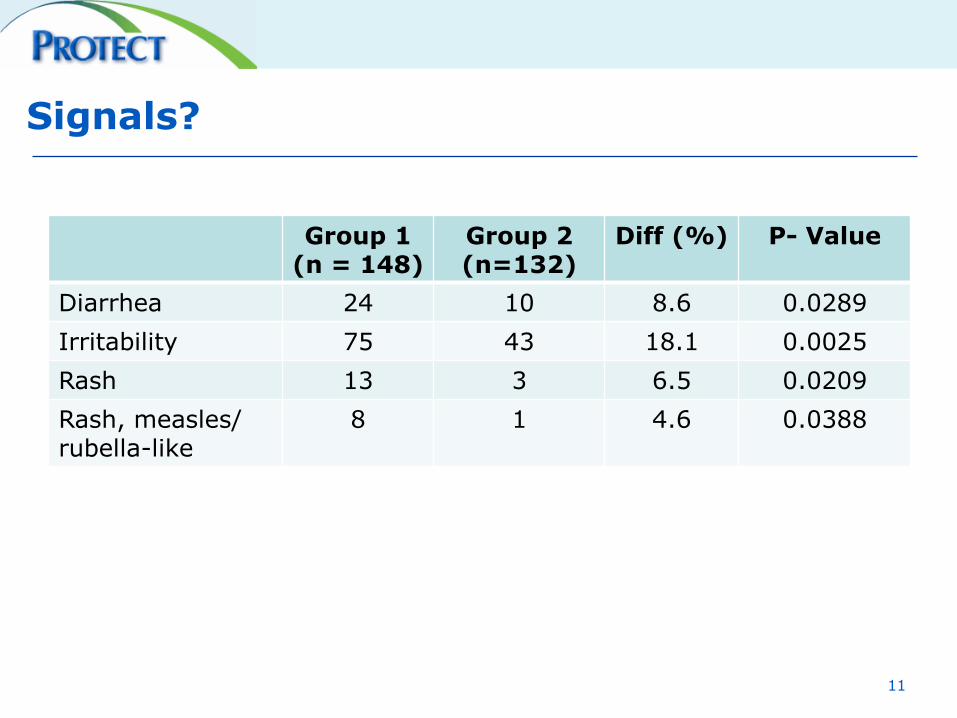
Group 1 (n = 148)
Group 2 (n=132)
Diff (%) P- Value
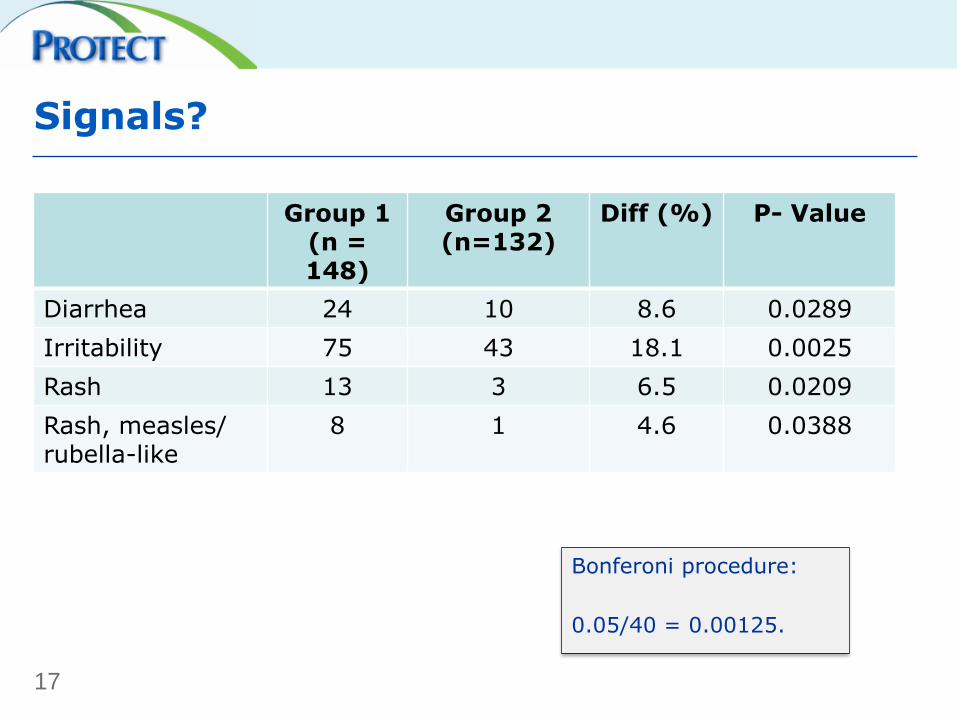
Diarrhea 24 10 8.6 0.0289
Irritability 75 43 18.1 0.0025
Rash 13 3 6.5 0.0209
Rash, measles/ rubella-like
8 1 4.6 0.0388
Signals?
11
Guidance on Multiplicity Adjustments
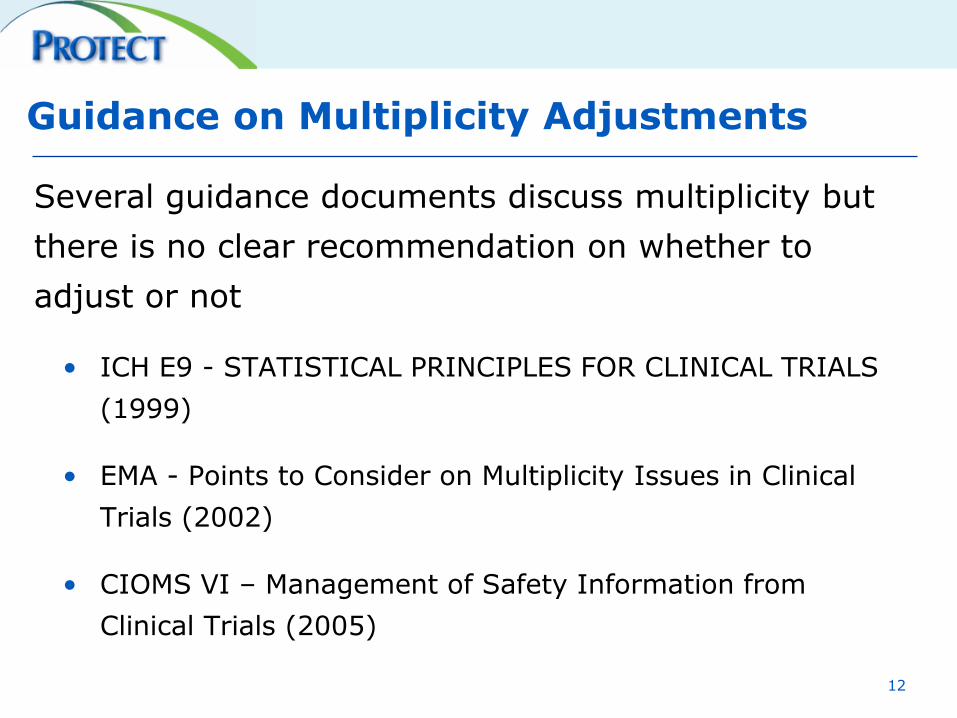
Several guidance documents discuss multiplicity but
there is no clear recommendation on whether to
adjust or not
• ICH E9 - STATISTICAL PRINCIPLES FOR CLINICAL TRIALS
(1999)
• EMA - Points to Consider on Multiplicity Issues in Clinical
Trials (2002)
• CIOMS VI – Management of Safety Information from
Clinical Trials (2005)
12
ICH E9
The calculation of p-values is sometimes useful ... as a 'flagging' device applied to a large number of safety variables.
If hypothesis tests are used, statistical adjustments for multiplicity to quantify the type I error are appropriate.
ICH E9 - STATISTICAL PRINCIPLES FOR CLINICAL TRIALS (1999)
13
CPMP - PtC on Multiplicity Issues
where a large number of statistical test procedures is used to serve as a flagging device to signal a potential risk ... adjustment for multiplicity is counterproductive for considerations fo safety.
CPMP Points to Consider on Multiplicity Issues in Clinical Trials (2002)
14
Multiple Testing Problem - Approaches
• Global Error Rate Control
• False Discovey Rate
• Bayesian Hierarchical Models
• Do nothing – Unadjusted Analysis
15
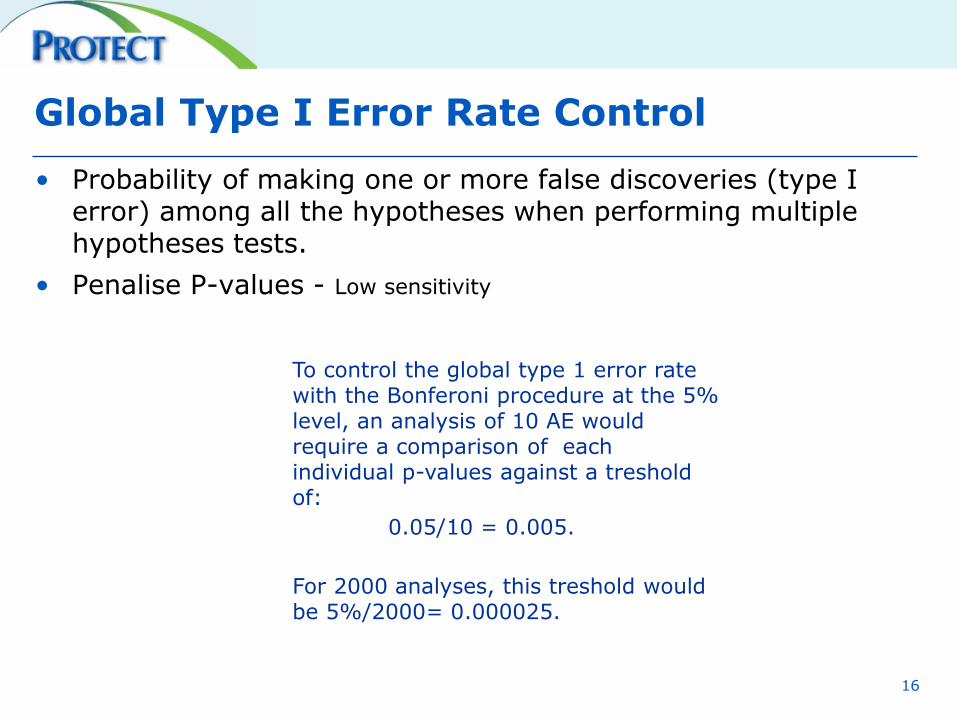
Global Type I Error Rate Control
• Probability of making one or more false discoveries (type I error) among all the hypotheses when performing multiple hypotheses tests.
• Penalise P-values - Low sensitivity
16
To control the global type 1 error rate with the Bonferoni procedure at the 5% level, an analysis of 10 AE would require a comparison of each individual p-values against a treshold of:
0.05/10 = 0.005.
For 2000 analyses, this treshold would be 5%/2000= 0.000025.
Group 1 (n = 148)
Group 2 (n=132)
Diff (%) P- Value
Diarrhea 24 10 8.6 0.0289
Irritability 75 43 18.1 0.0025
Rash 13 3 6.5 0.0209
Rash, measles/ rubella-like
8 1 4.6 0.0388
Signals?
17
Bonferoni procedure:
0.05/40 = 0.00125.
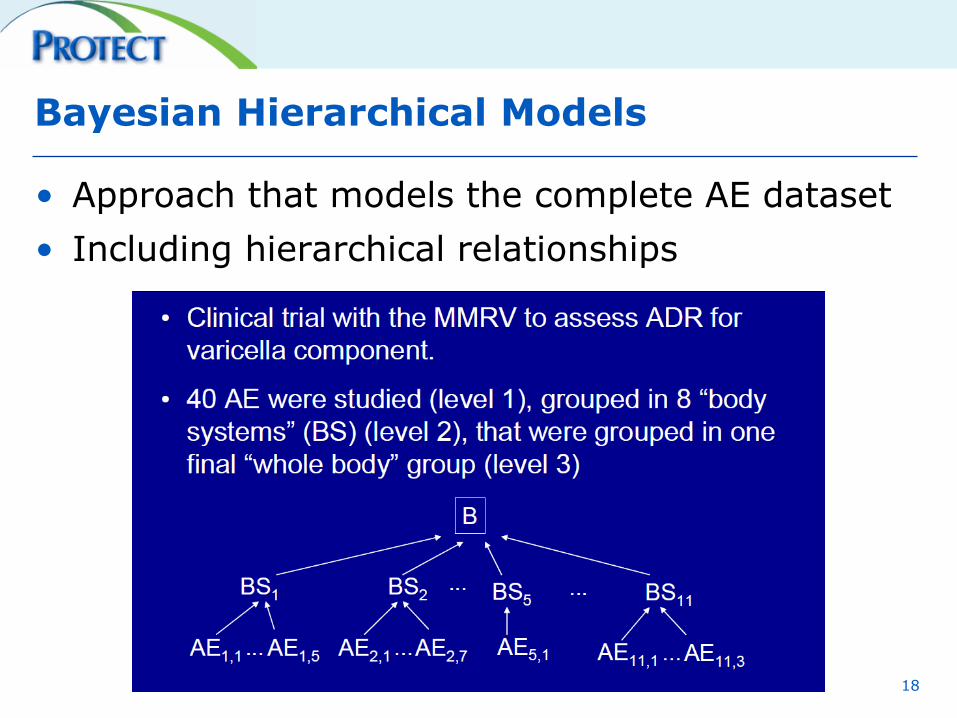
Bayesian Hierarchical Models
• Approach that models the complete AE dataset
• Including hierarchical relationships
18
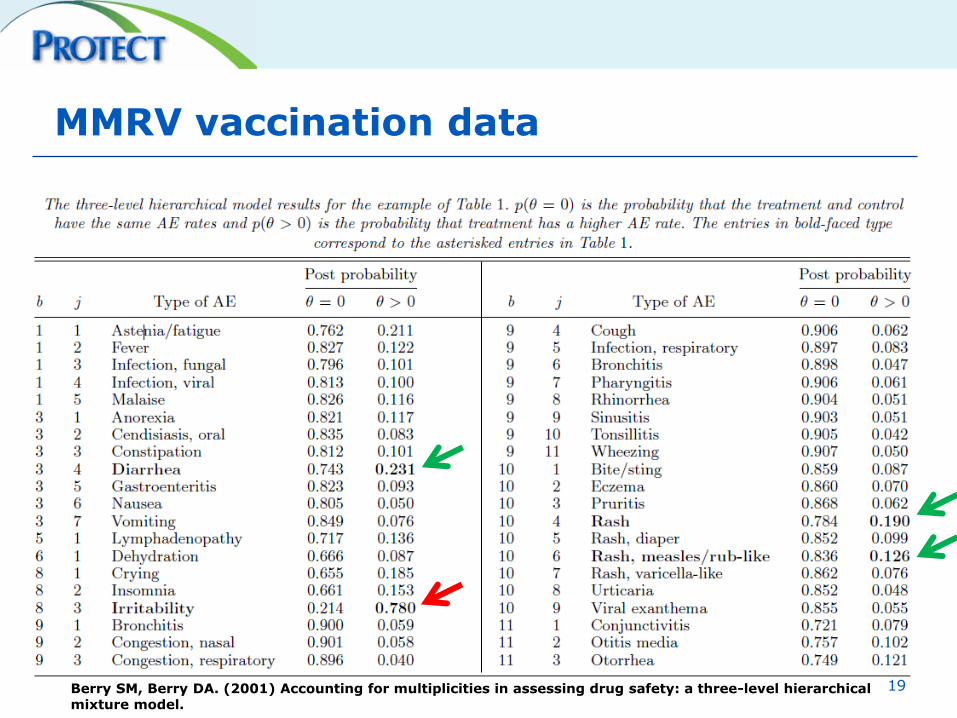
MMRV vaccination data
Berry SM, Berry DA. (2001) Accounting for multiplicities in assessing drug safety: a three-level hierarchical mixture model.
19
• FDR procedures are designed to control the expected proportion of incorrectly rejected null hypotheses ("false positives")
• As example: an analysis controlling the FDR at the 5% level identifies 20 signals. We would expect maximal one of these signals to be false positive.
• Double FDR is a two step adjustment procedure, first on the higher group level (e.g. SOC), then on the analysis level (e.g. PT).
20
Double False Discovery Rate
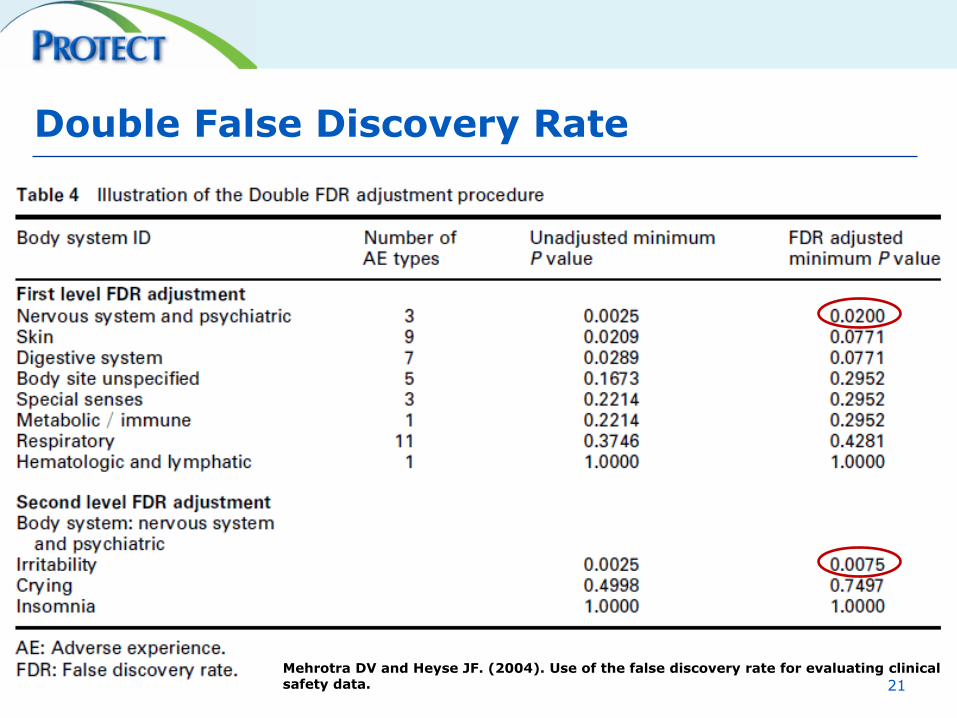
Double False Discovery Rate
Mehrotra DV and Heyse JF. (2004). Use of the false discovery rate for evaluating clinical safety data. 21
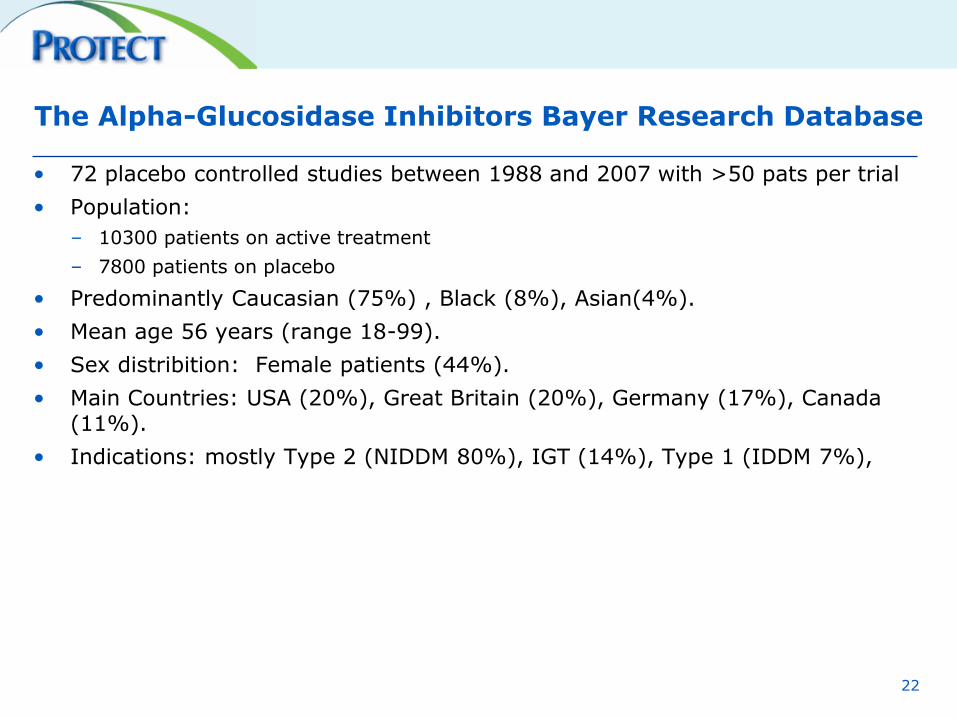
The Alpha-Glucosidase Inhibitors Bayer Research Database
• 72 placebo controlled studies between 1988 and 2007 with >50 pats per trial
• Population:
– 10300 patients on active treatment
– 7800 patients on placebo
• Predominantly Caucasian (75%) , Black (8%), Asian(4%).
• Mean age 56 years (range 18-99).
• Sex distribition: Female patients (44%).
• Main Countries: USA (20%), Great Britain (20%), Germany (17%), Canada (11%).
• Indications: mostly Type 2 (NIDDM 80%), IGT (14%), Type 1 (IDDM 7%),
22
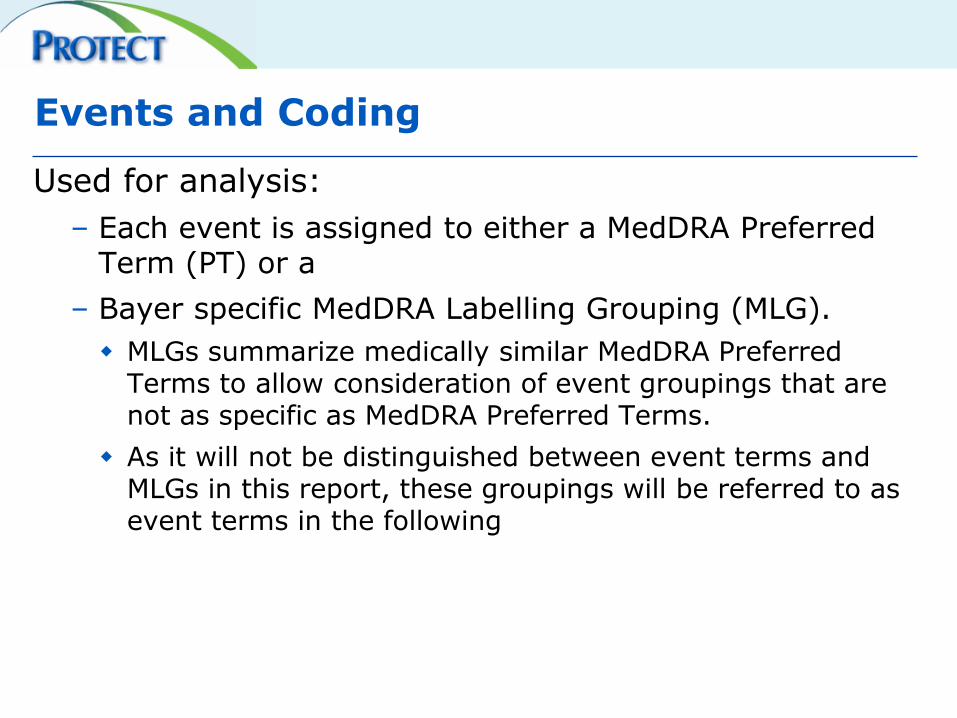
Events and Coding
Used for analysis:
– Each event is assigned to either a MedDRA Preferred Term (PT) or a
– Bayer specific MedDRA Labelling Grouping (MLG).
MLGs summarize medically similar MedDRA Preferred Terms to allow consideration of event groupings that are not as specific as MedDRA Preferred Terms.
As it will not be distinguished between event terms and MLGs in this report, these groupings will be referred to as event terms in the following
24
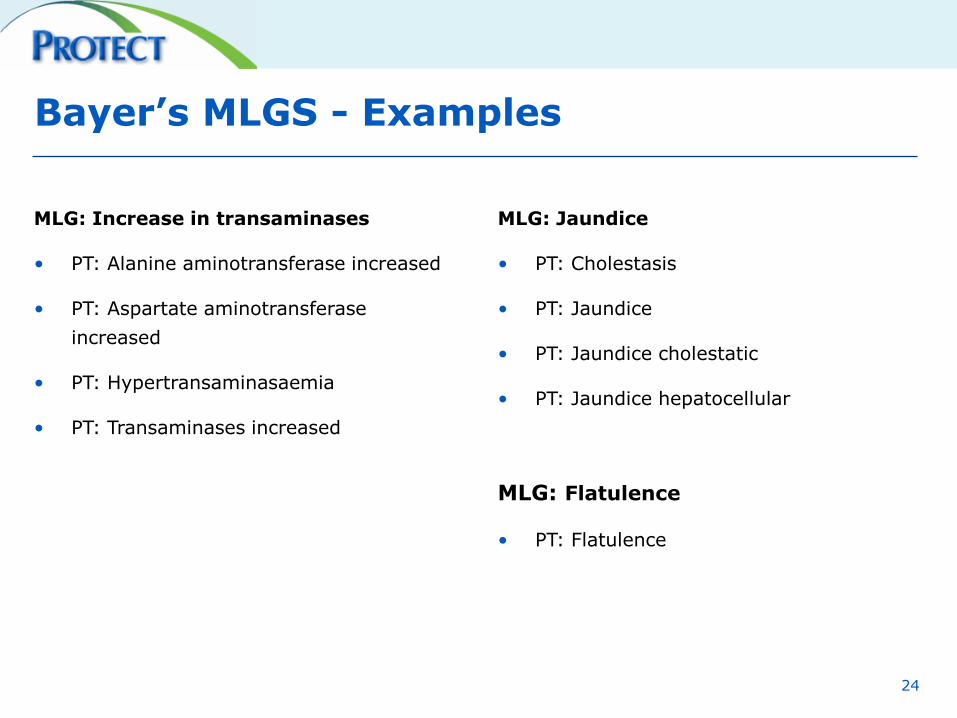
MLG: Increase in transaminases
• PT: Alanine aminotransferase increased
• PT: Aspartate aminotransferase
increased
• PT: Hypertransaminasaemia
• PT: Transaminases increased
MLG: Jaundice
• PT: Cholestasis
• PT: Jaundice
• PT: Jaundice cholestatic
• PT: Jaundice hepatocellular
MLG: Flatulence
• PT: Flatulence
Bayer’s MLGS - Examples
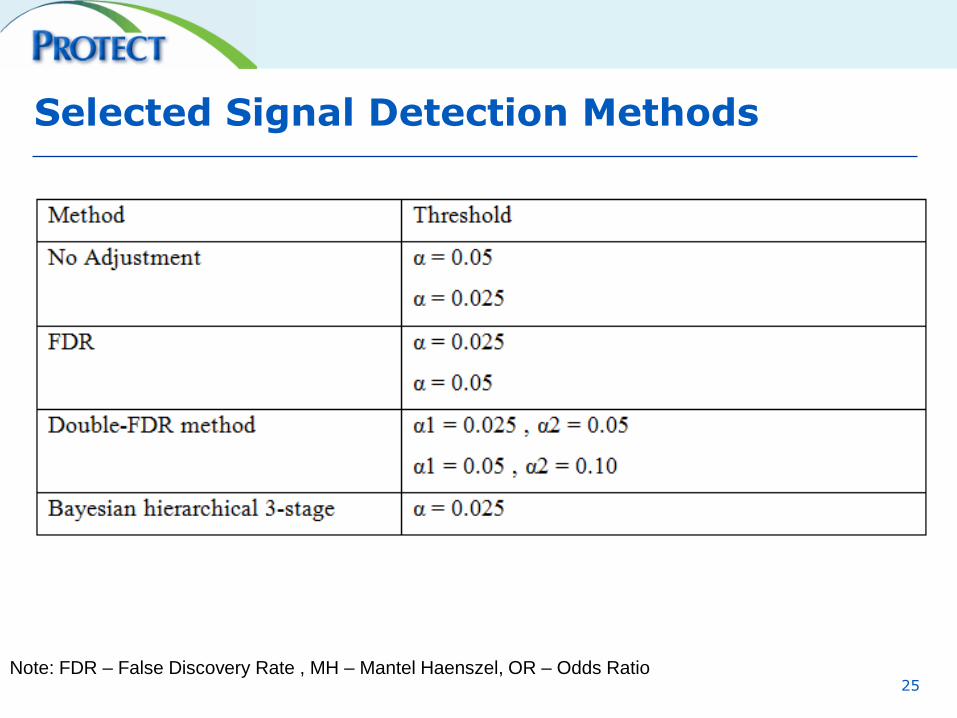
Selected Signal Detection Methods
25 Note: FDR – False Discovery Rate , MH – Mantel Haenszel, OR – Odds Ratio
Specificity, i.e. the proportion of not flagged events within all true non-signals
• To evaluate the performance of different Signal detection methods requires the definition of a gold standard, which is a set of known and unknown safety topics. The performance of the individual methods will be evaluated by comparing the signal detection results (signal, no signal) versus the gold standard (ADR, no ADR).
• An event is considered to be an ADR, if it is currently listed in the ADR section of the corresponding CDS with a frequency of rare or higher.
• Rare events are included based on the theoretical chance to create a signal in an unadjusted analysis given the size of the database (i.e., assume frequency to by 1/1000.
26
„Gold Standard“
Method Ranking
Signal detection methods will be ranked according to their performance with regard to
• Positive predictive value (PPV), i.e. the proportion of true signals among all flagged events
• Specificity, i.e. the proportion of not flagged events within all true non-signals
• Sensitivity, i.e. the proportion of flagged events within all true signals
• Negative predictive value (NPV), i.e. the proportion of true non-signals among all not flagged events
27
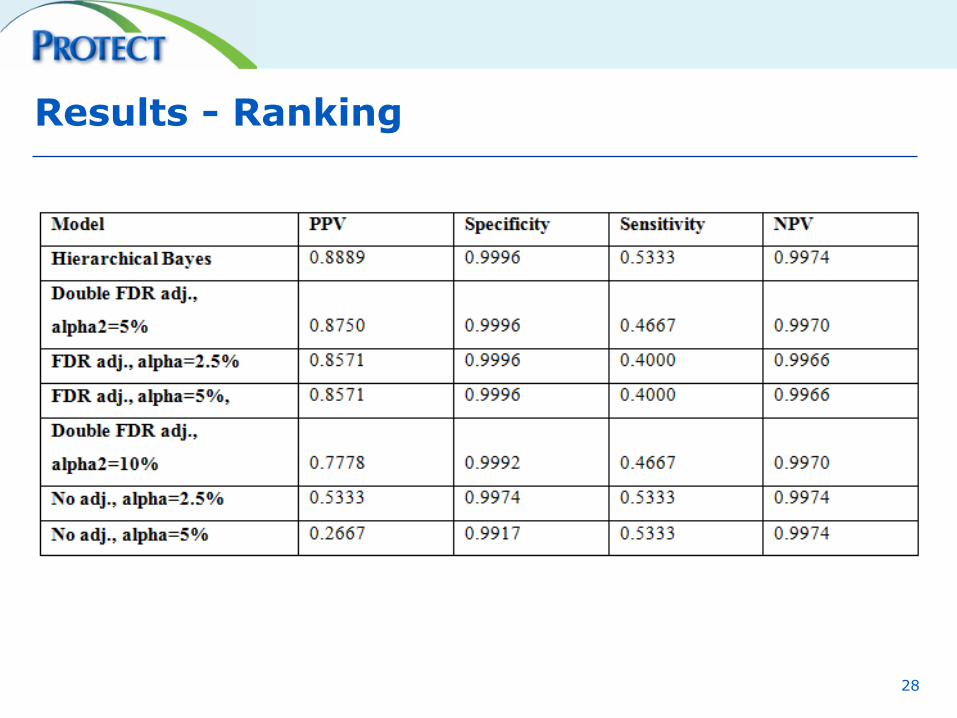
Results - Ranking
28
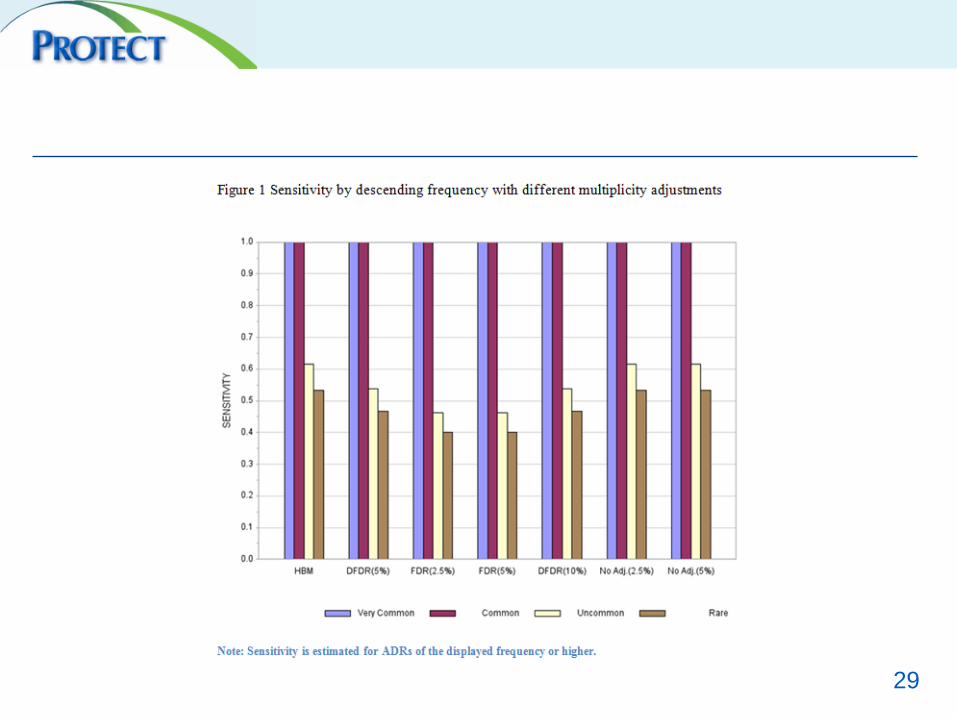
29
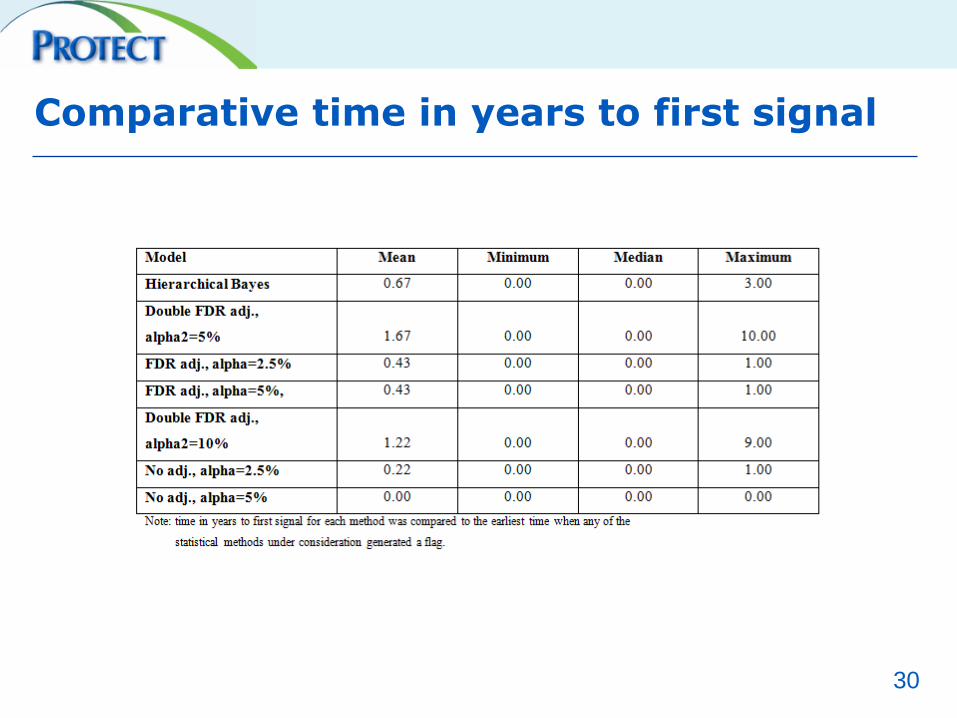
Comparative time in years to first signal
30
AE Data Modelling - Conclusions
• Multiplicity adjustment provides a useful tool to improve the quality in signal detection in clinical trial data by increasing the positive predictive value.
• The use of multiplicity adjustment needs to be evaluated against the size of the available clinical trial database.
• Bayesian Hierarchical Models can improve the efficiency of signal detection through borrowing of strength from other relevant events in the clinical trial dataset. This must be weighed against the more complex requirements of Bayesian modelling.
• The use of specific MedDRA groupings can further improve signal detection in clinical trial data.
References and Further Reading
• Alvarez Y, Hidalgo A, Maignen F and Slattery J. Validation of Statistical Signal Detection Procedures in EudraVigilance Post-Authorization Data A Retrospective Evaluation of the Potential for Earlier Signalling. Drug Saf 2010; 33 (6): 475-487
• Benjamini Y and Hochberg Y (1995). Controlling the false discovery rate: a practical and powerful approach to multiple testing. Journal of the Royal Statistical Society, Series B, 57(1):289–300.
• Benjamini Y, Krieger AM, and Yekutieli D (2006). Adaptive linear step-up procedures that control the false discovery rate. Biometrika, 93(3):491–507.
• Berlin. Are all quantitative postmarketing signal detection methods equal? Performance characteristics of logistic regression and Multi-item Gamma Poisson Shrinker. Pharmacoepidemiol. Drug Safety 2012 Jun;21(6):622-30
• Berry SM, Berry DA. Accounting for multiplicities in assessing drug safety: a three-level hierarchical mixture model. Biometrics, 60: 418-426).
• Chen W, Zhao N, Qin G and Chen J (2013): A Bayesian Group Sequential Approach to Safety Signal Detection, Journal of Biopharmaceutical Statistics, 23:1, 213-230.
• Council for International Organizations of Medical Sciences (2005). Final Report of CIOMS Working Group VI: Management of Safety Information from Clinical Trials. CIOMS, Geneva, 2005.
• DuMouchel W. Multivariate Bayesian Logistic Regression for Analysis of Clinical Study Safety Issues. Statist. Sci. Volume 27, Number 3 (2012), 319-339.Storey, J. D., Taylor, J. E., and Siegmund, D. (2004). Strong control, conservative point estimation and simultaneous conservative consistency of false discovery rates: a unified approach. Journal of the Royal Statistical Society, Series B, 66(1):187–205
• EMEA (2002). CPMP Points to Consider on multiplicity issues in clinical trials.
• Hu JX, Zhao H, Zhou HH. False discovery rate control with groups. Journal of the American Statistical Association 2010 105: 1215–1227.
32
References and Further Reading
• Gould AL. Detecting potential safety issues in clinical trials by Bayesian screening. Biom. J. 2008 Oct;50(5):837-51.
• Grunert J: Signalerkennung in klinischen Studiendaten unter Verwendung der False Discovery Rate. 2010. Diplomarbeit. Technische Universität Dortmund.
• International Conference on Harmonisation (ICH). Statistical principles for clinical trials, ICH topic E9. EMEA: Canary Wharf, London, 1998.
• Lutkewitz S: Signalerkennung in klinischen Studiendaten mit hierarchischen Bayes Modellen. 2012. Masterarbeit . Technische Universität Dortmund.
• Mallick, A. (2012, March 27). From AE to ADR: Medical aspects. Copenhagen, Denmark: 24th Annual DIA EuroMeeting.
• Mehrotra DV and Heyse JF. (2004). Use of the false discovery rate for evaluating clinical safety data. Stat Methods Med Res. 2004 Jun;13(3):227-38.
• Mehrotra DV and Adewale AJ (2012), Flagging clinical adverse experiences: reducing false discoveries without materially compromising power for detecting true signals. Statist. Med., 31: 1918–1930.
• Prieto-Merino D. Use of Bayesian Hierarchical Models in Signal Detection. Presentation. PSI 2009.
• Romano JP, Shaikh AM, and Wolf M (2008). Control of the false discovery rate under dependence using the bootstrap and subsampling. (Invited Paper with discussion), TEST 17, 417-442.
• Rosenkranz GK. An Approach to Integrated Safety Analyses from Clinical Studies. Drug Information Journal November 2010 vol. 44 no. 6 649-657.
• Southworth H and O'Connell M. Data mining and statistically guided clinical review of adverse event data in clinical trials. Journal of Biopharmaceutical Statistics, 19:803 - 817, 2009.
• Xia A, Ma H, and Carlin BP. Bayesian hierarchical modeling for detecting safety signals in clinical trials. Journal of Biopharmaceutical Statistics, 21:1006 - 1029, 2011.
33