statistical reasoning in the middle school - amazon … · statistical reasoning in the middle...
TRANSCRIPT
Statistical Reasoning in the Middle School2013 NCTM Annual Meeting & Exposition – Denver
Raymond Johnson 1 Susan Thomas 2
1University of Colorado BoulderFreudenthal Institute US
http://mathed.net
2University of Colorado [email protected]
April 18, 2013
Outline
1 Introduction
2 Reasoning About Variability
3 Reasoning About Sampling and Inference
4 Reasoning About Covariation
5 Resources
Johnson & Thomas (CU-Boulder & FIUS) Statistical Reasoning in MS NCTM 2013 2 / 30
About Us
Raymond:
PhD student in Curriculum & Instruction, Mathematics Education
Learned to teach statistics on the job as a reaction to standards
Instructor of Basic Statistical Methods
Susan:
PhD student in Research and Evaluation Methodology
Undergraduate degrees in mathematics and statistics
Together:
Research on middle school teachers’ perceptions of statistics in theCCSSM
A need for content knowledge (common, content, horizon) (Ball,Thames, & Phelps, 2008)A need for curriculum and tasks
Johnson & Thomas (CU-Boulder & FIUS) Statistical Reasoning in MS NCTM 2013 3 / 30
Why More Statistics?
Demand in standards
NCTM 1989, 2000
GAISE Report, CCSSM
Evolution of the discipline
A new and rapidly evolving field
Are you older than a box plot?
Big data and little data
Google’s Eric Schmidt: “There was 5 exabytes of information createdbetween the dawn of civilization through 2003, but that muchinformation is now created every 2 days, and the pace isincreasing.”(Kilpatrick, 2010)
The “Quantified Self”
Johnson & Thomas (CU-Boulder & FIUS) Statistical Reasoning in MS NCTM 2013 4 / 30
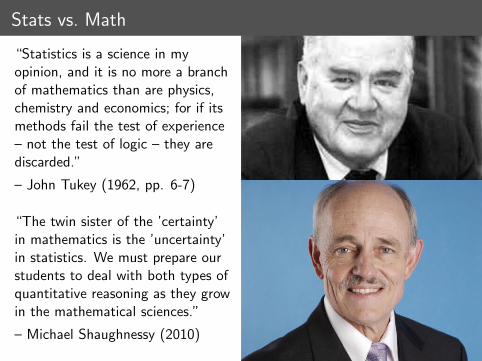
Stats vs. Math
“Statistics is a science in myopinion, and it is no more a branchof mathematics than are physics,chemistry and economics; for if itsmethods fail the test of experience– not the test of logic – they arediscarded.”
– John Tukey (1962, pp. 6-7)
“The twin sister of the ’certainty’in mathematics is the ’uncertainty’in statistics. We must prepare ourstudents to deal with both types ofquantitative reasoning as they growin the mathematical sciences.”
– Michael Shaughnessy (2010)
Statistical Thinking vs. Reasoning (DelMas, 2004)
Statistical Thinking : Knowing when and how to apply statisticalknowledge and procedures
Statistical Reasoning : Explaining why results were produced or why aconclusion is justified
Examples of statistical reasoning:
Stating implications
Justifying conclusions
Making inferences
Johnson & Thomas (CU-Boulder & FIUS) Statistical Reasoning in MS NCTM 2013 6 / 30
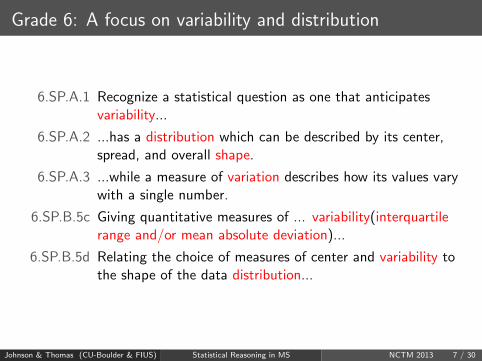
Grade 6: A focus on variability and distribution
6.SP.A.1 Recognize a statistical question as one that anticipatesvariability...
6.SP.A.2 ...has a distribution which can be described by its center,spread, and overall shape.
6.SP.A.3 ...while a measure of variation describes how its values varywith a single number.
6.SP.B.5c Giving quantitative measures of ... variability(interquartilerange and/or mean absolute deviation)...
6.SP.B.5d Relating the choice of measures of center and variability tothe shape of the data distribution...
Johnson & Thomas (CU-Boulder & FIUS) Statistical Reasoning in MS NCTM 2013 7 / 30
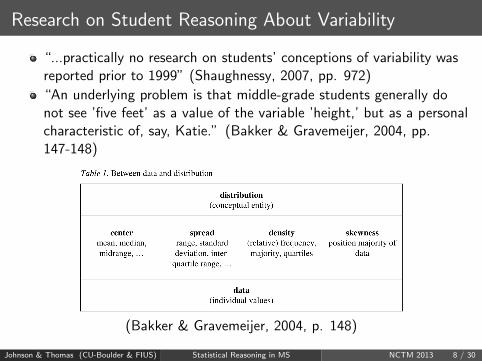
Research on Student Reasoning About Variability
“...practically no research on students’ conceptions of variability wasreported prior to 1999” (Shaughnessy, 2007, pp. 972)
“An underlying problem is that middle-grade students generally donot see ’five feet’ as a value of the variable ’height,’ but as a personalcharacteristic of, say, Katie.” (Bakker & Gravemeijer, 2004, pp.147-148)
(Bakker & Gravemeijer, 2004, p. 148)
Johnson & Thomas (CU-Boulder & FIUS) Statistical Reasoning in MS NCTM 2013 8 / 30
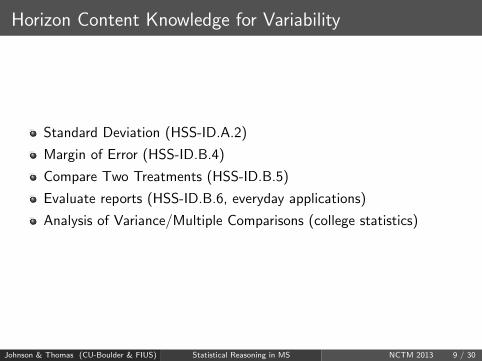
Horizon Content Knowledge for Variability
Standard Deviation (HSS-ID.A.2)
Margin of Error (HSS-ID.B.4)
Compare Two Treatments (HSS-ID.B.5)
Evaluate reports (HSS-ID.B.6, everyday applications)
Analysis of Variance/Multiple Comparisons (college statistics)
Johnson & Thomas (CU-Boulder & FIUS) Statistical Reasoning in MS NCTM 2013 9 / 30
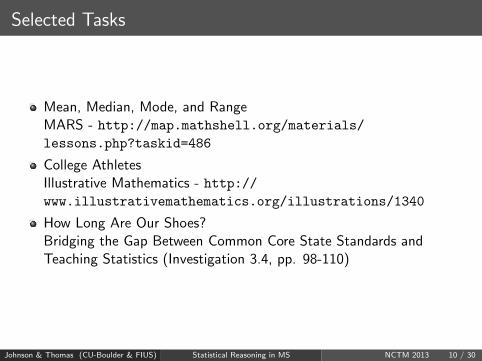
Selected Tasks
Mean, Median, Mode, and RangeMARS - http://map.mathshell.org/materials/lessons.php?taskid=486
College AthletesIllustrative Mathematics - http://www.illustrativemathematics.org/illustrations/1340
How Long Are Our Shoes?Bridging the Gap Between Common Core State Standards andTeaching Statistics (Investigation 3.4, pp. 98-110)
Johnson & Thomas (CU-Boulder & FIUS) Statistical Reasoning in MS NCTM 2013 10 / 30
Discussion About Variability
What kind of student thinking would you expect to see on this task?
How might the task elicit reasoning about variability?
Where in a sequence of tasks or lessons would you place this?
Johnson & Thomas (CU-Boulder & FIUS) Statistical Reasoning in MS NCTM 2013 11 / 30
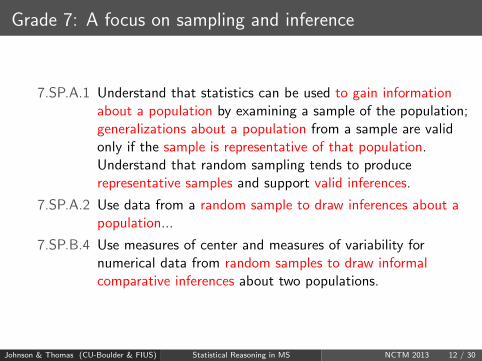
Grade 7: A focus on sampling and inference
7.SP.A.1 Understand that statistics can be used to gain informationabout a population by examining a sample of the population;generalizations about a population from a sample are validonly if the sample is representative of that population.Understand that random sampling tends to producerepresentative samples and support valid inferences.
7.SP.A.2 Use data from a random sample to draw inferences about apopulation...
7.SP.B.4 Use measures of center and measures of variability fornumerical data from random samples to draw informalcomparative inferences about two populations.
Johnson & Thomas (CU-Boulder & FIUS) Statistical Reasoning in MS NCTM 2013 12 / 30
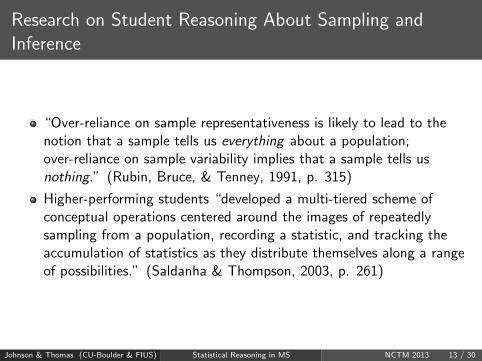
Research on Student Reasoning About Sampling andInference
“Over-reliance on sample representativeness is likely to lead to thenotion that a sample tells us everything about a population;over-reliance on sample variability implies that a sample tells usnothing.” (Rubin, Bruce, & Tenney, 1991, p. 315)
Higher-performing students “developed a multi-tiered scheme ofconceptual operations centered around the images of repeatedlysampling from a population, recording a statistic, and tracking theaccumulation of statistics as they distribute themselves along a rangeof possibilities.” (Saldanha & Thompson, 2003, p. 261)
Johnson & Thomas (CU-Boulder & FIUS) Statistical Reasoning in MS NCTM 2013 13 / 30
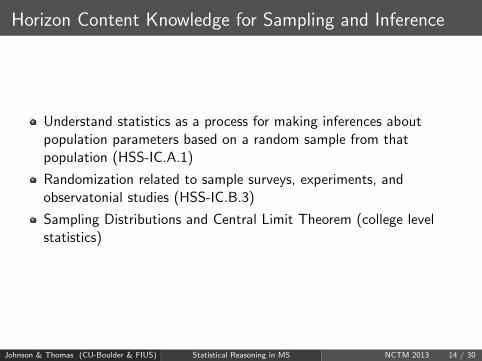
Horizon Content Knowledge for Sampling and Inference
Understand statistics as a process for making inferences aboutpopulation parameters based on a random sample from thatpopulation (HSS-IC.A.1)
Randomization related to sample surveys, experiments, andobservatonial studies (HSS-IC.B.3)
Sampling Distributions and Central Limit Theorem (college levelstatistics)
Johnson & Thomas (CU-Boulder & FIUS) Statistical Reasoning in MS NCTM 2013 14 / 30

Selected Tasks
What’s Your Favorite Subject?http://www.illustrativemathematics.org/illustrations/
973
Counting Treeshttp://map.mathshell.org/materials/
tasks.php?taskid=386&subpage=expert
Candy Barshttp://map.mathshell.org/materials/
tasks.php?taskid=396&subpage=expert
Johnson & Thomas (CU-Boulder & FIUS) Statistical Reasoning in MS NCTM 2013 15 / 30
Discussion About Sampling and Inference
What kind of student thinking would you expect to see on this task?
How might the task elicit reasoning about sampling and inference?
Where in a sequence of tasks or lessons would you place this?
Johnson & Thomas (CU-Boulder & FIUS) Statistical Reasoning in MS NCTM 2013 16 / 30
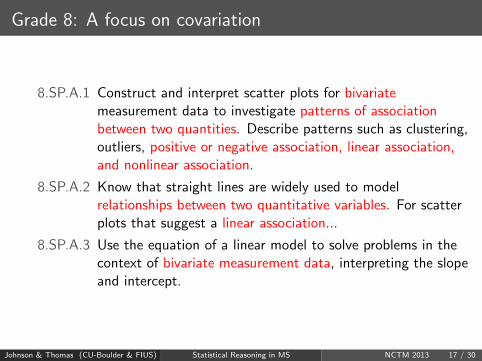
Grade 8: A focus on covariation
8.SP.A.1 Construct and interpret scatter plots for bivariatemeasurement data to investigate patterns of associationbetween two quantities. Describe patterns such as clustering,outliers, positive or negative association, linear association,and nonlinear association.
8.SP.A.2 Know that straight lines are widely used to modelrelationships between two quantitative variables. For scatterplots that suggest a linear association...
8.SP.A.3 Use the equation of a linear model to solve problems in thecontext of bivariate measurement data, interpreting the slopeand intercept.
Johnson & Thomas (CU-Boulder & FIUS) Statistical Reasoning in MS NCTM 2013 17 / 30
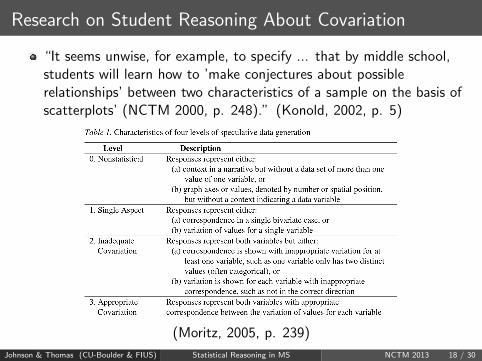
Research on Student Reasoning About Covariation
“It seems unwise, for example, to specify ... that by middle school,students will learn how to ’make conjectures about possiblerelationships’ between two characteristics of a sample on the basis ofscatterplots’ (NCTM 2000, p. 248).” (Konold, 2002, p. 5)
(Moritz, 2005, p. 239)
Johnson & Thomas (CU-Boulder & FIUS) Statistical Reasoning in MS NCTM 2013 18 / 30
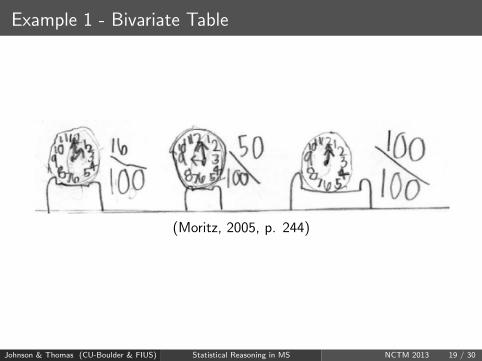
Example 1 - Bivariate Table
(Moritz, 2005, p. 244)
Johnson & Thomas (CU-Boulder & FIUS) Statistical Reasoning in MS NCTM 2013 19 / 30
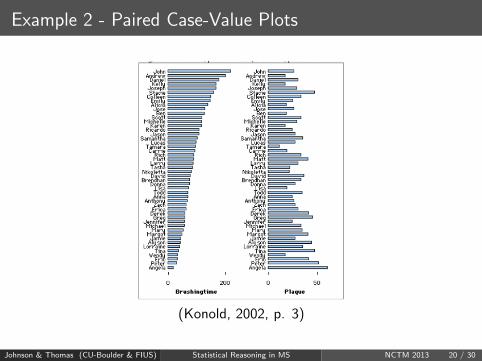
Example 2 - Paired Case-Value Plots
(Konold, 2002, p. 3)
Johnson & Thomas (CU-Boulder & FIUS) Statistical Reasoning in MS NCTM 2013 20 / 30
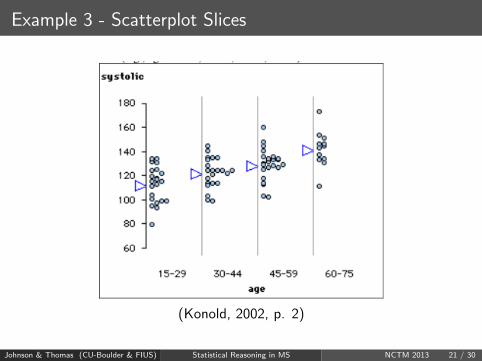
Example 3 - Scatterplot Slices
(Konold, 2002, p. 2)
Johnson & Thomas (CU-Boulder & FIUS) Statistical Reasoning in MS NCTM 2013 21 / 30
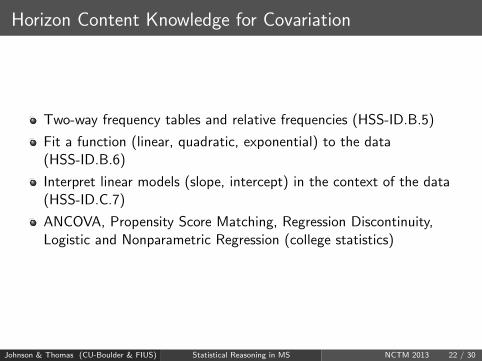
Horizon Content Knowledge for Covariation
Two-way frequency tables and relative frequencies (HSS-ID.B.5)
Fit a function (linear, quadratic, exponential) to the data(HSS-ID.B.6)
Interpret linear models (slope, intercept) in the context of the data(HSS-ID.C.7)
ANCOVA, Propensity Score Matching, Regression Discontinuity,Logistic and Nonparametric Regression (college statistics)
Johnson & Thomas (CU-Boulder & FIUS) Statistical Reasoning in MS NCTM 2013 22 / 30
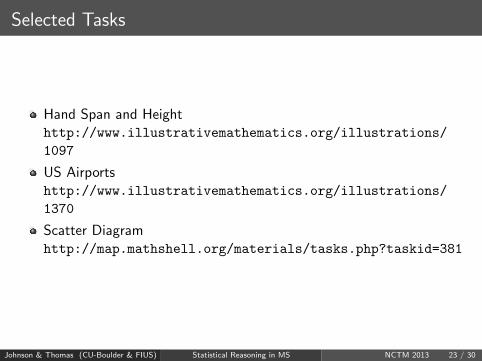
Selected Tasks
Hand Span and Heighthttp://www.illustrativemathematics.org/illustrations/
1097
US Airportshttp://www.illustrativemathematics.org/illustrations/
1370
Scatter Diagramhttp://map.mathshell.org/materials/tasks.php?taskid=381
Johnson & Thomas (CU-Boulder & FIUS) Statistical Reasoning in MS NCTM 2013 23 / 30

Discussion About Covariation
What kind of student thinking would you expect to see on this task?
How might the task elicit reasoning about covariation?
Where in a sequence of tasks or lessons would you place this?
Johnson & Thomas (CU-Boulder & FIUS) Statistical Reasoning in MS NCTM 2013 24 / 30

Resources
Bridging the Gap Between Common Core State Standards andTeaching Statistics: http://www.amstat.org/education/btg/ &http://www.nctm.org/catalog/product.aspx?id=14444
MARS: http://map.mathshell.org/materials/index.php
Illustrative Mathematics:http://www.illustrativemathematics.org/
AIMS Project: http://www.tc.umn.edu/~aims/index.htm
Johnson & Thomas (CU-Boulder & FIUS) Statistical Reasoning in MS NCTM 2013 25 / 30
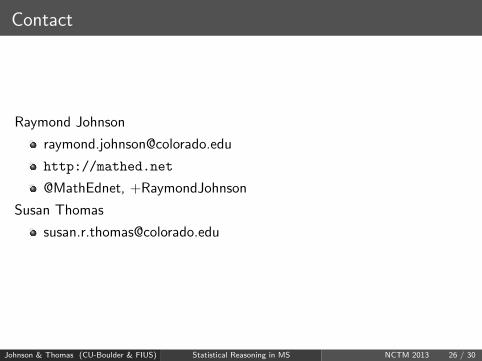
Contact
Raymond Johnson
http://mathed.net
@MathEdnet, +RaymondJohnson
Susan Thomas
Johnson & Thomas (CU-Boulder & FIUS) Statistical Reasoning in MS NCTM 2013 26 / 30
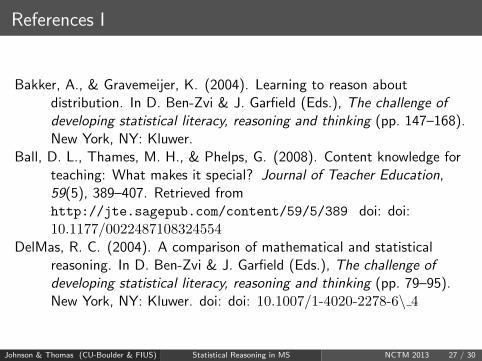
References I
Bakker, A., & Gravemeijer, K. (2004). Learning to reason aboutdistribution. In D. Ben-Zvi & J. Garfield (Eds.), The challenge ofdeveloping statistical literacy, reasoning and thinking (pp. 147–168).New York, NY: Kluwer.
Ball, D. L., Thames, M. H., & Phelps, G. (2008). Content knowledge forteaching: What makes it special? Journal of Teacher Education,59(5), 389–407. Retrieved fromhttp://jte.sagepub.com/content/59/5/389 doi: doi:10.1177/0022487108324554
DelMas, R. C. (2004). A comparison of mathematical and statisticalreasoning. In D. Ben-Zvi & J. Garfield (Eds.), The challenge ofdeveloping statistical literacy, reasoning and thinking (pp. 79–95).New York, NY: Kluwer. doi: doi: 10.1007/1-4020-2278-6\ 4
Johnson & Thomas (CU-Boulder & FIUS) Statistical Reasoning in MS NCTM 2013 27 / 30
References II
Kilpatrick, M. (2010, August). Google CEO Schmidt: ”People aren’tready for the technology revolution”. Retrieved fromhttp://readwrite.com/2010/08/04/
google ceo schmidt people arent ready for the tech
Konold, C. (2002). Alternatives to scatterplots. In Proceedings of thesixth international conference on teaching statistics (pp. 1–6). CapeTown, South Africa: International Association for StatisticalEducation. Retrieved from http://www.stat.auckland.ac.nz/
~iase/publications/1/7f5 kono.pdf
Moritz, J. (2005). Reasoning about covariation. In D. Ben-Zvi &J. Garfield (Eds.), The challenge of developing statistical literacy,reasoning and thinking (pp. 227–255). New York, NY: Kluwer. doi:doi: 10.1007/1-4020-2278-6\ 10
Johnson & Thomas (CU-Boulder & FIUS) Statistical Reasoning in MS NCTM 2013 28 / 30
References III
Rubin, A., Bruce, B., & Tenney, Y. (1991). Learning about sampling:Trouble at the core of statistics. In D. Vere-Jones (Ed.), Proceedingsof the third international conference on teaching statistics (pp.314–319). Voorberg, The Netherlands: International StatisticsInstitute.
Saldanha, L., & Thompson, P. (2003). Conceptions of sample and theirrelationship to statistical inference. Educational Studies inMathematics, 51, 257–270.
Shaughnessy, J. M. (2007). Research on statistics learning and reasoning.In F. K. Lester (Ed.), Second handbook of research on mathematicsteaching and learning: A project of the national council of teachersof mathematics (pp. 957–1009). Reston, VA: National Council ofTeachers of Mathematics.
Shaughnessy, J. M. (2010). Statistics for all – the flip side of quantitativereasoning. Retrieved fromhttp://www.nctm.org/about/content.aspx?id=26327
Johnson & Thomas (CU-Boulder & FIUS) Statistical Reasoning in MS NCTM 2013 29 / 30
References IV
Tukey, J. W. (1962). The future of data analysis. The Annals ofMathematical Statistics, 33(1), 1–67.
Johnson & Thomas (CU-Boulder & FIUS) Statistical Reasoning in MS NCTM 2013 30 / 30