statistical machine learning methods for...
TRANSCRIPT

Statistical Machine Learning Methods for Bioinformatics
VI. Support Vector Machine Applications in Bioinformatics
Jianlin Cheng, PhD Computer Science Department and Informatics Institute
University of Missouri 2016
Free for Academic Use. Copyright @ Jianlin Cheng & original sources of some materials.

SVM Applications in Bioinformatics
• Cancer Classification using Gene Expression Data
• Protein Mutation Stability Prediction • Protein Secondary Structure Prediction • Protein Fold Recognition • Protein Contact Map Prediction • Protein Structure Classification • ……
Project 4
• Classify cancer using gene expression data by SVM
• SVM tools: SVM-light (C++) or Weka (Java)
• R and MatLab • Reference: Golub et al, Molecular Classification of
Cancer: Class Discovery and Class Prediction by Gene Expression Monitoring, Science, 1999.
Current Cancer Diagnosis
• A reliable and precise classification of tumors is essential for successful treatment of cancer.
• Current methods relies on the subjective interpretation of both clinical histopathological information with an eye toward placing tumors in currently accepted categories based on the tissue of origin of the tumor.
• However, clinical information can be misleading or incomplete.
• there is a wide spectrum in cancer morphology and many tumors are atypical or lack morphologic features, which results in diagnostic confusion.
Jia Yi, 2005
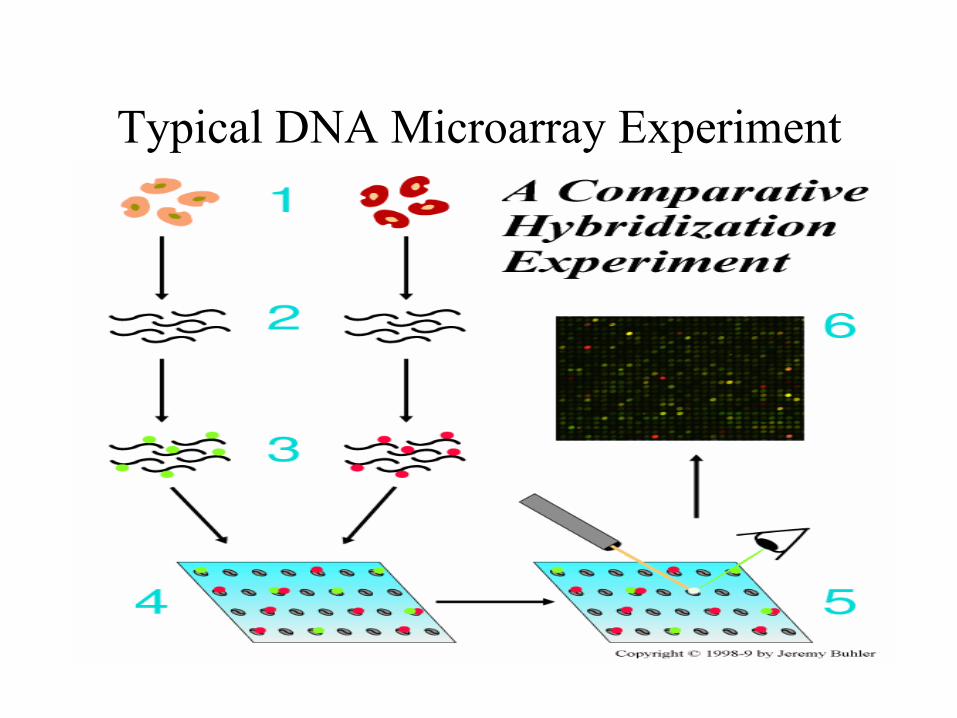
Typical DNA Microarray Experiment
DNA Microarray-based Cancer Diagnosis
• Molecular diagnostics offer the promise of precise, objective, and systematic cancer classification
• Recently, DNA microarray tumor gene expression profiles have been used for cancer diagnosis.
• By allowing the monitoring of expression levels for thousands of genes simultaneously, such techniques will lead to a more complete understanding of the molecular variations among tumors, hence to a finer and more reliable classification.

Tumor Classification Types • There are three main types of statistical problems
associated with tumor classification: – The identification of new tumor classes using gene
expression profiles --- unsupervised learning. – The classification of malignancies into known classes
--- supervised learning. – The identifications of “marker” genes that characterize the
different tumor classes --- variable selection.
Source of Datasets (cont.)
• Leukemia dataset – This dataset is the gene expression in two types
of acute leukemias: ALL and AML. – This study produced gene expression data for
p=6,817 genes in n=72 mRNA samples. 47 × ALL (38 B-cell All,9 T-cell All) 25 × AML
http://www.broad.mit.edu/cgi-bin/cancer/datasets.cgi

Christine Orengo 1997 Structures 5 1093-1108
The Universe of Protein Structures
B. Rost, 2005
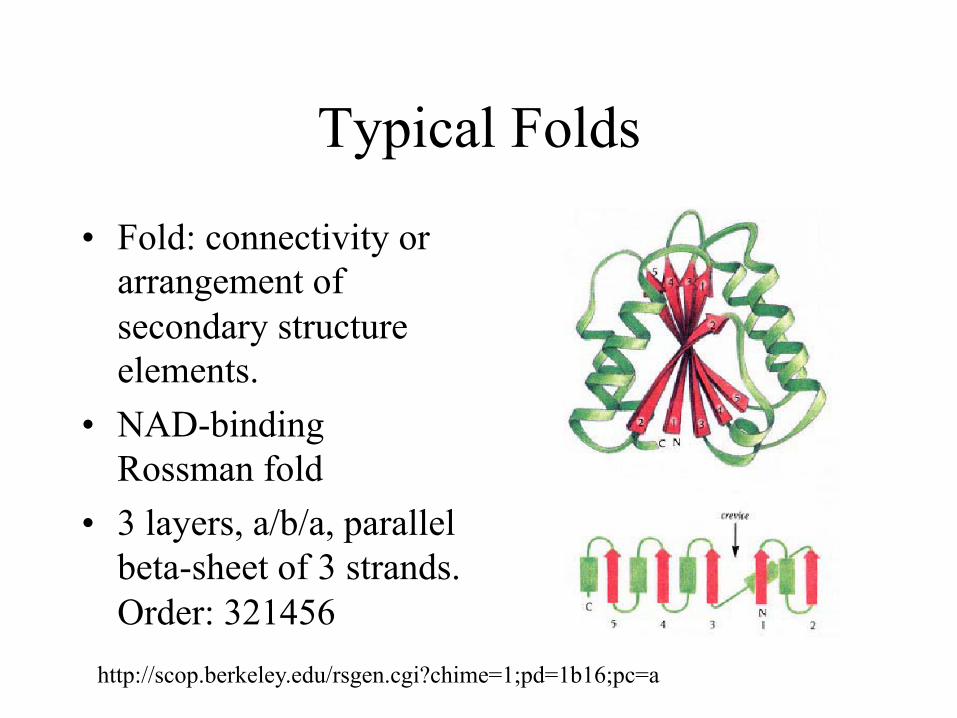
Typical Folds
• Fold: connectivity or arrangement of secondary structure elements.
• NAD-binding Rossman fold
• 3 layers, a/b/a, parallel beta-sheet of 3 strands. Order: 321456
http://scop.berkeley.edu/rsgen.cgi?chime=1;pd=1b16;pc=a
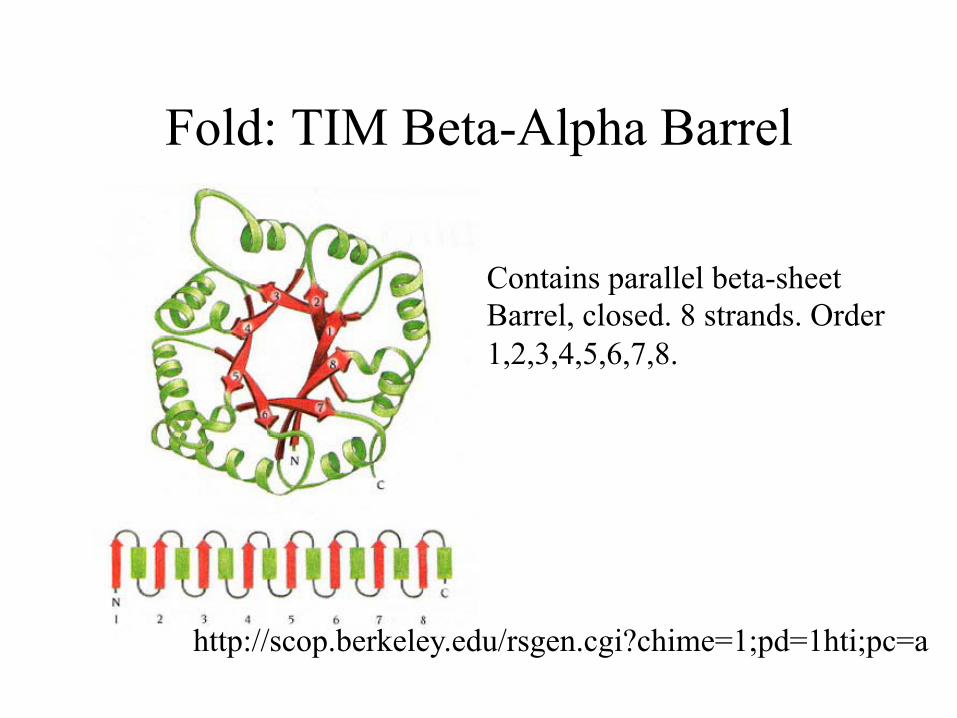
Fold: TIM Beta-Alpha Barrel
http://scop.berkeley.edu/rsgen.cgi?chime=1;pd=1hti;pc=a
Contains parallel beta-sheet Barrel, closed. 8 strands. Order 1,2,3,4,5,6,7,8.
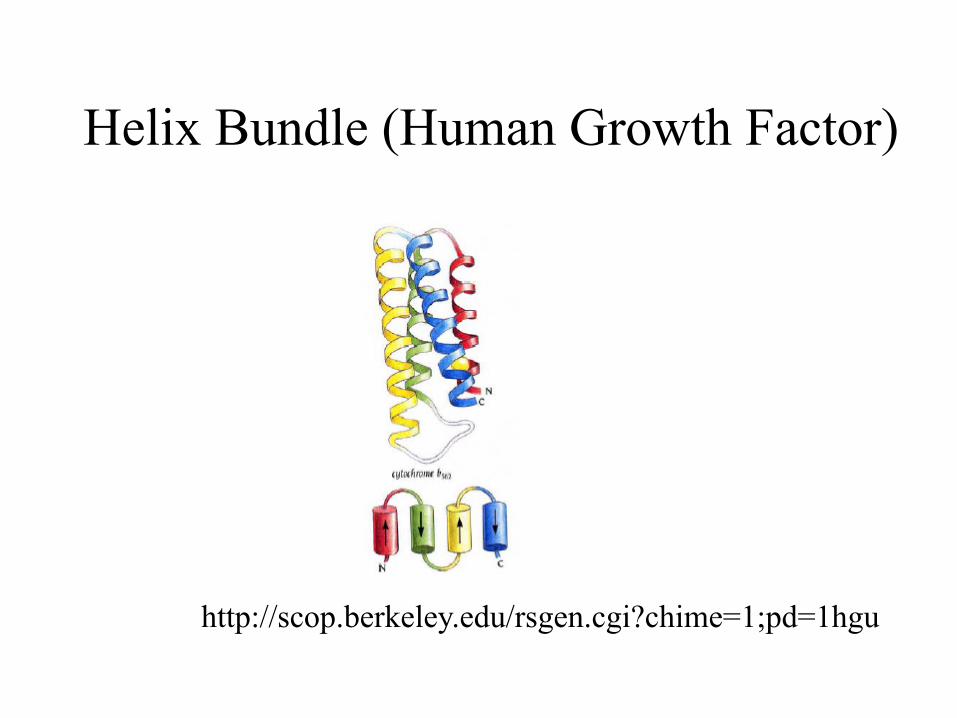
Helix Bundle (Human Growth Factor)
http://scop.berkeley.edu/rsgen.cgi?chime=1;pd=1hgu

Fold: Beta Barrel
http://scop.berkeley.edu/rsgen.cgi?chime=1;pd=1rbp
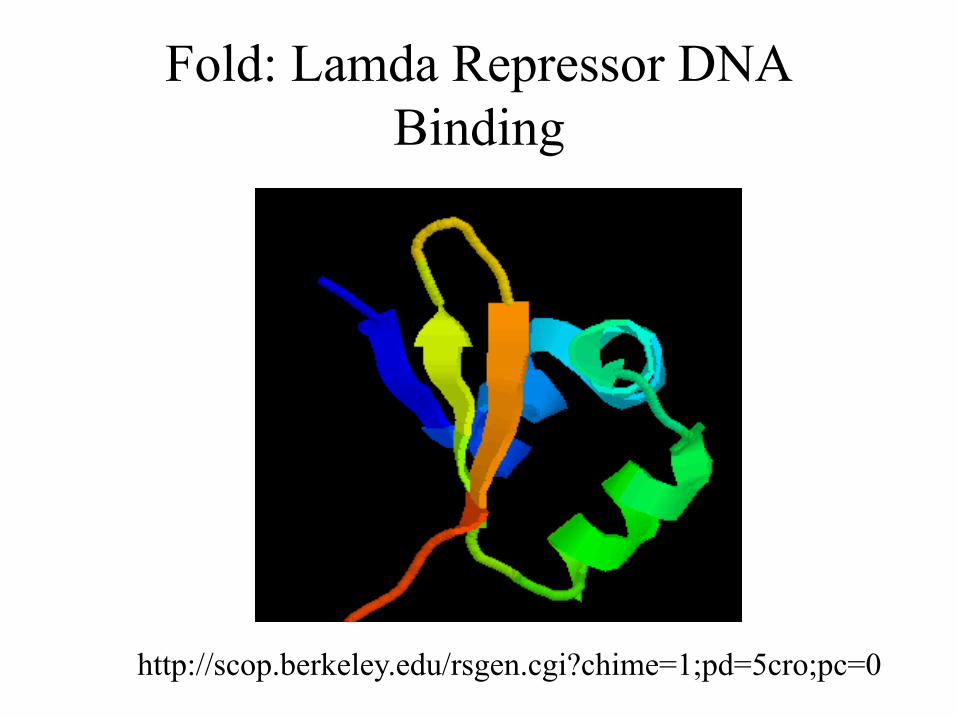
Fold: Lamda Repressor DNA Binding
http://scop.berkeley.edu/rsgen.cgi?chime=1;pd=5cro;pc=0
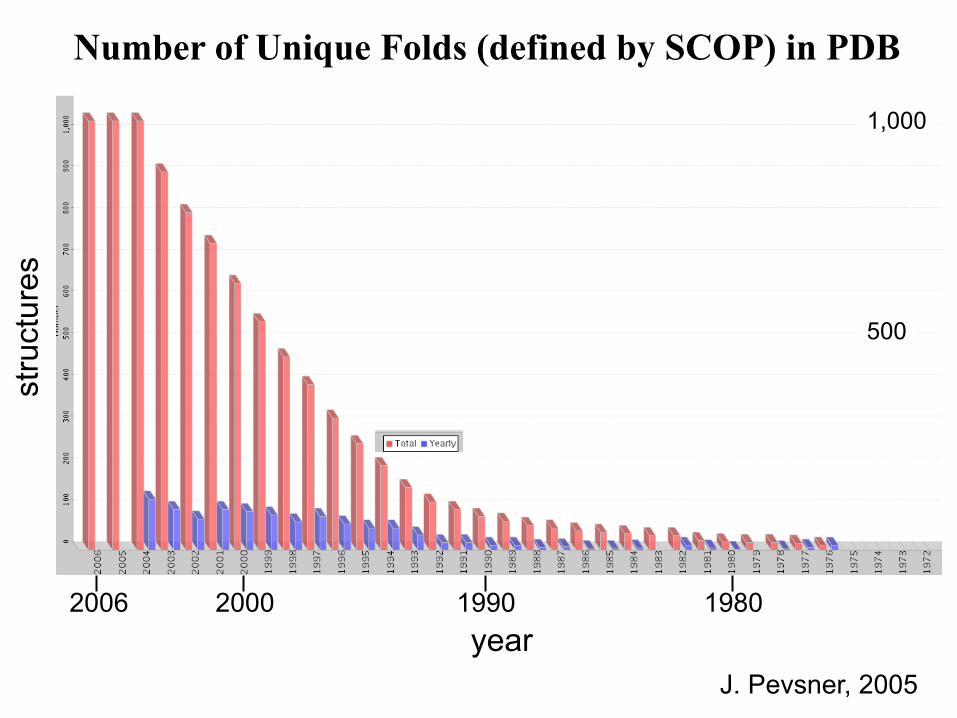
Number of Unique Folds (defined by SCOP) in PDB
year
stru
ctur
es
1,000
500
J. Pevsner, 2005
2006 2000 1990 1980

3D Structure Prediction • Ab-Initio Structure Prediction
• Template-Based Structure Prediction
Physical force field – protein folding Contact map - reconstruction
MWLKKFGINLLIGQSV…
……
Select structure with minimum free energy
MWLKKFGINKH…
Protein Data Bank
Fold
Recognition Alignment
Template
Simulation
Query protein
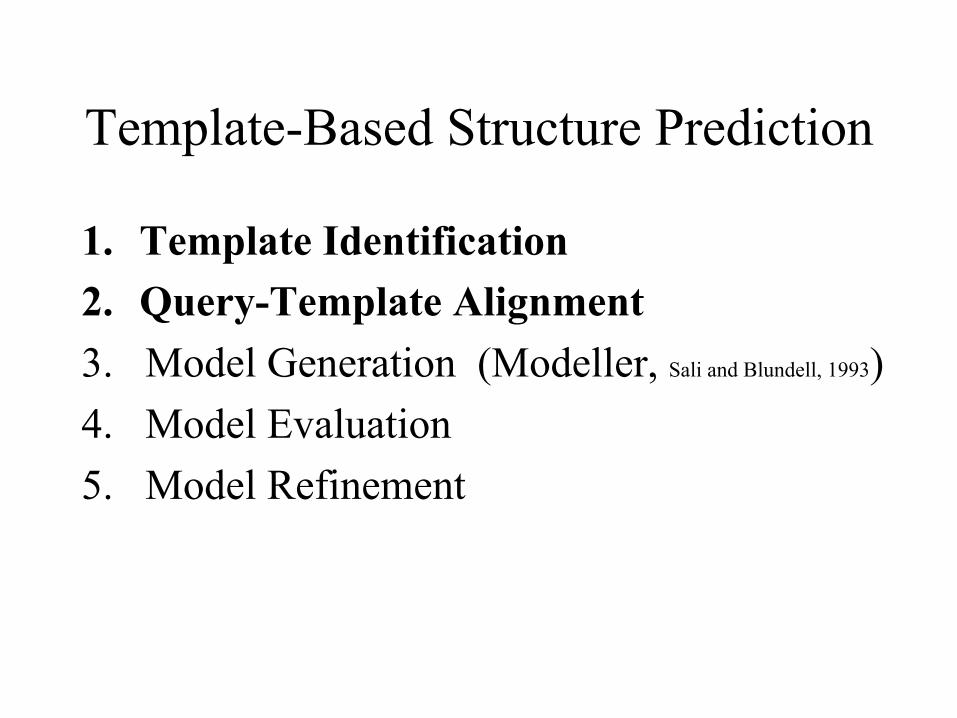
Template-Based Structure Prediction
1. Template Identification 2. Query-Template Alignment 3. Model Generation (Modeller, Sali and Blundell, 1993) 4. Model Evaluation 5. Model Refinement
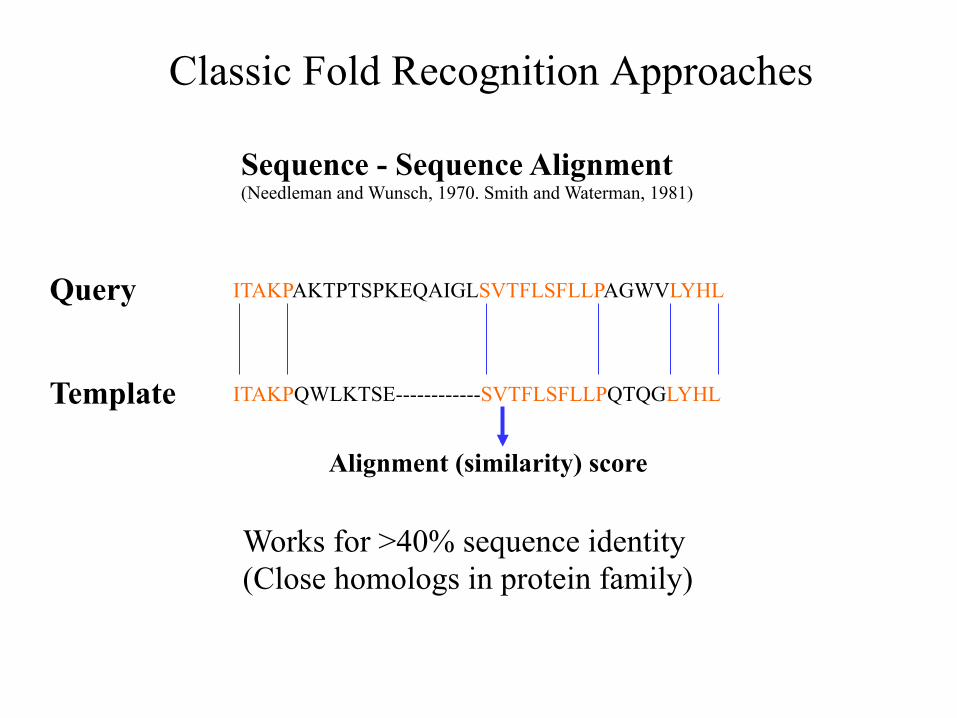
Classic Fold Recognition Approaches
Sequence - Sequence Alignment (Needleman and Wunsch, 1970. Smith and Waterman, 1981)
ITAKPAKTPTSPKEQAIGLSVTFLSFLLPAGWVLYHL
ITAKPQWLKTSE------------SVTFLSFLLPQTQGLYHL
Query
Template
Works for >40% sequence identity (Close homologs in protein family)
Alignment (similarity) score
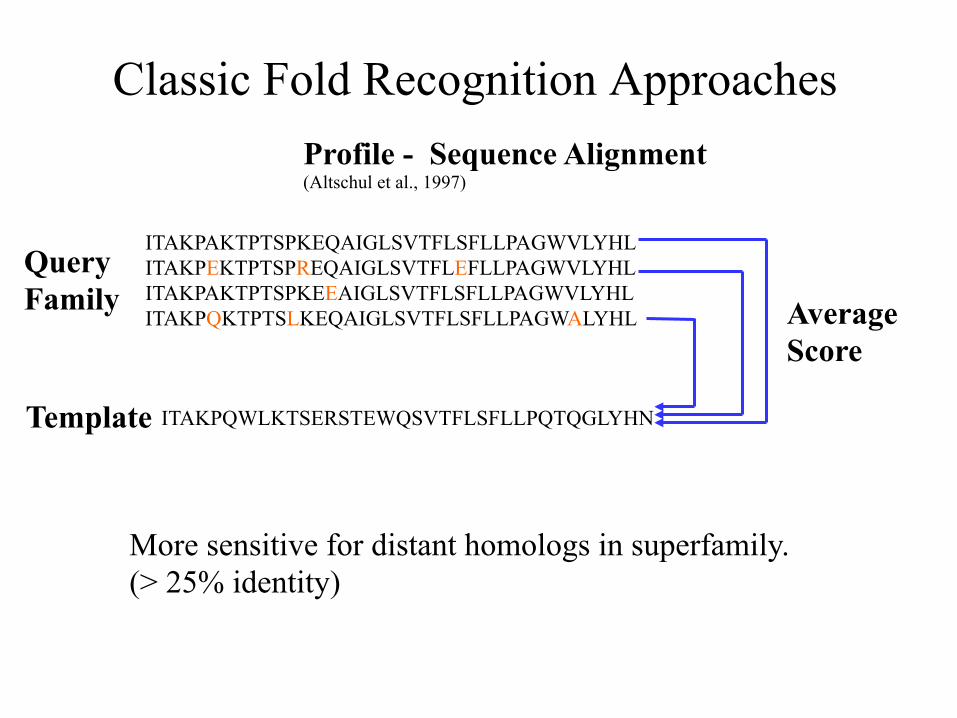
Classic Fold Recognition Approaches Profile - Sequence Alignment (Altschul et al., 1997)
ITAKPAKTPTSPKEQAIGLSVTFLSFLLPAGWVLYHL ITAKPEKTPTSPREQAIGLSVTFLEFLLPAGWVLYHL ITAKPAKTPTSPKEEAIGLSVTFLSFLLPAGWVLYHL ITAKPQKTPTSLKEQAIGLSVTFLSFLLPAGWALYHL
ITAKPQWLKTSERSTEWQSVTFLSFLLPQTQGLYHN
Query Family
Template
More sensitive for distant homologs in superfamily. (> 25% identity)
Average Score
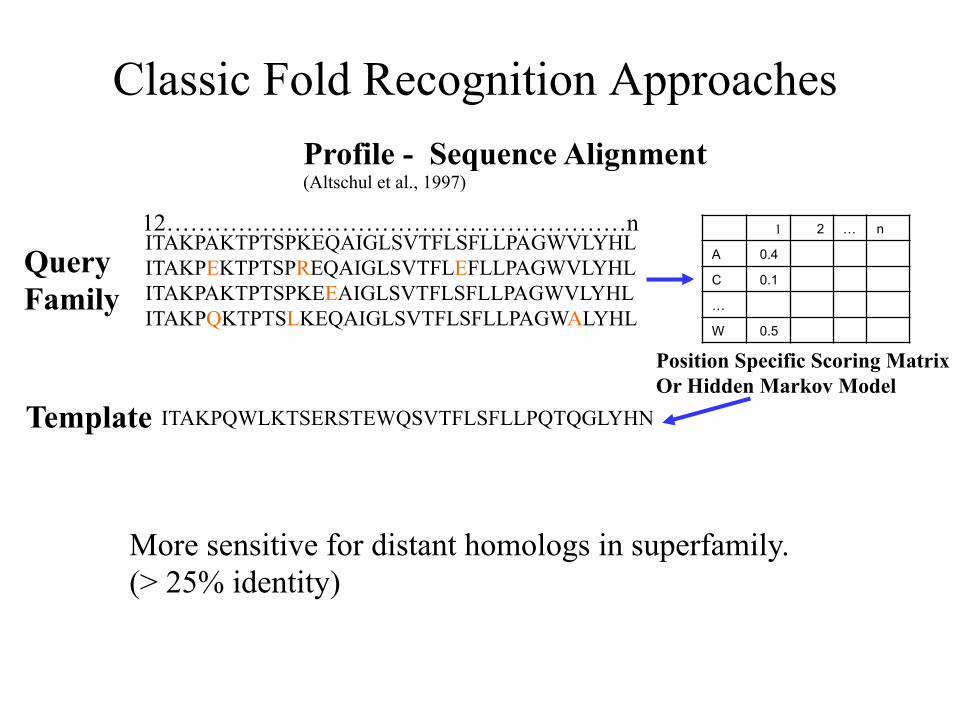
Classic Fold Recognition Approaches
ITAKPAKTPTSPKEQAIGLSVTFLSFLLPAGWVLYHL ITAKPEKTPTSPREQAIGLSVTFLEFLLPAGWVLYHL ITAKPAKTPTSPKEEAIGLSVTFLSFLLPAGWVLYHL ITAKPQKTPTSLKEQAIGLSVTFLSFLLPAGWALYHL
ITAKPQWLKTSERSTEWQSVTFLSFLLPQTQGLYHN
Query Family
Template
1 2 … n
A 0.4 C 0.1 … W 0.5
Position Specific Scoring Matrix Or Hidden Markov Model
More sensitive for distant homologs in superfamily. (> 25% identity)
12………………………………….………………n
Profile - Sequence Alignment (Altschul et al., 1997)
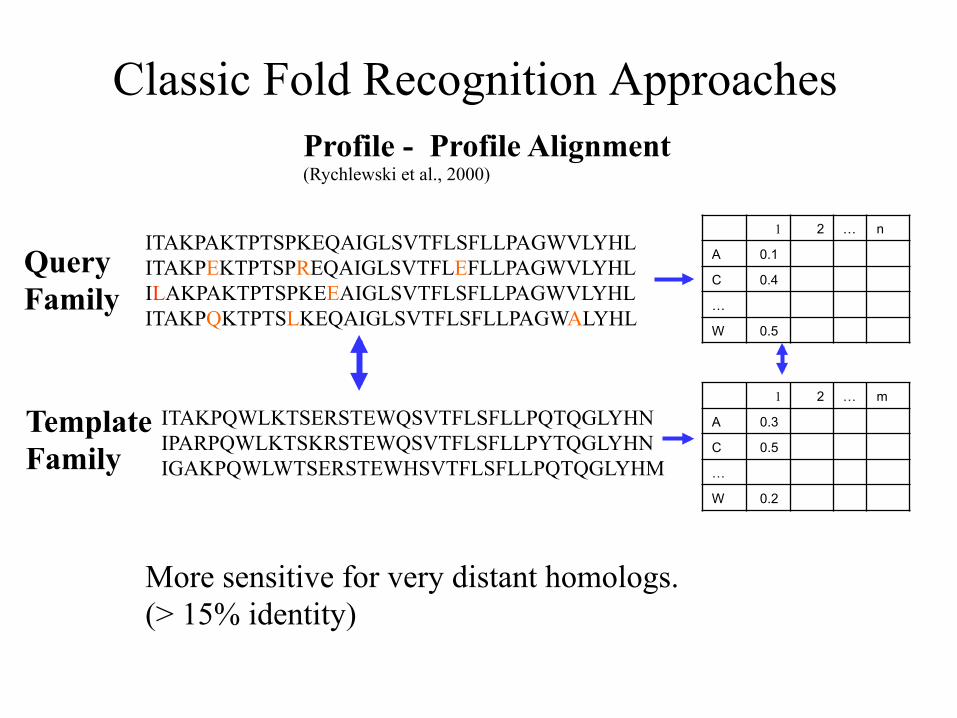
Classic Fold Recognition Approaches
1 2 … m
A 0.3 C 0.5 … W 0.2
Profile - Profile Alignment (Rychlewski et al., 2000)
ITAKPAKTPTSPKEQAIGLSVTFLSFLLPAGWVLYHL ITAKPEKTPTSPREQAIGLSVTFLEFLLPAGWVLYHL ILAKPAKTPTSPKEEAIGLSVTFLSFLLPAGWVLYHL ITAKPQKTPTSLKEQAIGLSVTFLSFLLPAGWALYHL
ITAKPQWLKTSERSTEWQSVTFLSFLLPQTQGLYHN IPARPQWLKTSKRSTEWQSVTFLSFLLPYTQGLYHN IGAKPQWLWTSERSTEWHSVTFLSFLLPQTQGLYHM
Query Family
Template Family
1 2 … n
A 0.1 C 0.4 … W 0.5
More sensitive for very distant homologs. (> 15% identity)

Classic Fold Recognition Approaches
MWLKKFGINLLIGQS….
Useful for recognizing similar folds without sequence similarity. (no evolutionary relationship)
Query
Template Structure
Fit Fitness Score
Sequence - Structure Alignment (Threading) (Bowie et al., 1991. Jones et al., 1992. Godzik, Skolnick, 1992. Lathrop, 1994)
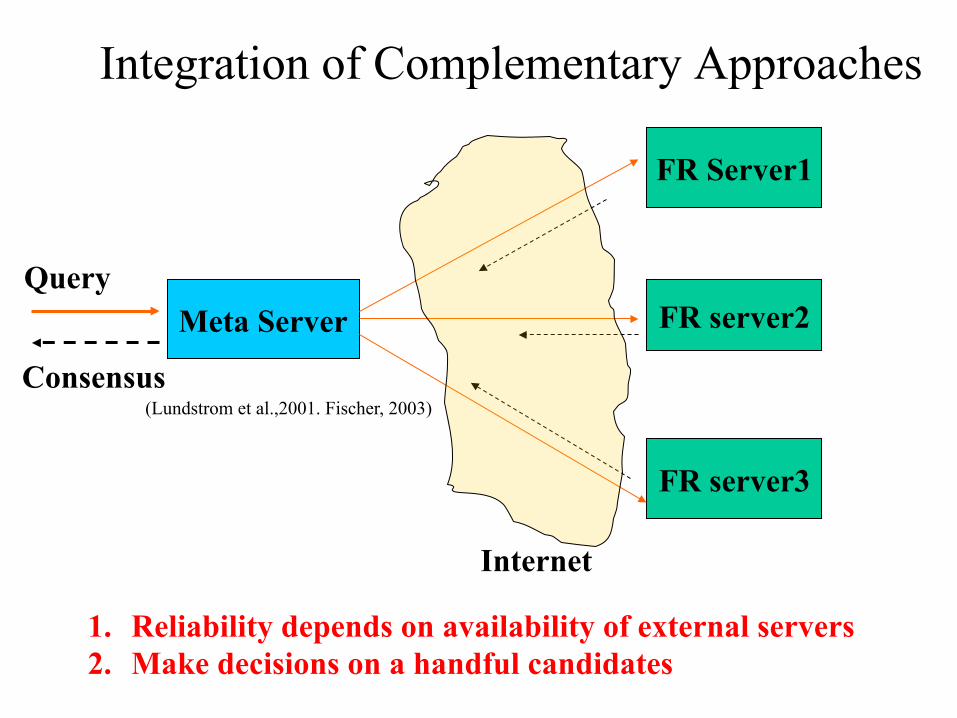
Integration of Complementary Approaches
Meta Server
FR Server1
FR server2
FR server3
Query
Internet
Consensus
1. Reliability depends on availability of external servers 2. Make decisions on a handful candidates
(Lundstrom et al.,2001. Fischer, 2003)
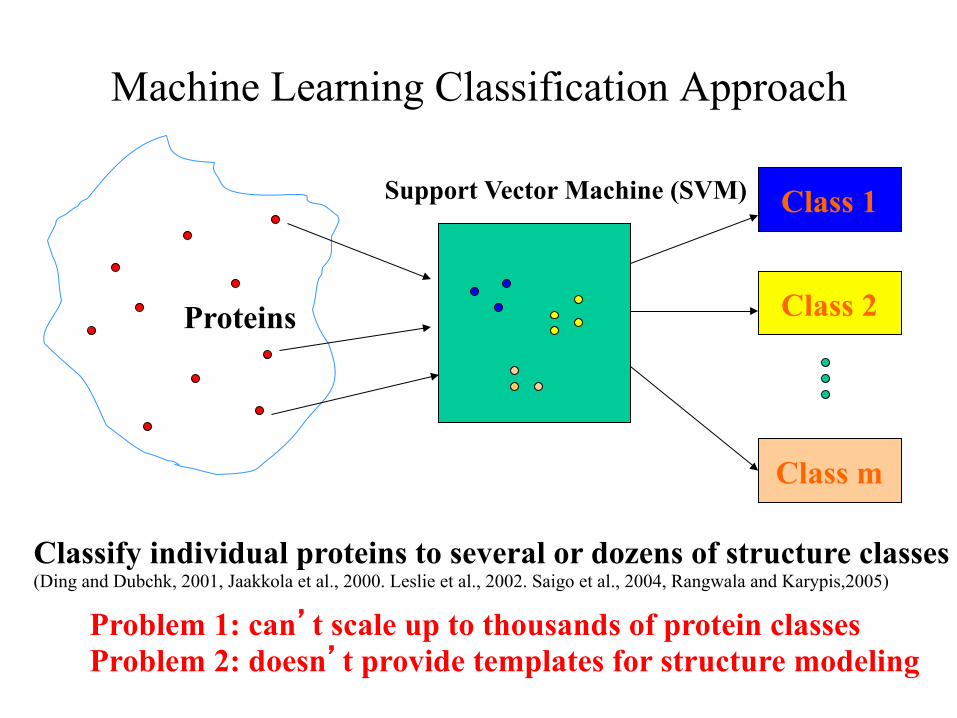
Machine Learning Classification Approach
Proteins
Class 1
Class 2
Class m
Classify individual proteins to several or dozens of structure classes (Ding and Dubchk, 2001, Jaakkola et al., 2000. Leslie et al., 2002. Saigo et al., 2004, Rangwala and Karypis,2005)
Problem 1: can’t scale up to thousands of protein classes Problem 2: doesn’t provide templates for structure modeling
Support Vector Machine (SVM)
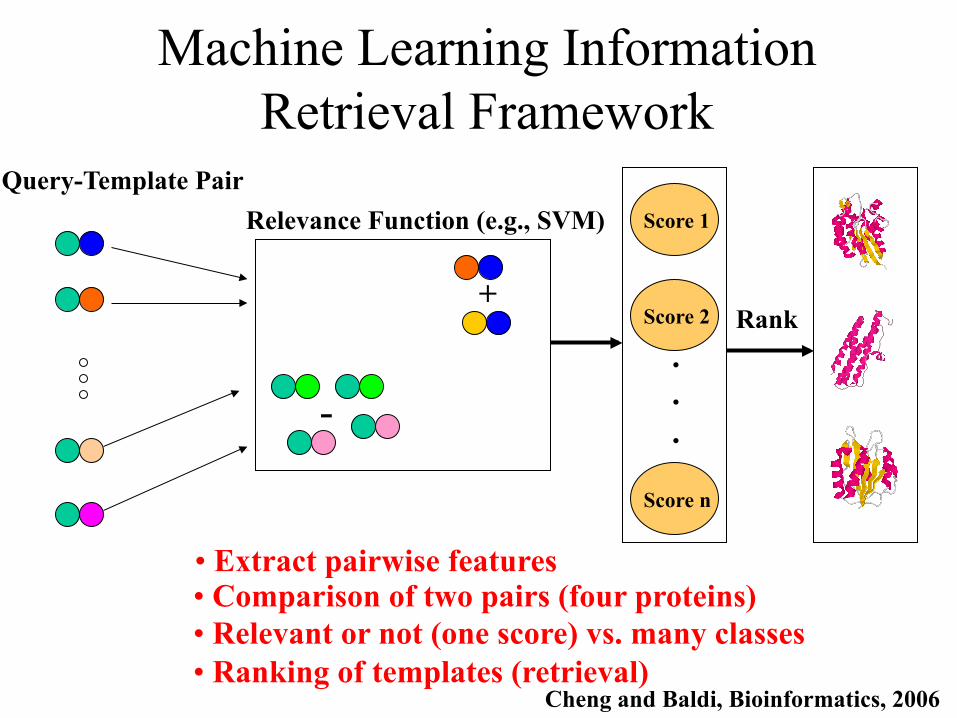
Machine Learning Information Retrieval Framework
Query-Template Pair
-
+
Score 1 Relevance Function (e.g., SVM)
• Extract pairwise features • Comparison of two pairs (four proteins) • Relevant or not (one score) vs. many classes • Ranking of templates (retrieval)
Score 2
Score n
Rank . . .
Cheng and Baldi, Bioinformatics, 2006
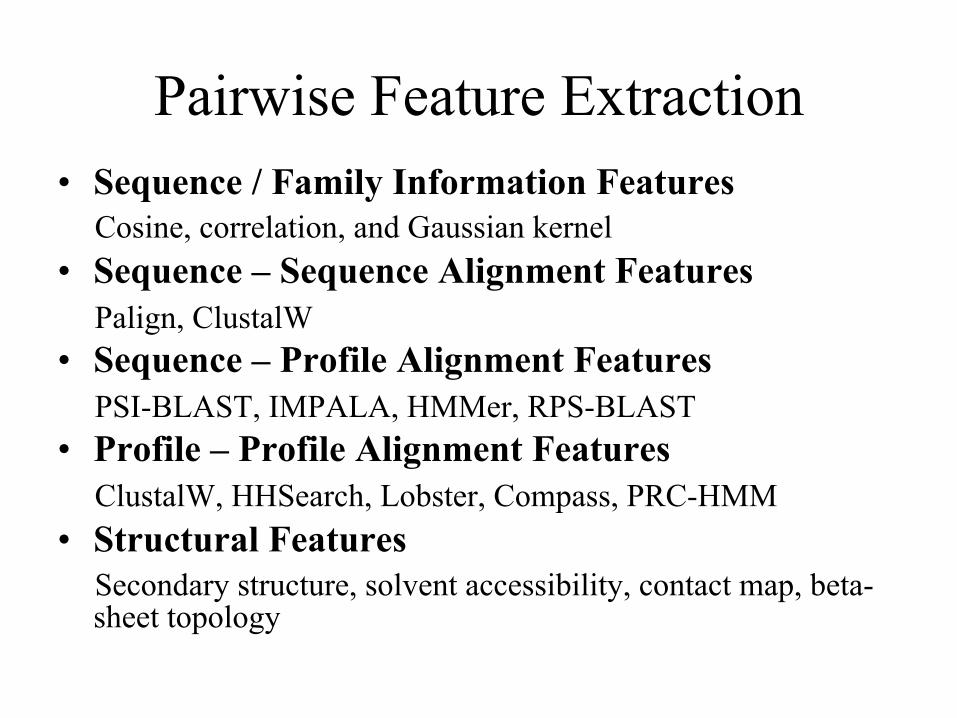
Pairwise Feature Extraction • Sequence / Family Information Features Cosine, correlation, and Gaussian kernel • Sequence – Sequence Alignment Features Palign, ClustalW • Sequence – Profile Alignment Features PSI-BLAST, IMPALA, HMMer, RPS-BLAST • Profile – Profile Alignment Features ClustalW, HHSearch, Lobster, Compass, PRC-HMM • Structural Features Secondary structure, solvent accessibility, contact map, beta-
sheet topology
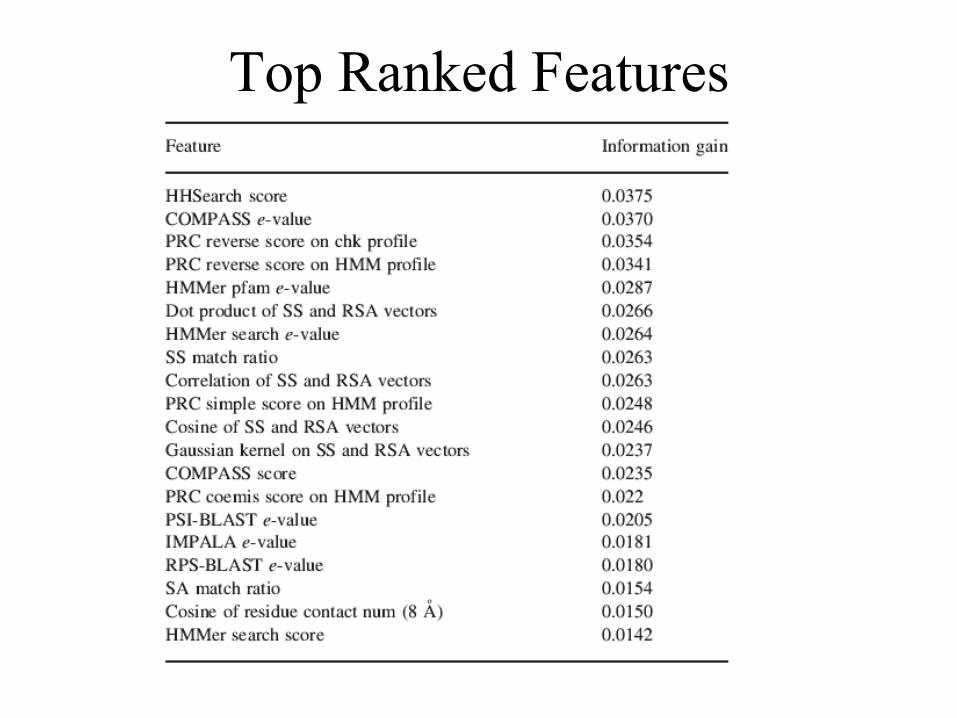
Top Ranked Features
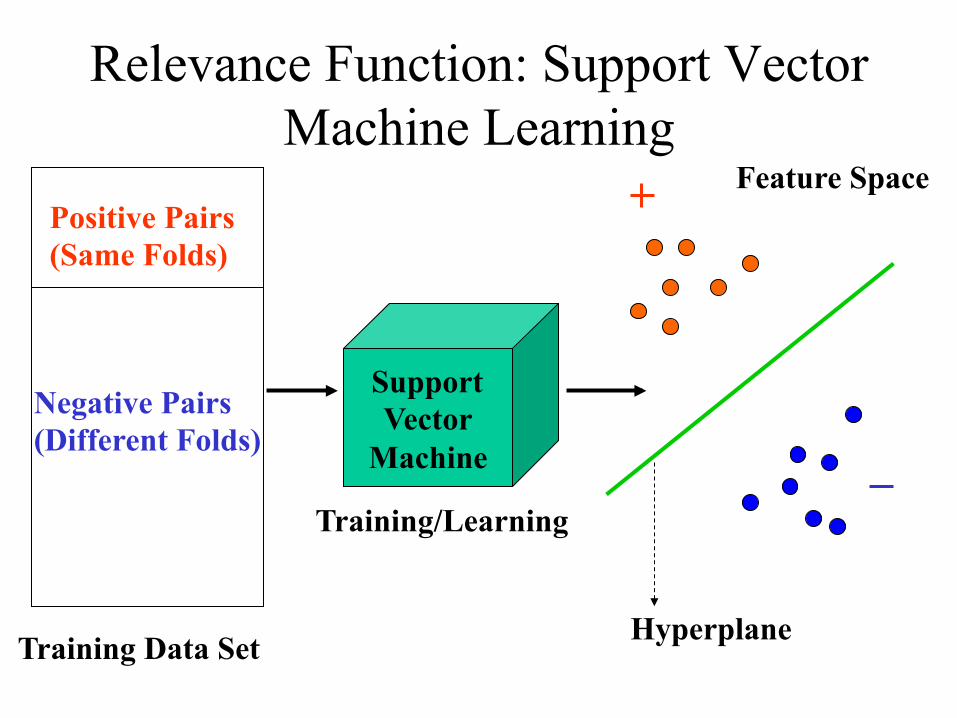
Relevance Function: Support Vector Machine Learning
Positive Pairs (Same Folds)
Negative Pairs (Different Folds)
Training/Learning
Support Vector
Machine
Training Data Set
Feature Space
Hyperplane
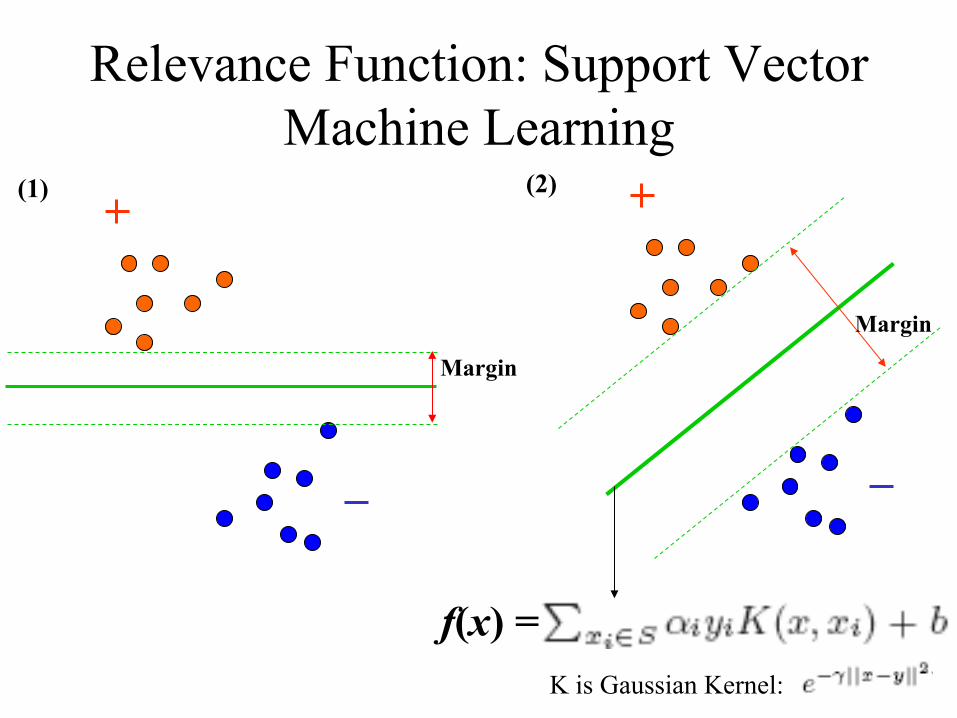
Relevance Function: Support Vector Machine Learning
f(x) = K is Gaussian Kernel:
Margin
Margin
(1) (2)
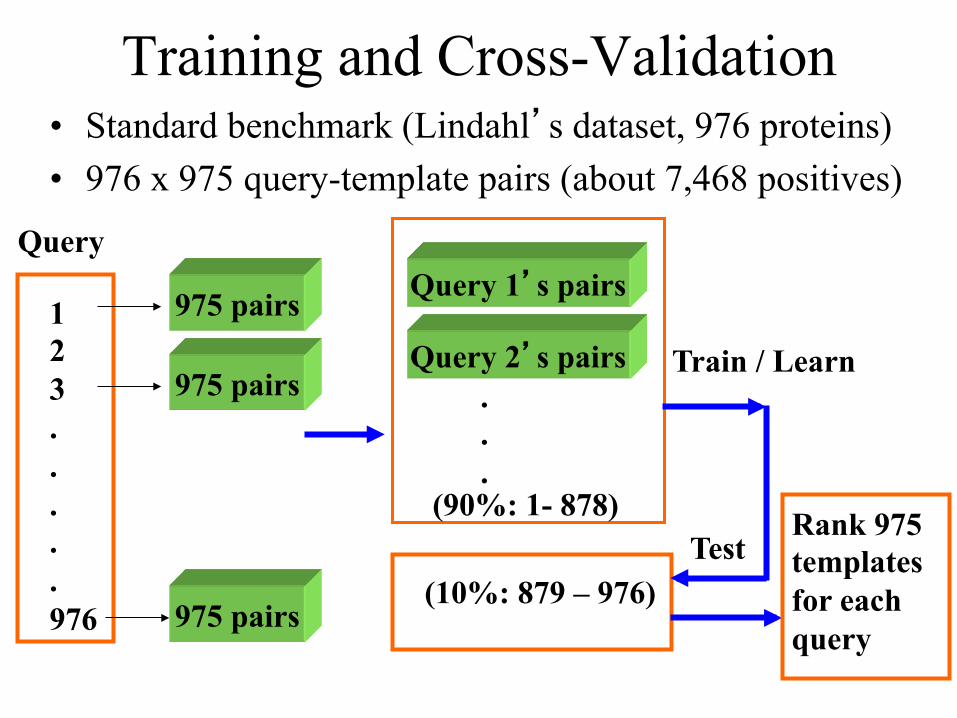
Training and Cross-Validation • Standard benchmark (Lindahl’s dataset, 976 proteins) • 976 x 975 query-template pairs (about 7,468 positives)
1 2 3 . . . . . 976
Query
975 pairs
975 pairs
Query 1’s pairs
.
.
.
Rank 975 templates for each query
975 pairs Query 2’s pairs
(90%: 1- 878)
(10%: 879 – 976)
Train / Learn
Test
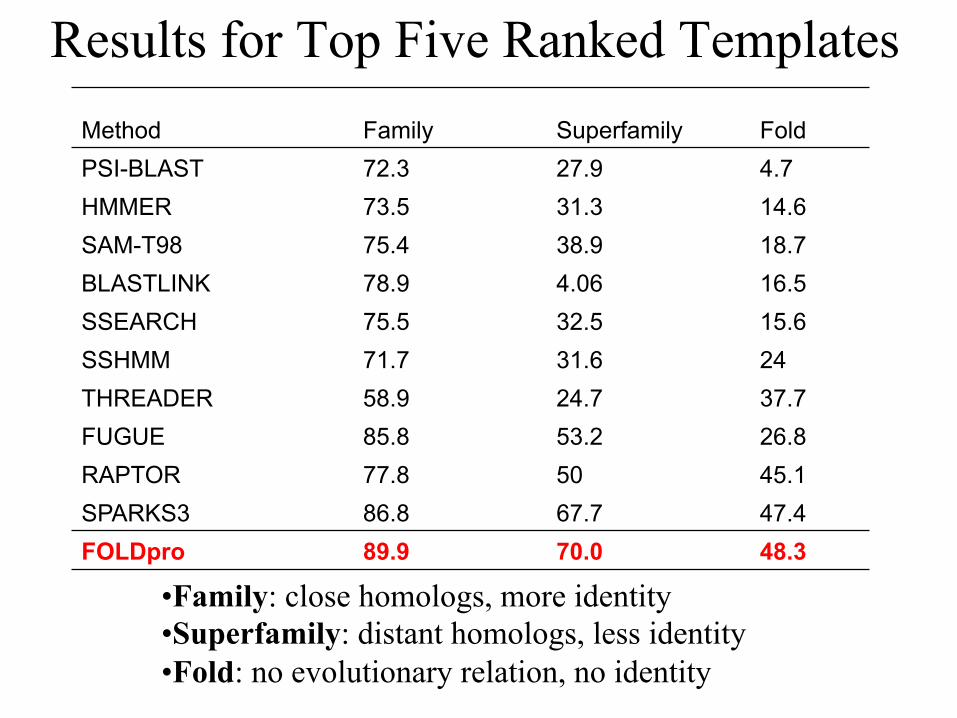
Results for Top Five Ranked Templates
• Family: close homologs, more identity • Superfamily: distant homologs, less identity • Fold: no evolutionary relation, no identity
Method Family Superfamily Fold PSI-BLAST 72.3 27.9 4.7 HMMER 73.5 31.3 14.6 SAM-T98 75.4 38.9 18.7 BLASTLINK 78.9 4.06 16.5 SSEARCH 75.5 32.5 15.6 SSHMM 71.7 31.6 24 THREADER 58.9 24.7 37.7 FUGUE 85.8 53.2 26.8 RAPTOR 77.8 50 45.1 SPARKS3 86.8 67.7 47.4 FOLDpro 89.9 70.0 48.3

Advantages of MLIR Framework • Integration, Accuracy, Extensibility • Simplicity, Completeness, Potentials
Disadvantages • Slower than some alignment methods
Challenge: analogous fold recognition using machine learning ranking techniques

A. Fisher, 2005
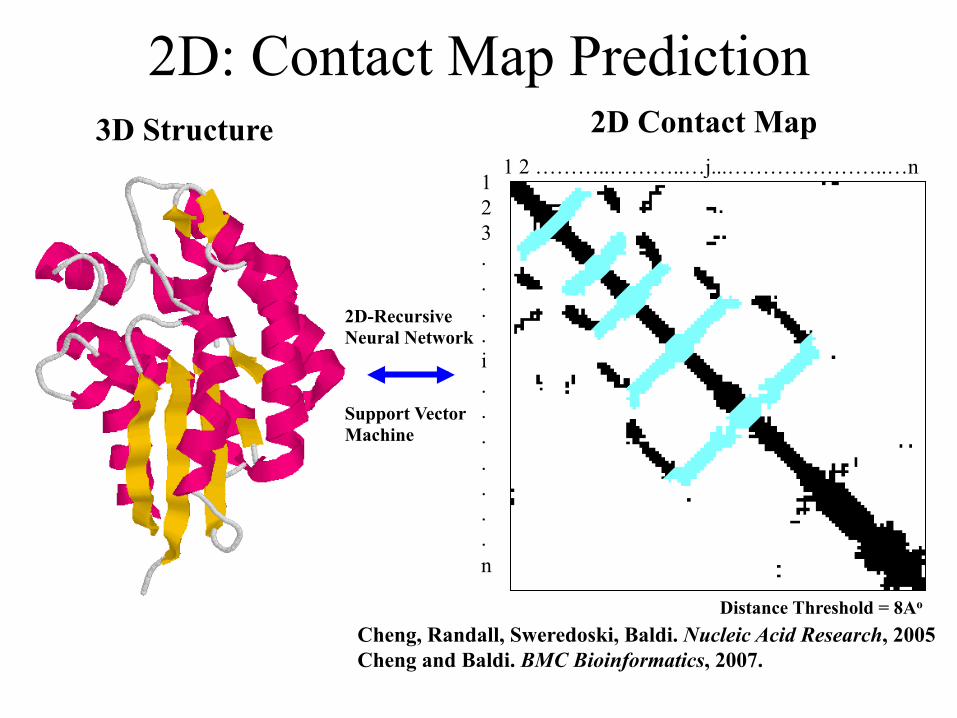
2D: Contact Map Prediction
1 2 ………..………..…j...…………………..…n 1 2 3 . . . . i . . . . . . . n
3D Structure 2D Contact Map
Cheng, Randall, Sweredoski, Baldi. Nucleic Acid Research, 2005 Cheng and Baldi. BMC Bioinformatics, 2007.
Distance Threshold = 8Ao
2D-Recursive Neural Network
Support Vector Machine
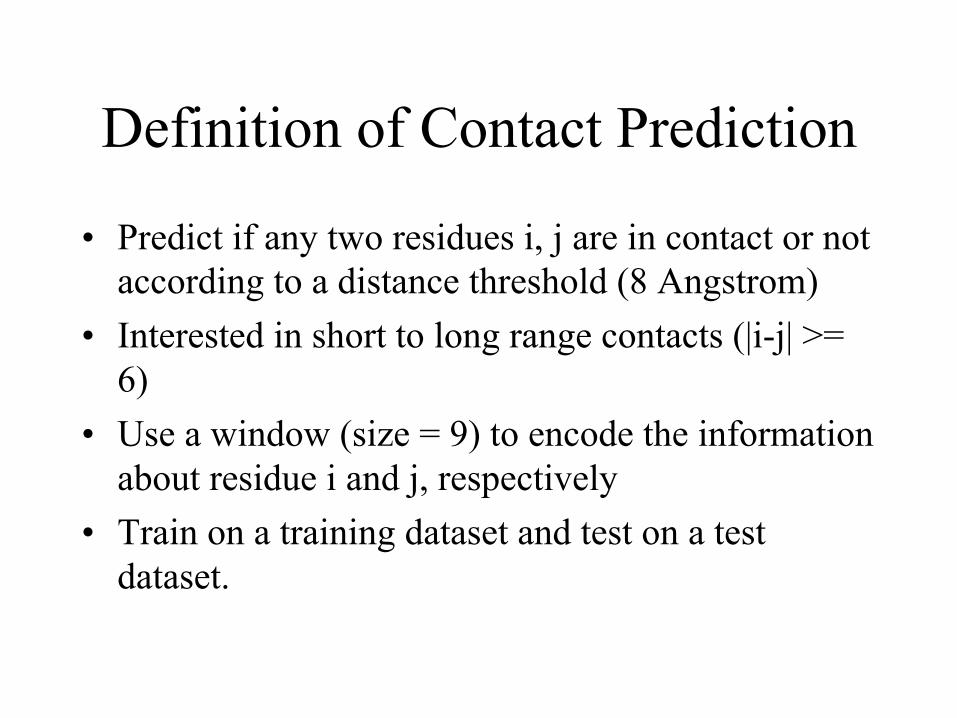
Definition of Contact Prediction
• Predict if any two residues i, j are in contact or not according to a distance threshold (8 Angstrom)
• Interested in short to long range contacts (|i-j| >= 6)
• Use a window (size = 9) to encode the information about residue i and j, respectively
• Train on a training dataset and test on a test dataset.

Feature Extraction
• Local window features (20 * 9 * 2) • Pairwise information feature (cosine,
correlation, mutual information) • Residue type feature (non-polar, polar,
acidic, and basic) • Central segment window features • Protein information features (global
composition, sequence length)
Kernel and Feature Selection
• Gaussion kernel seems to work well. However, we haven’t tested other kernels thoroughly
• Feature selection should be able to improve the performance. However, we haven’t conducted a thorough feature selection yet due to the limited computing power.
Results
• At break-even point, the sensitivity = specificity = 28%
• However, the accuracy varies according to the property of the individual proteins significantly.
• Contacts within beta-sheet is predicted with higher accuracy than that in alpha helices or between alpha helix and beta-sheet.
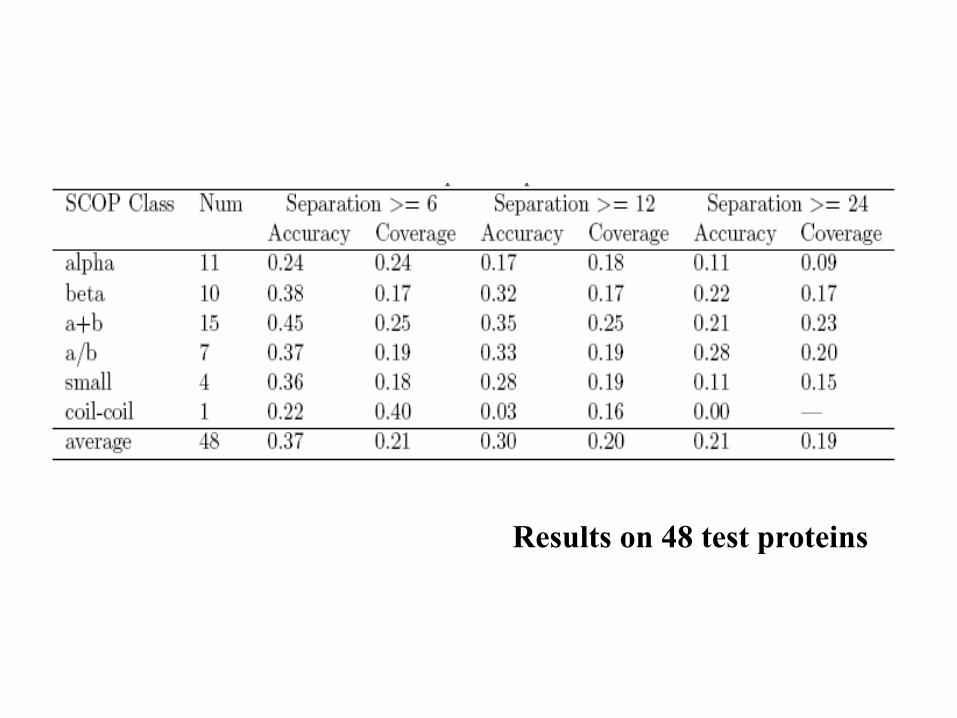
Results on 48 test proteins
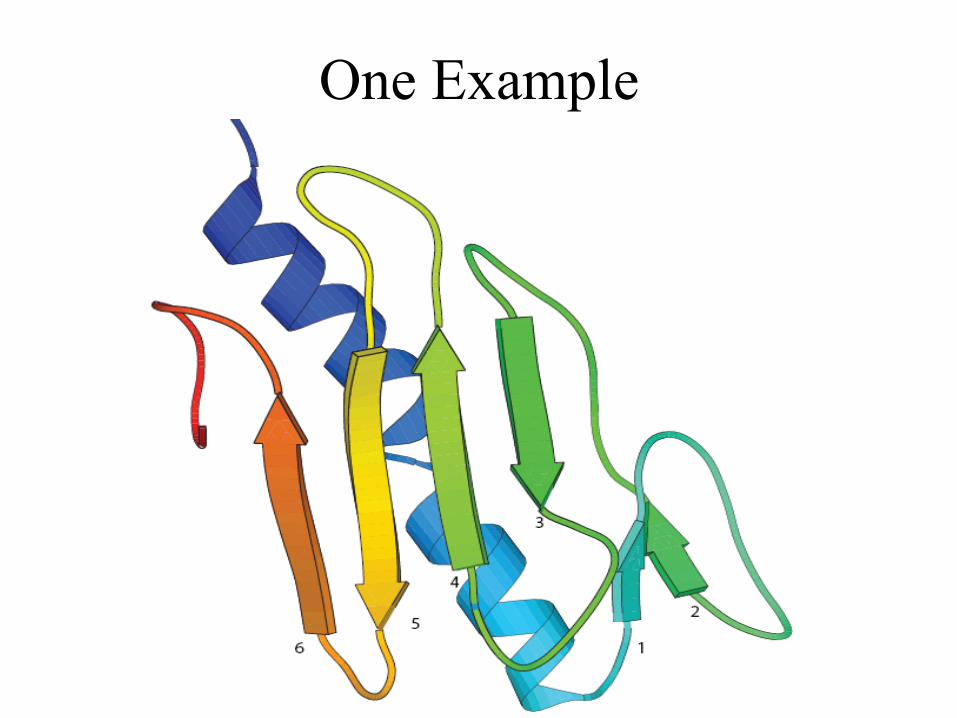
One Example
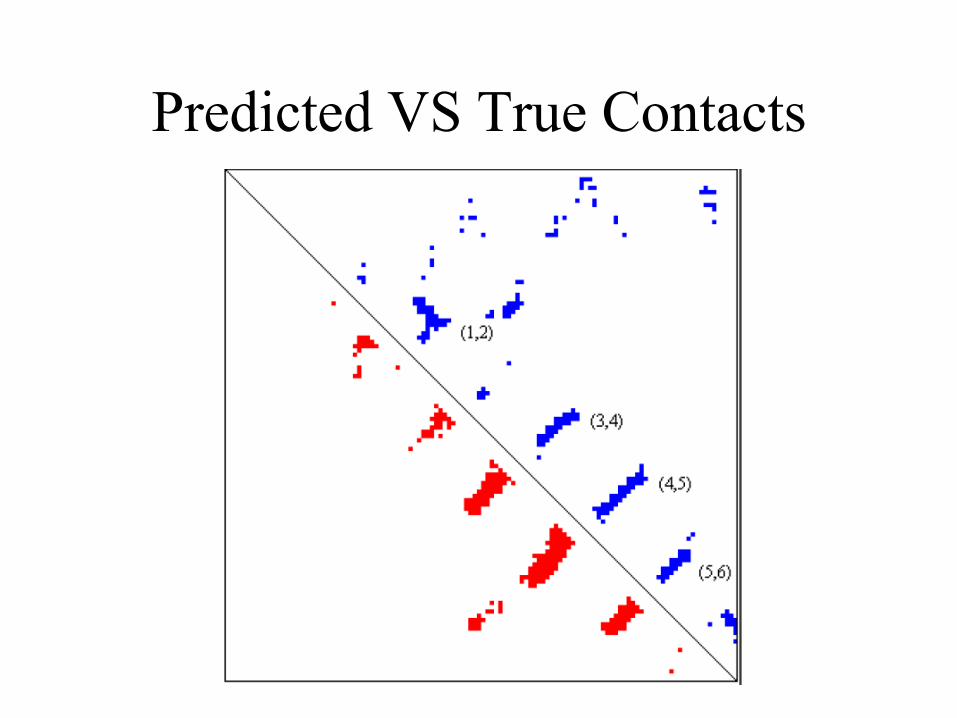
Predicted VS True Contacts
How to Use Contacts to Reconstruct 3D Structure
• 3D structure prediction problem can be defined as a constrained optimization problem.
• Generate a 3D structure with minimum free energy subject to contact restraints and intrinsic biophysical constraints such as bond length.
Optimization Techniques
• CONFOLD – distance geometry • Gradient Descent (Modeller) • Lattice Monte Carlo Sampling (TASSER) • Simulated Annealing (Rosetta) • Multi-Dimensional Scaling
Contact Prediction Software
• http://sysbio.rnet.missouri.edu/multicom_toolbox/tools.html (svmcon 1.0, source code and executable)
• Reference: J. Cheng and Baldi. Improved residue contact prediction using support vector machine and a large feature set. BMC Bioinformatics, 2007.