statistical inference, learning and models for big data
TRANSCRIPT

Statistical Inference, Learning and Models for Big Data
Nancy Reid
University of Toronto
October 16, 2015


Canadian Institute for Statistical Sciences
Pacific Institute for Mathematical Sciences
Centre de Recherches Mathématiques
Fields Institute for Resesarch in the Mathematical Sciences

Workshops• Opening Conference and Bootcamp Jan 9 – 23• Statistical Machine Learning Jan 26 – 30• Optimization and Matrix Methods Feb 9 – 11 • Visualization: Strategies and Principles Feb 23 – 27• Big Data in Health Policy Mar 23 – 27• Big Data for Social Policy Apr 13 – 16

And more
Distinguished Lecture Series in StatisticsTerry Speed, ANU, April 9 and 10Bin Yu, UC Berkeley, April 22 and 23
Coxeter Lecture SeriesMichael Jordan, UC Berkeley, April 7 – 9
Distinguished Public Lecture,Andrew Lo, MIT, March 25
Graduate CoursesStatistical Machine LearningTopics in Big Data
Industrial Problem Solving WorkshopMay 25 – 29
Fields Summer Undergraduate Research ProgramMay to August, 2015
Ruslan Salakhutdinov, Toronto
Mu Zhu, Waterloo

MDM 12 – Einat Gil et al.

Big Data – Big Topic
• Where to start?
• Look up some references
• Likelihood 78 m
• Statistical inference 7m

The Blogosphere

Big Data – Big Hype?Gartner Hype Cycle
July 2013
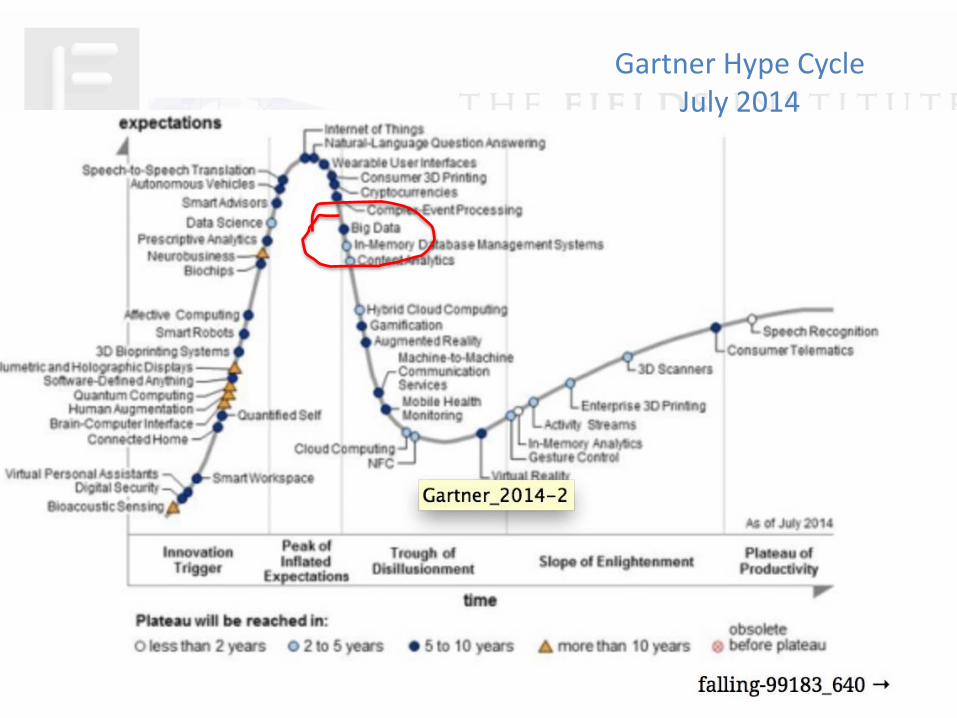
Gartner Hype CycleJuly 2014


The Blogosphere
I view “Big Data” as just the latest manifestation of a cycle that has been rolling along for quite a long time
Steve Marron, June 2013• Statistical Pattern Recognition• Artificial Intelligence• Neural Nets• Data Mining• Machine Learning
As each new field matured, there came a recognition that in fact much was to be gained by studying
connections to statistics

Big Data Types
• Data to confirm scientific hypotheses
• Data to explore new science
• Data generated by social activity – shopping, driving, phoning, watching TV, browsing, banking, …
• Data generated by sensor networks – smart cities
• Financial transaction data
• Government data – surveys, tax records, welfare rolls, …
• Public health data – health records, clinical trials, public health surveys
Jordan 06/2014

The Atlas experiment – CERN http://atlas.ch/what_is_atlas.html#5

If all the data from ATLAS were recorded, this would fill 100,000 CDs per second.
This would create a stack of CDs 450 feet high every second, which would reach to
the moon and back twice each year. The data rate is also equivalent to 50 billion
telephone calls at the same time. ATLAS actually only records a fraction of the data
(those that may show signs of new physics) and that rate is equivalent to
27 CDs per minute. http://atlas.ch/what_is_atlas.html - 5

Exploration: the Square Km Arrayhttps://www.skatelescope.org/location/
• The Square Kilometre Array (SKA) project is an international effort to build the world’s largest radio telescope, with a square kilometre (one million square metres) of collecting area.
• World leading scientists and engineers designing and developing a system which will require supercomputers faster than any in existence in 2013, and network technology that will generate more data traffic than the entire Internet.

Exploration: microarray


Social Activity


Big Data Structures
• Too much data: Large N• Bottleneck at processing
• Computation
• Estimates of precision
• Very complex data: small n, large p• New types of data: networks, images, …
• “Found” data: credit scoring, government records, …

“Big data” has arrived, but big insights have not

Highlights from the workshops
• Jan 9 – 23: Bootcamp
• Jan 26 – 30: Statistical Machine Learning
• Feb 9 – 11: Optimization and Matrix Methods
• Feb 23 – 27: Visualization: Strategies and Principles
• Mar 23 – 27: Health Policy
• April 13 – 16: Social Policy

Opening Conference and Bootcamp
• Overview– Robert Bell, ATT: “Big Data: it’s not the data”– Candes, Stanford: Reproducibility– Altman, Penn State: Generalizing PCA
• One day each: inference, environment, optimization, visualization, social policy, health policy, deep learning, networks
• Franke, Plante, et al. (2015): “A data analytic perspective on Big Data”, http://arxiv.org/abs/1509.02900

Big Data and Statistical Machine Learning
• Roger Grosse – Scaling up natural gradient by factorizing Fisher information
• Samy Bengio – The battle against the long tail
• Brendan Frey – The infinite genome project

Statistical Machine Learning
• Grosse, R. and Salakhutdinov, R. (2015). Scaling up natural gradient by factorizing Fisher information.
Proceedings of the 37th International Conference on Machine Learning.
• Markov Random Field is essentially an exponential family model:
• Restricted Boltzmann machine is a special case:

Statistical Machine Learning
• natural gradient ascent
• uses Fisher information as metric tensor
• Gaussian graphical model approximation to force sparse inverse
Girolami and Calderhead (2011); Amari (1987); Rao (1945)

Statistical Machine Learning
• Bengio, S. (2015). The battle against the long tail. slides

Statistical Machine Learning
“The rise of the machines”, Economist, May 9 2015

Optimization
• Wainwright – non-convex optimization
• example: regularized maximum likelihood
• lasso penalty is convex relaxation of
• many interesting penalties are non-convex
• optimization routines may not find global optimum

Wainwright and Loh
• distinction between statistical error
• and optimization error (iterates)

Wainwright and Loh
• a family of non-convex problems
• with constraints on the loss function (log-likelihood) and the regularizing function (penalty)
• conclusion: any local optimum will be close enough to the true value
• conclusion: can recover the true sparse vector under further conditions
Loh, P. and Wainwright, M. (2015). Regularized M-estimators with nonconvexity. J Machine Learning Res. 16, 559-616.
Loh, P. and Wainwright, M. (2014). Support recovery without incoherence. http://arxiv.org/abs/1412.5632

Visualization for Big DataStrategies and Principles
• data representation
• data exploration via filtering, sampling and aggregation
• visualization and cognition
• information visualization
• statistical modeling and software
• cognitive science and design

Visualization for Big Data: Strategies and Principles
Visualization February 23

Visualization for Big Data: Strategies and Principles
Visualization February 23
In addition to approaches such as search, query processing, and analysis, visualization techniques will also become critical across many stages of big data use--to obtain an initial assessment of data as well as through subsequent stages of scientific discovery.

Visualization for Big Data: Strategies and Principles
1983 1985

Visualization for Big Data: Strategies and Principles
2013 2009

Statistical Graphics
• convey the data clearly• focus on key features• easy to understand
• research in perception• aspects of cognitive science
• must turn ‘big data’ into small data
• Rstudio, R Markdown• ggplot2, ggvis, dplyr, tidyr, • cheatsheets
50
60
70
80
90
100
110
120
130
140
1970
1971
1972
1973
1974
1975
1976
1977
1978
1979
1980
1981
1982
1983
1984
1985
1986
1987
1988
1989
1990
1991
1992
1993
1994
1995
1996
1997
1998
1999
2000
2001
2002
2003
2004
2005
2006
2007
2008
2009
2010
2011
2012
2013
2014
year
ave
rag
e

Statistical Graphics
50
60
70
80
90
100
110
120
130
140
1970
1971
1972
1973
1974
1975
1976
1977
1978
1979
1980
1981
1982
1983
1984
1985
1986
1987
1988
1989
1990
1991
1992
1993
1994
1995
1996
1997
1998
1999
2000
2001
2002
2003
2004
2005
2006
2007
2008
2009
2010
2011
2012
2013
2014
year
ave
rag
e
honeyplot +
geom_line(aes(honey$year,honey$runmean),col = "green",size=1.5) +
geom_point(aes(honey$year,honey$average),) +
scale_x_continuous(breaks=1970:2014) +
geom_smooth(method="loess",span=.75,se=F) +
scale_y_continuous(breaks=seq(0,140,by=10)) +
theme(axis.text.x = element_text(angle=45))

Information Visualization
• http://www.infovis.org
• a process of transforming information into visual form
• relies on the visual system to perceive and process the information
• http://ieeevis.org/
• involves the design of visual data representations and interaction techniques

Highlights
• Sheelagh Carpendale: info-viz
http://innovis.cpsc.ucalgary.ca/
• representation
• presentation
• interaction
• Example: Edge Maps web page

Highlights
• Katy Borner: scientific visualization
• advances understanding or provides solutions for real-world problems
• impacts a particular application
• http://scimaps.org/

Highlights

Highlights
• Alex Gonçalves: Visualization for the masses
• to build communion
• for social change
• powerful stories
• “duty of beauty”http://www.nytimes.com/newsgraphics/2014/02/14/fashion-week-editors-picks/

Big Data for Health Policy
• Pragmatic clinical trials
– Patrick Heagerty, Fred Hutchison
• Linking health and other social data-bases
– Thérèse Stukel, ICES
• Privacy


Heagerty – Pragmatic Clinical Trials
Lisa Lix, U Manitoba

Heagerty – Pragmatic Clinical Trials
Lisa Lix, U Manitoba

Big Data for Social Policy

Privacy
• anonymization/de-identification “HIPAA rules”– privacy commissioner of Ontario: – “Big Data and Innovation, Setting the record straight: De-
identification does work”– Narayanan & Felten (July 2014) “No silver bullet: De-
identification still doesn’t work”
• multi-party communication (Andrew Lo, MIT)
• statistical disclosure limitation and differential privacySlavkovic, A. -- Differentially Private Exponential Random Graph Models and Synthetic Networks

Privacy
• Statistical Disclosure Limitation – released data is typically counts, or magnitudes, cross-classified by
various characteristics – gender, age, region, …– an item is sensitive if its publication allows estimation of another value
of the entity too precisely– rules designed to prohibit release of data in cells at ‘too much’ risk,
and prohibit release of data in other cells to prevent reconstruction of sensitive items – Cell Suppression
• computer science -- privacy-preserving data-mining; multi-party computation, differential privacy
• theoretical work on differential privacy has yielded solutions for function approximation, statistical analysis, data-mining, and sanitized databases
• it remains to see how these theoretical results might influence the practices of government agencies and private enterprise

What did we learn?
1. Statistical models are complex, high-dimensional– regularization to induce sparsity– sparsity assumed or imposed– layered architecture complex graphical models– dimension reduction PCA, ICA, etc.– ensemble methods aggregation of predictions
2. Computational challenges include size and speed– ideas of statistical inference get lost in the machine
3. Data owners understand 2., but not 1.
4. Data science may be the best way to combine these

Gartner Hype CycleJuly 2014

https://etechlib.wordpress.com/tag/hype-cycle/
“Citizen Data Science”July 2015

What did I learn?
• Big Data is real, and here to stay
• Big Data often quickly becomes small– by making models more and more complex
– by looking for the very rare/extreme points
– through visualization
• Big Insights build on old ideas– planning of studies, bias, variance, inference
• Big Data is a Big Opportunity

A few resources
• Franke, Plante et al. (2015). Statistical inference, learning and models in big data.
• http://arxiv.org/abs/1509.02900
• Talks from the closing workshop
for the Big Data program
• data science programs: U Michigan, Beijing, Johns Hopkins, UC Berkeley, Columbia, NYU, Dalhousie, UBC, U Toronto, …

A haphazard web walk
Khoury & Ioannidis“Big Data Meets Public Health”
Ruths & Pfeffer“Social media for large studies of behaviour”
McGill Newsroom re Ruths & Pfeffer“Social media data pose pitfalls for studying behaviour”
Science, 28.11.2014

A haphazard web walk
Graphic Detail (The Economist) “A new chart or map every working day”October 14: The shrinking malaria map
Data Points (Nathan Yau) “Visualization that means something”
“The Best Data Visualization Projects of 2014” http://flowingdata.com/2014/12/19/the-best-data-visualization-projects-of-2014-2/?utm_source=dlvr.it&utm_medium=twitter

A haphazard web walk
Big data Music Industry http://venturebeat.com/2014/12/18/how-big-data-can-change-the-music-industry/
The problem with big data http://www.scmagazine.com/the-problem-with-big-data/article/388691/
Open models http://radar.oreilly.com/2014/11/we-need-open-models-not-just-open-data.html
Katy Borner’s exhibit http://scimaps.org
David Donoho on Data Science