state street corp stt ar
TRANSCRIPT

08-STT00870208© 2008 STATE STREET CORPORATION
State Street Corporation
State Street Financial Center
One Lincoln Street
Boston, Massachusetts 02111-2900
+1 617 786 3000
www.statestreet.com
State Street Corporation
2007 Annual Report to Shareholders
200730%
Cert no. SW-COC-002514
08-STT0087_10KCoverWrap_2007_FIN.qxd:10-K COVER MECH 3/6/08 2:15 PM Page 2

To Our Shareholders
Ronald E. LogueChairman and
Chief Executive Officer
08-STT0087_10KCoverWrap_2007_FIN.qxd:10-K COVER MECH 3/4/08 3:36 PM Page 4
Introduction
Overall, 2007 was another strong year for State Street and one that demonstrated the continuedvalue of our focus on meeting the needs of global institutional investors.
The year, however, was not without its challenges. I believe that the best way to evaluate thestrength of a company is to judge its performance not only when conditions are favorable, but alsoduring times of adversity. At State Street, we face up to difficulty by sticking to the values that are atthe core of our company. These values are reflected in the four constituencies we serve: ourshareholders, our customers, our employees and our community. With each of these constituencies ouractions are guided by one principle—doing what is right. For this reason we are open and transparentwith our shareholders and fair to our customers. It is why we judge the performance of our employeesfairly, and give back to the communities in which we live and work.
During 2007, unprecedented conditions within the financial markets presented many challenges forour industry. I am pleased to report that despite these issues, our core businesses grew considerably in2007. We added new customers, expanded relationships with existing customers, grew market share, andextended our range of capabilities and services. Our acquisition in July of Investors Financial ServicesCorp. (Investors Financial), the largest acquisition in State Street’s history, also complemented thisgrowth.
This success is not to say that State Street was untouched by the volatility created by the creditcrisis. A small number of our actively managed fixed-income strategies were adversely impacted byexposure to, and the lack of liquidity in, sub-prime mortgage markets.
We recorded a net after-tax charge of $279 million in the fourth quarter to establish a reserve toaddress legal exposure associated with the underperformance of these strategies and, just asimportantly, to appropriately address customer concerns. We also made a number of changes to theinvestment teams to address the underperformance and to help prevent the recurrence of any similarevents in the future.
In addition, we addressed market-wide concerns about asset-backed commercial paper conduits byproviding investors with comprehensive information that highlighted the significant differences betweenour conduits and those that had triggered problems for many other banks.
Let me now outline our performance in 2007 across a number of key areas:
Performance Against Our Goals
We began the year with the objectives of growing operating earnings per share by 10 to 15 percent;growing operating revenue by 8 percent to 12 percent; and achieving operating return on equity of 14to 17 percent. I am pleased to report that State Street exceeded its financial goals for 2007, excludingthe merger and integration costs related to the Investors Financial acquisition, the fourth-quartercharge related to our active fixed-income strategies and, for 2006, excluding the tax adjustments. Wewere rewarded by a 20 percent annual gain in our stock price, well above the 3.5 percent rise in theStandard & Poor’s 500 Index through December 31, 2007.
Contributing to this result was sustained momentum in our core business in 2007, resulting indouble-digit increases in nearly every revenue item on our income statement. On an operating basis,after excluding the impact of the fourth quarter charge, the merger and integration costs associatedwith the Investors Financial acquisition and the impact of the tax adjustments in 2006, State Streetearned $4.57 per share on net income of $1.669 billion in 2007, up 32 percent compared to $3.46 pershare from continuing operations in 2006. Revenue for the year increased 32 percent to a record$8.394 billion. Operating return on shareholders’ equity was 17.7 percent, up from 17.1 percent in 2006.
We achieved our 30th consecutive year of growth in operating earnings per share and our dividendgrew for the 29th consecutive year as we increased our per share fourth-quarter dividend in 2007 to 23cents, up 10 percent from 2006. We also achieved positive operating leverage on an annual basis for thethird consecutive year.
We ended 2007 with $15.3 trillion in assets under custody, a 29 percent gain over the previousyear. Assets under management were $1.98 trillion at the end of 2007, up 13 percent from 2006.Servicing fees increased in 2007, growing 24 percent from 2006, and management fees were up by21 percent from the prior year. Foreign exchange revenue in 2007 increased 31 percent and securitiesfinance revenue increased 76 percent from 2006.
Our net interest margin improved significantly to 171 basis points, an increase from 125 basispoints in 2006. This performance continues the upward trend that began when we centralized ourtreasury function in early 2005.
Increasing its footprint, State Street Global Advisors (SSgA) accounted for 22 percent of thecompany’s pre-tax profit in 2007, excluding the fourth quarter charge, an increase of more than fivetimes in five years from just over 4 percent in 2002. SSgA also recorded a pre-tax margin of 36 percenton an operating basis, up from 12 percent in 2002.
Growing Globally for our Customers
State Street enhanced its global market position and capabilities for its customers in 2007. Threesignificant acquisitions fueled this achievement. In March, we acquired Currenex, a New York-basedonline foreign exchange trading platform, enabling us to address the needs of traders who view cash asan asset class and require high-speed, streaming prices to execute their investment strategies. Julymarked the completion of our acquisition of Investors Financial, which strengthened our leadership inhigh-growth areas for our customers, including servicing for alternative investments, and offshore andcollective funds. The consolidation of Investors Financial is exceeding our expectations. The companycontributed $462 million of fully taxable-equivalent revenue to State Street in the second half of 2007,and we continue to convert customers, confident we will achieve our goal of 90 percent revenueretention. During the year, we financed this acquisition through the issuance of approximately61 million shares of our common stock. In association with the acquisition, we initiated a $1 billionaccelerated share repurchase program that we just completed in January 2008. The dilutive impact toour bottom line was $(.06) per share in 2007, well below our original expectation of $(0.14) per sharedilutive. Given this encouraging performance, we now anticipate the acquisition to be slightly accretiveto earnings in 2008.
We also acquired Palmeri Fund Administrators, a New Jersey-based specialist in private equityfund administration that complements the capabilities we acquired from Investors Financial and enablesus to provide customers with a comprehensive servicing platform.
Building a strong growth company means working harder to find new opportunities in the globalmarketplace. In the major geographic regions of Europe and Asia-Pacific, we are growing faster thanthe market itself. In 2007, our non-US business accounted for 41 percent of State Street’s totalrevenue, up from 39 percent in 2006, the latter on a pro-forma basis assuming adjustment for theInvestors Financial acquisition. At the end of 2007, more than 35 percent of our workforce, or about10,000 employees, worked outside the United States.
Revenue in the Asia-Pacific region, where we employ about 2,400 employees, reached $906 millionin 2007, up from $669 million in 2006. Our long-standing presence in the region, where we celebratedour 25th year in Hong Kong in 2007, helped us win customers like the Bank of China, which selectedState Street to provide custody, fund accounting, performance measurement and compliance reportingfor the foreign currency assets of China Life Insurance Company Limited. This win represented thefirst-ever offshore insurance investment fund awarded as a jointly serviced mandate in mainland China.In Sydney, we were appointed to provide investment services for AU$12 billion in assets for theWorkers Compensation Nominal Insurer of New South Wales, Australia.
Revenue in Europe, the United Kingdom and the Middle East, where we employ just under 6,400employees, grew to $2.2 billion in 2007, up from $1.8 billion in 2006. Among the mandates originatingin Europe in 2007, State Street expanded its relationship with Paternoster, the London-based insurancespecialist that purchases and manages pension assets, representing a trend in pension defeasance that
we believe creates a servicing opportunity for us. We were also appointed to manage more than£330 million in assets for the British Airport Authority Pension Trust and were chosen to provide arange of investment services for A620 million in pension fund assets for Royal Cosun, a leading foodproducer in the Netherlands. SSgA also achieved significant growth in Europe. At the end of 2007,approximately 22 percent or $427 billion of SSgA’s assets under management originated in Europe andthe United Kingdom, compared with $76 billion or 10 percent of assets under management in 2002.During the year, we also expanded our operations into Eastern Europe by opening an office in Krakow,Poland.
As we expand globally we continue to grow our market share in North America. In July, NewYork-based Baron Funds tapped State Street to provide custody and fund accounting for approximately$18 billion in assets in its US mutual funds. Earlier in the year, Putnam Investments appointed StateStreet to provide custody, fund accounting and investment manager operations outsourcing services formore than $169 billion in assets.
Our Commitment to Our Communities and Our People
As I described earlier, giving back to the communities where we live and work is core to ourvalues. Through the efforts of the State Street Foundation, more State Street employees participated inmore community projects in more parts of the world than ever before. In 2007, more than 7,100employees volunteered more than 52,000 hours of their time—up from just over 6,700 volunteers and43,900 hours in 2006.
Our employees were generous not only with their time, but with their donations as well. StateStreet employees pledged more than $3 million for the United Way, which in combination with acorporate contribution resulted in a donation in excess of $5 million. In addition to the $18.2 million ingrants made by the State Street Foundation, the corporation’s gifts last year included $10 million toBoston’s Museum of Fine Arts to fund the renovation of the Museum’s Fenway entrance. We alsoexpanded our leadership support of Oxfam Trailwalker events held across Europe and the Asia-Pacificregion.
As a global company, State Street recognizes that a diverse and dedicated workforce isfundamental to the success of our business. In 2007, progress continued on a three-year targeted effortto create a more diverse workforce. Specifically, in 2006 we set out to add 50 percent more women,people of color and non-US passport holders to our executive ranks by 2008. After two years, we arenow at 97 percent of that goal.
Continuing Momentum in 2008
The financial services industry forged its way through a difficult environment in 2007. Goingforward, I believe that the winners in our business will be the organizations that can generate profitablerevenue growth even during slower economic environments. We at State Street are poised to do justthat given our ability to bring strong revenue growth down to the bottom line.
We begin 2008 with strong 2007 operating results and with the consolidation of Investors Financialexceeding our expectations. As the rate of growth in the US economy begins to slow, State Streetremains resilient and strong due to our focus, continued business momentum, our growth in non-USmarkets, and the talent and dedication of our people.
For 2008, our financial goals are focused on continuing our momentum: growth in operatingearnings per share of between 10 and 15 percent, growth in operating revenue of between 14 and

29FEB200811462186
17 percent, and achievement of operating return on equity of 14 to 17 percent. We currently expect toachieve in the middle of these ranges.
Volatile markets create trying times for investors and financial service providers alike. In the yearsahead our values will continue to guide us no matter what the industry may encounter. Our focusenabled us to deliver on our financial goals in 2007, and I will ensure that we remain equally steadfastin our commitment to superior results for all of our stakeholders in 2008.
Thank you for investing in State Street.
Ronald E. LogueChairman and Chief Executive Officer
CORPORATE INFORMATION
CORPORATE HEADQUARTERS
State Street CorporationState Street Financial CenterOne Lincoln StreetBoston, Massachusetts 02111-2900Web site: www.statestreet.comGeneral Inquiries: +1 617 786 3000
ANNUAL MEETING
Wednesday, April 30, 2008, 10:00 a.m. atCorporate Headquarters
TRANSFER AGENT
Registered shareholders wishing to change name or address information on their shares, transferownership of stock, deposit certificates, report lost certificates, consolidate accounts, authorize directdeposit of dividends, or receive information on our dividend reinvestment plan should contact:
Computershare Investor ServicesPO Box 43078Providence, RI 02940-3078
1-800-426-5523Web site: www.computershare.com
STOCK LISTINGS
State Street’s common stock is listed on the New York Stock Exchange under the ticker symbol STT.
State Street’s Chief Executive Officer submitted an annual certification to the New York StockExchange on May 11, 2007 stating that he was not aware of any violation by State Street of NYSEcorporate governance listing standards as of the date of certification.
State Street’s Chief Executive Officer and Chief Financial Officer certifications regarding the quality ofour public disclosure, required by Section 302 of the Sarbanes-Oxley Act of 2002 and the SecuritiesExchange Act of 1934, are filed with the SEC as exhibits 31.1 and 31.2 to its Annual Report onForm 10-K for the year ended December 31, 2007.
SHAREHOLDER INFORMATION
For timely information about State Street’s consolidated financial results and other matters of interestto shareholders, and to request copies of our news releases and financial reports by fax or mail, pleasevisit our web site at:
www.statestreet.com/stockholder
or call +1 877 639 7788 toll-free in the United States and Canada, or +1 202 266 3340 from othercountries. These services are available 24 hours a day, seven days a week.
For copies of our Forms 10-Q, quarterly earnings press releases, Forms 8-K or additional copies of thisAnnual Report to Shareholders, please visit our web site, call our shareholder services telephone lineprovided above, or write to Investor Relations at Corporate Headquarters. Copies are provided withoutcharge.
Investors and analysts interested in additional financial information may contact our Investor Relationsdepartment at Corporate Headquarters, telephone +1 617 664 3477.

UNITED STATESSECURITIES AND EXCHANGE COMMISSION
Washington, DC 20549
Form 10-K� ANNUAL REPORT PURSUANT TO SECTION 13 OR 15(d) OF
THE SECURITIES EXCHANGE ACT OF 1934For the fiscal year ended December 31, 2007
OR
� TRANSITION REPORT PURSUANT TO SECTION 13 OR 15(d) OFTHE SECURITIES EXCHANGE ACT OF 1934
For the transition period from to
Commission File No. 001-07511
STATE STREET CORPORATION(Exact name of registrant as specified in its charter)
Massachusetts 04-2456637(State or other jurisdiction of incorporation) (I.R.S. Employer Identification No.)
One Lincoln Street 02111Boston, Massachusetts (Zip Code)
(Address of principal executive office)
617-786-3000(Registrant’s telephone number, including area code)
Securities registered pursuant to Section 12(b) of the Act:(Title of Each Class) (Name of each exchange on which registered)
Common Stock, $1 par value New York Stock ExchangeSecurities registered pursuant to Section 12(g) of the Act:
None
Indicate by check mark if the registrant is a well-known seasoned issuer, as defined in Rule 405 of the SecuritiesAct. Yes � No �
Indicate by check mark if the registrant is not required to file reports pursuant to Section 13 or Section 15(d) of theAct. Yes � No �
Indicate by check mark whether the registrant (1) has filed all reports required to be filed by Section 13 or 15(d) ofthe Securities Exchange Act of 1934 during the preceding 12 months (or for such shorter period that the registrant wasrequired to file such reports) and (2) has been subject to such filing requirements for the past 90 days. Yes � No �
Indicate by check mark if disclosure of delinquent filers pursuant to Item 405 of Regulation S-K is not containedherein, and will not be contained, to the best of registrant’s knowledge, in definitive proxy or information statementsincorporated by reference in Part III of this Form 10-K or any amendment to this Form 10-K. �
Indicate by check mark whether the registrant is a large accelerated filer, an accelerated filer, a non-acceleratedfiler or a smaller reporting company. See the definitions of ‘‘large accelerated filer,’’ ‘‘accelerated filer’’ and ‘‘smallerreporting company’’ in Rule 12b-2 of the Exchange Act. (Check one):
Large accelerated filer � Accelerated filer � Non-accelerated filer � � Smaller reporting company(Do not check if a smaller reporting company)
Indicate by check mark whether the registrant is a shell company (as defined in Rule 12b-2 of the SecuritiesExchange Act of 1934). Yes � No �
The aggregate market value of the voting and non-voting common equity held by non-affiliates computed byreference to the per share price ($68.40) at which the common equity was last sold as of the last business day of theregistrant’s most recently completed second fiscal quarter (June 29, 2007) was approximately $23.00 billion.
The number of shares of the registrant’s Common Stock outstanding as of January 31, 2008 was 387,445,603.
Portions of the following documents are incorporated by reference into Parts of this Report on Form 10-K, to theextent noted in such Parts, as indicated below:
(1) The registrant’s definitive Proxy Statement for the 2008 Annual Meeting to be filed pursuant to Regulation 14Aon or before April 30, 2008 (Part III).
STATE STREET CORPORATIONTable of Contents
Description Page Number
PART IItem 1 Business . . . . . . . . . . . . . . . . . . . . . . . . . . . . . . . . . . . . . . . . . . . . . . . . . 1Item 1A Risk Factors . . . . . . . . . . . . . . . . . . . . . . . . . . . . . . . . . . . . . . . . . . . . . . . 6Item 1B Unresolved Staff Comments . . . . . . . . . . . . . . . . . . . . . . . . . . . . . . . . . . . 18Item 2 Properties . . . . . . . . . . . . . . . . . . . . . . . . . . . . . . . . . . . . . . . . . . . . . . . . 18Item 3 Legal Proceedings . . . . . . . . . . . . . . . . . . . . . . . . . . . . . . . . . . . . . . . . . . 19Item 4 Submission of Matters to a Vote of Security Holders . . . . . . . . . . . . . . . . . 19Item 4A Executive Officers of the Registrant . . . . . . . . . . . . . . . . . . . . . . . . . . . . . 20
PART IIItem 5 Market for Registrant’s Common Equity, Related Stockholder Matters and
Issuer Purchases of Equity Securities . . . . . . . . . . . . . . . . . . . . . . . . . . . 22Item 6 Selected Financial Data . . . . . . . . . . . . . . . . . . . . . . . . . . . . . . . . . . . . . . 24Item 7 Management’s Discussion and Analysis of Financial Condition and Results
of Operations . . . . . . . . . . . . . . . . . . . . . . . . . . . . . . . . . . . . . . . . . . . . 25Item 7A Quantitative and Qualitative Disclosures About Market Risk . . . . . . . . . . . 75Item 8 Financial Statements and Supplementary Data . . . . . . . . . . . . . . . . . . . . . . 76Item 9 Changes in and Disagreements with Accountants on Accounting and
Financial Disclosure . . . . . . . . . . . . . . . . . . . . . . . . . . . . . . . . . . . . . . . 132Item 9A Controls and Procedures . . . . . . . . . . . . . . . . . . . . . . . . . . . . . . . . . . . . . . 132Item 9B Other Information . . . . . . . . . . . . . . . . . . . . . . . . . . . . . . . . . . . . . . . . . . 135
PART IIIItem 10 Directors, Executive Officers and Corporate Governance . . . . . . . . . . . . . . 135Item 11 Executive Compensation . . . . . . . . . . . . . . . . . . . . . . . . . . . . . . . . . . . . . . 136Item 12 Security Ownership of Certain Beneficial Owners and Management and
Related Stockholder Matters . . . . . . . . . . . . . . . . . . . . . . . . . . . . . . . . . 136Item 13 Certain Relationships and Related Transactions, and Director Independence . 137Item 14 Principal Accounting Fees and Services . . . . . . . . . . . . . . . . . . . . . . . . . . . 137
PART IVItem 15 Exhibits and Financial Statement Schedules . . . . . . . . . . . . . . . . . . . . . . . . 138
Signatures . . . . . . . . . . . . . . . . . . . . . . . . . . . . . . . . . . . . . . . . . . . . . . . . 142Exhibit Index . . . . . . . . . . . . . . . . . . . . . . . . . . . . . . . . . . . . . . . . . . . . . . 144
PART I
ITEM 1. BUSINESS
State Street Corporation is a financial holding company, organized in 1970 under the laws of theCommonwealth of Massachusetts. Through its subsidiaries, including its principal banking subsidiary,State Street Bank and Trust Company, State Street Corporation provides a full range of products andservices for institutional investors worldwide. All references in this Form 10-K to ‘‘the parent company’’are to State Street Corporation. Unless otherwise indicated or unless the context requires otherwise, allreferences in this Form 10-K to ‘‘State Street,’’ ‘‘we,’’ ‘‘us,’’ ‘‘our’’ or similar terms mean State StreetCorporation and its subsidiaries on a consolidated basis. State Street Bank and Trust Company is referredto as ‘‘State Street Bank.’’ The parent company is a legal entity separate and distinct from its subsidiaries,assisting those subsidiaries by providing financial resources and management. At December 31, 2007, wehad consolidated total assets of $142.54 billion, consolidated total deposits of $95.79 billion, consolidatedtotal shareholders’ equity of $11.30 billion and employed 27,110. Our executive offices are located atOne Lincoln Street, Boston, Massachusetts 02111 (telephone (617) 786-3000).
We make available, without charge, on or through our Internet website at www.statestreet.com allreports we electronically file with, or furnish to, the Securities and Exchange Commission, including ourAnnual Reports on Form 10-K, Quarterly Reports on Form 10-Q and Current Reports on Form 8-K, aswell as any amendments to those reports, as soon as reasonably practicable after those documents havebeen filed with, or furnished to, the SEC. These documents are also accessible on the SEC’s website atwww.sec.gov. We have included the website addresses of State Street and the SEC as inactive textualreferences only. Except as may be specifically incorporated by reference into this Form 10-K,information on those websites is not part of this Form 10-K.
We have adopted Corporate Governance Guidelines, as well as written charters for the ExecutiveCommittee, the Examining and Audit Committee, the Executive Compensation Committee, and theNominating and Corporate Governance Committee of our Board of Directors, and a Code of Ethicsfor Senior Financial Officers, a Standard of Conduct for Directors, and a Standard of Conduct for ouremployees. Each of these documents is posted on our website, and each is available in print to anyshareholder who requests it by writing to the Office of the Secretary, State Street Corporation,One Lincoln Street, Boston, Massachusetts 02111.
GENERAL
We conduct our business primarily through our principal banking subsidiary, State Street Bank,which traces its beginnings to the founding of the Union Bank in 1792. State Street Bank’s currentcharter was authorized by a special act of the Massachusetts Legislature in 1891, and its present namewas adopted in 1960. With $15.30 trillion of assets under custody and $1.98 trillion of assets undermanagement at year-end 2007, we are a leading specialist in meeting the needs of institutional investorsworldwide. Our customers include mutual funds and other collective investment funds, corporate andpublic retirement plans, insurance companies, foundations, endowments and other investment pools,and investment managers. Including the United States, we operate in 26 countries and more than100 geographic markets worldwide.
For a discussion of our business activities, refer to the ‘‘Lines of Business’’ section that follows. Forinformation about our management of capital, liquidity, market risk, including interest-rate risk, andother risks inherent in our businesses, refer to Management’s Discussion and Analysis of FinancialCondition and Results of Operations included under Item 7, and Risk Factors, under Item 1A, of thisForm 10-K. Financial information with respect to our non-U.S. activities is included in note 23 of theNotes to Consolidated Financial Statements included in this Form 10-K under Item 8.
1
In July 2007, we completed our acquisition of Investors Financial Services Corp., a bank holdingcompany based in Boston, Massachusetts, with approximately $17 billion in total assets andapproximately $1.9 trillion in assets under custody. We acquired Investors Financial in order to enhanceour position as a worldwide service provider to institutional investors. Additional information about thisacquisition is included in note 2 of the Notes to Consolidated Financial Statements included in thisForm 10-K under Item 8.
LINES OF BUSINESS
We report two lines of business: Investment Servicing and Investment Management. These twolines of business provide services to support institutional investors, including custody, recordkeeping,daily pricing and administration, shareholder services, foreign exchange, brokerage and other tradingservices, securities finance, deposit and short-term investment facilities, loan and lease financing,investment manager and hedge fund manager operations outsourcing, performance, risk andcompliance analytics, investment research and investment management, including passive and activeU.S. and non-U.S. equity and fixed income strategies. For additional information about our lines ofbusiness, see the ‘‘Line of Business Information’’ section of Management’s Discussion and Analysisincluded under Item 7, and note 22 of the Notes to Consolidated Financial Statements included underItem 8, of this Form 10-K.
COMPETITION
We operate in a highly competitive environment in all areas of our business worldwide. We facecompetition from other financial services institutions, deposit-taking institutions, investmentmanagement firms, insurance companies, mutual funds, broker/dealers, investment banking firms,benefits consultants, leasing companies, and business service and software companies. As we expandglobally, we encounter additional sources of competition.
We believe that there are certain key competitive considerations in these markets. Theseconsiderations include, for investment servicing, quality of service, economies of scale, technologicalexpertise, quality and scope of sales and marketing, and price; and for investment management,expertise, experience, the availability of related service offerings, and price.
Our competitive success will depend upon our ability to develop and market new and innovativeservices, to adopt or develop new technologies, to bring new services to market in a timely fashion atcompetitive prices, to continue and expand our relationships with existing customers and to attract newcustomers.
SUPERVISION AND REGULATION
We are registered with the Board of Governors of the Federal Reserve System, which we refer toas the Federal Reserve Board, as a bank holding company pursuant to the Bank Holding Company Actof 1956, as amended. The Bank Holding Company Act, with certain exceptions, limits the activities inwhich we and our non-bank subsidiaries may engage, to those that the Federal Reserve Board considersto be closely related to banking or managing or controlling banks. These limits also apply to non-bankcompanies of which we own or control more than 5% of a class of voting shares. The Federal ReserveBoard may order a bank holding company to terminate any activity or its ownership or control of anon-bank subsidiary if the Federal Reserve Board finds that such activity, ownership or controlconstitutes a serious risk to the financial safety, soundness or stability of a bank subsidiary or isinconsistent with sound banking principles or statutory purposes. In the opinion of management, all ofour present subsidiaries operate within the statutory standard or are otherwise permissible. The BankHolding Company Act also requires a bank holding company to obtain prior approval of the Federal
2
Reserve Board before it may acquire substantially all the assets of any bank or ownership or control ofmore than 5% of the voting shares of any bank.
The parent company operates as a financial holding company, which reduces to some extent theFederal Reserve Board’s restrictions on our activities. A financial holding company and the companiesunder its control are permitted to engage in activities considered ‘‘financial in nature’’ as defined by theGramm-Leach-Bliley Act and Federal Reserve Board interpretations, and therefore may engage in abroader range of activities than permitted for bank holding companies and their subsidiaries. Financialholding companies may engage directly or indirectly in activities considered financial in nature, eitherde novo or by acquisition, provided the financial holding company gives the Federal Reserve Boardafter-the-fact notice of the new activities. Activities defined to be financial in nature include, but arenot limited to, the following: providing financial or investment advice; underwriting; dealing in ormaking markets in securities; merchant banking, subject to significant limitations; and any activitiespreviously found by the Federal Reserve Board to be closely related to banking. In order to maintainstatus as a financial holding company, each of a bank holding company’s depository subsidiaries mustbe well capitalized and well managed, as judged by regulators, and must comply with CommunityReinvestment Act obligations. Failure to maintain such standards may ultimately permit the FederalReserve Board to take certain enforcement actions against such company.
Many aspects of our business are subject to regulation by other U.S. federal and stategovernmental and regulatory agencies and self-regulatory organizations (including securities exchanges),and by non-U.S. governmental and regulatory agencies and self-regulatory organizations. Aspects of ourpublic disclosure, corporate governance principles and internal control systems are subject to theSarbanes-Oxley Act of 2002 and regulations and rules of the SEC and the New York Stock Exchange.
Capital Adequacy
Like other bank holding companies, we are subject to Federal Reserve Board minimum risk-basedcapital and leverage ratio guidelines. As noted above, our status as a financial holding company alsorequires that we maintain certain capital ratio levels. State Street Bank is subject to similar risk-basedcapital and leverage ratio guidelines. As of December 31, 2007, our capital levels on a consolidatedbasis, and the capital levels of State Street Bank, exceeded the applicable minimum capitalrequirements and the requirements to qualify as a financial holding company. Failure to meet capitalrequirements could subject us to a variety of enforcement actions, including the termination of depositinsurance of State Street Bank by the Federal Deposit Insurance Corporation, and to certainrestrictions on our business that are described further in this ‘‘Supervision and Regulation’’ section.
For additional information about our capital position and capital adequacy, refer to the ‘‘Capital’’section of Management’s Discussion and Analysis included under Item 7, and note 14 of the Notes toConsolidated Financial Statements included under Item 8, of this Form 10-K.
Subsidiaries
The Federal Reserve Board is the primary federal banking agency responsible for regulating us andour subsidiaries, including State Street Bank, for both our U.S. and non-U.S. operations.
Our bank subsidiaries are subject to supervision and examination by various regulatory authorities.State Street Bank is a member of the Federal Reserve System and the FDIC and is subject toapplicable federal and state banking laws and to supervision and examination by the Federal ReserveBank of Boston, as well as by the Massachusetts Commissioner of Banks, the FDIC, and the regulatoryauthorities of those countries in which a branch of State Street Bank is located. Other subsidiary trustcompanies are subject to supervision and examination by the Office of the Comptroller of theCurrency, other offices of the Federal Reserve System or by the appropriate state banking regulatoryauthorities of the states in which they are located. Our non-U.S. bank subsidiaries are subject to
3
regulation by the regulatory authorities of the countries in which they are located. As of December 31,2007, the capital of each of these banking subsidiaries was in excess of the minimum legal capitalrequirements as set by those authorities.
The parent company and its non-bank subsidiaries are affiliates of State Street Bank under federalbanking laws, which impose certain restrictions on transfers of funds in the form of loans, extensions ofcredit, investments or asset purchases from State Street Bank to the parent and its non-banksubsidiaries. Transfers of this kind to affiliates by State Street Bank are limited with respect to eachaffiliate to 10% of State Street Bank’s capital and surplus, as defined, and to 20% in the aggregate forall affiliates, and are subject to certain collateral requirements. As a bank holding company, the parentcompany and its subsidiaries are prohibited from engaging in certain tie-in arrangements in connectionwith any extension of credit or lease or sale of property or furnishing of services. Federal law alsoprovides that certain transactions with affiliates must be on terms and under circumstances, includingcredit standards, that are substantially the same or at least as favorable to the institution as thoseprevailing at the time for comparable transactions involving other non-affiliated companies or, in theabsence of comparable transactions, on terms and under circumstances, including credit standards, thatin good faith would be offered to, or would apply to, non-affiliated companies. The Federal ReserveBoard has jurisdiction to regulate the terms of certain debt issues of bank holding companies. Federallaw provides as well for a depositor preference on amounts realized from the liquidation or otherresolution of any depository institution insured by the FDIC.
Our investment management division, State Street Global Advisors, or ‘‘SSgA,’’ which acts as aninvestment advisor to investment companies registered under the Investment Company Act of 1940, isregistered as an investment adviser with the SEC. However, a major portion of our investmentmanagement activities are conducted by State Street Bank, which is subject to supervision primarily bythe Federal Reserve Board and the SEC with respect to these activities. Our U.S. broker/dealersubsidiary is registered as a broker/dealer with the SEC, is subject to regulation by the SEC (includingthe SEC’s net capital rule) and is a member of the Financial Industry Regulatory Authority, aself-regulatory organization. Many aspects of our investment management activities are subject tofederal and state laws and regulations primarily intended to benefit the investment holder. These lawsand regulations generally grant supervisory agencies and bodies broad administrative powers, includingthe power to limit or restrict us from carrying on our investment management activities in the eventthat we fail to comply with such laws and regulations, and examination authority. Our business relatingto investment management and trusteeship of collective trust funds and separate accounts offered toemployee benefit plans is subject to ERISA and is regulated by the U.S. Department of Labor.
Our businesses, including our investment management and securities and futures businesses, arealso regulated extensively by non-U.S. governments, securities exchanges, self-regulatory organizations,central banks and regulatory bodies, especially in those jurisdictions in which we maintain an office. Forinstance, the Financial Services Authority, the London Stock Exchange, and the Euronext.liffe regulateactivities in the United Kingdom; the Deutsche Borse AG and the Federal Financial SupervisoryAuthority regulate activities in Germany; and the Financial Services Agency, the Bank of Japan, theJapanese Securities Dealers Association and several Japanese securities and futures exchanges,including the Tokyo Stock Exchange, regulate activities in Japan. We have established policies,procedures, and systems designed to comply with these requirements. However, as a global financialservices institution, we face complexity and costs in our worldwide compliance efforts.
Most of our non-U.S. operations are conducted pursuant to Federal Reserve Board Regulation Kthrough State Street Bank’s Edge Act corporation subsidiary or through international branches of StateStreet Bank. An Edge Act corporation is a corporation organized under federal law that conductsforeign business activities. In general, banks may not invest more than 20% of their capital and surplusin their Edge Act corporations (and similar state law corporations), and the investment of any amountin excess of 10% of capital and surplus requires the prior approval of the Federal Reserve Board
4
(which approval is generally valid for a 12-month period). State Street Bank periodically applies to theFederal Reserve Board to invest in excess of 10% of its capital and surplus in its Edge Act corporation,and State Street Bank currently has approval to continue investing a dollar amount up to theequivalent of 18% of its capital and surplus.
In addition to non-U.S. operations conducted pursuant to Regulation K, we make new investmentsabroad directly (through the parent company or through non-bank subsidiaries of the parent company)pursuant to Federal Reserve Board Regulation Y, or through international bank branch expansion,which are not subject to the 20% investment limitation for Edge Act corporation subsidiaries. Wecannot predict with certainty what the future impact of the Regulation K investment limitation may be,but in light of available alternatives, we do not believe the limitation will materially limit our ability toexpand internationally.
We are subject to the USA PATRIOT Act of 2001, which contains anti-money laundering andfinancial transparency laws and requires implementation of regulations applicable to financial servicescompanies, including standards for verifying client identification and monitoring client transactions anddetecting and reporting suspicious activities. Anti-money laundering laws outside the U.S. containsimilar requirements.
We are also subject to the Massachusetts bank holding company statute. The Massachusetts statuterequires prior approval by the Massachusetts Board of Bank Incorporation for our acquisition of morethan 5% of the voting shares of any additional bank and for other forms of bank acquisitions.
Support of Subsidiary Banks
Under Federal Reserve Board guidelines, a bank holding company is required to act as a source offinancial and managerial strength to its bank subsidiaries. Under these guidelines, the parent companyis expected to commit resources to State Street Bank and any other bank subsidiary in circumstances inwhich it might not do so absent such guidelines. In the event of our bankruptcy, any commitment bythe parent company to a federal bank regulatory agency to maintain the capital of a bank subsidiarywill be assumed by the bankruptcy trustee and will be entitled to a priority payment.
ECONOMIC CONDITIONS AND GOVERNMENT POLICIES
Economic policies of the U.S. government and its agencies influence our operating environment.Monetary policy conducted by the Federal Reserve Board directly affects the level of interest rates,which may impact overall credit conditions of the economy. Monetary policy is applied by the FederalReserve Board through open market operations in U.S. government securities, changes in reserverequirements for depository institutions, and changes in the discount rate and availability of borrowingfrom the Federal Reserve. Government regulation of banks and bank holding companies is intendedprimarily for the protection of depositors of the banks, rather than for the shareholders of theinstitutions. We are also impacted by the economic policies of non-U.S. government agencies, such asthe European Central Bank.
STATISTICAL DISCLOSURE BY BANK HOLDING COMPANIES
The following information, provided under Items 6, 7 and 8 of this Form 10-K, is incorporated byreference herein:
‘‘Selected Financial Data’’ table (Item 6)—presents return on average common equity, return onaverage assets, common dividend payout and equity-to-assets ratios.
‘‘Distribution of Average Assets, Liabilities and Shareholders’ Equity; Interest Rates and InterestDifferential’’ table (Item 8)—presents average balance sheet amounts, related fully taxable-equivalentinterest earned or paid, related average yields and rates paid and changes in fully taxable-equivalent
5
interest revenue and expense for each major category of interest-earning assets and interest-bearingliabilities.
Note 3, ‘‘Investment Securities,’’ of the Notes to Consolidated Financial Statements (Item 8) and‘‘Investment Securities’’ section included in Management’s Discussion and Analysis of FinancialCondition and Results of Operations (Item 7)—disclose information regarding book values, marketvalues, maturities and weighted average yields of securities (by category).
Note 1, ‘‘Summary of Significant Accounting Policies—Loans and Lease Financing’’ of the Notesto Consolidated Financial Statements (Item 8)—discloses our policy for placing loans and leases onnon-accrual status.
Note 4, ‘‘Loans and Lease Financing,’’ of the Notes to Consolidated Financial Statements (Item 8)and ‘‘Loans and Lease Financing’’ section included in Management’s Discussion and Analysis ofFinancial Condition and Results of Operations (Item 7)—disclose distribution of loans, loan maturitiesand sensitivities of loans to changes in interest rates.
‘‘Loans and Lease Financing’’ and ‘‘Cross-Border Outstandings’’ sections of Management’sDiscussion and Analysis of Financial Condition and Results of Operations (Item 7)—discloseinformation regarding cross-border outstandings and other loan concentrations of State Street.
‘‘Credit Risk’’ section of Management’s Discussion and Analysis of Financial Condition andResults of Operations (Item 7) and note 4, ‘‘Loans and Lease Financing,’’ of the Notes to ConsolidatedFinancial Statements (Item 8)—present the allocation of the allowance for loan losses, and adescription of factors which influenced management’s judgment in determining amounts of additions orreductions to the allowance charged or credited to results of operations.
‘‘Distribution of Average Assets, Liabilities and Shareholders’ Equity; Interest Rates and InterestDifferential’’ table (Item 8)—discloses deposit information.
Note 8, ‘‘Short-Term Borrowings,’’ of the Notes to Consolidated Financial Statements (Item 8)—discloses information regarding short-term borrowings of State Street.
ITEM 1A. RISK FACTORS
This Form 10-K contains statements (including, without limitation, statements in Management’sDiscussion and Analysis of Financial Condition and Results of Operations, included in this Form 10-Kunder Item 7) that are considered ‘‘forward-looking statements’’ within the meaning of U.S. federalsecurities laws. In addition, State Street and its management may make other written or oralcommunications from time to time that contain forward-looking statements. Forward-lookingstatements, including statements as to industry trends, management’s future expectations and othermatters that do not relate strictly to historical facts, are based on assumptions by management, and areoften identified by such forward-looking terminology as ‘‘expect,’’ ‘‘look,’’ ‘‘believe,’’ ‘‘anticipate,’’‘‘estimate,’’ ‘‘seek,’’ ‘‘may,’’ ‘‘will,’’ ‘‘trend,’’ ‘‘target’’ and ‘‘goal,’’ or similar statements or variations ofsuch terms. Forward-looking statements may include, among other things, statements about StateStreet’s confidence in its strategies and its expectations about financial performance, market growth,acquisitions and divestitures, new technologies, services and opportunities, and earnings.
Forward-looking statements are subject to various risks and uncertainties, which change over time,and are based on management’s expectations and assumptions at the time the statements are made andare not guarantees of future results. These expectations and assumptions, and the continued validity ofthe forward-looking statements, are subject to change due to a broad range of factors affecting thenational and global economies, the equity, debt, currency and other financial markets, and factorsspecific to State Street and its subsidiaries, including State Street Bank. Factors that could cause
6
changes in the expectations or assumptions on which forward-looking statements are based include, butare not limited to:
• our ability to integrate and convert acquisitions into our business, including the acquisition ofInvestors Financial Services Corp.;
• the level and volatility of interest rates, particularly in the U.S. and Europe; the performanceand volatility of securities, currency and other markets in the U.S. and internationally; andeconomic conditions and monetary and other governmental actions designed to address thoseconditions;
• the liquidity of the U.S. and European securities and currency markets, particularly the marketsfor fixed income securities, including asset-backed commercial paper, and the liquidityrequirements of our customers;
• the credit quality and credit agency ratings of the securities in our investment securitiesportfolio, a deterioration or downgrade of which could lead to other-than-temporary impairmentof the respective securities and the recognition of an impairment loss;
• our ability to attract non-interest bearing deposits and other low-cost funds;
• the results of litigation and similar disputes and, in particular, the effect that current or potentiallitigation may have on the reputation of SSgA and its ability to attract and retain customers;
• the possibility that the ultimate costs of the legal exposure associated with certain of SSgA’sactively managed fixed-income strategies may exceed or be below the level of the relatedreserve, in view of the uncertainties of the timing and outcome of litigation, and the amountsinvolved; and the possibility of further developments of the nature giving rise to the legalexposure associated with SSgA’s actively managed fixed-income and other investment strategies;
• the performance and demand for the products and services we offer;
• the competitive environment in which we operate;
• the enactment of legislation and changes in regulation and enforcement that impact us and ourcustomers, as well as the effects of legal and regulatory proceedings, including litigation;
• our ability to continue to grow revenue, control expenses and attract the capital necessary toachieve our business goals and comply with regulatory requirements;
• our ability to manage systemic risks and control operating risks;
• our ability to obtain quality and timely services from third parties with which we contract;
• trends in the globalization of investment activity and the growth on a worldwide basis infinancial assets;
• trends in governmental and corporate pension plans and savings rates;
• changes in accounting standards and practices, including changes in the interpretation of existingstandards, that impact our consolidated financial statements; and
• changes in tax legislation and in the interpretation of existing tax laws by U.S. and non-U.S. taxauthorities that impact the amount of taxes due.
Forward-looking statements should not be viewed as predictions, and should not be the primarybasis upon which investors evaluate State Street. Any investor in State Street should consider all risksand uncertainties disclosed in this Form 10-K and in our other SEC filings, including our reports onForm 10-Q and Form 8-K, which are accessible on the SEC’s website at www.sec.gov or on our websiteat www.statestreet.com.
7
Actual outcomes and results may differ materially from what is expressed in our forward-lookingstatements and from our historical financial results due to the factors discussed in this Risk Factorssection and elsewhere in this Form 10-K or disclosed in our other SEC filings, and forward-lookingstatements should not be relied upon as representing our expectations or beliefs as of any datesubsequent to the date this Form 10-K is filed with the SEC. State Street undertakes no obligation torevise the forward-looking statements contained in this Form 10-K to reflect events after the date it isfiled with the SEC. The factors discussed above and below are not intended to be a complete summaryof all risks and uncertainties that may affect our businesses. Though we strive to monitor and mitigaterisk, we cannot anticipate all potential economic, operational and financial developments that mayadversely impact our operations and our financial results.
Business Conditions/Economic Risk
Our businesses are affected by global economic conditions, political uncertainties and volatility andother developments in the financial markets. Factors such as interest rates and commodities prices,regional and international rates of economic growth, inflation, political instability, the liquidity andvolatility of fixed-income, equity, credit, currency, derivative and other financial markets, and investorconfidence can significantly affect the financial markets in which we and our customers are engaged.Such factors have affected, and may further unfavorably affect, both regional and worldwide economicgrowth, creating adverse effects on many companies, including us, in ways that are not predictable orthat we may fail to anticipate.
A significant market downturn may lead to a decline in the value of assets under management andcustody, which would reduce our asset-based fee revenue and the value of securities we hold in ourinvestment portfolio, and may adversely impact other transaction-based revenue, such as securitiesfinance revenue, and the volume of transactions that we execute for our customers. The assets held byour asset-backed commercial paper conduits can be similarly affected. In addition, lower marketvolatility, even in a generally rising market environment, may reduce trading volumes of our customers,and our ability to achieve attractive spreads, which could lead to lower trading revenues. Our revenues,particularly our trading revenues, may increase or decrease depending upon the extent of increases ordecreases in cross-border investments made by our customers. The level of cross-border activity can beinfluenced by a number of factors, including geopolitical instabilities and customer mix. General marketdownturns would also likely lead to a decline in the volume of transactions we execute on behalf of ourcustomers, decreasing our fee and revenue opportunities and reducing the level of assets undermanagement and custody. Market performance and volatility may also influence the revenue that wereceive from off-balance sheet activities. A widening of credit spreads or credit deterioration couldcause some or all off-balance sheet assets and liabilities to be consolidated onto our balance sheet.
In addition, revenues during a calendar year, driven by the products and services we provide, canfluctuate commensurate with the normal course of business activity of our customers, typically resultingin stronger revenues in the second and fourth quarters and relatively weaker revenues in the first andthird quarters.
In recent years, investment manager and hedge fund manager operations outsourcing and non-U.S.asset servicing have been areas of rapid growth in our business. If the demand for these types ofservices were to decline, we could see a slowing in the growth rate of our revenue.
Strategic/Competition Risk
We expect the markets in which we operate to remain both highly competitive and global across allfacets of our business, resulting in increases in both regional and global competitive risks. We haveexperienced, and anticipate that we will continue to experience, pricing pressure in many of our corebusinesses. Many of our businesses compete with other domestic and international banks and financial
8
services companies, such as custody banks, investment advisors, broker/dealers, outsourcing companiesand data processing companies. Many of our competitors, including our competitors in core services,have substantially greater capital resources. In some of our businesses, we are service providers tosignificant competitors. These competitors are in some instances significant customers, and theretention of these customers involves additional risks, such as the avoidance of actual or perceivedconflicts of interest and the maintenance of high levels of service quality. The ability of a competitor tooffer comparable or improved products or services at a lower price would likely negatively affect ourability to maintain or increase our profitability. Many of our core services are subject to contracts thathave relatively short terms or may be terminated by our customer after a short-notice period. Inaddition, pricing pressures as a result of the activities of competitors, customer pricing reviews, andrebids, as well as the introduction of new products, may result in a reduction in the prices we cancharge for our products and services.
Acquisitions of complementary businesses and technologies, development of strategic alliances anddivestitures of portions of our business, in addition to fostering organic growth opportunities, are anactive part of our overall business strategy to remain competitive. We may not be able to effectivelyassimilate services, technologies, key personnel or businesses of acquired companies into our businessor service offerings, alliances may not be successful, and related revenue growth or cost savings may notbe achieved. In addition, we may not be able to successfully manage the divestiture of identifiedbusinesses on satisfactory terms, if at all, and this would reduce anticipated benefits to earnings.Ongoing consolidation within the financial services industry could pose challenges in the markets weserve.
Acquisitions present risks that differ from the risks associated with our ongoing operations. Ourfinancial results for 2008 and for the next few years may be significantly impacted by our ability toachieve the cost savings and other benefits that we anticipate as a result of the acquisition of InvestorsFinancial in 2007, as well as our ability to retain its customer base and to successfully cross-sell ourproducts and services to its customers. These cost savings and customer retention goals will besignificantly influenced by our ability to convert former Investor Financial customers onto State Streetsystems in a timely manner and to maintain the level of customer service such customers received fromInvestors Financial. Future acquisitions may present similar integration, cost savings and customerretention challenges.
Intellectual property of an acquired business, such as Currenex, Inc. in 2007, may be an importantcomponent of the value that we agree to pay for such a business; however, these types of acquisitionsentail the risk that the acquired business does not own the intellectual property that we believe we areacquiring, that the intellectual property is dependent upon licenses from third parties, that the acquiredbusiness infringes upon the intellectual property rights of others, or that the technology does not havethe acceptance in the marketplace that we anticipated. Acquisitions of investment servicing businessessuch as Investors Financial normally entail information technology systems conversions, which involveoperational risks and may result in customer dissatisfaction and defection. Customers of businesses thatwe acquire, including, in the case of Investors Financial, its largest customer, are competitors of ournon-custody businesses. The loss of some of these customers or a significant reduction in revenuesgenerated from them, for competitive or other reasons, would adversely affect the benefits that weexpect to achieve from the acquisition.
Our ability to acquire other entities that provide our core services to achieve greater economies ofscale or to expand our product offering is dependent upon our financial resources and ability to accessthe capital markets. Due to company-specific issues or lack of liquidity in the capital markets, ourability to continue to expand through acquisitions or to dispose of businesses that no longer arestrategic to us may be adversely affected.
9
In connection with most acquisitions, before the acquisition can be completed, we must obtainvarious regulatory approvals or consents, which approvals may include the Federal Reserve Board, theMassachusetts Commissioner of Banks and other domestic and foreign regulatory authorities. Theseregulatory authorities may impose conditions on the completion of the acquisition or require changes toits terms. Although we would not enter into a transaction anticipating materially adverse regulatoryconditions, such conditions may be imposed, or we may experience regulatory delays, that could limitthe benefits of the transaction.
With any acquisition, the integration of the operations and resources of the two businesses couldresult in the loss of key employees, the disruption of our and the acquired company’s ongoingbusinesses, or inconsistencies in standards, controls, procedures and policies that could adversely affectour ability to maintain relationships with customers, and employees or to achieve the anticipatedbenefits of the acquisition. Integration efforts may also divert management attention and resources.Where we acquire a business and combine it with our operations, we are also exposed to risks fromunknown or contingent liabilities with respect to which we may have no recourse against the seller.While we normally seek to mitigate that risk through pre-acquisition due diligence, increasinglyacquisition transactions are competitive auctions in which we have limited time and access toinformation to evaluate the risks inherent in the business being acquired, and no or limited recourseagainst the seller if undisclosed liabilities are discovered after we enter into a definitive agreement.
We may not achieve the benefits we sought in an acquisition, or, if achieved, those benefits maycome later than we anticipated. Failure to achieve anticipated benefits from an acquisition could resultin increased costs and lower revenues than expected of the combined company. In addition, if thefinancial performance associated with an acquisition falls short of expectations, it may result inimpairment charges associated with the intangible assets reported as part of the acquisition.
Our financial performance depends, in part, on our ability to develop and market new andinnovative services and to adopt or develop new technologies that differentiate our products or providecost efficiencies, while avoiding increased related expenses. The risks we face include rapidtechnological change in the industry, our ability to access technical and other information from ourcustomers, and the significant and ongoing investments required to bring new products and services tomarket in a timely fashion at competitive prices. Our proactive cross selling of multiple products andservices to our customers can exacerbate the negative financial effects associated with the risk of loss ofany one customer. Developments in the securities processing industry, including shortened settlementcycles and straight-through processing, have required continued internal procedural enhancements andfurther technology investment.
Our strategy for growth depends upon both attracting new customers and cross selling additionalproducts and services to our existing customer base. To the extent that we are not able to achieve thesegoals, we may not be able to attain our financial goals. Substantial risks and uncertainties areassociated with the introduction of new products and services, including technical and controlrequirements that may need to be developed and implemented to offer such products while alsomanaging associated risks. The introduction of new products and services can also entail significanttime and resources. Regulatory and internal control requirements, capital requirements, competitivealternatives and shifting market preferences may also determine if such initiatives can be brought tomarket in a manner that is timely and attractive to our customers. Failure to successfully manage theserisks in the development and implementation of new products or services could have a material adverseeffect on our business, as well as our results of operations and financial condition.
Liquidity Risk and Management
Liquidity management is critical to the management of our consolidated balance sheet and to ourability to service our customer base. In managing our consolidated balance sheet, our primary source of
10
funding is customer deposits. Our deposits are predominantly short-term, transaction-based deposits byinstitutional investors. Our ability to continue to attract these deposits, and other funding sources suchas certificates of deposit and commercial paper, is subject to variability based upon a number offactors, including volume and volatility in the global securities markets, our credit rating and therelative interest rates that we are prepared to pay for these liabilities.
In managing our consolidated balance sheet, we also depend on access to global capital markets toprovide us with sufficient capital resources and liquidity to meet our commitments and business needs,and to accommodate the transaction and cash management needs of our customers. Other sources offunding available to us, and upon which we rely as regular components of our liquidity riskmanagement strategy, include inter-bank borrowings, repurchase agreements and borrowings from theFederal Reserve discount window, or comparable non-U.S. central banking sources. Any occurrencethat may limit our access to the capital markets, such as a decline in the confidence of our corporatedebt or equity purchasers, or a downgrade of our debt rating, may adversely affect our capital costs andour ability to raise capital and, in turn, our liquidity. Similarly, the failure to maintain an acceptablecredit rating on our obligations may preclude us from being competitive in certain products. Generalmarket disruptions, natural disasters or operational problems may affect either third parties or us, andcan also have an adverse affect on our liquidity.
We generally use our sources of funds to invest in a portfolio of investment securities and tomaintain the liquidity necessary to extend credit to our customers. These funds are invested in a varietyof assets ranging from short-term interest-bearing deposits with banks to longer-maturity investmentsecurities. While we have historically maintained our investment portfolio at a relatively short durationwith respect to interest-rate risk, the average maturity of the investment portfolio is significantly longerthan the contractual maturity of our deposit base. In addition, as part of our custody business, weprovide overdraft financing to our customers, and liquidity lines to third-party commercial paperconduits and mutual funds, as well as more traditional extensions of credit. The demand for credit isdifficult to forecast and control, and may be at its peak at times of dislocation in the securities markets,potentially compounding liquidity issues.
In a period of financial disruption, or if negative developments occurred with respect to StateStreet, the availability and cost of our funding sources could be adversely affected. In that event, ourcost of funds may increase, thereby reducing our net interest revenue, or we may need to dispose of aportion of our investment portfolio, which, depending upon market conditions, could result in ourrealizing a loss or experiencing other adverse accounting consequences upon those dispositions. Ourefforts to monitor and manage liquidity risk may not be successful or sufficient to deal with dramatic orunanticipated changes in the global securities markets or other State Street or market event-drivenreductions in liquidity.
In our business activities, we assume liquidity and interest-rate risk in managing longer-term assetsor asset pools for third parties that are funded on a short-term basis, or where the customersparticipating in these products may have a right to the return of cash or assets on limited notice. Thesebusiness activities include, among others, the unconsolidated asset-backed commercial paper conduitsmanaged by our Structured Products group, securities finance collateral pools and money market andother short-term investment funds. In the commercial paper conduits, for example, pools of medium-and long-term financial instruments, principally mortgage- and other asset-backed securities, arefinanced through the issuance of short-term commercial paper. The conduits strive to maintain apositive margin between the rate of return on their longer-term assets and the short-term cost offunding. This mismatch in the maturity of the investment pools and funding creates risk if disruptionsoccur in the liquidity of the short-term debt or asset-backed securities markets, or if the cost ofshort-term borrowings exceeds the conduits’ rate of return on their investment pools or purchasedassets.
11
In connection with the administration of the activities of the commercial paper conduits, weprovide contractual back-up liquidity to the conduits if they cannot meet their liquidity needs throughthe issuance of commercial paper. Other institutions can and do provide liquidity to the conduits. Inthe event that maturing commercial paper cannot be placed by the conduits, the liquidity providers arerequired by contract to, among other things, provide liquidity to the conduits by purchasing portfolioassets from them. We may also provide liquidity by purchasing commercial paper or providing otherextensions of credit to the conduits.
Beginning in the third quarter of 2007, asset-backed commercial paper conduits, including thosesponsored by State Street, experienced significantly less liquidity and higher borrowing costs in theglobal fixed-income securities markets, and in a few cases, required liquidity support from theirsponsoring bank. The fixed-income markets remain significantly disrupted, and the potential fordecreased liquidity, increased funding costs and adverse asset valuations remains a material risk. We onoccasion have purchased, and during the third and fourth quarters of 2007 did purchase, commercialpaper from the conduits, the purchase of which we recorded in our consolidated balance sheet. We maycontinue to do so in the future. These purchases of commercial paper were funded from our generalliquidity, and the liquidity agreements were not drawn.
The conduits are not recorded in our consolidated financial statements. However, if circumstanceschange we may be required, under existing accounting standards, to consolidate the conduits onto ourconsolidated balance sheet. For example, if changes in market conditions require us to update theassumptions in our expected loss model, we may be required to increase the amount of first-loss notesin order for the investors in the first-loss notes to continue to be considered the primary beneficiariesof the conduits. In various circumstances, including if the conduits are not able to issue additionalfirst-loss notes or take other actions, we may be determined to be the primary beneficiary of theconduits, and we would be required to consolidate the conduits’ assets and liabilities onto ourconsolidated balance sheet. Existing accounting standards may be changed or interpreted differently inthe future in a manner that increases the risk of consolidation of the conduits.
Consolidation, or the purchase of assets of the conduits pursuant to the contractual agreementsdescribed above, could affect the size of our consolidated balance sheet and related fundingrequirements, our financial and regulatory capital ratios and, if the conduit assets include unrealizedlosses, could require us to recognize those losses. Because of our contractual agreements to purchaseassets from the conduits under specified conditions, we are also exposed to the credit risks in theconduits’ portfolios.
Other of our business activities that involve managing pools of assets that are funded in theshort-term markets and invested in longer-term markets include managing securities finance collateralpools and money market and other short-term investment funds. These businesses involve similar risksinherent in an arbitrage of funding and investment; however, in these businesses, we primarily act asagent and do not have the direct principal risk. For example, if a collateral pool or a money marketfund that we manage were to have unexpected liquidity demands from investors in the pool thatexceeded available liquidity, the investment pool would be required to sell assets to meet thoseredemption requirements. During periods of disruption in the credit markets, it may be difficult to sellthe assets held by these pools at a reasonable price. In those circumstances, the financial loss accrues tothe pools’ investors and not to us.
Similarly, credit risks inherent in these portfolios are attributable to the investors in the investmentpools and not to State Street. These investment pools may have significant exposure to individualcredits. The incurrence of substantive losses in these pools, particularly in money market funds, couldresult in significant harm to our reputation and significantly and adversely affect the prospects of ourassociated business units. In some circumstances, we may seek to mitigate that risk by compensating theinvestment pools for all or a portion of such losses even if not contractually obligated to do so;
12
however, that would potentially result in the recognition of significant losses or a greater use of capitalthan we have available. Certain accounts managed by SSgA are managed in accordance with specificinvestment guidelines and have the benefit of contractual arrangements with third-party financialinstitutions that allow the accounts to issue and redeem units based upon the book value of such unitsrather than market value. The third-party financial institutions have an obligation to fund any shortfallafter all the units have been redeemed at book value. Several of these accounts were significantlyimpacted by the volatility in the fixed-income markets in the second half of 2007. The continuedwillingness of these financial institutions to partner with us in these products may be negativelyimpacted if the variance between book and market value and other risk metrics fall or remain belowthe financial institutions’ internal risk standards.
We used a portion of the reserve announced on January 3, 2008 to reduce the differences betweenthe book and market value of these accounts. This cash infusion was intended to reduce the differencebetween market and book values of these accounts to levels that are within the risk tolerance of suchthird-party financial institutions. If the third-party financial institutions are or become unwilling tocontinue to partner with us, our business may be adversely affected. There can be no assurance thatthese and other costs associated with our legal exposures resulting from SSgA’s active fixed incomestrategies will not exceed the reserve we have established.
Investment, operational and other decisions and actions, often made to achieve scale and otherbenefits, are implemented over multiple investment pools as applicable, increasing the opportunity forlosses, even small losses, to have a significant effect. To mitigate these risks to the investment pools, weseek to prudently manage the duration and credit exposure of the pools, to satisfy large liquiditydemands by the in-kind delivery of securities held by the pools and to closely monitor liquidity demandfrom investors; however, market conditions or increased defaults could result in our inability toeffectively manage those risks. To some degree, all of our investment management pools hold potentialrisks to our reputation and business prospects if the asset pools that we manage have higher thananticipated redemption or other liquidity requirements and the pools incur losses to meet suchdemands.
Other parts of our business where we primarily act as agent, such as other investment managementactivities of SSgA and certain of State Street Global Markets’ business units, do not currently havesignificant liquidity requirements; however, as we develop new products in response to customerdemand and to remain competitive in a dynamic marketplace, we could take on more principal risk inthese businesses. Any increase in the extent to which these or other businesses assume principalpositions would increase the risks associated with our liquidity management strategy.
The disruption in the global fixed-income securities markets beginning in the third quarter of 2007has had a substantially greater impact upon liquidity and valuations in those markets than hashistorically been experienced. Because demand from investors for fixed-income products has markedlydecreased and dealers have been less prepared to take principal exposures, funding sources, such as thecommercial paper markets for conduits, have been less reliable and more expensive. At the same time,the ability of the markets to absorb the sale of large portfolios of certain types of securities has beensubstantially impaired. These conditions have also led to greater difficulty in accurately valuingportfolio positions. These market conditions have made the management of our own and our clients’liquidity significantly more challenging. As discussed above, the risks to State Street inherent in itsmanagement of liquidity are significant, and a further deterioration in the credit markets couldadversely affect our consolidated financial position, including our regulatory capital ratios, and couldadversely affect our results of operations and our business prospects in the future.
13
Reputational Risk
Our relationship with many of our customers is predicated upon our reputation as a fiduciary anda service provider that adheres to the highest standards of ethics, service quality and regulatorycompliance. Adverse publicity, regulatory actions, litigation, operational failures, the failure to meetclient expectations and other issues could materially and adversely affect our reputation and our abilityto retain and attract customers. Preserving and enhancing our reputation depends not only inmaintaining systems and procedures that address known risks and regulatory requirements, but also ourability to identify and mitigate additional risks that arise due to changes in our businesses and themarketplaces in which we operate, the regulatory environment, and customer expectations. If any ofthese developments, including our recently announced customer concerns related to certain SSgA activefixed income strategies, has a material effect on our reputation, our business will suffer.
Credit Risk
Our focus on large institutional investors and their businesses requires that we assume credit andcounterparty risk, both on- and off-balance sheet, in a variety of forms. We may experience significantintra- and inter-day credit exposure through settlement-related extensions of credit. From time to time,we may assume concentrated credit risk at the individual obligor, counterparty, guarantor, industryand/or country level, thereby potentially exposing us to a single market or political event or acorrelated set of events. The credit quality of our on- and off-balance sheet exposures may be affectedby many factors, such as economic and business conditions or deterioration in the financial condition ofan individual counterparty, group of counterparties or asset classes. If a significant economic downturnoccurs in either a country or a region, or we experience the failure of a significant individualcounterparty, we could incur financial losses that could adversely affect our earnings.
Financial Markets Risk
As asset values in worldwide financial markets increase or decrease, our opportunities to invest inand service financial assets change. Given that a portion of our fees is based on the value of assetsunder custody and management, fluctuations in the valuation of worldwide securities markets will affectrevenue. Many of the costs of providing our services are relatively fixed; therefore, a decline in revenuecould have a disproportionate effect on our earnings. In addition, if investment performance in ourasset management business fails to meet either benchmarks or the performance of our competitors, wecould experience a decline in assets under management and a reduction in the fees that we earn,irrespective of economic or market conditions.
We have increased the portion of our management fee revenue that is generated from enhancedindex and actively managed products, with respect to which we generally receive higher fees comparedto passive products. We may not be able to continue to increase this segment of our business at thesame rate that we have achieved in the past few years. The amount of assets in active fixed-incomestrategies, for example, has been adversely impacted in 2007. In addition, with respect to certain of ourenhanced index and actively managed products, we have entered into performance fee arrangements,where the management fee revenue we earn is based on the performance of managed funds againstspecified benchmarks. The reliance on performance fees increases the potential volatility of ourmanagement fee revenue.
Financial markets trading businesses, as well as our asset and liability management activities, arealso subject to market risks. Adverse movements in levels and volatilities of financial markets couldcause losses that may affect our consolidated results of operations and financial condition. In addition,changes in investor and rating agency perceptions regarding certain asset classes or structures can alsoaffect volatility, liquidity and market prices, which, in turn, can lead to losses. The degree of volatilityin foreign exchange rates can affect our foreign exchange trading revenue. In general, we benefit from
14
currency volatility, although it can increase risk. Foreign exchange revenue, all other things being equal,is likely to decrease during times of decreased currency volatility. In addition, as our business growsglobally, our exposure to changes in foreign currency exchange rates could affect our levels of revenue,expense and earnings, as well as the value of our investment in our non-U.S. operations.
Interest Rate Risk
State Street’s financial performance could be unfavorably affected by changes in interest rates asthey impact our asset and liability management process. The levels of global market interest rates, theshape of these yield curves (changes in the relationship between short- and long-term interest rates),the direction and speed of interest rate changes, and the asset and liability spreads relative to thecurrency and geographic mix of our interest-earning assets and interest-bearing liabilities, affect our netinterest revenue. Our ability to anticipate these changes and/or to hedge the related exposures on andoff our balance sheet can significantly influence the success of our asset and liability managementprocess and the resulting level of our net interest revenue. The impact of changes in interest rates willdepend on the relative durations of assets and liabilities in accordance with their relevant currencies. Ingeneral, sustained lower interest rates, a flat or inverted yield curve and narrow interest-rate spreadshave a constraining effect on our net interest revenue.
Operational Risk
Operational risk is inherent in all of State Street’s activities. Our customers have a broad array ofcomplex and specialized servicing, confidentiality and fiduciary requirements. We have establishedpolicies, procedures and systems designed to comply with these regulatory and operational riskrequirements. We also face the potential for loss resulting from inadequate or failed internal processes,employee supervisory or monitoring mechanisms, or other systems or controls, and from externalevents, which could materially affect our future results of operations. We may also be subject todisruptions from events that are wholly or partially beyond our control, which could cause delays ordisruptions to operational functions, including information processing and financial market settlementfunctions. In addition, our customers, vendors and counterparties could suffer from such events. Shouldthese events affect us, or the customers, vendors or counterparties with which we conduct business, ourresults of operations could be negatively affected.
Our success depends, in large part, on our ability to attract and retain key people. Competition forthe best people in most activities in which we engage can be intense, and we may not be able to hirepeople or retain them. The unexpected loss of services of one or more of our key personnel could havea material adverse impact on our business because of their skills, their knowledge of our markets, theiryears of industry experience, and, in some cases, the difficulty of promptly finding qualifiedreplacement personnel. Similarly, the loss of key portfolio management staff, either individually or as agroup, can adversely impact customer perception of SSgA’s ability to continue to manage certain typesof investment management mandates. In some of our businesses, we have experienced significantemployee turnover, which increases costs, requires additional training and increases the potential foroperational risks.
We enter into long-term fixed-price contracts to provide middle office or investment manager andhedge fund manager operations outsourcing services to customers, services related but not limited tocertain trading activities, cash reporting, settlement and reconciliation activities, collateral managementand information technology development. These long-term contracts require considerable up-frontinvestment by us, including technology and conversion costs, and carry the risk that pricing for theproducts and services we provide might not prove adequate to generate expected operating marginsover the term of the contracts. Profitability of these contracts is largely a function of our ability toaccurately calculate pricing for our services and our ability to control our costs and maintain therelationship with the customer for an adequate period of time to recover our up-front investment.
15
Performance risk exists in each contract, given our dependence on successful conversion andimplementation onto our own operating platforms of the service activities provided. In addition, ourfailure to meet specified service levels may adversely affect our revenue from such arrangements, orpermit early termination of the contracts by the customer.
We actively strive to achieve significant cost savings by shifting certain business processes tolower-cost geographic locations, while continuing to maintain service quality, control and effectivemanagement of risks within these business operations. This transition to a true ‘‘shared services’’operational model focuses on certain core service offerings, including middle- and back-officereconciliations, securities processing and transfer agency activities. We have employed various structuralarrangements to achieve these goals, including establishing operations in lower cost areas, such asEastern Europe, India and China, forming joint ventures in India and China and outsourcing tovendors in various jurisdictions. The increased elements of risk that arise from conducting certainoperating processes in some jurisdictions could lead to an increase in reputational risk. During periodsof transition, greater operational risk and client concern exists regarding the continuity of a high levelof service delivery. The extent and pace at which we are able to move functions to lower-cost locationsmay also be impacted by regulatory and customer acceptance issues. Such relocation of functions alsoentails costs, such as technology and real estate expenses, that partially offset the financial benefits ofthe lower-cost locations.
Our businesses depend on an information technology infrastructure to record and process a largevolume of increasingly complex transactions, in many currencies, on a daily basis, across numerous anddiverse markets. Any interruptions, delays and/or breakdowns of this infrastructure can result insignificant costs. As a result, we continue to invest significantly in this infrastructure. Our businessesand our relationship with customers, are dependent upon our ability to maintain the confidentiality ofour and our customers’ trade secrets and confidential information (including personal data of theircustomers). A failure of our security measures in such regard could have a material adverse impact onour competitive position, relationship with customers and reputation. To the extent that we are not ableto protect our intellectual property through patents or other means, we are also exposed to the riskthat employees with knowledge of such intellectual property may leave and seek to exploit ourintellectual property for their own advantage.
Litigation Risks
From time to time, our customers may make claims and take legal action relating to ourperformance of fiduciary or contractual responsibilities. If such claims and legal actions are notresolved in a manner favorable to us, such claims may result in financial liability to State Street and/oradversely affect the market perception of us and our products and services, and could impact customerdemand for our products and services. We record balance sheet reserves for probable losscontingencies, including litigation and operational losses. However, we cannot always accuratelyestimate our ultimate exposure. As a result, any reserves we establish to cover any settlements,judgments or operational losses may not be sufficient to cover our actual financial exposure. Anyunderestimation or overestimation could have a material impact on our consolidated financial conditionor results of operations.
In connection with certain of SSgA’s active fixed-income strategies, we established a reserve tocover legal exposure and related costs in connection with such strategies as of December 31, 2007.Among other things, the portfolio managers for certain actively managed fixed-income strategiesmaterially increased the exposure of these strategies to securities backed by sub-prime mortgages andshifted the weighting of these portfolios to more highly rated sub-prime instruments. During the thirdquarter of 2007, as the liquidity and valuations of these securities, including the more highly ratedinstruments, came under increased pressure, the performance of these strategies was adversely affected,in some cases significantly. The underperformance, which was greater than that typically associated with
16
fixed-income funds, also caused a number of our customers to question whether the execution of thesestrategies was consistent with their investment intent. This has resulted in several civil suits, includingputative class action claims. These lawsuits allege, among other things, that we failed to comply withour standard of care in managing these active funds as a fiduciary under ERISA. We have also receivedinquiries from regulatory authorities regarding SSgA’s active fixed-income strategies. Given our desireto fully respond to customer concerns, following the end of the third quarter of 2007, State Streetundertook a further review of all the actively managed fixed-income strategies at SSgA that wereexposed to sub-prime investments. Based on our review and on-going discussions with customers whowere invested in these strategies, we established the reserve to address our estimated legal exposure.
The reserve was established based upon our best judgment as to legal exposures and related costsassociated with the active fixed-income investments. As of December 31, 2007, we had entered intosettlement agreements with aggregate total payments of $16 million. We believe that our reserve will beadequate to accommodate the potential exposure relating to SSgA’s active fixed-income strategies. Theamount of the reserve is based on certain assumptions. While we believe the reserve represents areasonable estimate of our legal exposure and other costs associated with these issues, we do notbelieve that it is feasible to predict or determine the amount of such exposure with certainty. As such,it is possible that we have overestimated or underestimated our exposure. If the amount of our actualexposure is materially different from our reserve, there would be a material impact on our financialcondition and results of operations.
To determine whether the issues that arose within the active fixed-income area are limited toSSgA’s active fixed-income strategies, we are conducting, with the assistance of third-party consultants, asystematic review of the operational, risk and compliance infrastructure, procedures and resourcesacross SSgA’s entire product line. This review has only recently begun and no conclusions orrecommendations have resulted from that review as of the date of this filing. While we do not believethat such review will identify material legal or regulatory exposures, there can be no assurance as to theconclusions of such review.
Regulatory/Legal/Accounting/Tax Risk
Most of our businesses are subject to extensive regulation, and many of the customers to which weprovide services are themselves subject to a broad range of regulatory requirements. These regulationsmay affect the manner and terms of delivery of our services. As a financial institution with substantialinternational operations, we are subject to extensive regulatory and supervisory oversight, both in theUnited States and overseas in connection with our global operations. Our businesses are subject tostringent regulation and examination by U.S. federal and state governmental and regulatory agencies,including the Federal Reserve, the SEC and the Massachusetts Commissioner of Banks, andself-regulatory organizations (including securities exchanges), and by non-U.S. governmental andregulatory agencies and self-regulatory organizations. The regulations affect, among other things, thescope of our activities and customer services, our capital structure and our ability to fund theoperations of our subsidiaries, our lending practices, our dividend policy and the manner in which wemarket our services. Evolving regulations, such as the new Basel II capital framework and anti-moneylaundering regulations, can require significant effort on our part to ensure compliance. New ormodified regulations and related regulatory guidance may have unforeseen or unintended adverseeffects on the financial services industry.
If we do not comply with governmental regulations, we may be subject to fines, penalties ormaterial restrictions on our businesses in the jurisdiction where the violation occurred, which mayadversely affect our business operations and, in turn, our financial results. Similarly, many of ourcustomers are subject to significant regulatory requirements, and retain our services in order for us toassist them in complying with those legal requirements. Changes in these regulations can significantlyaffect the services that we are asked to provide, as well as our costs. If we cause customers to fail to
17
comply with these regulatory requirements, we may be liable to them for losses and expenses that theyincur. In addition, adverse publicity and damage to our reputation arising from the failure or perceivedfailure to comply with legal, regulatory or contractual requirements could affect our ability to attractand retain customers or to maintain access to capital markets, or could result in enforcement actions,fines, penalties and lawsuits. In recent years, regulatory oversight and enforcement have increasedsubstantially, imposing additional costs and increasing the potential risks associated with our operations.If this regulatory trend continues, it could adversely affect our operations and, in turn, our financialresults.
New accounting requirements, or changes in the interpretation of existing accounting requirements,by the Financial Accounting Standards Board or the SEC, can potentially affect our consolidatedfinancial condition and results of operations, as accounting rules in the United States and otherjurisdictions consistently evolve to reflect the increasing complexities of business. These changes arevery difficult to predict, and can materially impact how we record and report our financial conditionand results of operations and other financial information. In some cases, we could be required to applya new or revised standard retroactively, resulting in the revised treatment of certain transactions oractivities, and, in some cases, the restatement of prior period financial statements.
Our businesses can be affected by new tax legislation or the interpretation of existing tax lawsworldwide. Changes in tax laws may affect our business directly or indirectly through their impact onthe financial markets. In the normal course of business, we are subject to reviews by U.S. andnon-U.S. tax authorities. These reviews may result in adjustments to the timing or amount of taxes dueand the allocation of taxable income among tax jurisdictions. These adjustments could affect theattainment of our financial goals.
Risk Management
We seek to monitor and manage risk on a corporate basis and within specific business units. Thetypes of risk that we monitor and seek to manage include operational risk, interest rate risk, tradingrisk, fiduciary risk, legal and compliance risk, liquidity risk and credit risk. We have adopted variouspolicies, procedures and systems to monitor and manage risk. There can be no assurance that thosepolicies, procedures or systems are adequate to identify and mitigate all risks inherent in our variousbusiness. In addition, our businesses and the markets in which we operate are continuously evolving.We may fail to fully understand the implications of changes in our business or the financial marketsand fail to adequately or timely enhance our risk framework to address those changes. If our riskframework is ineffective, either because it fails to keep pace with changes in the financial markets orour business or for other reasons, we could incur losses.
We also measure our material risks. Our measurement methodologies rely upon many assumptionsand historical analyses and correlations. There can be no assurance that those assumptions will becorrect or that the historical correlations will continue to be relevant. Consequently the measurementsthat we make for regulatory and economic capital may not adequately capture or express the true riskprofiles of our businesses. Additionally, as businesses and markets evolve, our measurements may notaccurately reflect those changes. While our risk measures may indicate sufficient capitalization, we mayin fact have inadequate capital to conduct our businesses.
ITEM 1B. UNRESOLVED STAFF COMMENTS
None.
ITEM 2. PROPERTIES
We occupy a total of approximately 6.8 million square feet of office space and related facilitiesaround the world, of which approximately 6.1 million square feet are leased. Of the total leased space,
18
approximately 3.4 million square feet are located in eastern Massachusetts. An additional 1.3 millionsquare feet are located elsewhere throughout the U.S. and in Canada. We occupy approximately1.0 million square feet in Europe, and approximately 370,000 square feet in the Asia/Pacific region.
Our headquarters is located at State Street Financial Center, One Lincoln Street, Boston,Massachusetts, a 36-story office building. We have leased the entire 1,025,000 square feet of thisbuilding, as well as the entire 366,000-square-foot parking garage at One Lincoln Street, under 20-yearnon-cancelable capital leases. A portion of the lease payments is offset by subleases for 153,000 squarefeet of the building. We occupy two buildings located in Quincy, Massachusetts, one of which we ownand the other we lease. The buildings, containing a total of approximately 821,000 square feet, functionas State Street Bank’s principal operations facilities.
Additional information about our occupancy costs, including commitments under non-cancelableleases, is in note 18 of the Notes to Consolidated Financial Statements included in this Form 10-Kunder Item 8.
ITEM 3. LEGAL PROCEEDINGS
We are involved in various industry-related and other regulatory, governmental and lawenforcement inquiries and subpoenas, as well as legal proceedings, including recent proceedings relatedto SSgA’s active fixed-income strategies, that arise in the normal course of business. For a discussion ofrecent proceedings, litigation exposure and related costs and other similar matters associated withSSgA’s active fixed-income strategies, including the establishment of a reserve of approximately$625 million, refer to ‘‘Risk Factors—Litigation Risks’’ included under Item 1A; the ‘‘Summary,’’‘‘Financial Highlights,’’ ‘‘Operating Expenses’’ and ‘‘Line of Business Information’’ sections ofManagement’s Discussion and Analysis of Financial Condition and Results of Operations includedunder Item 7; and note 10 of the Notes to Consolidated Financial Statements included under Item 8 ofthis Form 10-K. In the opinion of management, after discussion with counsel, these regulatory,governmental and law enforcement inquiries and subpoenas and legal proceedings, including the above-mentioned matters associated with SSgA’s active fixed-income strategies, can be defended or resolvedwithout a material adverse effect on our consolidated financial position or results of operations infuture periods.
ITEM 4. SUBMISSION OF MATTERS TO A VOTE OF SECURITIES HOLDERS
None.
19
ITEM 4A. EXECUTIVE OFFICERS OF THE REGISTRANT
The following table sets forth certain information with regard to each of our executive officers asof February 15, 2008.
Name Age Position
Ronald E. Logue . . . . . . . . . . . . . 62 Chairman, President, Chief Executive Officer and ChiefOperating Officer
Joseph C. Antonellis . . . . . . . . . . . 53 Vice ChairmanJoseph L. Hooley . . . . . . . . . . . . . 50 Vice ChairmanJeffrey N. Carp . . . . . . . . . . . . . . . 51 Executive Vice President, Chief Legal Officer and SecretaryJoseph W. Chow . . . . . . . . . . . . . . 55 Executive Vice PresidentJames J. Malerba . . . . . . . . . . . . . 53 Senior Vice President and Corporate ControllerDavid C. O’Leary . . . . . . . . . . . . . 61 Executive Vice PresidentJames S. Phalen . . . . . . . . . . . . . . 57 Executive Vice President; Interim President and Chief
Executive Officer of State Street Global AdvisorsDavid C. Phelan . . . . . . . . . . . . . . 50 Executive Vice President, General Counsel and Assistant
SecretaryEdward J. Resch . . . . . . . . . . . . . . 55 Executive Vice President and Chief Financial OfficerStanley W. Shelton . . . . . . . . . . . . 53 Executive Vice President
All executive officers are appointed by the Board of Directors. All officers hold office at thediscretion of the Board. There are no family relationships among any of our directors and executiveofficers.
Mr. Logue joined State Street in 1990. He has served as President since 2001 and Chief OperatingOfficer since 2000. In June 2004, he was appointed Chairman and Chief Executive Officer.
Mr. Antonellis joined State Street in 1991. In 2003, he was named head of Information Technologyand Global Securities Services. In 2006, he was appointed Vice Chairman with additional responsibilityas head of Investor Services in North America and Global Investment Manager Outsourcing Services.
Mr. Hooley joined State Street in 1986. Since 2002, he has served as Executive Vice President andhead of Investor Services. In 2006, he was appointed Vice Chairman and global head of InvestmentServicing and Investment Research and Trading.
Mr. Carp joined State Street in January 2006 as Executive Vice President and Chief Legal Officer.In 2006, he was also appointed Secretary. From April 2004 until December 2005, Mr. Carp served asexecutive vice president and general counsel of Massachusetts Financial Services, an investmentmanagement and research company. From 1989 until 2004, Mr. Carp was a senior partner at the lawfirm of Hale and Dorr LLP, where he was an attorney since 1982.
Mr. Chow first joined State Street in 1990, retired in 2003, and rejoined State Street in 2004.When he retired in 2003, he was Executive Vice President and head of Credit and Risk Policy. Since2004, he has served as Executive Vice President, Risk and Corporate Administration, and is engaged ina variety of strategic and management initiatives across the organization.
Mr. Malerba joined State Street in November 2004 as Deputy Corporate Controller. In 2006, hewas appointed Corporate Controller. Prior to joining State Street, he served as Deputy Controller atFleetBoston Financial Corporation from December 2000 and continued in that role after the mergerwith Bank of America Corporation in April 2004.
Mr. O’Leary joined State Street in 2005 as Executive Vice President and head of Global HumanResources. In 2004, he served as a senior advisor to Credit Suisse First Boston Corporation, a global
20
financial services company, after serving as Managing Director from 1990 to 2003 and Global Head ofHuman Resources from 1988 to 2003.
Mr. James Phalen joined State Street in 1992. As of 2003, he served as Executive Vice President ofState Street and Chairman and Chief Executive Officer of CitiStreet, a global benefit provider andretirement plan recordkeeper. In February 2005, he was appointed head of Investor Services in NorthAmerica. In 2006, he was appointed head of international operations for Investment Servicing andInvestment Research and Trading, based in Europe. In January 2008, he was appointed InterimPresident and Chief Executive Officer of State Street Global Advisors.
Mr. David Phelan joined State Street in 2006 as Executive Vice President, General Counsel andAssistant Secretary. From 1995 until 2006, he was a senior partner at the law firm of Hale andDorr LLP (and, following a merger, of Wilmer Cutler Pickering Hale and Dorr LLP), where he was anattorney since 1993.
Mr. Resch joined State Street in 2002 as Executive Vice President and Chief Financial Officer. Healso served as Treasurer from 2006 until January 2008.
Mr. Shelton joined State Street in 1984. Since prior to 2003, he has served as Executive VicePresident and head of State Street Global Markets.
21
PART II
ITEM 5. MARKET FOR REGISTRANT’S COMMON EQUITY, RELATEDSTOCKHOLDER MATTERS AND ISSUER PURCHASES OF EQUITY SECURITIES
MARKET FOR REGISTRANT’S COMMON EQUITY
Our common stock is listed on the New York Stock Exchange under the ticker symbol STT. Therewere 4,432 shareholders of record at December 31, 2007. Information concerning the market prices of,and dividends on, our common stock during the past two years is included in this Form 10-K underItem 8, under the caption ‘‘Quarterly Summarized Financial Information.’’
In March 2007, our Board of Directors authorized the purchase of up to 15 million shares ofcommon stock for general corporate purposes, including mitigating the dilutive impact of shares issuedunder employee benefit plans, in addition to its previous authorization in 2006 of up to 15 millionshares, of which 12.2 million shares remained available for purchase at December 31, 2006. Wegenerally employ third-party broker/dealers to acquire shares on the open market in connection withour common stock purchase program.
Under the above-described authorization, during 2007 we repurchased 13.4 million shares of ourcommon stock, and an additional .6 million shares in January 2008, in connection with a $1 billionaccelerated share repurchase program that concluded on January 18, 2008. As of that date,approximately 13.2 million shares remained available for future purchase under the combinedauthorization described above.
RELATED STOCKHOLDER MATTERS
As a bank holding company, the parent company is a legal entity separate and distinct from itsprincipal banking subsidiary, State Street Bank, and its non-bank subsidiaries. The right of the parentcompany to participate as a shareholder in any distribution of assets of State Street Bank upon itsliquidation, reorganization or otherwise is subject to the prior claims by creditors of State Street Bank,including obligations for federal funds purchased and securities sold under repurchase agreements anddeposit liabilities. Payment of dividends by State Street Bank is subject to the provisions ofMassachusetts banking law, which provide that dividends may be paid out of net profits provided(i) capital stock and surplus remain unimpaired, (ii) dividend and retirement fund requirements of anypreferred stock have been met, (iii) surplus equals or exceeds capital stock, and (iv) losses and baddebts, as defined, in excess of reserves specifically established for such losses and bad debts, have beendeducted from net profits.
Under the Federal Reserve Act, the approval of the Federal Reserve Board would be required ifdividends declared by State Street Bank in any year exceeded the total of its net profits for that yearcombined with retained net profits for the preceding two years, less any required transfers to surplus.Information about dividends from our subsidiary banks is in note 14 of the Notes to ConsolidatedFinancial Statements included in this Form 10-K under Item 8. Future dividend payments of StateStreet Bank and other non-bank subsidiaries cannot be determined at this time.
22
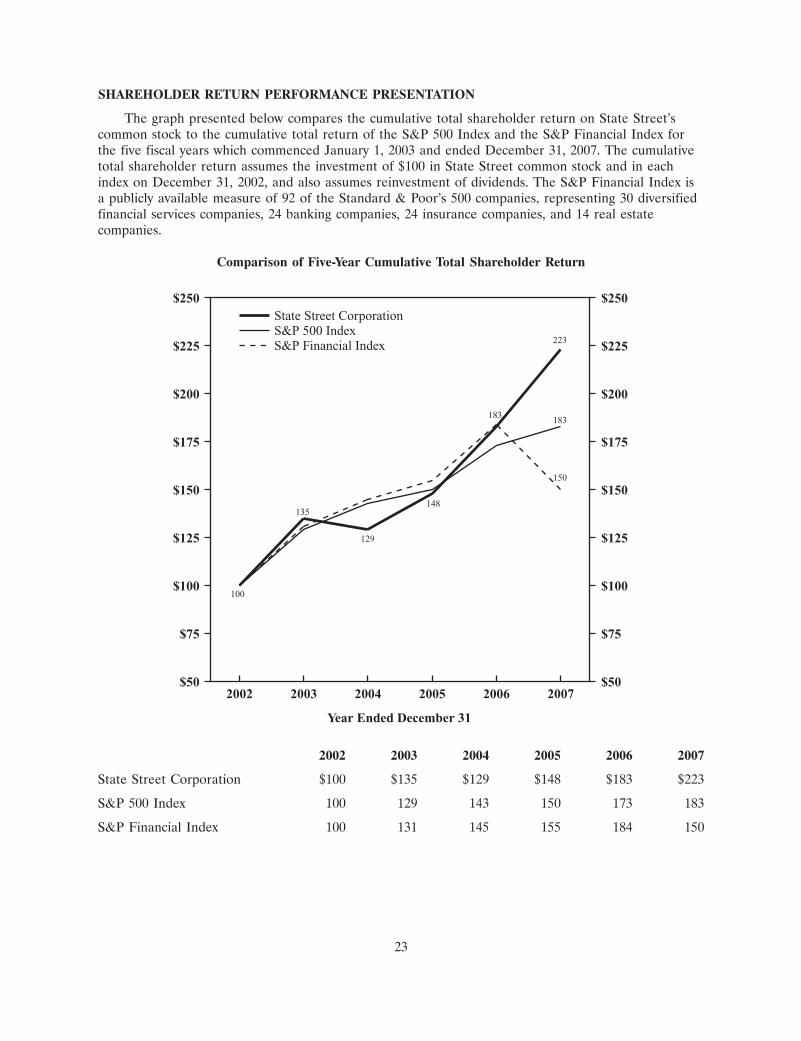
29JAN200805572913
SHAREHOLDER RETURN PERFORMANCE PRESENTATION
The graph presented below compares the cumulative total shareholder return on State Street’scommon stock to the cumulative total return of the S&P 500 Index and the S&P Financial Index forthe five fiscal years which commenced January 1, 2003 and ended December 31, 2007. The cumulativetotal shareholder return assumes the investment of $100 in State Street common stock and in eachindex on December 31, 2002, and also assumes reinvestment of dividends. The S&P Financial Index isa publicly available measure of 92 of the Standard & Poor’s 500 companies, representing 30 diversifiedfinancial services companies, 24 banking companies, 24 insurance companies, and 14 real estatecompanies.
Comparison of Five-Year Cumulative Total Shareholder Return
$250
$225
$200
$175
$150
100
135
129
148
183
223
183
150
$125
$100
$75
2002 20072006200520042003$50
$250
$225
$200
$175
$150
$125
$100
$75
$50
State Street CorporationS&P 500 IndexS&P Financial Index
Year Ended December 31
2002 2003 2004 2005 2006 2007
State Street Corporation $100 $135 $129 $148 $183 $223
S&P 500 Index 100 129 143 150 173 183
S&P Financial Index 100 131 145 155 184 150
23
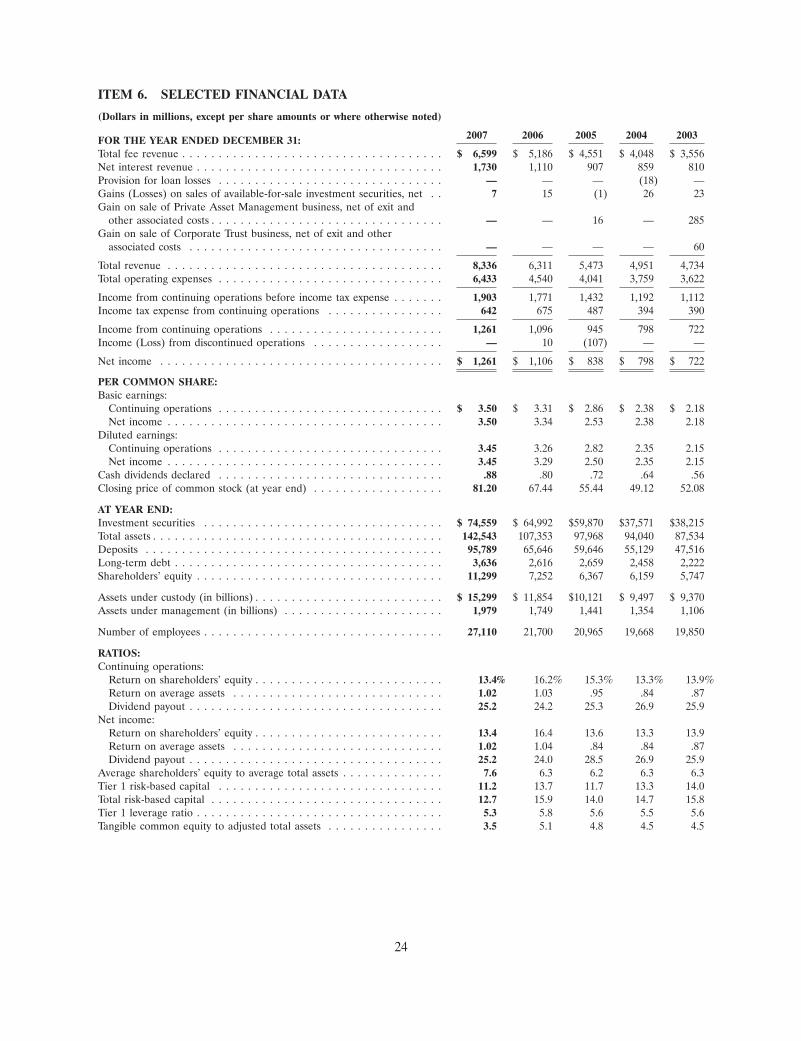
ITEM 6. SELECTED FINANCIAL DATA
(Dollars in millions, except per share amounts or where otherwise noted)
2007 2006 2005 2004 2003FOR THE YEAR ENDED DECEMBER 31:Total fee revenue . . . . . . . . . . . . . . . . . . . . . . . . . . . . . . . . . . . . $ 6,599 $ 5,186 $ 4,551 $ 4,048 $ 3,556Net interest revenue . . . . . . . . . . . . . . . . . . . . . . . . . . . . . . . . . . 1,730 1,110 907 859 810Provision for loan losses . . . . . . . . . . . . . . . . . . . . . . . . . . . . . . . — — — (18) —Gains (Losses) on sales of available-for-sale investment securities, net . . 7 15 (1) 26 23Gain on sale of Private Asset Management business, net of exit and
other associated costs . . . . . . . . . . . . . . . . . . . . . . . . . . . . . . . . — — 16 — 285Gain on sale of Corporate Trust business, net of exit and other
associated costs . . . . . . . . . . . . . . . . . . . . . . . . . . . . . . . . . . . — — — — 60
Total revenue . . . . . . . . . . . . . . . . . . . . . . . . . . . . . . . . . . . . . . 8,336 6,311 5,473 4,951 4,734Total operating expenses . . . . . . . . . . . . . . . . . . . . . . . . . . . . . . . 6,433 4,540 4,041 3,759 3,622
Income from continuing operations before income tax expense . . . . . . . 1,903 1,771 1,432 1,192 1,112Income tax expense from continuing operations . . . . . . . . . . . . . . . . 642 675 487 394 390
Income from continuing operations . . . . . . . . . . . . . . . . . . . . . . . . 1,261 1,096 945 798 722Income (Loss) from discontinued operations . . . . . . . . . . . . . . . . . . — 10 (107) — —
Net income . . . . . . . . . . . . . . . . . . . . . . . . . . . . . . . . . . . . . . . $ 1,261 $ 1,106 $ 838 $ 798 $ 722
PER COMMON SHARE:Basic earnings:
Continuing operations . . . . . . . . . . . . . . . . . . . . . . . . . . . . . . . $ 3.50 $ 3.31 $ 2.86 $ 2.38 $ 2.18Net income . . . . . . . . . . . . . . . . . . . . . . . . . . . . . . . . . . . . . . 3.50 3.34 2.53 2.38 2.18
Diluted earnings:Continuing operations . . . . . . . . . . . . . . . . . . . . . . . . . . . . . . . 3.45 3.26 2.82 2.35 2.15Net income . . . . . . . . . . . . . . . . . . . . . . . . . . . . . . . . . . . . . . 3.45 3.29 2.50 2.35 2.15
Cash dividends declared . . . . . . . . . . . . . . . . . . . . . . . . . . . . . . . .88 .80 .72 .64 .56Closing price of common stock (at year end) . . . . . . . . . . . . . . . . . . 81.20 67.44 55.44 49.12 52.08
AT YEAR END:Investment securities . . . . . . . . . . . . . . . . . . . . . . . . . . . . . . . . . $ 74,559 $ 64,992 $59,870 $37,571 $38,215Total assets . . . . . . . . . . . . . . . . . . . . . . . . . . . . . . . . . . . . . . . . 142,543 107,353 97,968 94,040 87,534Deposits . . . . . . . . . . . . . . . . . . . . . . . . . . . . . . . . . . . . . . . . . 95,789 65,646 59,646 55,129 47,516Long-term debt . . . . . . . . . . . . . . . . . . . . . . . . . . . . . . . . . . . . . 3,636 2,616 2,659 2,458 2,222Shareholders’ equity . . . . . . . . . . . . . . . . . . . . . . . . . . . . . . . . . . 11,299 7,252 6,367 6,159 5,747
Assets under custody (in billions) . . . . . . . . . . . . . . . . . . . . . . . . . . $ 15,299 $ 11,854 $10,121 $ 9,497 $ 9,370Assets under management (in billions) . . . . . . . . . . . . . . . . . . . . . . 1,979 1,749 1,441 1,354 1,106
Number of employees . . . . . . . . . . . . . . . . . . . . . . . . . . . . . . . . . 27,110 21,700 20,965 19,668 19,850
RATIOS:Continuing operations:
Return on shareholders’ equity . . . . . . . . . . . . . . . . . . . . . . . . . . 13.4% 16.2% 15.3% 13.3% 13.9%Return on average assets . . . . . . . . . . . . . . . . . . . . . . . . . . . . . 1.02 1.03 .95 .84 .87Dividend payout . . . . . . . . . . . . . . . . . . . . . . . . . . . . . . . . . . . 25.2 24.2 25.3 26.9 25.9
Net income:Return on shareholders’ equity . . . . . . . . . . . . . . . . . . . . . . . . . . 13.4 16.4 13.6 13.3 13.9Return on average assets . . . . . . . . . . . . . . . . . . . . . . . . . . . . . 1.02 1.04 .84 .84 .87Dividend payout . . . . . . . . . . . . . . . . . . . . . . . . . . . . . . . . . . . 25.2 24.0 28.5 26.9 25.9
Average shareholders’ equity to average total assets . . . . . . . . . . . . . . 7.6 6.3 6.2 6.3 6.3Tier 1 risk-based capital . . . . . . . . . . . . . . . . . . . . . . . . . . . . . . . 11.2 13.7 11.7 13.3 14.0Total risk-based capital . . . . . . . . . . . . . . . . . . . . . . . . . . . . . . . . 12.7 15.9 14.0 14.7 15.8Tier 1 leverage ratio . . . . . . . . . . . . . . . . . . . . . . . . . . . . . . . . . . 5.3 5.8 5.6 5.5 5.6Tangible common equity to adjusted total assets . . . . . . . . . . . . . . . . 3.5 5.1 4.8 4.5 4.5
24
ITEM 7. MANAGEMENT’S DISCUSSION AND ANALYSIS OF FINANCIAL CONDITION ANDRESULTS OF OPERATIONS
GENERAL
State Street Corporation is a financial holding company organized under the laws of theCommonwealth of Massachusetts. All references in this Management’s Discussion and Analysis to ‘‘theparent company’’ are to State Street Corporation. Unless otherwise indicated or unless the contextrequires otherwise, all references in this Management’s Discussion to ‘‘State Street,’’ ‘‘we,’’ ‘‘us,’’ ‘‘our’’or similar terms mean State Street Corporation and its subsidiaries on a consolidated basis. State StreetBank and Trust Company is referred to as ‘‘State Street Bank.’’ At December 31, 2007, we had totalassets of $142.54 billion, total deposits of $95.79 billion, total shareholders’ equity of $11.30 billion andemployed 27,110. With $15.30 trillion of assets under custody and $1.98 trillion of assets undermanagement at year-end 2007, we are a leading specialist in meeting the needs of institutional investorsworldwide.
We report two lines of business: Investment Servicing and Investment Management. These lines ofbusiness provide a full range of products and services for our customers, which include mutual fundsand other collective investment funds, corporate and public retirement plans, insurance companies,foundations, endowments and other investment pools, and investment managers. Investment Servicingprovides services to support institutional investors, such as custody, product- and participant-levelaccounting, daily pricing and administration; master trust and master custody; recordkeeping;shareholder services, including mutual fund and collective investment fund shareholder accounting;foreign exchange, brokerage and other trading services; securities finance; deposit and short-terminvestment facilities; loans and lease financing; investment manager and hedge fund manageroperations outsourcing; and performance, risk and compliance analytics. Investment Managementprovides a broad array of services for managing financial assets, such as investment research servicesand investment management, including passive and active U.S. and non-U.S. equity and fixed-incomestrategies. For additional information about our lines of business, see the ‘‘Line of BusinessInformation’’ section of this Management’s Discussion and Analysis and note 22 of the Notes toConsolidated Financial Statements included in this Form 10-K under Item 8.
This Management’s Discussion and Analysis should be read in conjunction with the ConsolidatedFinancial Statements and accompanying Notes to Consolidated Financial Statements included in thisForm 10-K under Item 8. Certain previously reported amounts presented have been reclassified toconform to current period classifications. We prepare our consolidated financial statements inaccordance with accounting principles generally accepted in the U.S., referred to as ‘‘GAAP’’. Thepreparation of financial statements in accordance with GAAP requires management to make estimatesand assumptions in the application of certain accounting policies that materially affect the reportedamounts of assets, liabilities, revenue, and expenses. Accounting policies that require management tomake assumptions that are difficult, subjective, or complex about matters that are uncertain and maychange in subsequent periods are discussed in more depth in the ‘‘Significant Accounting Estimates’’section of this Management’s Discussion and Analysis.
This Management’s Discussion and Analysis contains statements that are considered ‘‘forward-looking statements’’ within the meaning of U.S. federal securities laws. Forward-looking statements arebased on our current expectations about revenue and market growth, acquisitions and divestitures, newtechnologies, services and opportunities, earnings and other factors. These forward-looking statementsinvolve certain risks and uncertainties which could cause actual results to differ materially. Weundertake no obligation to revise the forward-looking statements contained in this Management’sDiscussion and Analysis to reflect events after the date we file this Form 10-K with the SEC.Additional information about forward-looking statements and related risks and uncertainties is includedin the Risk Factors section of this Form 10-K under Item 1A.
25
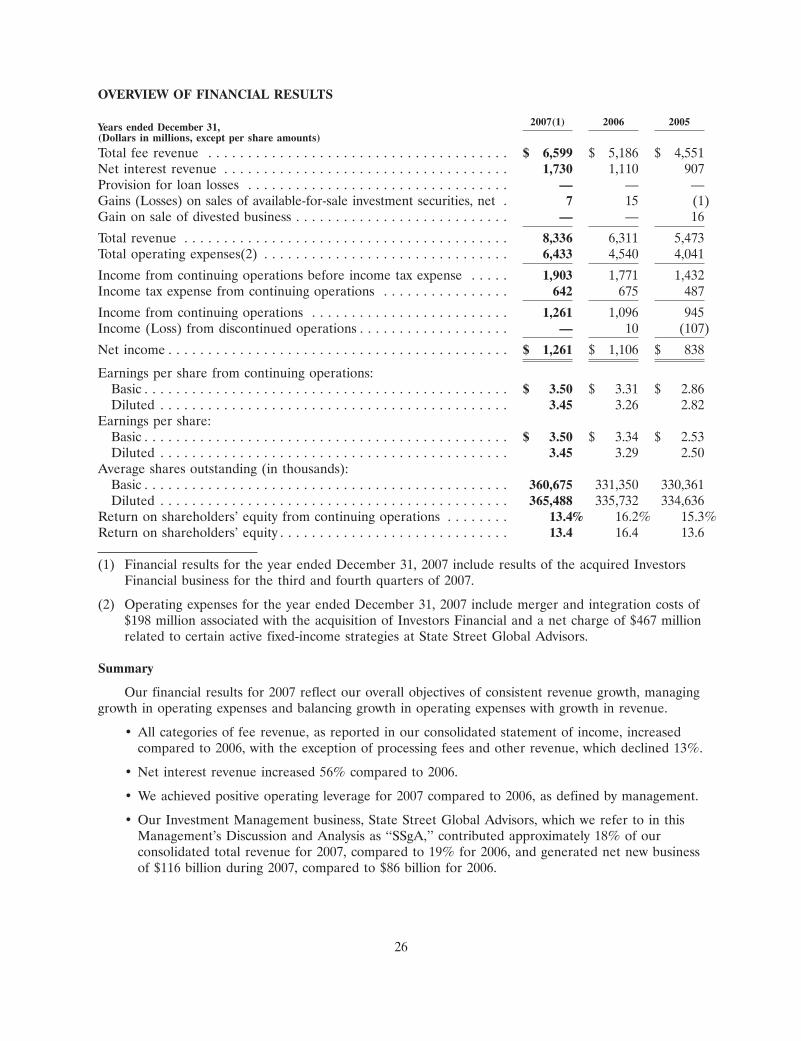
OVERVIEW OF FINANCIAL RESULTS
2007(1) 2006 2005Years ended December 31,(Dollars in millions, except per share amounts)
Total fee revenue . . . . . . . . . . . . . . . . . . . . . . . . . . . . . . . . . . . . . . $ 6,599 $ 5,186 $ 4,551Net interest revenue . . . . . . . . . . . . . . . . . . . . . . . . . . . . . . . . . . . . 1,730 1,110 907Provision for loan losses . . . . . . . . . . . . . . . . . . . . . . . . . . . . . . . . . — — —Gains (Losses) on sales of available-for-sale investment securities, net . 7 15 (1)Gain on sale of divested business . . . . . . . . . . . . . . . . . . . . . . . . . . . — — 16
Total revenue . . . . . . . . . . . . . . . . . . . . . . . . . . . . . . . . . . . . . . . . . 8,336 6,311 5,473Total operating expenses(2) . . . . . . . . . . . . . . . . . . . . . . . . . . . . . . . 6,433 4,540 4,041
Income from continuing operations before income tax expense . . . . . 1,903 1,771 1,432Income tax expense from continuing operations . . . . . . . . . . . . . . . . 642 675 487
Income from continuing operations . . . . . . . . . . . . . . . . . . . . . . . . . 1,261 1,096 945Income (Loss) from discontinued operations . . . . . . . . . . . . . . . . . . . — 10 (107)
Net income . . . . . . . . . . . . . . . . . . . . . . . . . . . . . . . . . . . . . . . . . . . $ 1,261 $ 1,106 $ 838
Earnings per share from continuing operations:Basic . . . . . . . . . . . . . . . . . . . . . . . . . . . . . . . . . . . . . . . . . . . . . . $ 3.50 $ 3.31 $ 2.86Diluted . . . . . . . . . . . . . . . . . . . . . . . . . . . . . . . . . . . . . . . . . . . . 3.45 3.26 2.82
Earnings per share:Basic . . . . . . . . . . . . . . . . . . . . . . . . . . . . . . . . . . . . . . . . . . . . . . $ 3.50 $ 3.34 $ 2.53Diluted . . . . . . . . . . . . . . . . . . . . . . . . . . . . . . . . . . . . . . . . . . . . 3.45 3.29 2.50
Average shares outstanding (in thousands):Basic . . . . . . . . . . . . . . . . . . . . . . . . . . . . . . . . . . . . . . . . . . . . . . 360,675 331,350 330,361Diluted . . . . . . . . . . . . . . . . . . . . . . . . . . . . . . . . . . . . . . . . . . . . 365,488 335,732 334,636
Return on shareholders’ equity from continuing operations . . . . . . . . 13.4% 16.2% 15.3%Return on shareholders’ equity . . . . . . . . . . . . . . . . . . . . . . . . . . . . . 13.4 16.4 13.6
(1) Financial results for the year ended December 31, 2007 include results of the acquired InvestorsFinancial business for the third and fourth quarters of 2007.
(2) Operating expenses for the year ended December 31, 2007 include merger and integration costs of$198 million associated with the acquisition of Investors Financial and a net charge of $467 millionrelated to certain active fixed-income strategies at State Street Global Advisors.
Summary
Our financial results for 2007 reflect our overall objectives of consistent revenue growth, managinggrowth in operating expenses and balancing growth in operating expenses with growth in revenue.
• All categories of fee revenue, as reported in our consolidated statement of income, increasedcompared to 2006, with the exception of processing fees and other revenue, which declined 13%.
• Net interest revenue increased 56% compared to 2006.
• We achieved positive operating leverage for 2007 compared to 2006, as defined by management.
• Our Investment Management business, State Street Global Advisors, which we refer to in thisManagement’s Discussion and Analysis as ‘‘SSgA,’’ contributed approximately 18% of ourconsolidated total revenue for 2007, compared to 19% for 2006, and generated net new businessof $116 billion during 2007, compared to $86 billion for 2006.
26
• We ended 2007 with levels of assets under custody and assets under management that increased29% and 13%, respectively, from year-end 2006.
• We completed our acquisition of Currenex in March 2007. For the period March to December2007, the acquired Currenex business contributed approximately $65 million of revenue,primarily other trading services revenue.
• We completed our acquisition of Investors Financial in July 2007, and issued approximately60.8 million shares in the transaction. For the second half of the year, the acquired InvestorsFinancial business contributed $456 million in revenue, including $395 million in fee revenue,and $340 million in operating expenses. In connection with the acquisition, during the secondhalf of the year we recorded $198 million, or $129 million after-tax, of merger and integrationcosts.
• During the second half of 2007, we purchased 13.4 million shares of our common stock, as wellas an additional .6 million shares in January 2008, under a $1 billion accelerated sharerepurchase program, which program concluded on January 18, 2008.
• During the fourth quarter of 2007, we recorded a net pre-tax charge of $467 million, or$279 million after-tax, to establish a reserve associated with certain active fixed-income strategiesmanaged by SSgA.
Certain financial information is presented and discussed in the following sections on both a GAAPbasis and on an ‘‘operating’’ basis. Management measures certain financial information on an operatingbasis to provide for meaningful comparisons from period to period, and to present comparablefinancial trends with respect to our normal ongoing business operations. Management believes thatoperating-basis financial information, which includes the impact of revenue from non-taxable sourcesand excludes the impact of non-recurring expenses, facilitates an investor’s understanding and analysisof State Street’s underlying performance and trends in addition to financial information prepared inaccordance with GAAP.
Financial Highlights
For 2007, we recorded income from continuing operations of $1.3 billion, or $3.45 per dilutedshare, compared to $1.1 billion, or $3.26 per diluted share, for 2006. Total revenue increased 32% from2006, and return on equity from continuing operations was 13.4% compared to 16.2% for 2006. Resultsfor 2007 included two significant expenses. First, we recorded aggregate merger and integration costs of$198 million, or $129 million after-tax, in connection with our acquisition of Investors Financial.Second, we recorded a net pre-tax charge of $467 million, or $279 million after-tax, in connection withthe establishment of a reserve to address legal exposure and other costs associated with theunderperformance of certain active fixed-income strategies managed by SSgA, and customer concernsas to whether the execution of these strategies was consistent with the customers’ investment intent.These costs are more fully discussed in the ‘‘Consolidated Results of Operations—Operating Expenses’’section of this Management’s Discussion and Analysis.
Our results for 2006 included income from discontinued operations of $10 million (pre-tax incomeof $16 million reduced by related income tax expense of $6 million), or $.03 per diluted share, theresult of the finalization of certain legal, selling and other costs recorded in connection with ourdivestiture of Bel Air Investment Advisors LLC.
Total revenue for 2007 grew 32% from 2006. Total fee revenue for 2007, which grew 27%, reflectedconsistent growth throughout the year in servicing fees and management fees, up 24% and 21%,respectively, compared to 2006, and trading services and securities finance revenue, up 34% and 76%,respectively. Generally, servicing fees benefited from the inclusion of the acquired Investors Financial
27
business, net new business and favorable equity markets, and management fees benefited primarilyfrom net new business and favorable equity markets. Trading services revenue grew primarily as a resultof increases in customer volumes and the inclusion of the acquired Investors Financial business, withrespect to foreign exchange revenue, and as a result of the inclusion of revenue from the acquiredCurrenex business, with respect to other trading services revenue. Securities finance revenue benefitedfrom increases in volumes of securities loaned, both from new customers and from growth in volumefrom existing customers, and increases in spreads.
Net interest revenue increased 56% compared to 2006, and net interest margin increased to 1.71%from 1.25%. This growth was the result of several favorable trends—(1) favorable rates and volumes onnon-U.S. deposits; (2) the addition of interest-earning assets from Investors Financial’s balance sheet;and (3) the favorable impact of fixed-rate investments.
Total operating expenses increased 42% from 2006, partly reflective of the $665 million aggregateimpact of merger and integration costs associated with Investors Financial and a net pre-tax chargeassociated with certain SSgA active fixed-income strategies. If these aggregate costs are excluded, totaloperating expenses for 2007 totaled $5.768 billion ($6.433 billion less $665 million), an increase of 27%from $4.54 billion for 2006, as we continued to carefully manage operating expenses and balancegrowth in operating expenses with growth in revenue. Most of the increase resulted from the inclusionof the operating expenses of the acquired Investors Financial business for the second half of 2007, aswell as increased incentive compensation due to improved performance and increased staffing levels tosupport new business, particularly internationally. Excluding the aggregate $665 million of merger andintegration costs and the net pre-tax charge, as a result of year-over-year growth in revenue of 32% andyear-over-year growth in total operating expenses of 27% as described above, we generated positiveoperating leverage of approximately 500 basis points. We define positive operating leverage as a rate oftotal revenue growth that exceeds the rate of growth of total operating expenses, determined on anoperating basis.
SSgA was a significant contributor to our overall results for 2007. Its total revenue increased 25%for 2007 over 2006, and comprised about 18% of our total consolidated revenue for 2007, compared to19% for 2006. In addition, SSgA generated net new business in assets under management, which weexpect will generate management fee revenue in future years, of approximately $116 billion for 2007,compared to $86 billion for 2006. The decline in SSgA’s relative contribution to our consolidated totalrevenue was the result of the impact of the acquired Investors Financial business’s revenue on totalrevenue of our Investment Servicing line of business, which increased 34% for 2007 over 2006.
We continue to expand our business outside of the U.S., particularly in Europe and theAsia/Pacific region. For 2007, approximately $3.42 billion, or 41% of our consolidated total revenue of$8.336 billion, was generated from non-U.S. activities, compared to 43% for 2006. The 2007 percentagereflects revenue from the acquired Investors Financial business, which was predominantly generated inthe U.S. For illustrative purposes, if we exclude total revenue from the acquired Investors Financialbusiness for 2007 of $456 million, non-U.S. revenue of $3.42 billion for 2007 comprised approximately43% of consolidated total revenue for 2007 of $7.88 billion ($8.336 billion less $456 million). Atyear-end 2007, we employed 9,500 outside the U.S., compared to 8,630 at year-end 2006. Our goal is toeventually generate 50% of our consolidated total revenue from outside the United States.
Assets under custody and assets under management both increased from year-end 2006, with assetsunder custody at $15.30 trillion, up 29% from $11.85 trillion a year ago, and assets under managementat $1.98 trillion, up 13% from $1.75 trillion a year ago. The acquired Investors Financial businesscontributed $1.9 trillion of assets under custody. Assets under custody have grown at a compoundannual rate of 13% since year-end 2003, with U.S. assets growing by 12% and non-U.S. assets growingby 16%, while assets under management have grown at a compound annual rate of 16% over the sameperiod.
28
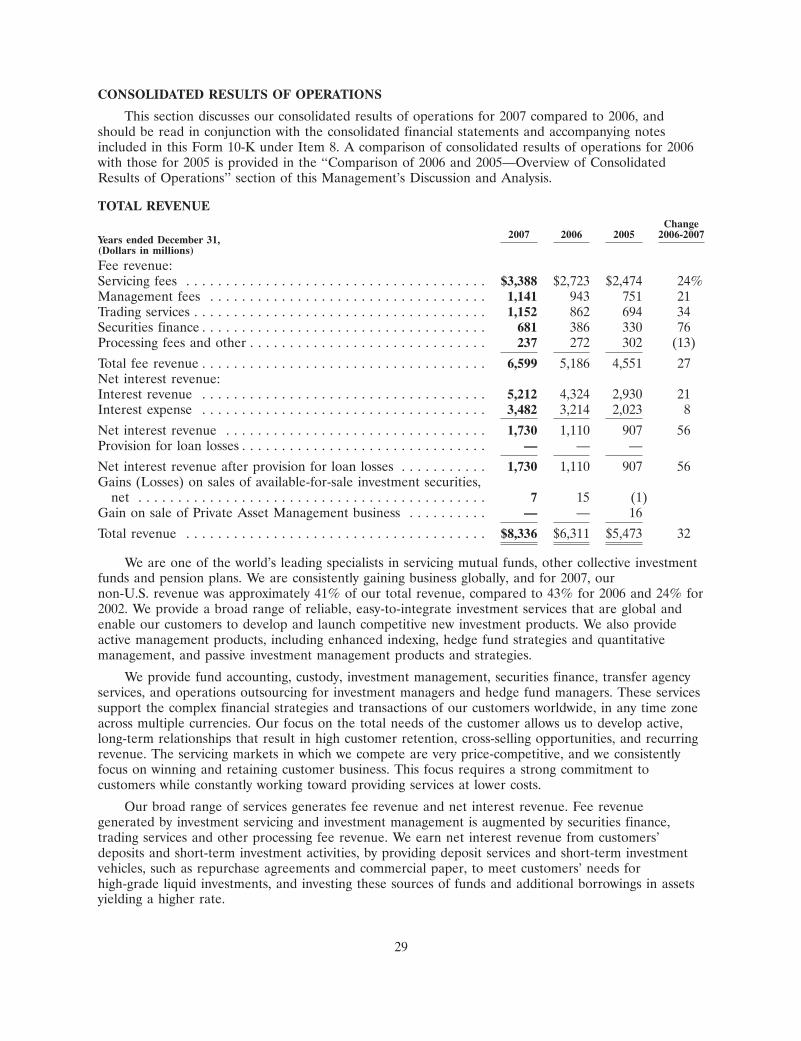
CONSOLIDATED RESULTS OF OPERATIONS
This section discusses our consolidated results of operations for 2007 compared to 2006, andshould be read in conjunction with the consolidated financial statements and accompanying notesincluded in this Form 10-K under Item 8. A comparison of consolidated results of operations for 2006with those for 2005 is provided in the ‘‘Comparison of 2006 and 2005—Overview of ConsolidatedResults of Operations’’ section of this Management’s Discussion and Analysis.
TOTAL REVENUEChange
2007 2006 2005 2006-2007Years ended December 31,(Dollars in millions)
Fee revenue:Servicing fees . . . . . . . . . . . . . . . . . . . . . . . . . . . . . . . . . . . . . . $3,388 $2,723 $2,474 24%Management fees . . . . . . . . . . . . . . . . . . . . . . . . . . . . . . . . . . . 1,141 943 751 21Trading services . . . . . . . . . . . . . . . . . . . . . . . . . . . . . . . . . . . . . 1,152 862 694 34Securities finance . . . . . . . . . . . . . . . . . . . . . . . . . . . . . . . . . . . . 681 386 330 76Processing fees and other . . . . . . . . . . . . . . . . . . . . . . . . . . . . . . 237 272 302 (13)
Total fee revenue . . . . . . . . . . . . . . . . . . . . . . . . . . . . . . . . . . . . 6,599 5,186 4,551 27Net interest revenue:Interest revenue . . . . . . . . . . . . . . . . . . . . . . . . . . . . . . . . . . . . 5,212 4,324 2,930 21Interest expense . . . . . . . . . . . . . . . . . . . . . . . . . . . . . . . . . . . . 3,482 3,214 2,023 8
Net interest revenue . . . . . . . . . . . . . . . . . . . . . . . . . . . . . . . . . 1,730 1,110 907 56Provision for loan losses . . . . . . . . . . . . . . . . . . . . . . . . . . . . . . . — — —
Net interest revenue after provision for loan losses . . . . . . . . . . . 1,730 1,110 907 56Gains (Losses) on sales of available-for-sale investment securities,
net . . . . . . . . . . . . . . . . . . . . . . . . . . . . . . . . . . . . . . . . . . . . 7 15 (1)Gain on sale of Private Asset Management business . . . . . . . . . . — — 16
Total revenue . . . . . . . . . . . . . . . . . . . . . . . . . . . . . . . . . . . . . . $8,336 $6,311 $5,473 32
We are one of the world’s leading specialists in servicing mutual funds, other collective investmentfunds and pension plans. We are consistently gaining business globally, and for 2007, ournon-U.S. revenue was approximately 41% of our total revenue, compared to 43% for 2006 and 24% for2002. We provide a broad range of reliable, easy-to-integrate investment services that are global andenable our customers to develop and launch competitive new investment products. We also provideactive management products, including enhanced indexing, hedge fund strategies and quantitativemanagement, and passive investment management products and strategies.
We provide fund accounting, custody, investment management, securities finance, transfer agencyservices, and operations outsourcing for investment managers and hedge fund managers. These servicessupport the complex financial strategies and transactions of our customers worldwide, in any time zoneacross multiple currencies. Our focus on the total needs of the customer allows us to develop active,long-term relationships that result in high customer retention, cross-selling opportunities, and recurringrevenue. The servicing markets in which we compete are very price-competitive, and we consistentlyfocus on winning and retaining customer business. This focus requires a strong commitment tocustomers while constantly working toward providing services at lower costs.
Our broad range of services generates fee revenue and net interest revenue. Fee revenuegenerated by investment servicing and investment management is augmented by securities finance,trading services and other processing fee revenue. We earn net interest revenue from customers’deposits and short-term investment activities, by providing deposit services and short-term investmentvehicles, such as repurchase agreements and commercial paper, to meet customers’ needs forhigh-grade liquid investments, and investing these sources of funds and additional borrowings in assetsyielding a higher rate.
29
Fee Revenue
Servicing and management fees are the largest components of fee revenue, and collectivelycomprised approximately 69% of total fee revenue for 2007 and 71% for 2006. These fees are afunction of several factors, including the mix and volume of assets under custody and assets undermanagement, securities positions held and the volume of portfolio transactions, and the types ofproducts and services used by customers, and are affected by changes in worldwide equity and fixed-income valuations.
Generally, servicing fees are impacted, in part, by changes in daily average valuations of assetsunder custody, while management fees are impacted by changes in month-end valuations of assetsunder management. Additional factors, such as the level of transaction volumes, changes in servicelevel, balance credits, customer minimum balances, pricing concessions and other factors may have asignificant impact on servicing fee revenue. Generally, management fee revenue is more sensitive tomarket valuations than servicing fee revenue. Management fees also include performance fees, whichamounted to approximately 6% of management fees for 2007 compared to 9% for 2006. Performancefees are generated when the performance of managed funds exceeds benchmarks specified in themanagement agreements, and we experience more volatility with performance fees than with moretraditional management fees.
In light of the above, we estimate, assuming all other factors remain constant, that a 10% increaseor decrease in worldwide equity values would result in a corresponding change in our total revenue ofapproximately 2%. If fixed-income security values were to increase or decrease by 10%, we wouldanticipate a corresponding change of approximately 1% in our total revenue.
The following table presents selected equity market indices. Daily averages and the averages ofmonth-end indices demonstrate worldwide equity market valuation changes that impact servicing andmanagement fee revenue, respectively. Year-end indices impact the value of assets under custody andmanagement at those dates. The index names listed in the table and elsewhere in this Management’sDiscussion and Analysis are service marks of their respective owners.
INDEX
Daily Averages of Indices Average of Month-End Indices Year-End Indices
2007 2006 Change 2007 2006 Change 2007 2006 Change
S&P 500� . . . . . . . . . . . 1,477 1,310 13% 1,478 1,318 12% 1,468 1,418 4%NASDAQ� . . . . . . . . . . 2,578 2,263 14 2,588 2,279 14 2,652 2,415 10MSCI EAFE� . . . . . . . 2,212 1,858 19 2,230 1,883 18 2,253 2,074 9
FEE REVENUE
Change2007 2006 2005 2006-2007Years ended December 31,
(Dollars in millions)
Servicing fees . . . . . . . . . . . . . . . . . . . . . . . . . . . . . . . . . . . . . . $3,388 $2,723 $2,474 24%Management fees(1) . . . . . . . . . . . . . . . . . . . . . . . . . . . . . . . . . 1,141 943 751 21Trading services . . . . . . . . . . . . . . . . . . . . . . . . . . . . . . . . . . . . . 1,152 862 694 34Securities finance . . . . . . . . . . . . . . . . . . . . . . . . . . . . . . . . . . . . 681 386 330 76Processing fees and other . . . . . . . . . . . . . . . . . . . . . . . . . . . . . . 237 272 302 (13)
Total fee revenue . . . . . . . . . . . . . . . . . . . . . . . . . . . . . . . . . . . . $6,599 $5,186 $4,551 27
(1) Includes performance fees of $72 million, $84 million and $41 million for 2007, 2006 and 2005,respectively.
30
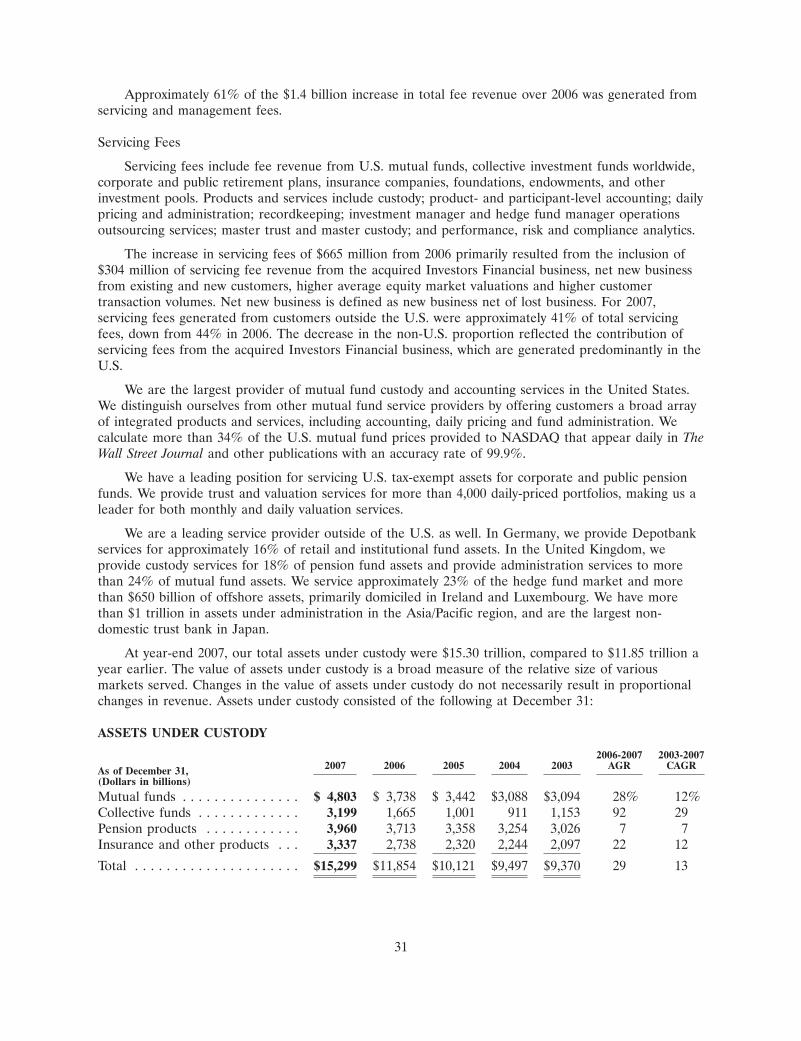
Approximately 61% of the $1.4 billion increase in total fee revenue over 2006 was generated fromservicing and management fees.
Servicing Fees
Servicing fees include fee revenue from U.S. mutual funds, collective investment funds worldwide,corporate and public retirement plans, insurance companies, foundations, endowments, and otherinvestment pools. Products and services include custody; product- and participant-level accounting; dailypricing and administration; recordkeeping; investment manager and hedge fund manager operationsoutsourcing services; master trust and master custody; and performance, risk and compliance analytics.
The increase in servicing fees of $665 million from 2006 primarily resulted from the inclusion of$304 million of servicing fee revenue from the acquired Investors Financial business, net new businessfrom existing and new customers, higher average equity market valuations and higher customertransaction volumes. Net new business is defined as new business net of lost business. For 2007,servicing fees generated from customers outside the U.S. were approximately 41% of total servicingfees, down from 44% in 2006. The decrease in the non-U.S. proportion reflected the contribution ofservicing fees from the acquired Investors Financial business, which are generated predominantly in theU.S.
We are the largest provider of mutual fund custody and accounting services in the United States.We distinguish ourselves from other mutual fund service providers by offering customers a broad arrayof integrated products and services, including accounting, daily pricing and fund administration. Wecalculate more than 34% of the U.S. mutual fund prices provided to NASDAQ that appear daily in TheWall Street Journal and other publications with an accuracy rate of 99.9%.
We have a leading position for servicing U.S. tax-exempt assets for corporate and public pensionfunds. We provide trust and valuation services for more than 4,000 daily-priced portfolios, making us aleader for both monthly and daily valuation services.
We are a leading service provider outside of the U.S. as well. In Germany, we provide Depotbankservices for approximately 16% of retail and institutional fund assets. In the United Kingdom, weprovide custody services for 18% of pension fund assets and provide administration services to morethan 24% of mutual fund assets. We service approximately 23% of the hedge fund market and morethan $650 billion of offshore assets, primarily domiciled in Ireland and Luxembourg. We have morethan $1 trillion in assets under administration in the Asia/Pacific region, and are the largest non-domestic trust bank in Japan.
At year-end 2007, our total assets under custody were $15.30 trillion, compared to $11.85 trillion ayear earlier. The value of assets under custody is a broad measure of the relative size of variousmarkets served. Changes in the value of assets under custody do not necessarily result in proportionalchanges in revenue. Assets under custody consisted of the following at December 31:
ASSETS UNDER CUSTODY
2006-2007 2003-20072007 2006 2005 2004 2003 AGR CAGRAs of December 31,
(Dollars in billions)
Mutual funds . . . . . . . . . . . . . . . $ 4,803 $ 3,738 $ 3,442 $3,088 $3,094 28% 12%Collective funds . . . . . . . . . . . . . 3,199 1,665 1,001 911 1,153 92 29Pension products . . . . . . . . . . . . 3,960 3,713 3,358 3,254 3,026 7 7Insurance and other products . . . 3,337 2,738 2,320 2,244 2,097 22 12
Total . . . . . . . . . . . . . . . . . . . . . $15,299 $11,854 $10,121 $9,497 $9,370 29 13
31

FINANCIAL INSTRUMENT MIX OF ASSETS UNDER CUSTODY
2007 2006 2005As of December 31,(In billions)
Equities . . . . . . . . . . . . . . . . . . . . . . . . . . . . . . . . . . . . . . . . . . . . . . . . $ 8,653 $ 5,821 $ 4,814Fixed-income . . . . . . . . . . . . . . . . . . . . . . . . . . . . . . . . . . . . . . . . . . . . 4,087 4,035 3,797Short-term and other investments . . . . . . . . . . . . . . . . . . . . . . . . . . . . . 2,559 1,998 1,510
Total . . . . . . . . . . . . . . . . . . . . . . . . . . . . . . . . . . . . . . . . . . . . . . . . . . $15,299 $11,854 $10,121
GEOGRAPHIC MIX OF ASSETS UNDER CUSTODY(1)
2007 2006 2005As of December 31,(In billions)
United States . . . . . . . . . . . . . . . . . . . . . . . . . . . . . . . . . . . . . . . . . . . . $11,792 $ 8,962 $ 7,773Other Americas . . . . . . . . . . . . . . . . . . . . . . . . . . . . . . . . . . . . . . . . . . 698 607 508Europe/Middle East/Africa . . . . . . . . . . . . . . . . . . . . . . . . . . . . . . . . . . 2,163 1,815 1,454Asia/Pacific . . . . . . . . . . . . . . . . . . . . . . . . . . . . . . . . . . . . . . . . . . . . . 646 470 386
Total . . . . . . . . . . . . . . . . . . . . . . . . . . . . . . . . . . . . . . . . . . . . . . . . . . $15,299 $11,854 $10,121
(1) Geographic mix is based on the location where the assets are serviced.
Management Fees
We provide a broad range of investment management strategies, specialized investmentmanagement advisory services and other financial services for corporations, public funds, and othersophisticated investors. These services are offered through SSgA. Based upon assets undermanagement, SSgA is the largest manager of institutional assets worldwide, the largest manager ofassets for tax-exempt organizations (primarily pension plans) in the United States, and the third largestinvestment manager overall in the world. SSgA offers a broad array of investment managementstrategies, including passive and active, such as enhanced indexing and hedge fund strategies, usingquantitative and fundamental methods for both U.S. and global equities and fixed income securities.SSgA also offers exchange traded funds, or ‘‘ETFs,’’ such as the SPDR� Dividend ETFs.
The $198 million increase in management fees from 2006 primarily resulted from net new businessand higher equity market valuations. Performance fees decreased from $84 million in 2006 to$72 million in 2007. Management fees generated from customers outside the United States wereapproximately 41% of total management fees, up from 32% for 2006.
At year-end 2007, assets under management were $1.98 trillion, compared to $1.75 trillion atyear-end 2006. While certain management fees are directly determined by the value of assets undermanagement and the investment strategy employed, management fees reflect other factors as well,including our relationship pricing for customers who use multiple services, and the benchmarksspecified in the respective management agreements related to performance fees. Accordingly, no directcorrelation necessarily exists between the value of assets under management, market indices andmanagement fee revenue. Assets under management consisted of the following at December 31:
32
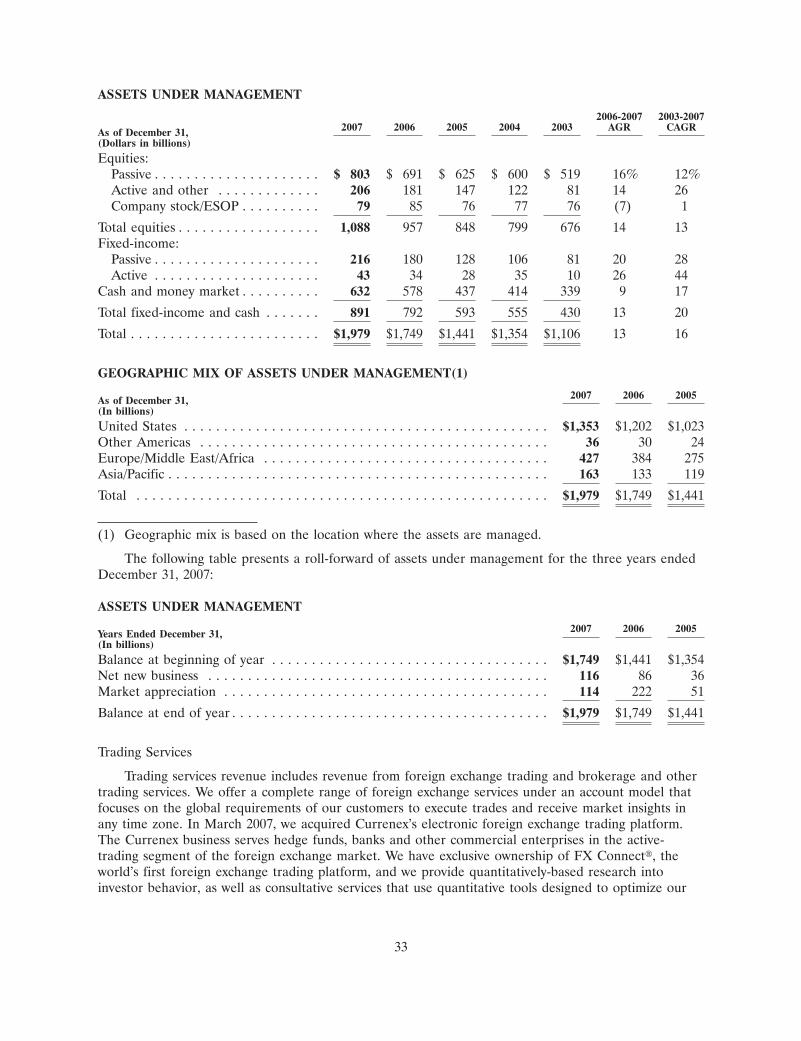
ASSETS UNDER MANAGEMENT
2006-2007 2003-20072007 2006 2005 2004 2003 AGR CAGRAs of December 31,
(Dollars in billions)
Equities:Passive . . . . . . . . . . . . . . . . . . . . . $ 803 $ 691 $ 625 $ 600 $ 519 16% 12%Active and other . . . . . . . . . . . . . 206 181 147 122 81 14 26Company stock/ESOP . . . . . . . . . . 79 85 76 77 76 (7) 1
Total equities . . . . . . . . . . . . . . . . . . 1,088 957 848 799 676 14 13Fixed-income:
Passive . . . . . . . . . . . . . . . . . . . . . 216 180 128 106 81 20 28Active . . . . . . . . . . . . . . . . . . . . . 43 34 28 35 10 26 44
Cash and money market . . . . . . . . . . 632 578 437 414 339 9 17
Total fixed-income and cash . . . . . . . 891 792 593 555 430 13 20
Total . . . . . . . . . . . . . . . . . . . . . . . . $1,979 $1,749 $1,441 $1,354 $1,106 13 16
GEOGRAPHIC MIX OF ASSETS UNDER MANAGEMENT(1)
2007 2006 2005As of December 31,(In billions)
United States . . . . . . . . . . . . . . . . . . . . . . . . . . . . . . . . . . . . . . . . . . . . . . $1,353 $1,202 $1,023Other Americas . . . . . . . . . . . . . . . . . . . . . . . . . . . . . . . . . . . . . . . . . . . . 36 30 24Europe/Middle East/Africa . . . . . . . . . . . . . . . . . . . . . . . . . . . . . . . . . . . . 427 384 275Asia/Pacific . . . . . . . . . . . . . . . . . . . . . . . . . . . . . . . . . . . . . . . . . . . . . . . . 163 133 119
Total . . . . . . . . . . . . . . . . . . . . . . . . . . . . . . . . . . . . . . . . . . . . . . . . . . . . $1,979 $1,749 $1,441
(1) Geographic mix is based on the location where the assets are managed.
The following table presents a roll-forward of assets under management for the three years endedDecember 31, 2007:
ASSETS UNDER MANAGEMENT
2007 2006 2005Years Ended December 31,(In billions)
Balance at beginning of year . . . . . . . . . . . . . . . . . . . . . . . . . . . . . . . . . . . $1,749 $1,441 $1,354Net new business . . . . . . . . . . . . . . . . . . . . . . . . . . . . . . . . . . . . . . . . . . . 116 86 36Market appreciation . . . . . . . . . . . . . . . . . . . . . . . . . . . . . . . . . . . . . . . . . 114 222 51
Balance at end of year . . . . . . . . . . . . . . . . . . . . . . . . . . . . . . . . . . . . . . . . $1,979 $1,749 $1,441
Trading Services
Trading services revenue includes revenue from foreign exchange trading and brokerage and othertrading services. We offer a complete range of foreign exchange services under an account model thatfocuses on the global requirements of our customers to execute trades and receive market insights inany time zone. In March 2007, we acquired Currenex’s electronic foreign exchange trading platform.The Currenex business serves hedge funds, banks and other commercial enterprises in the active-trading segment of the foreign exchange market. We have exclusive ownership of FX Connect�, theworld’s first foreign exchange trading platform, and we provide quantitatively-based research intoinvestor behavior, as well as consultative services that use quantitative tools designed to optimize our
33
customers’ returns. Foreign exchange trading revenue is influenced by three principal factors: thevolume and type of customer foreign exchange transactions; currency volatility; and the management ofcurrency market risks.
For 2007, foreign exchange trading revenue increased 31%, to $802 million from $611 million in2006, and benefited from the disruption in the global securities markets that occurred in the secondhalf of the year. The increase was mainly driven by a 39% increase in customer volumes, but also wasthe result of the inclusion of $43 million of foreign exchange revenue from the acquired InvestorsFinancial business. These increases were partly offset by an unfavorable transaction mix influenced bylower margin transactions and a 5% decline in currency volatility.
We also offer a range of brokerage and other trading products tailored specifically to meet theneeds of the global pension community, including transition management, commission recapture andself-directed brokerage. These products are differentiated by our position as an agent of theinstitutional investor. Brokerage and other trading fees were $350 million in 2007, up 39% compared to2006. The increase was attributable to the contribution of revenue from the acquired Currenex businessand an increase in revenue from transition management.
Securities Finance
Securities finance provides liquidity to the financial markets and an effective means for customersto earn revenue on their existing portfolios. By acting as a lending agent and coordinating loansbetween lenders and borrowers, we lend securities and provide liquidity to customers around the world.Borrowers provide collateral in the form of cash or securities to State Street in return for loanedsecurities. For cash collateral, we pay a usage fee to the provider of the cash collateral, and invest thecash collateral in certain investment vehicles. The spread between the yield on the investment vehicleand the usage fee paid to the provider of the collateral is split between the lender of the securities andState Street as agent. For non-cash collateral, the borrower pays a fee for the loaned securities, and thefee is split between the lender of the securities and State Street.
Securities finance revenue is principally a function of the volume of securities loaned and theinterest-rate spreads earned on the collateral. For 2007, securities finance revenue increased 76% froma year earlier, as loan volumes increased 30%, with this volume resulting from both new customerdemand and increased demand from existing customers. Consolidated spread also increased, primarilyin the domestic and non-U.S. equity portfolios and the corporate bond and fixed-income portfolios.Spreads benefited from reductions in federal funds rates during 2007, as well as from the above-mentioned market disruption.
Processing Fees and Other
Processing fees and other revenue includes diverse types of fees and other revenue, including feesfrom our structured products business, fees from software licensing and maintenance, profits and lossesfrom unconsolidated subsidiaries, gains and losses on sales of leased equipment and other assets, andamortization of investments in tax-advantaged financings. Processing fees and other revenue decreased13% from 2006, with an additional $32 million of revenue from the acquired Investors Financialbusiness and improved joint venture performance more than offset by reduced revenue from thestructured products business, primarily from the asset-backed commercial paper program, and theabsence of revenue from our tax-exempt investment program. The absence of revenue from thetax-exempt investment program resulted from the impact of the consolidation of the program onto ourbalance sheet on September 30, 2006. As a result of this consolidation, revenue from the program,previously recorded in processing fees and other, is now recorded in net interest revenue.
34
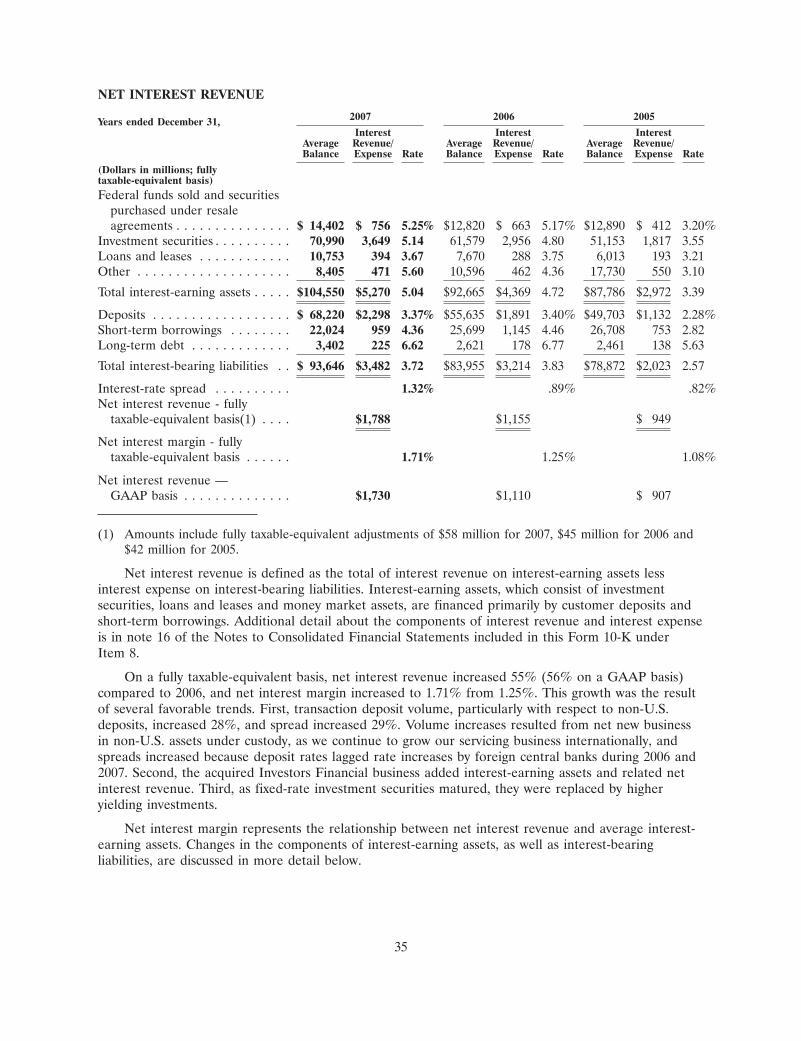
NET INTEREST REVENUE
2007 2006 2005Years ended December 31,Interest Interest Interest
Average Revenue/ Average Revenue/ Average Revenue/Balance Expense Rate Balance Expense Rate Balance Expense Rate
(Dollars in millions; fullytaxable-equivalent basis)Federal funds sold and securities
purchased under resaleagreements . . . . . . . . . . . . . . . $ 14,402 $ 756 5.25% $12,820 $ 663 5.17% $12,890 $ 412 3.20%
Investment securities . . . . . . . . . . 70,990 3,649 5.14 61,579 2,956 4.80 51,153 1,817 3.55Loans and leases . . . . . . . . . . . . 10,753 394 3.67 7,670 288 3.75 6,013 193 3.21Other . . . . . . . . . . . . . . . . . . . . 8,405 471 5.60 10,596 462 4.36 17,730 550 3.10
Total interest-earning assets . . . . . $104,550 $5,270 5.04 $92,665 $4,369 4.72 $87,786 $2,972 3.39
Deposits . . . . . . . . . . . . . . . . . . $ 68,220 $2,298 3.37% $55,635 $1,891 3.40% $49,703 $1,132 2.28%Short-term borrowings . . . . . . . . 22,024 959 4.36 25,699 1,145 4.46 26,708 753 2.82Long-term debt . . . . . . . . . . . . . 3,402 225 6.62 2,621 178 6.77 2,461 138 5.63
Total interest-bearing liabilities . . $ 93,646 $3,482 3.72 $83,955 $3,214 3.83 $78,872 $2,023 2.57
Interest-rate spread . . . . . . . . . . 1.32% .89% .82%Net interest revenue - fully
taxable-equivalent basis(1) . . . . $1,788 $1,155 $ 949
Net interest margin - fullytaxable-equivalent basis . . . . . . 1.71% 1.25% 1.08%
Net interest revenue —GAAP basis . . . . . . . . . . . . . . $1,730 $1,110 $ 907
(1) Amounts include fully taxable-equivalent adjustments of $58 million for 2007, $45 million for 2006 and$42 million for 2005.
Net interest revenue is defined as the total of interest revenue on interest-earning assets lessinterest expense on interest-bearing liabilities. Interest-earning assets, which consist of investmentsecurities, loans and leases and money market assets, are financed primarily by customer deposits andshort-term borrowings. Additional detail about the components of interest revenue and interest expenseis in note 16 of the Notes to Consolidated Financial Statements included in this Form 10-K underItem 8.
On a fully taxable-equivalent basis, net interest revenue increased 55% (56% on a GAAP basis)compared to 2006, and net interest margin increased to 1.71% from 1.25%. This growth was the resultof several favorable trends. First, transaction deposit volume, particularly with respect to non-U.S.deposits, increased 28%, and spread increased 29%. Volume increases resulted from net new businessin non-U.S. assets under custody, as we continue to grow our servicing business internationally, andspreads increased because deposit rates lagged rate increases by foreign central banks during 2006 and2007. Second, the acquired Investors Financial business added interest-earning assets and related netinterest revenue. Third, as fixed-rate investment securities matured, they were replaced by higheryielding investments.
Net interest margin represents the relationship between net interest revenue and average interest-earning assets. Changes in the components of interest-earning assets, as well as interest-bearingliabilities, are discussed in more detail below.
35
Average federal funds sold and securities purchased under resale agreements increased 12.3% or$1.58 billion, from $12.82 billion in 2006 to $14.40 billion for 2007. The increase was primarily theresult of excess liquidity.
Our average investment securities portfolio increased from approximately $61.58 billion toapproximately $70.99 billion, primarily due to the acquisition of investment securities of InvestorsFinancial and increases in our tax-exempt securities portfolio. The investment portfolio now includes ahigher percentage of collateralized mortgage obligations and mortgage- and asset-backed securitiescompared to a year earlier. These increases did not adversely affect overall risk, as we continued toinvest conservatively in ‘‘AA’’ and ‘‘AAA’’ rated securities. Securities rated ‘‘AA’’ and ‘‘AAA’’ comprisedapproximately 95% of the investment securities portfolio, with approximately 89% ‘‘AAA’’ rated, atDecember 31, 2007.
Loans and leases averaged $10.75 billion, up 40% from $7.67 billion in 2006. The increase wasrelated to higher levels of customer overdraft activity. Approximately 70% of the loans and leasesportfolio is composed of U.S. and non-U.S. short-duration advances, primarily related to the processingof custodied customer investments, which averaged approximately $7.53 billion for 2007, up from$5.21 billion in 2006.
The $12.59 billion increase in average interest-bearing deposits from 2006 was mainly due to theacquisition of Investors Financial and an increase in low cost customer deposits, primarily non-U.S.deposits. This deposit growth funded the $11.89 billion increase in average interest-earning assets.
Average short-term borrowings decreased primarily due to the liquidity provided by the increase incustomer deposits, and long-term debt increased due to debt issuances associated with the InvestorsFinancial acquisition.
Several factors could affect future levels of net interest revenue and margin, including the FederalReserve’s ongoing actions to manage short-term interest rates, the level and pace of changes innon-U.S. interest rates, particularly as a result of actions of the European Central Bank and the Bankof England, the mix of customer liabilities, and the shapes of the various yield curves around the world.
Gains (Losses) on Sales of Available-for-Sale Securities, Net
Our management of the investment securities portfolio has many objectives, the foremost of whichare to provide liquidity and to serve as a source of collateral for customer activities. These objectivesmay entail strategic sales of specific securities as market conditions warrant. We recorded net gains of$7 million on sales of available-for-sale securities for 2007, compared to net gains of $15 million for2006. At December 31, 2007, approximately 94% of the investment securities portfolio, or$70.33 billion, was classified as available for sale. Additional information about available-for-salesecurities, and the gross gains and losses that comprise the net gains, is in note 3 of the Notes toConsolidated Financial Statements included in this Form 10-K under Item 8.
36
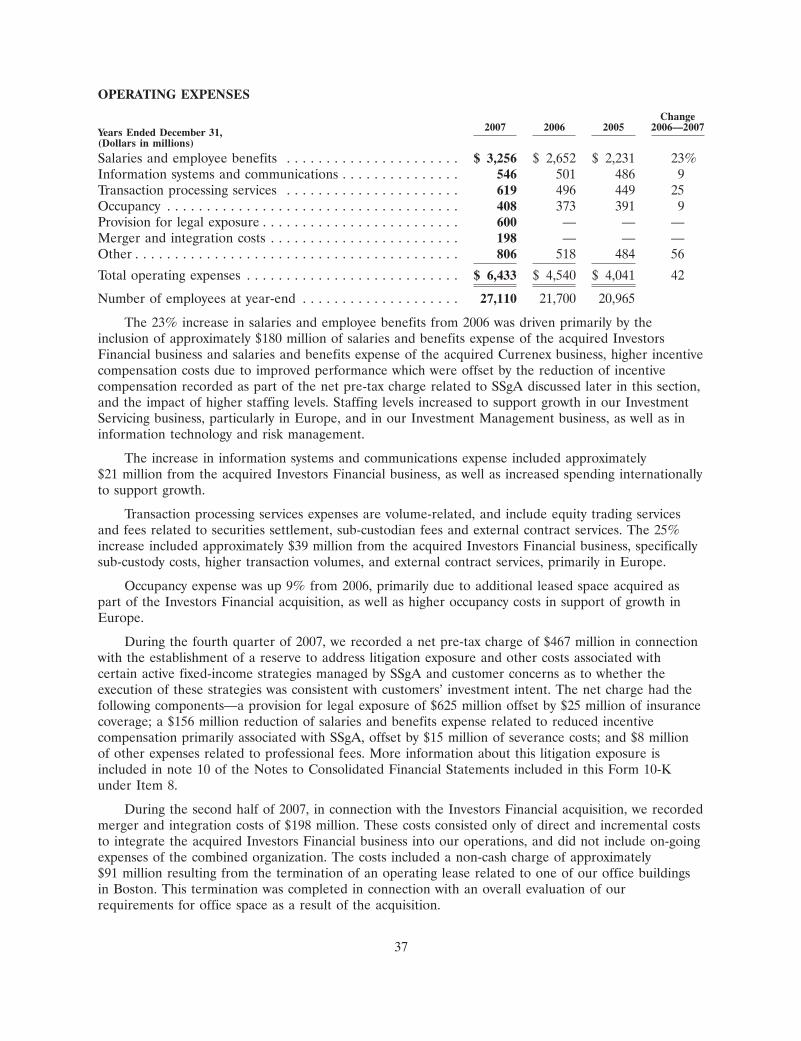
OPERATING EXPENSES
Change2007 2006 2005 2006—2007Years Ended December 31,
(Dollars in millions)
Salaries and employee benefits . . . . . . . . . . . . . . . . . . . . . . $ 3,256 $ 2,652 $ 2,231 23%Information systems and communications . . . . . . . . . . . . . . . 546 501 486 9Transaction processing services . . . . . . . . . . . . . . . . . . . . . . 619 496 449 25Occupancy . . . . . . . . . . . . . . . . . . . . . . . . . . . . . . . . . . . . . 408 373 391 9Provision for legal exposure . . . . . . . . . . . . . . . . . . . . . . . . . 600 — — —Merger and integration costs . . . . . . . . . . . . . . . . . . . . . . . . 198 — — —Other . . . . . . . . . . . . . . . . . . . . . . . . . . . . . . . . . . . . . . . . . 806 518 484 56
Total operating expenses . . . . . . . . . . . . . . . . . . . . . . . . . . . $ 6,433 $ 4,540 $ 4,041 42
Number of employees at year-end . . . . . . . . . . . . . . . . . . . . 27,110 21,700 20,965
The 23% increase in salaries and employee benefits from 2006 was driven primarily by theinclusion of approximately $180 million of salaries and benefits expense of the acquired InvestorsFinancial business and salaries and benefits expense of the acquired Currenex business, higher incentivecompensation costs due to improved performance which were offset by the reduction of incentivecompensation recorded as part of the net pre-tax charge related to SSgA discussed later in this section,and the impact of higher staffing levels. Staffing levels increased to support growth in our InvestmentServicing business, particularly in Europe, and in our Investment Management business, as well as ininformation technology and risk management.
The increase in information systems and communications expense included approximately$21 million from the acquired Investors Financial business, as well as increased spending internationallyto support growth.
Transaction processing services expenses are volume-related, and include equity trading servicesand fees related to securities settlement, sub-custodian fees and external contract services. The 25%increase included approximately $39 million from the acquired Investors Financial business, specificallysub-custody costs, higher transaction volumes, and external contract services, primarily in Europe.
Occupancy expense was up 9% from 2006, primarily due to additional leased space acquired aspart of the Investors Financial acquisition, as well as higher occupancy costs in support of growth inEurope.
During the fourth quarter of 2007, we recorded a net pre-tax charge of $467 million in connectionwith the establishment of a reserve to address litigation exposure and other costs associated withcertain active fixed-income strategies managed by SSgA and customer concerns as to whether theexecution of these strategies was consistent with customers’ investment intent. The net charge had thefollowing components—a provision for legal exposure of $625 million offset by $25 million of insurancecoverage; a $156 million reduction of salaries and benefits expense related to reduced incentivecompensation primarily associated with SSgA, offset by $15 million of severance costs; and $8 millionof other expenses related to professional fees. More information about this litigation exposure isincluded in note 10 of the Notes to Consolidated Financial Statements included in this Form 10-Kunder Item 8.
During the second half of 2007, in connection with the Investors Financial acquisition, we recordedmerger and integration costs of $198 million. These costs consisted only of direct and incremental coststo integrate the acquired Investors Financial business into our operations, and did not include on-goingexpenses of the combined organization. The costs included a non-cash charge of approximately$91 million resulting from the termination of an operating lease related to one of our office buildingsin Boston. This termination was completed in connection with an overall evaluation of ourrequirements for office space as a result of the acquisition.
37
The merger and integration costs also included $42 million associated with employee retention andother compensation, and $22 million associated with the integration of the acquired Investors Financialbusiness’s accounting and management systems. In addition, subsequent to the completion of theacquisition, we redeemed an aggregate of $500 million of unsecured junior subordinated debenturesissued by the parent company to two of our statutory business trusts, composed of $200 million of7.94% debentures issued in 1996 and $300 million of 8.035% debentures issued in 1997. We paid thetrusts the outstanding amount on the debentures plus accrued interest and an aggregate redemptionpremium of approximately $20 million, which was included in the merger and integration costs.
The 56% increase in other expenses from 2006 primarily resulted from the acquired InvestorsFinancial business, increases in professional services, securities processing costs, higher sales promotioncosts and increased amortization of intangibles that resulted from the acquisitions of Investors Financialand Currenex.
Income Taxes
Income tax expense totaled $642 million for 2007, compared to $675 million from continuingoperations a year ago. The decrease was primarily the result of the absence of the impact of federal taxlegislation that increased income tax expense for 2006. The overall effective tax rate for 2007 was33.7%, compared to 38.1% for 2006. Additional information about income tax expense is in note 20 ofthe Notes to Consolidated Financial Statements included in this Form 10-K under Item 8.
The 2006 income tax expense from discontinued operations of $6 million was related to$16 million of income associated with the finalization of certain costs recorded in connection with ourdivestiture of Bel Air, which was completed during 2006.
Information about income tax contingencies related to our leveraged lease portfolio is in note 10of the Notes to Consolidated Financial Statements included in this Form 10-K under Item 8.
LINE OF BUSINESS INFORMATION
We report two lines of business: Investment Servicing and Investment Management. Given ourservices and management organization, the results of operations for these lines of business are notnecessarily comparable with those of other companies, including companies in the financial servicesindustry. Information about revenue, expense and capital allocation methodologies is in note 22 of theNotes to Consolidated Financial Statements included in this Form 10-K under Item 8.
The following is a summary of line of business results. Results presented exclude the income (loss)from discontinued operations related to our divestiture of Bel Air. The amount presented in the‘‘Other/One-Time’’ column for 2007 represents merger and integration costs recorded in connectionwith our acquisition of Investors Financial. The amount presented in the same column for 2005represents additional gain from our sale of the Private Asset Management business. The amount
38
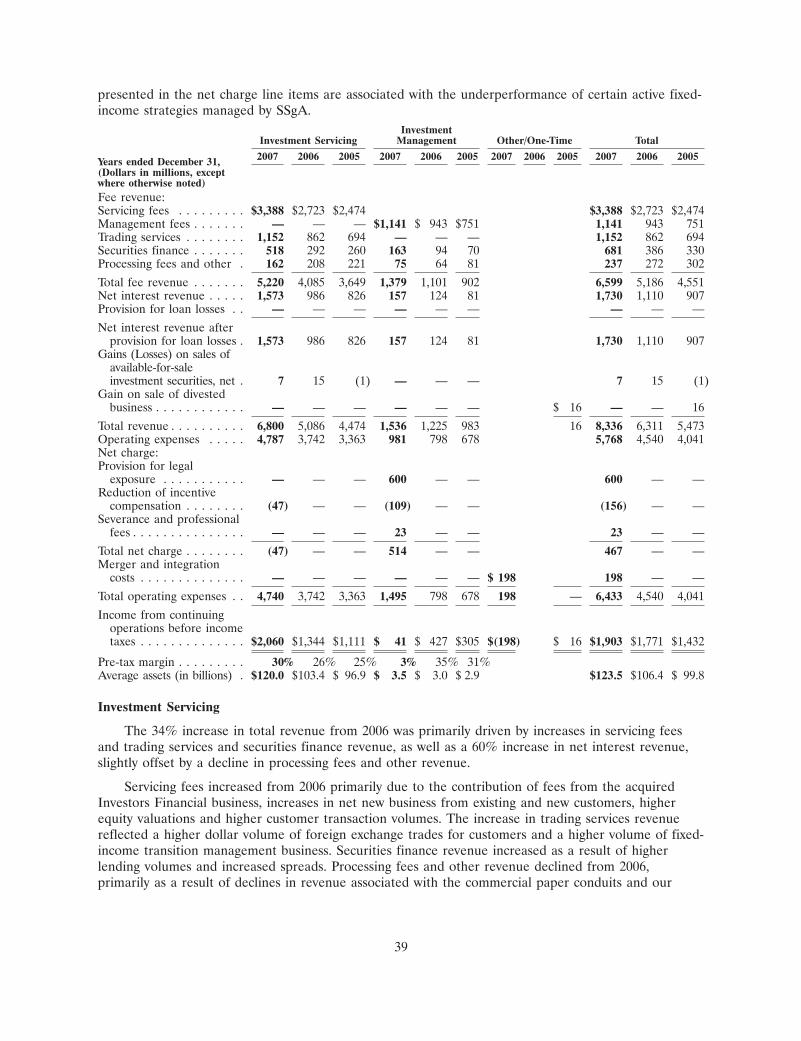
presented in the net charge line items are associated with the underperformance of certain active fixed-income strategies managed by SSgA.
InvestmentInvestment Servicing Management Other/One-Time Total
2007 2006 2005 2007 2006 2005 2007 2006 2005 2007 2006 2005Years ended December 31,(Dollars in millions, exceptwhere otherwise noted)Fee revenue:Servicing fees . . . . . . . . . $3,388 $2,723 $2,474 $3,388 $2,723 $2,474Management fees . . . . . . . — — — $1,141 $ 943 $751 1,141 943 751Trading services . . . . . . . . 1,152 862 694 — — — 1,152 862 694Securities finance . . . . . . . 518 292 260 163 94 70 681 386 330Processing fees and other . 162 208 221 75 64 81 237 272 302
Total fee revenue . . . . . . . 5,220 4,085 3,649 1,379 1,101 902 6,599 5,186 4,551Net interest revenue . . . . . 1,573 986 826 157 124 81 1,730 1,110 907Provision for loan losses . . — — — — — — — — —
Net interest revenue afterprovision for loan losses . 1,573 986 826 157 124 81 1,730 1,110 907
Gains (Losses) on sales ofavailable-for-saleinvestment securities, net . 7 15 (1) — — — 7 15 (1)
Gain on sale of divestedbusiness . . . . . . . . . . . . — — — — — — $ 16 — — 16
Total revenue . . . . . . . . . . 6,800 5,086 4,474 1,536 1,225 983 16 8,336 6,311 5,473Operating expenses . . . . . 4,787 3,742 3,363 981 798 678 5,768 4,540 4,041Net charge:Provision for legal
exposure . . . . . . . . . . . — — — 600 — — 600 — —Reduction of incentive
compensation . . . . . . . . (47) — — (109) — — (156) — —Severance and professional
fees . . . . . . . . . . . . . . . — — — 23 — — 23 — —
Total net charge . . . . . . . . (47) — — 514 — — 467 — —Merger and integration
costs . . . . . . . . . . . . . . — — — — — — $ 198 198 — —
Total operating expenses . . 4,740 3,742 3,363 1,495 798 678 198 — 6,433 4,540 4,041
Income from continuingoperations before incometaxes . . . . . . . . . . . . . . $2,060 $1,344 $1,111 $ 41 $ 427 $305 $(198) $ 16 $1,903 $1,771 $1,432
Pre-tax margin . . . . . . . . . 30% 26% 25% 3% 35% 31%Average assets (in billions) . $120.0 $103.4 $ 96.9 $ 3.5 $ 3.0 $ 2.9 $123.5 $106.4 $ 99.8
Investment Servicing
The 34% increase in total revenue from 2006 was primarily driven by increases in servicing feesand trading services and securities finance revenue, as well as a 60% increase in net interest revenue,slightly offset by a decline in processing fees and other revenue.
Servicing fees increased from 2006 primarily due to the contribution of fees from the acquiredInvestors Financial business, increases in net new business from existing and new customers, higherequity valuations and higher customer transaction volumes. The increase in trading services revenuereflected a higher dollar volume of foreign exchange trades for customers and a higher volume of fixed-income transition management business. Securities finance revenue increased as a result of higherlending volumes and increased spreads. Processing fees and other revenue declined from 2006,primarily as a result of declines in revenue associated with the commercial paper conduits and our
39
tax-exempt investment program, the latter of which was consolidated onto our balance sheet in 2006.Revenue from this program is now recorded in net interest revenue.
Servicing fees, trading services revenue and net gains (losses) on sales of available-for-salesecurities for our Investment Servicing business line are identical to the respective consolidated results.Refer to the ‘‘Servicing Fees,’’ ‘‘Trading Services’’ and ‘‘Gains (Losses) on Sales of Available-For-SaleSecurities, Net’’ captions in the ‘‘Total Revenue’’ section of this Management’s Discussion and Analysisfor a more in-depth discussion. A discussion of processing fees and other revenue is provided under thecaption ‘‘Processing Fees and Other’’ in the ‘‘Total Revenue’’ section.
Net interest revenue increased 60% from 2006 due to an increase in average interest-earningassets, including those from the acquired Investors Financial business, as well as higher yields on ourinvestment securities portfolio A portion of net interest revenue is recorded in the InvestmentManagement business line based on the volume of customer liabilities attributable to that business.
Operating expenses increased from 2006, driven primarily by the inclusion of the operatingexpenses of the acquired Investors Financial business and Currenex, as well as higher incentivecompensation costs due to improved performance and the impact of higher staffing levels. Staffinglevels increased to support growth in business, particularly in Europe. Transaction processing costsincreased due to a higher volume of sub-custodian fees, particularly from the acquired InvestorsFinancial business. Other expenses increased as a result of the inclusion of expenses of the acquiredInvestors Financial business, increases in professional services, securities processing costs and increasedamortization of intangibles that resulted from the Investors Financial and Currenex acquisitions.
Investment Management
Total revenue for 2007 increased 25% from 2006. Management fees for the InvestmentManagement business line, which were up 21%, are identical to the respective consolidated results.Refer to the ‘‘Management Fees’’ caption in the ‘‘Total Revenue’’ section of this Management’sDiscussion and Analysis for a more in-depth discussion. Securities finance revenue for 2007 was up73% from 2006, reflecting higher lending volumes and increased spreads. Net interest revenueimproved due to higher volumes of customer liabilities, primarily resulting from the growth of ournon-U.S. operations, as well as a more favorable mix of deposits.
Operating expenses of $981 million, which do not include the net pre-tax charge allocated toInvestment Management of $514 million, increased 23% from $798 million in 2006, primarily due tothe cost of increases in staffing levels to support growth in business, and related increases ininformation systems and communications expenses. The net pre-tax charge was recorded in connectionwith the establishment of a reserve to address legal exposure and other costs associated with the under-performance of certain active fixed-income strategies managed by SSgA and customer concerns as towhether the execution of these strategies was consistent with the customers’ investment intent. The netcharge had the following components—a provision for legal exposure of $625 million offset by$25 million of insurance coverage; a $109 million reduction of salaries and benefits expense related toreduced incentive compensation offset by $15 million of severance costs; and $8 million of otherexpenses related to professional fees. More information about this charge is included in the‘‘Consolidated Results of Operations—Operating Expenses’’ section of this Management’s Discussionand Analysis.
The pre-tax margin for Investment Management, which is the percentage of the business line’spre-tax income to its total revenue, was 3% for 2007 compared to 35% for 2006 and 31% for 2005. Thesignificant decrease in margin was the result of the net charge described above. Without the net charge,Investment Management’s pre-tax income would have been $555 million ($41 million plus$514 million), and its pre-tax margin would have been 36% for 2007.
40
During the second half of 2007, the global markets for fixed-income securities, particularly themarkets for financial instruments collateralized by sub-prime mortgages, experienced significantdisruption. This disruption affected the liquidity and pricing of securities traded in these markets, aswell as the returns of, and levels of redemptions in, investment vehicles investing in those instruments.Additional information about the impact of these market conditions on the asset-backed commercialpaper conduits administered by State Street is provided in the ‘‘Off Balance Sheet Arrangements’’section of this Management’s Discussion and Analysis and in the Risk Factors section included underItem 1A of this Form 10-K.
As of December 31, 2007, global fixed-income assets under management totaled approximately$259 billion, an increase of approximately $45 billion compared to $214 billion at December 31, 2006,with approximately $43 billion under active management. This amount included approximately$6.1 billion of SSgA customer assets which were invested in strategies that were adversely affected by acombination of holdings in financial instruments collateralized by sub-prime mortgages, illiquidity in thefixed-income markets generally, and customer redemptions. These strategies included approximately$2.2 billion of institutional customer investments in non-registered pooled investment funds;approximately $2.1 billion of unit investments by other SSgA investment funds in the samenon-registered pooled investment funds; approximately $1.6 billion of institutional customer investmentsin separately-managed customer accounts; and approximately $0.2 billion of customer investments inmutual funds.
Information about recent proceedings, legal exposure and related costs and other similar mattersassociated with SSgA’s active fixed-income strategies, including the establishment of a reserve ofapproximately $625 million, is included in ‘‘Risk Factors—Litigation Risks’’ included under Item 1A;the ‘‘Consolidated Results of Operations—Operating Expenses’’ section of this Management’sDiscussion and Analysis; and note 10 of the Notes to Consolidated Financial Statements includedunder Item 8 of this Form 10-K.
41
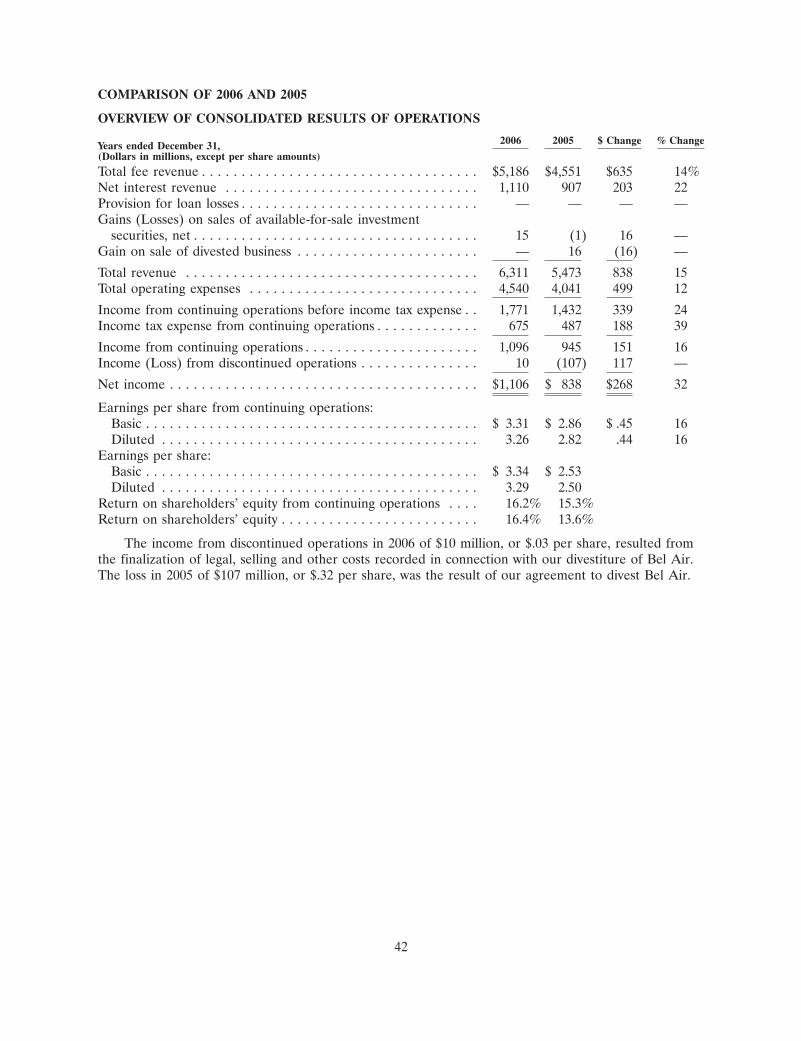
COMPARISON OF 2006 AND 2005
OVERVIEW OF CONSOLIDATED RESULTS OF OPERATIONS
2006 2005 $ Change % ChangeYears ended December 31,(Dollars in millions, except per share amounts)
Total fee revenue . . . . . . . . . . . . . . . . . . . . . . . . . . . . . . . . . . . $5,186 $4,551 $635 14%Net interest revenue . . . . . . . . . . . . . . . . . . . . . . . . . . . . . . . . 1,110 907 203 22Provision for loan losses . . . . . . . . . . . . . . . . . . . . . . . . . . . . . . — — — —Gains (Losses) on sales of available-for-sale investment
securities, net . . . . . . . . . . . . . . . . . . . . . . . . . . . . . . . . . . . . 15 (1) 16 —Gain on sale of divested business . . . . . . . . . . . . . . . . . . . . . . . — 16 (16) —
Total revenue . . . . . . . . . . . . . . . . . . . . . . . . . . . . . . . . . . . . . 6,311 5,473 838 15Total operating expenses . . . . . . . . . . . . . . . . . . . . . . . . . . . . . 4,540 4,041 499 12
Income from continuing operations before income tax expense . . 1,771 1,432 339 24Income tax expense from continuing operations . . . . . . . . . . . . . 675 487 188 39
Income from continuing operations . . . . . . . . . . . . . . . . . . . . . . 1,096 945 151 16Income (Loss) from discontinued operations . . . . . . . . . . . . . . . 10 (107) 117 —
Net income . . . . . . . . . . . . . . . . . . . . . . . . . . . . . . . . . . . . . . . $1,106 $ 838 $268 32
Earnings per share from continuing operations:Basic . . . . . . . . . . . . . . . . . . . . . . . . . . . . . . . . . . . . . . . . . . $ 3.31 $ 2.86 $ .45 16Diluted . . . . . . . . . . . . . . . . . . . . . . . . . . . . . . . . . . . . . . . . 3.26 2.82 .44 16
Earnings per share:Basic . . . . . . . . . . . . . . . . . . . . . . . . . . . . . . . . . . . . . . . . . . $ 3.34 $ 2.53Diluted . . . . . . . . . . . . . . . . . . . . . . . . . . . . . . . . . . . . . . . . 3.29 2.50
Return on shareholders’ equity from continuing operations . . . . 16.2% 15.3%Return on shareholders’ equity . . . . . . . . . . . . . . . . . . . . . . . . . 16.4% 13.6%
The income from discontinued operations in 2006 of $10 million, or $.03 per share, resulted fromthe finalization of legal, selling and other costs recorded in connection with our divestiture of Bel Air.The loss in 2005 of $107 million, or $.32 per share, was the result of our agreement to divest Bel Air.
42
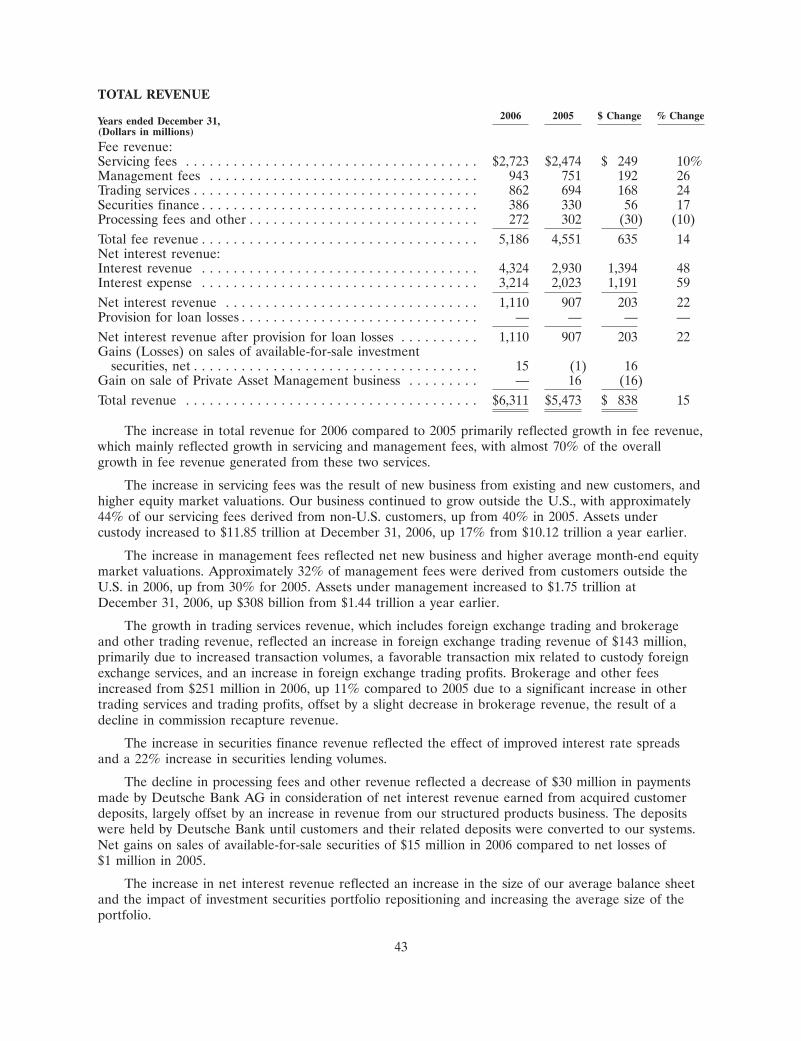
TOTAL REVENUE
2006 2005 $ Change % ChangeYears ended December 31,(Dollars in millions)
Fee revenue:Servicing fees . . . . . . . . . . . . . . . . . . . . . . . . . . . . . . . . . . . . . $2,723 $2,474 $ 249 10%Management fees . . . . . . . . . . . . . . . . . . . . . . . . . . . . . . . . . . 943 751 192 26Trading services . . . . . . . . . . . . . . . . . . . . . . . . . . . . . . . . . . . . 862 694 168 24Securities finance . . . . . . . . . . . . . . . . . . . . . . . . . . . . . . . . . . . 386 330 56 17Processing fees and other . . . . . . . . . . . . . . . . . . . . . . . . . . . . . 272 302 (30) (10)Total fee revenue . . . . . . . . . . . . . . . . . . . . . . . . . . . . . . . . . . . 5,186 4,551 635 14Net interest revenue:Interest revenue . . . . . . . . . . . . . . . . . . . . . . . . . . . . . . . . . . . 4,324 2,930 1,394 48Interest expense . . . . . . . . . . . . . . . . . . . . . . . . . . . . . . . . . . . 3,214 2,023 1,191 59Net interest revenue . . . . . . . . . . . . . . . . . . . . . . . . . . . . . . . . 1,110 907 203 22Provision for loan losses . . . . . . . . . . . . . . . . . . . . . . . . . . . . . . — — — —Net interest revenue after provision for loan losses . . . . . . . . . . 1,110 907 203 22Gains (Losses) on sales of available-for-sale investment
securities, net . . . . . . . . . . . . . . . . . . . . . . . . . . . . . . . . . . . . 15 (1) 16Gain on sale of Private Asset Management business . . . . . . . . . — 16 (16)Total revenue . . . . . . . . . . . . . . . . . . . . . . . . . . . . . . . . . . . . . $6,311 $5,473 $ 838 15
The increase in total revenue for 2006 compared to 2005 primarily reflected growth in fee revenue,which mainly reflected growth in servicing and management fees, with almost 70% of the overallgrowth in fee revenue generated from these two services.
The increase in servicing fees was the result of new business from existing and new customers, andhigher equity market valuations. Our business continued to grow outside the U.S., with approximately44% of our servicing fees derived from non-U.S. customers, up from 40% in 2005. Assets undercustody increased to $11.85 trillion at December 31, 2006, up 17% from $10.12 trillion a year earlier.
The increase in management fees reflected net new business and higher average month-end equitymarket valuations. Approximately 32% of management fees were derived from customers outside theU.S. in 2006, up from 30% for 2005. Assets under management increased to $1.75 trillion atDecember 31, 2006, up $308 billion from $1.44 trillion a year earlier.
The growth in trading services revenue, which includes foreign exchange trading and brokerageand other trading revenue, reflected an increase in foreign exchange trading revenue of $143 million,primarily due to increased transaction volumes, a favorable transaction mix related to custody foreignexchange services, and an increase in foreign exchange trading profits. Brokerage and other feesincreased from $251 million in 2006, up 11% compared to 2005 due to a significant increase in othertrading services and trading profits, offset by a slight decrease in brokerage revenue, the result of adecline in commission recapture revenue.
The increase in securities finance revenue reflected the effect of improved interest rate spreadsand a 22% increase in securities lending volumes.
The decline in processing fees and other revenue reflected a decrease of $30 million in paymentsmade by Deutsche Bank AG in consideration of net interest revenue earned from acquired customerdeposits, largely offset by an increase in revenue from our structured products business. The depositswere held by Deutsche Bank until customers and their related deposits were converted to our systems.Net gains on sales of available-for-sale securities of $15 million in 2006 compared to net losses of$1 million in 2005.
The increase in net interest revenue reflected an increase in the size of our average balance sheetand the impact of investment securities portfolio repositioning and increasing the average size of theportfolio.
43
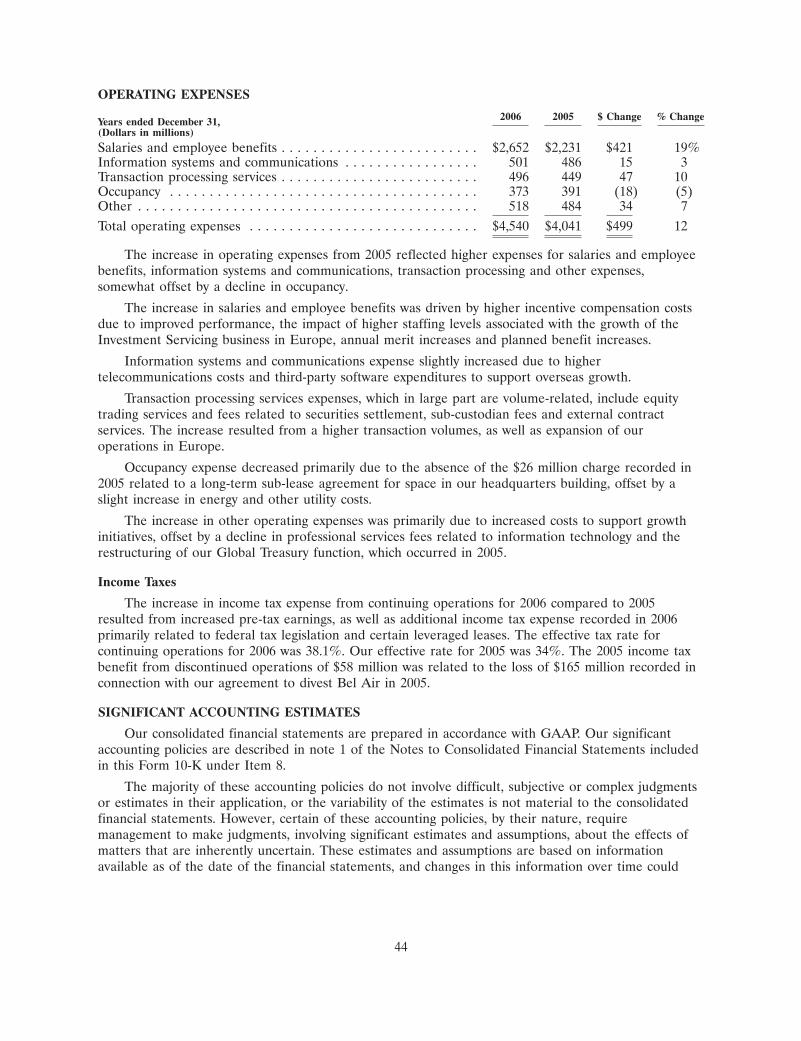
OPERATING EXPENSES
2006 2005 $ Change % ChangeYears ended December 31,(Dollars in millions)
Salaries and employee benefits . . . . . . . . . . . . . . . . . . . . . . . . . $2,652 $2,231 $421 19%Information systems and communications . . . . . . . . . . . . . . . . . 501 486 15 3Transaction processing services . . . . . . . . . . . . . . . . . . . . . . . . . 496 449 47 10Occupancy . . . . . . . . . . . . . . . . . . . . . . . . . . . . . . . . . . . . . . . 373 391 (18) (5)Other . . . . . . . . . . . . . . . . . . . . . . . . . . . . . . . . . . . . . . . . . . . 518 484 34 7Total operating expenses . . . . . . . . . . . . . . . . . . . . . . . . . . . . . $4,540 $4,041 $499 12
The increase in operating expenses from 2005 reflected higher expenses for salaries and employeebenefits, information systems and communications, transaction processing and other expenses,somewhat offset by a decline in occupancy.
The increase in salaries and employee benefits was driven by higher incentive compensation costsdue to improved performance, the impact of higher staffing levels associated with the growth of theInvestment Servicing business in Europe, annual merit increases and planned benefit increases.
Information systems and communications expense slightly increased due to highertelecommunications costs and third-party software expenditures to support overseas growth.
Transaction processing services expenses, which in large part are volume-related, include equitytrading services and fees related to securities settlement, sub-custodian fees and external contractservices. The increase resulted from a higher transaction volumes, as well as expansion of ouroperations in Europe.
Occupancy expense decreased primarily due to the absence of the $26 million charge recorded in2005 related to a long-term sub-lease agreement for space in our headquarters building, offset by aslight increase in energy and other utility costs.
The increase in other operating expenses was primarily due to increased costs to support growthinitiatives, offset by a decline in professional services fees related to information technology and therestructuring of our Global Treasury function, which occurred in 2005.
Income Taxes
The increase in income tax expense from continuing operations for 2006 compared to 2005resulted from increased pre-tax earnings, as well as additional income tax expense recorded in 2006primarily related to federal tax legislation and certain leveraged leases. The effective tax rate forcontinuing operations for 2006 was 38.1%. Our effective rate for 2005 was 34%. The 2005 income taxbenefit from discontinued operations of $58 million was related to the loss of $165 million recorded inconnection with our agreement to divest Bel Air in 2005.
SIGNIFICANT ACCOUNTING ESTIMATES
Our consolidated financial statements are prepared in accordance with GAAP. Our significantaccounting policies are described in note 1 of the Notes to Consolidated Financial Statements includedin this Form 10-K under Item 8.
The majority of these accounting policies do not involve difficult, subjective or complex judgmentsor estimates in their application, or the variability of the estimates is not material to the consolidatedfinancial statements. However, certain of these accounting policies, by their nature, requiremanagement to make judgments, involving significant estimates and assumptions, about the effects ofmatters that are inherently uncertain. These estimates and assumptions are based on informationavailable as of the date of the financial statements, and changes in this information over time could
44
materially impact amounts of assets, liabilities, revenue and expenses reported in subsequent financialstatements.
Based on the sensitivity of reported financial statement amounts to the underlying policies,estimates and assumptions, the relatively more significant accounting policies applied by State Streethave been identified by management as accounting for fair value of financial instruments; accountingfor special purpose entities; accounting for goodwill; and accounting for income taxes. These policiesrequire the most subjective or complex judgments, and related estimates and assumptions could bemost subject to revision as new information becomes available. An understanding of the judgments,estimates and assumptions underlying these accounting policies is essential in order to understand ourreported consolidated financial condition and results of operations.
The following is a brief discussion of the above-mentioned significant accounting policies.Management of State Street has discussed these significant accounting estimates with the Examiningand Audit Committee of our Board of Directors.
Fair Value of Financial Instruments
We carry certain of our assets and liabilities at fair value in our consolidated financial statements,including trading assets, investment securities available for sale and derivative instruments. AtDecember 31, 2007, approximately $75.43 billion of our assets and approximately $4.57 billion of ourliabilities were carried at fair value. The fair value of a financial instrument is defined as the amount atwhich the instrument could be exchanged in an arm’s length transaction between willing parties, otherthan in a forced or liquidation sale. The degree of management judgment involved in determining thefair value of a financial instrument is dependent upon the availability of quoted market prices andobservable market inputs. For a significant amount of our assets and liabilities which are measured atfair value, those fair values are determined based upon quotations provided by independent third-partypricing services or observable market inputs, and as a result there is little or no management judgmentinvolved in determining fair value. Prices provided by independent third-party pricing services aresubject to review by management. In developing their quotations, the independent pricing services seekto utilize observable inputs, including trade and market information. However, because many fixed-income securities do not trade regularly, the pricing services’ quotations may also be based onproprietary financial models that incorporate available information, such as benchmarking to similarsecurities, sector groupings or matrix pricing.
Quotations may not always be available for some securities or in markets where trading activity hasslowed or ceased. When quotations are not available, and are not provided by third-party pricingservices, management judgment is necessary to determine fair value. In situations involvingmanagement judgment, fair value is determined using discounted cash flow analysis or other valuationmodels, which incorporate available market information, including appropriate benchmarking to similarinstruments, analysis of default and recovery rates, estimation of prepayment characteristics and impliedvolatilities.
Discounted cash flow analysis is dependent upon estimated future cash flows and the level ofinterest rates. Expected cash flows are discounted using market interest rates commensurate with thecredit quality and duration of the investment. Valuation models use as their basis independently-sourced market inputs including, for example, interest rate yield curves and foreign currency exchangerates. Our valuation process using models considers factors such as credit quality, product structure,third-party enhancements and guarantees. We apply judgment in the application of these factors. Otherfactors can affect our estimates of fair value, including market dislocations, incorrect modelassumptions and unexpected correlations. These valuation methods could expose us to materiallydifferent results should the models used or underlying assumptions be inaccurate.
We determine fair value for trading account assets primarily by using quoted market prices foridentical or similar instruments in active markets for those securities. Fair value for investment
45
securities available for sale is determined using quotations from independent third-party pricingservices, which generally are based on observable market inputs for identical or similar instruments inactive and non-active markets for those securities. We value derivative instruments primarily by usingvaluation models. These models generally do not involve material subjectivity because themethodologies used do not necessitate significant judgment, and the pricing inputs are observed fromactively quoted markets, for instance with over-the-counter interest-rate swap and option contracts, andforeign exchange forward and option contracts.
Management reviews the fair value of the portfolio at least quarterly, and evaluates individualsecurities for declines in fair value that may be other than temporary. This review considers factorssuch as current and expected future interest rates, external credit ratings, dividend payments, thefinancial health of the issuer and other pertinent information. Other pertinent information includescurrent developments with respect to the issuer, the length of time the cost basis has exceeded the fairvalue, the severity of the impairment measured as the ratio of fair value to amortized cost andmanagement’s intent and ability to hold the security.
The review includes all investment securities for which we have issuer specific concerns regardlessof quantitative factors. The review considers current economic conditions, adverse situations that mightaffect our ability to fully collect interest and principal, the timing of future payments, the credit qualityand performance of underlying collateral and guarantees and other relevant factors. If declines aredeemed other than temporary, an impairment loss is recognized and the amortized cost basis of theinvestment security is written down to its current fair value, which becomes the new cost basis.
Additional information about fair values of financial instruments and fair value estimates isincluded in note 24 of the Notes to Consolidated Financial Statements included under Item 8 of thisForm 10-K.
Special Purpose Entities
In the normal course of business, we utilize three types of special purpose entities, referred to as‘‘SPEs,’’ two of which are not recorded in our consolidated financial statements. Information about theactivities of these SPEs, which are used in connection with our tax-exempt investment program, ourinvolvement with managed investment vehicles and our asset-backed commercial paper program, is innotes 10 and 11 of the Notes to Consolidated Financial Statements included in this Form 10-K underItem 8. Additional information about SPEs used in connection with our commercial paper program isprovided below.
In our role as a financial intermediary, we administer four third-party asset-backed commercialpaper conduits, which are structured as bankruptcy-remote, limited liability companies, and which arenot included in our consolidated financial statements. These conduits purchase a variety of financialassets from third-party financial institutions, and fund these purchases by issuing commercial paper.The financial assets purchased by the conduits are not originated by us, and we do not hold any equityownership interest in the conduits. Additional information about the conduits and their businessactivities is in the ‘‘Off-Balance Sheet Arrangements’’ section of this Management’s Discussion andAnalysis and in note 11 of the Notes to Consolidated Financial Statements included under Item 8 ofthis Form 10-K.
Our accounting for the conduits’ activities, and our conclusion that we are not required to includeeach or all of the conduits’ assets and liabilities in our consolidated financial statements, is based onour application of the provisions of FASB Interpretation No. 46(R), which governs our accounting forthe conduits and which is discussed in more detail in note 11. Expected losses, which we estimate usinga financial model as described below, form the basis for our application of the provisions of FIN 46(R).Expected losses, as defined by FIN 46(R), are not economic losses. Instead, expected losses arecalculated by comparing projected possible cash flows, which are probability-weighted, with expectedcash flows for the risk(s) the entity was designed to create and distribute; they represent the variability
46
in potential cash flows of the entity’s designated risks. We believe that credit risk is the predominantrisk that is designed to be created and distributed by these entities. There is also a modest amount ofbasis risk within each conduit. Basis risk arises when commercial paper funding costs move at adifferent rate than the comparable floating-rate asset benchmark rates (generally LIBOR). This risk ismitigated through the use of derivative instruments, principally basis swaps, which remove thisvariability from each conduit. Accordingly, basis risk is not a significant assumption in the financialmodel.
Any credit losses of the conduits would be absorbed by (1) investors in the subordinated debt,commonly referred to as ‘‘first-loss notes,’’ issued by the conduits; (2) State Street; and (3) the holdersof the conduits’ commercial paper, in order of priority. The investors in the first-loss notes, which areindependent third parties, would absorb the first dollar of any credit loss on the conduits’ assets. Ifcredit losses exceeded the first-loss notes, we would absorb credit losses through our credit facilitiesprovided to the conduits. The commercial paper holders would absorb credit losses after the first-lossnotes and State Street’s credit facilities have been exhausted. We have developed a financial model toestimate and allocate each conduit’s expected losses. Our model has determined that, as ofDecember 31, 2007, the amount of first-loss notes of each conduit held by the third-party investorscauses them to absorb a majority of each conduit’s expected losses, as defined by FIN 46(R), and,accordingly, the investors in the first-loss notes are considered to be the primary beneficiary of theconduits. The aggregate amount of first-loss notes issued by the conduits totaled approximately$32 million as of December 31, 2007.
In order to estimate expected losses as required by FIN 46(R), we estimate possible defaults of theconduits’ assets. These expected losses are allocated to the conduits’ variable interest holders based onthe order in which actual losses would be absorbed, as described above. We use the model to estimateexpected losses based on hundreds of thousands of probability-weighted loss scenarios. Thesesimulations incorporate published rating agency data to estimate expected losses due to credit risk.Primary assumptions incorporated into the financial model relative to credit risk variability, such asdefault probabilities and loss severities, are directly linked to the conduit’s underlying assets. Thesedefault probabilities and loss severity assumptions vary by asset class and ratings of individual conduitassets. Accordingly, the model’s calculation of expected losses is significantly affected by the creditratings and asset mix of each conduit’s assets. These statistics are reviewed by management regularlyand more formally on an annual basis. If downgrades and asset mix change significantly, or if defaultsoccur on the conduits’ underlying assets, we may conclude that the current level of first-loss notes isinsufficient to absorb a majority of the conduits’ expected losses.
We perform stress tests and sensitivity analyses, with respect to each conduit individually, in orderto model potential scenarios that could cause the amount of first-loss notes to be insufficient to absorbthe majority of the conduits’ expected losses. As part of these analyses, we have identified certainconduit assets that could be more susceptible to credit downgrade because of their underlying creditcharacteristics. Our scenario testing specifically addresses asset classes that have experienced significantprice erosion and/or have little observed market activity. Examples of scenarios that are designed tomeasure the sensitivity of the sufficiency of the first-loss notes include performing a downgrade of allassets which have underlying monoline insurance provider support, and a downgrade scenario oncertain other conduit securities where our analysis of the timing and amount of expected cash flows forselected security default expectations does not re-affirm the security’s current external credit rating.These simulations do not include a scenario whereby all positions are simultaneously downgraded, thepossibility of which we consider remote. In addition, a scenario could arise where one or more defaultscould be so severe that the associated losses would exhaust the conduits’ total first-loss notes currentlyoutstanding.
We believe that the current level of first-loss notes of approximately $32 million as ofDecember 31, 2007 is sufficient to support default scenarios that we believe are more likely, includingthe stress tests previously described. However, in the future, if the determination and allocation of
47
conduit expected losses by the financial model indicates that the current level of first-loss notes isinsufficient to absorb a majority of the conduits’ expected losses, we would be required to either(1) issue additional first-loss notes to third parties; (2) change the composition of conduit assets; or(3) take other actions in order to avoid being determined to be the primary beneficiary of the conduits.If we were unable to accomplish any of the above, we would be determined to be the primarybeneficiary of the conduits, and would be required to consolidate the conduits’ assets and liabilities. Forillustrative purposes only, if consolidation of all four of the conduits had been required onDecember 31, 2007, we would have recognized an extraordinary after-tax loss of approximately$530 million in our consolidated statement of income. In addition, the consolidation of the conduit’sassets would have had a direct impact on our leverage capital ratios. The illustrative impact ofconsolidation of the conduits and the assumptions underlying its calculation are discussed in the‘‘Off-Balance Sheet Arrangements’’ section of this Management’s Discussion and Analysis.
The conduits do not regularly trade their assets. That is, the design of the conduits is such thatconduit assets are purchased with the intent to hold to them to their maturities. Accordingly, changesin the fair values of the conduits’ assets do not impact the day-to-day management of the conduits.However, we closely monitor changes in fair values of the conduits’ assets to ensure that the defaultassumptions in our financial model continue to be appropriate. As of December 31, 2007, total assetsin the unconsolidated conduits were approximately $28.76 billion, and the pre-tax unrealized loss onthose assets was approximately $850 million, or $530 million after-tax. We believe the fair values of theconduits’ assets are impacted by a number of factors, including the lack of liquidity of mortgage- andasset-backed securities, supply and demand imbalance in the market, and a risk aversion premiumbeing demanded by investors for certain asset types. We do not believe that the current fair values ofsome of the conduits’ assets are necessarily indicative of a change in marketplace participants’ view ofthe default probabilities for these assets.
Goodwill
Goodwill is created when the purchase price exceeds the assigned value of net assets of acquiredbusinesses, and represents the value attributable to unidentifiable intangible elements being acquired.Almost all of our goodwill has resulted from business acquisitions of our Investment Servicing line ofbusiness. As a result, substantially all of the total goodwill recorded in our consolidated statement ofcondition was recorded by this business line, with the remainder recorded by Investment Management.
The sustained value of the majority of this goodwill is supported ultimately by revenue from ourinvestment servicing business. A decline in earnings as a result of a lack of growth, or our inability todeliver cost-effective services over sustained periods, could lead to a perceived impairment of goodwill,which would be evaluated and, if necessary, be recorded as a write-down of the reported amount ofgoodwill through a charge to earnings in our consolidated statement of income.
On an annual basis, or more frequently if circumstances dictate, management reviews goodwill andevaluates events or other developments that may indicate impairment in the carrying amount. Weperform this evaluation at the reporting unit level, which is one level below our two major businesslines. The evaluation methodology for potential impairment is inherently complex and involvessignificant management judgment in the use of estimates and assumptions.
We evaluate impairment using a two-step process. First, we compare the aggregate fair value ofthe reporting unit to its carrying amount, including goodwill. If the fair value exceeds the carryingamount, no impairment exists. If the carrying amount of the reporting unit exceeds the fair value, thenwe compare the ‘‘implied’’ fair value of the reporting unit’s goodwill with its carrying amount. If thecarrying amount of the goodwill exceeds the implied fair value, then goodwill impairment is recognizedby writing the goodwill down to the implied fair value. The implied fair value of the goodwill isdetermined by allocating the fair value of the reporting unit to all of the assets and liabilities of thatunit, as if the unit had been acquired in a business combination and the overall fair value of the unitwas the purchase price.
48
To determine the aggregate fair value of the reporting unit being evaluated for goodwillimpairment, we use one of two principal methodologies—external or independent valuation, usingquoted market prices in active markets; or an analysis of comparable recent external sales or marketdata, such as multiples of earnings or similar performance measures. In limited circumstances, thesemethodologies are not available, and as such, we estimate future cash flows using present-valuetechniques.
Events that may indicate goodwill impairment include significant or adverse changes in thebusiness, economic or political climate; an adverse action or assessment by a regulator; unanticipatedcompetition; and a more-likely-than-not expectation that we will sell or otherwise dispose of a businessto which the goodwill relates. Our goodwill impairment testing for 2007 indicated that none of ourgoodwill was impaired. Goodwill recorded in our consolidated statement of condition at December 31,2007 totaled approximately $4.57 billion.
Additional information about goodwill, including information by line of business, is in note 5 ofthe Notes to Consolidated Financial Statements included under Item 8 of this Form 10-K.
Income Taxes
Our overall tax position is fundamentally complex, and management judgment is involved in theanalysis of income tax assets and liabilities. We are subject to the income tax laws of the U.S., its statesand municipalities and those of the foreign jurisdictions in which we operate. These tax laws can besubject to different interpretations by the taxpayer and the taxing authorities.
In establishing a provision for income tax expense, we must make judgments and interpretationsabout the application of these inherently complex tax laws. Disputes over interpretations of the tax lawsmay be adjudicated by the court systems of the various tax jurisdictions or may be settled with thetaxing authority upon examination or administrative appeal.
Management’s determination of the likelihood that deferred tax assets can be realized is subjectiveand involves estimates and assumptions about matters that are inherently uncertain. The realization ofdeferred tax assets arises from future taxable income, including foreign-source income, and theachievement of tax planning strategies. Underlying estimates and assumptions can change over time,influencing our overall tax positions, as a result of unanticipated events or circumstances.
Management continually monitors and evaluates the worldwide impact of tax legislation, decisions,rulings and other current developments on the estimates and assumptions underlying our calculations ofcurrent and deferred taxes and our analysis of the expected realization of deferred tax assets.Additional information about income taxes is in notes 10 and 20 of the Notes to Consolidated FinancialStatements included under Item 8 of this Form 10-K.
49
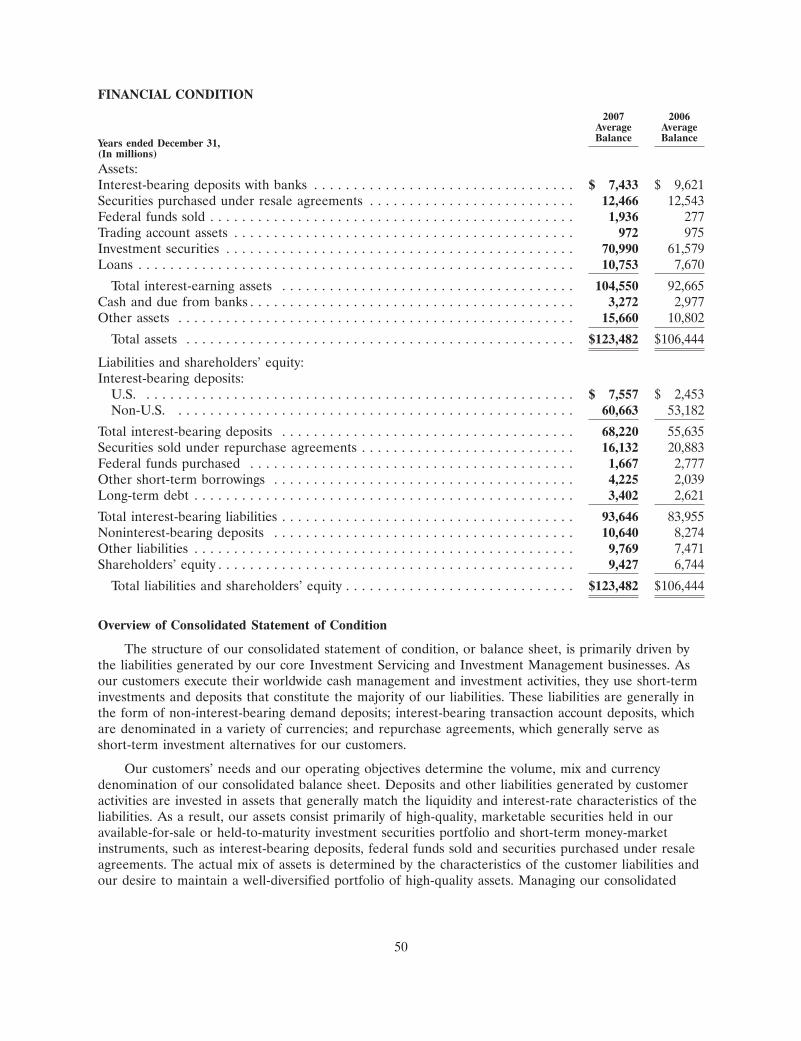
FINANCIAL CONDITION
2007 2006Average AverageBalance BalanceYears ended December 31,
(In millions)
Assets:Interest-bearing deposits with banks . . . . . . . . . . . . . . . . . . . . . . . . . . . . . . . . . $ 7,433 $ 9,621Securities purchased under resale agreements . . . . . . . . . . . . . . . . . . . . . . . . . . 12,466 12,543Federal funds sold . . . . . . . . . . . . . . . . . . . . . . . . . . . . . . . . . . . . . . . . . . . . . . 1,936 277Trading account assets . . . . . . . . . . . . . . . . . . . . . . . . . . . . . . . . . . . . . . . . . . . 972 975Investment securities . . . . . . . . . . . . . . . . . . . . . . . . . . . . . . . . . . . . . . . . . . . . 70,990 61,579Loans . . . . . . . . . . . . . . . . . . . . . . . . . . . . . . . . . . . . . . . . . . . . . . . . . . . . . . . 10,753 7,670
Total interest-earning assets . . . . . . . . . . . . . . . . . . . . . . . . . . . . . . . . . . . . . 104,550 92,665Cash and due from banks . . . . . . . . . . . . . . . . . . . . . . . . . . . . . . . . . . . . . . . . . 3,272 2,977Other assets . . . . . . . . . . . . . . . . . . . . . . . . . . . . . . . . . . . . . . . . . . . . . . . . . . 15,660 10,802
Total assets . . . . . . . . . . . . . . . . . . . . . . . . . . . . . . . . . . . . . . . . . . . . . . . . . $123,482 $106,444
Liabilities and shareholders’ equity:Interest-bearing deposits:
U.S. . . . . . . . . . . . . . . . . . . . . . . . . . . . . . . . . . . . . . . . . . . . . . . . . . . . . . . $ 7,557 $ 2,453Non-U.S. . . . . . . . . . . . . . . . . . . . . . . . . . . . . . . . . . . . . . . . . . . . . . . . . . . 60,663 53,182
Total interest-bearing deposits . . . . . . . . . . . . . . . . . . . . . . . . . . . . . . . . . . . . . 68,220 55,635Securities sold under repurchase agreements . . . . . . . . . . . . . . . . . . . . . . . . . . . 16,132 20,883Federal funds purchased . . . . . . . . . . . . . . . . . . . . . . . . . . . . . . . . . . . . . . . . . 1,667 2,777Other short-term borrowings . . . . . . . . . . . . . . . . . . . . . . . . . . . . . . . . . . . . . . 4,225 2,039Long-term debt . . . . . . . . . . . . . . . . . . . . . . . . . . . . . . . . . . . . . . . . . . . . . . . . 3,402 2,621
Total interest-bearing liabilities . . . . . . . . . . . . . . . . . . . . . . . . . . . . . . . . . . . . . 93,646 83,955Noninterest-bearing deposits . . . . . . . . . . . . . . . . . . . . . . . . . . . . . . . . . . . . . . 10,640 8,274Other liabilities . . . . . . . . . . . . . . . . . . . . . . . . . . . . . . . . . . . . . . . . . . . . . . . . 9,769 7,471Shareholders’ equity . . . . . . . . . . . . . . . . . . . . . . . . . . . . . . . . . . . . . . . . . . . . . 9,427 6,744
Total liabilities and shareholders’ equity . . . . . . . . . . . . . . . . . . . . . . . . . . . . . $123,482 $106,444
Overview of Consolidated Statement of Condition
The structure of our consolidated statement of condition, or balance sheet, is primarily driven bythe liabilities generated by our core Investment Servicing and Investment Management businesses. Asour customers execute their worldwide cash management and investment activities, they use short-terminvestments and deposits that constitute the majority of our liabilities. These liabilities are generally inthe form of non-interest-bearing demand deposits; interest-bearing transaction account deposits, whichare denominated in a variety of currencies; and repurchase agreements, which generally serve asshort-term investment alternatives for our customers.
Our customers’ needs and our operating objectives determine the volume, mix and currencydenomination of our consolidated balance sheet. Deposits and other liabilities generated by customeractivities are invested in assets that generally match the liquidity and interest-rate characteristics of theliabilities. As a result, our assets consist primarily of high-quality, marketable securities held in ouravailable-for-sale or held-to-maturity investment securities portfolio and short-term money-marketinstruments, such as interest-bearing deposits, federal funds sold and securities purchased under resaleagreements. The actual mix of assets is determined by the characteristics of the customer liabilities andour desire to maintain a well-diversified portfolio of high-quality assets. Managing our consolidated
50
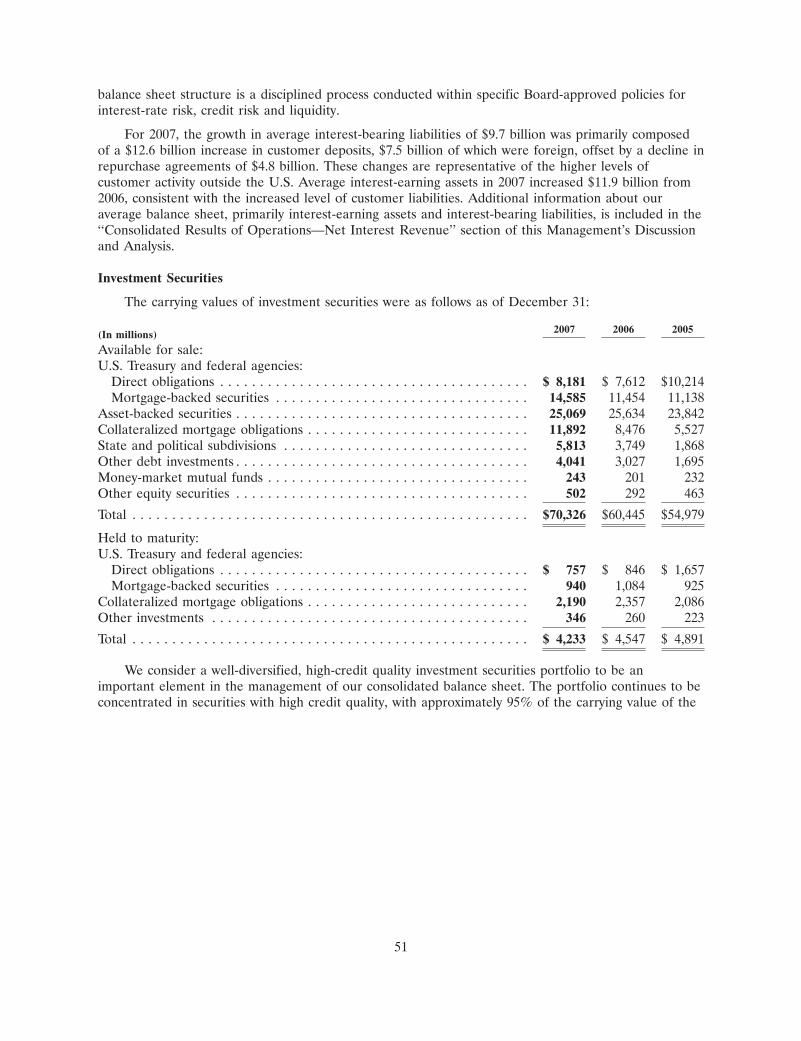
balance sheet structure is a disciplined process conducted within specific Board-approved policies forinterest-rate risk, credit risk and liquidity.
For 2007, the growth in average interest-bearing liabilities of $9.7 billion was primarily composedof a $12.6 billion increase in customer deposits, $7.5 billion of which were foreign, offset by a decline inrepurchase agreements of $4.8 billion. These changes are representative of the higher levels ofcustomer activity outside the U.S. Average interest-earning assets in 2007 increased $11.9 billion from2006, consistent with the increased level of customer liabilities. Additional information about ouraverage balance sheet, primarily interest-earning assets and interest-bearing liabilities, is included in the‘‘Consolidated Results of Operations—Net Interest Revenue’’ section of this Management’s Discussionand Analysis.
Investment Securities
The carrying values of investment securities were as follows as of December 31:
2007 2006 2005(In millions)
Available for sale:U.S. Treasury and federal agencies:
Direct obligations . . . . . . . . . . . . . . . . . . . . . . . . . . . . . . . . . . . . . . . $ 8,181 $ 7,612 $10,214Mortgage-backed securities . . . . . . . . . . . . . . . . . . . . . . . . . . . . . . . . 14,585 11,454 11,138
Asset-backed securities . . . . . . . . . . . . . . . . . . . . . . . . . . . . . . . . . . . . . 25,069 25,634 23,842Collateralized mortgage obligations . . . . . . . . . . . . . . . . . . . . . . . . . . . . 11,892 8,476 5,527State and political subdivisions . . . . . . . . . . . . . . . . . . . . . . . . . . . . . . . 5,813 3,749 1,868Other debt investments . . . . . . . . . . . . . . . . . . . . . . . . . . . . . . . . . . . . . 4,041 3,027 1,695Money-market mutual funds . . . . . . . . . . . . . . . . . . . . . . . . . . . . . . . . . 243 201 232Other equity securities . . . . . . . . . . . . . . . . . . . . . . . . . . . . . . . . . . . . . 502 292 463
Total . . . . . . . . . . . . . . . . . . . . . . . . . . . . . . . . . . . . . . . . . . . . . . . . . . $70,326 $60,445 $54,979
Held to maturity:U.S. Treasury and federal agencies:
Direct obligations . . . . . . . . . . . . . . . . . . . . . . . . . . . . . . . . . . . . . . . $ 757 $ 846 $ 1,657Mortgage-backed securities . . . . . . . . . . . . . . . . . . . . . . . . . . . . . . . . 940 1,084 925
Collateralized mortgage obligations . . . . . . . . . . . . . . . . . . . . . . . . . . . . 2,190 2,357 2,086Other investments . . . . . . . . . . . . . . . . . . . . . . . . . . . . . . . . . . . . . . . . 346 260 223
Total . . . . . . . . . . . . . . . . . . . . . . . . . . . . . . . . . . . . . . . . . . . . . . . . . . $ 4,233 $ 4,547 $ 4,891
We consider a well-diversified, high-credit quality investment securities portfolio to be animportant element in the management of our consolidated balance sheet. The portfolio continues to beconcentrated in securities with high credit quality, with approximately 95% of the carrying value of the
51
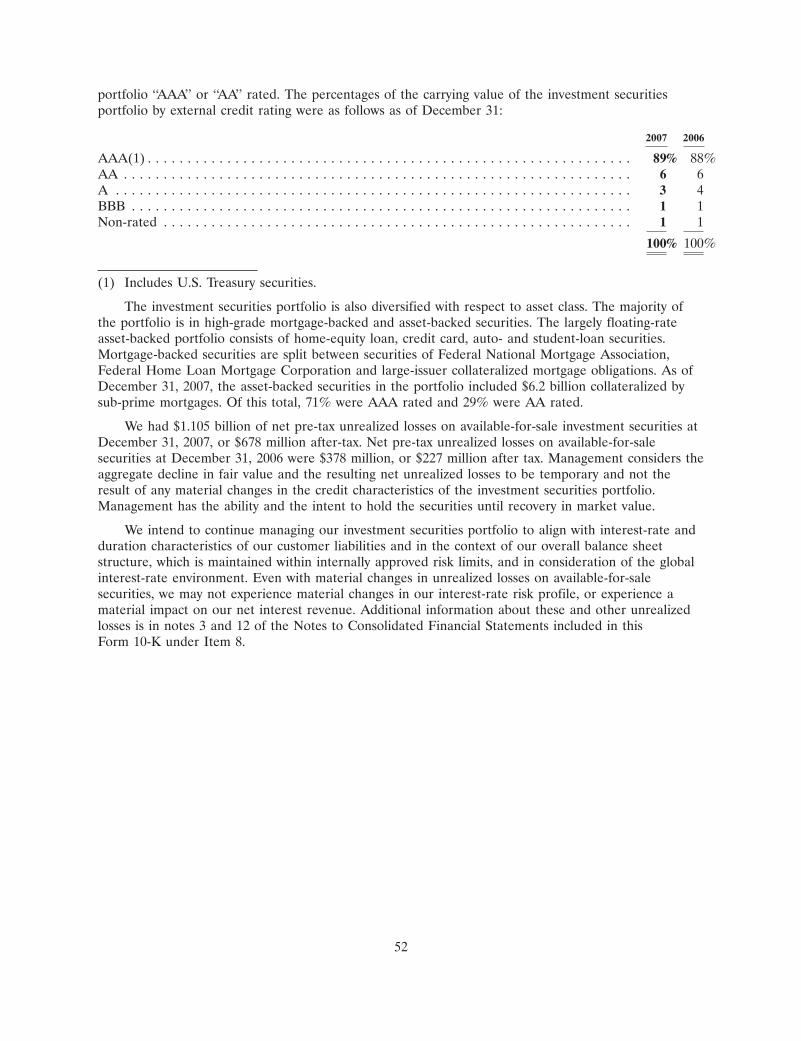
portfolio ‘‘AAA’’ or ‘‘AA’’ rated. The percentages of the carrying value of the investment securitiesportfolio by external credit rating were as follows as of December 31:
2007 2006
AAA(1) . . . . . . . . . . . . . . . . . . . . . . . . . . . . . . . . . . . . . . . . . . . . . . . . . . . . . . . . . . . . . 89% 88%AA . . . . . . . . . . . . . . . . . . . . . . . . . . . . . . . . . . . . . . . . . . . . . . . . . . . . . . . . . . . . . . . . 6 6A . . . . . . . . . . . . . . . . . . . . . . . . . . . . . . . . . . . . . . . . . . . . . . . . . . . . . . . . . . . . . . . . . 3 4BBB . . . . . . . . . . . . . . . . . . . . . . . . . . . . . . . . . . . . . . . . . . . . . . . . . . . . . . . . . . . . . . . 1 1Non-rated . . . . . . . . . . . . . . . . . . . . . . . . . . . . . . . . . . . . . . . . . . . . . . . . . . . . . . . . . . . 1 1
100% 100%
(1) Includes U.S. Treasury securities.
The investment securities portfolio is also diversified with respect to asset class. The majority ofthe portfolio is in high-grade mortgage-backed and asset-backed securities. The largely floating-rateasset-backed portfolio consists of home-equity loan, credit card, auto- and student-loan securities.Mortgage-backed securities are split between securities of Federal National Mortgage Association,Federal Home Loan Mortgage Corporation and large-issuer collateralized mortgage obligations. As ofDecember 31, 2007, the asset-backed securities in the portfolio included $6.2 billion collateralized bysub-prime mortgages. Of this total, 71% were AAA rated and 29% were AA rated.
We had $1.105 billion of net pre-tax unrealized losses on available-for-sale investment securities atDecember 31, 2007, or $678 million after-tax. Net pre-tax unrealized losses on available-for-salesecurities at December 31, 2006 were $378 million, or $227 million after tax. Management considers theaggregate decline in fair value and the resulting net unrealized losses to be temporary and not theresult of any material changes in the credit characteristics of the investment securities portfolio.Management has the ability and the intent to hold the securities until recovery in market value.
We intend to continue managing our investment securities portfolio to align with interest-rate andduration characteristics of our customer liabilities and in the context of our overall balance sheetstructure, which is maintained within internally approved risk limits, and in consideration of the globalinterest-rate environment. Even with material changes in unrealized losses on available-for-salesecurities, we may not experience material changes in our interest-rate risk profile, or experience amaterial impact on our net interest revenue. Additional information about these and other unrealizedlosses is in notes 3 and 12 of the Notes to Consolidated Financial Statements included in thisForm 10-K under Item 8.
52
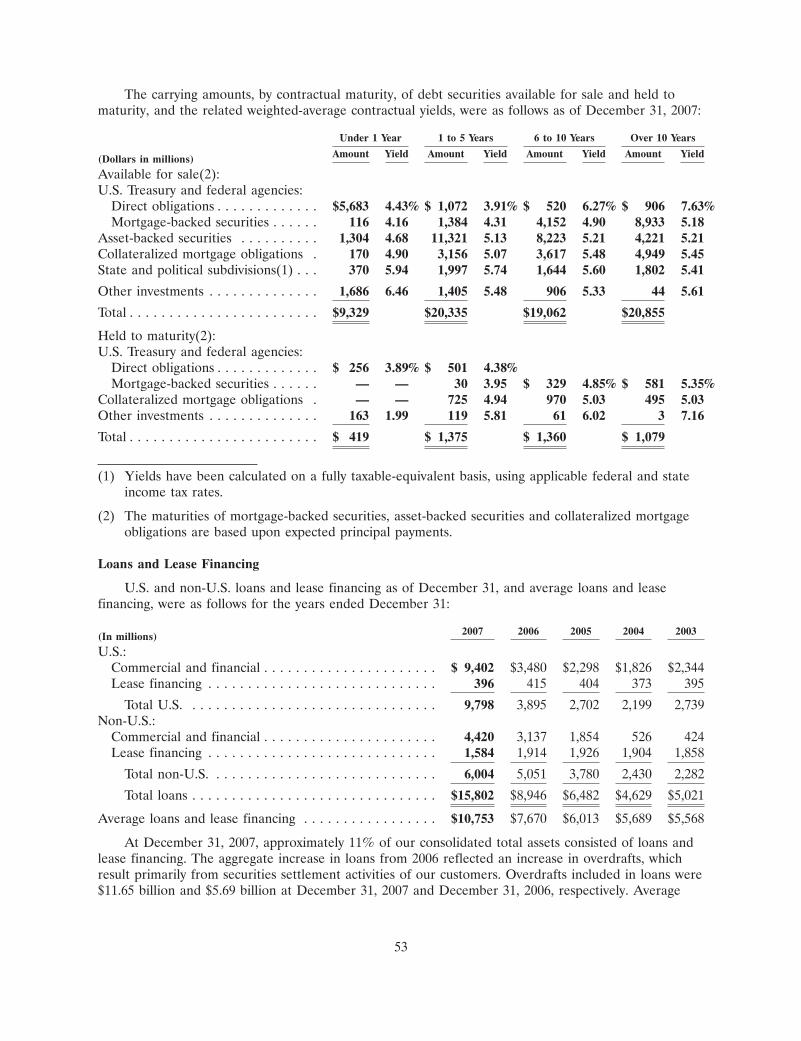
The carrying amounts, by contractual maturity, of debt securities available for sale and held tomaturity, and the related weighted-average contractual yields, were as follows as of December 31, 2007:
Under 1 Year 1 to 5 Years 6 to 10 Years Over 10 Years
Amount Yield Amount Yield Amount Yield Amount Yield(Dollars in millions)
Available for sale(2):U.S. Treasury and federal agencies:
Direct obligations . . . . . . . . . . . . . $5,683 4.43% $ 1,072 3.91% $ 520 6.27% $ 906 7.63%Mortgage-backed securities . . . . . . 116 4.16 1,384 4.31 4,152 4.90 8,933 5.18
Asset-backed securities . . . . . . . . . . 1,304 4.68 11,321 5.13 8,223 5.21 4,221 5.21Collateralized mortgage obligations . 170 4.90 3,156 5.07 3,617 5.48 4,949 5.45State and political subdivisions(1) . . . 370 5.94 1,997 5.74 1,644 5.60 1,802 5.41
Other investments . . . . . . . . . . . . . . 1,686 6.46 1,405 5.48 906 5.33 44 5.61
Total . . . . . . . . . . . . . . . . . . . . . . . . $9,329 $20,335 $19,062 $20,855
Held to maturity(2):U.S. Treasury and federal agencies:
Direct obligations . . . . . . . . . . . . . $ 256 3.89% $ 501 4.38%Mortgage-backed securities . . . . . . — — 30 3.95 $ 329 4.85% $ 581 5.35%
Collateralized mortgage obligations . — — 725 4.94 970 5.03 495 5.03Other investments . . . . . . . . . . . . . . 163 1.99 119 5.81 61 6.02 3 7.16
Total . . . . . . . . . . . . . . . . . . . . . . . . $ 419 $ 1,375 $ 1,360 $ 1,079
(1) Yields have been calculated on a fully taxable-equivalent basis, using applicable federal and stateincome tax rates.
(2) The maturities of mortgage-backed securities, asset-backed securities and collateralized mortgageobligations are based upon expected principal payments.
Loans and Lease Financing
U.S. and non-U.S. loans and lease financing as of December 31, and average loans and leasefinancing, were as follows for the years ended December 31:
2007 2006 2005 2004 2003(In millions)
U.S.:Commercial and financial . . . . . . . . . . . . . . . . . . . . . . $ 9,402 $3,480 $2,298 $1,826 $2,344Lease financing . . . . . . . . . . . . . . . . . . . . . . . . . . . . . 396 415 404 373 395
Total U.S. . . . . . . . . . . . . . . . . . . . . . . . . . . . . . . . 9,798 3,895 2,702 2,199 2,739Non-U.S.:
Commercial and financial . . . . . . . . . . . . . . . . . . . . . . 4,420 3,137 1,854 526 424Lease financing . . . . . . . . . . . . . . . . . . . . . . . . . . . . . 1,584 1,914 1,926 1,904 1,858
Total non-U.S. . . . . . . . . . . . . . . . . . . . . . . . . . . . . 6,004 5,051 3,780 2,430 2,282
Total loans . . . . . . . . . . . . . . . . . . . . . . . . . . . . . . . $15,802 $8,946 $6,482 $4,629 $5,021
Average loans and lease financing . . . . . . . . . . . . . . . . . $10,753 $7,670 $6,013 $5,689 $5,568
At December 31, 2007, approximately 11% of our consolidated total assets consisted of loans andlease financing. The aggregate increase in loans from 2006 reflected an increase in overdrafts, whichresult primarily from securities settlement activities of our customers. Overdrafts included in loans were$11.65 billion and $5.69 billion at December 31, 2007 and December 31, 2006, respectively. Average
53
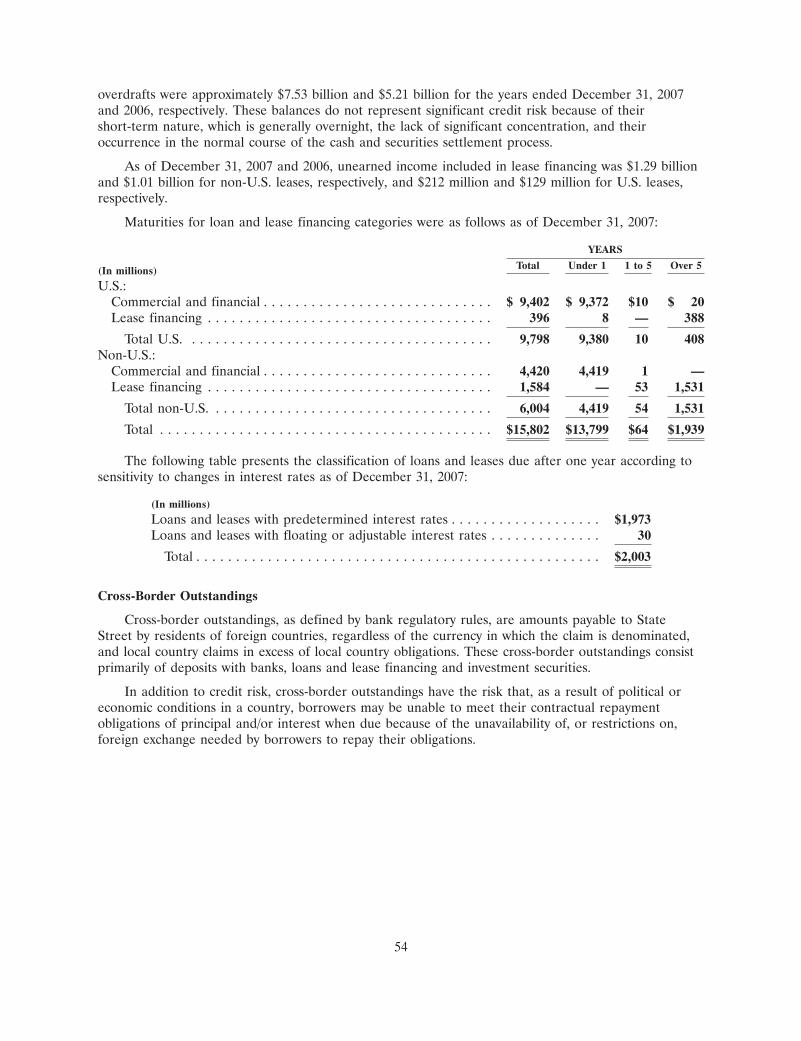
overdrafts were approximately $7.53 billion and $5.21 billion for the years ended December 31, 2007and 2006, respectively. These balances do not represent significant credit risk because of theirshort-term nature, which is generally overnight, the lack of significant concentration, and theiroccurrence in the normal course of the cash and securities settlement process.
As of December 31, 2007 and 2006, unearned income included in lease financing was $1.29 billionand $1.01 billion for non-U.S. leases, respectively, and $212 million and $129 million for U.S. leases,respectively.
Maturities for loan and lease financing categories were as follows as of December 31, 2007:
YEARS
Total Under 1 1 to 5 Over 5(In millions)
U.S.:Commercial and financial . . . . . . . . . . . . . . . . . . . . . . . . . . . . . $ 9,402 $ 9,372 $10 $ 20Lease financing . . . . . . . . . . . . . . . . . . . . . . . . . . . . . . . . . . . . 396 8 — 388
Total U.S. . . . . . . . . . . . . . . . . . . . . . . . . . . . . . . . . . . . . . . 9,798 9,380 10 408Non-U.S.:
Commercial and financial . . . . . . . . . . . . . . . . . . . . . . . . . . . . . 4,420 4,419 1 —Lease financing . . . . . . . . . . . . . . . . . . . . . . . . . . . . . . . . . . . . 1,584 — 53 1,531
Total non-U.S. . . . . . . . . . . . . . . . . . . . . . . . . . . . . . . . . . . . 6,004 4,419 54 1,531
Total . . . . . . . . . . . . . . . . . . . . . . . . . . . . . . . . . . . . . . . . . . $15,802 $13,799 $64 $1,939
The following table presents the classification of loans and leases due after one year according tosensitivity to changes in interest rates as of December 31, 2007:
(In millions)
Loans and leases with predetermined interest rates . . . . . . . . . . . . . . . . . . . $1,973Loans and leases with floating or adjustable interest rates . . . . . . . . . . . . . . 30
Total . . . . . . . . . . . . . . . . . . . . . . . . . . . . . . . . . . . . . . . . . . . . . . . . . . . $2,003
Cross-Border Outstandings
Cross-border outstandings, as defined by bank regulatory rules, are amounts payable to StateStreet by residents of foreign countries, regardless of the currency in which the claim is denominated,and local country claims in excess of local country obligations. These cross-border outstandings consistprimarily of deposits with banks, loans and lease financing and investment securities.
In addition to credit risk, cross-border outstandings have the risk that, as a result of political oreconomic conditions in a country, borrowers may be unable to meet their contractual repaymentobligations of principal and/or interest when due because of the unavailability of, or restrictions on,foreign exchange needed by borrowers to repay their obligations.
54
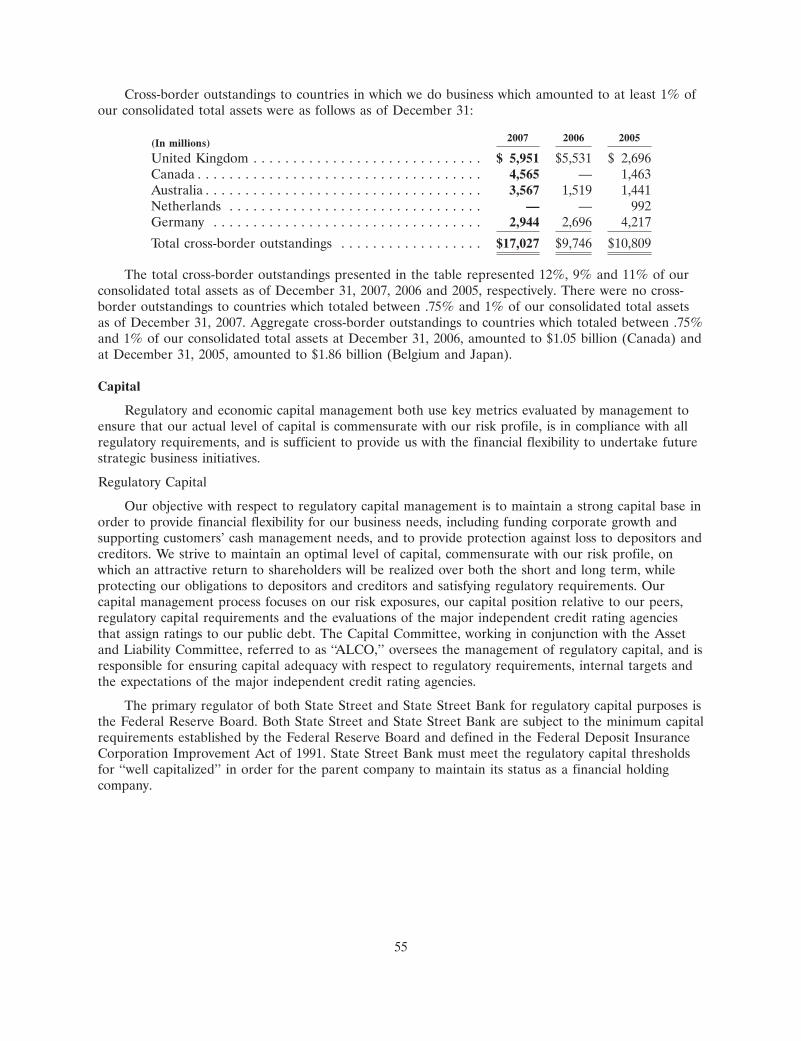
Cross-border outstandings to countries in which we do business which amounted to at least 1% ofour consolidated total assets were as follows as of December 31:
2007 2006 2005(In millions)
United Kingdom . . . . . . . . . . . . . . . . . . . . . . . . . . . . . $ 5,951 $5,531 $ 2,696Canada . . . . . . . . . . . . . . . . . . . . . . . . . . . . . . . . . . . . 4,565 — 1,463Australia . . . . . . . . . . . . . . . . . . . . . . . . . . . . . . . . . . . 3,567 1,519 1,441Netherlands . . . . . . . . . . . . . . . . . . . . . . . . . . . . . . . . — — 992Germany . . . . . . . . . . . . . . . . . . . . . . . . . . . . . . . . . . 2,944 2,696 4,217
Total cross-border outstandings . . . . . . . . . . . . . . . . . . $17,027 $9,746 $10,809
The total cross-border outstandings presented in the table represented 12%, 9% and 11% of ourconsolidated total assets as of December 31, 2007, 2006 and 2005, respectively. There were no cross-border outstandings to countries which totaled between .75% and 1% of our consolidated total assetsas of December 31, 2007. Aggregate cross-border outstandings to countries which totaled between .75%and 1% of our consolidated total assets at December 31, 2006, amounted to $1.05 billion (Canada) andat December 31, 2005, amounted to $1.86 billion (Belgium and Japan).
Capital
Regulatory and economic capital management both use key metrics evaluated by management toensure that our actual level of capital is commensurate with our risk profile, is in compliance with allregulatory requirements, and is sufficient to provide us with the financial flexibility to undertake futurestrategic business initiatives.
Regulatory Capital
Our objective with respect to regulatory capital management is to maintain a strong capital base inorder to provide financial flexibility for our business needs, including funding corporate growth andsupporting customers’ cash management needs, and to provide protection against loss to depositors andcreditors. We strive to maintain an optimal level of capital, commensurate with our risk profile, onwhich an attractive return to shareholders will be realized over both the short and long term, whileprotecting our obligations to depositors and creditors and satisfying regulatory requirements. Ourcapital management process focuses on our risk exposures, our capital position relative to our peers,regulatory capital requirements and the evaluations of the major independent credit rating agenciesthat assign ratings to our public debt. The Capital Committee, working in conjunction with the Assetand Liability Committee, referred to as ‘‘ALCO,’’ oversees the management of regulatory capital, and isresponsible for ensuring capital adequacy with respect to regulatory requirements, internal targets andthe expectations of the major independent credit rating agencies.
The primary regulator of both State Street and State Street Bank for regulatory capital purposes isthe Federal Reserve Board. Both State Street and State Street Bank are subject to the minimum capitalrequirements established by the Federal Reserve Board and defined in the Federal Deposit InsuranceCorporation Improvement Act of 1991. State Street Bank must meet the regulatory capital thresholdsfor ‘‘well capitalized’’ in order for the parent company to maintain its status as a financial holdingcompany.
55
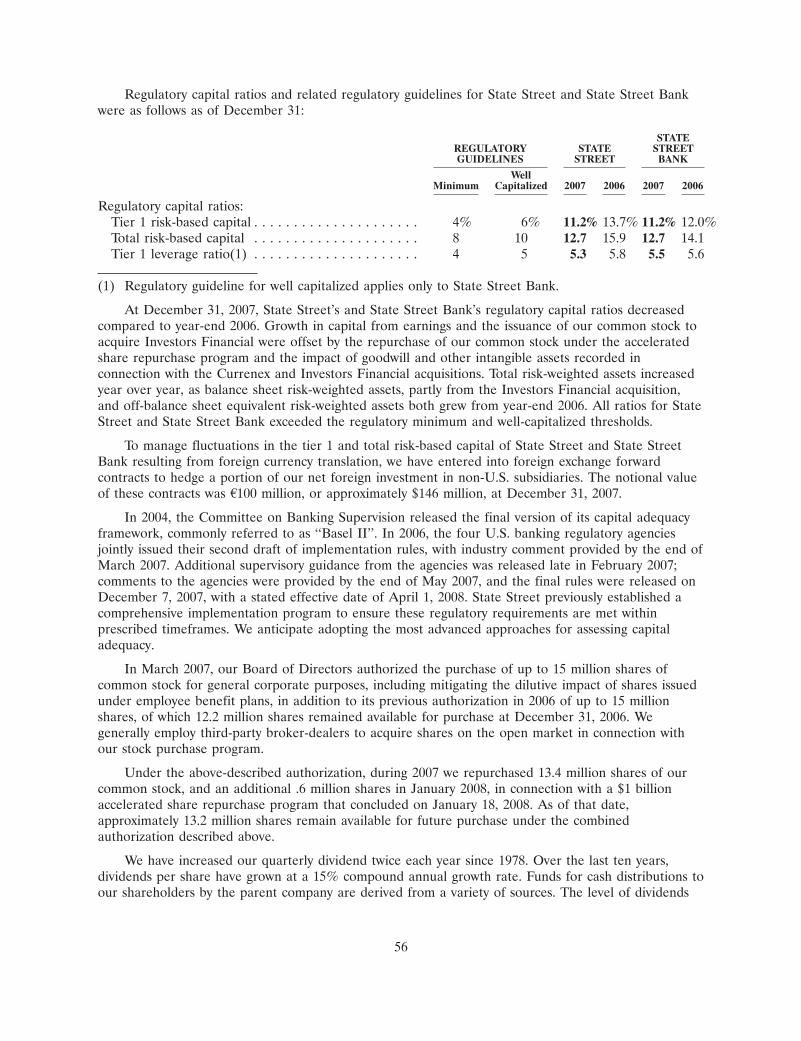
Regulatory capital ratios and related regulatory guidelines for State Street and State Street Bankwere as follows as of December 31:
STATEREGULATORY STATE STREETGUIDELINES STREET BANK
WellMinimum Capitalized 2007 2006 2007 2006
Regulatory capital ratios:Tier 1 risk-based capital . . . . . . . . . . . . . . . . . . . . . 4% 6% 11.2% 13.7% 11.2% 12.0%Total risk-based capital . . . . . . . . . . . . . . . . . . . . . 8 10 12.7 15.9 12.7 14.1Tier 1 leverage ratio(1) . . . . . . . . . . . . . . . . . . . . . 4 5 5.3 5.8 5.5 5.6
(1) Regulatory guideline for well capitalized applies only to State Street Bank.
At December 31, 2007, State Street’s and State Street Bank’s regulatory capital ratios decreasedcompared to year-end 2006. Growth in capital from earnings and the issuance of our common stock toacquire Investors Financial were offset by the repurchase of our common stock under the acceleratedshare repurchase program and the impact of goodwill and other intangible assets recorded inconnection with the Currenex and Investors Financial acquisitions. Total risk-weighted assets increasedyear over year, as balance sheet risk-weighted assets, partly from the Investors Financial acquisition,and off-balance sheet equivalent risk-weighted assets both grew from year-end 2006. All ratios for StateStreet and State Street Bank exceeded the regulatory minimum and well-capitalized thresholds.
To manage fluctuations in the tier 1 and total risk-based capital of State Street and State StreetBank resulting from foreign currency translation, we have entered into foreign exchange forwardcontracts to hedge a portion of our net foreign investment in non-U.S. subsidiaries. The notional valueof these contracts was A100 million, or approximately $146 million, at December 31, 2007.
In 2004, the Committee on Banking Supervision released the final version of its capital adequacyframework, commonly referred to as ‘‘Basel II’’. In 2006, the four U.S. banking regulatory agenciesjointly issued their second draft of implementation rules, with industry comment provided by the end ofMarch 2007. Additional supervisory guidance from the agencies was released late in February 2007;comments to the agencies were provided by the end of May 2007, and the final rules were released onDecember 7, 2007, with a stated effective date of April 1, 2008. State Street previously established acomprehensive implementation program to ensure these regulatory requirements are met withinprescribed timeframes. We anticipate adopting the most advanced approaches for assessing capitaladequacy.
In March 2007, our Board of Directors authorized the purchase of up to 15 million shares ofcommon stock for general corporate purposes, including mitigating the dilutive impact of shares issuedunder employee benefit plans, in addition to its previous authorization in 2006 of up to 15 millionshares, of which 12.2 million shares remained available for purchase at December 31, 2006. Wegenerally employ third-party broker-dealers to acquire shares on the open market in connection withour stock purchase program.
Under the above-described authorization, during 2007 we repurchased 13.4 million shares of ourcommon stock, and an additional .6 million shares in January 2008, in connection with a $1 billionaccelerated share repurchase program that concluded on January 18, 2008. As of that date,approximately 13.2 million shares remain available for future purchase under the combinedauthorization described above.
We have increased our quarterly dividend twice each year since 1978. Over the last ten years,dividends per share have grown at a 15% compound annual growth rate. Funds for cash distributions toour shareholders by the parent company are derived from a variety of sources. The level of dividends
56
to shareholders on our common stock, which totaled $320 million in 2007, is reviewed regularly anddetermined by the Board of Directors considering our liquidity, capital adequacy and recent earningshistory and prospects, as well as economic conditions and other factors deemed relevant. Federal andstate banking regulations place certain restrictions on dividends paid by subsidiary banks to the parentholding company. In addition, bank regulators have the authority to prohibit bank holding companiesfrom paying dividends if they deem such payment to be an unsafe or unsound practice. Informationconcerning limitations on dividends from our subsidiary banks is in note 14 of the Notes toConsolidated Financial Statements included in this Form 10-K under Item 8.
Economic Capital
We define economic capital as the common equity required to protect debt holders againstunexpected economic losses over a one-year period at a level consistent with the solvency of a firmwith our target ‘‘AA’’ debt rating. Our entire economic capital process is the responsibility of ourCapital Committee. The framework and methodologies used to quantify economic capital for each ofthe risk types described below have been developed by our Enterprise Risk Management, GlobalTreasury and Finance groups, and are designed to be generally consistent with our risk managementprinciples. This framework has been approved by senior management and has been reviewed by theExecutive Committee of the Board. Due to the evolving nature of quantification techniques, we expectto periodically refine the methodologies used to estimate our economic capital requirements, whichcould result in a different amount of capital needed to support our risk profile.
We quantify capital requirements for the risks inherent in our business activities and group theminto one of the following broadly-defined categories:
• Market risk: the risk of adverse financial impact due to fluctuations in market prices, primarilyas they relate to our trading activities
• Interest-rate risk: the risk of loss in non-trading asset and liability management positions,primarily the impact of adverse movements in interest rates on the repricing mismatches thatexist between balance sheet assets and liabilities
• Credit risk: the risk of loss that may result from the default or downgrade of a borrower orcounterparty
• Operational risk: the risk of loss from inadequate or failed internal processes, people andsystems, or from external events
• Business risk: the risk of adverse changes in our earnings from business factors, includingchanges in the competitive environment, changes in the operational economics of businessactivities, and the effect of strategic and reputation risks
Economic capital for each of these five categories is estimated on a stand-alone basis usingstatistical modeling techniques applied to internally generated and, in some cases, external data. Theseindividual results are then aggregated at the State Street consolidated level. A capital reduction ordiversification benefit is then applied to reflect the unlikely event of experiencing an extremely largeloss in each risk type at the same time.
Liquidity
The objective of liquidity management is to ensure that we have the ability to meet our financialobligations in a timely and cost-effective manner, and that we maintain sufficient flexibility to fundstrategic corporate initiatives as they arise. Effective management of liquidity involves assessing thepotential mismatch between the future cash needs of our customers and our available sources of cashunder normal and adverse economic and business conditions. Uses of liquidity consist primarily ofmeeting deposit withdrawals; funding outstanding commitments to extend credit or purchase securities
57

as they are drawn upon; overdraft facilities; and liquidity asset purchase agreements. Liquidity isprovided by the maintenance of broad access to the global capital markets and our balance sheet assetstructure.
Global Treasury is responsible for the day-to-day management of our global liquidity position,which is conducted within risk guidelines established and monitored by ALCO. Management maintainsa liquidity measurement framework to assess the sources and uses of liquidity that is continuouslymonitored by Global Treasury and Enterprise Risk Management. Embedded in this framework is aprocess that outlines several levels of potential risk to our liquidity and identifies ‘‘triggers’’ that we useas early warning signals of a possible difficulty. These triggers are a combination of internal andexternal measures of potential increases in cash needs or decreases in available sources of cash andpossible impairment of our ability to access the global capital markets. Another important componentof the framework is a contingency funding plan that is designed to identify and manage through apotential liquidity crisis. The plan defines roles, responsibilities and management actions to beundertaken in the event of a deterioration in our liquidity profile caused by either a State Street-specific event or a broader disruption in the capital markets. Specific actions are linked to the levels of‘‘triggers.’’
We generally manage our liquidity risk on a global basis at the consolidated level. We also manageparent company liquidity, and in certain cases branch liquidity, separately. State Street Bank generallyhas broader access to funding products and markets limited to banks, specifically the federal fundsmarket and the Federal Reserve’s discount window. The parent company is managed to a moreconservative liquidity profile, reflecting narrower market access. We typically hold enough cash,primarily in the form of interest-bearing deposits with subsidiary banks, to meet current debt maturitiesand cash needs, as well as those projected over the next one-year period.
Sources of liquidity come from two primary areas: access to the global capital markets and liquidassets maintained on our consolidated balance sheet. Our ability to source incremental funding atreasonable rates of interest from wholesale investors in the capital markets is the first source ofliquidity we would tap to accommodate the uses of liquidity described below. On-balance sheet liquidassets are also an integral component of our liquidity management strategy. These assets provideliquidity through maturities of the assets, but more importantly, they provide us with the ability to raisefunds by pledging the securities as collateral or through outright sales. Each of these sources is used inthe management of daily cash needs and in a crisis scenario where we would need to accommodatepotential large, unexpected demand for funds.
Uses of liquidity result from four primary areas: withdrawals of unsecured customer deposits;draws on unfunded commitments to extend credit or purchase securities, generally provided throughlines of credit; overdraft facilities; and liquidity asset purchase agreements supporting the fourcommercial paper conduits that we administer. Customer deposits are generated largely from ourinvestment servicing activities, and are invested in a combination of term investment securities andshort-term money market assets whose mix is determined by the characteristics of the deposits. Most ofthe customer liabilities are payable upon demand or are short-term in nature, which means thatwithdrawals can potentially occur quickly and in large amounts. Similarly, customers can requestdisbursement of funds under commitments to extend credit, or can overdraw deposit accounts rapidlyand in large volumes.
Material risks to sources of short-term liquidity would include, among other things, external ratingagency downgrades of our deposits and debt securities, which would restrict our ability to access thecapital markets and may lead to withdrawals of unsecured deposits by our customers. In addition, alarge volume of unanticipated funding requirements, such as fundings under liquidity asset purchaseagreements that have met draw conditions, or large draw-downs of existing lines of credit, could requireadditional liquidity. During the summer of 2007, the disruption in the global fixed-income securities
58
markets, which largely stemmed from sub-prime mortgages and securities collateralized by them andlater spread to asset-backed securities in general, caused us to invoke some elements of ourcontingency funding plan, resulting in more active monitoring of our liquidity position and morefrequent reporting to management. Of primary concern was our ability to replace maturing commercialpaper issued by the conduits. As more fully discussed in the ‘‘Off-Balance Arrangements’’ section ofthis Management’s Discussion and Analysis, we have been able to reissue the paper, but with somedifficulty and at higher rates of interest because of a significant decline in the demand for asset-backedcommercial paper in the market generally. One action we have taken to improve our liquidity positionhas been the issuance of term wholesale certificates of deposit and the placement of those funds intoshort-term money market assets where they would be available to meet cash needs. This portfolio stoodat $4.57 billion as of December 31, 2007. It is important to note that we did not experience anydeterioration in our customer deposit base; it was stable to growing during 2007.
While maintenance of our high investment-grade credit rating is of primary importance to ourliquidity management program, on-balance sheet liquid assets represent significant liquidity that we candirectly control, and provide a source of cash in the form of principal maturities and the ability toborrow from the capital markets using our securities as collateral. Our liquid assets consist primarily ofshort-term money-market assets, such as federal funds sold and interest-bearing deposits with banks,the latter of which are multicurrency instruments invested with major multinational banks; andhigh-quality, marketable investment securities not already pledged, which generally are more liquid thanother types of assets and can be sold or borrowed against to quickly generate cash. As of December 31,2007, the cash value of our liquid assets, as defined, totaled $55.14 billion. Securities carried at$39.84 billion as of December 31, 2007 were designated as pledged for public and trust deposits,borrowed funds and for other purposes as provided by law, and are excluded from the liquid assetscalculation. Included in liquid assets are securities that have been pledged to the Federal Reserve Bankof Boston in order to secure our ability to borrow from the discount window should the need arise.This access to the discount window, including the Federal Reserve’s recently announced term auctionfacility, is an important source of back-up liquidity for State Street Bank. As of December 31, 2007, wehad no outstanding borrowings from the discount window.
Based upon our level of liquid assets and our ability to access the capital markets for additionalfunding when necessary, management considers overall liquidity at December 31, 2007 more thansufficient to meet State Street’s current commitments and business needs, including accommodating thetransaction and cash management needs of its customers.
In April 2007, the parent company issued $700 million of senior debt, consisting of $250 million offloating-rate notes due in 2012 and $450 million of 5.375% notes due in 2017. In addition, State StreetCapital Trust IV, a Delaware statutory trust wholly owned by the parent company, issued $800 millionin aggregate liquidation amount of floating-rate capital securities and used the proceeds to purchase alike amount of floating-rate junior subordinated debentures from the parent company. The capitalsecurities represent an undivided preferred beneficial interest in those junior subordinated debentures,which are the only assets of the trust. The junior subordinated debentures have an initial scheduledmaturity in June 2037 and an initial final repayment date in June 2067, each of which we may extendby ten years in specified circumstances. In accordance with existing accounting standards, we did notrecord the trust in our consolidated financial statements. The junior subordinated debentures qualifyfor inclusion in tier 1 regulatory capital.
In connection with the issuance of the junior subordinated debentures, the parent companyentered into a replacement capital covenant in which it agreed, for the benefit of the holders of itsjunior subordinated debentures due 2028 underlying the floating-rate capital securities issued by StateStreet Capital Trust I, that it will not repay, redeem or repurchase, and that none of its subsidiaries willpurchase, any part of the newly issued debentures or the floating-rate capital securities on or beforeJune 1, 2047, unless the repayment, redemption or repurchase is made from the net cash proceeds of
59
the issuance of certain qualified securities and pursuant to the other terms and conditions set forth inthe covenant.
In July 2007, we redeemed an aggregate of $500 million of unsecured junior subordinateddebentures issued by the parent company to two of our statutory business trusts, State Street CapitalTrusts A and B, composed of $200 million of 7.94% debentures issued in 1996 and $300 million of8.035% debentures issued in 1997. We paid the trusts the outstanding amount on the debentures plusaccrued interest and an aggregate redemption premium of approximately $20 million. This redemptionpremium was included in the merger and integration costs which we recorded during the third quarterof 2007 in connection with the Investors Financial acquisition. Additional information about these costsis in the ‘‘Consolidated Results of Operations—Operating Expenses’’ section of this Management’sDiscussion and Analysis.
In July 2007, the trusts, consistent with the terms of their applicable governing documents,redeemed their respective outstanding capital securities, with an aggregate liquidation amount of$500 million, corresponding to the debentures. The trusts paid to the holders of the outstanding capitalsecurities the same amount that was paid by the parent company to the trusts to redeem thedebentures.
In January 2008, State Street Capital Trust III, a Delaware statutory trust wholly owned by theparent company, issued $500 million in aggregate liquidation amount of 8.250% fixed-to-floating ratenormal automatic preferred enhanced capital securities, referred to as ‘‘normal APEX,’’ and used theproceeds to purchase a like amount of remarketable 6.001% junior subordinated debentures due 2042from the parent company. In addition, the trust entered into stock purchase contracts with the parentcompany under which the trust agrees to purchase, and the parent company agrees to sell, on the stockpurchase date, a like amount in aggregate liquidation amount of the parent company’s non-cumulativeperpetual preferred stock, series A, $100,000 liquidation preference per share. State Street will makecontract payments to the trust at an annual rate of 2.249% of the stated amount of $100,000 per stockpurchase contract. The normal APEX are beneficial interests in the trust. The trust will pass through,as distributions on or the redemption price of normal APEX, amounts that it receives on its assets thatare the corresponding assets for the normal APEX. The corresponding assets for each normal APEX,$1,000 liquidation amount, initially are $1,000 principal amount of the 6.001% junior subordinateddebentures and a 1/100th, or a $1,000, interest in a stock purchase contract for the purchase and sale ofone share of the Series A preferred stock for $100,000. The stock purchase date is expected to beMarch 15, 2011, but it may occur on an earlier date or as late as March 15, 2012. From and after thestock purchase date, the corresponding asset for each normal APEX will be a 1/100th, or a $1,000,interest in one share of the Series A preferred stock. In accordance with existing accounting standards,we did not record the trust in our consolidated financial statements. The 6.001% junior debenturesqualify for inclusion in tier 1 regulatory capital.
As stated previously, our ability to maintain consistent access to liquidity is fostered by themaintenance of high investment-grade ratings on our debt, as measured by the major independentcredit rating agencies. Factors essential to retaining high credit ratings include diverse and stable coreearnings; strong risk management; strong capital ratios; diverse liquidity sources, including the globalcapital markets and customer deposits; and strong liquidity monitoring procedures. High ratings ondebt minimize borrowing costs and enhance our liquidity by ensuring the largest possible market forour debt. A downgrade or reduction of these credit ratings could have an adverse impact to our abilityto access funding at favorable interest rates. Following our January 3, 2008 announcement of a netcharge to establish a reserve associated with certain active fixed-income strategies managed by SSgA,the major national rating agencies affirmed their ratings for State Street and State Street Bank.However, Moody’s Investors Service and Fitch changed their outlook from stable to negative. These
60
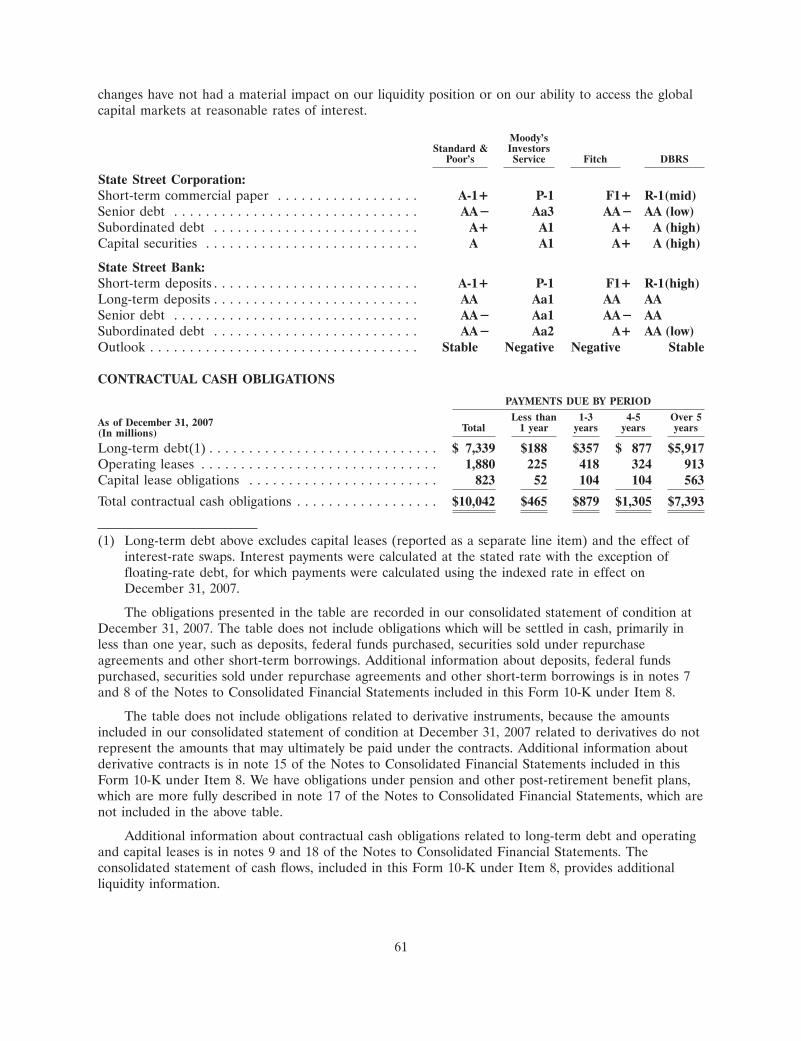
changes have not had a material impact on our liquidity position or on our ability to access the globalcapital markets at reasonable rates of interest.
Moody’sStandard & Investors
Poor’s Service Fitch DBRS
State Street Corporation:Short-term commercial paper . . . . . . . . . . . . . . . . . . A-1+ P-1 F1+ R-1(mid)Senior debt . . . . . . . . . . . . . . . . . . . . . . . . . . . . . . . AA� Aa3 AA� AA (low)Subordinated debt . . . . . . . . . . . . . . . . . . . . . . . . . . A+ A1 A+ A (high)Capital securities . . . . . . . . . . . . . . . . . . . . . . . . . . . A A1 A+ A (high)
State Street Bank:Short-term deposits . . . . . . . . . . . . . . . . . . . . . . . . . . A-1+ P-1 F1+ R-1(high)Long-term deposits . . . . . . . . . . . . . . . . . . . . . . . . . . AA Aa1 AA AASenior debt . . . . . . . . . . . . . . . . . . . . . . . . . . . . . . . AA� Aa1 AA� AASubordinated debt . . . . . . . . . . . . . . . . . . . . . . . . . . AA� Aa2 A+ AA (low)Outlook . . . . . . . . . . . . . . . . . . . . . . . . . . . . . . . . . . Stable Negative Negative Stable
CONTRACTUAL CASH OBLIGATIONS
PAYMENTS DUE BY PERIOD
Less than 1-3 4-5 Over 5As of December 31, 2007 Total 1 year years years years(In millions)
Long-term debt(1) . . . . . . . . . . . . . . . . . . . . . . . . . . . . . $ 7,339 $188 $357 $ 877 $5,917Operating leases . . . . . . . . . . . . . . . . . . . . . . . . . . . . . . 1,880 225 418 324 913Capital lease obligations . . . . . . . . . . . . . . . . . . . . . . . . 823 52 104 104 563
Total contractual cash obligations . . . . . . . . . . . . . . . . . . $10,042 $465 $879 $1,305 $7,393
(1) Long-term debt above excludes capital leases (reported as a separate line item) and the effect ofinterest-rate swaps. Interest payments were calculated at the stated rate with the exception offloating-rate debt, for which payments were calculated using the indexed rate in effect onDecember 31, 2007.
The obligations presented in the table are recorded in our consolidated statement of condition atDecember 31, 2007. The table does not include obligations which will be settled in cash, primarily inless than one year, such as deposits, federal funds purchased, securities sold under repurchaseagreements and other short-term borrowings. Additional information about deposits, federal fundspurchased, securities sold under repurchase agreements and other short-term borrowings is in notes 7and 8 of the Notes to Consolidated Financial Statements included in this Form 10-K under Item 8.
The table does not include obligations related to derivative instruments, because the amountsincluded in our consolidated statement of condition at December 31, 2007 related to derivatives do notrepresent the amounts that may ultimately be paid under the contracts. Additional information aboutderivative contracts is in note 15 of the Notes to Consolidated Financial Statements included in thisForm 10-K under Item 8. We have obligations under pension and other post-retirement benefit plans,which are more fully described in note 17 of the Notes to Consolidated Financial Statements, which arenot included in the above table.
Additional information about contractual cash obligations related to long-term debt and operatingand capital leases is in notes 9 and 18 of the Notes to Consolidated Financial Statements. Theconsolidated statement of cash flows, included in this Form 10-K under Item 8, provides additionalliquidity information.
61
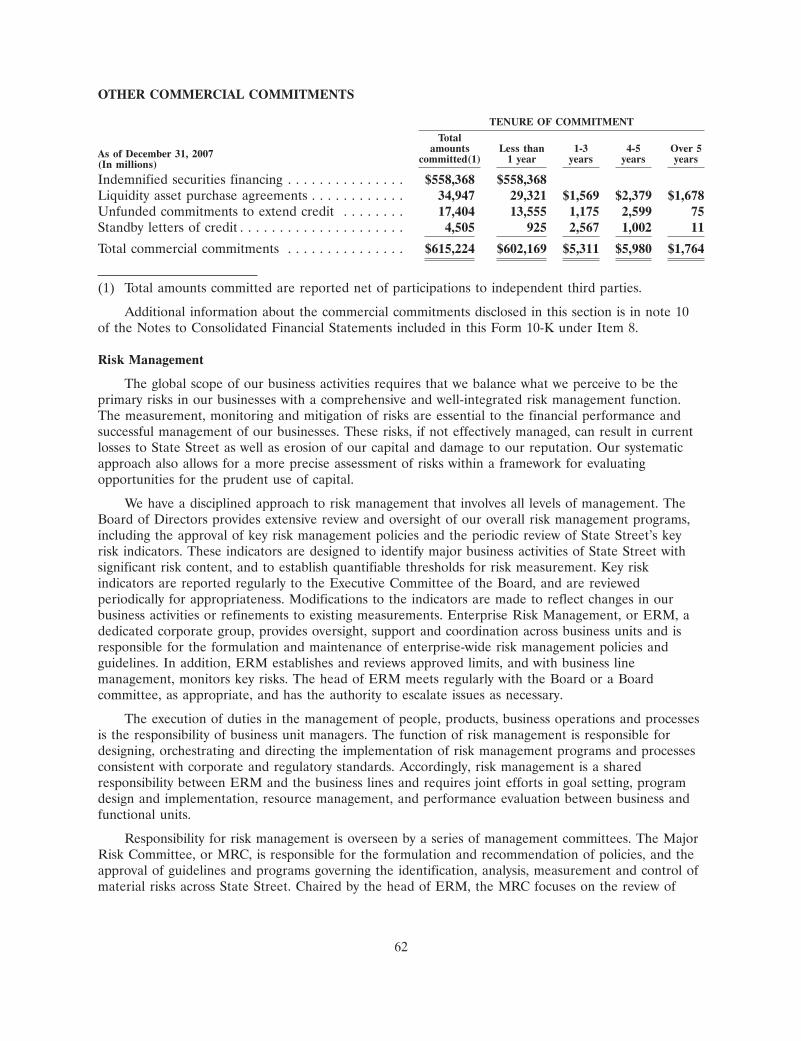
OTHER COMMERCIAL COMMITMENTS
TENURE OF COMMITMENT
Totalamounts Less than 1-3 4-5 Over 5As of December 31, 2007 committed(1) 1 year years years years(In millions)
Indemnified securities financing . . . . . . . . . . . . . . . $558,368 $558,368Liquidity asset purchase agreements . . . . . . . . . . . . 34,947 29,321 $1,569 $2,379 $1,678Unfunded commitments to extend credit . . . . . . . . 17,404 13,555 1,175 2,599 75Standby letters of credit . . . . . . . . . . . . . . . . . . . . . 4,505 925 2,567 1,002 11
Total commercial commitments . . . . . . . . . . . . . . . $615,224 $602,169 $5,311 $5,980 $1,764
(1) Total amounts committed are reported net of participations to independent third parties.
Additional information about the commercial commitments disclosed in this section is in note 10of the Notes to Consolidated Financial Statements included in this Form 10-K under Item 8.
Risk Management
The global scope of our business activities requires that we balance what we perceive to be theprimary risks in our businesses with a comprehensive and well-integrated risk management function.The measurement, monitoring and mitigation of risks are essential to the financial performance andsuccessful management of our businesses. These risks, if not effectively managed, can result in currentlosses to State Street as well as erosion of our capital and damage to our reputation. Our systematicapproach also allows for a more precise assessment of risks within a framework for evaluatingopportunities for the prudent use of capital.
We have a disciplined approach to risk management that involves all levels of management. TheBoard of Directors provides extensive review and oversight of our overall risk management programs,including the approval of key risk management policies and the periodic review of State Street’s keyrisk indicators. These indicators are designed to identify major business activities of State Street withsignificant risk content, and to establish quantifiable thresholds for risk measurement. Key riskindicators are reported regularly to the Executive Committee of the Board, and are reviewedperiodically for appropriateness. Modifications to the indicators are made to reflect changes in ourbusiness activities or refinements to existing measurements. Enterprise Risk Management, or ERM, adedicated corporate group, provides oversight, support and coordination across business units and isresponsible for the formulation and maintenance of enterprise-wide risk management policies andguidelines. In addition, ERM establishes and reviews approved limits, and with business linemanagement, monitors key risks. The head of ERM meets regularly with the Board or a Boardcommittee, as appropriate, and has the authority to escalate issues as necessary.
The execution of duties in the management of people, products, business operations and processesis the responsibility of business unit managers. The function of risk management is responsible fordesigning, orchestrating and directing the implementation of risk management programs and processesconsistent with corporate and regulatory standards. Accordingly, risk management is a sharedresponsibility between ERM and the business lines and requires joint efforts in goal setting, programdesign and implementation, resource management, and performance evaluation between business andfunctional units.
Responsibility for risk management is overseen by a series of management committees. The MajorRisk Committee, or MRC, is responsible for the formulation and recommendation of policies, and theapproval of guidelines and programs governing the identification, analysis, measurement and control ofmaterial risks across State Street. Chaired by the head of ERM, the MRC focuses on the review of
62
business activities with significant risk content and the assessment of risk management programs andinitiatives. The Capital Committee, chaired by the Chief Financial Officer, oversees the management ofour regulatory and economic capital, the determination of the framework for capital allocation andstrategies for capital structure and debt and equity issuances. ALCO, chaired by the Treasurer, overseesthe management of our consolidated balance sheet, including management of our global liquidity andinterest-rate risk positions. The Fiduciary Review Committee reviews the criteria for the acceptance offiduciary duties, and assists our business lines with their fiduciary responsibilities executed on behalf ofcustomers. The Credit Committee, chaired within ERM, acts as the credit policy committee for StateStreet. The Operational Risk Committee, chaired within ERM, provides cross-business oversight ofoperational risk to identify, measure, manage and control operational risk in an effective and consistentmanner across State Street. The Model Assessment Committee, chaired within ERM, provides unbiasedrecommendations concerning technical modeling issues and independently validates qualifying financialmodels utilized by our businesses. Several other committees with specialized risk management functionsreport to the MRC.
Corporate Audit serves in a complementary role to our program of risk management, providingthe Board and management with continuous monitoring and control assessments to ensure adherenceto State Street’s policies and procedures and the effectiveness of its system of internal controls.Additionally, the internal control environment is evaluated through external examinations andregulatory compliance efforts. The Corporate Compliance, Regulatory and Industry Affairs, and Legalgroups also serve essential roles in risk management. Corporate Compliance is responsible for thedesign, implementation and oversight of policies, guidelines and programs to ensure our compliancewith applicable laws and regulations wherever we conduct business. The Regulatory and IndustryAffairs group monitors proposed changes in rules and legislation, and the Legal group provides counselthat enables us to deal with complex legal and regulatory environments, maximize businessopportunities and minimize legal, regulatory and other risks.
While we believe that our risk management program is effective in managing the risks in ourbusinesses, external factors may create risks that cannot always be identified or anticipated. Forexample, a material counterparty failure or a default of a material obligor could have a materialadverse effect on our consolidated results of operations.
Market Risk
Market risk is defined as the risk of adverse financial impact due to fluctuations in interest rates,foreign exchange rates and other market-driven rates or prices. We are exposed to market risk both inour trading and non-trading, or asset and liability management, activities. We manage our overallmarket risk through a comprehensive risk management framework. This framework includes riskmanagement groups that report independently to senior management through ERM. The process ofmanaging market risk for these activities, discussed in further detail below, applies to both on-balancesheet and off-balance sheet exposures.
Trading Activities
We primarily engage in trading and investment activities to serve our customers’ needs and tocontribute to overall corporate earnings and liquidity. In the conduct of these activities, we are subjectto, and assume, market risk. The level of market risk that we assume is a function of our overallobjectives and liquidity needs, customer requirements and market volatility. Interest-rate risk, acomponent of market risk, is more thoroughly discussed in the ‘‘Asset and Liability Management’’portion of this ‘‘Market Risk’’ section.
Market risk associated with foreign exchange and trading activities is controlled throughestablished limits on aggregate and net open positions, sensitivity to changes in interest rates, and
63
concentrations, which are supplemented by stop-loss thresholds. We use an array of risk managementtools and methodologies, including value-at-risk, to measure, monitor and control market risk. All limitsand measurement techniques are reviewed and adjusted as necessary on a regular basis by businessmanagers, the market risk management group and the Trading and Market Risk Committee.
We use a variety of derivative financial instruments to support customers’ needs, conduct tradingactivities and manage our interest-rate and currency risk. These activities are designed to create tradingrevenue or to hedge volatility in net interest revenue. In addition, we provide services related toderivative financial instruments in our role as both a manager and servicer of financial assets.
Our customers use derivative financial instruments to manage the financial risks associated withtheir investment goals and business activities. With the growth of cross-border investing, customers havean increasing need for foreign exchange forward contracts to convert currency for internationalinvestment and to manage the currency risk in international investment portfolios. As an activeparticipant in the foreign exchange markets, we provide foreign exchange forward contracts and optionsin support of these customer needs.
As part of our trading activities, we assume positions in the foreign exchange and interest-ratemarkets by buying and selling cash instruments and using derivative financial instruments, includingforeign exchange forward contracts, foreign exchange and interest-rate options and interest-rate swaps.As of December 31, 2007, the notional amounts of all of these derivative financial instruments were$796.19 billion, of which $732.01 billion were foreign exchange forward contracts. In the aggregate, longand short foreign exchange forward positions are closely matched to minimize currency andinterest-rate risk. All foreign exchange contracts are valued daily at current market rates.
We use a variety of risk measurement and estimation techniques, including value-at-risk.Value-at-risk is an estimate of potential loss for a given period within a stated statistical confidenceinterval. We use a system of risk management to estimate value-at-risk daily for all material tradingpositions. We have adopted standards for estimating value-at-risk, and we maintain capital for marketrisk in accordance with applicable regulatory guidelines. Value-at-risk is estimated for a 99% one-tailconfidence interval and an assumed one-day holding period using a historical observation period ofgreater than one year. A 99% one-tail confidence interval implies that daily trading losses should notexceed the estimated value-at-risk more than 1% of the time, or approximately three days out of theyear. The methodology uses a simulation approach based on observed changes in market prices andtakes into account the resulting diversification benefits provided from the mix of our trading positions.
Like all quantitative risk measures, value-at-risk is subject to certain limitations and assumptionsinherent in the methodology. Our methodology gives equal weight to all market-rate observationsregardless of how recently the market rates were observed. The estimate is calculated using staticportfolios consisting of positions held at the end of the trading day. Implicit in the estimate is theassumption that no intraday action is taken by management during adverse market movements. As aresult, the methodology does not represent risk associated with intraday changes in positions orintraday price volatility.
64
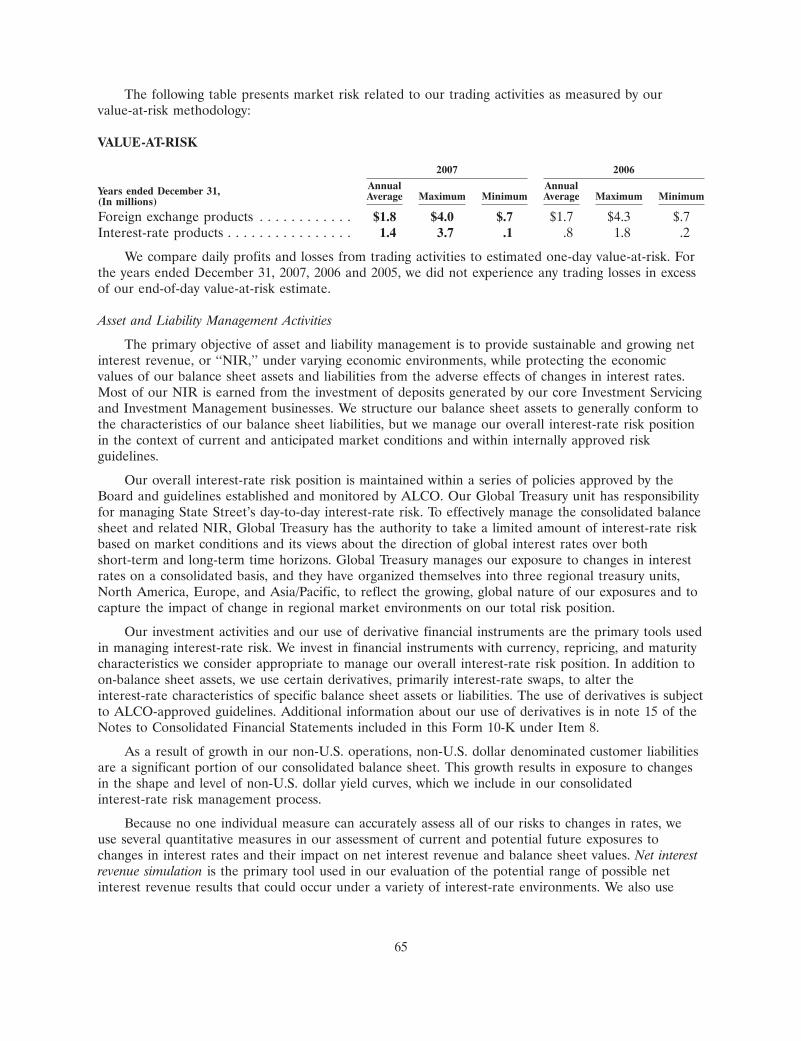
The following table presents market risk related to our trading activities as measured by ourvalue-at-risk methodology:
VALUE-AT-RISK
2007 2006
Annual AnnualYears ended December 31, Average Maximum Minimum Average Maximum Minimum(In millions)
Foreign exchange products . . . . . . . . . . . . $1.8 $4.0 $.7 $1.7 $4.3 $.7Interest-rate products . . . . . . . . . . . . . . . . 1.4 3.7 .1 .8 1.8 .2
We compare daily profits and losses from trading activities to estimated one-day value-at-risk. Forthe years ended December 31, 2007, 2006 and 2005, we did not experience any trading losses in excessof our end-of-day value-at-risk estimate.
Asset and Liability Management Activities
The primary objective of asset and liability management is to provide sustainable and growing netinterest revenue, or ‘‘NIR,’’ under varying economic environments, while protecting the economicvalues of our balance sheet assets and liabilities from the adverse effects of changes in interest rates.Most of our NIR is earned from the investment of deposits generated by our core Investment Servicingand Investment Management businesses. We structure our balance sheet assets to generally conform tothe characteristics of our balance sheet liabilities, but we manage our overall interest-rate risk positionin the context of current and anticipated market conditions and within internally approved riskguidelines.
Our overall interest-rate risk position is maintained within a series of policies approved by theBoard and guidelines established and monitored by ALCO. Our Global Treasury unit has responsibilityfor managing State Street’s day-to-day interest-rate risk. To effectively manage the consolidated balancesheet and related NIR, Global Treasury has the authority to take a limited amount of interest-rate riskbased on market conditions and its views about the direction of global interest rates over bothshort-term and long-term time horizons. Global Treasury manages our exposure to changes in interestrates on a consolidated basis, and they have organized themselves into three regional treasury units,North America, Europe, and Asia/Pacific, to reflect the growing, global nature of our exposures and tocapture the impact of change in regional market environments on our total risk position.
Our investment activities and our use of derivative financial instruments are the primary tools usedin managing interest-rate risk. We invest in financial instruments with currency, repricing, and maturitycharacteristics we consider appropriate to manage our overall interest-rate risk position. In addition toon-balance sheet assets, we use certain derivatives, primarily interest-rate swaps, to alter theinterest-rate characteristics of specific balance sheet assets or liabilities. The use of derivatives is subjectto ALCO-approved guidelines. Additional information about our use of derivatives is in note 15 of theNotes to Consolidated Financial Statements included in this Form 10-K under Item 8.
As a result of growth in our non-U.S. operations, non-U.S. dollar denominated customer liabilitiesare a significant portion of our consolidated balance sheet. This growth results in exposure to changesin the shape and level of non-U.S. dollar yield curves, which we include in our consolidatedinterest-rate risk management process.
Because no one individual measure can accurately assess all of our risks to changes in rates, weuse several quantitative measures in our assessment of current and potential future exposures tochanges in interest rates and their impact on net interest revenue and balance sheet values. Net interestrevenue simulation is the primary tool used in our evaluation of the potential range of possible netinterest revenue results that could occur under a variety of interest-rate environments. We also use
65
market valuation and duration analysis to assess changes in the economic value of balance sheet assetsand liabilities caused by assumed changes in interest rates. Finally, gap analysis—the difference betweenthe amount of balance sheet assets and liabilities re-pricing within a specified time period—is used as ameasurement of our interest-rate risk position.
To measure, monitor, and report on our interest-rate risk position, we use (1) NIR simulation, or‘‘NIR-at-risk,’’ which measures the impact on NIR over the next twelve months to immediate, or ‘‘rateshock,’’ and gradual, or ‘‘rate ramp,’’ changes in market interest rates; and (2) economic value ofequity, or ‘‘EVE,’’ which measures the impact on the present value of all NIR-related principal andinterest cash flows of an immediate change in interest rates. NIR-at-risk is designed to measure thepotential impact of changes in market interest rates on NIR in the short term. EVE, on the otherhand, is a long-term view of interest-rate risk, but with a view toward liquidation of State Street. Bothof these measures are subject to ALCO-established guidelines, and are monitored regularly, along withother relevant simulations, scenario analyses and stress tests by both Global Treasury and ALCO.
In calculating our NIR-at-risk, we start with a base amount of NIR that is projected over the nexttwelve months, assuming that the then-current yield curve remains unchanged over the period. Ourexisting balance sheet assets and liabilities are adjusted by the amount and timing of transactions thatare forecasted to occur over the next twelve months. That yield curve is then ‘‘shocked,’’ or movedimmediately, �100 basis points in a parallel fashion, or at all points along the yield curve. Two newtwelve-month NIR projections are then developed using the same balance sheet and forecastedtransactions, but with the new yield curves, and compared to the base scenario. We also perform thecalculations using interest rate ramps, which are �100 basis point changes in interest rates that areassumed to occur gradually over the next twelve-month period, rather than immediately as we do withinterest-rate shocks.
EVE is based on the change in the present value of all NIR-related principal and interest cashflows for changes in market rates of interest. The present value of existing cash flows with athen-current yield curve serves as the base case. We then apply an immediate parallel shock to thatyield curve of �200 basis points and recalculate the cash flows and related present values. A largeshock is used to better capture the embedded option risk in our mortgage-backed securities that resultsfrom the borrower’s prepayment opportunity.
Key assumptions used in the models described above include the timing of cash flows; the maturityand repricing of balance sheet assets and liabilities, especially option-embedded financial instrumentslike mortgage-backed securities; changes in market conditions; and interest-rate sensitivities of ourcustomer liabilities with respect to the interest rates paid and the level of balances. These assumptionsare inherently uncertain and, as a result, the models cannot precisely calculate future NIR or predictthe impact of changes in interest rates on NIR and economic value. Actual results could differ fromsimulated results due to the timing, magnitude and frequency of changes in interest rates and marketconditions, changes in spreads and management strategies, among other factors. Projections of potentialfuture streams of NIR are assessed as part of our forecasting process.
The following table presents the estimated exposure of NIR for the next twelve months, calculatedas of December 31, 2007 and 2006, due to an immediate � 100 basis point shift in then-currentinterest rates. Estimated incremental exposures presented below are dependent on management’sassumptions about asset and liability sensitivities under various interest-rate scenarios, such as thosepreviously discussed, and do not reflect any actions management may undertake in order to mitigatesome of the adverse effects of interest-rate changes on State Street’s financial performance.
66
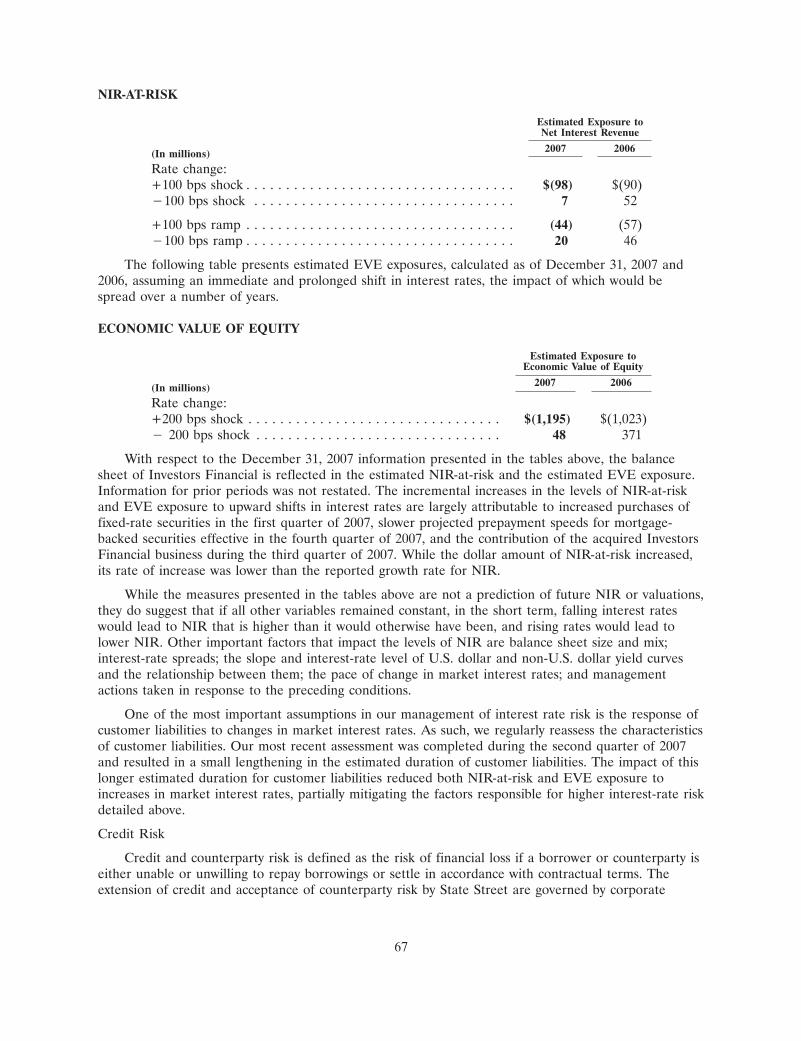
NIR-AT-RISK
Estimated Exposure toNet Interest Revenue
2007 2006(In millions)
Rate change:+100 bps shock . . . . . . . . . . . . . . . . . . . . . . . . . . . . . . . . . . $(98) $(90)�100 bps shock . . . . . . . . . . . . . . . . . . . . . . . . . . . . . . . . . 7 52
+100 bps ramp . . . . . . . . . . . . . . . . . . . . . . . . . . . . . . . . . . (44) (57)�100 bps ramp . . . . . . . . . . . . . . . . . . . . . . . . . . . . . . . . . . 20 46
The following table presents estimated EVE exposures, calculated as of December 31, 2007 and2006, assuming an immediate and prolonged shift in interest rates, the impact of which would bespread over a number of years.
ECONOMIC VALUE OF EQUITY
Estimated Exposure toEconomic Value of Equity
2007 2006(In millions)
Rate change:+200 bps shock . . . . . . . . . . . . . . . . . . . . . . . . . . . . . . . . $(1,195) $(1,023)� 200 bps shock . . . . . . . . . . . . . . . . . . . . . . . . . . . . . . . 48 371
With respect to the December 31, 2007 information presented in the tables above, the balancesheet of Investors Financial is reflected in the estimated NIR-at-risk and the estimated EVE exposure.Information for prior periods was not restated. The incremental increases in the levels of NIR-at-riskand EVE exposure to upward shifts in interest rates are largely attributable to increased purchases offixed-rate securities in the first quarter of 2007, slower projected prepayment speeds for mortgage-backed securities effective in the fourth quarter of 2007, and the contribution of the acquired InvestorsFinancial business during the third quarter of 2007. While the dollar amount of NIR-at-risk increased,its rate of increase was lower than the reported growth rate for NIR.
While the measures presented in the tables above are not a prediction of future NIR or valuations,they do suggest that if all other variables remained constant, in the short term, falling interest rateswould lead to NIR that is higher than it would otherwise have been, and rising rates would lead tolower NIR. Other important factors that impact the levels of NIR are balance sheet size and mix;interest-rate spreads; the slope and interest-rate level of U.S. dollar and non-U.S. dollar yield curvesand the relationship between them; the pace of change in market interest rates; and managementactions taken in response to the preceding conditions.
One of the most important assumptions in our management of interest rate risk is the response ofcustomer liabilities to changes in market interest rates. As such, we regularly reassess the characteristicsof customer liabilities. Our most recent assessment was completed during the second quarter of 2007and resulted in a small lengthening in the estimated duration of customer liabilities. The impact of thislonger estimated duration for customer liabilities reduced both NIR-at-risk and EVE exposure toincreases in market interest rates, partially mitigating the factors responsible for higher interest-rate riskdetailed above.
Credit Risk
Credit and counterparty risk is defined as the risk of financial loss if a borrower or counterparty iseither unable or unwilling to repay borrowings or settle in accordance with contractual terms. Theextension of credit and acceptance of counterparty risk by State Street are governed by corporate
67
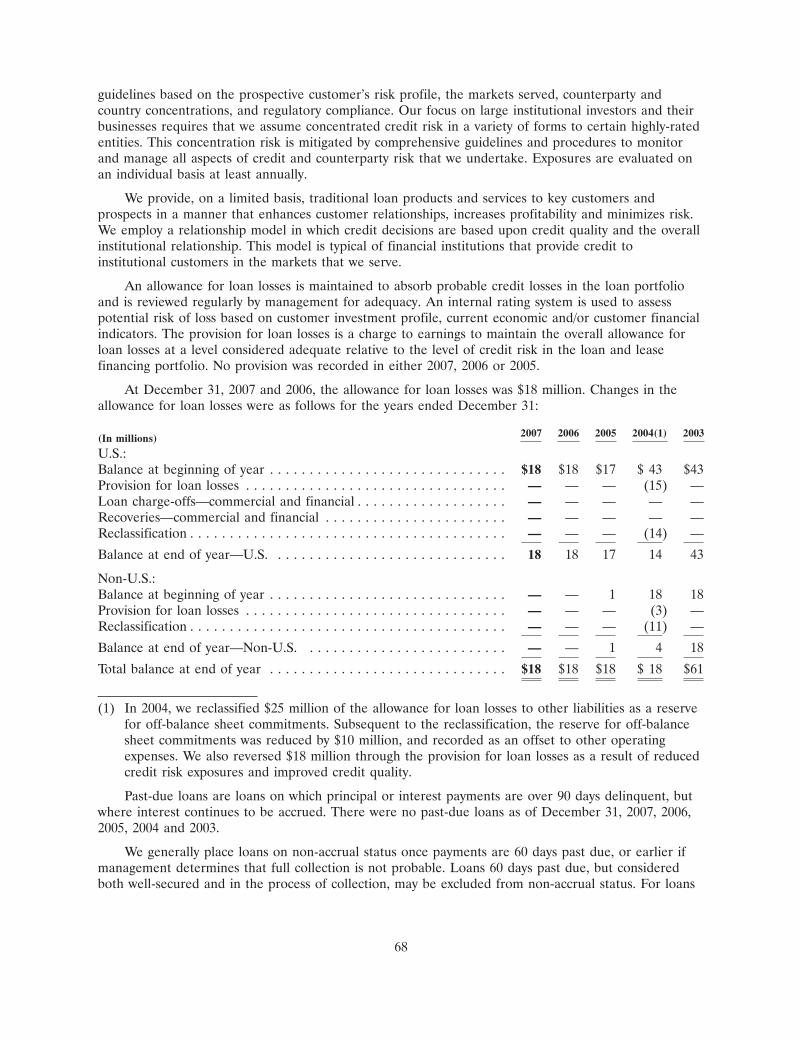
guidelines based on the prospective customer’s risk profile, the markets served, counterparty andcountry concentrations, and regulatory compliance. Our focus on large institutional investors and theirbusinesses requires that we assume concentrated credit risk in a variety of forms to certain highly-ratedentities. This concentration risk is mitigated by comprehensive guidelines and procedures to monitorand manage all aspects of credit and counterparty risk that we undertake. Exposures are evaluated onan individual basis at least annually.
We provide, on a limited basis, traditional loan products and services to key customers andprospects in a manner that enhances customer relationships, increases profitability and minimizes risk.We employ a relationship model in which credit decisions are based upon credit quality and the overallinstitutional relationship. This model is typical of financial institutions that provide credit toinstitutional customers in the markets that we serve.
An allowance for loan losses is maintained to absorb probable credit losses in the loan portfolioand is reviewed regularly by management for adequacy. An internal rating system is used to assesspotential risk of loss based on customer investment profile, current economic and/or customer financialindicators. The provision for loan losses is a charge to earnings to maintain the overall allowance forloan losses at a level considered adequate relative to the level of credit risk in the loan and leasefinancing portfolio. No provision was recorded in either 2007, 2006 or 2005.
At December 31, 2007 and 2006, the allowance for loan losses was $18 million. Changes in theallowance for loan losses were as follows for the years ended December 31:
2007 2006 2005 2004(1) 2003(In millions)
U.S.:Balance at beginning of year . . . . . . . . . . . . . . . . . . . . . . . . . . . . . . $18 $18 $17 $ 43 $43Provision for loan losses . . . . . . . . . . . . . . . . . . . . . . . . . . . . . . . . . — — — (15) —Loan charge-offs—commercial and financial . . . . . . . . . . . . . . . . . . . — — — — —Recoveries—commercial and financial . . . . . . . . . . . . . . . . . . . . . . . — — — — —Reclassification . . . . . . . . . . . . . . . . . . . . . . . . . . . . . . . . . . . . . . . . — — — (14) —
Balance at end of year—U.S. . . . . . . . . . . . . . . . . . . . . . . . . . . . . . 18 18 17 14 43
Non-U.S.:Balance at beginning of year . . . . . . . . . . . . . . . . . . . . . . . . . . . . . . — — 1 18 18Provision for loan losses . . . . . . . . . . . . . . . . . . . . . . . . . . . . . . . . . — — — (3) —Reclassification . . . . . . . . . . . . . . . . . . . . . . . . . . . . . . . . . . . . . . . . — — — (11) —
Balance at end of year—Non-U.S. . . . . . . . . . . . . . . . . . . . . . . . . . — — 1 4 18
Total balance at end of year . . . . . . . . . . . . . . . . . . . . . . . . . . . . . . $18 $18 $18 $ 18 $61
(1) In 2004, we reclassified $25 million of the allowance for loan losses to other liabilities as a reservefor off-balance sheet commitments. Subsequent to the reclassification, the reserve for off-balancesheet commitments was reduced by $10 million, and recorded as an offset to other operatingexpenses. We also reversed $18 million through the provision for loan losses as a result of reducedcredit risk exposures and improved credit quality.
Past-due loans are loans on which principal or interest payments are over 90 days delinquent, butwhere interest continues to be accrued. There were no past-due loans as of December 31, 2007, 2006,2005, 2004 and 2003.
We generally place loans on non-accrual status once payments are 60 days past due, or earlier ifmanagement determines that full collection is not probable. Loans 60 days past due, but consideredboth well-secured and in the process of collection, may be excluded from non-accrual status. For loans
68
placed on non-accrual status, revenue recognition is suspended. There were no non-accrual loans atyear-end 2007, 2006, 2005, 2004 and 2003.
We purchase securities under agreements to resell. Risk is minimized by establishing theacceptability of counterparties; limiting purchases almost exclusively to low-risk U.S. governmentsecurities; taking possession or control of transaction assets; monitoring levels of underlying collateral;and limiting the duration of the agreements. Securities are revalued daily to determine if additionalcollateral is necessary from the borrower. Most repurchase agreements are short-term, with maturitiesof less than 90 days.
We also provide customers with off-balance sheet liquidity and credit enhancement facilities in theform of letters of credit, lines of credit and liquidity asset purchase agreements. These exposures aresubject to an initial credit analysis, with detailed approval and review processes. These facilities are alsoactively monitored and reviewed on an annual basis. We maintain a separate reserve for probable creditlosses related to certain of these off-balance sheet activities. Management reviews the adequacy of thisreserve on a regular basis.
On behalf of our customers, we lend their securities to creditworthy banks, broker/dealers andother institutions. In most circumstances, we indemnify our customers for the fair market value of thosesecurities against a failure of the borrower to return such securities. Though these transactions arewell-collateralized, the substantial volume of these activities necessitates thorough credit-basedunderwriting and monitoring processes. State Street requires the borrowers to provide collateral in anamount equal to or in excess of 100% of the fair market value of the securities borrowed. Collateralfunds received in connection with our securities lending services are held by us as agent and are notrecorded in our consolidated statement of condition. The borrowed securities and collateral arerevalued daily to determine if additional collateral is necessary. State Street held, as agent, cash andsecurities totaling $572.93 billion and $527.37 billion as collateral for indemnified securities financing atDecember 31, 2007 and 2006, respectively.
Processes for credit approval and monitoring are in place for other credit extensions. As part ofthe approval and renewal process, appropriate due diligence is conducted based on the size and term ofthe exposure, as well as the quality of the counterparty. Exposures to these entities are aggregated andevaluated by ERM.
Investments in debt and equity securities, including investments in affiliates, are monitoredregularly by Corporate Finance and ERM. To the extent necessary, procedures are in place forevaluating potentially impaired securities, as discussed in notes 1 and 3 of the Notes to ConsolidatedFinancial Statements included in this Form 10-K under Item 8. Total non-performing investmentsecurities were $3 million and $4 million at December 31, 2007 and 2006, respectively.
Operational Risk
We define operational risk as the potential for loss resulting from inadequate or failed internalprocesses, people and systems, or from external events. As a leading provider of services to institutionalinvestors, our customers have a broad array of complex and specialized servicing, confidentiality andfiduciary requirements. Active management of operational risk is an integral component of all aspectsof our business, and responsibility for the management of operational risk lies with every individual atState Street. Our Operational Risk Policy Statement defines operational risk and details roles andresponsibilities for managing operational risk. The Policy Statement is reinforced by the OperationalRisk Guidelines, which codify our approach to operational risk. The Guidelines document our soundpractices and provide a mandate within which programs, processes, and regulatory elements areimplemented to ensure that operational risk is identified, measured, managed and controlled in aneffective and consistent manner across State Street.
69
We maintain an operational risk governance structure to ensure that responsibilities are clearlydefined and to provide independent oversight of operational risk management. Business unitsperiodically review the status of the business controls and monitor and report key risk indicator results.ERM oversees the overall operational risk management program. The MRC and the Operational RiskCommittee review key risk indicators and policies related to operational risk, provide oversight toensure compliance with the operational risk program, and escalate operational risk issues of note to theExecutive Committee of the Board. Corporate Audit performs independent reviews of the applicationof operational risk management practices and methodologies and reports to the Examining and AuditCommittee of the Board.
State Street’s internal control environment is designed to provide a sound operationalenvironment. Our discipline in managing operational risk provides the structure to identify, evaluate,control, monitor, measure, mitigate and report operational risk.
Business Risk
We define business risk as the risk of adverse changes in our earnings related to business factors,including changes in the competitive environment, changes in the operational economics of businessactivities and the potential effect of strategic and reputation risks, not already captured as market,interest-rate, credit or operational risks. We incorporate business risk into our assessment of oureconomic capital needs. Active management of business risk is an integral component of all aspects ofour business, and responsibility for the management of business risk lies with every individual at StateStreet.
It is sometimes difficult to separate the effects of a potential material adverse event intooperational and business risks. For instance, the direct financial impact of an unfavorable event in theform of fines or penalties would be classified as an operational risk loss, while the impact on ourreputation and the potential loss of customers and corresponding decline in revenue would be classifiedas a business risk loss. An additional example of business risk is the integration of a major acquisition.Failure to successfully integrate the operations of an acquired business, and the resultant inability toretain customers, would be classified as a business risk loss.
Business risk is managed with a long-term focus. Techniques include the careful development ofbusiness plans and appropriate management oversight. The potential impact of the various elements ofbusiness risk is difficult to quantify with any degree of precision. We use a combination of historicalearnings volatility, scenario analysis, stress-testing and management judgment to help assess thepotential effect on State Street attributable to business risk. Management and control of business risksare generally the responsibility of the business units as part of their overall and strategic planning andinternal risk management processes.
OFF-BALANCE SHEET ARRANGEMENTS
In the normal course of business, we hold assets under custody and assets under management in acustodial or fiduciary capacity for our customers, and, in accordance with GAAP, we do not recordthese assets in our consolidated statement of condition. Similarly, collateral funds associated with oursecurities finance activities are held by us as agent; therefore, we do not record these assets in ourconsolidated statement of condition. Additional information about these and other off-balance sheetactivities is in note 10 of the Notes to Consolidated Financial Statements included in this Form 10-Kunder Item 8.
In the normal course of business, we utilize derivative financial instruments to support ourcustomers’ needs, to conduct trading activities and to manage our interest-rate and foreign currencyrisk. Additional information about our use of derivatives is in note 15 of the Notes to ConsolidatedFinancial Statements included in this Form 10-K under Item 8.
70
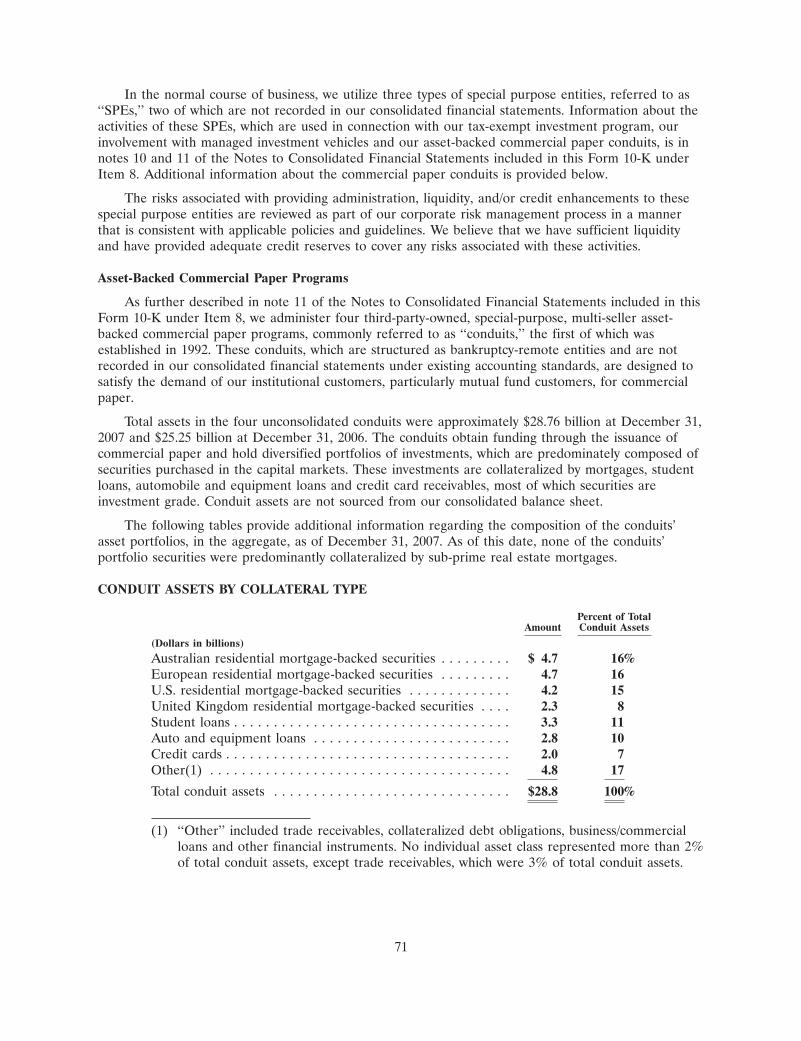
In the normal course of business, we utilize three types of special purpose entities, referred to as‘‘SPEs,’’ two of which are not recorded in our consolidated financial statements. Information about theactivities of these SPEs, which are used in connection with our tax-exempt investment program, ourinvolvement with managed investment vehicles and our asset-backed commercial paper conduits, is innotes 10 and 11 of the Notes to Consolidated Financial Statements included in this Form 10-K underItem 8. Additional information about the commercial paper conduits is provided below.
The risks associated with providing administration, liquidity, and/or credit enhancements to thesespecial purpose entities are reviewed as part of our corporate risk management process in a mannerthat is consistent with applicable policies and guidelines. We believe that we have sufficient liquidityand have provided adequate credit reserves to cover any risks associated with these activities.
Asset-Backed Commercial Paper Programs
As further described in note 11 of the Notes to Consolidated Financial Statements included in thisForm 10-K under Item 8, we administer four third-party-owned, special-purpose, multi-seller asset-backed commercial paper programs, commonly referred to as ‘‘conduits,’’ the first of which wasestablished in 1992. These conduits, which are structured as bankruptcy-remote entities and are notrecorded in our consolidated financial statements under existing accounting standards, are designed tosatisfy the demand of our institutional customers, particularly mutual fund customers, for commercialpaper.
Total assets in the four unconsolidated conduits were approximately $28.76 billion at December 31,2007 and $25.25 billion at December 31, 2006. The conduits obtain funding through the issuance ofcommercial paper and hold diversified portfolios of investments, which are predominately composed ofsecurities purchased in the capital markets. These investments are collateralized by mortgages, studentloans, automobile and equipment loans and credit card receivables, most of which securities areinvestment grade. Conduit assets are not sourced from our consolidated balance sheet.
The following tables provide additional information regarding the composition of the conduits’asset portfolios, in the aggregate, as of December 31, 2007. As of this date, none of the conduits’portfolio securities were predominantly collateralized by sub-prime real estate mortgages.
CONDUIT ASSETS BY COLLATERAL TYPE
Percent of TotalAmount Conduit Assets
(Dollars in billions)
Australian residential mortgage-backed securities . . . . . . . . . $ 4.7 16%European residential mortgage-backed securities . . . . . . . . . 4.7 16U.S. residential mortgage-backed securities . . . . . . . . . . . . . 4.2 15United Kingdom residential mortgage-backed securities . . . . 2.3 8Student loans . . . . . . . . . . . . . . . . . . . . . . . . . . . . . . . . . . . 3.3 11Auto and equipment loans . . . . . . . . . . . . . . . . . . . . . . . . . 2.8 10Credit cards . . . . . . . . . . . . . . . . . . . . . . . . . . . . . . . . . . . . 2.0 7Other(1) . . . . . . . . . . . . . . . . . . . . . . . . . . . . . . . . . . . . . . 4.8 17
Total conduit assets . . . . . . . . . . . . . . . . . . . . . . . . . . . . . . $28.8 100%
(1) ‘‘Other’’ included trade receivables, collateralized debt obligations, business/commercialloans and other financial instruments. No individual asset class represented more than 2%of total conduit assets, except trade receivables, which were 3% of total conduit assets.
71
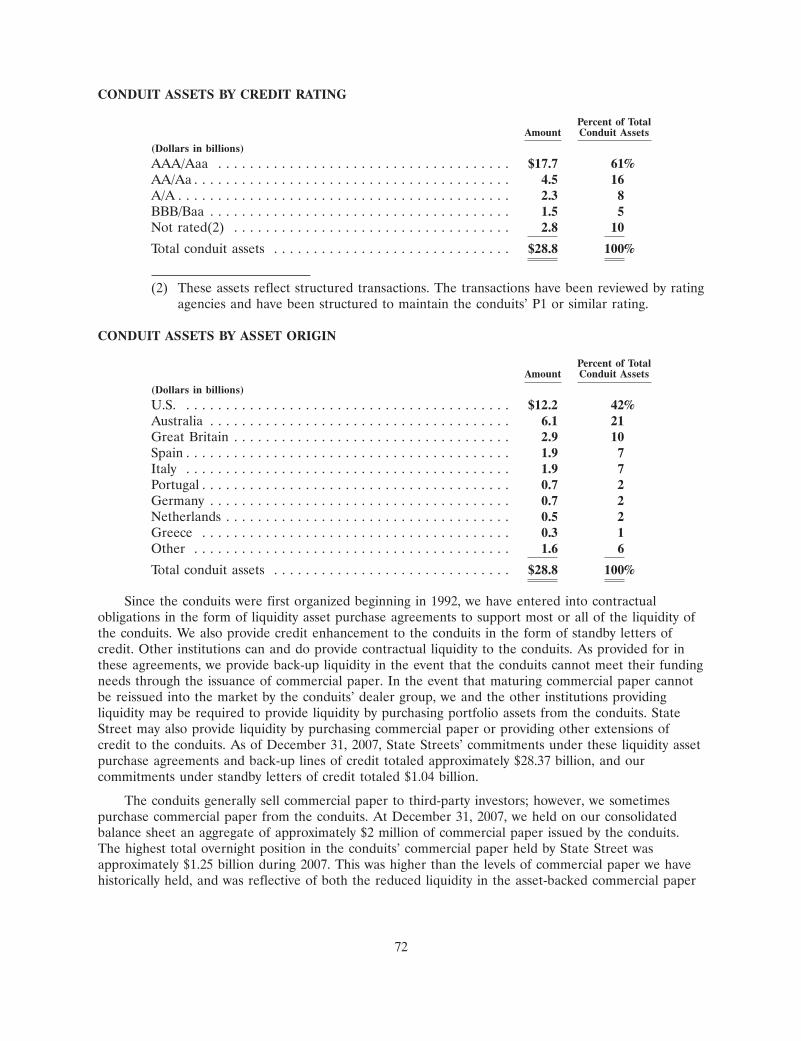
CONDUIT ASSETS BY CREDIT RATING
Percent of TotalAmount Conduit Assets
(Dollars in billions)
AAA/Aaa . . . . . . . . . . . . . . . . . . . . . . . . . . . . . . . . . . . . . $17.7 61%AA/Aa . . . . . . . . . . . . . . . . . . . . . . . . . . . . . . . . . . . . . . . . 4.5 16A/A . . . . . . . . . . . . . . . . . . . . . . . . . . . . . . . . . . . . . . . . . . 2.3 8BBB/Baa . . . . . . . . . . . . . . . . . . . . . . . . . . . . . . . . . . . . . . 1.5 5Not rated(2) . . . . . . . . . . . . . . . . . . . . . . . . . . . . . . . . . . . 2.8 10
Total conduit assets . . . . . . . . . . . . . . . . . . . . . . . . . . . . . . $28.8 100%
(2) These assets reflect structured transactions. The transactions have been reviewed by ratingagencies and have been structured to maintain the conduits’ P1 or similar rating.
CONDUIT ASSETS BY ASSET ORIGIN
Percent of TotalAmount Conduit Assets
(Dollars in billions)
U.S. . . . . . . . . . . . . . . . . . . . . . . . . . . . . . . . . . . . . . . . . . $12.2 42%Australia . . . . . . . . . . . . . . . . . . . . . . . . . . . . . . . . . . . . . . 6.1 21Great Britain . . . . . . . . . . . . . . . . . . . . . . . . . . . . . . . . . . . 2.9 10Spain . . . . . . . . . . . . . . . . . . . . . . . . . . . . . . . . . . . . . . . . . 1.9 7Italy . . . . . . . . . . . . . . . . . . . . . . . . . . . . . . . . . . . . . . . . . 1.9 7Portugal . . . . . . . . . . . . . . . . . . . . . . . . . . . . . . . . . . . . . . . 0.7 2Germany . . . . . . . . . . . . . . . . . . . . . . . . . . . . . . . . . . . . . . 0.7 2Netherlands . . . . . . . . . . . . . . . . . . . . . . . . . . . . . . . . . . . . 0.5 2Greece . . . . . . . . . . . . . . . . . . . . . . . . . . . . . . . . . . . . . . . 0.3 1Other . . . . . . . . . . . . . . . . . . . . . . . . . . . . . . . . . . . . . . . . 1.6 6
Total conduit assets . . . . . . . . . . . . . . . . . . . . . . . . . . . . . . $28.8 100%
Since the conduits were first organized beginning in 1992, we have entered into contractualobligations in the form of liquidity asset purchase agreements to support most or all of the liquidity ofthe conduits. We also provide credit enhancement to the conduits in the form of standby letters ofcredit. Other institutions can and do provide contractual liquidity to the conduits. As provided for inthese agreements, we provide back-up liquidity in the event that the conduits cannot meet their fundingneeds through the issuance of commercial paper. In the event that maturing commercial paper cannotbe reissued into the market by the conduits’ dealer group, we and the other institutions providingliquidity may be required to provide liquidity by purchasing portfolio assets from the conduits. StateStreet may also provide liquidity by purchasing commercial paper or providing other extensions ofcredit to the conduits. As of December 31, 2007, State Streets’ commitments under these liquidity assetpurchase agreements and back-up lines of credit totaled approximately $28.37 billion, and ourcommitments under standby letters of credit totaled $1.04 billion.
The conduits generally sell commercial paper to third-party investors; however, we sometimespurchase commercial paper from the conduits. At December 31, 2007, we held on our consolidatedbalance sheet an aggregate of approximately $2 million of commercial paper issued by the conduits.The highest total overnight position in the conduits’ commercial paper held by State Street wasapproximately $1.25 billion during 2007. This was higher than the levels of commercial paper we havehistorically held, and was reflective of both the reduced liquidity in the asset-backed commercial paper
72
markets during the third and fourth quarters and our desire to provide short-term stability to fundingcosts given the lack of liquidity in the marketplace. There were no draw-downs on the liquidity assetpurchase agreements or standby letters of credit during 2007.
As the third quarter of 2007 progressed and investors became increasingly concerned about thecredit quality of the underlying assets generally held in asset-backed commercial paper conduits andsimilar vehicles, the resulting reduction in liquidity in the global fixed-income securities markets madethe funding of the State Street-administered conduits more challenging than in normal marketconditions, and the yields that issuers had to pay on asset-backed commercial paper increased.Consistent with the experience of other market participants, commercial paper was generally beingplaced by the State Street-administered conduits with shorter maturities and higher investor yields thanhistorically experienced. This compressed the spread between the rate earned on the conduits’ assetsand the conduits’ funding costs. The weighted-average maturity of the conduits’ commercial paper wasapproximately 20 days as of December 31, 2007, compared to approximately 23 days as ofDecember 31, 2006. However, the conduits continue to roll over the commercial paper as it matures,i.e., place the commercial paper with market participants, including State Street.
We intend to continue to manage the liquidity of the programs, if and as needed, throughpurchases of commercial paper as necessary; however, if due to further deterioration in the liquidity ofthe fixed-income markets or otherwise, it would become necessary to purchase assets from the conduits,we anticipate that we could fund those purchases.
During 2007, we did not experience any losses in our role as a liquidity and credit enhancementprovider to the conduits, although the margins that we generated from administration of the conduitswere lower than the levels historically achieved on commercial paper issued by the conduits. The feerevenue we generated from our involvement with the conduits was approximately $66 million for 2007,$62 million for 2006 and $58 million for 2005. We earn fees from our role as administrator, liquidity orcredit enhancement provider and as one of the dealers, which fees are priced on a market basis. Thesefees are recorded in processing fees and other revenue in our consolidated statement of income. Ouroverall conduit business activities generated pre-tax income, which included the fee revenue describedabove, of approximately $23 million for 2007, compared to pre-tax income of $49 million for 2006 and$45 million for 2005. The decrease in this income from 2006 to 2007 primarily resulted from thechange in fair value of basis swaps, as well as other conduit operating expenses.
As described above, we provide the conduits with contractual liquidity in the form of liquidity assetpurchase agreements. If a conduit experienced a problem with an asset, such as a default or creditrating downgrade, subject to certain conditions, the liquidity asset purchase agreement could beinvoked by the conduit, requiring State Street to purchase the asset from the conduit at prices whichmay exceed the fair value of the assets. If that occurred, we would be required to recognize a loss uponpurchase of the asset. Any loss from a credit default would first be offset by the level of fundingprovided by the first-loss note holders. Currently, in light of the recent reduction in liquidity in themarkets, with spreads on virtually all asset classes except U.S. treasuries having widened, we expect thatan asset purchase would result in a loss. This loss may be recovered in future periods, depending onState Street’s actions after the asset is purchased and market conditions.
It is also possible that we would be required to consolidate one or more of the conduits’ assets andliabilities onto our consolidated balance sheet. This consolidation would occur if we were determined tobe the primary beneficiary of the conduits as defined in FIN 46(R). For example, if we updated ourexpected loss model assumptions as a result of changes in market conditions or a downgrade ofsecurities, we may be required to increase the amount of first-loss notes in order for the investors inthe first-loss notes to continue to be considered the primary beneficiaries of the conduits. If theconduits are not able to issue additional first-loss notes or take other actions, we may be determined tobe the primary beneficiary of the conduits, and would be required to consolidate the conduits’ assets
73
and liabilities onto our consolidated balance sheet. Additional information about our use of anexpected loss model and the third-party investors in first-loss notes is provided in the ‘‘SignificantAccounting Estimates—Special Purpose Entities’’ section of this Management’s Discussion and Analysisand in note 11 of the Notes to Consolidated Financial Statements included in this Form 10-K underItem 8. Our accounting treatment of the conduits is reviewed at least quarterly, and more frequently ifspecific events warrant.
As a result of the events in the global fixed-income securities markets, we reviewed the underlyingassumptions incorporated in our FIN 46(R) expected loss model. We concluded as of December 31,2007, that our model assumptions were appropriate and were reflective of market participantassumptions, and appropriately considered the probability of, and potential for, the recurrence of theseevents.
If consolidation were to occur because we were determined to be the primary beneficiary of theconduits as defined in FIN 46(R), we would consolidate the conduits’ assets and liabilities onto ourconsolidated balance sheet at fair value. We expect that we would recognize an extraordinary loss onthe date of consolidation if the fair value of the conduits’ liabilities exceeded the fair value of theconduits’ assets, as they do currently. This loss would be recovered back into income over theremaining lives of the assets, assuming that the assets were held to maturity and that we recovered thefull principal amount of the securities.
Purchasing or consolidating all or a significant portion of the assets of the conduits would affectthe size and composition of our consolidated balance sheet and alter our financial and regulatorycapital ratios, and may affect our earnings. In light of our continued ability to manage the liquidity ofthe commercial paper, we do not currently anticipate that this action will become necessary. However,for illustrative purposes only, assuming estimated fair values of the conduits’ assets as of December 31,2007, if all of the conduits’ assets were purchased under the liquidity asset purchase agreements, or ifthe conduits’ assets and liabilities were consolidated onto our consolidated balance sheet, we estimatethat we would recognize an after-tax loss of approximately $530 million in our consolidated statementof income.
This estimate assumes that all of the conduits, with total assets of approximately $28.76 billion asof December 31, 2007, are consolidated on that date; that the assets of the conduits are recorded atfair value, which is based on State Street’s consistent application of its pricing policies for conduitassets; and that the pre-tax loss is tax-effected at a 40% marginal income tax rate. If this consolidationwere to occur in the future, or we were required to purchase assets pursuant to the liquidity assetpurchase agreements at prices in excess of the fair value of the assets, the ultimate amount of loss willbe based upon market conditions at the date such a determination is made, which could differ from theestimate provided above. If the assets were consolidated for accounting purposes pursuant toFIN 46(R), we expect that this loss would be recorded as an extraordinary loss, after income fromcontinuing operations. If we were to purchase the assets under the liquidity asset purchase agreements,to the extent that a loss was incurred, we expect that the loss would be recognized in continuingoperations.
We consider the activities of the conduits in our liquidity management process, as more fullydescribed in the ‘‘Liquidity’’ section of this Management’s Discussion and Analysis. We would be ableto access multiple sources of liquidity to fund required asset purchases, including sales of other assets,asset repurchase agreements, the issuance of corporate commercial paper, the issuance of bankcertificates of deposit and time deposits, and accessing the Federal Reserve discount window or similarfacilities in other jurisdictions in which we maintain significant banking operations. The consolidation ofthe conduits for accounting purposes alone would not require additional funding or liquidity for theconduits to fund their asset portfolios. However, if the reasons for consolidation related to an inabilityof the conduits to issue commercial paper, the conduits would require additional liquidity.
74
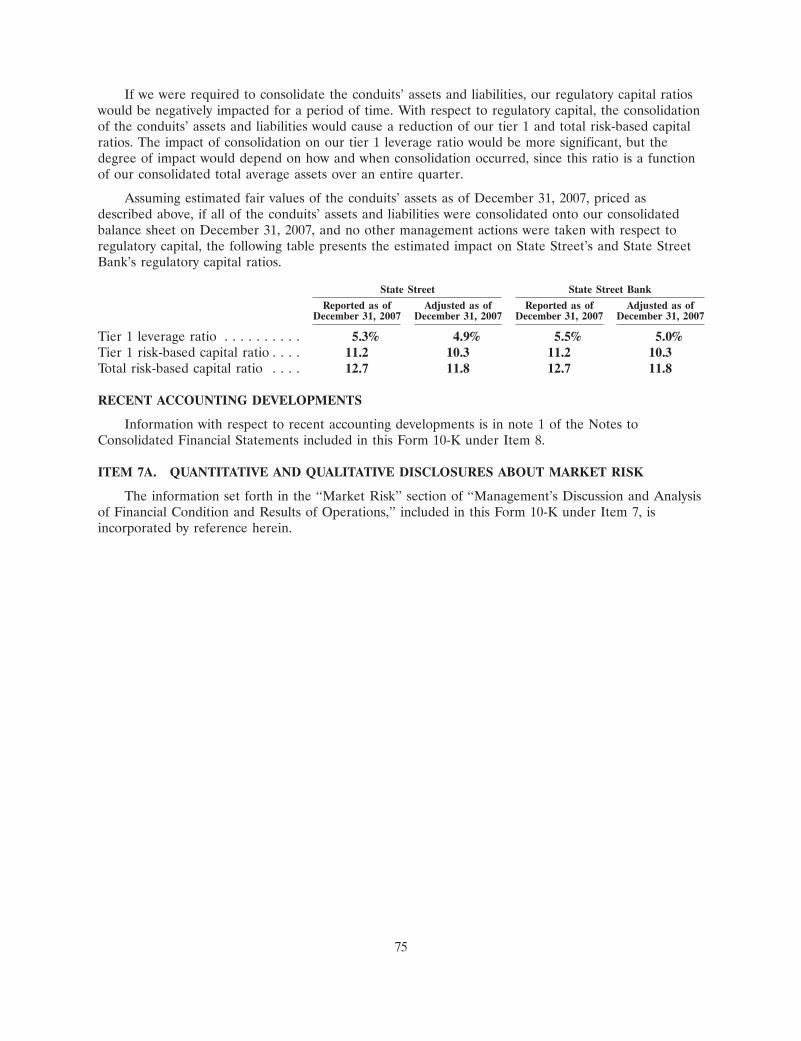
If we were required to consolidate the conduits’ assets and liabilities, our regulatory capital ratioswould be negatively impacted for a period of time. With respect to regulatory capital, the consolidationof the conduits’ assets and liabilities would cause a reduction of our tier 1 and total risk-based capitalratios. The impact of consolidation on our tier 1 leverage ratio would be more significant, but thedegree of impact would depend on how and when consolidation occurred, since this ratio is a functionof our consolidated total average assets over an entire quarter.
Assuming estimated fair values of the conduits’ assets as of December 31, 2007, priced asdescribed above, if all of the conduits’ assets and liabilities were consolidated onto our consolidatedbalance sheet on December 31, 2007, and no other management actions were taken with respect toregulatory capital, the following table presents the estimated impact on State Street’s and State StreetBank’s regulatory capital ratios.
State Street State Street Bank
Reported as of Adjusted as of Reported as of Adjusted as ofDecember 31, 2007 December 31, 2007 December 31, 2007 December 31, 2007
Tier 1 leverage ratio . . . . . . . . . . 5.3% 4.9% 5.5% 5.0%Tier 1 risk-based capital ratio . . . . 11.2 10.3 11.2 10.3Total risk-based capital ratio . . . . 12.7 11.8 12.7 11.8
RECENT ACCOUNTING DEVELOPMENTS
Information with respect to recent accounting developments is in note 1 of the Notes toConsolidated Financial Statements included in this Form 10-K under Item 8.
ITEM 7A. QUANTITATIVE AND QUALITATIVE DISCLOSURES ABOUT MARKET RISK
The information set forth in the ‘‘Market Risk’’ section of ‘‘Management’s Discussion and Analysisof Financial Condition and Results of Operations,’’ included in this Form 10-K under Item 7, isincorporated by reference herein.
75
29JAN200801230360
ITEM 8. FINANCIAL STATEMENTS AND SUPPLEMENTARY DATA
Additional information about restrictions on the transfer of funds from State Street Bank to theparent company is included in this Form 10-K under Item 5, and in the ‘‘Financial Condition —Capital’’ section of Management’s Discussion and Analysis of Financial Condition and Results ofOperations under Item 7.
REPORT OF INDEPENDENT REGISTERED PUBLIC ACCOUNTING FIRM
THE SHAREHOLDERS AND BOARD OF DIRECTORS OFSTATE STREET CORPORATION
We have audited the accompanying consolidated statement of condition of State StreetCorporation as of December 31, 2007 and 2006, and the related consolidated statements of income,changes in shareholders’ equity, and cash flows for each of the three years in the period endedDecember 31, 2007. These financial statements are the responsibility of the Corporation’s management.Our responsibility is to express an opinion on these financial statements based on our audits.
We conducted our audits in accordance with the standards of the Public Company AccountingOversight Board (United States). Those standards require that we plan and perform the audit to obtainreasonable assurance about whether the financial statements are free of material misstatement. Anaudit includes examining, on a test basis, evidence supporting the amounts and disclosures in thefinancial statements. An audit also includes assessing the accounting principles used and significantestimates made by management, as well as evaluating the overall financial statement presentation. Webelieve that our audits provide a reasonable basis for our opinion.
In our opinion, the financial statements referred to above present fairly, in all material respects,the consolidated financial position of State Street Corporation at December 31, 2007 and 2006, and theconsolidated results of its operations and its cash flows for each of the three years in the period endedDecember 31, 2007, in conformity with U.S. generally accepted accounting principles.
We also have audited, in accordance with the standards of the Public Company AccountingOversight Board (United States), the effectiveness of State Street Corporation’s internal control overfinancial reporting as of December 31, 2007, based on criteria established in Internal Control—Integrated Framework issued by the Committee of Sponsoring Organizations of the TreadwayCommission and our report dated February 14, 2008 expressed an unqualified opinion thereon.
As discussed in note 1 to the consolidated financial statements, in 2007 the Corporation hasadopted Financial Accounting Standards Board Staff Position FAS 13-2, ‘‘Accounting for a Change orProjected Change in the Timing of Cash Flows Relating to Income Taxes Generated by a LeveragedLease Transaction’’ and Financial Accounting Standards Board Interpretation No. 48, ‘‘Accounting forUncertainty in Income Taxes.’’
Boston, Massachusetts
February 14, 2008
76
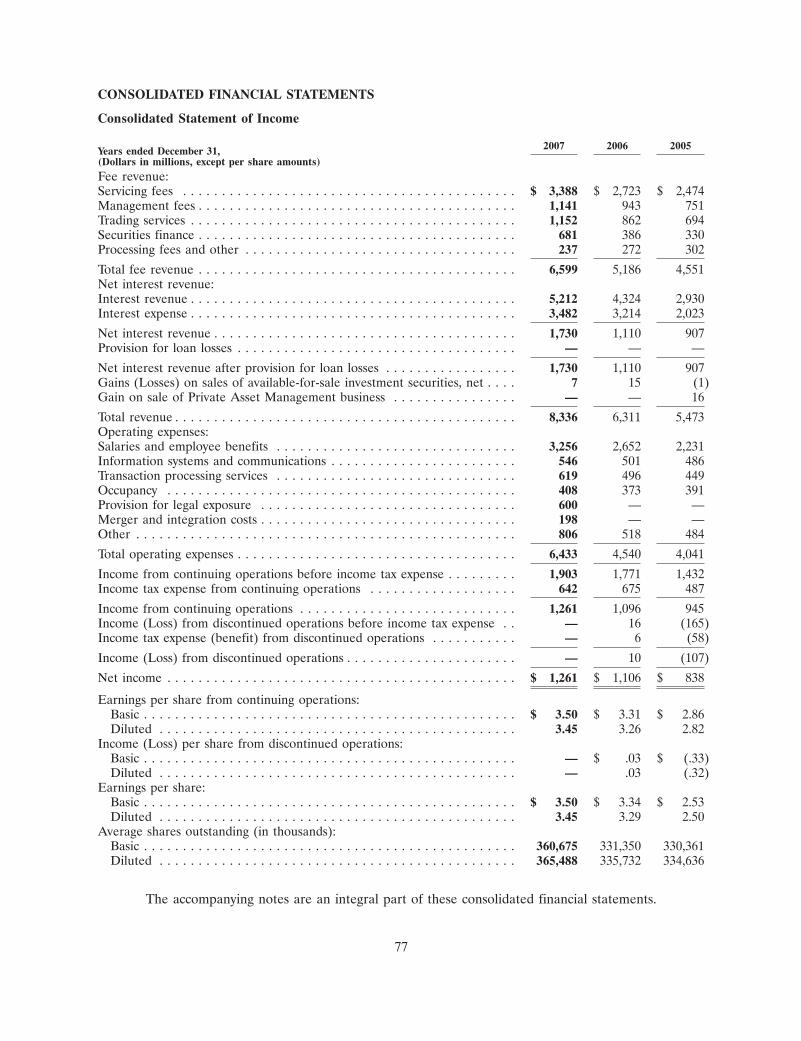
CONSOLIDATED FINANCIAL STATEMENTS
Consolidated Statement of Income
2007 2006 2005Years ended December 31,(Dollars in millions, except per share amounts)Fee revenue:Servicing fees . . . . . . . . . . . . . . . . . . . . . . . . . . . . . . . . . . . . . . . . . . . $ 3,388 $ 2,723 $ 2,474Management fees . . . . . . . . . . . . . . . . . . . . . . . . . . . . . . . . . . . . . . . . . 1,141 943 751Trading services . . . . . . . . . . . . . . . . . . . . . . . . . . . . . . . . . . . . . . . . . . 1,152 862 694Securities finance . . . . . . . . . . . . . . . . . . . . . . . . . . . . . . . . . . . . . . . . . 681 386 330Processing fees and other . . . . . . . . . . . . . . . . . . . . . . . . . . . . . . . . . . . 237 272 302
Total fee revenue . . . . . . . . . . . . . . . . . . . . . . . . . . . . . . . . . . . . . . . . . 6,599 5,186 4,551Net interest revenue:Interest revenue . . . . . . . . . . . . . . . . . . . . . . . . . . . . . . . . . . . . . . . . . . 5,212 4,324 2,930Interest expense . . . . . . . . . . . . . . . . . . . . . . . . . . . . . . . . . . . . . . . . . . 3,482 3,214 2,023
Net interest revenue . . . . . . . . . . . . . . . . . . . . . . . . . . . . . . . . . . . . . . . 1,730 1,110 907Provision for loan losses . . . . . . . . . . . . . . . . . . . . . . . . . . . . . . . . . . . . — — —
Net interest revenue after provision for loan losses . . . . . . . . . . . . . . . . . 1,730 1,110 907Gains (Losses) on sales of available-for-sale investment securities, net . . . . 7 15 (1)Gain on sale of Private Asset Management business . . . . . . . . . . . . . . . . — — 16
Total revenue . . . . . . . . . . . . . . . . . . . . . . . . . . . . . . . . . . . . . . . . . . . . 8,336 6,311 5,473Operating expenses:Salaries and employee benefits . . . . . . . . . . . . . . . . . . . . . . . . . . . . . . . 3,256 2,652 2,231Information systems and communications . . . . . . . . . . . . . . . . . . . . . . . . 546 501 486Transaction processing services . . . . . . . . . . . . . . . . . . . . . . . . . . . . . . . 619 496 449Occupancy . . . . . . . . . . . . . . . . . . . . . . . . . . . . . . . . . . . . . . . . . . . . . 408 373 391Provision for legal exposure . . . . . . . . . . . . . . . . . . . . . . . . . . . . . . . . . 600 — —Merger and integration costs . . . . . . . . . . . . . . . . . . . . . . . . . . . . . . . . . 198 — —Other . . . . . . . . . . . . . . . . . . . . . . . . . . . . . . . . . . . . . . . . . . . . . . . . . 806 518 484
Total operating expenses . . . . . . . . . . . . . . . . . . . . . . . . . . . . . . . . . . . . 6,433 4,540 4,041
Income from continuing operations before income tax expense . . . . . . . . . 1,903 1,771 1,432Income tax expense from continuing operations . . . . . . . . . . . . . . . . . . . 642 675 487
Income from continuing operations . . . . . . . . . . . . . . . . . . . . . . . . . . . . 1,261 1,096 945Income (Loss) from discontinued operations before income tax expense . . — 16 (165)Income tax expense (benefit) from discontinued operations . . . . . . . . . . . — 6 (58)
Income (Loss) from discontinued operations . . . . . . . . . . . . . . . . . . . . . . — 10 (107)
Net income . . . . . . . . . . . . . . . . . . . . . . . . . . . . . . . . . . . . . . . . . . . . . $ 1,261 $ 1,106 $ 838
Earnings per share from continuing operations:Basic . . . . . . . . . . . . . . . . . . . . . . . . . . . . . . . . . . . . . . . . . . . . . . . . $ 3.50 $ 3.31 $ 2.86Diluted . . . . . . . . . . . . . . . . . . . . . . . . . . . . . . . . . . . . . . . . . . . . . . 3.45 3.26 2.82
Income (Loss) per share from discontinued operations:Basic . . . . . . . . . . . . . . . . . . . . . . . . . . . . . . . . . . . . . . . . . . . . . . . . — $ .03 $ (.33)Diluted . . . . . . . . . . . . . . . . . . . . . . . . . . . . . . . . . . . . . . . . . . . . . . — .03 (.32)
Earnings per share:Basic . . . . . . . . . . . . . . . . . . . . . . . . . . . . . . . . . . . . . . . . . . . . . . . . $ 3.50 $ 3.34 $ 2.53Diluted . . . . . . . . . . . . . . . . . . . . . . . . . . . . . . . . . . . . . . . . . . . . . . 3.45 3.29 2.50
Average shares outstanding (in thousands):Basic . . . . . . . . . . . . . . . . . . . . . . . . . . . . . . . . . . . . . . . . . . . . . . . . 360,675 331,350 330,361Diluted . . . . . . . . . . . . . . . . . . . . . . . . . . . . . . . . . . . . . . . . . . . . . . 365,488 335,732 334,636
The accompanying notes are an integral part of these consolidated financial statements.
77
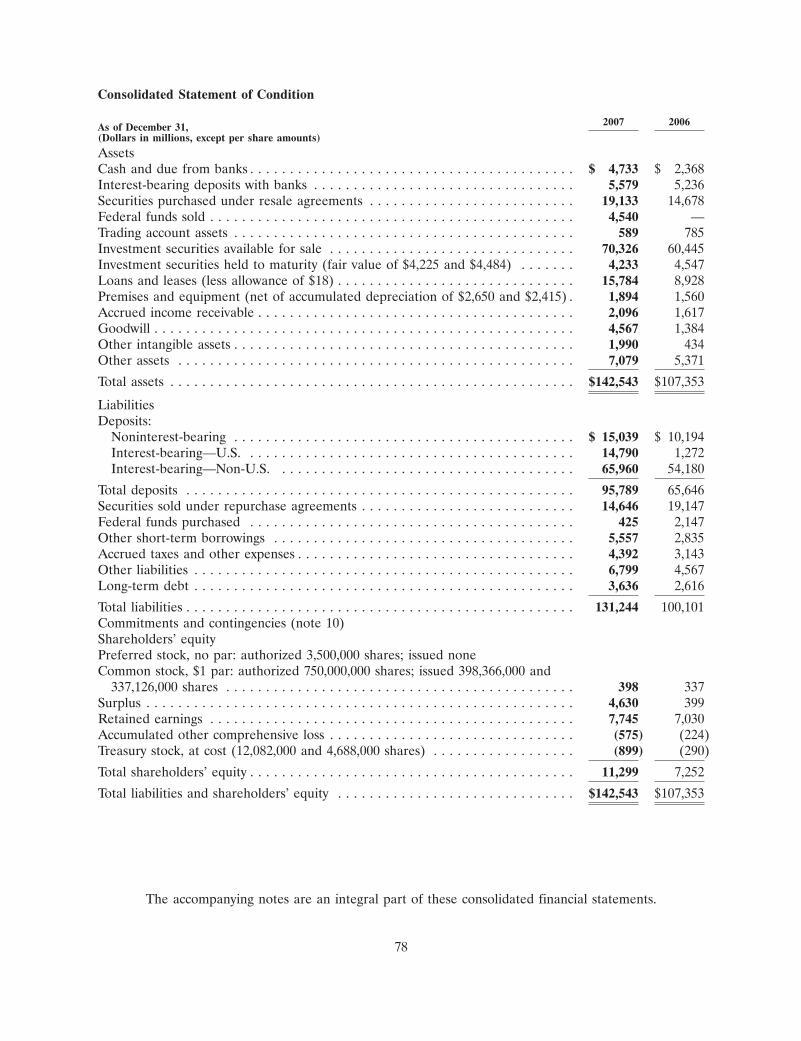
Consolidated Statement of Condition
2007 2006As of December 31,(Dollars in millions, except per share amounts)
AssetsCash and due from banks . . . . . . . . . . . . . . . . . . . . . . . . . . . . . . . . . . . . . . . . . $ 4,733 $ 2,368Interest-bearing deposits with banks . . . . . . . . . . . . . . . . . . . . . . . . . . . . . . . . . 5,579 5,236Securities purchased under resale agreements . . . . . . . . . . . . . . . . . . . . . . . . . . 19,133 14,678Federal funds sold . . . . . . . . . . . . . . . . . . . . . . . . . . . . . . . . . . . . . . . . . . . . . . 4,540 —Trading account assets . . . . . . . . . . . . . . . . . . . . . . . . . . . . . . . . . . . . . . . . . . . 589 785Investment securities available for sale . . . . . . . . . . . . . . . . . . . . . . . . . . . . . . . 70,326 60,445Investment securities held to maturity (fair value of $4,225 and $4,484) . . . . . . . 4,233 4,547Loans and leases (less allowance of $18) . . . . . . . . . . . . . . . . . . . . . . . . . . . . . . 15,784 8,928Premises and equipment (net of accumulated depreciation of $2,650 and $2,415) . 1,894 1,560Accrued income receivable . . . . . . . . . . . . . . . . . . . . . . . . . . . . . . . . . . . . . . . . 2,096 1,617Goodwill . . . . . . . . . . . . . . . . . . . . . . . . . . . . . . . . . . . . . . . . . . . . . . . . . . . . . 4,567 1,384Other intangible assets . . . . . . . . . . . . . . . . . . . . . . . . . . . . . . . . . . . . . . . . . . . 1,990 434Other assets . . . . . . . . . . . . . . . . . . . . . . . . . . . . . . . . . . . . . . . . . . . . . . . . . . 7,079 5,371
Total assets . . . . . . . . . . . . . . . . . . . . . . . . . . . . . . . . . . . . . . . . . . . . . . . . . . . $142,543 $107,353
LiabilitiesDeposits:
Noninterest-bearing . . . . . . . . . . . . . . . . . . . . . . . . . . . . . . . . . . . . . . . . . . . $ 15,039 $ 10,194Interest-bearing—U.S. . . . . . . . . . . . . . . . . . . . . . . . . . . . . . . . . . . . . . . . . . 14,790 1,272Interest-bearing—Non-U.S. . . . . . . . . . . . . . . . . . . . . . . . . . . . . . . . . . . . . . 65,960 54,180
Total deposits . . . . . . . . . . . . . . . . . . . . . . . . . . . . . . . . . . . . . . . . . . . . . . . . . 95,789 65,646Securities sold under repurchase agreements . . . . . . . . . . . . . . . . . . . . . . . . . . . 14,646 19,147Federal funds purchased . . . . . . . . . . . . . . . . . . . . . . . . . . . . . . . . . . . . . . . . . 425 2,147Other short-term borrowings . . . . . . . . . . . . . . . . . . . . . . . . . . . . . . . . . . . . . . 5,557 2,835Accrued taxes and other expenses . . . . . . . . . . . . . . . . . . . . . . . . . . . . . . . . . . . 4,392 3,143Other liabilities . . . . . . . . . . . . . . . . . . . . . . . . . . . . . . . . . . . . . . . . . . . . . . . . 6,799 4,567Long-term debt . . . . . . . . . . . . . . . . . . . . . . . . . . . . . . . . . . . . . . . . . . . . . . . . 3,636 2,616
Total liabilities . . . . . . . . . . . . . . . . . . . . . . . . . . . . . . . . . . . . . . . . . . . . . . . . . 131,244 100,101Commitments and contingencies (note 10)Shareholders’ equityPreferred stock, no par: authorized 3,500,000 shares; issued noneCommon stock, $1 par: authorized 750,000,000 shares; issued 398,366,000 and
337,126,000 shares . . . . . . . . . . . . . . . . . . . . . . . . . . . . . . . . . . . . . . . . . . . . 398 337Surplus . . . . . . . . . . . . . . . . . . . . . . . . . . . . . . . . . . . . . . . . . . . . . . . . . . . . . . 4,630 399Retained earnings . . . . . . . . . . . . . . . . . . . . . . . . . . . . . . . . . . . . . . . . . . . . . . 7,745 7,030Accumulated other comprehensive loss . . . . . . . . . . . . . . . . . . . . . . . . . . . . . . . (575) (224)Treasury stock, at cost (12,082,000 and 4,688,000 shares) . . . . . . . . . . . . . . . . . . (899) (290)
Total shareholders’ equity . . . . . . . . . . . . . . . . . . . . . . . . . . . . . . . . . . . . . . . . . 11,299 7,252
Total liabilities and shareholders’ equity . . . . . . . . . . . . . . . . . . . . . . . . . . . . . . $142,543 $107,353
The accompanying notes are an integral part of these consolidated financial statements.
78
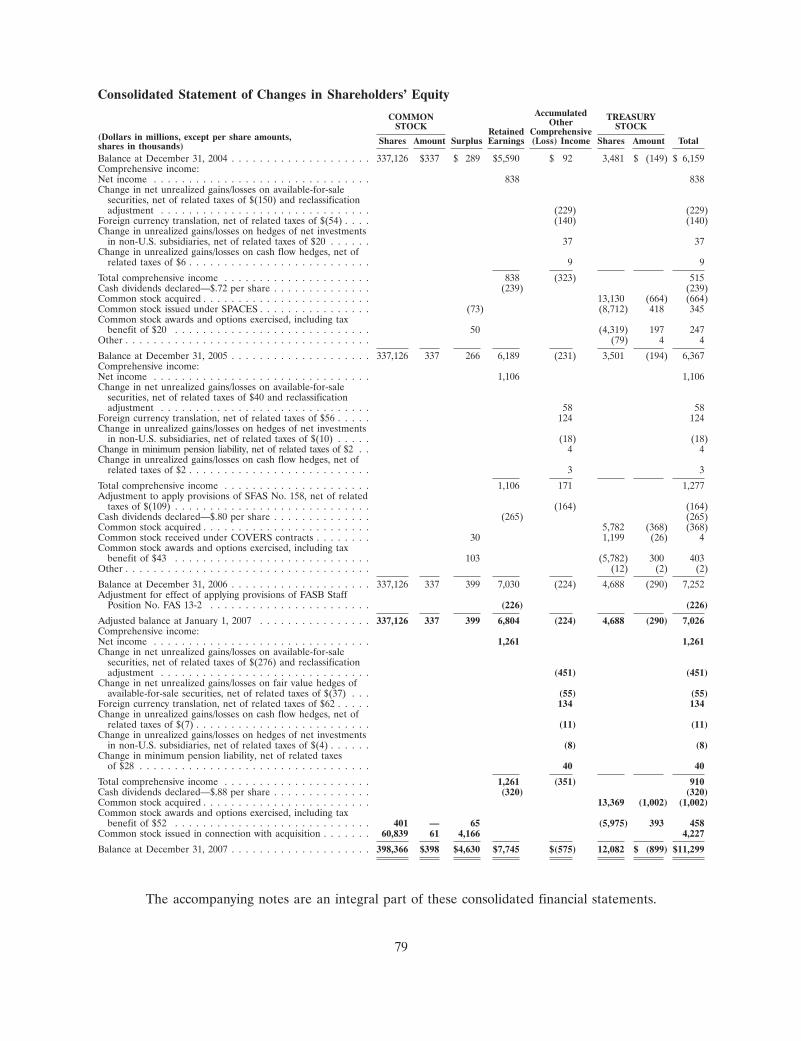
Consolidated Statement of Changes in Shareholders’ EquityAccumulatedCOMMON TREASURYOtherSTOCK STOCKRetained Comprehensive(Dollars in millions, except per share amounts, Shares Amount Surplus Earnings (Loss) Income Shares Amount Totalshares in thousands)
Balance at December 31, 2004 . . . . . . . . . . . . . . . . . . . . 337,126 $337 $ 289 $5,590 $ 92 3,481 $ (149) $ 6,159Comprehensive income:Net income . . . . . . . . . . . . . . . . . . . . . . . . . . . . . . . 838 838Change in net unrealized gains/losses on available-for-sale
securities, net of related taxes of $(150) and reclassificationadjustment . . . . . . . . . . . . . . . . . . . . . . . . . . . . . . (229) (229)
Foreign currency translation, net of related taxes of $(54) . . . . (140) (140)Change in unrealized gains/losses on hedges of net investments
in non-U.S. subsidiaries, net of related taxes of $20 . . . . . . 37 37Change in unrealized gains/losses on cash flow hedges, net of
related taxes of $6 . . . . . . . . . . . . . . . . . . . . . . . . . . 9 9
Total comprehensive income . . . . . . . . . . . . . . . . . . . . . 838 (323) 515Cash dividends declared—$.72 per share . . . . . . . . . . . . . . (239) (239)Common stock acquired . . . . . . . . . . . . . . . . . . . . . . . . 13,130 (664) (664)Common stock issued under SPACES . . . . . . . . . . . . . . . . (73) (8,712) 418 345Common stock awards and options exercised, including tax
benefit of $20 . . . . . . . . . . . . . . . . . . . . . . . . . . . . 50 (4,319) 197 247Other . . . . . . . . . . . . . . . . . . . . . . . . . . . . . . . . . . . (79) 4 4
Balance at December 31, 2005 . . . . . . . . . . . . . . . . . . . . 337,126 337 266 6,189 (231) 3,501 (194) 6,367Comprehensive income:Net income . . . . . . . . . . . . . . . . . . . . . . . . . . . . . . . 1,106 1,106Change in net unrealized gains/losses on available-for-sale
securities, net of related taxes of $40 and reclassificationadjustment . . . . . . . . . . . . . . . . . . . . . . . . . . . . . . 58 58
Foreign currency translation, net of related taxes of $56 . . . . . 124 124Change in unrealized gains/losses on hedges of net investments
in non-U.S. subsidiaries, net of related taxes of $(10) . . . . . (18) (18)Change in minimum pension liability, net of related taxes of $2 . . 4 4Change in unrealized gains/losses on cash flow hedges, net of
related taxes of $2 . . . . . . . . . . . . . . . . . . . . . . . . . . 3 3
Total comprehensive income . . . . . . . . . . . . . . . . . . . . . 1,106 171 1,277Adjustment to apply provisions of SFAS No. 158, net of related
taxes of $(109) . . . . . . . . . . . . . . . . . . . . . . . . . . . . (164) (164)Cash dividends declared—$.80 per share . . . . . . . . . . . . . . (265) (265)Common stock acquired . . . . . . . . . . . . . . . . . . . . . . . . 5,782 (368) (368)Common stock received under COVERS contracts . . . . . . . . 30 1,199 (26) 4Common stock awards and options exercised, including tax
benefit of $43 . . . . . . . . . . . . . . . . . . . . . . . . . . . . 103 (5,782) 300 403Other . . . . . . . . . . . . . . . . . . . . . . . . . . . . . . . . . . . (12) (2) (2)
Balance at December 31, 2006 . . . . . . . . . . . . . . . . . . . . 337,126 337 399 7,030 (224) 4,688 (290) 7,252Adjustment for effect of applying provisions of FASB Staff
Position No. FAS 13-2 . . . . . . . . . . . . . . . . . . . . . . . (226) (226)
Adjusted balance at January 1, 2007 . . . . . . . . . . . . . . . . 337,126 337 399 6,804 (224) 4,688 (290) 7,026Comprehensive income:Net income . . . . . . . . . . . . . . . . . . . . . . . . . . . . . . . 1,261 1,261Change in net unrealized gains/losses on available-for-sale
securities, net of related taxes of $(276) and reclassificationadjustment . . . . . . . . . . . . . . . . . . . . . . . . . . . . . . (451) (451)
Change in net unrealized gains/losses on fair value hedges ofavailable-for-sale securities, net of related taxes of $(37) . . . (55) (55)
Foreign currency translation, net of related taxes of $62 . . . . . 134 134Change in unrealized gains/losses on cash flow hedges, net of
related taxes of $(7) . . . . . . . . . . . . . . . . . . . . . . . . . (11) (11)Change in unrealized gains/losses on hedges of net investments
in non-U.S. subsidiaries, net of related taxes of $(4) . . . . . . (8) (8)Change in minimum pension liability, net of related taxes
of $28 . . . . . . . . . . . . . . . . . . . . . . . . . . . . . . . . . 40 40
Total comprehensive income . . . . . . . . . . . . . . . . . . . . . 1,261 (351) 910Cash dividends declared—$.88 per share . . . . . . . . . . . . . . (320) (320)Common stock acquired . . . . . . . . . . . . . . . . . . . . . . . . 13,369 (1,002) (1,002)Common stock awards and options exercised, including tax
benefit of $52 . . . . . . . . . . . . . . . . . . . . . . . . . . . . 401 — 65 (5,975) 393 458Common stock issued in connection with acquisition . . . . . . . 60,839 61 4,166 4,227
Balance at December 31, 2007 . . . . . . . . . . . . . . . . . . . . 398,366 $398 $4,630 $7,745 $(575) 12,082 $ (899) $11,299
The accompanying notes are an integral part of these consolidated financial statements.
79
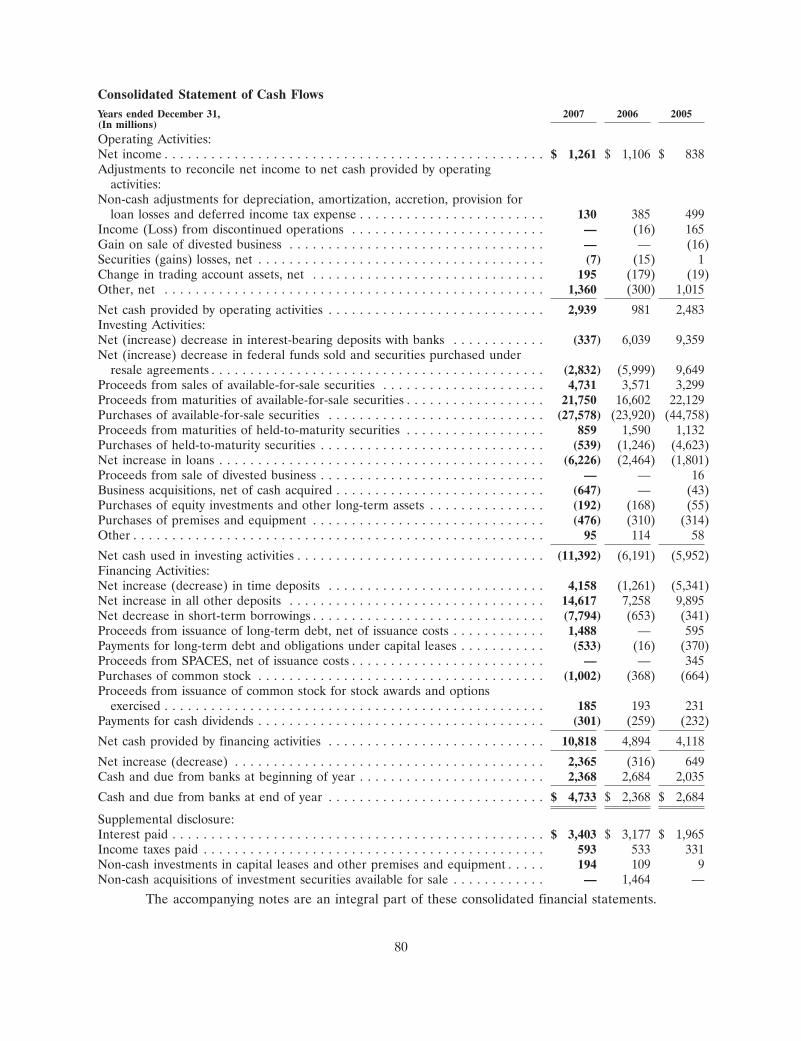
Consolidated Statement of Cash FlowsYears ended December 31, 2007 2006 2005(In millions)Operating Activities:Net income . . . . . . . . . . . . . . . . . . . . . . . . . . . . . . . . . . . . . . . . . . . . . . . . . $ 1,261 $ 1,106 $ 838Adjustments to reconcile net income to net cash provided by operating
activities:Non-cash adjustments for depreciation, amortization, accretion, provision for
loan losses and deferred income tax expense . . . . . . . . . . . . . . . . . . . . . . . . 130 385 499Income (Loss) from discontinued operations . . . . . . . . . . . . . . . . . . . . . . . . . — (16) 165Gain on sale of divested business . . . . . . . . . . . . . . . . . . . . . . . . . . . . . . . . . — — (16)Securities (gains) losses, net . . . . . . . . . . . . . . . . . . . . . . . . . . . . . . . . . . . . . (7) (15) 1Change in trading account assets, net . . . . . . . . . . . . . . . . . . . . . . . . . . . . . . 195 (179) (19)Other, net . . . . . . . . . . . . . . . . . . . . . . . . . . . . . . . . . . . . . . . . . . . . . . . . . 1,360 (300) 1,015
Net cash provided by operating activities . . . . . . . . . . . . . . . . . . . . . . . . . . . . 2,939 981 2,483Investing Activities:Net (increase) decrease in interest-bearing deposits with banks . . . . . . . . . . . . (337) 6,039 9,359Net (increase) decrease in federal funds sold and securities purchased under
resale agreements . . . . . . . . . . . . . . . . . . . . . . . . . . . . . . . . . . . . . . . . . . . (2,832) (5,999) 9,649Proceeds from sales of available-for-sale securities . . . . . . . . . . . . . . . . . . . . . 4,731 3,571 3,299Proceeds from maturities of available-for-sale securities . . . . . . . . . . . . . . . . . . 21,750 16,602 22,129Purchases of available-for-sale securities . . . . . . . . . . . . . . . . . . . . . . . . . . . . (27,578) (23,920) (44,758)Proceeds from maturities of held-to-maturity securities . . . . . . . . . . . . . . . . . . 859 1,590 1,132Purchases of held-to-maturity securities . . . . . . . . . . . . . . . . . . . . . . . . . . . . . (539) (1,246) (4,623)Net increase in loans . . . . . . . . . . . . . . . . . . . . . . . . . . . . . . . . . . . . . . . . . . (6,226) (2,464) (1,801)Proceeds from sale of divested business . . . . . . . . . . . . . . . . . . . . . . . . . . . . . — — 16Business acquisitions, net of cash acquired . . . . . . . . . . . . . . . . . . . . . . . . . . . (647) — (43)Purchases of equity investments and other long-term assets . . . . . . . . . . . . . . . (192) (168) (55)Purchases of premises and equipment . . . . . . . . . . . . . . . . . . . . . . . . . . . . . . (476) (310) (314)Other . . . . . . . . . . . . . . . . . . . . . . . . . . . . . . . . . . . . . . . . . . . . . . . . . . . . . 95 114 58
Net cash used in investing activities . . . . . . . . . . . . . . . . . . . . . . . . . . . . . . . . (11,392) (6,191) (5,952)Financing Activities:Net increase (decrease) in time deposits . . . . . . . . . . . . . . . . . . . . . . . . . . . . 4,158 (1,261) (5,341)Net increase in all other deposits . . . . . . . . . . . . . . . . . . . . . . . . . . . . . . . . . 14,617 7,258 9,895Net decrease in short-term borrowings . . . . . . . . . . . . . . . . . . . . . . . . . . . . . . (7,794) (653) (341)Proceeds from issuance of long-term debt, net of issuance costs . . . . . . . . . . . . 1,488 — 595Payments for long-term debt and obligations under capital leases . . . . . . . . . . . (533) (16) (370)Proceeds from SPACES, net of issuance costs . . . . . . . . . . . . . . . . . . . . . . . . . — — 345Purchases of common stock . . . . . . . . . . . . . . . . . . . . . . . . . . . . . . . . . . . . . (1,002) (368) (664)Proceeds from issuance of common stock for stock awards and options
exercised . . . . . . . . . . . . . . . . . . . . . . . . . . . . . . . . . . . . . . . . . . . . . . . . . 185 193 231Payments for cash dividends . . . . . . . . . . . . . . . . . . . . . . . . . . . . . . . . . . . . . (301) (259) (232)
Net cash provided by financing activities . . . . . . . . . . . . . . . . . . . . . . . . . . . . 10,818 4,894 4,118
Net increase (decrease) . . . . . . . . . . . . . . . . . . . . . . . . . . . . . . . . . . . . . . . . 2,365 (316) 649Cash and due from banks at beginning of year . . . . . . . . . . . . . . . . . . . . . . . . 2,368 2,684 2,035
Cash and due from banks at end of year . . . . . . . . . . . . . . . . . . . . . . . . . . . . $ 4,733 $ 2,368 $ 2,684
Supplemental disclosure:Interest paid . . . . . . . . . . . . . . . . . . . . . . . . . . . . . . . . . . . . . . . . . . . . . . . . $ 3,403 $ 3,177 $ 1,965Income taxes paid . . . . . . . . . . . . . . . . . . . . . . . . . . . . . . . . . . . . . . . . . . . . 593 533 331Non-cash investments in capital leases and other premises and equipment . . . . . 194 109 9Non-cash acquisitions of investment securities available for sale . . . . . . . . . . . . — 1,464 —
The accompanying notes are an integral part of these consolidated financial statements.
80
Notes to Consolidated Financial Statements
Note 1. Summary of Significant Accounting Policies
The accounting and financial reporting policies of State Street Corporation conform to accountingprinciples generally accepted in the United States of America, referred to as ‘‘GAAP.’’ Unless otherwiseindicated or unless the context requires otherwise, all references in these Notes to ConsolidatedFinancial Statements to ‘‘State Street,’’ ‘‘we,’’ ‘‘us,’’ ‘‘our’’ or similar references mean State StreetCorporation and its subsidiaries on a consolidated basis. The parent company is a financial holdingcompany headquartered in Boston, Massachusetts. We report two lines of business:
• Investment Servicing provides services for U.S. mutual funds and collective investment funds,corporate and public retirement plans, insurance companies, foundations, endowments and otherinvestment pools worldwide. Products include custody, product- and participant-level accounting;daily pricing and administration; master trust and master custody; recordkeeping; foreignexchange, brokerage and other trading services; securities finance; deposit and short-terminvestment facilities; loans and lease financing; investment manager and hedge fund manageroperations outsourcing; and performance, risk and compliance analytics to support institutionalinvestors.
• Investment Management offers a broad array of services for managing financial assets, includinginvestment management and investment research services, primarily for institutional investorsworldwide. These services include passive and active U.S. and non-U.S. equity and fixed-incomestrategies, and other related services, such as securities finance.
The preparation of consolidated financial statements requires management to make estimates andassumptions in the application of certain of our accounting policies that materially affect the reportedamounts of assets, liabilities, revenue and expenses. As a result of unanticipated events orcircumstances, actual results could differ from those estimates. The following is a summary of oursignificant accounting policies.
Basis of Presentation:
Our consolidated financial statements include the accounts of the parent company and its majority-owned subsidiaries, including its principal banking subsidiary, State Street Bank and Trust Company,referred to as ‘‘State Street Bank.’’ All material inter-company transactions and balances have beeneliminated. Certain previously reported amounts have been reclassified to conform to current yearpresentation.
We consolidate subsidiaries in which we hold a majority of the voting rights or exercise control.Investments in unconsolidated subsidiaries, recorded in other assets, are generally accounted for usingthe equity method of accounting if we have the ability to exercise significant influence over theoperations of the investee. For investments accounted for under the equity method, our share ofincome or loss is recorded in processing fees and other revenue. Investments not meeting the criteriafor equity method treatment are accounted for using the cost method of accounting.
Foreign Currency Translation:
The assets and liabilities of our operations with functional currencies other than the U.S. dollarare translated at month-end exchange rates, and revenue and expenses are translated at rates thatapproximate average monthly exchange rates. Gains or losses from the translation of the net assets ofsubsidiaries with functional currencies other than the U.S. dollar, net of related taxes, are recorded inaccumulated other comprehensive income.
81
Cash and Cash Equivalents:
For purposes of the consolidated statement of cash flows, cash equivalents have been defined ascash and due from banks.
Securities Purchased Under Resale Agreements and Securities Sold Under Repurchase Agreements:
U.S. Treasury and federal agency securities, referred to as ‘‘U.S. government securities,’’ purchasedunder resale agreements or sold under repurchase agreements are treated as collateralized financingtransactions, and are recorded in our consolidated statement of condition at the amounts at which thesecurities will be subsequently resold or repurchased, plus accrued interest. Our policy is to takepossession or control of securities underlying resale agreements, allowing borrowers the right ofcollateral substitution and/or short-notice termination. We revalue these securities daily to determine ifadditional collateral is necessary from the borrower to protect us against credit exposure. We can usethese securities as collateral for repurchase agreements. For securities sold under repurchaseagreements collateralized by our U.S. government securities portfolio, the dollar value of the U.S.government securities remains in investment securities in our consolidated statement of condition.Where a master netting agreement exists or both parties are members of a common clearingorganization, resale and repurchase agreements with the same counterparty or clearing house andmaturity date are reported on a net basis.
Investment Securities Available for Sale and Held to Maturity:
Securities held in our investment securities portfolio are classified at the time of purchase, basedon management’s intentions, as available for sale or held to maturity. Securities available for sale arethose that management intends to hold for an indefinite period of time, including securities used aspart of our asset and liability management strategy that may be sold in response to changes in interestrates, pre-payment risk, liquidity needs or other similar factors. Debt and marketable equity securitiesclassified as available for sale are reported at fair value, and after-tax net unrealized gains and lossesare reported in accumulated other comprehensive income, a component of shareholders’ equity. Gainsor losses on sales of available-for-sale securities are computed using the specific identification method.Securities held to maturity are debt securities that management has the positive intent and ability tohold to maturity. Securities classified as held to maturity are reported at cost, adjusted for amortizationof premiums and accretion of discounts.
Management reviews the fair value of the portfolio at least quarterly, and evaluates individualsecurities for declines in fair value that may be other than temporary, considering factors such ascurrent and expected future interest rates, external credit ratings, dividend payments, the performanceof underlying collateral, if any, the financial health of the issuer and other pertinent information,including current developments with respect to the issuer, as well as the duration of the decline andmanagement’s intent and ability to hold the security. If declines are deemed other than temporary, animpairment loss is recognized and the amortized cost basis of the investment security is written down toits current fair value, which becomes the new cost basis. Other-than-temporary unrealized losses onavailable-for-sale and held-to-maturity securities, if any, are recorded as a reduction of processing feesand other revenue.
Loans and Lease Financing:
Loans are generally reported at the principal amount outstanding, net of the allowance for loanlosses, unearned income, and any net unamortized deferred loan origination fees. Interest revenue isrecognized using the interest method or on a basis approximating a level rate of return over the termof the loan. Fees received for providing loan commitments and letters of credit that we anticipate willresult in loans typically are deferred and amortized to interest revenue over the life of the related loan,
82
beginning with the initial borrowing. Fees on commitments and letters of credit are amortized toprocessing fees and other revenue over the commitment period when funding is not known or expected.
Loans are placed on non-accrual status when they become 60 days past due as to either principalor interest, or earlier when, in the opinion of management, full collection of principal or interest is notprobable. Loans 60 days past due, but considered both well secured and in the process of collection,are treated as exceptions and may be exempted from non-accrual status. When we place a loan onnon-accrual status, the accrual of interest is discontinued and previously recorded but unpaid interest isreversed and generally charged against net interest revenue. For loans on non-accrual status, revenue isrecognized on a cash basis after recovery of principal, if and when interest payments are received.
Leveraged lease investments are reported at the aggregate of lease payments receivable andestimated residual values, net of non-recourse debt and unearned income. Lease residual values arereviewed regularly for other-than-temporary impairment, with valuation adjustments recorded currentlyagainst processing fees and other revenue. Unearned income is recognized to yield a level rate ofreturn on the net investment in the leases. Gains and losses on residual values of leased equipmentsold are recorded in processing fees and other revenue.
Allowance for Loan Losses:
The adequacy of the allowance for loan losses is evaluated on a regular basis by management.Factors considered in evaluating the adequacy of the allowance include previous loss experience,current economic conditions and adverse situations that may affect the borrower’s ability to repay, theestimated value of the underlying collateral and the performance of individual credits in relation tocontract terms, and other relevant factors. The provision for loan losses charged to earnings is basedupon management’s estimate of the amount necessary to maintain the allowance at a level adequate toabsorb estimated probable credit losses.
Loans are charged off to the allowance for loan losses in the reporting period in which either anevent occurs that confirms the existence of a loss or it is determined that a loan or a portion of a loanis not collectible. Recoveries are recorded on a cash basis.
In addition, we maintain a reserve for off-balance sheet credit exposures that is recorded in otherliabilities. The adequacy of this reserve is subject to the same considerations and review as theallowance for loan losses. Provisions to change the level of this reserve are recorded in other operatingexpenses.
Premises and Equipment:
Buildings, leasehold improvements, computers, software and other equipment are carried at costless accumulated depreciation and amortization. Depreciation and amortization recorded in operatingexpenses are computed using the straight-line method over the estimated useful lives of the relatedassets or the remaining terms of the leases, generally 3 to 40 years. Maintenance and repairs arecharged to expense as incurred, while major leasehold improvements are capitalized and expensed overtheir estimated useful lives or terms of the lease. For premises held under leases where we have anobligation to restore the facilities to their original condition upon expiration of the lease, we expensethe anticipated related costs over the term of the lease.
Costs related to internal-use software development projects that provide significant newfunctionality are capitalized. We consider projects for capitalization that are expected to yield long-termoperational benefits, such as applications that result in operational efficiencies and/or incrementalrevenue streams. Software customization costs relating to specific customer enhancements are expensedas incurred.
83
Goodwill and Other Intangible Assets:
Goodwill represents the excess of the cost of an acquisition over the fair value of the net tangibleand other intangible assets acquired. Other intangible assets represent purchased assets that can bedistinguished from goodwill because of contractual rights or because the asset can be exchanged on itsown or in combination with a related contract, asset or liability. Goodwill is not amortized, but issubject to annual impairment tests. Customer relationship intangible assets generally are amortized ona straight-line basis over periods ranging from twelve to twenty years, and core deposit intangible assetsover twenty-two years, with amortization expense recorded in other operating expenses. Impairment ofgoodwill is deemed to exist if the carrying value of a reporting unit, including its allocation of goodwilland other intangible assets, exceeds its estimated fair value. Impairment of other intangibles is deemedto exist if the balance of the other intangible asset exceeds the cumulative net cash inflows related tothe asset over its remaining estimated useful life. If it is determined, based on these reviews, thatgoodwill or other intangible assets are impaired, the value of the goodwill or the other intangible assetis written down through a charge to other operating expenses.
Fee and Net Interest Revenue:
Fees from investment servicing, investment management, securities finance, trading services andcertain types of processing fees and other revenue are recorded based on estimates or specificcontractual terms as transactions occur or services are rendered, provided that persuasive evidenceexists, the price to the customer is fixed or determinable and collectibility is reasonably assured.Amounts accrued at period-end are recorded in accrued income receivable in our consolidatedstatement of condition. Investment management performance fees are recorded when earned, based onpredetermined benchmarks associated with the applicable fund’s performance. Interest revenue oninterest-earning assets and interest expense on interest-bearing liabilities is recorded based on theeffective yield of the related financial instrument.
Employee Benefits Expense:
Employee benefits expense includes prior and current service costs of pension and otherpostretirement benefit plans, which are accrued on a current basis, as well as contributions underdefined contribution savings plans, unrestricted awards under other employee compensation plans, andthe amortization of restricted stock awards.
Equity-Based Compensation:
We record compensation expense, equal to the estimated fair value of employee stock options onthe grant date, on a straight-line basis over the options’ vesting period. We use a Black-Scholes option-pricing model to determine the fair value of the options granted.
On January 1, 2006, we adopted Statement of Financial Accounting Standards No. 123 (revised2004), Share-Based Payment. This standard requires the fair value of all share-based payments toemployees, including awards made prior to January 1, 2003, to be recognized in the consolidatedstatement of income. We elected to use the modified prospective method, under which compensationexpense is recorded over the remaining vesting period for only the portion of stock awards not fullyvested as of January 1, 2006. The impact of adoption of the standard was not material to ourconsolidated financial position or results of operations, because the number of options granted prior toJanuary 1, 2003, that were not fully vested as of January 1, 2006, was not significant. In addition, weelected to adopt the alternative transition method prescribed by Financial Accounting Standards BoardStaff Position No. FAS 123(R)-3, and reclassified $86 million of tax benefits related to equity-basedcompensation from a general surplus account to a specifically designated surplus account withinshareholders’ equity.
84
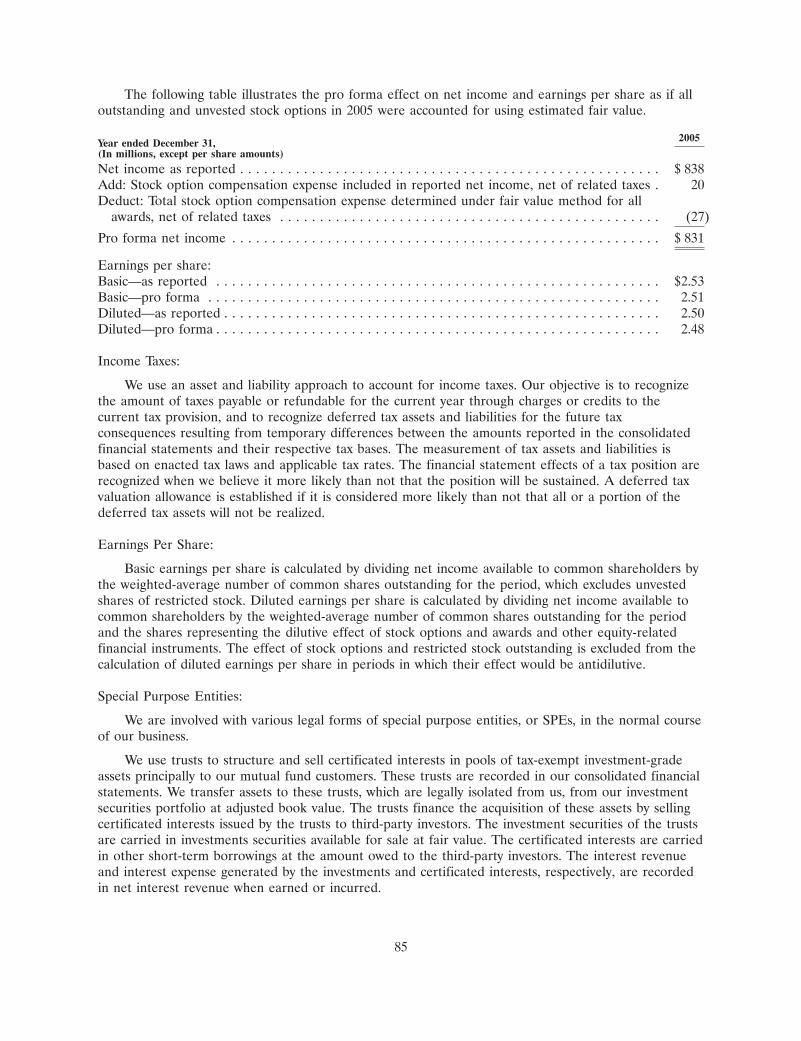
The following table illustrates the pro forma effect on net income and earnings per share as if alloutstanding and unvested stock options in 2005 were accounted for using estimated fair value.
2005Year ended December 31,(In millions, except per share amounts)
Net income as reported . . . . . . . . . . . . . . . . . . . . . . . . . . . . . . . . . . . . . . . . . . . . . . . . . . . . . $ 838Add: Stock option compensation expense included in reported net income, net of related taxes . 20Deduct: Total stock option compensation expense determined under fair value method for all
awards, net of related taxes . . . . . . . . . . . . . . . . . . . . . . . . . . . . . . . . . . . . . . . . . . . . . . . . (27)
Pro forma net income . . . . . . . . . . . . . . . . . . . . . . . . . . . . . . . . . . . . . . . . . . . . . . . . . . . . . . $ 831
Earnings per share:Basic—as reported . . . . . . . . . . . . . . . . . . . . . . . . . . . . . . . . . . . . . . . . . . . . . . . . . . . . . . . . $2.53Basic—pro forma . . . . . . . . . . . . . . . . . . . . . . . . . . . . . . . . . . . . . . . . . . . . . . . . . . . . . . . . . 2.51Diluted—as reported . . . . . . . . . . . . . . . . . . . . . . . . . . . . . . . . . . . . . . . . . . . . . . . . . . . . . . . 2.50Diluted—pro forma . . . . . . . . . . . . . . . . . . . . . . . . . . . . . . . . . . . . . . . . . . . . . . . . . . . . . . . . 2.48
Income Taxes:
We use an asset and liability approach to account for income taxes. Our objective is to recognizethe amount of taxes payable or refundable for the current year through charges or credits to thecurrent tax provision, and to recognize deferred tax assets and liabilities for the future taxconsequences resulting from temporary differences between the amounts reported in the consolidatedfinancial statements and their respective tax bases. The measurement of tax assets and liabilities isbased on enacted tax laws and applicable tax rates. The financial statement effects of a tax position arerecognized when we believe it more likely than not that the position will be sustained. A deferred taxvaluation allowance is established if it is considered more likely than not that all or a portion of thedeferred tax assets will not be realized.
Earnings Per Share:
Basic earnings per share is calculated by dividing net income available to common shareholders bythe weighted-average number of common shares outstanding for the period, which excludes unvestedshares of restricted stock. Diluted earnings per share is calculated by dividing net income available tocommon shareholders by the weighted-average number of common shares outstanding for the periodand the shares representing the dilutive effect of stock options and awards and other equity-relatedfinancial instruments. The effect of stock options and restricted stock outstanding is excluded from thecalculation of diluted earnings per share in periods in which their effect would be antidilutive.
Special Purpose Entities:
We are involved with various legal forms of special purpose entities, or SPEs, in the normal courseof our business.
We use trusts to structure and sell certificated interests in pools of tax-exempt investment-gradeassets principally to our mutual fund customers. These trusts are recorded in our consolidated financialstatements. We transfer assets to these trusts, which are legally isolated from us, from our investmentsecurities portfolio at adjusted book value. The trusts finance the acquisition of these assets by sellingcertificated interests issued by the trusts to third-party investors. The investment securities of the trustsare carried in investments securities available for sale at fair value. The certificated interests are carriedin other short-term borrowings at the amount owed to the third-party investors. The interest revenueand interest expense generated by the investments and certificated interests, respectively, are recordedin net interest revenue when earned or incurred.
85
We use conduits in connection with an asset-backed commercial paper program that providesshort-term investments for our customers. The conduits, which are administered by us, are third-partyowned and are structured as bankruptcy-remote limited liability companies. The conduits purchasefinancial assets with various asset classifications from a variety of third-parties and fund those purchasesby issuing commercial paper. We do not sell our own assets to these conduits. These conduits typicallymeet the definition of a variable interest entity, or VIE, as defined by FASB Interpretation No. 46(R),Consolidation of Variable Interest Entities (revised December 2003)—an interpretation of ARB No. 51. Wehave determined that we are not the primary beneficiary of the conduits, as defined by FIN 46(R), anddo not record them in our consolidated financial statements. We periodically re-assess thisdetermination, using a financial model, referred to as an ‘‘expected loss model,’’ to ensure thatconsolidation is not required pursuant to FIN 46(R).
The primary beneficiary is the party that has one or more variable interests that will absorb amajority of a VIE’s expected losses, receive a majority of the VIE’s expected residual returns, or both.If we were to determine that we were the primary beneficiary of the conduits, we would consolidatethem. We apply the expected loss model to the conduits to determine the primary beneficiaries ofconduits meeting the definition of variable interest entities. Variabilities factored into the model includebasis risk and credit risk, which are then allocated to the variable interest holders to determine whichof those variable interest holders is the primary beneficiary. We hold no equity ownership interest inthese conduits.
Investors in commercial paper issued by the conduits benefit from the liquidity support provided tothe conduits, the majority of which is provided by us in the form of liquidity asset purchase agreementsand backup liquidity lines of credit. We also provide direct credit support to the conduits in the form ofstandby letters of credit. Liquidity asset purchase agreements, backup liquidity lines of credit andstandby letters of credit are not recorded in our consolidated financial statements but are reported asoff-balance sheet commitments. We receive fees for providing administrative services to the conduits, aswell as liquidity and direct credit support, all of which are based on market price and are recorded inprocessing fees and other revenue when earned.
We manage the collateral in certain third-party investment vehicles, referred to as CDOs, whichstructure and sell debt and equity securities to investors. These CDOs purchase a portfolio ofdiversified assets and fund these asset purchases through the issuance of several tranches of debt andequity, the repayment and return of which are linked to the performance of the assets in the CDO.Typically, our involvement is only as collateral manager. We may also invest in a small percentage ofthe debt issued. These CDOs typically meet the definition of a variable interest entity as defined byFIN 46(R). We have determined that we are not the primary beneficiary of these CDOs, and do notrecord them in our consolidated financial statements. We receive fees for asset management servicesprovided to the CDOs, which are based on market price and are recorded in processing fees and otherrevenue when earned.
Derivative Financial Instruments:
A derivative financial instrument is a financial instrument or other contract which has one or moreunderlying and one or more notional amounts, no initial net investment, or a smaller initial netinvestment than would be expected for similar types of contracts, and which requires or permits netsettlement. Derivatives that we enter into include forwards, futures, swaps, options and otherinstruments with similar characteristics.
We record derivatives in our consolidated statement of condition at their fair value. On the date aderivative contract is entered into, we designate the derivative as: (1) a hedge of the fair value of arecognized fixed-rate asset or liability or of an unrecognized firm commitment (a ‘‘fair value’’ hedge);(2) a hedge of a forecasted transaction or of the variability of cash flows to be received or paid related
86
to a recognized variable-rate asset or liability (a ‘‘cash flow’’ hedge); (3) a foreign currency fair value orcash flow hedge (a ‘‘foreign currency’’ hedge); (4) a hedge of a net investment in a non-U.S. operation;or (5) held for trading purposes (‘‘trading’’ instruments).
Changes in the fair value of a derivative that is highly effective—and that is designated andqualifies as a fair value hedge—are recorded currently in processing fees and other revenue, along withthe changes in fair value of the hedged asset or liability attributable to the hedged risk. Changes in thefair value of a derivative that is highly effective—and that is designated and qualifies as a cash flowhedge—are recorded, net of tax, in other comprehensive income, until earnings are affected by thehedged cash flows (e.g., when periodic settlements on a variable-rate asset or liability are recorded inearnings). Cash flow hedge ineffectiveness, defined as the extent to which the changes in fair value ofthe derivative exceed the variability of cash flows of the forecasted transaction, is recorded inprocessing fees and other revenue.
Changes in the fair value of a derivative that is highly effective—and that is designated andqualifies as a foreign currency hedge—are recorded currently either in processing fees and otherrevenue or in other comprehensive income, net of tax, depending on whether the hedge transactionmeets the criteria for a fair value or a cash flow hedge. If, however, a derivative is used as a hedge of anet investment in a non-U.S. operation, its changes in fair value, to the extent effective as a hedge, arerecorded, net of tax, in the foreign currency translation component of other comprehensive income.Lastly, entire changes in the fair value of derivatives classified as trading instruments are recorded intrading services revenue.
At both the inception of the hedge and on an ongoing basis, we formally assess and document theeffectiveness of a derivative designated as a hedge in offsetting changes in the fair value of hedgeditems and the likelihood that the derivative will be an effective hedge in future periods. We discontinuehedge accounting prospectively when we determine that the derivative will not remain effective inoffsetting changes in fair value or cash flows of the underlying risk being hedged, the derivative expires,terminates or is sold, or management discontinues the hedge designation.
Unrealized gains and losses on foreign exchange and interest-rate contracts are reported at fairvalue in the consolidated statement of condition as a component of other assets and other liabilities,respectively, on a gross basis, except where such gains and losses arise from contracts covered byqualifying master netting agreements.
Recent Accounting Developments:
In December 2007, the FASB issued SFAS No. 160, Noncontrolling Interests in ConsolidatedFinancial Statements, an amendment of ARB No. 51. SFAS No. 160 will change the accounting andreporting for minority interests, which will be recharacterized as ‘‘noncontrolling interests’’ andclassified as a component of equity. This new consolidation method will significantly change theaccounting for transactions with minority interest holders. The provisions of this standard are effectivebeginning January 1, 2009. We are currently evaluating the potential impact of adoption of thisstandard on our consolidated financial position and results of operations.
In December 2007, the FASB issued SFAS No. 141 (revised 2007), Business Combinations. SFASNo. 141(R) will significantly change the accounting for business combinations in a number of areas,including the treatment of contingent consideration, contingencies, acquisition costs, in-process researchand development costs and restructuring costs. In addition, under SFAS No. 141(R), changes indeferred tax asset valuation allowances and acquired income tax uncertainties in a business combinationafter the measurement period will impact income tax expense. The provisions of this standard areeffective beginning January 1, 2009. We are currently evaluating the potential impact of adoption ofthis new standard on our consolidated financial position and results of operations.
87
In February 2007, the FASB issued SFAS No. 159, The Fair Value Option for Financial Assets andFinancial Liabilities—Including an amendment of FASB Statement No. 115. This new standard isdesigned to reduce complexity in accounting for financial instruments and lessen earnings volatilitycaused by measuring related assets and liabilities differently. The standard creates presentation anddisclosure requirements designed to aid comparisons between companies that use differentmeasurement attributes for similar types of assets and liabilities. The standard, which is expected toexpand the use of fair value measurement, permits entities to choose to measure many financialinstruments and certain other items at fair value, with unrealized gains and losses on those assets andliabilities recorded in earnings. The fair value option may be applied on a financial instrument byfinancial instrument basis, with a few exceptions, and is irrevocable for those financial instruments onceapplied. The fair value option may only be applied to entire financial instruments, not portions ofinstruments.
The standard does not eliminate disclosures required by SFAS No. 107, Disclosures About FairValue of Financial Instruments, or SFAS No. 157, Fair Value Measurements, the latter of which isdescribed below. The provisions of the standard were effective for our consolidated financial statementsbeginning January 1, 2008. We have not elected the fair value option under SFAS No. 159, but mayelect to do so in future periods.
In September 2006, the FASB issued SFAS No. 157, Fair Value Measurements. This new standarddefines fair value, establishes a framework for measuring fair value in conformity with GAAP, andexpands disclosures about fair value measurements. Prior to this standard, there were varyingdefinitions of fair value, and the limited guidance for applying those definitions under GAAP wasdispersed among the many accounting pronouncements that require fair value measurements. The newstandard defines fair value as the exchange price that would be received for an asset or paid to transfera liability (an exit price) in the principal or most advantageous market for the asset or liability in anorderly transaction between market participants on the measurement date.
The standard applies under other accounting pronouncements that require or permit fair valuemeasurements, since the FASB previously concluded in those accounting pronouncements that fairvalue is the relevant measurement attribute. As a result, the new standard does not establish any newfair value measurements itself, but applies to other accounting standards that require the use of fairvalue for recognition or disclosure. In particular, the framework in the new standard will be requiredfor financial instruments for which fair value is elected, such as under the newly issued SFAS No. 159,discussed above.
The new standard requires companies to disclose the fair value of financial instruments accordingto a fair value hierarchy. The fair value hierarchy ranks the quality and reliability of the informationused to determine fair values. Financial instruments carried at fair value will be classified and disclosedin one of the three categories in accordance with the hierarchy. The three levels of the fair valuehierarchy are:
• level 1: Quoted market prices for identical assets or liabilities in active markets;
• level 2: Observable market-based inputs or unobservable inputs corroborated by market data;and
• level 3: Unobservable inputs that are not corroborated by market data.
In addition, the standard requires enhanced disclosure with respect to the activities of thosefinancial instruments classified within the level 3 category, including a roll-forward analysis of fair valuebalance sheet amounts for each major category of assets and liabilities and disclosure of the unrealizedgains and losses for level 3 positions held at the reporting date.
88
The standard is intended to increase consistency and comparability in fair value measurements anddisclosures about fair value measurements, and encourages entities to combine the fair valueinformation disclosed under the standard with the fair value information disclosed under otheraccounting pronouncements, including SFAS No. 107, Disclosures about Fair Value of FinancialInstruments, where practicable. The provisions of this standard were effective beginning January 1, 2008.Our adoption of the standard’s provisions did not materially impact our consolidated financial positionand results of operations. We will provide the disclosures required by the new standard in our firstquarter 2008 Form 10-Q.
In July 2006, the FASB issued FASB Staff Position No. FAS 13-2, Accounting for a Change orProjected Change in the Timing of Cash Flows Relating to Income Taxes Generated by a Leveraged LeaseTransaction. The Staff Position, the provisions of which were applied on January 1, 2007, requires thatthe recognition of lease income over the term of a lease be recalculated if a change in the expectedtiming of tax-related cash flows occurs. Our application of the Staff Position’s provisions to certain ofour leveraged leases resulted in a cumulative after-tax reduction of the beginning balance of retainedearnings on January 1, 2007 of approximately $226 million. Future income from the affected leases isexpected to increase over the remaining terms of the affected leases by an amount approximately equalto the after-tax reduction.
In July 2006, to improve comparability in the reporting of income tax assets and liabilities in theabsence of guidance in existing income tax accounting standards, the FASB issued InterpretationNo. 48, Accounting for Uncertainty in Income Taxes—an interpretation of FASB Statement No. 109.Generally, this Interpretation clarifies the accounting for uncertainty in income taxes recognized in acompany’s financial statements in accordance with existing income tax accounting standards, andprescribes certain thresholds and attributes for the financial statement recognition and measurement oftax positions taken or expected to be taken in a tax return. The provisions of the Interpretation wereapplied on January 1, 2007, and did not have a material impact on our consolidated financial positionor results of operations. Disclosures required by the Interpretation are provided in note 20.
Note 2. Acquisitions and Divestitures
On July 2, 2007, we completed our acquisition of Investors Financial Services Corp., a bankholding company based in Boston, Massachusetts with approximately $17 billion in total assets andapproximately $1.9 trillion in assets under custody. We acquired Investors Financial in order to enhanceour position as a worldwide service provider to institutional investors. We exchanged approximately60.8 million shares of our common stock, with an aggregate value of approximately $4.2 billion, for allof the outstanding common stock of Investors Financial. Financial results of the acquired InvestorsFinancial business are included in our consolidated financial statements beginning on July 2, 2007.
89
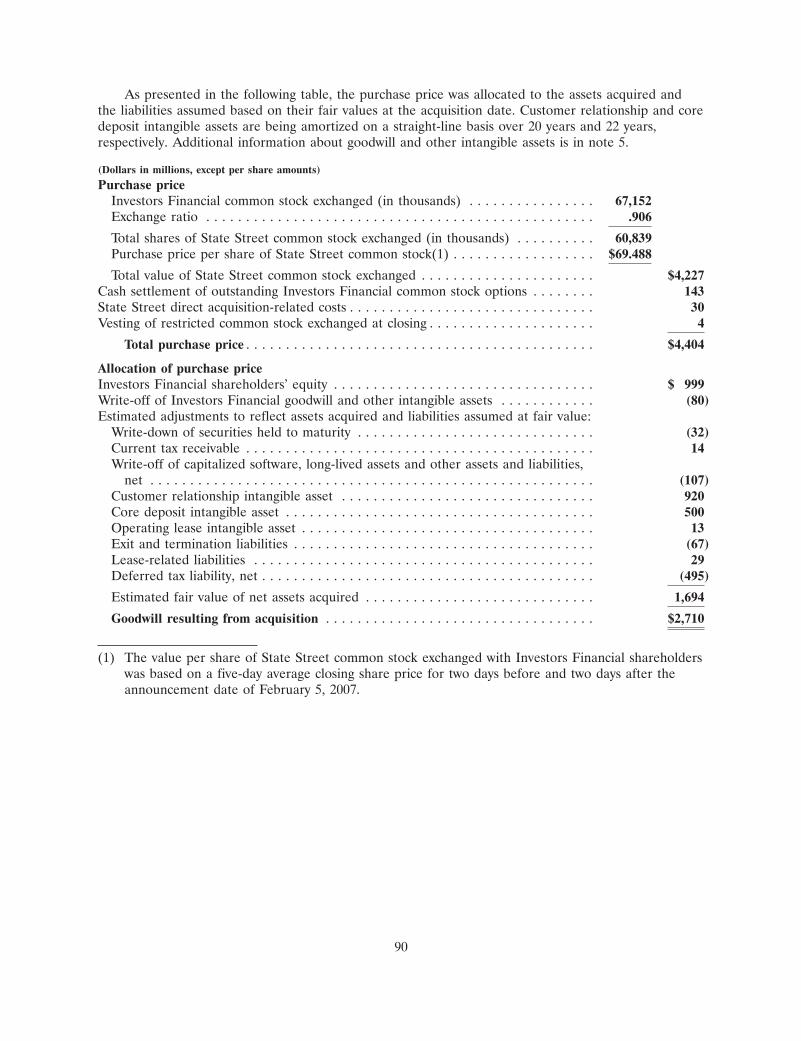
As presented in the following table, the purchase price was allocated to the assets acquired andthe liabilities assumed based on their fair values at the acquisition date. Customer relationship and coredeposit intangible assets are being amortized on a straight-line basis over 20 years and 22 years,respectively. Additional information about goodwill and other intangible assets is in note 5.
(Dollars in millions, except per share amounts)
Purchase priceInvestors Financial common stock exchanged (in thousands) . . . . . . . . . . . . . . . . 67,152Exchange ratio . . . . . . . . . . . . . . . . . . . . . . . . . . . . . . . . . . . . . . . . . . . . . . . . . .906
Total shares of State Street common stock exchanged (in thousands) . . . . . . . . . . 60,839Purchase price per share of State Street common stock(1) . . . . . . . . . . . . . . . . . . $69.488
Total value of State Street common stock exchanged . . . . . . . . . . . . . . . . . . . . . . $4,227Cash settlement of outstanding Investors Financial common stock options . . . . . . . . 143State Street direct acquisition-related costs . . . . . . . . . . . . . . . . . . . . . . . . . . . . . . . 30Vesting of restricted common stock exchanged at closing . . . . . . . . . . . . . . . . . . . . . 4
Total purchase price . . . . . . . . . . . . . . . . . . . . . . . . . . . . . . . . . . . . . . . . . . . . $4,404
Allocation of purchase priceInvestors Financial shareholders’ equity . . . . . . . . . . . . . . . . . . . . . . . . . . . . . . . . . $ 999Write-off of Investors Financial goodwill and other intangible assets . . . . . . . . . . . . (80)Estimated adjustments to reflect assets acquired and liabilities assumed at fair value:
Write-down of securities held to maturity . . . . . . . . . . . . . . . . . . . . . . . . . . . . . . (32)Current tax receivable . . . . . . . . . . . . . . . . . . . . . . . . . . . . . . . . . . . . . . . . . . . . 14Write-off of capitalized software, long-lived assets and other assets and liabilities,
net . . . . . . . . . . . . . . . . . . . . . . . . . . . . . . . . . . . . . . . . . . . . . . . . . . . . . . . . (107)Customer relationship intangible asset . . . . . . . . . . . . . . . . . . . . . . . . . . . . . . . . 920Core deposit intangible asset . . . . . . . . . . . . . . . . . . . . . . . . . . . . . . . . . . . . . . . 500Operating lease intangible asset . . . . . . . . . . . . . . . . . . . . . . . . . . . . . . . . . . . . . 13Exit and termination liabilities . . . . . . . . . . . . . . . . . . . . . . . . . . . . . . . . . . . . . . (67)Lease-related liabilities . . . . . . . . . . . . . . . . . . . . . . . . . . . . . . . . . . . . . . . . . . . 29Deferred tax liability, net . . . . . . . . . . . . . . . . . . . . . . . . . . . . . . . . . . . . . . . . . . (495)
Estimated fair value of net assets acquired . . . . . . . . . . . . . . . . . . . . . . . . . . . . . 1,694
Goodwill resulting from acquisition . . . . . . . . . . . . . . . . . . . . . . . . . . . . . . . . . . $2,710
(1) The value per share of State Street common stock exchanged with Investors Financial shareholderswas based on a five-day average closing share price for two days before and two days after theannouncement date of February 5, 2007.
90
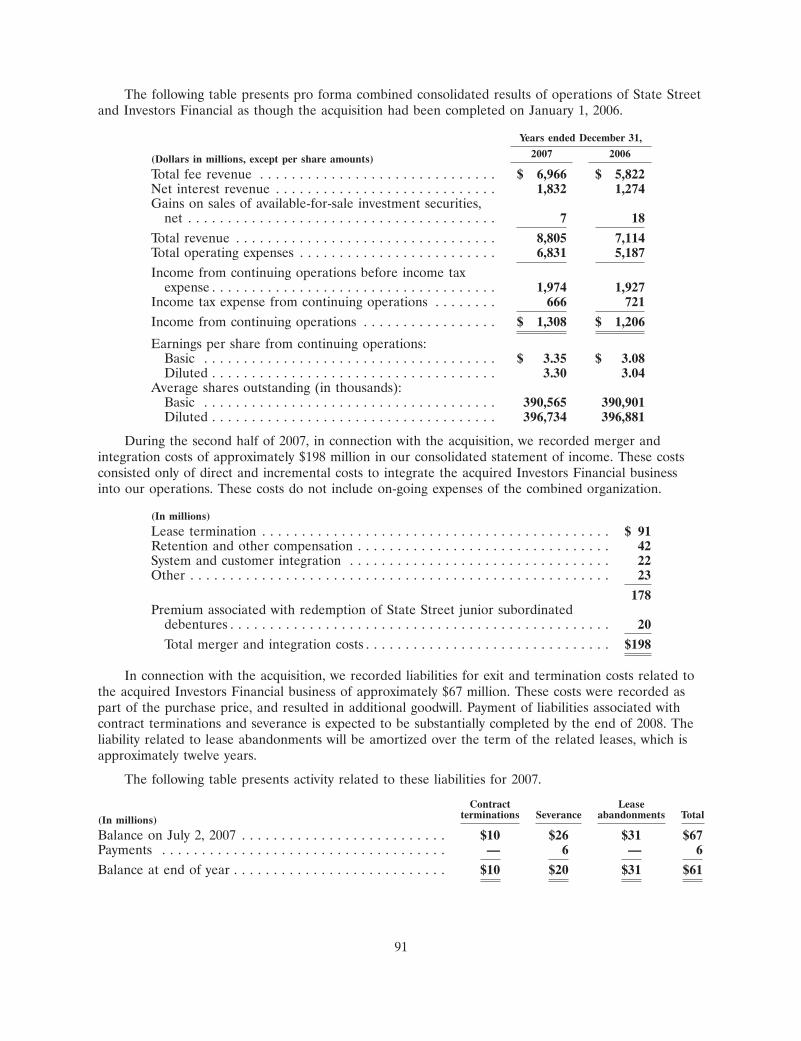
The following table presents pro forma combined consolidated results of operations of State Streetand Investors Financial as though the acquisition had been completed on January 1, 2006.
Years ended December 31,
2007 2006(Dollars in millions, except per share amounts)
Total fee revenue . . . . . . . . . . . . . . . . . . . . . . . . . . . . . . $ 6,966 $ 5,822Net interest revenue . . . . . . . . . . . . . . . . . . . . . . . . . . . . 1,832 1,274Gains on sales of available-for-sale investment securities,
net . . . . . . . . . . . . . . . . . . . . . . . . . . . . . . . . . . . . . . . 7 18
Total revenue . . . . . . . . . . . . . . . . . . . . . . . . . . . . . . . . . 8,805 7,114Total operating expenses . . . . . . . . . . . . . . . . . . . . . . . . . 6,831 5,187
Income from continuing operations before income taxexpense . . . . . . . . . . . . . . . . . . . . . . . . . . . . . . . . . . . . 1,974 1,927
Income tax expense from continuing operations . . . . . . . . 666 721
Income from continuing operations . . . . . . . . . . . . . . . . . $ 1,308 $ 1,206
Earnings per share from continuing operations:Basic . . . . . . . . . . . . . . . . . . . . . . . . . . . . . . . . . . . . . $ 3.35 $ 3.08Diluted . . . . . . . . . . . . . . . . . . . . . . . . . . . . . . . . . . . . 3.30 3.04
Average shares outstanding (in thousands):Basic . . . . . . . . . . . . . . . . . . . . . . . . . . . . . . . . . . . . . 390,565 390,901Diluted . . . . . . . . . . . . . . . . . . . . . . . . . . . . . . . . . . . . 396,734 396,881
During the second half of 2007, in connection with the acquisition, we recorded merger andintegration costs of approximately $198 million in our consolidated statement of income. These costsconsisted only of direct and incremental costs to integrate the acquired Investors Financial businessinto our operations. These costs do not include on-going expenses of the combined organization.
(In millions)
Lease termination . . . . . . . . . . . . . . . . . . . . . . . . . . . . . . . . . . . . . . . . . . . . $ 91Retention and other compensation . . . . . . . . . . . . . . . . . . . . . . . . . . . . . . . . 42System and customer integration . . . . . . . . . . . . . . . . . . . . . . . . . . . . . . . . . 22Other . . . . . . . . . . . . . . . . . . . . . . . . . . . . . . . . . . . . . . . . . . . . . . . . . . . . . 23
178Premium associated with redemption of State Street junior subordinated
debentures . . . . . . . . . . . . . . . . . . . . . . . . . . . . . . . . . . . . . . . . . . . . . . . . 20
Total merger and integration costs . . . . . . . . . . . . . . . . . . . . . . . . . . . . . . . $198
In connection with the acquisition, we recorded liabilities for exit and termination costs related tothe acquired Investors Financial business of approximately $67 million. These costs were recorded aspart of the purchase price, and resulted in additional goodwill. Payment of liabilities associated withcontract terminations and severance is expected to be substantially completed by the end of 2008. Theliability related to lease abandonments will be amortized over the term of the related leases, which isapproximately twelve years.
The following table presents activity related to these liabilities for 2007.
Contract Leaseterminations Severance abandonments Total(In millions)
Balance on July 2, 2007 . . . . . . . . . . . . . . . . . . . . . . . . . . $10 $26 $31 $67Payments . . . . . . . . . . . . . . . . . . . . . . . . . . . . . . . . . . . . — 6 — 6
Balance at end of year . . . . . . . . . . . . . . . . . . . . . . . . . . . $10 $20 $31 $61
91
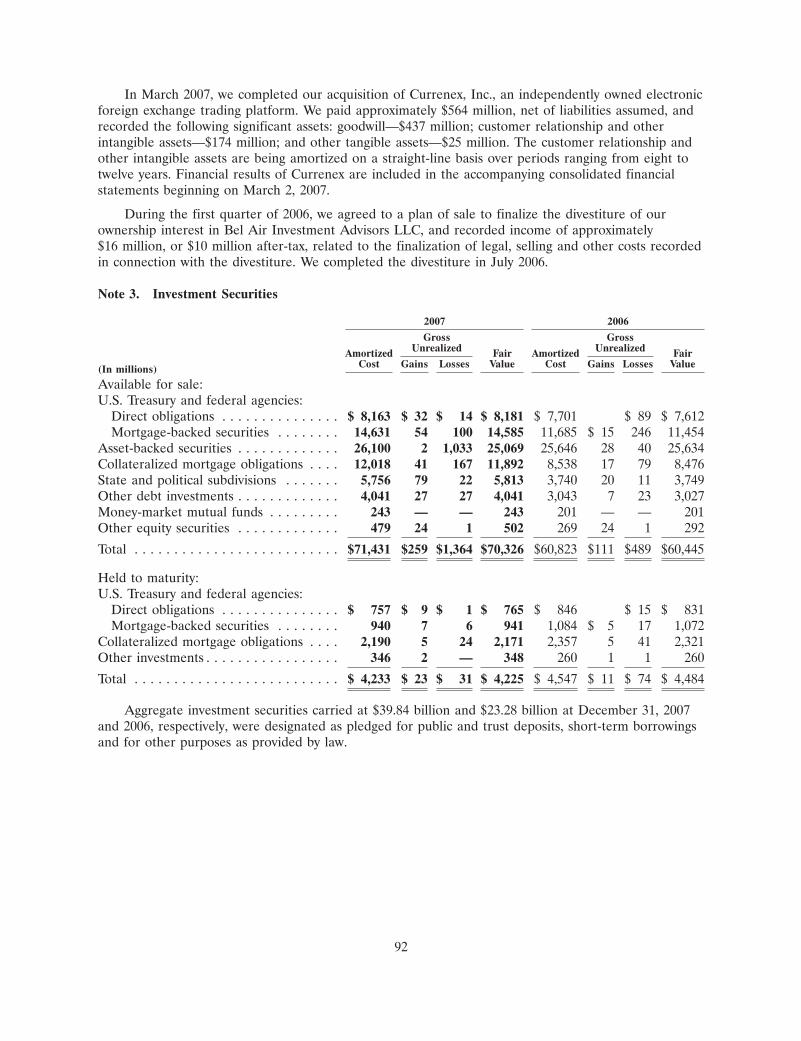
In March 2007, we completed our acquisition of Currenex, Inc., an independently owned electronicforeign exchange trading platform. We paid approximately $564 million, net of liabilities assumed, andrecorded the following significant assets: goodwill—$437 million; customer relationship and otherintangible assets—$174 million; and other tangible assets—$25 million. The customer relationship andother intangible assets are being amortized on a straight-line basis over periods ranging from eight totwelve years. Financial results of Currenex are included in the accompanying consolidated financialstatements beginning on March 2, 2007.
During the first quarter of 2006, we agreed to a plan of sale to finalize the divestiture of ourownership interest in Bel Air Investment Advisors LLC, and recorded income of approximately$16 million, or $10 million after-tax, related to the finalization of legal, selling and other costs recordedin connection with the divestiture. We completed the divestiture in July 2006.
Note 3. Investment Securities
2007 2006
Gross GrossUnrealized UnrealizedAmortized Fair Amortized Fair
Cost Gains Losses Value Cost Gains Losses Value(In millions)
Available for sale:U.S. Treasury and federal agencies:
Direct obligations . . . . . . . . . . . . . . . $ 8,163 $ 32 $ 14 $ 8,181 $ 7,701 $ 89 $ 7,612Mortgage-backed securities . . . . . . . . 14,631 54 100 14,585 11,685 $ 15 246 11,454
Asset-backed securities . . . . . . . . . . . . . 26,100 2 1,033 25,069 25,646 28 40 25,634Collateralized mortgage obligations . . . . 12,018 41 167 11,892 8,538 17 79 8,476State and political subdivisions . . . . . . . 5,756 79 22 5,813 3,740 20 11 3,749Other debt investments . . . . . . . . . . . . . 4,041 27 27 4,041 3,043 7 23 3,027Money-market mutual funds . . . . . . . . . 243 — — 243 201 — — 201Other equity securities . . . . . . . . . . . . . 479 24 1 502 269 24 1 292
Total . . . . . . . . . . . . . . . . . . . . . . . . . . $71,431 $259 $1,364 $70,326 $60,823 $111 $489 $60,445
Held to maturity:U.S. Treasury and federal agencies:
Direct obligations . . . . . . . . . . . . . . . $ 757 $ 9 $ 1 $ 765 $ 846 $ 15 $ 831Mortgage-backed securities . . . . . . . . 940 7 6 941 1,084 $ 5 17 1,072
Collateralized mortgage obligations . . . . 2,190 5 24 2,171 2,357 5 41 2,321Other investments . . . . . . . . . . . . . . . . . 346 2 — 348 260 1 1 260
Total . . . . . . . . . . . . . . . . . . . . . . . . . . $ 4,233 $ 23 $ 31 $ 4,225 $ 4,547 $ 11 $ 74 $ 4,484
Aggregate investment securities carried at $39.84 billion and $23.28 billion at December 31, 2007and 2006, respectively, were designated as pledged for public and trust deposits, short-term borrowingsand for other purposes as provided by law.
92
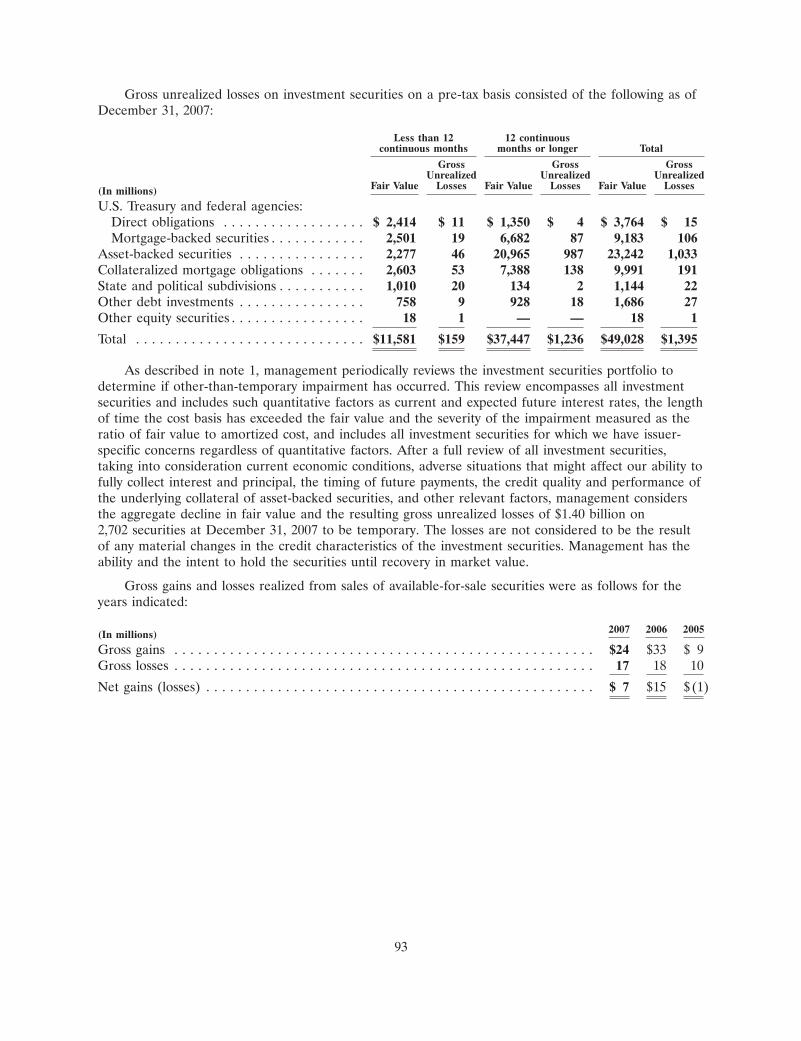
Gross unrealized losses on investment securities on a pre-tax basis consisted of the following as ofDecember 31, 2007:
Less than 12 12 continuouscontinuous months months or longer Total
Gross Gross GrossUnrealized Unrealized Unrealized
Fair Value Losses Fair Value Losses Fair Value Losses(In millions)
U.S. Treasury and federal agencies:Direct obligations . . . . . . . . . . . . . . . . . . $ 2,414 $ 11 $ 1,350 $ 4 $ 3,764 $ 15Mortgage-backed securities . . . . . . . . . . . . 2,501 19 6,682 87 9,183 106
Asset-backed securities . . . . . . . . . . . . . . . . 2,277 46 20,965 987 23,242 1,033Collateralized mortgage obligations . . . . . . . 2,603 53 7,388 138 9,991 191State and political subdivisions . . . . . . . . . . . 1,010 20 134 2 1,144 22Other debt investments . . . . . . . . . . . . . . . . 758 9 928 18 1,686 27Other equity securities . . . . . . . . . . . . . . . . . 18 1 — — 18 1
Total . . . . . . . . . . . . . . . . . . . . . . . . . . . . . $11,581 $159 $37,447 $1,236 $49,028 $1,395
As described in note 1, management periodically reviews the investment securities portfolio todetermine if other-than-temporary impairment has occurred. This review encompasses all investmentsecurities and includes such quantitative factors as current and expected future interest rates, the lengthof time the cost basis has exceeded the fair value and the severity of the impairment measured as theratio of fair value to amortized cost, and includes all investment securities for which we have issuer-specific concerns regardless of quantitative factors. After a full review of all investment securities,taking into consideration current economic conditions, adverse situations that might affect our ability tofully collect interest and principal, the timing of future payments, the credit quality and performance ofthe underlying collateral of asset-backed securities, and other relevant factors, management considersthe aggregate decline in fair value and the resulting gross unrealized losses of $1.40 billion on2,702 securities at December 31, 2007 to be temporary. The losses are not considered to be the resultof any material changes in the credit characteristics of the investment securities. Management has theability and the intent to hold the securities until recovery in market value.
Gross gains and losses realized from sales of available-for-sale securities were as follows for theyears indicated:
2007 2006 2005(In millions)
Gross gains . . . . . . . . . . . . . . . . . . . . . . . . . . . . . . . . . . . . . . . . . . . . . . . . . . . . . $24 $33 $ 9Gross losses . . . . . . . . . . . . . . . . . . . . . . . . . . . . . . . . . . . . . . . . . . . . . . . . . . . . . 17 18 10
Net gains (losses) . . . . . . . . . . . . . . . . . . . . . . . . . . . . . . . . . . . . . . . . . . . . . . . . . $ 7 $15 $(1)
93
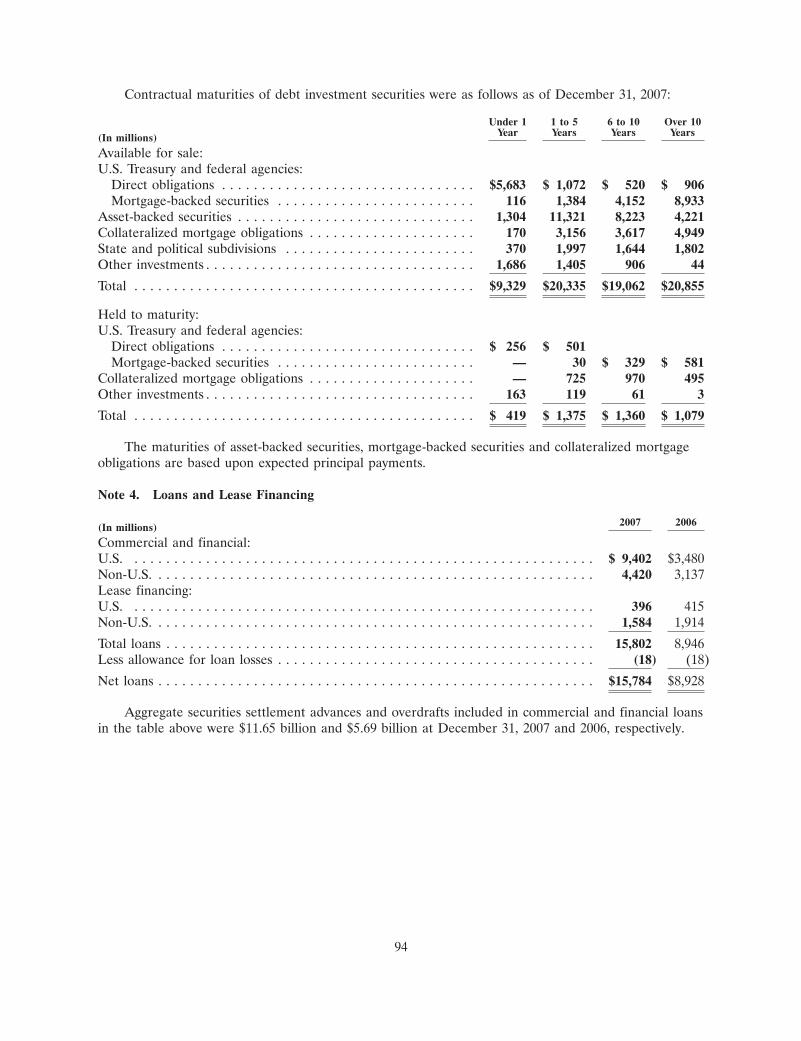
Contractual maturities of debt investment securities were as follows as of December 31, 2007:
Under 1 1 to 5 6 to 10 Over 10Year Years Years Years(In millions)
Available for sale:U.S. Treasury and federal agencies:
Direct obligations . . . . . . . . . . . . . . . . . . . . . . . . . . . . . . . . $5,683 $ 1,072 $ 520 $ 906Mortgage-backed securities . . . . . . . . . . . . . . . . . . . . . . . . . 116 1,384 4,152 8,933
Asset-backed securities . . . . . . . . . . . . . . . . . . . . . . . . . . . . . . 1,304 11,321 8,223 4,221Collateralized mortgage obligations . . . . . . . . . . . . . . . . . . . . . 170 3,156 3,617 4,949State and political subdivisions . . . . . . . . . . . . . . . . . . . . . . . . 370 1,997 1,644 1,802Other investments . . . . . . . . . . . . . . . . . . . . . . . . . . . . . . . . . . 1,686 1,405 906 44
Total . . . . . . . . . . . . . . . . . . . . . . . . . . . . . . . . . . . . . . . . . . . $9,329 $20,335 $19,062 $20,855
Held to maturity:U.S. Treasury and federal agencies:
Direct obligations . . . . . . . . . . . . . . . . . . . . . . . . . . . . . . . . $ 256 $ 501Mortgage-backed securities . . . . . . . . . . . . . . . . . . . . . . . . . — 30 $ 329 $ 581
Collateralized mortgage obligations . . . . . . . . . . . . . . . . . . . . . — 725 970 495Other investments . . . . . . . . . . . . . . . . . . . . . . . . . . . . . . . . . . 163 119 61 3
Total . . . . . . . . . . . . . . . . . . . . . . . . . . . . . . . . . . . . . . . . . . . $ 419 $ 1,375 $ 1,360 $ 1,079
The maturities of asset-backed securities, mortgage-backed securities and collateralized mortgageobligations are based upon expected principal payments.
Note 4. Loans and Lease Financing
2007 2006(In millions)
Commercial and financial:U.S. . . . . . . . . . . . . . . . . . . . . . . . . . . . . . . . . . . . . . . . . . . . . . . . . . . . . . . . . . . $ 9,402 $3,480Non-U.S. . . . . . . . . . . . . . . . . . . . . . . . . . . . . . . . . . . . . . . . . . . . . . . . . . . . . . . . 4,420 3,137Lease financing:U.S. . . . . . . . . . . . . . . . . . . . . . . . . . . . . . . . . . . . . . . . . . . . . . . . . . . . . . . . . . . 396 415Non-U.S. . . . . . . . . . . . . . . . . . . . . . . . . . . . . . . . . . . . . . . . . . . . . . . . . . . . . . . . 1,584 1,914
Total loans . . . . . . . . . . . . . . . . . . . . . . . . . . . . . . . . . . . . . . . . . . . . . . . . . . . . . . 15,802 8,946Less allowance for loan losses . . . . . . . . . . . . . . . . . . . . . . . . . . . . . . . . . . . . . . . . (18) (18)
Net loans . . . . . . . . . . . . . . . . . . . . . . . . . . . . . . . . . . . . . . . . . . . . . . . . . . . . . . . $15,784 $8,928
Aggregate securities settlement advances and overdrafts included in commercial and financial loansin the table above were $11.65 billion and $5.69 billion at December 31, 2007 and 2006, respectively.
94
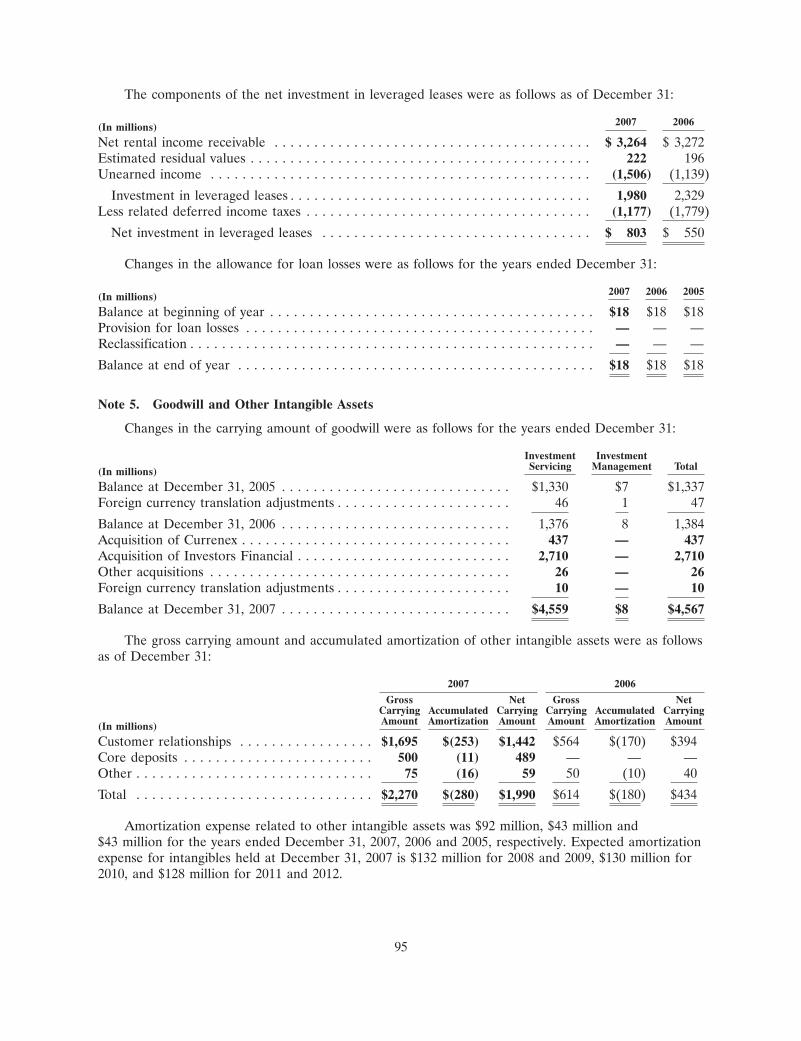
The components of the net investment in leveraged leases were as follows as of December 31:
2007 2006(In millions)
Net rental income receivable . . . . . . . . . . . . . . . . . . . . . . . . . . . . . . . . . . . . . . . . $ 3,264 $ 3,272Estimated residual values . . . . . . . . . . . . . . . . . . . . . . . . . . . . . . . . . . . . . . . . . . . 222 196Unearned income . . . . . . . . . . . . . . . . . . . . . . . . . . . . . . . . . . . . . . . . . . . . . . . . (1,506) (1,139)
Investment in leveraged leases . . . . . . . . . . . . . . . . . . . . . . . . . . . . . . . . . . . . . . 1,980 2,329Less related deferred income taxes . . . . . . . . . . . . . . . . . . . . . . . . . . . . . . . . . . . . (1,177) (1,779)
Net investment in leveraged leases . . . . . . . . . . . . . . . . . . . . . . . . . . . . . . . . . . $ 803 $ 550
Changes in the allowance for loan losses were as follows for the years ended December 31:
2007 2006 2005(In millions)
Balance at beginning of year . . . . . . . . . . . . . . . . . . . . . . . . . . . . . . . . . . . . . . . . . $18 $18 $18Provision for loan losses . . . . . . . . . . . . . . . . . . . . . . . . . . . . . . . . . . . . . . . . . . . . — — —Reclassification . . . . . . . . . . . . . . . . . . . . . . . . . . . . . . . . . . . . . . . . . . . . . . . . . . . — — —
Balance at end of year . . . . . . . . . . . . . . . . . . . . . . . . . . . . . . . . . . . . . . . . . . . . . $18 $18 $18
Note 5. Goodwill and Other Intangible Assets
Changes in the carrying amount of goodwill were as follows for the years ended December 31:
Investment InvestmentServicing Management Total(In millions)
Balance at December 31, 2005 . . . . . . . . . . . . . . . . . . . . . . . . . . . . . $1,330 $7 $1,337Foreign currency translation adjustments . . . . . . . . . . . . . . . . . . . . . . 46 1 47
Balance at December 31, 2006 . . . . . . . . . . . . . . . . . . . . . . . . . . . . . 1,376 8 1,384Acquisition of Currenex . . . . . . . . . . . . . . . . . . . . . . . . . . . . . . . . . . 437 — 437Acquisition of Investors Financial . . . . . . . . . . . . . . . . . . . . . . . . . . . 2,710 — 2,710Other acquisitions . . . . . . . . . . . . . . . . . . . . . . . . . . . . . . . . . . . . . . 26 — 26Foreign currency translation adjustments . . . . . . . . . . . . . . . . . . . . . . 10 — 10
Balance at December 31, 2007 . . . . . . . . . . . . . . . . . . . . . . . . . . . . . $4,559 $8 $4,567
The gross carrying amount and accumulated amortization of other intangible assets were as followsas of December 31:
2007 2006
Gross Net Gross NetCarrying Accumulated Carrying Carrying Accumulated CarryingAmount Amortization Amount Amount Amortization Amount(In millions)
Customer relationships . . . . . . . . . . . . . . . . . $1,695 $(253) $1,442 $564 $(170) $394Core deposits . . . . . . . . . . . . . . . . . . . . . . . . 500 (11) 489 — — —Other . . . . . . . . . . . . . . . . . . . . . . . . . . . . . . 75 (16) 59 50 (10) 40
Total . . . . . . . . . . . . . . . . . . . . . . . . . . . . . . $2,270 $(280) $1,990 $614 $(180) $434
Amortization expense related to other intangible assets was $92 million, $43 million and$43 million for the years ended December 31, 2007, 2006 and 2005, respectively. Expected amortizationexpense for intangibles held at December 31, 2007 is $132 million for 2008 and 2009, $130 million for2010, and $128 million for 2011 and 2012.
95
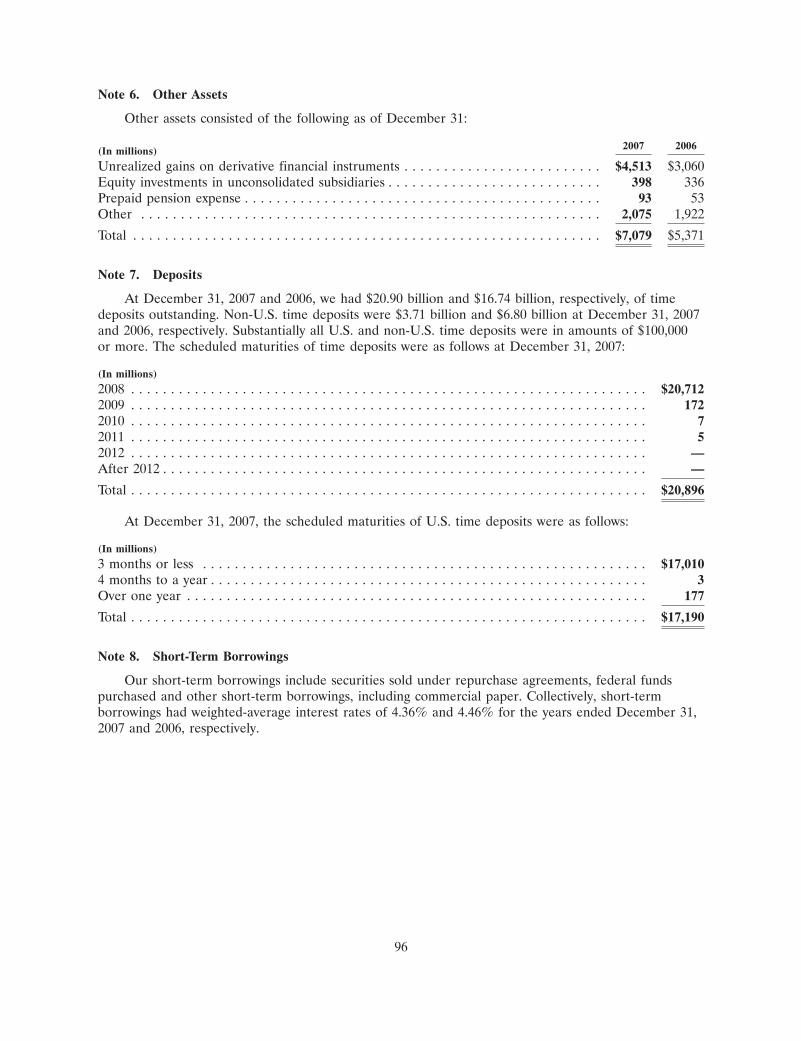
Note 6. Other Assets
Other assets consisted of the following as of December 31:
2007 2006(In millions)
Unrealized gains on derivative financial instruments . . . . . . . . . . . . . . . . . . . . . . . . . $4,513 $3,060Equity investments in unconsolidated subsidiaries . . . . . . . . . . . . . . . . . . . . . . . . . . . 398 336Prepaid pension expense . . . . . . . . . . . . . . . . . . . . . . . . . . . . . . . . . . . . . . . . . . . . . 93 53Other . . . . . . . . . . . . . . . . . . . . . . . . . . . . . . . . . . . . . . . . . . . . . . . . . . . . . . . . . . 2,075 1,922
Total . . . . . . . . . . . . . . . . . . . . . . . . . . . . . . . . . . . . . . . . . . . . . . . . . . . . . . . . . . . $7,079 $5,371
Note 7. Deposits
At December 31, 2007 and 2006, we had $20.90 billion and $16.74 billion, respectively, of timedeposits outstanding. Non-U.S. time deposits were $3.71 billion and $6.80 billion at December 31, 2007and 2006, respectively. Substantially all U.S. and non-U.S. time deposits were in amounts of $100,000or more. The scheduled maturities of time deposits were as follows at December 31, 2007:
(In millions)
2008 . . . . . . . . . . . . . . . . . . . . . . . . . . . . . . . . . . . . . . . . . . . . . . . . . . . . . . . . . . . . . . . . . $20,7122009 . . . . . . . . . . . . . . . . . . . . . . . . . . . . . . . . . . . . . . . . . . . . . . . . . . . . . . . . . . . . . . . . . 1722010 . . . . . . . . . . . . . . . . . . . . . . . . . . . . . . . . . . . . . . . . . . . . . . . . . . . . . . . . . . . . . . . . . 72011 . . . . . . . . . . . . . . . . . . . . . . . . . . . . . . . . . . . . . . . . . . . . . . . . . . . . . . . . . . . . . . . . . 52012 . . . . . . . . . . . . . . . . . . . . . . . . . . . . . . . . . . . . . . . . . . . . . . . . . . . . . . . . . . . . . . . . . —After 2012 . . . . . . . . . . . . . . . . . . . . . . . . . . . . . . . . . . . . . . . . . . . . . . . . . . . . . . . . . . . . . —
Total . . . . . . . . . . . . . . . . . . . . . . . . . . . . . . . . . . . . . . . . . . . . . . . . . . . . . . . . . . . . . . . . . $20,896
At December 31, 2007, the scheduled maturities of U.S. time deposits were as follows:
(In millions)
3 months or less . . . . . . . . . . . . . . . . . . . . . . . . . . . . . . . . . . . . . . . . . . . . . . . . . . . . . . . . $17,0104 months to a year . . . . . . . . . . . . . . . . . . . . . . . . . . . . . . . . . . . . . . . . . . . . . . . . . . . . . . . 3Over one year . . . . . . . . . . . . . . . . . . . . . . . . . . . . . . . . . . . . . . . . . . . . . . . . . . . . . . . . . . 177
Total . . . . . . . . . . . . . . . . . . . . . . . . . . . . . . . . . . . . . . . . . . . . . . . . . . . . . . . . . . . . . . . . . $17,190
Note 8. Short-Term Borrowings
Our short-term borrowings include securities sold under repurchase agreements, federal fundspurchased and other short-term borrowings, including commercial paper. Collectively, short-termborrowings had weighted-average interest rates of 4.36% and 4.46% for the years ended December 31,2007 and 2006, respectively.
96
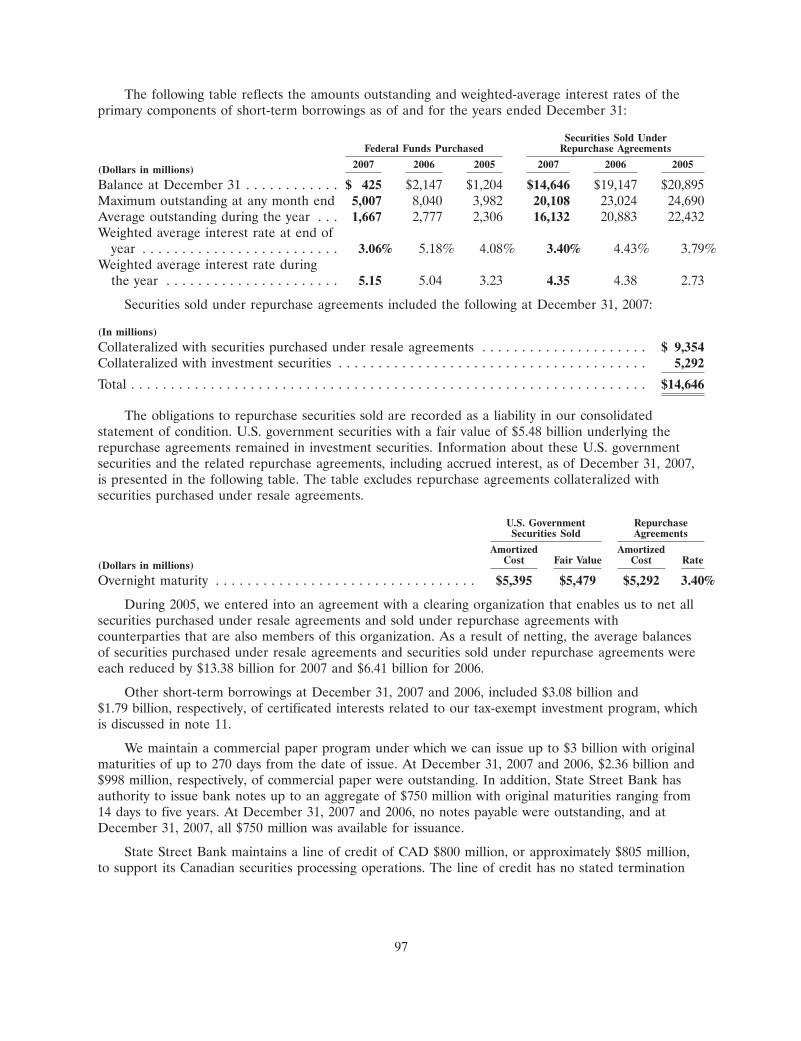
The following table reflects the amounts outstanding and weighted-average interest rates of theprimary components of short-term borrowings as of and for the years ended December 31:
Securities Sold UnderFederal Funds Purchased Repurchase Agreements
2007 2006 2005 2007 2006 2005(Dollars in millions)
Balance at December 31 . . . . . . . . . . . . $ 425 $2,147 $1,204 $14,646 $19,147 $20,895Maximum outstanding at any month end 5,007 8,040 3,982 20,108 23,024 24,690Average outstanding during the year . . . 1,667 2,777 2,306 16,132 20,883 22,432Weighted average interest rate at end of
year . . . . . . . . . . . . . . . . . . . . . . . . . 3.06% 5.18% 4.08% 3.40% 4.43% 3.79%Weighted average interest rate during
the year . . . . . . . . . . . . . . . . . . . . . . 5.15 5.04 3.23 4.35 4.38 2.73
Securities sold under repurchase agreements included the following at December 31, 2007:
(In millions)
Collateralized with securities purchased under resale agreements . . . . . . . . . . . . . . . . . . . . . $ 9,354Collateralized with investment securities . . . . . . . . . . . . . . . . . . . . . . . . . . . . . . . . . . . . . . . 5,292
Total . . . . . . . . . . . . . . . . . . . . . . . . . . . . . . . . . . . . . . . . . . . . . . . . . . . . . . . . . . . . . . . . . $14,646
The obligations to repurchase securities sold are recorded as a liability in our consolidatedstatement of condition. U.S. government securities with a fair value of $5.48 billion underlying therepurchase agreements remained in investment securities. Information about these U.S. governmentsecurities and the related repurchase agreements, including accrued interest, as of December 31, 2007,is presented in the following table. The table excludes repurchase agreements collateralized withsecurities purchased under resale agreements.
U.S. Government RepurchaseSecurities Sold Agreements
Amortized AmortizedCost Fair Value Cost Rate(Dollars in millions)
Overnight maturity . . . . . . . . . . . . . . . . . . . . . . . . . . . . . . . . . $5,395 $5,479 $5,292 3.40%
During 2005, we entered into an agreement with a clearing organization that enables us to net allsecurities purchased under resale agreements and sold under repurchase agreements withcounterparties that are also members of this organization. As a result of netting, the average balancesof securities purchased under resale agreements and securities sold under repurchase agreements wereeach reduced by $13.38 billion for 2007 and $6.41 billion for 2006.
Other short-term borrowings at December 31, 2007 and 2006, included $3.08 billion and$1.79 billion, respectively, of certificated interests related to our tax-exempt investment program, whichis discussed in note 11.
We maintain a commercial paper program under which we can issue up to $3 billion with originalmaturities of up to 270 days from the date of issue. At December 31, 2007 and 2006, $2.36 billion and$998 million, respectively, of commercial paper were outstanding. In addition, State Street Bank hasauthority to issue bank notes up to an aggregate of $750 million with original maturities ranging from14 days to five years. At December 31, 2007 and 2006, no notes payable were outstanding, and atDecember 31, 2007, all $750 million was available for issuance.
State Street Bank maintains a line of credit of CAD $800 million, or approximately $805 million,to support its Canadian securities processing operations. The line of credit has no stated termination
97
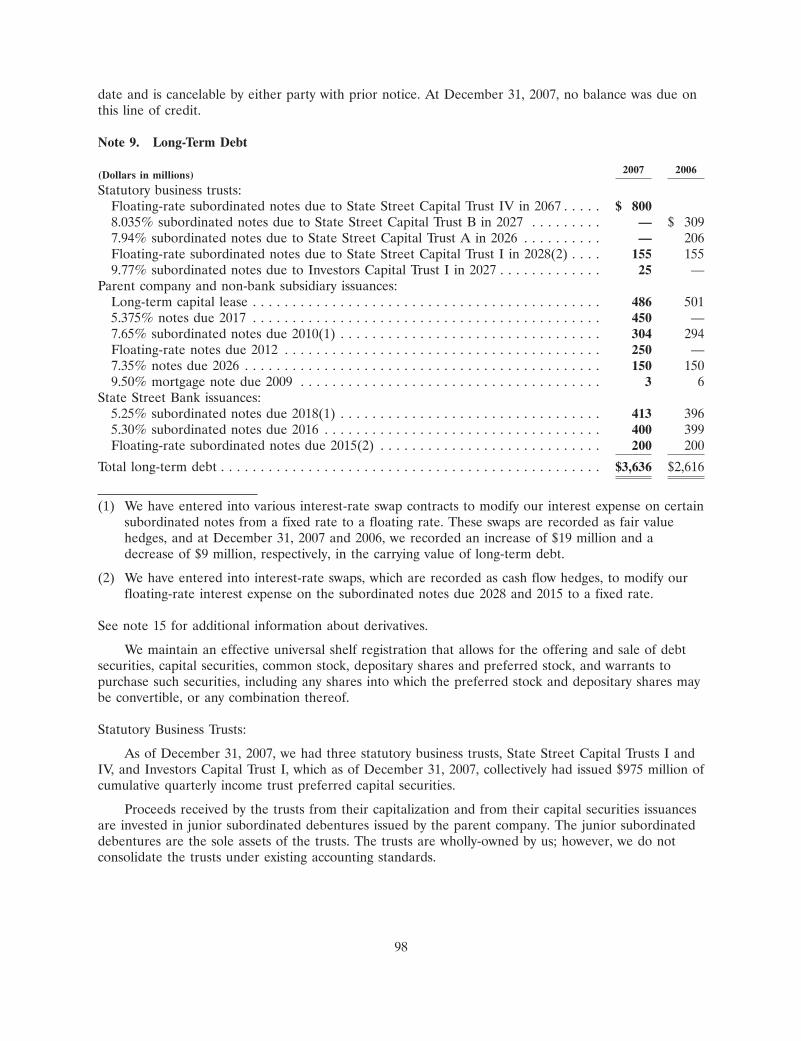
date and is cancelable by either party with prior notice. At December 31, 2007, no balance was due onthis line of credit.
Note 9. Long-Term Debt
2007 2006(Dollars in millions)
Statutory business trusts:Floating-rate subordinated notes due to State Street Capital Trust IV in 2067 . . . . . $ 8008.035% subordinated notes due to State Street Capital Trust B in 2027 . . . . . . . . . — $ 3097.94% subordinated notes due to State Street Capital Trust A in 2026 . . . . . . . . . . — 206Floating-rate subordinated notes due to State Street Capital Trust I in 2028(2) . . . . 155 1559.77% subordinated notes due to Investors Capital Trust I in 2027 . . . . . . . . . . . . . 25 —
Parent company and non-bank subsidiary issuances:Long-term capital lease . . . . . . . . . . . . . . . . . . . . . . . . . . . . . . . . . . . . . . . . . . . . 486 5015.375% notes due 2017 . . . . . . . . . . . . . . . . . . . . . . . . . . . . . . . . . . . . . . . . . . . . 450 —7.65% subordinated notes due 2010(1) . . . . . . . . . . . . . . . . . . . . . . . . . . . . . . . . . 304 294Floating-rate notes due 2012 . . . . . . . . . . . . . . . . . . . . . . . . . . . . . . . . . . . . . . . . 250 —7.35% notes due 2026 . . . . . . . . . . . . . . . . . . . . . . . . . . . . . . . . . . . . . . . . . . . . . 150 1509.50% mortgage note due 2009 . . . . . . . . . . . . . . . . . . . . . . . . . . . . . . . . . . . . . . 3 6
State Street Bank issuances:5.25% subordinated notes due 2018(1) . . . . . . . . . . . . . . . . . . . . . . . . . . . . . . . . . 413 3965.30% subordinated notes due 2016 . . . . . . . . . . . . . . . . . . . . . . . . . . . . . . . . . . . 400 399Floating-rate subordinated notes due 2015(2) . . . . . . . . . . . . . . . . . . . . . . . . . . . . 200 200
Total long-term debt . . . . . . . . . . . . . . . . . . . . . . . . . . . . . . . . . . . . . . . . . . . . . . . . $3,636 $2,616
(1) We have entered into various interest-rate swap contracts to modify our interest expense on certainsubordinated notes from a fixed rate to a floating rate. These swaps are recorded as fair valuehedges, and at December 31, 2007 and 2006, we recorded an increase of $19 million and adecrease of $9 million, respectively, in the carrying value of long-term debt.
(2) We have entered into interest-rate swaps, which are recorded as cash flow hedges, to modify ourfloating-rate interest expense on the subordinated notes due 2028 and 2015 to a fixed rate.
See note 15 for additional information about derivatives.
We maintain an effective universal shelf registration that allows for the offering and sale of debtsecurities, capital securities, common stock, depositary shares and preferred stock, and warrants topurchase such securities, including any shares into which the preferred stock and depositary shares maybe convertible, or any combination thereof.
Statutory Business Trusts:
As of December 31, 2007, we had three statutory business trusts, State Street Capital Trusts I andIV, and Investors Capital Trust I, which as of December 31, 2007, collectively had issued $975 million ofcumulative quarterly income trust preferred capital securities.
Proceeds received by the trusts from their capitalization and from their capital securities issuancesare invested in junior subordinated debentures issued by the parent company. The junior subordinateddebentures are the sole assets of the trusts. The trusts are wholly-owned by us; however, we do notconsolidate the trusts under existing accounting standards.
98
Payments made by the trusts on the capital securities are dependent on our payments made to thetrusts on the junior subordinated debentures. Our fulfillment of these commitments has the effect ofproviding a full, irrevocable and unconditional guarantee of the trusts’ obligations under the capitalsecurities. While the capital securities issued by the trusts are not recorded in our consolidatedstatement of condition, the junior subordinated debentures qualify for inclusion in tier 1 regulatorycapital under federal regulatory capital guidelines. Information about restrictions on our ability toobtain funds from our subsidiary banks is in note 14.
Interest paid on the debentures is recorded in interest expense. Distributions on the capitalsecurities are payable from interest payments received on the debentures and are due quarterly byState Street Capital Trusts I and IV, subject to deferral for up to five years under certain conditions.The capital securities are subject to mandatory redemption in whole at the stated maturity uponrepayment of the debentures, with an option by us to redeem the debentures at any time upon theoccurrence of certain tax events or changes to tax treatment, investment company regulation or capitaltreatment; or at any time after May 15, 2008 for the Capital Trust I securities and any time afterJune 15, 2012 for the Capital Trust IV securities. Redemptions are subject to federal regulatoryapproval.
In April 2007, State Street Capital Trust IV, a Delaware statutory trust wholly owned by the parentcompany, issued $800 million in aggregate liquidation amount of floating-rate capital securities andused the proceeds to purchase a like amount of floating-rate junior subordinated debentures from theparent company. The capital securities represent an undivided preferred beneficial interest in thosejunior subordinated debentures, which are the only assets of the trust. The junior subordinateddebentures have an initial scheduled maturity in June 2037 and an initial final repayment date in June2067, each of which we may extend by ten years in specified circumstances. In accordance with existingaccounting standards, we did not record the trust in our consolidated financial statements. The juniorsubordinated debentures qualify for inclusion in tier 1 regulatory capital.
In connection with the issuance of the junior subordinated debentures, the parent companyentered into a replacement capital covenant in which it agreed, for the benefit of the holders of itsjunior subordinated debentures due 2028 underlying the floating-rate capital securities issued by StateStreet Capital Trust I, that it will not repay, redeem or repurchase, and that none of its subsidiaries willpurchase, any part of the newly issued debentures or the floating-rate capital securities on or beforeJune 1, 2047, unless the repayment, redemption or repurchase is made from the net cash proceeds ofthe issuance of certain qualified securities and pursuant to the other terms and conditions set forth inthe covenant.
In July 2007, we redeemed an aggregate of $500 million of unsecured junior subordinateddebentures issued by the parent company to two of our statutory business trusts, State Street CapitalTrusts A and B, composed of $200 million of 7.94% debentures issued in 1996 and $300 million of8.035% debentures issued in 1997. We paid the trusts the outstanding amount on the debentures plusaccrued interest and an aggregate redemption premium of approximately $20 million. This redemptionpremium was included in the merger and integration costs which were recorded during the second halfof 2007 in connection with the Investors Financial acquisition.
In July 2007, the trusts, consistent with the terms of their applicable governing documents,redeemed their respective outstanding capital securities, with an aggregate liquidation amount of$500 million, corresponding to the debentures. The trusts paid to the holders of the outstanding capitalsecurities the same amount that was paid by the parent company to the trusts to redeem thedebentures.
In January 2008, State Street Capital Trust III, a Delaware statutory trust wholly owned by theparent company, issued $500 million in aggregate liquidation amount of 8.250% fixed-to-floating ratenormal automatic preferred enhanced capital securities, referred to as ‘‘normal APEX,’’ and used the
99
proceeds to purchase a like amount of remarketable 6.001% junior subordinated debentures due 2042from the parent company. In addition, the trust entered into stock purchase contracts with the parentcompany under which the trust agrees to purchase, and the parent company agrees to sell, on the stockpurchase date, a like amount in aggregate liquidation amount of the parent company’s non-cumulativeperpetual preferred stock, series A, $100,000 liquidation preference per share. State Street will makecontract payments to the trust at an annual rate of 2.249% of the stated amount of $100,000 per stockpurchase contract. The normal APEX are beneficial interests in the trust. The trust will pass through,as distributions on or the redemption price of normal APEX, amounts that it receives on its assets thatare the corresponding assets for the normal APEX. The corresponding assets for each normal APEX,$1,000 liquidation amount, initially are $1,000 principal amount of the 6.001% junior subordinateddebentures and a 1/100th, or a $1,000, interest in a stock purchase contract for the purchase and sale ofone share of the Series A preferred stock for $100,000. The stock purchase date is expected to beMarch 15, 2011, but it may occur on an earlier date or as late as March 15, 2012. From and after thestock purchase date, the corresponding asset for each normal APEX will be a 1/100th, or a $1,000,interest in one share of the Series A preferred stock. In accordance with existing accounting standards,we did not record the trust in our consolidated financial statements. The junior subordinateddebentures qualify for inclusion in tier 1 regulatory capital.
Parent Company and Non-Bank Subsidiary Issuances:
At December 31, 2007 and 2006, $486 million and $501 million, respectively, were included inlong-term debt related to the capital leases for One Lincoln Street and the One Lincoln Street parkinggarage. See note 18 for additional information. The 7.65% subordinated notes due 2010 qualify astier 2 regulatory capital under federal regulatory capital guidelines. The 7.35% notes are unsecured.The 9.50% mortgage note was fully collateralized by property at December 31, 2005. The scheduledprincipal payments for the next two years are $3 million for 2008 and less than $1 million for 2009, atwhich time the debt will be entirely paid off.
In April 2007, the parent company issued $700 million of senior debt, consisting of $250 million offloating-rate notes due in 2012 and $450 million of 5.375% notes due in 2017. Interest on thefloating-rate notes will be paid quarterly, and on the 5.375% notes will be paid semi-annually. Neitherthe floating-rate notes nor the 5.375% notes may be redeemed prior to maturity. Both the floating-ratenotes and the 5.375% notes are unsecured.
State Street Bank Issuances:
State Street Bank has authority to issue up to an aggregate of $1 billion of subordinated fixed-rate,floating-rate or zero-coupon bank notes with a maturity of five to fifteen years. With respect to the5.25% subordinated bank notes due 2018, State Street Bank is required to make semi-annual interestpayments on the outstanding principal balance of the notes on April 15 and October 15 of each year,and the notes qualify for inclusion in tier 2 regulatory capital.
With respect to the 5.30% subordinated notes due 2016 and the floating-rate subordinated notesdue 2015, State Street Bank is required to make semi-annual interest payments on the outstandingprincipal balance of the 5.30% notes on January 15 and July 15 of each year beginning in July 2006,and quarterly interest payments on the outstanding principal balance of the floating-rate notes onMarch 8, June 8, September 8 and December 8 of each year beginning in March 2006. The notesqualify for inclusion in tier 2 regulatory capital.
100
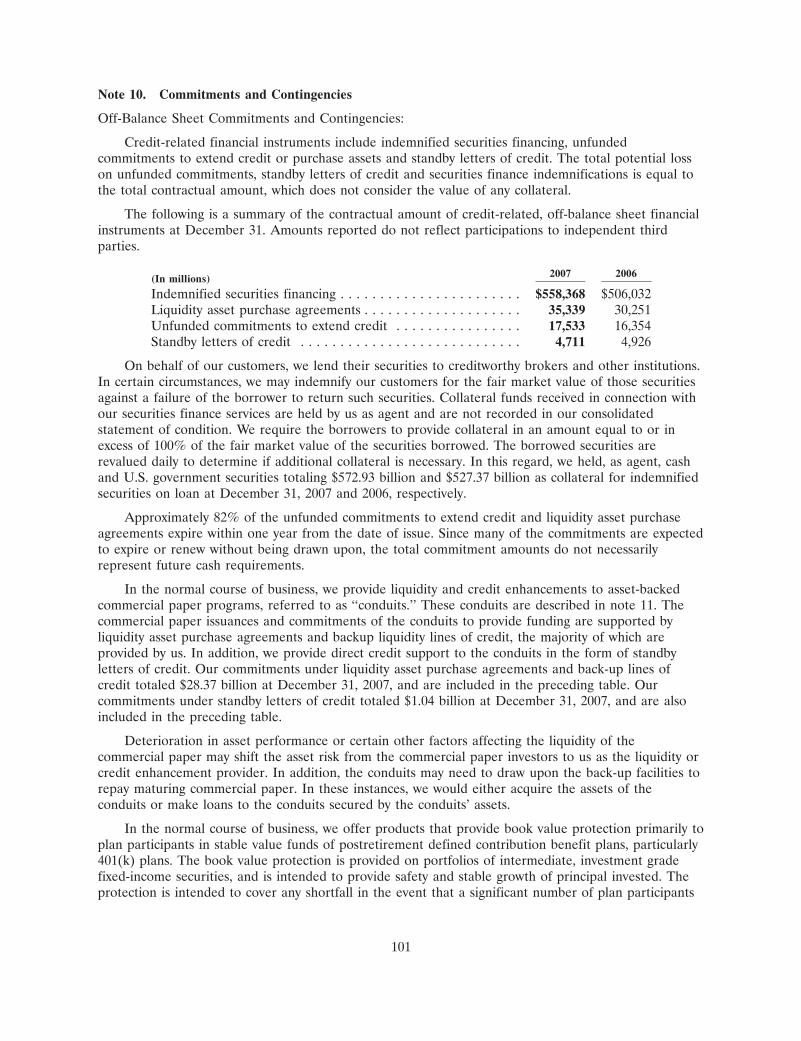
Note 10. Commitments and Contingencies
Off-Balance Sheet Commitments and Contingencies:
Credit-related financial instruments include indemnified securities financing, unfundedcommitments to extend credit or purchase assets and standby letters of credit. The total potential losson unfunded commitments, standby letters of credit and securities finance indemnifications is equal tothe total contractual amount, which does not consider the value of any collateral.
The following is a summary of the contractual amount of credit-related, off-balance sheet financialinstruments at December 31. Amounts reported do not reflect participations to independent thirdparties.
2007 2006(In millions)
Indemnified securities financing . . . . . . . . . . . . . . . . . . . . . . . $558,368 $506,032Liquidity asset purchase agreements . . . . . . . . . . . . . . . . . . . . 35,339 30,251Unfunded commitments to extend credit . . . . . . . . . . . . . . . . 17,533 16,354Standby letters of credit . . . . . . . . . . . . . . . . . . . . . . . . . . . . 4,711 4,926
On behalf of our customers, we lend their securities to creditworthy brokers and other institutions.In certain circumstances, we may indemnify our customers for the fair market value of those securitiesagainst a failure of the borrower to return such securities. Collateral funds received in connection withour securities finance services are held by us as agent and are not recorded in our consolidatedstatement of condition. We require the borrowers to provide collateral in an amount equal to or inexcess of 100% of the fair market value of the securities borrowed. The borrowed securities arerevalued daily to determine if additional collateral is necessary. In this regard, we held, as agent, cashand U.S. government securities totaling $572.93 billion and $527.37 billion as collateral for indemnifiedsecurities on loan at December 31, 2007 and 2006, respectively.
Approximately 82% of the unfunded commitments to extend credit and liquidity asset purchaseagreements expire within one year from the date of issue. Since many of the commitments are expectedto expire or renew without being drawn upon, the total commitment amounts do not necessarilyrepresent future cash requirements.
In the normal course of business, we provide liquidity and credit enhancements to asset-backedcommercial paper programs, referred to as ‘‘conduits.’’ These conduits are described in note 11. Thecommercial paper issuances and commitments of the conduits to provide funding are supported byliquidity asset purchase agreements and backup liquidity lines of credit, the majority of which areprovided by us. In addition, we provide direct credit support to the conduits in the form of standbyletters of credit. Our commitments under liquidity asset purchase agreements and back-up lines ofcredit totaled $28.37 billion at December 31, 2007, and are included in the preceding table. Ourcommitments under standby letters of credit totaled $1.04 billion at December 31, 2007, and are alsoincluded in the preceding table.
Deterioration in asset performance or certain other factors affecting the liquidity of thecommercial paper may shift the asset risk from the commercial paper investors to us as the liquidity orcredit enhancement provider. In addition, the conduits may need to draw upon the back-up facilities torepay maturing commercial paper. In these instances, we would either acquire the assets of theconduits or make loans to the conduits secured by the conduits’ assets.
In the normal course of business, we offer products that provide book value protection primarily toplan participants in stable value funds of postretirement defined contribution benefit plans, particularly401(k) plans. The book value protection is provided on portfolios of intermediate, investment gradefixed-income securities, and is intended to provide safety and stable growth of principal invested. Theprotection is intended to cover any shortfall in the event that a significant number of plan participants
101
withdraw funds when book value exceeds market value and the liquidation of the assets is not sufficientto redeem the participants. To manage our exposure, we impose significant restrictions and constraintson the timing and cause of the withdrawals, the manner in which the portfolio is liquidated and thefunds are accessed, and the investment parameters of the underlying portfolio. These constraints,combined with structural protections, are designed to provide adequate cushion and guard againstpayments even under extreme stress scenarios. As of December 31, 2007 and 2006, the notional amountof these guarantees totaled $44.99 billion and $38.37 billion, respectively. As of December 31, 2007, wehave not made a payment under these products, and management believes that the probability ofpayment under these guarantees is remote.
In the normal course of business, we hold assets under custody and management in a custodial orfiduciary capacity. Management conducts regular reviews of its responsibilities in this regard andconsiders the results in preparing the consolidated financial statements. In this regard, in the opinion ofmanagement, no contingent liabilities existed at December 31, 2007, that would have had a materialadverse effect on State Street’s consolidated financial position or results of operations.
Legal Proceedings:
Several customers have filed litigation claims against us, some of which are putative class actionspurportedly on behalf of customers invested in certain of State Street Global Advisors’, or ‘‘SSgA’s’’,active fixed-income strategies. These claims related to investment losses in one or more of SSgA’sstrategies that included sub-prime investments. In December 2007, we established a reserve ofapproximately $625 million to address legal exposure associated with the under-performance of certainactive fixed-income strategies managed by SSgA and customer concerns as to whether the execution ofthese strategies was consistent with the customers’ investment intent. These strategies were adverselyimpacted by exposure to, and the lack of liquidity in, sub-prime mortgage markets that resulted fromthe disruption in the global securities markets during the second half of 2007. After payments forsettlement agreements, the reserve totaled approximately $609 million at December 31, 2007.
We are involved in various industry-related and other regulatory, governmental and lawenforcement inquiries and subpoenas, as well as legal proceedings including the proceedings related toSSgA’s active fixed-income strategies referenced above, that arise in the normal course of business. Inthe opinion of management, after discussion with counsel, these regulatory, governmental and lawenforcement inquiries and subpoenas and legal proceedings can be defended or resolved without amaterial adverse effect on our consolidated financial position or results of operations in future periods.
Tax Contingencies:
In the normal course of business, we are subject to challenges from U.S. and non-U.S. income taxauthorities regarding the amount of taxes due. These challenges may result in adjustments to the timingor amount of taxable income or deductions or the allocation of income among tax jurisdictions.
As a result of its review of our 1997 - 1999 income tax returns, the IRS proposed to disallow taxlosses resulting from leveraged leases known as lease-in, lease-out, or LILO, transactions. We appealedthe disallowance and finalized a settlement with the IRS during the fourth quarter of 2007. We hadsufficient reserves to cover the final settlement agreement.
Currently, the IRS is reviewing our 2000 - 2003 income tax returns. During those years, we enteredinto leveraged leases known as sale-in, lease-out, or SILO, transactions, which the IRS has sinceclassified as tax shelters. The IRS has proposed to disallow tax losses resulting from these leases. Webelieve that we reported the tax effects of all SILO lease transactions properly based upon applicablestatutes, regulations and case law in effect at the time we entered into them, and we expect to appealthe disallowance.
102
While it is unclear whether we will be able to reach an acceptable resolution with the IRS,management believes we are sufficiently accrued as of December 31, 2007 for tax exposures, includingexposures related to SILO transactions, and related interest expense. In future periods, if managementrevises its evaluation of this tax position, the effect of the revision will be recorded in income taxexpense in that period. In note 20, information is provided with respect to our application of theprovisions of FASB Interpretation No. 48, Accounting for Uncertainty in Income Taxes, to tax positionsfor certain of our leveraged leases for which the timing of our tax deductions is uncertain.
Note 11. Securitizations and Variable Interest Entities
Tax-Exempt Investment Programs:
In the normal course of business, we structure and sell certificated interests in pools of tax-exemptinvestment-grade assets, principally to our mutual fund customers. We structure these pools aspartnership trusts, and the trusts are recorded in our consolidated statement of condition as municipalsecurities available for sale and related short-term borrowings. We may also provide liquidity andre-marketing services to the trusts.
We transfer assets to the trusts from our investment securities portfolio at adjusted book value,and the trusts finance the acquisition of these assets by selling certificated interests issued by the truststo third-party investors and to State Street as residual holder. These transfers do not meet thede-recognition criteria of SFAS No. 140, Accounting for the Transfers and Servicing of Financial Assetsand Extinguishments of Liabilities, and therefore are recorded in our consolidated financial statements.The trusts had a weighted-average life of approximately 8.6 years at December 31, 2007, compared toapproximately 4.9 years at December 31, 2006. Under separate agreements, we provide standby bondpurchase agreements to these trusts, which obligate State Street to acquire the certificated interests atpar value in the event that the re-marketing agent is unable to place the certificated interests withinvestors. Our obligations as standby bond purchase agreement provider terminate in the event of thefollowing credit events: payment default, bankruptcy of issuer or credit enhancement provider,imposition of taxability, or downgrade of an asset held by the trust below investment grade. Ourcommitments to the trusts under these standby bond purchase agreements totaled $3.21 billion atDecember 31, 2007, none of which were utilized at period-end. In the event that our obligations underthese agreements are triggered, no material impact to our consolidated financial position or results ofoperations is expected to occur, because the bonds are already recorded at fair value in ourconsolidated statement of condition.
Asset-Backed Commercial Paper Programs:
We established our first asset-backed commercial paper program in 1992, primarily to satisfy thedemand from our institutional customers, particularly mutual fund customers, for commercial paper fortheir money market funds. Currently, we administer four third-party owned, multi-seller asset-backedcommercial paper programs, referred to as ‘‘conduits,’’ that purchase financial instruments,predominantly securities, from the capital markets. These conduits, which are structured as specialpurpose, bankruptcy-remote entities, provide our customers with short-term investment products forcash management and other investment purposes. Our relationship with the conduits is contractual. Wehold no direct or indirect equity ownership in these entities.
Under FIN 46(R), the conduits meet the definition of variable interest entities. In applying theprovisions of FIN 46(R), we apply a financial model, referred to as an ‘‘expected loss model,’’ to theactivities of the conduits to determine the primary beneficiaries of the conduits. As a result ofapplication of this model, we concluded that we were not the primary beneficiary of the conduits, asdefined by FIN 46(R), and as a result, we do not record these conduits in our consolidated financialstatements. The conduits have third-party investors who hold subordinated debt, referred to as ‘‘first-
103
loss notes,’’ issued by the conduits. These investors are in a first-loss position and bear the majority ofthe expected losses, as defined by FIN 46(R), of the conduits. We re-perform our expected loss modelat least quarterly, and more frequently if specific events occur.
During the second half of 2007, as a result of disruption in the global fixed-income securitiesmarkets, we reviewed the underlying assumptions incorporated in our FIN 46(R) expected loss model.We concluded as of December 31, 2007, that our model assumptions were appropriate and werereflective of market participant assumptions, and appropriately considered the probability of, andpotential for, the recurrence of recent events. At December 31, 2007 and December 31, 2006, totalassets in these unconsolidated conduits were $28.76 billion and $25.25 billion, respectively. Our off-balance commitments to the conduits are disclosed in note 10.
The conduit structure is not designed to distribute interest-rate and/or foreign currency risk tocommercial paper investors or the subordinated note holders. Accordingly, the conduits take measuresto mitigate these risks through the use of derivative financial instruments. These derivatives aregenerally with State Street Bank as a counterparty, and are based upon market observable rates andindices. Among the most significant derivatives are basis swaps, whereby the conduit receives its cost offunds and pays LIBOR plus a spread to State Street Bank. This structure mitigates a portion of therisk of erosion in the expected spread between the conduits’ cost of funds and the respective currencyLIBOR rate.
Collateralized Debt Obligations:
We manage a series of collateralized debt obligations, referred to as ‘‘CDOs.’’ A CDO is amanaged investment vehicle which purchases a portfolio of diversified assets. A CDO funds purchasesthrough the issuance of several tranches of debt and equity, the repayment and return of which arelinked to the performance of the assets in the CDO. Typically, our involvement is as collateral manager.We may also invest in a small percentage of the debt issued. These entities typically meet the definitionof a variable interest entity as defined by FIN 46(R). We are not the primary beneficiary of theseCDOs, as defined by FIN 46(R), and do not record these CDOs in our consolidated financialstatements. At December 31, 2007 and 2006, total assets in these CDOs were $6.73 billion and$3.48 billion, respectively. We did not acquire or transfer any investment securities to a CDO during2007 or 2006.
Note 12. Shareholders’ Equity
In March 2007, our Board of Directors authorized the purchase of up to 15 million shares ofcommon stock for general corporate purposes, including mitigating the dilutive impact of shares issuedunder employee benefit plans, in addition to its previous authorization in 2006 of up to 15 millionshares, of which 12.2 million shares remained available for purchase at December 31, 2006. Wegenerally employ third-party broker-dealers to acquire shares on the open market in connection withour stock purchase programs.
Under the above-described authorization, during 2007 we repurchased 13.4 million shares of ourcommon stock, and an additional .6 million shares in January 2008, in connection with a $1 billionaccelerated share repurchase program that concluded on January 18, 2008. As of that date,approximately 13.2 million shares remained available for future purchase under the combinedauthorization described above.
In addition, our common shares may be acquired for other deferred compensation plans, held byan external trustee, that are not part of the common stock purchase program. As of December 31,2007, on a cumulative basis, approximately 396,500 shares have been purchased and are held in trust.These shares are recorded as treasury stock in our consolidated statement of condition.
104
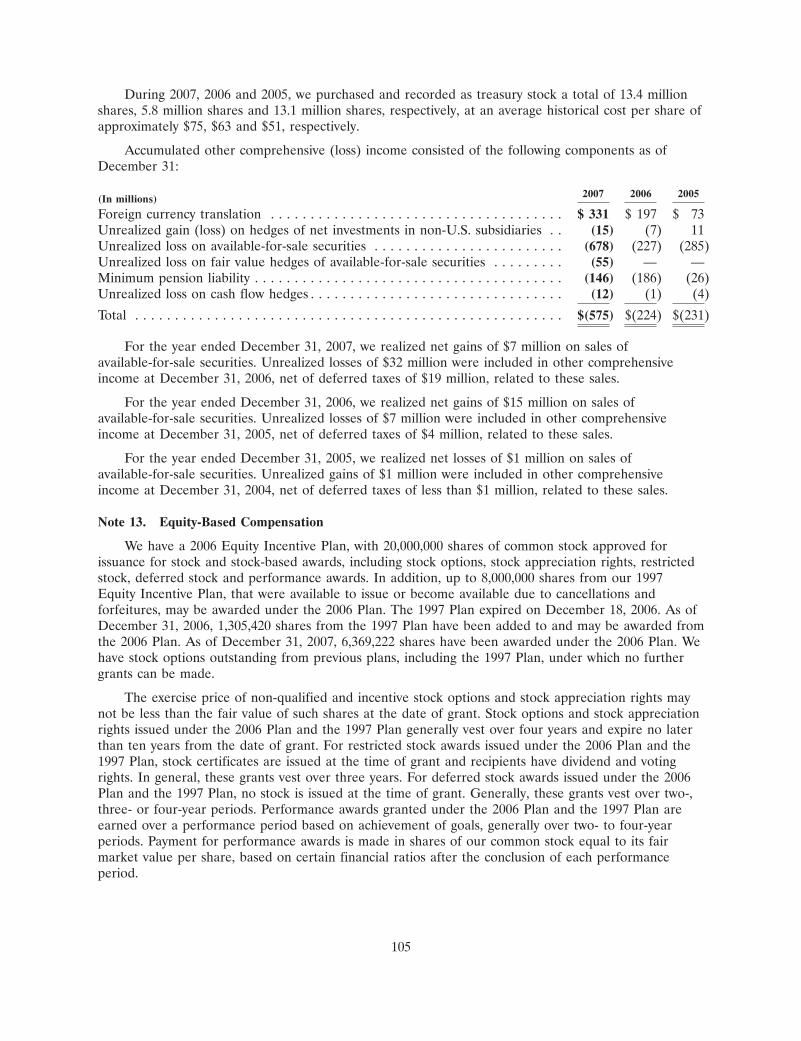
During 2007, 2006 and 2005, we purchased and recorded as treasury stock a total of 13.4 millionshares, 5.8 million shares and 13.1 million shares, respectively, at an average historical cost per share ofapproximately $75, $63 and $51, respectively.
Accumulated other comprehensive (loss) income consisted of the following components as ofDecember 31:
2007 2006 2005(In millions)
Foreign currency translation . . . . . . . . . . . . . . . . . . . . . . . . . . . . . . . . . . . . . $ 331 $ 197 $ 73Unrealized gain (loss) on hedges of net investments in non-U.S. subsidiaries . . (15) (7) 11Unrealized loss on available-for-sale securities . . . . . . . . . . . . . . . . . . . . . . . . (678) (227) (285)Unrealized loss on fair value hedges of available-for-sale securities . . . . . . . . . (55) — —Minimum pension liability . . . . . . . . . . . . . . . . . . . . . . . . . . . . . . . . . . . . . . . (146) (186) (26)Unrealized loss on cash flow hedges . . . . . . . . . . . . . . . . . . . . . . . . . . . . . . . . (12) (1) (4)
Total . . . . . . . . . . . . . . . . . . . . . . . . . . . . . . . . . . . . . . . . . . . . . . . . . . . . . . $(575) $(224) $(231)
For the year ended December 31, 2007, we realized net gains of $7 million on sales ofavailable-for-sale securities. Unrealized losses of $32 million were included in other comprehensiveincome at December 31, 2006, net of deferred taxes of $19 million, related to these sales.
For the year ended December 31, 2006, we realized net gains of $15 million on sales ofavailable-for-sale securities. Unrealized losses of $7 million were included in other comprehensiveincome at December 31, 2005, net of deferred taxes of $4 million, related to these sales.
For the year ended December 31, 2005, we realized net losses of $1 million on sales ofavailable-for-sale securities. Unrealized gains of $1 million were included in other comprehensiveincome at December 31, 2004, net of deferred taxes of less than $1 million, related to these sales.
Note 13. Equity-Based Compensation
We have a 2006 Equity Incentive Plan, with 20,000,000 shares of common stock approved forissuance for stock and stock-based awards, including stock options, stock appreciation rights, restrictedstock, deferred stock and performance awards. In addition, up to 8,000,000 shares from our 1997Equity Incentive Plan, that were available to issue or become available due to cancellations andforfeitures, may be awarded under the 2006 Plan. The 1997 Plan expired on December 18, 2006. As ofDecember 31, 2006, 1,305,420 shares from the 1997 Plan have been added to and may be awarded fromthe 2006 Plan. As of December 31, 2007, 6,369,222 shares have been awarded under the 2006 Plan. Wehave stock options outstanding from previous plans, including the 1997 Plan, under which no furthergrants can be made.
The exercise price of non-qualified and incentive stock options and stock appreciation rights maynot be less than the fair value of such shares at the date of grant. Stock options and stock appreciationrights issued under the 2006 Plan and the 1997 Plan generally vest over four years and expire no laterthan ten years from the date of grant. For restricted stock awards issued under the 2006 Plan and the1997 Plan, stock certificates are issued at the time of grant and recipients have dividend and votingrights. In general, these grants vest over three years. For deferred stock awards issued under the 2006Plan and the 1997 Plan, no stock is issued at the time of grant. Generally, these grants vest over two-,three- or four-year periods. Performance awards granted under the 2006 Plan and the 1997 Plan areearned over a performance period based on achievement of goals, generally over two- to four-yearperiods. Payment for performance awards is made in shares of our common stock equal to its fairmarket value per share, based on certain financial ratios after the conclusion of each performanceperiod.
105
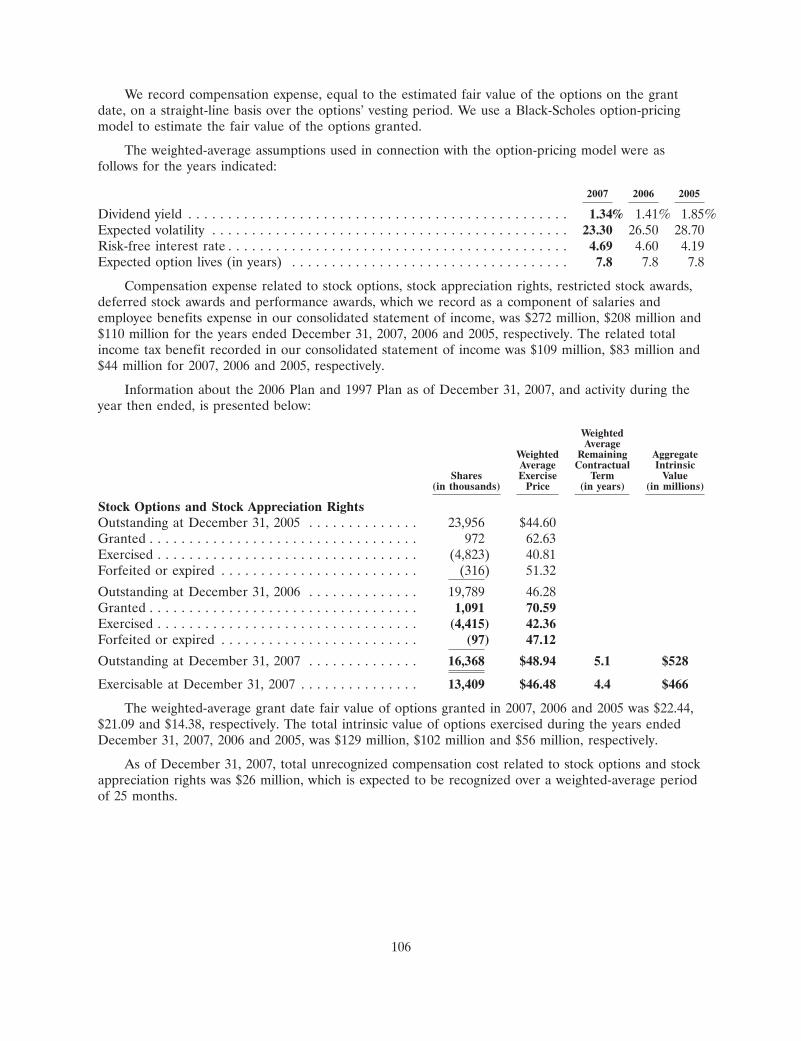
We record compensation expense, equal to the estimated fair value of the options on the grantdate, on a straight-line basis over the options’ vesting period. We use a Black-Scholes option-pricingmodel to estimate the fair value of the options granted.
The weighted-average assumptions used in connection with the option-pricing model were asfollows for the years indicated:
2007 2006 2005
Dividend yield . . . . . . . . . . . . . . . . . . . . . . . . . . . . . . . . . . . . . . . . . . . . . . . . 1.34% 1.41% 1.85%Expected volatility . . . . . . . . . . . . . . . . . . . . . . . . . . . . . . . . . . . . . . . . . . . . . 23.30 26.50 28.70Risk-free interest rate . . . . . . . . . . . . . . . . . . . . . . . . . . . . . . . . . . . . . . . . . . . 4.69 4.60 4.19Expected option lives (in years) . . . . . . . . . . . . . . . . . . . . . . . . . . . . . . . . . . . 7.8 7.8 7.8
Compensation expense related to stock options, stock appreciation rights, restricted stock awards,deferred stock awards and performance awards, which we record as a component of salaries andemployee benefits expense in our consolidated statement of income, was $272 million, $208 million and$110 million for the years ended December 31, 2007, 2006 and 2005, respectively. The related totalincome tax benefit recorded in our consolidated statement of income was $109 million, $83 million and$44 million for 2007, 2006 and 2005, respectively.
Information about the 2006 Plan and 1997 Plan as of December 31, 2007, and activity during theyear then ended, is presented below:
WeightedAverage
Weighted Remaining AggregateAverage Contractual Intrinsic
Shares Exercise Term Value(in thousands) Price (in years) (in millions)
Stock Options and Stock Appreciation RightsOutstanding at December 31, 2005 . . . . . . . . . . . . . . 23,956 $44.60Granted . . . . . . . . . . . . . . . . . . . . . . . . . . . . . . . . . . 972 62.63Exercised . . . . . . . . . . . . . . . . . . . . . . . . . . . . . . . . . (4,823) 40.81Forfeited or expired . . . . . . . . . . . . . . . . . . . . . . . . . (316) 51.32
Outstanding at December 31, 2006 . . . . . . . . . . . . . . 19,789 46.28Granted . . . . . . . . . . . . . . . . . . . . . . . . . . . . . . . . . . 1,091 70.59Exercised . . . . . . . . . . . . . . . . . . . . . . . . . . . . . . . . . (4,415) 42.36Forfeited or expired . . . . . . . . . . . . . . . . . . . . . . . . . (97) 47.12
Outstanding at December 31, 2007 . . . . . . . . . . . . . . 16,368 $48.94 5.1 $528
Exercisable at December 31, 2007 . . . . . . . . . . . . . . . 13,409 $46.48 4.4 $466
The weighted-average grant date fair value of options granted in 2007, 2006 and 2005 was $22.44,$21.09 and $14.38, respectively. The total intrinsic value of options exercised during the years endedDecember 31, 2007, 2006 and 2005, was $129 million, $102 million and $56 million, respectively.
As of December 31, 2007, total unrecognized compensation cost related to stock options and stockappreciation rights was $26 million, which is expected to be recognized over a weighted-average periodof 25 months.
106
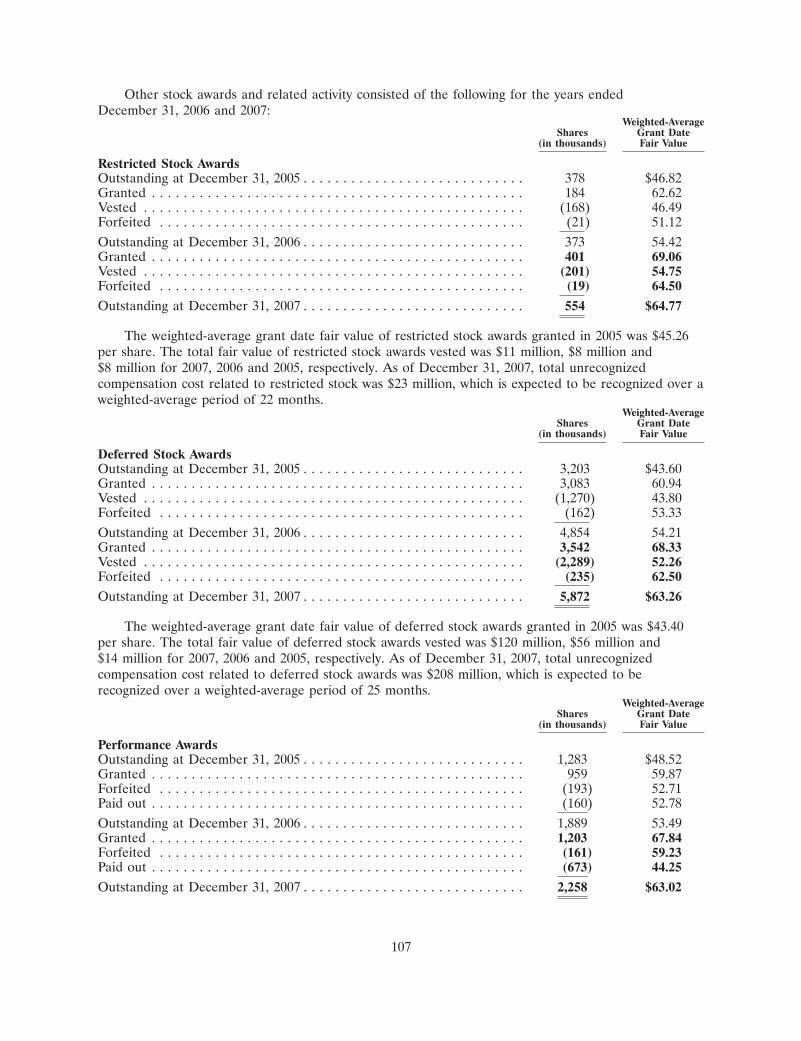
Other stock awards and related activity consisted of the following for the years endedDecember 31, 2006 and 2007:
Weighted-AverageShares Grant Date
(in thousands) Fair Value
Restricted Stock AwardsOutstanding at December 31, 2005 . . . . . . . . . . . . . . . . . . . . . . . . . . . . 378 $46.82Granted . . . . . . . . . . . . . . . . . . . . . . . . . . . . . . . . . . . . . . . . . . . . . . . 184 62.62Vested . . . . . . . . . . . . . . . . . . . . . . . . . . . . . . . . . . . . . . . . . . . . . . . . (168) 46.49Forfeited . . . . . . . . . . . . . . . . . . . . . . . . . . . . . . . . . . . . . . . . . . . . . . (21) 51.12Outstanding at December 31, 2006 . . . . . . . . . . . . . . . . . . . . . . . . . . . . 373 54.42Granted . . . . . . . . . . . . . . . . . . . . . . . . . . . . . . . . . . . . . . . . . . . . . . . 401 69.06Vested . . . . . . . . . . . . . . . . . . . . . . . . . . . . . . . . . . . . . . . . . . . . . . . . (201) 54.75Forfeited . . . . . . . . . . . . . . . . . . . . . . . . . . . . . . . . . . . . . . . . . . . . . . (19) 64.50
Outstanding at December 31, 2007 . . . . . . . . . . . . . . . . . . . . . . . . . . . . 554 $64.77
The weighted-average grant date fair value of restricted stock awards granted in 2005 was $45.26per share. The total fair value of restricted stock awards vested was $11 million, $8 million and$8 million for 2007, 2006 and 2005, respectively. As of December 31, 2007, total unrecognizedcompensation cost related to restricted stock was $23 million, which is expected to be recognized over aweighted-average period of 22 months.
Weighted-AverageShares Grant Date
(in thousands) Fair Value
Deferred Stock AwardsOutstanding at December 31, 2005 . . . . . . . . . . . . . . . . . . . . . . . . . . . . 3,203 $43.60Granted . . . . . . . . . . . . . . . . . . . . . . . . . . . . . . . . . . . . . . . . . . . . . . . 3,083 60.94Vested . . . . . . . . . . . . . . . . . . . . . . . . . . . . . . . . . . . . . . . . . . . . . . . . (1,270) 43.80Forfeited . . . . . . . . . . . . . . . . . . . . . . . . . . . . . . . . . . . . . . . . . . . . . . (162) 53.33Outstanding at December 31, 2006 . . . . . . . . . . . . . . . . . . . . . . . . . . . . 4,854 54.21Granted . . . . . . . . . . . . . . . . . . . . . . . . . . . . . . . . . . . . . . . . . . . . . . . 3,542 68.33Vested . . . . . . . . . . . . . . . . . . . . . . . . . . . . . . . . . . . . . . . . . . . . . . . . (2,289) 52.26Forfeited . . . . . . . . . . . . . . . . . . . . . . . . . . . . . . . . . . . . . . . . . . . . . . (235) 62.50
Outstanding at December 31, 2007 . . . . . . . . . . . . . . . . . . . . . . . . . . . . 5,872 $63.26
The weighted-average grant date fair value of deferred stock awards granted in 2005 was $43.40per share. The total fair value of deferred stock awards vested was $120 million, $56 million and$14 million for 2007, 2006 and 2005, respectively. As of December 31, 2007, total unrecognizedcompensation cost related to deferred stock awards was $208 million, which is expected to berecognized over a weighted-average period of 25 months.
Weighted-AverageShares Grant Date
(in thousands) Fair Value
Performance AwardsOutstanding at December 31, 2005 . . . . . . . . . . . . . . . . . . . . . . . . . . . . 1,283 $48.52Granted . . . . . . . . . . . . . . . . . . . . . . . . . . . . . . . . . . . . . . . . . . . . . . . 959 59.87Forfeited . . . . . . . . . . . . . . . . . . . . . . . . . . . . . . . . . . . . . . . . . . . . . . (193) 52.71Paid out . . . . . . . . . . . . . . . . . . . . . . . . . . . . . . . . . . . . . . . . . . . . . . . (160) 52.78Outstanding at December 31, 2006 . . . . . . . . . . . . . . . . . . . . . . . . . . . . 1,889 53.49Granted . . . . . . . . . . . . . . . . . . . . . . . . . . . . . . . . . . . . . . . . . . . . . . . 1,203 67.84Forfeited . . . . . . . . . . . . . . . . . . . . . . . . . . . . . . . . . . . . . . . . . . . . . . (161) 59.23Paid out . . . . . . . . . . . . . . . . . . . . . . . . . . . . . . . . . . . . . . . . . . . . . . . (673) 44.25
Outstanding at December 31, 2007 . . . . . . . . . . . . . . . . . . . . . . . . . . . . 2,258 $63.02
107
The weighted-average grant date fair value of performance awards granted in 2005 was $47.91 pershare. The total fair value of performance awards paid out was $33 million, $9 million and $12 millionfor 2007, 2006 and 2005, respectively. As of December 31, 2007, total unrecognized compensation costrelated to performance awards was $55 million, which is expected to be recognized over a weighted-average period of 22 months.
We generally utilize treasury shares to satisfy the issuance of stock under our equity incentiveplans. We do not have a specific policy concerning purchases of our common stock to satisfy stockissuances, including exercises of options. We have a general policy concerning purchases of stock tomeet common stock issuances under our employee benefit plans, including option exercises and othercorporate purposes. Various factors determine the amount and timing of our purchases of our commonstock, including our capital requirements, the number of shares we expect to issue under employeebenefit plans, market conditions (including the trading price of our common stock), and legalconsiderations. These factors can change at any time, and there can be no assurance as to the numberof shares of common stock we will purchase or when we will purchase them.
Note 14. Regulatory Matters
Regulatory Capital:
We are subject to various regulatory capital requirements administered by federal bankingagencies. Failure to meet minimum capital requirements can initiate certain mandatory anddiscretionary actions by regulators that, if undertaken, could have a direct material effect on ourconsolidated financial condition. Under regulatory capital adequacy guidelines, we must meet specificcapital requirements that involve quantitative measures of our consolidated assets, liabilities andoff-balance sheet exposures as calculated in accordance with regulatory accounting practices. Ourcapital amounts and classification are subject to qualitative judgments by the regulators aboutcomponents, risk weightings and other factors.
Quantitative measures established by regulation to ensure capital adequacy require State Streetand State Street Bank to maintain minimum risk-based capital and leverage ratios as set forth in thefollowing table. The risk-based capital ratios are tier 1 capital and total capital divided by adjusted totalrisk-weighted assets and market-risk equivalents, and the tier 1 leverage ratio is tier 1 capital divided byadjusted quarterly average assets. As of December 31, 2007 and 2006, State Street and State StreetBank met all capital adequacy requirements to which they were subject.
As of December 31, 2007, State Street Bank was categorized as ‘‘well capitalized’’ under theregulatory framework. To be categorized as ‘‘well capitalized,’’ State Street Bank must exceed the ‘‘wellcapitalized’’ guideline ratios, as set forth in the table, and meet certain other requirements. State StreetBank exceeded all ‘‘well capitalized’’ requirements as of December 31, 2007 and 2006. There are noconditions or events since December 31, 2007 that management believes have changed the capitalcategory of State Street Bank.
108
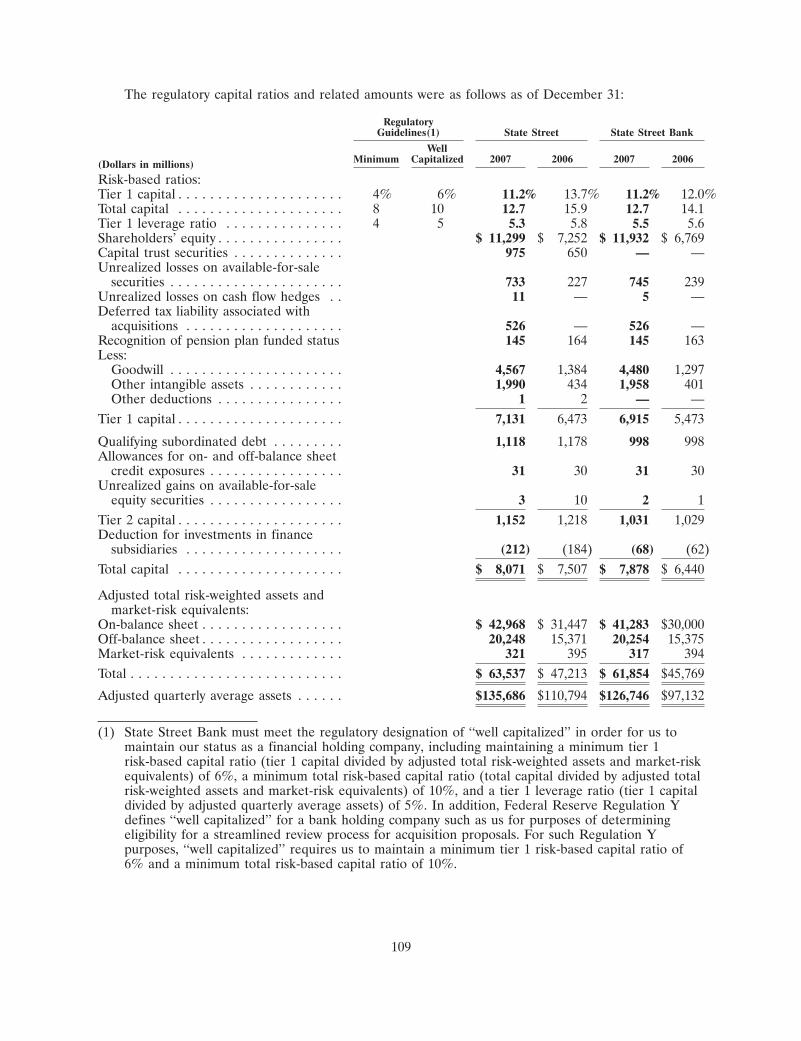
The regulatory capital ratios and related amounts were as follows as of December 31:
RegulatoryGuidelines(1) State Street State Street Bank
WellMinimum Capitalized 2007 2006 2007 2006(Dollars in millions)
Risk-based ratios:Tier 1 capital . . . . . . . . . . . . . . . . . . . . . 4% 6% 11.2% 13.7% 11.2% 12.0%Total capital . . . . . . . . . . . . . . . . . . . . . 8 10 12.7 15.9 12.7 14.1Tier 1 leverage ratio . . . . . . . . . . . . . . . 4 5 5.3 5.8 5.5 5.6Shareholders’ equity . . . . . . . . . . . . . . . . $ 11,299 $ 7,252 $ 11,932 $ 6,769Capital trust securities . . . . . . . . . . . . . . 975 650 — —Unrealized losses on available-for-sale
securities . . . . . . . . . . . . . . . . . . . . . . 733 227 745 239Unrealized losses on cash flow hedges . . 11 — 5 —Deferred tax liability associated with
acquisitions . . . . . . . . . . . . . . . . . . . . 526 — 526 —Recognition of pension plan funded status 145 164 145 163Less:
Goodwill . . . . . . . . . . . . . . . . . . . . . . 4,567 1,384 4,480 1,297Other intangible assets . . . . . . . . . . . . 1,990 434 1,958 401Other deductions . . . . . . . . . . . . . . . . 1 2 — —
Tier 1 capital . . . . . . . . . . . . . . . . . . . . . 7,131 6,473 6,915 5,473
Qualifying subordinated debt . . . . . . . . . 1,118 1,178 998 998Allowances for on- and off-balance sheet
credit exposures . . . . . . . . . . . . . . . . . 31 30 31 30Unrealized gains on available-for-sale
equity securities . . . . . . . . . . . . . . . . . 3 10 2 1Tier 2 capital . . . . . . . . . . . . . . . . . . . . . 1,152 1,218 1,031 1,029Deduction for investments in finance
subsidiaries . . . . . . . . . . . . . . . . . . . . (212) (184) (68) (62)Total capital . . . . . . . . . . . . . . . . . . . . . $ 8,071 $ 7,507 $ 7,878 $ 6,440
Adjusted total risk-weighted assets andmarket-risk equivalents:
On-balance sheet . . . . . . . . . . . . . . . . . . $ 42,968 $ 31,447 $ 41,283 $30,000Off-balance sheet . . . . . . . . . . . . . . . . . . 20,248 15,371 20,254 15,375Market-risk equivalents . . . . . . . . . . . . . 321 395 317 394Total . . . . . . . . . . . . . . . . . . . . . . . . . . . $ 63,537 $ 47,213 $ 61,854 $45,769
Adjusted quarterly average assets . . . . . . $135,686 $110,794 $126,746 $97,132
(1) State Street Bank must meet the regulatory designation of ‘‘well capitalized’’ in order for us tomaintain our status as a financial holding company, including maintaining a minimum tier 1risk-based capital ratio (tier 1 capital divided by adjusted total risk-weighted assets and market-riskequivalents) of 6%, a minimum total risk-based capital ratio (total capital divided by adjusted totalrisk-weighted assets and market-risk equivalents) of 10%, and a tier 1 leverage ratio (tier 1 capitaldivided by adjusted quarterly average assets) of 5%. In addition, Federal Reserve Regulation Ydefines ‘‘well capitalized’’ for a bank holding company such as us for purposes of determiningeligibility for a streamlined review process for acquisition proposals. For such Regulation Ypurposes, ‘‘well capitalized’’ requires us to maintain a minimum tier 1 risk-based capital ratio of6% and a minimum total risk-based capital ratio of 10%.
109
Cash, Dividend, Loan and Other Restrictions:
During 2007, our bank subsidiaries were required by the Federal Reserve to maintain average cashreserve balances of $53 million. In addition, federal and state banking regulations place certainrestrictions on dividends paid by bank subsidiaries to a parent holding company. For 2008, aggregatedividends by State Street Bank without prior regulatory approval are limited to approximately$1.78 billion of its undistributed earnings at December 31, 2007, plus an additional amount equal to itsnet profits, as defined, for 2008 up to the date of any dividend.
The Federal Reserve Act requires that extensions of credit by State Street Bank to certainaffiliates, including the parent company, be secured by specific collateral, that the extension of credit toany one affiliate be limited to 10% of its capital and surplus (as defined), and that extensions of creditto all such affiliates be limited to 20% of its capital and surplus.
At December 31, 2007, consolidated retained earnings included $295 million representingundistributed earnings of affiliates that are accounted for using the equity method.
Note 15. Derivative Financial Instruments
We use derivatives to support customers’ needs, conduct trading activities, and manage ourinterest-rate and currency risk.
As part of our trading activities, we assume positions in both the foreign exchange andinterest-rate markets by buying and selling cash instruments and using derivative financial instruments,including foreign exchange forward contracts, foreign exchange and interest-rate options, andinterest-rate swaps. In the aggregate, long and short foreign exchange forward positions are matchedclosely to minimize currency and interest-rate risk. All foreign exchange contracts are valued daily atcurrent market rates.
Interest-rate contracts involve an agreement with a counterparty to exchange cash flows based onthe movement of an underlying interest-rate index. An interest-rate swap agreement involves theexchange of a series of interest payments, either at a fixed or variable rate, based upon the notionalamount without the exchange of the underlying principal amount. An interest-rate option contractprovides the purchaser, for a premium, the right, but not the obligation, to receive an interest ratebased upon a predetermined notional value during a specified period. An interest-rate futures contractis a commitment to buy or sell, at a future date, a financial instrument at a contracted price; it may besettled in cash or through the delivery of the contracted instrument.
Foreign exchange contracts involve an agreement to exchange one currency for another currency atan agreed-upon rate and settlement date. Foreign exchange contracts generally consist of cross-currencyswap agreements and foreign exchange forward and spot contracts.
110
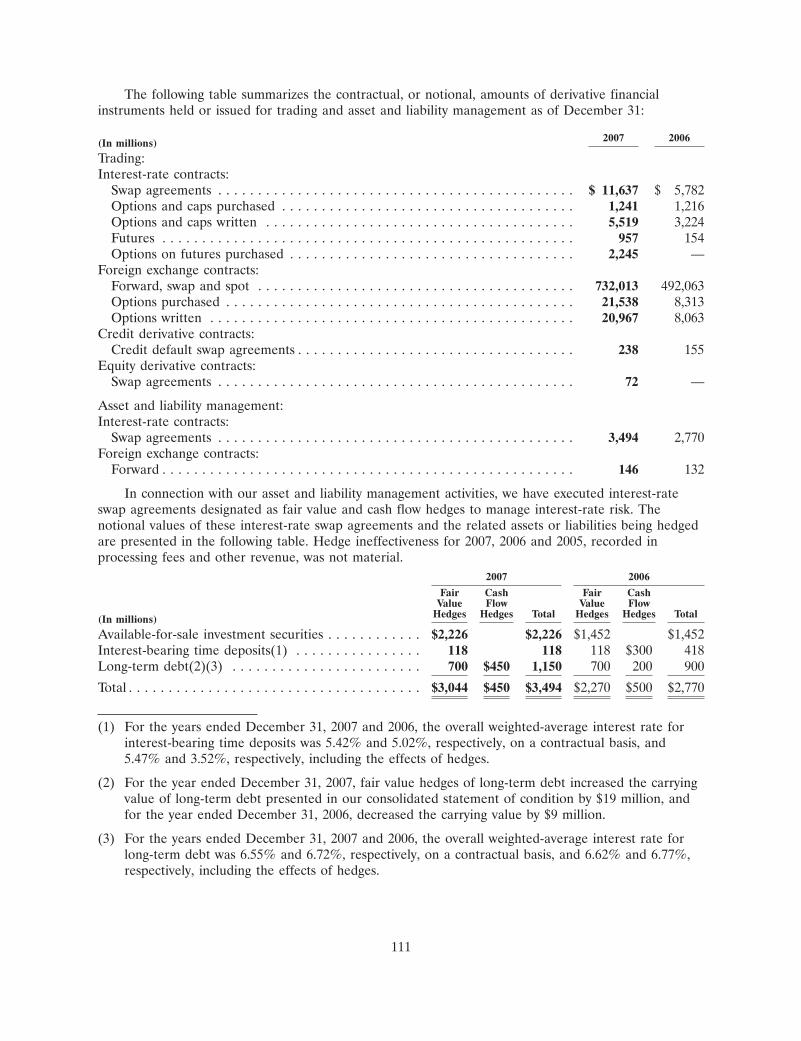
The following table summarizes the contractual, or notional, amounts of derivative financialinstruments held or issued for trading and asset and liability management as of December 31:
2007 2006(In millions)
Trading:Interest-rate contracts:
Swap agreements . . . . . . . . . . . . . . . . . . . . . . . . . . . . . . . . . . . . . . . . . . . . . $ 11,637 $ 5,782Options and caps purchased . . . . . . . . . . . . . . . . . . . . . . . . . . . . . . . . . . . . . 1,241 1,216Options and caps written . . . . . . . . . . . . . . . . . . . . . . . . . . . . . . . . . . . . . . . 5,519 3,224Futures . . . . . . . . . . . . . . . . . . . . . . . . . . . . . . . . . . . . . . . . . . . . . . . . . . . . 957 154Options on futures purchased . . . . . . . . . . . . . . . . . . . . . . . . . . . . . . . . . . . . 2,245 —
Foreign exchange contracts:Forward, swap and spot . . . . . . . . . . . . . . . . . . . . . . . . . . . . . . . . . . . . . . . . 732,013 492,063Options purchased . . . . . . . . . . . . . . . . . . . . . . . . . . . . . . . . . . . . . . . . . . . . 21,538 8,313Options written . . . . . . . . . . . . . . . . . . . . . . . . . . . . . . . . . . . . . . . . . . . . . . 20,967 8,063
Credit derivative contracts:Credit default swap agreements . . . . . . . . . . . . . . . . . . . . . . . . . . . . . . . . . . . 238 155
Equity derivative contracts:Swap agreements . . . . . . . . . . . . . . . . . . . . . . . . . . . . . . . . . . . . . . . . . . . . . 72 —
Asset and liability management:Interest-rate contracts:
Swap agreements . . . . . . . . . . . . . . . . . . . . . . . . . . . . . . . . . . . . . . . . . . . . . 3,494 2,770Foreign exchange contracts:
Forward . . . . . . . . . . . . . . . . . . . . . . . . . . . . . . . . . . . . . . . . . . . . . . . . . . . . 146 132
In connection with our asset and liability management activities, we have executed interest-rateswap agreements designated as fair value and cash flow hedges to manage interest-rate risk. Thenotional values of these interest-rate swap agreements and the related assets or liabilities being hedgedare presented in the following table. Hedge ineffectiveness for 2007, 2006 and 2005, recorded inprocessing fees and other revenue, was not material.
2007 2006
Fair Cash Fair CashValue Flow Value Flow
Hedges Hedges Total Hedges Hedges Total(In millions)
Available-for-sale investment securities . . . . . . . . . . . . $2,226 $2,226 $1,452 $1,452Interest-bearing time deposits(1) . . . . . . . . . . . . . . . . 118 118 118 $300 418Long-term debt(2)(3) . . . . . . . . . . . . . . . . . . . . . . . . 700 $450 1,150 700 200 900
Total . . . . . . . . . . . . . . . . . . . . . . . . . . . . . . . . . . . . . $3,044 $450 $3,494 $2,270 $500 $2,770
(1) For the years ended December 31, 2007 and 2006, the overall weighted-average interest rate forinterest-bearing time deposits was 5.42% and 5.02%, respectively, on a contractual basis, and5.47% and 3.52%, respectively, including the effects of hedges.
(2) For the year ended December 31, 2007, fair value hedges of long-term debt increased the carryingvalue of long-term debt presented in our consolidated statement of condition by $19 million, andfor the year ended December 31, 2006, decreased the carrying value by $9 million.
(3) For the years ended December 31, 2007 and 2006, the overall weighted-average interest rate forlong-term debt was 6.55% and 6.72%, respectively, on a contractual basis, and 6.62% and 6.77%,respectively, including the effects of hedges.
111
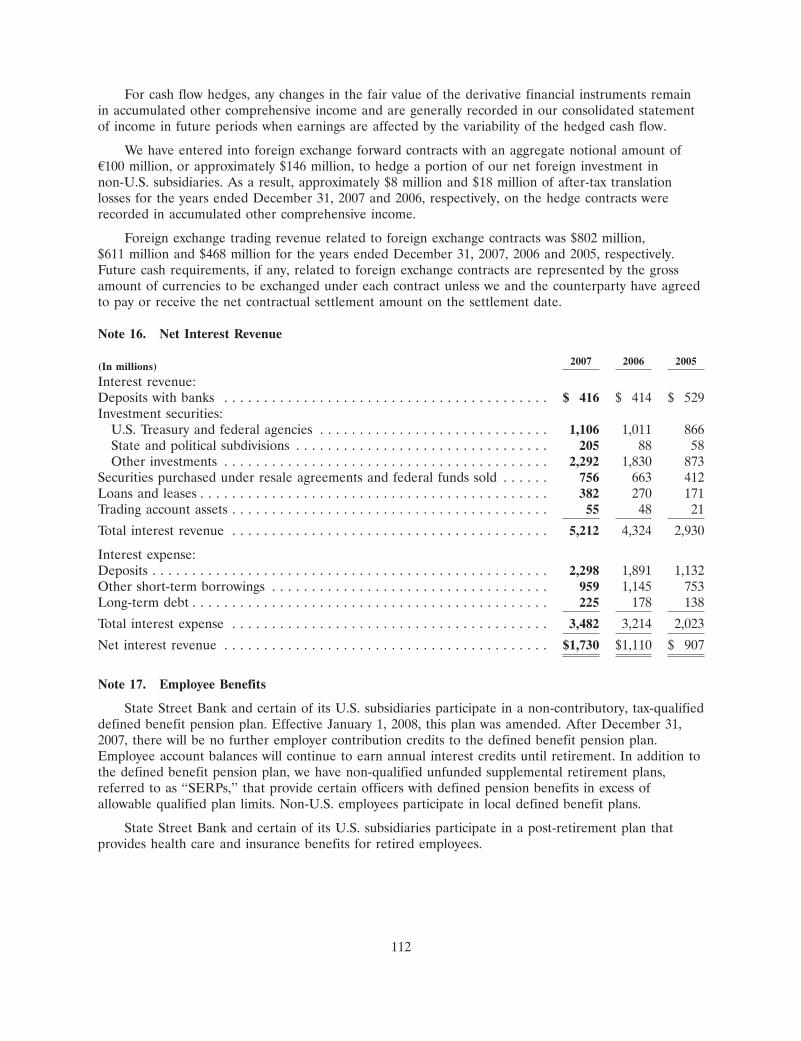
For cash flow hedges, any changes in the fair value of the derivative financial instruments remainin accumulated other comprehensive income and are generally recorded in our consolidated statementof income in future periods when earnings are affected by the variability of the hedged cash flow.
We have entered into foreign exchange forward contracts with an aggregate notional amount ofA100 million, or approximately $146 million, to hedge a portion of our net foreign investment innon-U.S. subsidiaries. As a result, approximately $8 million and $18 million of after-tax translationlosses for the years ended December 31, 2007 and 2006, respectively, on the hedge contracts wererecorded in accumulated other comprehensive income.
Foreign exchange trading revenue related to foreign exchange contracts was $802 million,$611 million and $468 million for the years ended December 31, 2007, 2006 and 2005, respectively.Future cash requirements, if any, related to foreign exchange contracts are represented by the grossamount of currencies to be exchanged under each contract unless we and the counterparty have agreedto pay or receive the net contractual settlement amount on the settlement date.
Note 16. Net Interest Revenue
2007 2006 2005(In millions)
Interest revenue:Deposits with banks . . . . . . . . . . . . . . . . . . . . . . . . . . . . . . . . . . . . . . . . . $ 416 $ 414 $ 529Investment securities:
U.S. Treasury and federal agencies . . . . . . . . . . . . . . . . . . . . . . . . . . . . . 1,106 1,011 866State and political subdivisions . . . . . . . . . . . . . . . . . . . . . . . . . . . . . . . . 205 88 58Other investments . . . . . . . . . . . . . . . . . . . . . . . . . . . . . . . . . . . . . . . . . 2,292 1,830 873
Securities purchased under resale agreements and federal funds sold . . . . . . 756 663 412Loans and leases . . . . . . . . . . . . . . . . . . . . . . . . . . . . . . . . . . . . . . . . . . . . 382 270 171Trading account assets . . . . . . . . . . . . . . . . . . . . . . . . . . . . . . . . . . . . . . . . 55 48 21
Total interest revenue . . . . . . . . . . . . . . . . . . . . . . . . . . . . . . . . . . . . . . . . 5,212 4,324 2,930
Interest expense:Deposits . . . . . . . . . . . . . . . . . . . . . . . . . . . . . . . . . . . . . . . . . . . . . . . . . . 2,298 1,891 1,132Other short-term borrowings . . . . . . . . . . . . . . . . . . . . . . . . . . . . . . . . . . . 959 1,145 753Long-term debt . . . . . . . . . . . . . . . . . . . . . . . . . . . . . . . . . . . . . . . . . . . . . 225 178 138
Total interest expense . . . . . . . . . . . . . . . . . . . . . . . . . . . . . . . . . . . . . . . . 3,482 3,214 2,023
Net interest revenue . . . . . . . . . . . . . . . . . . . . . . . . . . . . . . . . . . . . . . . . . $1,730 $1,110 $ 907
Note 17. Employee Benefits
State Street Bank and certain of its U.S. subsidiaries participate in a non-contributory, tax-qualifieddefined benefit pension plan. Effective January 1, 2008, this plan was amended. After December 31,2007, there will be no further employer contribution credits to the defined benefit pension plan.Employee account balances will continue to earn annual interest credits until retirement. In addition tothe defined benefit pension plan, we have non-qualified unfunded supplemental retirement plans,referred to as ‘‘SERPs,’’ that provide certain officers with defined pension benefits in excess ofallowable qualified plan limits. Non-U.S. employees participate in local defined benefit plans.
State Street Bank and certain of its U.S. subsidiaries participate in a post-retirement plan thatprovides health care and insurance benefits for retired employees.
112
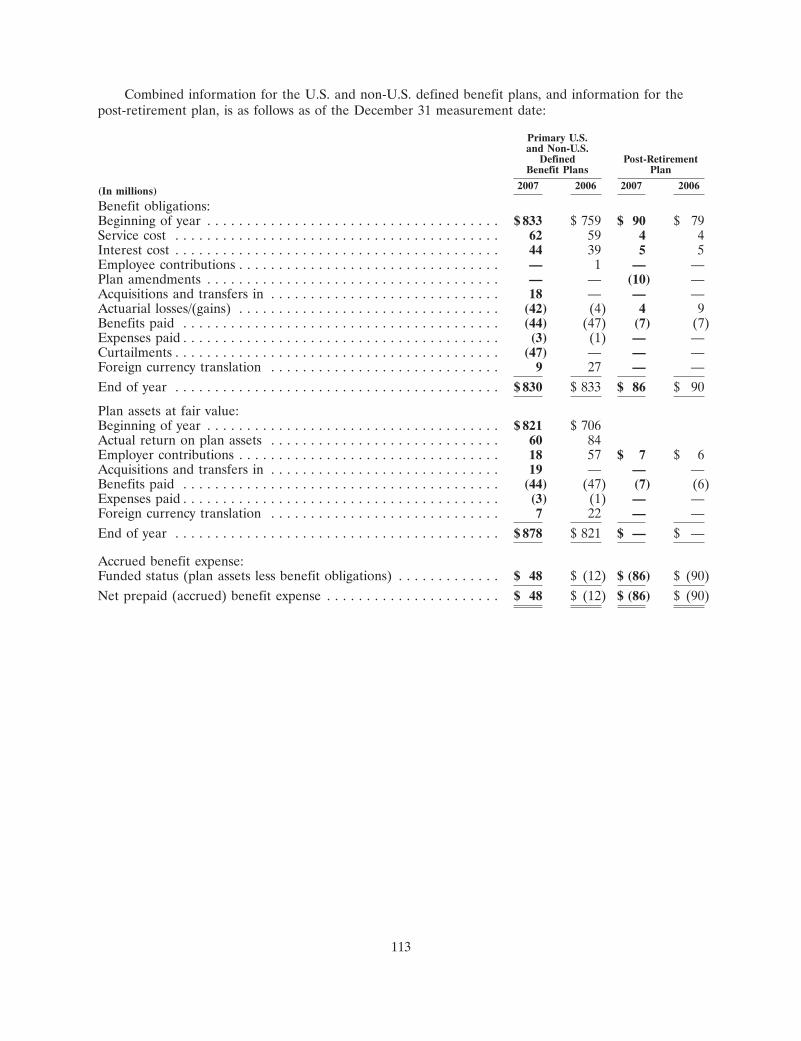
Combined information for the U.S. and non-U.S. defined benefit plans, and information for thepost-retirement plan, is as follows as of the December 31 measurement date:
Primary U.S.and Non-U.S.
Defined Post-RetirementBenefit Plans Plan
2007 2006 2007 2006(In millions)
Benefit obligations:Beginning of year . . . . . . . . . . . . . . . . . . . . . . . . . . . . . . . . . . . . . $ 833 $ 759 $ 90 $ 79Service cost . . . . . . . . . . . . . . . . . . . . . . . . . . . . . . . . . . . . . . . . . 62 59 4 4Interest cost . . . . . . . . . . . . . . . . . . . . . . . . . . . . . . . . . . . . . . . . . 44 39 5 5Employee contributions . . . . . . . . . . . . . . . . . . . . . . . . . . . . . . . . . — 1 — —Plan amendments . . . . . . . . . . . . . . . . . . . . . . . . . . . . . . . . . . . . . — — (10) —Acquisitions and transfers in . . . . . . . . . . . . . . . . . . . . . . . . . . . . . 18 — — —Actuarial losses/(gains) . . . . . . . . . . . . . . . . . . . . . . . . . . . . . . . . . (42) (4) 4 9Benefits paid . . . . . . . . . . . . . . . . . . . . . . . . . . . . . . . . . . . . . . . . (44) (47) (7) (7)Expenses paid . . . . . . . . . . . . . . . . . . . . . . . . . . . . . . . . . . . . . . . . (3) (1) — —Curtailments . . . . . . . . . . . . . . . . . . . . . . . . . . . . . . . . . . . . . . . . . (47) — — —Foreign currency translation . . . . . . . . . . . . . . . . . . . . . . . . . . . . . 9 27 — —End of year . . . . . . . . . . . . . . . . . . . . . . . . . . . . . . . . . . . . . . . . . $ 830 $ 833 $ 86 $ 90
Plan assets at fair value:Beginning of year . . . . . . . . . . . . . . . . . . . . . . . . . . . . . . . . . . . . . $ 821 $ 706Actual return on plan assets . . . . . . . . . . . . . . . . . . . . . . . . . . . . . 60 84Employer contributions . . . . . . . . . . . . . . . . . . . . . . . . . . . . . . . . . 18 57 $ 7 $ 6Acquisitions and transfers in . . . . . . . . . . . . . . . . . . . . . . . . . . . . . 19 — — —Benefits paid . . . . . . . . . . . . . . . . . . . . . . . . . . . . . . . . . . . . . . . . (44) (47) (7) (6)Expenses paid . . . . . . . . . . . . . . . . . . . . . . . . . . . . . . . . . . . . . . . . (3) (1) — —Foreign currency translation . . . . . . . . . . . . . . . . . . . . . . . . . . . . . 7 22 — —End of year . . . . . . . . . . . . . . . . . . . . . . . . . . . . . . . . . . . . . . . . . $ 878 $ 821 $ — $ —
Accrued benefit expense:Funded status (plan assets less benefit obligations) . . . . . . . . . . . . . $ 48 $ (12) $ (86) $ (90)Net prepaid (accrued) benefit expense . . . . . . . . . . . . . . . . . . . . . . $ 48 $ (12) $ (86) $ (90)
113

Primary U.S. andNon-U.S. Defined Post-Retirement
Benefit Plans Plan
2007 2006 2007 2006(In millions)Amounts recognized in the consolidated statement of condition
as of December 31:Non-current assets . . . . . . . . . . . . . . . . . . . . . . . . . . . . . . . . . . . . $ 93 $ 53Current liabilities . . . . . . . . . . . . . . . . . . . . . . . . . . . . . . . . . . . . . — — $ (7) $ (8)Noncurrent liabilities . . . . . . . . . . . . . . . . . . . . . . . . . . . . . . . . . . . (45) (65) (79) (82)
Net prepaid (accrued) amount recognized in statement of condition . . . $ 48 $ (12) $ (86) $ (90)
Amounts recognized in accumulated other comprehensive income:Initial net obligation . . . . . . . . . . . . . . . . . . . . . . . . . . . . . . . . . . . . . $ (5)Prior service credit . . . . . . . . . . . . . . . . . . . . . . . . . . . . . . . . . . . . . . $ 20 $ 6 —Net loss . . . . . . . . . . . . . . . . . . . . . . . . . . . . . . . . . . . . . . . . . . . . . $(110) (217) (32) (29)
Accumulated other comprehensive loss . . . . . . . . . . . . . . . . . . . . . . . (110) (197) (26) (34)Cumulative employer contributions in excess of net periodic benefit cost 158 185 (60) (56)
Net asset (obligation) recognized in consolidated statement of condition $ 48 $ (12) $ (86) $ (90)
Determination of adjustment related to adoption of SFAS No. 158:Liability before adoption of the funded status provisions of SFAS
No. 158 . . . . . . . . . . . . . . . . . . . . . . . . . . . . . . . . . . . . . . . . . . . . $ 31Accumulated other comprehensive loss before adoption of funded
status recognition provisions of SFAS No. 158 . . . . . . . . . . . . . . . . . 31Transition obligation after adoption of funded status provisions of SFAS
No. 158 . . . . . . . . . . . . . . . . . . . . . . . . . . . . . . . . . . . . . . . . . . . . — $ 5Prior service cost . . . . . . . . . . . . . . . . . . . . . . . . . . . . . . . . . . . . . . . (20) —Net loss . . . . . . . . . . . . . . . . . . . . . . . . . . . . . . . . . . . . . . . . . . . . . 217 29
Accumulated other comprehensive loss after adoption of funded statusrecognition provisions of SFAS No. 158 . . . . . . . . . . . . . . . . . . . . . . $ 197 $ 34
Increase in accumulated other comprehensive loss, before taxes, toreflect the adoption of SFAS No. 158 . . . . . . . . . . . . . . . . . . . . . . . $ 166 $ 34
Accumulated benefit obligation . . . . . . . . . . . . . . . . . . . . . . . . . . . . . $ 793 $ 751
Actuarial assumptions (U.S. Plans):Used to determine benefit obligations as of December 31:
Discount rate . . . . . . . . . . . . . . . . . . . . . . . . . . . . . . . . . . . . . . . . 6.00% 5.75% 6.00% 5.75%Rate of increase for future compensation . . . . . . . . . . . . . . . . . . . . 4.50 4.50 — —
Used to determine periodic benefit cost for the years endedDecember 31:Discount rate . . . . . . . . . . . . . . . . . . . . . . . . . . . . . . . . . . . . . . . . 6.00% 5.50% 5.75% 5.50%Rate of increase for future compensation . . . . . . . . . . . . . . . . . . . . 4.50 4.50 — —Expected long-term rate of return on plan assets . . . . . . . . . . . . . . . 7.50 8.00 — —
Assumed health care cost trend rates as of December 31:Cost trend rate assumed for next year . . . . . . . . . . . . . . . . . . . . . . . — — 9.5% 10.00%Rate to which the cost trend rate is assumed to decline . . . . . . . . . . — — 5.00 5.00Year that the rate reaches the ultimate trend rate . . . . . . . . . . . . . . — — 2015 2013
114
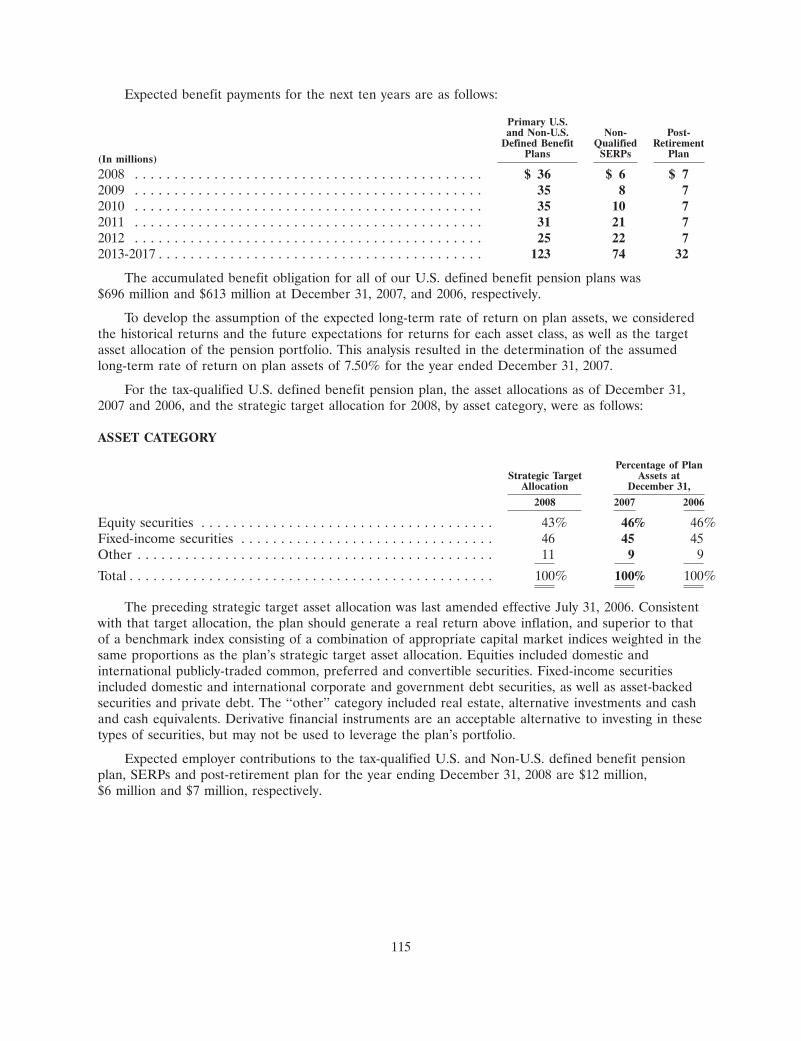
Expected benefit payments for the next ten years are as follows:
Primary U.S.and Non-U.S. Non- Post-
Defined Benefit Qualified RetirementPlans SERPs Plan(In millions)
2008 . . . . . . . . . . . . . . . . . . . . . . . . . . . . . . . . . . . . . . . . . . . . $ 36 $ 6 $ 72009 . . . . . . . . . . . . . . . . . . . . . . . . . . . . . . . . . . . . . . . . . . . . 35 8 72010 . . . . . . . . . . . . . . . . . . . . . . . . . . . . . . . . . . . . . . . . . . . . 35 10 72011 . . . . . . . . . . . . . . . . . . . . . . . . . . . . . . . . . . . . . . . . . . . . 31 21 72012 . . . . . . . . . . . . . . . . . . . . . . . . . . . . . . . . . . . . . . . . . . . . 25 22 72013-2017 . . . . . . . . . . . . . . . . . . . . . . . . . . . . . . . . . . . . . . . . . 123 74 32
The accumulated benefit obligation for all of our U.S. defined benefit pension plans was$696 million and $613 million at December 31, 2007, and 2006, respectively.
To develop the assumption of the expected long-term rate of return on plan assets, we consideredthe historical returns and the future expectations for returns for each asset class, as well as the targetasset allocation of the pension portfolio. This analysis resulted in the determination of the assumedlong-term rate of return on plan assets of 7.50% for the year ended December 31, 2007.
For the tax-qualified U.S. defined benefit pension plan, the asset allocations as of December 31,2007 and 2006, and the strategic target allocation for 2008, by asset category, were as follows:
ASSET CATEGORY
Percentage of PlanStrategic Target Assets at
Allocation December 31,
2008 2007 2006
Equity securities . . . . . . . . . . . . . . . . . . . . . . . . . . . . . . . . . . . . . 43% 46% 46%Fixed-income securities . . . . . . . . . . . . . . . . . . . . . . . . . . . . . . . . 46 45 45Other . . . . . . . . . . . . . . . . . . . . . . . . . . . . . . . . . . . . . . . . . . . . . 11 9 9
Total . . . . . . . . . . . . . . . . . . . . . . . . . . . . . . . . . . . . . . . . . . . . . . 100% 100% 100%
The preceding strategic target asset allocation was last amended effective July 31, 2006. Consistentwith that target allocation, the plan should generate a real return above inflation, and superior to thatof a benchmark index consisting of a combination of appropriate capital market indices weighted in thesame proportions as the plan’s strategic target asset allocation. Equities included domestic andinternational publicly-traded common, preferred and convertible securities. Fixed-income securitiesincluded domestic and international corporate and government debt securities, as well as asset-backedsecurities and private debt. The ‘‘other’’ category included real estate, alternative investments and cashand cash equivalents. Derivative financial instruments are an acceptable alternative to investing in thesetypes of securities, but may not be used to leverage the plan’s portfolio.
Expected employer contributions to the tax-qualified U.S. and Non-U.S. defined benefit pensionplan, SERPs and post-retirement plan for the year ending December 31, 2008 are $12 million,$6 million and $7 million, respectively.
115
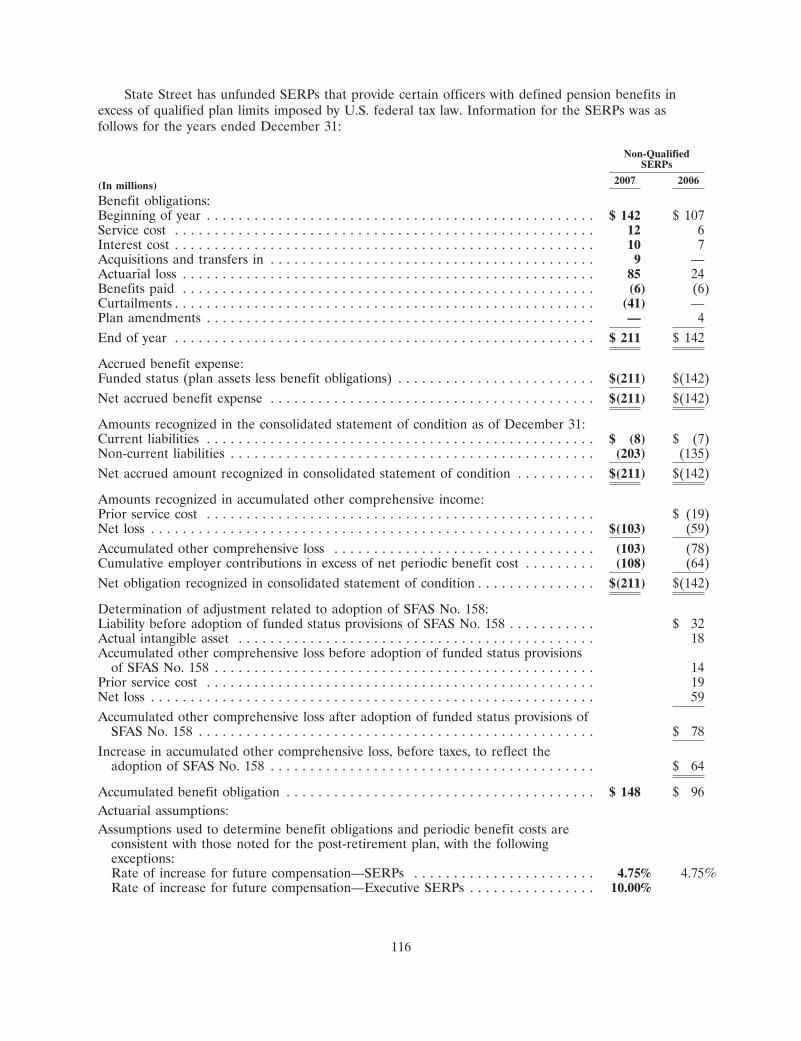
State Street has unfunded SERPs that provide certain officers with defined pension benefits inexcess of qualified plan limits imposed by U.S. federal tax law. Information for the SERPs was asfollows for the years ended December 31:
Non-QualifiedSERPs
2007 2006(In millions)
Benefit obligations:Beginning of year . . . . . . . . . . . . . . . . . . . . . . . . . . . . . . . . . . . . . . . . . . . . . . . . . $ 142 $ 107Service cost . . . . . . . . . . . . . . . . . . . . . . . . . . . . . . . . . . . . . . . . . . . . . . . . . . . . . 12 6Interest cost . . . . . . . . . . . . . . . . . . . . . . . . . . . . . . . . . . . . . . . . . . . . . . . . . . . . . 10 7Acquisitions and transfers in . . . . . . . . . . . . . . . . . . . . . . . . . . . . . . . . . . . . . . . . . 9 —Actuarial loss . . . . . . . . . . . . . . . . . . . . . . . . . . . . . . . . . . . . . . . . . . . . . . . . . . . . 85 24Benefits paid . . . . . . . . . . . . . . . . . . . . . . . . . . . . . . . . . . . . . . . . . . . . . . . . . . . . (6) (6)Curtailments . . . . . . . . . . . . . . . . . . . . . . . . . . . . . . . . . . . . . . . . . . . . . . . . . . . . . (41) —Plan amendments . . . . . . . . . . . . . . . . . . . . . . . . . . . . . . . . . . . . . . . . . . . . . . . . . — 4End of year . . . . . . . . . . . . . . . . . . . . . . . . . . . . . . . . . . . . . . . . . . . . . . . . . . . . . $ 211 $ 142
Accrued benefit expense:Funded status (plan assets less benefit obligations) . . . . . . . . . . . . . . . . . . . . . . . . . $(211) $(142)Net accrued benefit expense . . . . . . . . . . . . . . . . . . . . . . . . . . . . . . . . . . . . . . . . . $(211) $(142)
Amounts recognized in the consolidated statement of condition as of December 31:Current liabilities . . . . . . . . . . . . . . . . . . . . . . . . . . . . . . . . . . . . . . . . . . . . . . . . . $ (8) $ (7)Non-current liabilities . . . . . . . . . . . . . . . . . . . . . . . . . . . . . . . . . . . . . . . . . . . . . . (203) (135)Net accrued amount recognized in consolidated statement of condition . . . . . . . . . . $(211) $(142)
Amounts recognized in accumulated other comprehensive income:Prior service cost . . . . . . . . . . . . . . . . . . . . . . . . . . . . . . . . . . . . . . . . . . . . . . . . . $ (19)Net loss . . . . . . . . . . . . . . . . . . . . . . . . . . . . . . . . . . . . . . . . . . . . . . . . . . . . . . . . $(103) (59)Accumulated other comprehensive loss . . . . . . . . . . . . . . . . . . . . . . . . . . . . . . . . . (103) (78)Cumulative employer contributions in excess of net periodic benefit cost . . . . . . . . . (108) (64)Net obligation recognized in consolidated statement of condition . . . . . . . . . . . . . . . $(211) $(142)
Determination of adjustment related to adoption of SFAS No. 158:Liability before adoption of funded status provisions of SFAS No. 158 . . . . . . . . . . . $ 32Actual intangible asset . . . . . . . . . . . . . . . . . . . . . . . . . . . . . . . . . . . . . . . . . . . . . 18Accumulated other comprehensive loss before adoption of funded status provisions
of SFAS No. 158 . . . . . . . . . . . . . . . . . . . . . . . . . . . . . . . . . . . . . . . . . . . . . . . . 14Prior service cost . . . . . . . . . . . . . . . . . . . . . . . . . . . . . . . . . . . . . . . . . . . . . . . . . 19Net loss . . . . . . . . . . . . . . . . . . . . . . . . . . . . . . . . . . . . . . . . . . . . . . . . . . . . . . . . 59Accumulated other comprehensive loss after adoption of funded status provisions of
SFAS No. 158 . . . . . . . . . . . . . . . . . . . . . . . . . . . . . . . . . . . . . . . . . . . . . . . . . . $ 78Increase in accumulated other comprehensive loss, before taxes, to reflect the
adoption of SFAS No. 158 . . . . . . . . . . . . . . . . . . . . . . . . . . . . . . . . . . . . . . . . . $ 64
Accumulated benefit obligation . . . . . . . . . . . . . . . . . . . . . . . . . . . . . . . . . . . . . . . $ 148 $ 96Actuarial assumptions:Assumptions used to determine benefit obligations and periodic benefit costs are
consistent with those noted for the post-retirement plan, with the followingexceptions:Rate of increase for future compensation—SERPs . . . . . . . . . . . . . . . . . . . . . . . 4.75% 4.75%Rate of increase for future compensation—Executive SERPs . . . . . . . . . . . . . . . . 10.00%
116
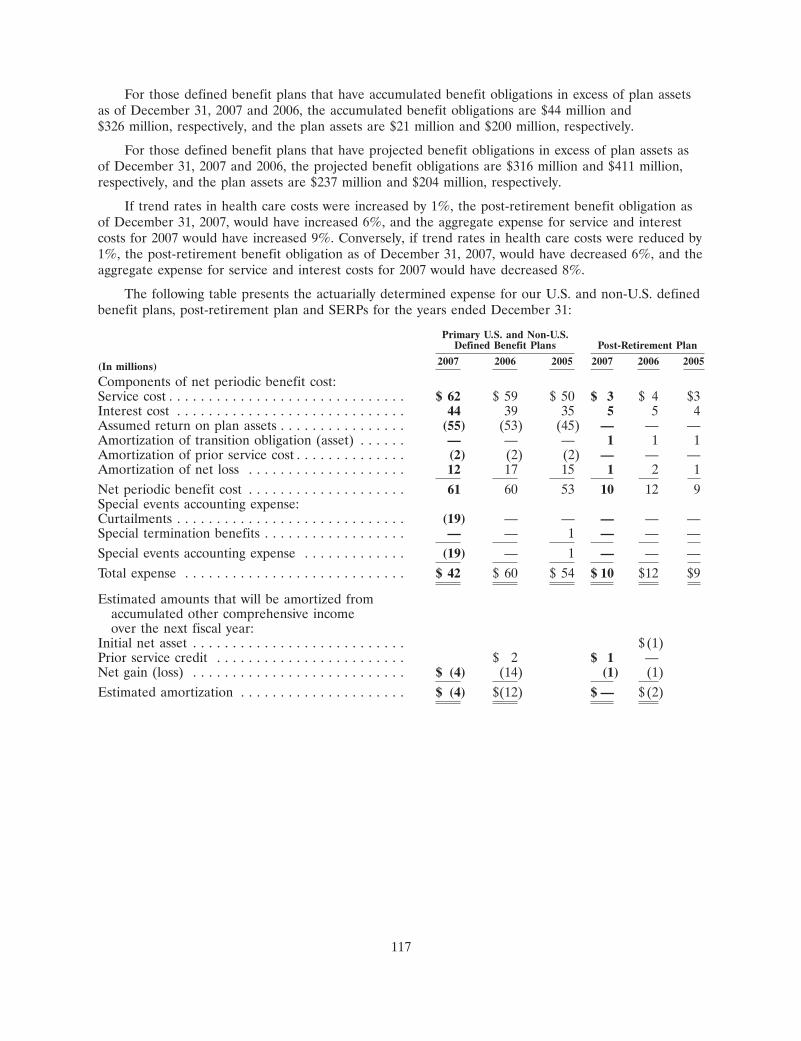
For those defined benefit plans that have accumulated benefit obligations in excess of plan assetsas of December 31, 2007 and 2006, the accumulated benefit obligations are $44 million and$326 million, respectively, and the plan assets are $21 million and $200 million, respectively.
For those defined benefit plans that have projected benefit obligations in excess of plan assets asof December 31, 2007 and 2006, the projected benefit obligations are $316 million and $411 million,respectively, and the plan assets are $237 million and $204 million, respectively.
If trend rates in health care costs were increased by 1%, the post-retirement benefit obligation asof December 31, 2007, would have increased 6%, and the aggregate expense for service and interestcosts for 2007 would have increased 9%. Conversely, if trend rates in health care costs were reduced by1%, the post-retirement benefit obligation as of December 31, 2007, would have decreased 6%, and theaggregate expense for service and interest costs for 2007 would have decreased 8%.
The following table presents the actuarially determined expense for our U.S. and non-U.S. definedbenefit plans, post-retirement plan and SERPs for the years ended December 31:
Primary U.S. and Non-U.S.Defined Benefit Plans Post-Retirement Plan
2007 2006 2005 2007 2006 2005(In millions)
Components of net periodic benefit cost:Service cost . . . . . . . . . . . . . . . . . . . . . . . . . . . . . . $ 62 $ 59 $ 50 $ 3 $ 4 $3Interest cost . . . . . . . . . . . . . . . . . . . . . . . . . . . . . 44 39 35 5 5 4Assumed return on plan assets . . . . . . . . . . . . . . . . (55) (53) (45) — — —Amortization of transition obligation (asset) . . . . . . — — — 1 1 1Amortization of prior service cost . . . . . . . . . . . . . . (2) (2) (2) — — —Amortization of net loss . . . . . . . . . . . . . . . . . . . . 12 17 15 1 2 1Net periodic benefit cost . . . . . . . . . . . . . . . . . . . . 61 60 53 10 12 9Special events accounting expense:Curtailments . . . . . . . . . . . . . . . . . . . . . . . . . . . . . (19) — — — — —Special termination benefits . . . . . . . . . . . . . . . . . . — — 1 — — —Special events accounting expense . . . . . . . . . . . . . (19) — 1 — — —Total expense . . . . . . . . . . . . . . . . . . . . . . . . . . . . $ 42 $ 60 $ 54 $ 10 $12 $9
Estimated amounts that will be amortized fromaccumulated other comprehensive incomeover the next fiscal year:
Initial net asset . . . . . . . . . . . . . . . . . . . . . . . . . . . $ (1)Prior service credit . . . . . . . . . . . . . . . . . . . . . . . . $ 2 $ 1 —Net gain (loss) . . . . . . . . . . . . . . . . . . . . . . . . . . . $ (4) (14) (1) (1)Estimated amortization . . . . . . . . . . . . . . . . . . . . . $ (4) $(12) $ — $(2)
117
Non-Qualified SERPs
2007 2006 2005(In millions)
Components of net periodic benefit cost:Service cost . . . . . . . . . . . . . . . . . . . . . . . . . . . . . . . . . . . . . . . . . . . . . . . . . $12 $ 6 $ 4Interest cost . . . . . . . . . . . . . . . . . . . . . . . . . . . . . . . . . . . . . . . . . . . . . . . . . 10 7 5Amortization of prior service cost . . . . . . . . . . . . . . . . . . . . . . . . . . . . . . . . . 2 2 2Amortization of net loss . . . . . . . . . . . . . . . . . . . . . . . . . . . . . . . . . . . . . . . . 5 4 2Net periodic benefit cost . . . . . . . . . . . . . . . . . . . . . . . . . . . . . . . . . . . . . . . . 29 19 13Special events accounting expense:Settlements . . . . . . . . . . . . . . . . . . . . . . . . . . . . . . . . . . . . . . . . . . . . . . . . . — — 2Curtailments . . . . . . . . . . . . . . . . . . . . . . . . . . . . . . . . . . . . . . . . . . . . . . . . 13 — —Special events accounting expense . . . . . . . . . . . . . . . . . . . . . . . . . . . . . . . . . 13 — 2Total expense . . . . . . . . . . . . . . . . . . . . . . . . . . . . . . . . . . . . . . . . . . . . . . . . $42 $19 $15
Estimated amounts that will be amortized from accumulated othercomprehensive income over the next fiscal year:
Prior service cost . . . . . . . . . . . . . . . . . . . . . . . . . . . . . . . . . . . . . . . . . . . . . $ (2)Net loss . . . . . . . . . . . . . . . . . . . . . . . . . . . . . . . . . . . . . . . . . . . . . . . . . . . . $(9) (4)Estimated amortization . . . . . . . . . . . . . . . . . . . . . . . . . . . . . . . . . . . . . . . . . $(9) $(6)
Certain of our U.S. employees are eligible to contribute a portion of their pre-tax salary to a401(k) savings plan and an Employee Stock Ownership Plan, referred to as an ‘‘ESOP.’’ Our matchingportion of these contributions is paid in cash, and the related expense was $25 million for 2007,$20 million for 2006 and $21 million for 2005. In addition, employees in certain non-U.S. officesparticipate in other local plans. Expenses related to these plans were $33 million, $32 million and$39 million for 2007, 2006 and 2005, respectively.
The ESOP is a non-leveraged plan. Compensation cost is equal to the contribution called for bythe plan formula and is equal to the cash contributed for the purchase of shares on the open market orthe fair value of the shares contributed from treasury stock. Dividends on shares held by the ESOP arecharged to retained earnings, and shares are treated as outstanding for purposes of calculating earningsper share.
Note 18. Occupancy Expense and Information Systems and Communications Expense
Occupancy expense and information systems and communications expense includes expense fordepreciation of buildings, leasehold improvements, computers, equipment and furniture and fixtures.Total depreciation expense for the years ended December 31, 2007, 2006 and 2005 was $319 million,$309 million and $315 million, respectively.
We lease approximately 865,000 square feet at One Lincoln Street, an office building located inBoston, Massachusetts, and a related 366,000 square-foot underground parking garage, under 20-year,non-cancelable capital leases expiring in September 2023. As of December 31, 2007 and 2006, anaggregate net book value of $421 million and $447 million, respectively, for the capital leases wasrecorded in premises and equipment in our consolidated statement of condition, and the relatedliability was recorded in long-term debt. Capital lease asset amortization is recorded in occupancyexpense over the lease terms. Lease payments are recorded as a reduction of the liability, with aportion recorded as imputed interest expense. For the years ended December 31, 2007 and 2006,interest expense related to these capital lease obligations, recorded in net interest revenue, was$36 million and $37 million, respectively. As of December 31, 2007 and 2006, accumulated amortizationof assets under capital leases was $110 million and $84 million, respectively.
118
We have entered into non-cancelable operating leases for premises and equipment. Nearly allleases include renewal options. Costs related to operating leases for office space are recorded inoccupancy expense. Costs related to operating leases for computers and equipment are recorded ininformation systems and communications expense.
Total rental expense, net of sublease revenue, amounted to $199 million, $179 million and$181 million in 2007, 2006 and 2005, respectively. Rental expense has been reduced by subleaserevenue of $15 million, $13 million and $10 million for the years ended December 31, 2007, 2006 and2005, respectively.
During 2007, we terminated an operating lease related to one of our office buildings in Boston.The lease was terminated in connection with an overall evaluation of our requirements for office spaceas a result of our acquisition of Investors Financial. The termination of the lease resulted in therecognition of a charge of approximately $91 million, which was included in the merger and integrationcosts recorded in connection with the acquisition. During 2005, we entered into sub-lease agreementsfor our headquarters building and other office space in Boston. These sub-lease agreements resulted inthe recognition of charges to occupancy expense of $26 million for the year ended December 31, 2005.
The following is a summary of future minimum lease payments under non-cancelable capital andoperating leases as of December 31, 2007. Future minimum rental commitments have been reduced byaggregate sublease rental commitments of $77 million for capital leases and $138 million for operatingleases. The increase in future lease payments compared to amounts reported in prior years resultedfrom the addition of approximately 1 million square feet of office space in connection with ouracquisition of Investors Financial.
Capital OperatingLeases Leases Total(In millions)
2008 . . . . . . . . . . . . . . . . . . . . . . . . . . . . . . . . . . . . . . . . . . . . . . . . . . . . $ 52 $ 225 $ 2772009 . . . . . . . . . . . . . . . . . . . . . . . . . . . . . . . . . . . . . . . . . . . . . . . . . . . . 52 219 2712010 . . . . . . . . . . . . . . . . . . . . . . . . . . . . . . . . . . . . . . . . . . . . . . . . . . . . 52 199 2512011 . . . . . . . . . . . . . . . . . . . . . . . . . . . . . . . . . . . . . . . . . . . . . . . . . . . . 52 164 2162012 . . . . . . . . . . . . . . . . . . . . . . . . . . . . . . . . . . . . . . . . . . . . . . . . . . . . 52 160 212Thereafter . . . . . . . . . . . . . . . . . . . . . . . . . . . . . . . . . . . . . . . . . . . . . . . 563 913 1,476
Total minimum lease payments . . . . . . . . . . . . . . . . . . . . . . . . . . . . . . . . . 823 $1,880 $2,703
Less amount representing interest payments . . . . . . . . . . . . . . . . . . . . . . . (337)
Present value of minimum lease payments . . . . . . . . . . . . . . . . . . . . . . . . $ 486
Note 19. Other Operating Expenses
The components of other operating expenses were as follows for the years ended December 31:
2007 2006 2005(In millions)
Professional services . . . . . . . . . . . . . . . . . . . . . . . . . . . . . . . . . . . . . . . . . . . . . $236 $157 $184Amortization of intangible assets . . . . . . . . . . . . . . . . . . . . . . . . . . . . . . . . . . . . 92 43 43Other . . . . . . . . . . . . . . . . . . . . . . . . . . . . . . . . . . . . . . . . . . . . . . . . . . . . . . . . 478 318 257Total other operating expenses . . . . . . . . . . . . . . . . . . . . . . . . . . . . . . . . . . . . . . $806 $518 $484
119
Note 20. Income Taxes
The components of income tax expense from continuing operations consisted of the following forthe years ended December 31:
2007 2006 2005(In millions)
Current:Federal . . . . . . . . . . . . . . . . . . . . . . . . . . . . . . . . . . . . . . . . . . . . . . . . . . . . . . $ 424 $328 $185State . . . . . . . . . . . . . . . . . . . . . . . . . . . . . . . . . . . . . . . . . . . . . . . . . . . . . . . . 133 82 46Non-U.S. . . . . . . . . . . . . . . . . . . . . . . . . . . . . . . . . . . . . . . . . . . . . . . . . . . . . 338 265 139Total current . . . . . . . . . . . . . . . . . . . . . . . . . . . . . . . . . . . . . . . . . . . . . . . . . . 895 675 370
Deferred:Federal . . . . . . . . . . . . . . . . . . . . . . . . . . . . . . . . . . . . . . . . . . . . . . . . . . . . . . (155) 27 83State . . . . . . . . . . . . . . . . . . . . . . . . . . . . . . . . . . . . . . . . . . . . . . . . . . . . . . . . (59) (9) 14Non-U.S. . . . . . . . . . . . . . . . . . . . . . . . . . . . . . . . . . . . . . . . . . . . . . . . . . . . . (39) (18) 20Total deferred . . . . . . . . . . . . . . . . . . . . . . . . . . . . . . . . . . . . . . . . . . . . . . . . . (253) — 117Total income tax expense from continuing operations . . . . . . . . . . . . . . . . . . . . . $ 642 $675 $487
The income tax expense (benefit) related to net realized securities gains or losses was $3 million,$6 million and $(1) million for 2007, 2006 and 2005, respectively. Pre-tax income from continuingoperations attributable to operations located outside the U.S. was $1.13 billion, $759 million and$494 million for 2007, 2006 and 2005, respectively.
For those foreign subsidiaries for which accumulated earnings of the subsidiary are considered tobe permanently invested, no provision for deferred U.S. income taxes is recorded. The totalundistributed retained earnings of these subsidiaries was $561 million at December 31, 2007. If theaccumulated earnings in these subsidiaries had been temporarily invested, a deferred U.S. tax liabilityof $107 million would have been recorded.
Income tax expense from continuing operations for 2006 included an additional provision of$35 million primarily related to the impact of the Tax Increase Prevention and Reconciliation Act onincome generated from certain of our leveraged leases, more fully described below, and $46 millionrelated to the potential resolution of issues with the IRS concerning our LILO and SILO transactions.Additional information about contingencies related to LILO and SILO transactions is in note 10.
During 2006, TIPRA repealed the federal income tax exclusion, effective on January 1, 2007, whichwas previously allowed for a portion of the income generated from certain leveraged leases of aircraft.As a result of this legislation, and in accordance with existing lease accounting standards, werecalculated the allocation of the components of leasing-related income over the terms of the affectedleases and recorded a non-cash charge to income tax expense of approximately $35 million primarilyrelated to the impact of this legislation.
120
Significant components of deferred tax liabilities and assets were as follows at December 31:
2007 2006(In millions)
Deferred tax liabilities:Lease financing transactions . . . . . . . . . . . . . . . . . . . . . . . . . . . . . . . . . . . . . . . . . $1,177 $1,779Foreign currency translation . . . . . . . . . . . . . . . . . . . . . . . . . . . . . . . . . . . . . . . . . 152 90Fixed and intangible assets . . . . . . . . . . . . . . . . . . . . . . . . . . . . . . . . . . . . . . . . . . 731 112Total deferred tax liabilities . . . . . . . . . . . . . . . . . . . . . . . . . . . . . . . . . . . . . . . . . . 2,060 1,981
Deferred tax assets:Unrealized losses on available-for-sale securities, net . . . . . . . . . . . . . . . . . . . . . . . 486 153Deferred compensation . . . . . . . . . . . . . . . . . . . . . . . . . . . . . . . . . . . . . . . . . . . . . 122 108Pension . . . . . . . . . . . . . . . . . . . . . . . . . . . . . . . . . . . . . . . . . . . . . . . . . . . . . . . . 85 81Operating expenses . . . . . . . . . . . . . . . . . . . . . . . . . . . . . . . . . . . . . . . . . . . . . . . 402 61Real estate . . . . . . . . . . . . . . . . . . . . . . . . . . . . . . . . . . . . . . . . . . . . . . . . . . . . . 56 26Other . . . . . . . . . . . . . . . . . . . . . . . . . . . . . . . . . . . . . . . . . . . . . . . . . . . . . . . . . 79 38Total deferred tax assets . . . . . . . . . . . . . . . . . . . . . . . . . . . . . . . . . . . . . . . . . . . . 1,230 467Net deferred tax liabilities . . . . . . . . . . . . . . . . . . . . . . . . . . . . . . . . . . . . . . . . . . . $ 830 $1,514
A reconciliation of the U.S. statutory income tax rate to the effective tax rate based on incomefrom continuing operations before income taxes was as follows for the years ended December 31:
2007 2006 2005
U.S. federal income tax rate . . . . . . . . . . . . . . . . . . . . . . . . . . . . . . . . . . . . . . . . 35.0% 35.0% 35.0%Changes from statutory rate:State taxes, net of federal benefit . . . . . . . . . . . . . . . . . . . . . . . . . . . . . . . . . . . . . 2.2 2.9 3.3Tax-exempt income . . . . . . . . . . . . . . . . . . . . . . . . . . . . . . . . . . . . . . . . . . . . . . . (1.7) (1.1) (1.5)Tax credits . . . . . . . . . . . . . . . . . . . . . . . . . . . . . . . . . . . . . . . . . . . . . . . . . . . . . (1.6) (1.4) (1.3)Foreign tax differential . . . . . . . . . . . . . . . . . . . . . . . . . . . . . . . . . . . . . . . . . . . . (2.2) (1.2) (1.0)Provision related to TIPRA . . . . . . . . . . . . . . . . . . . . . . . . . . . . . . . . . . . . . . . . . — 1.8 —Provision related to LILO and SILO transactions . . . . . . . . . . . . . . . . . . . . . . . . . 2.0 2.6 —Other, net . . . . . . . . . . . . . . . . . . . . . . . . . . . . . . . . . . . . . . . . . . . . . . . . . . . . . — (.5) (.5)Effective tax rate . . . . . . . . . . . . . . . . . . . . . . . . . . . . . . . . . . . . . . . . . . . . . . . . . 33.7% 38.1% 34.0%
As discussed in note 1, we applied the provisions of FASB Interpretation No. 48, Accounting forUncertainty in Income Taxes—an interpretation of FASB Statement No. 109, on January 1, 2007. Theapplication of the Interpretation’s provisions did not change our liability for unrecognized tax benefits.
An analysis of activity related to unrecognized tax benefits follows:
2007(In millions)
Balance at beginning of year . . . . . . . . . . . . . . . . . . . . . . . . . . . . . . . . . . . . $ 662Additions for tax positions of prior years . . . . . . . . . . . . . . . . . . . . . . . . . . . 150Settlements . . . . . . . . . . . . . . . . . . . . . . . . . . . . . . . . . . . . . . . . . . . . . . . . (507)
Balance at end of year . . . . . . . . . . . . . . . . . . . . . . . . . . . . . . . . . . . . . . . . $ 305
Included in the balance at December 31, 2007 is $285 million of tax positions for which theultimate deductibility is highly certain but for which there is uncertainty about the timing of suchdeductibility. Because of the impact of deferred tax accounting, the disallowance of the shorterdeductibility period would not affect the annual effective tax rate but would accelerate the payment ofcash to the taxing authority to an earlier period. Settlements include amounts remitted during 2007 andidentified amounts to be remitted in 2008.
121
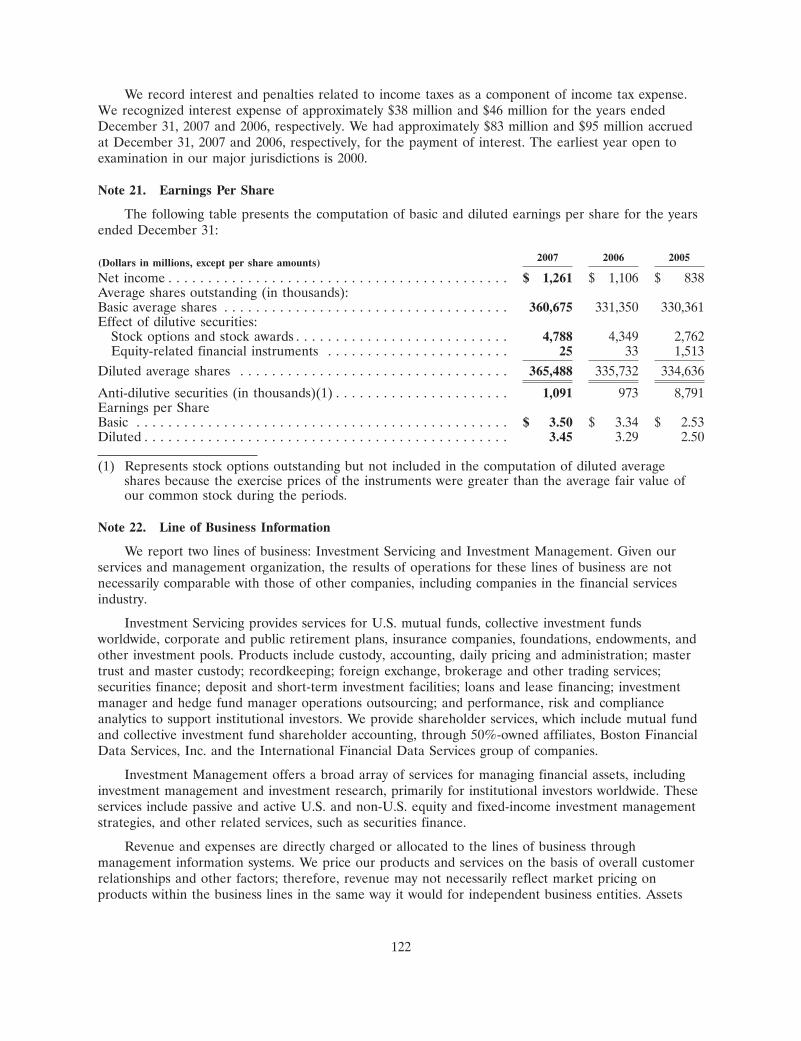
We record interest and penalties related to income taxes as a component of income tax expense.We recognized interest expense of approximately $38 million and $46 million for the years endedDecember 31, 2007 and 2006, respectively. We had approximately $83 million and $95 million accruedat December 31, 2007 and 2006, respectively, for the payment of interest. The earliest year open toexamination in our major jurisdictions is 2000.
Note 21. Earnings Per Share
The following table presents the computation of basic and diluted earnings per share for the yearsended December 31:
2007 2006 2005(Dollars in millions, except per share amounts)
Net income . . . . . . . . . . . . . . . . . . . . . . . . . . . . . . . . . . . . . . . . . . . $ 1,261 $ 1,106 $ 838Average shares outstanding (in thousands):Basic average shares . . . . . . . . . . . . . . . . . . . . . . . . . . . . . . . . . . . . 360,675 331,350 330,361Effect of dilutive securities:
Stock options and stock awards . . . . . . . . . . . . . . . . . . . . . . . . . . . 4,788 4,349 2,762Equity-related financial instruments . . . . . . . . . . . . . . . . . . . . . . . 25 33 1,513
Diluted average shares . . . . . . . . . . . . . . . . . . . . . . . . . . . . . . . . . . 365,488 335,732 334,636
Anti-dilutive securities (in thousands)(1) . . . . . . . . . . . . . . . . . . . . . . 1,091 973 8,791Earnings per ShareBasic . . . . . . . . . . . . . . . . . . . . . . . . . . . . . . . . . . . . . . . . . . . . . . . $ 3.50 $ 3.34 $ 2.53Diluted . . . . . . . . . . . . . . . . . . . . . . . . . . . . . . . . . . . . . . . . . . . . . . 3.45 3.29 2.50
(1) Represents stock options outstanding but not included in the computation of diluted averageshares because the exercise prices of the instruments were greater than the average fair value ofour common stock during the periods.
Note 22. Line of Business Information
We report two lines of business: Investment Servicing and Investment Management. Given ourservices and management organization, the results of operations for these lines of business are notnecessarily comparable with those of other companies, including companies in the financial servicesindustry.
Investment Servicing provides services for U.S. mutual funds, collective investment fundsworldwide, corporate and public retirement plans, insurance companies, foundations, endowments, andother investment pools. Products include custody, accounting, daily pricing and administration; mastertrust and master custody; recordkeeping; foreign exchange, brokerage and other trading services;securities finance; deposit and short-term investment facilities; loans and lease financing; investmentmanager and hedge fund manager operations outsourcing; and performance, risk and complianceanalytics to support institutional investors. We provide shareholder services, which include mutual fundand collective investment fund shareholder accounting, through 50%-owned affiliates, Boston FinancialData Services, Inc. and the International Financial Data Services group of companies.
Investment Management offers a broad array of services for managing financial assets, includinginvestment management and investment research, primarily for institutional investors worldwide. Theseservices include passive and active U.S. and non-U.S. equity and fixed-income investment managementstrategies, and other related services, such as securities finance.
Revenue and expenses are directly charged or allocated to the lines of business throughmanagement information systems. We price our products and services on the basis of overall customerrelationships and other factors; therefore, revenue may not necessarily reflect market pricing onproducts within the business lines in the same way it would for independent business entities. Assets
122
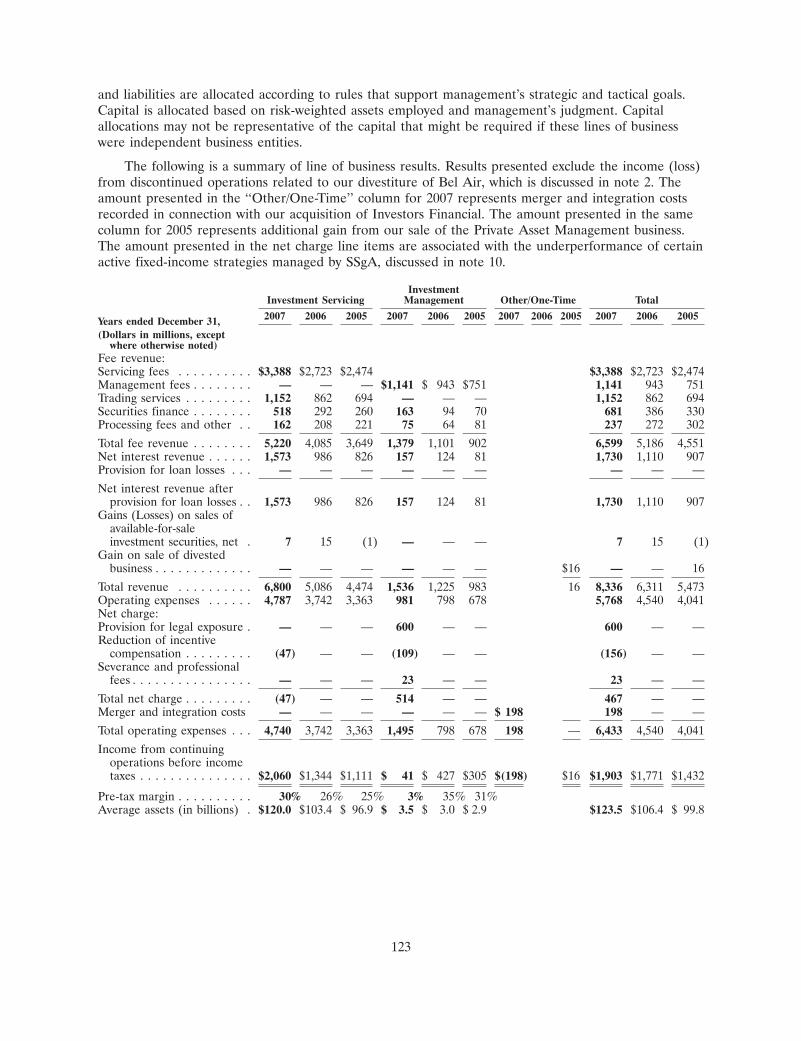
and liabilities are allocated according to rules that support management’s strategic and tactical goals.Capital is allocated based on risk-weighted assets employed and management’s judgment. Capitalallocations may not be representative of the capital that might be required if these lines of businesswere independent business entities.
The following is a summary of line of business results. Results presented exclude the income (loss)from discontinued operations related to our divestiture of Bel Air, which is discussed in note 2. Theamount presented in the ‘‘Other/One-Time’’ column for 2007 represents merger and integration costsrecorded in connection with our acquisition of Investors Financial. The amount presented in the samecolumn for 2005 represents additional gain from our sale of the Private Asset Management business.The amount presented in the net charge line items are associated with the underperformance of certainactive fixed-income strategies managed by SSgA, discussed in note 10.
InvestmentInvestment Servicing Management Other/One-Time Total
2007 2006 2005 2007 2006 2005 2007 2006 2005 2007 2006 2005Years ended December 31,(Dollars in millions, except
where otherwise noted)Fee revenue:Servicing fees . . . . . . . . . . $3,388 $2,723 $2,474 $3,388 $2,723 $2,474Management fees . . . . . . . . — — — $1,141 $ 943 $751 1,141 943 751Trading services . . . . . . . . . 1,152 862 694 — — — 1,152 862 694Securities finance . . . . . . . . 518 292 260 163 94 70 681 386 330Processing fees and other . . 162 208 221 75 64 81 237 272 302
Total fee revenue . . . . . . . . 5,220 4,085 3,649 1,379 1,101 902 6,599 5,186 4,551Net interest revenue . . . . . . 1,573 986 826 157 124 81 1,730 1,110 907Provision for loan losses . . . — — — — — — — — —
Net interest revenue afterprovision for loan losses . . 1,573 986 826 157 124 81 1,730 1,110 907
Gains (Losses) on sales ofavailable-for-saleinvestment securities, net . 7 15 (1) — — — 7 15 (1)
Gain on sale of divestedbusiness . . . . . . . . . . . . . — — — — — — $16 — — 16
Total revenue . . . . . . . . . . 6,800 5,086 4,474 1,536 1,225 983 16 8,336 6,311 5,473Operating expenses . . . . . . 4,787 3,742 3,363 981 798 678 5,768 4,540 4,041Net charge:Provision for legal exposure . — — — 600 — — 600 — —Reduction of incentive
compensation . . . . . . . . . (47) — — (109) — — (156) — —Severance and professional
fees . . . . . . . . . . . . . . . . — — — 23 — — 23 — —
Total net charge . . . . . . . . . (47) — — 514 — — 467 — —Merger and integration costs — — — — — — $ 198 198 — —
Total operating expenses . . . 4,740 3,742 3,363 1,495 798 678 198 — 6,433 4,540 4,041
Income from continuingoperations before incometaxes . . . . . . . . . . . . . . . $2,060 $1,344 $1,111 $ 41 $ 427 $305 $(198) $16 $1,903 $1,771 $1,432
Pre-tax margin . . . . . . . . . . 30% 26% 25% 3% 35% 31%Average assets (in billions) . $120.0 $103.4 $ 96.9 $ 3.5 $ 3.0 $ 2.9 $123.5 $106.4 $ 99.8
123
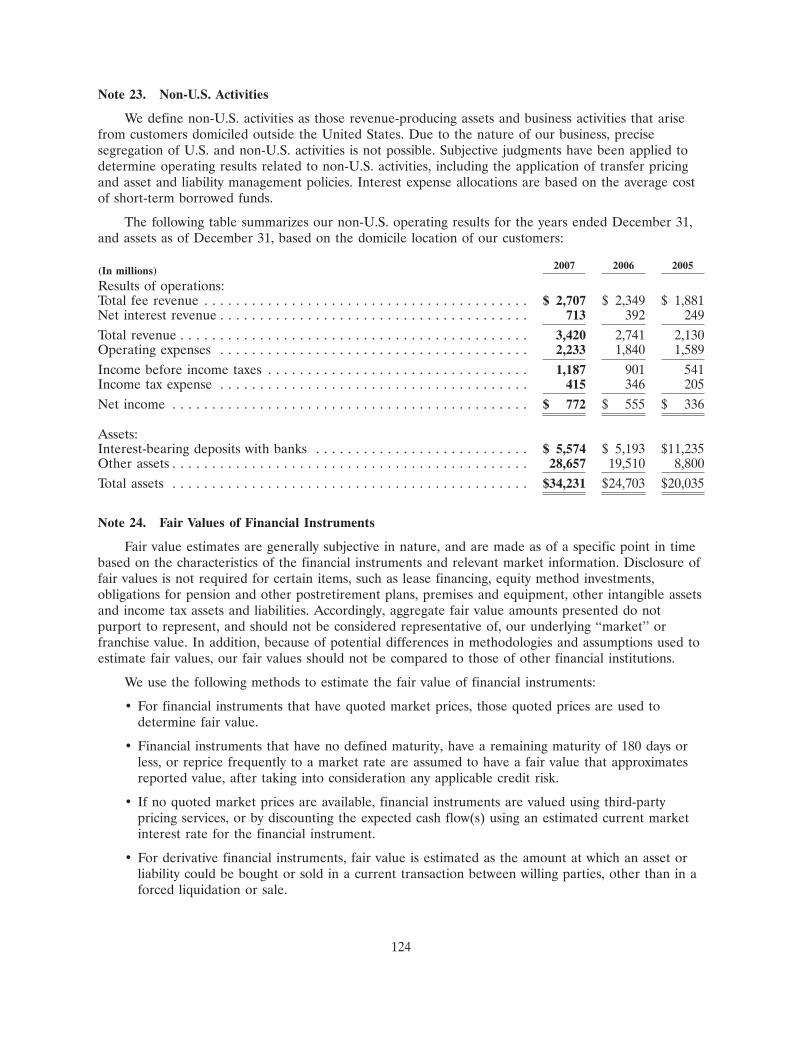
Note 23. Non-U.S. Activities
We define non-U.S. activities as those revenue-producing assets and business activities that arisefrom customers domiciled outside the United States. Due to the nature of our business, precisesegregation of U.S. and non-U.S. activities is not possible. Subjective judgments have been applied todetermine operating results related to non-U.S. activities, including the application of transfer pricingand asset and liability management policies. Interest expense allocations are based on the average costof short-term borrowed funds.
The following table summarizes our non-U.S. operating results for the years ended December 31,and assets as of December 31, based on the domicile location of our customers:
2007 2006 2005(In millions)
Results of operations:Total fee revenue . . . . . . . . . . . . . . . . . . . . . . . . . . . . . . . . . . . . . . . . . $ 2,707 $ 2,349 $ 1,881Net interest revenue . . . . . . . . . . . . . . . . . . . . . . . . . . . . . . . . . . . . . . . 713 392 249Total revenue . . . . . . . . . . . . . . . . . . . . . . . . . . . . . . . . . . . . . . . . . . . . 3,420 2,741 2,130Operating expenses . . . . . . . . . . . . . . . . . . . . . . . . . . . . . . . . . . . . . . . 2,233 1,840 1,589Income before income taxes . . . . . . . . . . . . . . . . . . . . . . . . . . . . . . . . . 1,187 901 541Income tax expense . . . . . . . . . . . . . . . . . . . . . . . . . . . . . . . . . . . . . . . 415 346 205Net income . . . . . . . . . . . . . . . . . . . . . . . . . . . . . . . . . . . . . . . . . . . . . $ 772 $ 555 $ 336
Assets:Interest-bearing deposits with banks . . . . . . . . . . . . . . . . . . . . . . . . . . . $ 5,574 $ 5,193 $11,235Other assets . . . . . . . . . . . . . . . . . . . . . . . . . . . . . . . . . . . . . . . . . . . . . 28,657 19,510 8,800Total assets . . . . . . . . . . . . . . . . . . . . . . . . . . . . . . . . . . . . . . . . . . . . . $34,231 $24,703 $20,035
Note 24. Fair Values of Financial Instruments
Fair value estimates are generally subjective in nature, and are made as of a specific point in timebased on the characteristics of the financial instruments and relevant market information. Disclosure offair values is not required for certain items, such as lease financing, equity method investments,obligations for pension and other postretirement plans, premises and equipment, other intangible assetsand income tax assets and liabilities. Accordingly, aggregate fair value amounts presented do notpurport to represent, and should not be considered representative of, our underlying ‘‘market’’ orfranchise value. In addition, because of potential differences in methodologies and assumptions used toestimate fair values, our fair values should not be compared to those of other financial institutions.
We use the following methods to estimate the fair value of financial instruments:
• For financial instruments that have quoted market prices, those quoted prices are used todetermine fair value.
• Financial instruments that have no defined maturity, have a remaining maturity of 180 days orless, or reprice frequently to a market rate are assumed to have a fair value that approximatesreported value, after taking into consideration any applicable credit risk.
• If no quoted market prices are available, financial instruments are valued using third-partypricing services, or by discounting the expected cash flow(s) using an estimated current marketinterest rate for the financial instrument.
• For derivative financial instruments, fair value is estimated as the amount at which an asset orliability could be bought or sold in a current transaction between willing parties, other than in aforced liquidation or sale.
124
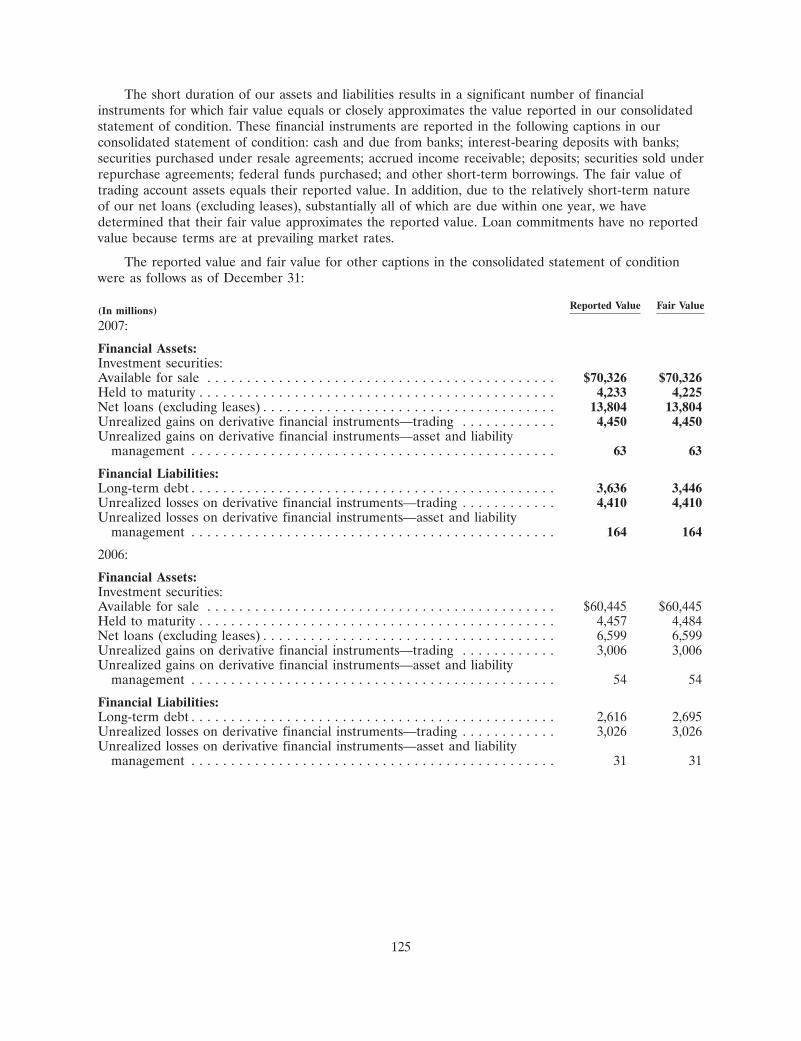
The short duration of our assets and liabilities results in a significant number of financialinstruments for which fair value equals or closely approximates the value reported in our consolidatedstatement of condition. These financial instruments are reported in the following captions in ourconsolidated statement of condition: cash and due from banks; interest-bearing deposits with banks;securities purchased under resale agreements; accrued income receivable; deposits; securities sold underrepurchase agreements; federal funds purchased; and other short-term borrowings. The fair value oftrading account assets equals their reported value. In addition, due to the relatively short-term natureof our net loans (excluding leases), substantially all of which are due within one year, we havedetermined that their fair value approximates the reported value. Loan commitments have no reportedvalue because terms are at prevailing market rates.
The reported value and fair value for other captions in the consolidated statement of conditionwere as follows as of December 31:
Reported Value Fair Value(In millions)
2007:
Financial Assets:Investment securities:Available for sale . . . . . . . . . . . . . . . . . . . . . . . . . . . . . . . . . . . . . . . . . . . . $70,326 $70,326Held to maturity . . . . . . . . . . . . . . . . . . . . . . . . . . . . . . . . . . . . . . . . . . . . . 4,233 4,225Net loans (excluding leases) . . . . . . . . . . . . . . . . . . . . . . . . . . . . . . . . . . . . . 13,804 13,804Unrealized gains on derivative financial instruments—trading . . . . . . . . . . . . 4,450 4,450Unrealized gains on derivative financial instruments—asset and liability
management . . . . . . . . . . . . . . . . . . . . . . . . . . . . . . . . . . . . . . . . . . . . . . 63 63
Financial Liabilities:Long-term debt . . . . . . . . . . . . . . . . . . . . . . . . . . . . . . . . . . . . . . . . . . . . . . 3,636 3,446Unrealized losses on derivative financial instruments—trading . . . . . . . . . . . . 4,410 4,410Unrealized losses on derivative financial instruments—asset and liability
management . . . . . . . . . . . . . . . . . . . . . . . . . . . . . . . . . . . . . . . . . . . . . . 164 164
2006:
Financial Assets:Investment securities:Available for sale . . . . . . . . . . . . . . . . . . . . . . . . . . . . . . . . . . . . . . . . . . . . $60,445 $60,445Held to maturity . . . . . . . . . . . . . . . . . . . . . . . . . . . . . . . . . . . . . . . . . . . . . 4,457 4,484Net loans (excluding leases) . . . . . . . . . . . . . . . . . . . . . . . . . . . . . . . . . . . . . 6,599 6,599Unrealized gains on derivative financial instruments—trading . . . . . . . . . . . . 3,006 3,006Unrealized gains on derivative financial instruments—asset and liability
management . . . . . . . . . . . . . . . . . . . . . . . . . . . . . . . . . . . . . . . . . . . . . . 54 54
Financial Liabilities:Long-term debt . . . . . . . . . . . . . . . . . . . . . . . . . . . . . . . . . . . . . . . . . . . . . . 2,616 2,695Unrealized losses on derivative financial instruments—trading . . . . . . . . . . . . 3,026 3,026Unrealized losses on derivative financial instruments—asset and liability
management . . . . . . . . . . . . . . . . . . . . . . . . . . . . . . . . . . . . . . . . . . . . . . 31 31
125
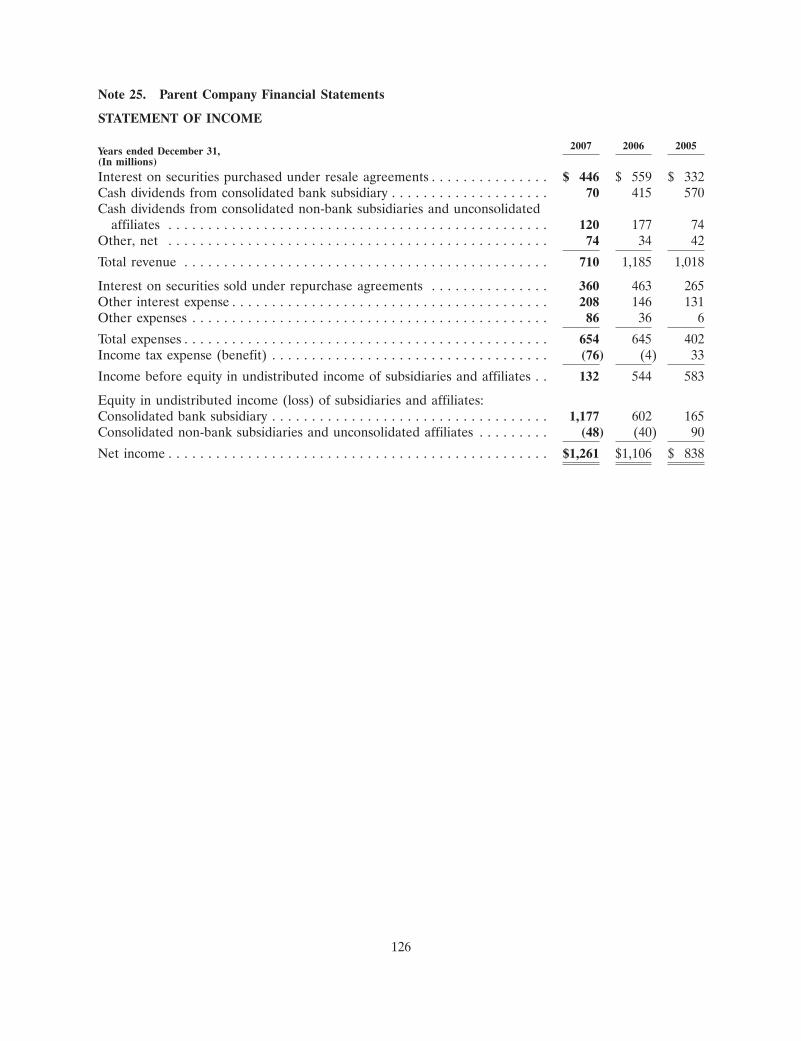
Note 25. Parent Company Financial Statements
STATEMENT OF INCOME
2007 2006 2005Years ended December 31,(In millions)
Interest on securities purchased under resale agreements . . . . . . . . . . . . . . . $ 446 $ 559 $ 332Cash dividends from consolidated bank subsidiary . . . . . . . . . . . . . . . . . . . . 70 415 570Cash dividends from consolidated non-bank subsidiaries and unconsolidated
affiliates . . . . . . . . . . . . . . . . . . . . . . . . . . . . . . . . . . . . . . . . . . . . . . . . 120 177 74Other, net . . . . . . . . . . . . . . . . . . . . . . . . . . . . . . . . . . . . . . . . . . . . . . . . 74 34 42
Total revenue . . . . . . . . . . . . . . . . . . . . . . . . . . . . . . . . . . . . . . . . . . . . . . 710 1,185 1,018
Interest on securities sold under repurchase agreements . . . . . . . . . . . . . . . 360 463 265Other interest expense . . . . . . . . . . . . . . . . . . . . . . . . . . . . . . . . . . . . . . . . 208 146 131Other expenses . . . . . . . . . . . . . . . . . . . . . . . . . . . . . . . . . . . . . . . . . . . . . 86 36 6
Total expenses . . . . . . . . . . . . . . . . . . . . . . . . . . . . . . . . . . . . . . . . . . . . . . 654 645 402Income tax expense (benefit) . . . . . . . . . . . . . . . . . . . . . . . . . . . . . . . . . . . (76) (4) 33
Income before equity in undistributed income of subsidiaries and affiliates . . 132 544 583
Equity in undistributed income (loss) of subsidiaries and affiliates:Consolidated bank subsidiary . . . . . . . . . . . . . . . . . . . . . . . . . . . . . . . . . . . 1,177 602 165Consolidated non-bank subsidiaries and unconsolidated affiliates . . . . . . . . . (48) (40) 90
Net income . . . . . . . . . . . . . . . . . . . . . . . . . . . . . . . . . . . . . . . . . . . . . . . . $1,261 $1,106 $ 838
126

STATEMENT OF CONDITION
2007 2006As of December 31,(In millions)
Assets:Interest-bearing deposits with bank subsidiary . . . . . . . . . . . . . . . . . . . . . . . . . . . . $ 2,067 $ 841Securities purchased under resale agreements from:
External parties . . . . . . . . . . . . . . . . . . . . . . . . . . . . . . . . . . . . . . . . . . . . . . . . 6,798 9,269Consolidated non-bank subsidiary and unconsolidated affiliates . . . . . . . . . . . . . 3 21
Investment securities available for sale . . . . . . . . . . . . . . . . . . . . . . . . . . . . . . . . . 122 103Investments in subsidiaries:
Consolidated bank subsidiary . . . . . . . . . . . . . . . . . . . . . . . . . . . . . . . . . . . . . . 11,932 6,768Consolidated non-bank subsidiaries . . . . . . . . . . . . . . . . . . . . . . . . . . . . . . . . . . 876 940Unconsolidated affiliates . . . . . . . . . . . . . . . . . . . . . . . . . . . . . . . . . . . . . . . . . 184 166
Notes and other receivables from:Consolidated bank subsidiary . . . . . . . . . . . . . . . . . . . . . . . . . . . . . . . . . . . . . . 205 3Consolidated non-bank subsidiaries and affiliates . . . . . . . . . . . . . . . . . . . . . . . . 210 120
Other assets . . . . . . . . . . . . . . . . . . . . . . . . . . . . . . . . . . . . . . . . . . . . . . . . . . . . 149 140
Total assets . . . . . . . . . . . . . . . . . . . . . . . . . . . . . . . . . . . . . . . . . . . . . . . . . . . . . $22,546 $18,371
Liabilities:Securities sold under repurchase agreements . . . . . . . . . . . . . . . . . . . . . . . . . . . . . $ 6,293 $ 8,772Commercial paper . . . . . . . . . . . . . . . . . . . . . . . . . . . . . . . . . . . . . . . . . . . . . . . . 2,355 998Accrued taxes, expenses and other liabilities due to:
Consolidated bank subsidiary . . . . . . . . . . . . . . . . . . . . . . . . . . . . . . . . . . . . . . 241 54Consolidated non-bank subsidiaries . . . . . . . . . . . . . . . . . . . . . . . . . . . . . . . . . . 11 7External parties . . . . . . . . . . . . . . . . . . . . . . . . . . . . . . . . . . . . . . . . . . . . . . . . 218 167
Long-term debt . . . . . . . . . . . . . . . . . . . . . . . . . . . . . . . . . . . . . . . . . . . . . . . . . . 2,129 1,121
Total liabilities . . . . . . . . . . . . . . . . . . . . . . . . . . . . . . . . . . . . . . . . . . . . . . . . . . 11,247 11,119Shareholders’ equity . . . . . . . . . . . . . . . . . . . . . . . . . . . . . . . . . . . . . . . . . . . . . . 11,299 7,252
Total liabilities and shareholders’ equity . . . . . . . . . . . . . . . . . . . . . . . . . . . . . . . . $22,546 $18,371
127
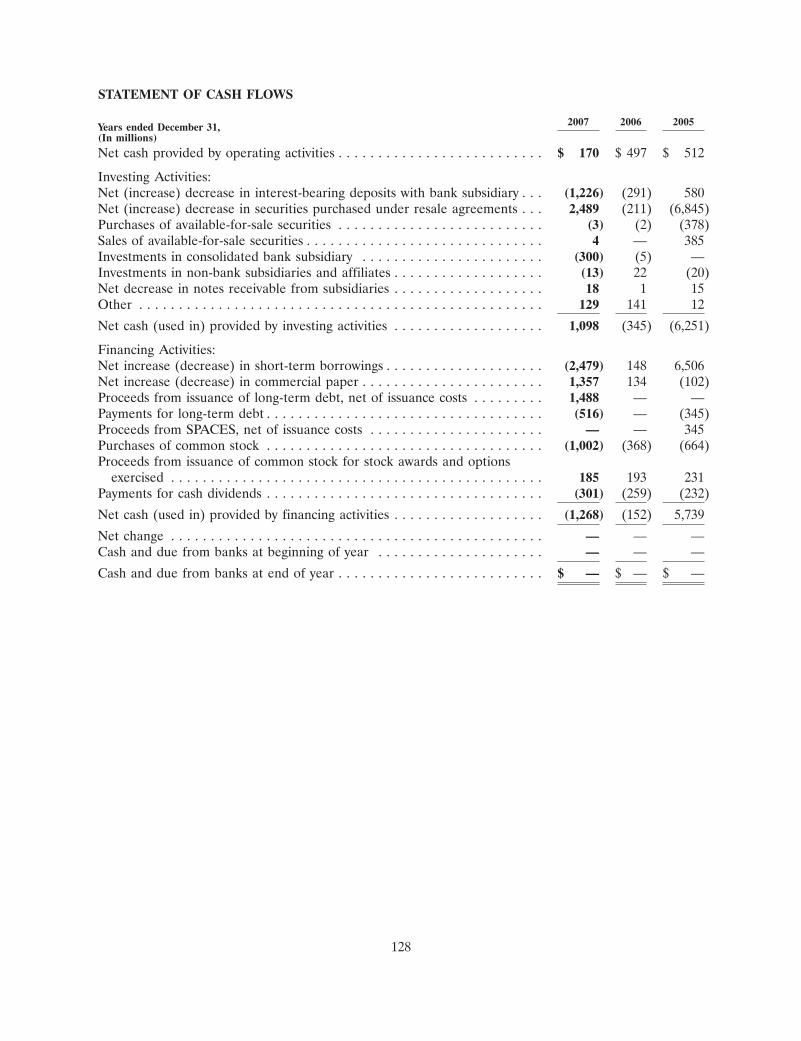
STATEMENT OF CASH FLOWS
2007 2006 2005Years ended December 31,(In millions)
Net cash provided by operating activities . . . . . . . . . . . . . . . . . . . . . . . . . . $ 170 $ 497 $ 512
Investing Activities:Net (increase) decrease in interest-bearing deposits with bank subsidiary . . . (1,226) (291) 580Net (increase) decrease in securities purchased under resale agreements . . . 2,489 (211) (6,845)Purchases of available-for-sale securities . . . . . . . . . . . . . . . . . . . . . . . . . . (3) (2) (378)Sales of available-for-sale securities . . . . . . . . . . . . . . . . . . . . . . . . . . . . . . 4 — 385Investments in consolidated bank subsidiary . . . . . . . . . . . . . . . . . . . . . . . (300) (5) —Investments in non-bank subsidiaries and affiliates . . . . . . . . . . . . . . . . . . . (13) 22 (20)Net decrease in notes receivable from subsidiaries . . . . . . . . . . . . . . . . . . . 18 1 15Other . . . . . . . . . . . . . . . . . . . . . . . . . . . . . . . . . . . . . . . . . . . . . . . . . . . 129 141 12
Net cash (used in) provided by investing activities . . . . . . . . . . . . . . . . . . . 1,098 (345) (6,251)
Financing Activities:Net increase (decrease) in short-term borrowings . . . . . . . . . . . . . . . . . . . . (2,479) 148 6,506Net increase (decrease) in commercial paper . . . . . . . . . . . . . . . . . . . . . . . 1,357 134 (102)Proceeds from issuance of long-term debt, net of issuance costs . . . . . . . . . 1,488 — —Payments for long-term debt . . . . . . . . . . . . . . . . . . . . . . . . . . . . . . . . . . . (516) — (345)Proceeds from SPACES, net of issuance costs . . . . . . . . . . . . . . . . . . . . . . — — 345Purchases of common stock . . . . . . . . . . . . . . . . . . . . . . . . . . . . . . . . . . . (1,002) (368) (664)Proceeds from issuance of common stock for stock awards and options
exercised . . . . . . . . . . . . . . . . . . . . . . . . . . . . . . . . . . . . . . . . . . . . . . . 185 193 231Payments for cash dividends . . . . . . . . . . . . . . . . . . . . . . . . . . . . . . . . . . . (301) (259) (232)
Net cash (used in) provided by financing activities . . . . . . . . . . . . . . . . . . . (1,268) (152) 5,739
Net change . . . . . . . . . . . . . . . . . . . . . . . . . . . . . . . . . . . . . . . . . . . . . . . — — —Cash and due from banks at beginning of year . . . . . . . . . . . . . . . . . . . . . — — —
Cash and due from banks at end of year . . . . . . . . . . . . . . . . . . . . . . . . . . $ — $ — $ —
128
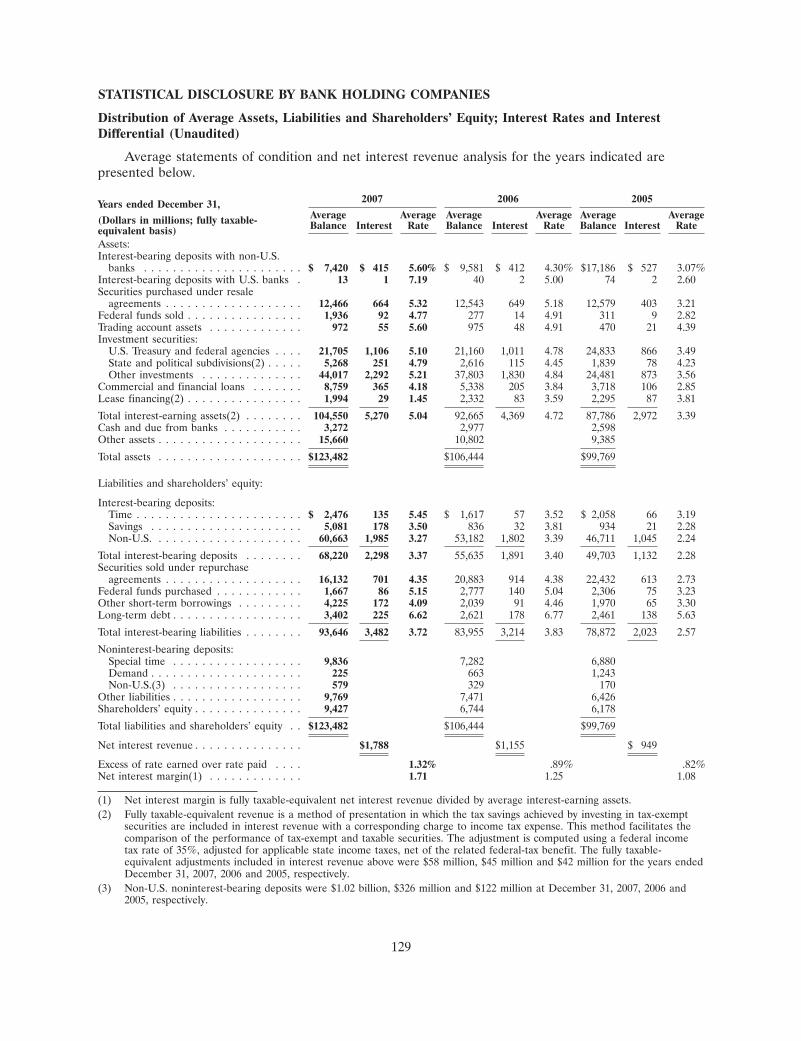
STATISTICAL DISCLOSURE BY BANK HOLDING COMPANIES
Distribution of Average Assets, Liabilities and Shareholders’ Equity; Interest Rates and InterestDifferential (Unaudited)
Average statements of condition and net interest revenue analysis for the years indicated arepresented below.
2007 2006 2005Years ended December 31,Average Average Average Average Average Average(Dollars in millions; fully taxable- Balance Interest Rate Balance Interest Rate Balance Interest Rateequivalent basis)
Assets:Interest-bearing deposits with non-U.S.
banks . . . . . . . . . . . . . . . . . . . . . . $ 7,420 $ 415 5.60% $ 9,581 $ 412 4.30% $17,186 $ 527 3.07%Interest-bearing deposits with U.S. banks . 13 1 7.19 40 2 5.00 74 2 2.60Securities purchased under resale
agreements . . . . . . . . . . . . . . . . . . . 12,466 664 5.32 12,543 649 5.18 12,579 403 3.21Federal funds sold . . . . . . . . . . . . . . . . 1,936 92 4.77 277 14 4.91 311 9 2.82Trading account assets . . . . . . . . . . . . . 972 55 5.60 975 48 4.91 470 21 4.39Investment securities:
U.S. Treasury and federal agencies . . . . 21,705 1,106 5.10 21,160 1,011 4.78 24,833 866 3.49State and political subdivisions(2) . . . . . 5,268 251 4.79 2,616 115 4.45 1,839 78 4.23Other investments . . . . . . . . . . . . . . 44,017 2,292 5.21 37,803 1,830 4.84 24,481 873 3.56
Commercial and financial loans . . . . . . . 8,759 365 4.18 5,338 205 3.84 3,718 106 2.85Lease financing(2) . . . . . . . . . . . . . . . . 1,994 29 1.45 2,332 83 3.59 2,295 87 3.81
Total interest-earning assets(2) . . . . . . . . 104,550 5,270 5.04 92,665 4,369 4.72 87,786 2,972 3.39Cash and due from banks . . . . . . . . . . . 3,272 2,977 2,598Other assets . . . . . . . . . . . . . . . . . . . . 15,660 10,802 9,385
Total assets . . . . . . . . . . . . . . . . . . . . $123,482 $106,444 $99,769
Liabilities and shareholders’ equity:
Interest-bearing deposits:Time . . . . . . . . . . . . . . . . . . . . . . . $ 2,476 135 5.45 $ 1,617 57 3.52 $ 2,058 66 3.19Savings . . . . . . . . . . . . . . . . . . . . . 5,081 178 3.50 836 32 3.81 934 21 2.28Non-U.S. . . . . . . . . . . . . . . . . . . . . 60,663 1,985 3.27 53,182 1,802 3.39 46,711 1,045 2.24
Total interest-bearing deposits . . . . . . . . 68,220 2,298 3.37 55,635 1,891 3.40 49,703 1,132 2.28Securities sold under repurchase
agreements . . . . . . . . . . . . . . . . . . . 16,132 701 4.35 20,883 914 4.38 22,432 613 2.73Federal funds purchased . . . . . . . . . . . . 1,667 86 5.15 2,777 140 5.04 2,306 75 3.23Other short-term borrowings . . . . . . . . . 4,225 172 4.09 2,039 91 4.46 1,970 65 3.30Long-term debt . . . . . . . . . . . . . . . . . . 3,402 225 6.62 2,621 178 6.77 2,461 138 5.63
Total interest-bearing liabilities . . . . . . . . 93,646 3,482 3.72 83,955 3,214 3.83 78,872 2,023 2.57
Noninterest-bearing deposits:Special time . . . . . . . . . . . . . . . . . . 9,836 7,282 6,880Demand . . . . . . . . . . . . . . . . . . . . . 225 663 1,243Non-U.S.(3) . . . . . . . . . . . . . . . . . . 579 329 170
Other liabilities . . . . . . . . . . . . . . . . . . 9,769 7,471 6,426Shareholders’ equity . . . . . . . . . . . . . . . 9,427 6,744 6,178
Total liabilities and shareholders’ equity . . $123,482 $106,444 $99,769
Net interest revenue . . . . . . . . . . . . . . . $1,788 $1,155 $ 949
Excess of rate earned over rate paid . . . . 1.32% .89% .82%Net interest margin(1) . . . . . . . . . . . . . 1.71 1.25 1.08
(1) Net interest margin is fully taxable-equivalent net interest revenue divided by average interest-earning assets.(2) Fully taxable-equivalent revenue is a method of presentation in which the tax savings achieved by investing in tax-exempt
securities are included in interest revenue with a corresponding charge to income tax expense. This method facilitates thecomparison of the performance of tax-exempt and taxable securities. The adjustment is computed using a federal incometax rate of 35%, adjusted for applicable state income taxes, net of the related federal-tax benefit. The fully taxable-equivalent adjustments included in interest revenue above were $58 million, $45 million and $42 million for the years endedDecember 31, 2007, 2006 and 2005, respectively.
(3) Non-U.S. noninterest-bearing deposits were $1.02 billion, $326 million and $122 million at December 31, 2007, 2006 and2005, respectively.
129
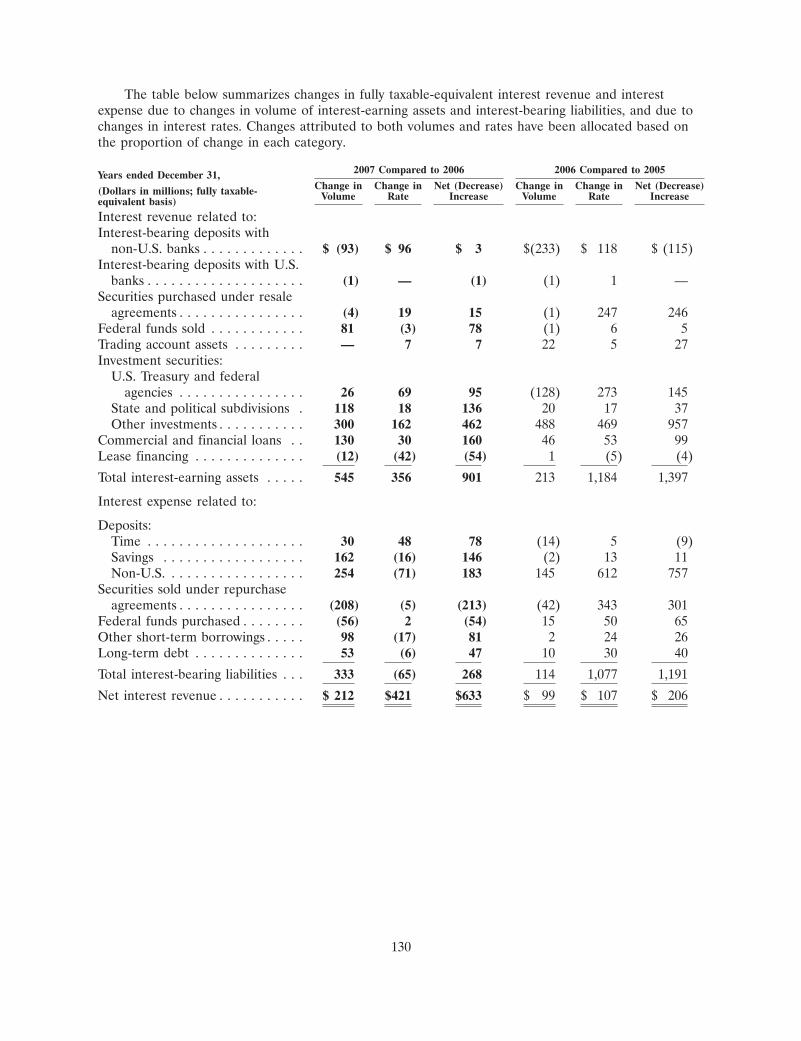
The table below summarizes changes in fully taxable-equivalent interest revenue and interestexpense due to changes in volume of interest-earning assets and interest-bearing liabilities, and due tochanges in interest rates. Changes attributed to both volumes and rates have been allocated based onthe proportion of change in each category.
2007 Compared to 2006 2006 Compared to 2005Years ended December 31,Change in Change in Net (Decrease) Change in Change in Net (Decrease)(Dollars in millions; fully taxable- Volume Rate Increase Volume Rate Increaseequivalent basis)
Interest revenue related to:Interest-bearing deposits with
non-U.S. banks . . . . . . . . . . . . . $ (93) $ 96 $ 3 $(233) $ 118 $ (115)Interest-bearing deposits with U.S.
banks . . . . . . . . . . . . . . . . . . . . (1) — (1) (1) 1 —Securities purchased under resale
agreements . . . . . . . . . . . . . . . . (4) 19 15 (1) 247 246Federal funds sold . . . . . . . . . . . . 81 (3) 78 (1) 6 5Trading account assets . . . . . . . . . — 7 7 22 5 27Investment securities:
U.S. Treasury and federalagencies . . . . . . . . . . . . . . . . 26 69 95 (128) 273 145
State and political subdivisions . 118 18 136 20 17 37Other investments . . . . . . . . . . . 300 162 462 488 469 957
Commercial and financial loans . . 130 30 160 46 53 99Lease financing . . . . . . . . . . . . . . (12) (42) (54) 1 (5) (4)
Total interest-earning assets . . . . . 545 356 901 213 1,184 1,397
Interest expense related to:
Deposits:Time . . . . . . . . . . . . . . . . . . . . 30 48 78 (14) 5 (9)Savings . . . . . . . . . . . . . . . . . . 162 (16) 146 (2) 13 11Non-U.S. . . . . . . . . . . . . . . . . . 254 (71) 183 145 612 757
Securities sold under repurchaseagreements . . . . . . . . . . . . . . . . (208) (5) (213) (42) 343 301
Federal funds purchased . . . . . . . . (56) 2 (54) 15 50 65Other short-term borrowings . . . . . 98 (17) 81 2 24 26Long-term debt . . . . . . . . . . . . . . 53 (6) 47 10 30 40
Total interest-bearing liabilities . . . 333 (65) 268 114 1,077 1,191
Net interest revenue . . . . . . . . . . . $ 212 $421 $633 $ 99 $ 107 $ 206
130
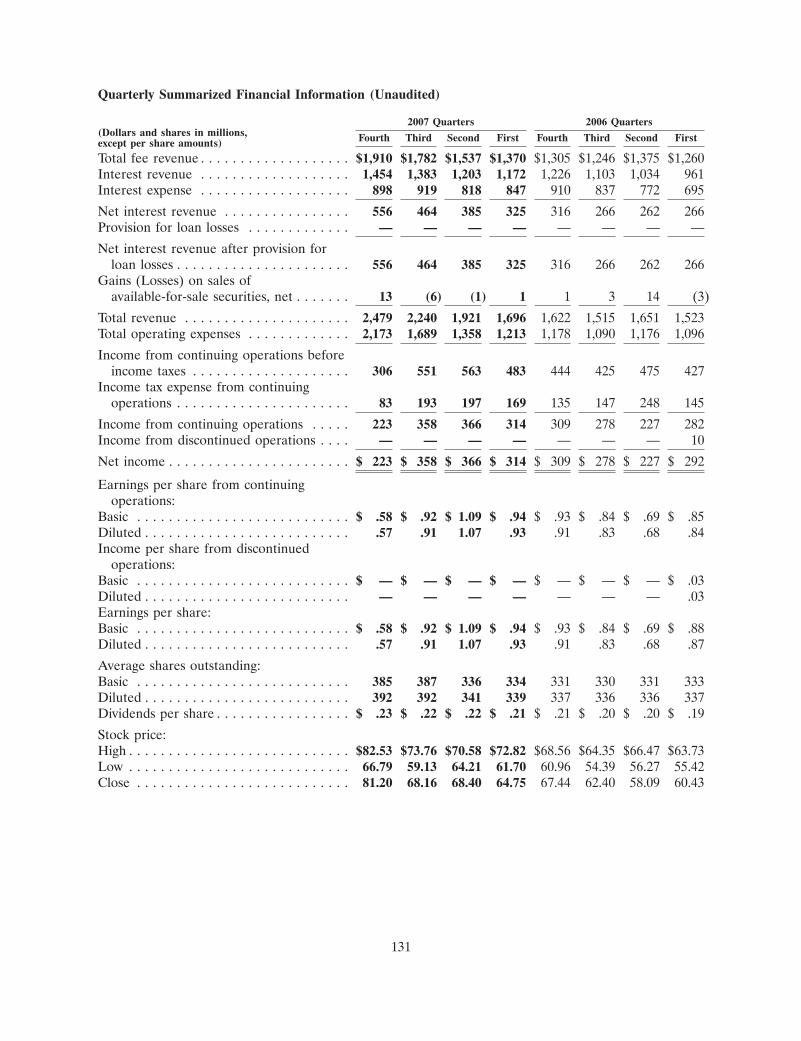
Quarterly Summarized Financial Information (Unaudited)
2007 Quarters 2006 Quarters(Dollars and shares in millions, Fourth Third Second First Fourth Third Second Firstexcept per share amounts)
Total fee revenue . . . . . . . . . . . . . . . . . . . $1,910 $1,782 $1,537 $1,370 $1,305 $1,246 $1,375 $1,260Interest revenue . . . . . . . . . . . . . . . . . . . 1,454 1,383 1,203 1,172 1,226 1,103 1,034 961Interest expense . . . . . . . . . . . . . . . . . . . 898 919 818 847 910 837 772 695
Net interest revenue . . . . . . . . . . . . . . . . 556 464 385 325 316 266 262 266Provision for loan losses . . . . . . . . . . . . . — — — — — — — —
Net interest revenue after provision forloan losses . . . . . . . . . . . . . . . . . . . . . . 556 464 385 325 316 266 262 266
Gains (Losses) on sales ofavailable-for-sale securities, net . . . . . . . 13 (6) (1) 1 1 3 14 (3)
Total revenue . . . . . . . . . . . . . . . . . . . . . 2,479 2,240 1,921 1,696 1,622 1,515 1,651 1,523Total operating expenses . . . . . . . . . . . . . 2,173 1,689 1,358 1,213 1,178 1,090 1,176 1,096
Income from continuing operations beforeincome taxes . . . . . . . . . . . . . . . . . . . . 306 551 563 483 444 425 475 427
Income tax expense from continuingoperations . . . . . . . . . . . . . . . . . . . . . . 83 193 197 169 135 147 248 145
Income from continuing operations . . . . . 223 358 366 314 309 278 227 282Income from discontinued operations . . . . — — — — — — — 10
Net income . . . . . . . . . . . . . . . . . . . . . . . $ 223 $ 358 $ 366 $ 314 $ 309 $ 278 $ 227 $ 292
Earnings per share from continuingoperations:
Basic . . . . . . . . . . . . . . . . . . . . . . . . . . . $ .58 $ .92 $ 1.09 $ .94 $ .93 $ .84 $ .69 $ .85Diluted . . . . . . . . . . . . . . . . . . . . . . . . . . .57 .91 1.07 .93 .91 .83 .68 .84Income per share from discontinued
operations:Basic . . . . . . . . . . . . . . . . . . . . . . . . . . . $ — $ — $ — $ — $ — $ — $ — $ .03Diluted . . . . . . . . . . . . . . . . . . . . . . . . . . — — — — — — — .03Earnings per share:Basic . . . . . . . . . . . . . . . . . . . . . . . . . . . $ .58 $ .92 $ 1.09 $ .94 $ .93 $ .84 $ .69 $ .88Diluted . . . . . . . . . . . . . . . . . . . . . . . . . . .57 .91 1.07 .93 .91 .83 .68 .87
Average shares outstanding:Basic . . . . . . . . . . . . . . . . . . . . . . . . . . . 385 387 336 334 331 330 331 333Diluted . . . . . . . . . . . . . . . . . . . . . . . . . . 392 392 341 339 337 336 336 337Dividends per share . . . . . . . . . . . . . . . . . $ .23 $ .22 $ .22 $ .21 $ .21 $ .20 $ .20 $ .19
Stock price:High . . . . . . . . . . . . . . . . . . . . . . . . . . . . $82.53 $73.76 $70.58 $72.82 $68.56 $64.35 $66.47 $63.73Low . . . . . . . . . . . . . . . . . . . . . . . . . . . . 66.79 59.13 64.21 61.70 60.96 54.39 56.27 55.42Close . . . . . . . . . . . . . . . . . . . . . . . . . . . 81.20 68.16 68.40 64.75 67.44 62.40 58.09 60.43
131
ITEM 9. CHANGES IN AND DISAGREEMENTS WITH ACCOUNTANTS ON ACCOUNTING ANDFINANCIAL DISCLOSURE
None.
ITEM 9A. CONTROLS AND PROCEDURES
DISCLOSURE CONTROLS AND PROCEDURES: CHANGES IN INTERNAL CONTROL OVERFINANCIAL REPORTING
State Street has established and maintains disclosure controls and procedures that are designed toensure that material information relating to State Street and its subsidiaries on a consolidated basisrequired to be disclosed in its reports filed or submitted under the Securities Exchange Act of 1934 isrecorded, processed, summarized, and reported within the time periods specified in the SEC’s rules andforms, and that such information is accumulated and communicated to State Street management,including its Chief Executive Officer and Chief Financial Officer, as appropriate, to allow timelydecisions regarding required disclosure. For the fiscal quarter ended December 31, 2007, State Streetcarried out an evaluation, under the supervision and with the participation of State Street management,including its Chief Executive Officer and Chief Financial Officer, of the effectiveness of the design andoperation of State Street’s disclosure controls and procedures. Based on the evaluation of thesedisclosure controls and procedures, the Chief Executive Officer and Chief Financial Officer concludedthat State Street’s disclosure controls and procedures were effective as of December 31, 2007.
State Street has also established and maintains internal control over financial reporting as aprocess designed to provide reasonable assurance regarding the reliability of financial reporting and thepreparation of consolidated financial statements for external purposes in accordance with accountingprinciples generally accepted in the United States. In the ordinary course of business, State Streetroutinely enhances its internal controls and procedures for financial reporting by either upgrading itscurrent systems or implementing new systems. Changes have been made and will be made to StateStreet’s internal controls and procedures for financial reporting as a result of these efforts. During thefiscal quarter ended December 31, 2007, there was no change in State Street’s internal control overfinancial reporting that has materially affected, or is reasonably likely to materially affect, State Street’sinternal control over financial reporting.
INTERNAL CONTROL OVER FINANCIAL REPORTING
Management’s Report on Internal Control Over Financial Reporting
The management of State Street is responsible for the preparation and fair presentation of thefinancial statements and other financial information contained in this Form 10-K. Management is alsoresponsible for establishing and maintaining adequate internal control over financial reporting.Management has designed business processes and internal controls and has also established and isresponsible for maintaining a business culture that fosters financial integrity and accurate reporting. Tothese ends, management maintains a comprehensive system of internal controls intended to providereasonable assurances regarding the reliability of financial reporting and the preparation of theconsolidated financial statements of State Street in accordance with generally accepted accountingprinciples. State Street’s accounting policies and internal control over financial reporting, establishedand maintained by management, are under the general oversight of State Street’s Board of Directors,including State Street’s Examining and Audit Committee.
Management has made a comprehensive review, evaluation, and assessment of State Street’sinternal control over financial reporting as of December 31, 2007. The standard measures adopted bymanagement in making its evaluation are the measures in the Integrated Framework published by theCommittee of Sponsoring Organizations of the Treadway Commission (the COSO Framework).
132

Based upon its review and evaluation, management has concluded that State Street’s internalcontrol over financial reporting is effective at December 31, 2007, and that there were no materialweaknesses in State Street’s internal control over financial reporting as of that date.
Ernst & Young LLP, an independent registered public accounting firm, which has audited andreported on the consolidated financial statements contained in this Form 10-K, has issued its writtenattestation report on its assessment of State Street’s internal control over financial reporting whichfollows this report.
133
29JAN200801230360
Report of Independent Registered Public Accounting Firm on Internal Control Over FinancialReporting
THE SHAREHOLDERS AND BOARD OF DIRECTORSSTATE STREET CORPORATION
We have audited State Street Corporation’s internal control over financial reporting as ofDecember 31, 2007, based on criteria established in Internal Control—Integrated Framework issued bythe Committee of Sponsoring Organizations of the Treadway Commission (the COSO criteria). StateStreet Corporation’s management is responsible for maintaining effective internal control over financialreporting and for its assessment of the effectiveness of internal control over financial reporting includedin the accompanying Management’s Report on Internal Control over Financial Reporting. Ourresponsibility is to express an opinion on the company’s internal control over financial reporting basedon our audit.
We conducted our audit in accordance with the standards of the Public Company AccountingOversight Board (United States). Those standards require that we plan and perform the audit to obtainreasonable assurance about whether effective internal control over financial reporting was maintainedin all material respects. Our audit included obtaining an understanding of internal control overfinancial reporting, assessing the risk that a weakness exists, testing and evaluating the design andoperating effectiveness of internal control based on the assessed risk, and performing such otherprocedures as we considered necessary in the circumstances. We believe that our audit provides areasonable basis for our opinion.
A company’s internal control over financial reporting is a process designed to provide reasonableassurance regarding the reliability of financial reporting and the preparation of financial statements forexternal purposes in accordance with generally accepted accounting principles. A company’s internalcontrol over financial reporting includes those policies and procedures that (1) pertain to themaintenance of records that, in reasonable detail, accurately and fairly reflect the transactions anddispositions of the assets of the company; (2) provide reasonable assurance that transactions arerecorded as necessary to permit preparation of financial statements in accordance with generallyaccepted accounting principles, and that receipts and expenditures of the company are being made onlyin accordance with authorizations of management and directors of the company; and (3) providereasonable assurance regarding prevention or timely detection of unauthorized acquisition, use, ordisposition of the company’s assets that could have a material effect on the financial statements.
Because of its inherent limitations, internal control over financial reporting may not prevent ordetect misstatements. Also, projections of any evaluation of effectiveness to future periods are subjectto the risk that controls may become inadequate because of changes in conditions, or that the degreeof compliance with the policies or procedures may deteriorate.
In our opinion, State Street Corporation maintained, in all material respects, effective internalcontrol over financial reporting as of December 31, 2007, based on the COSO criteria.
We also have audited, in accordance with the standards of the Public Company AccountingOversight Board (United States), the consolidated statement of condition of State Street Corporationas of December 31, 2007 and 2006, and the related consolidated statements of income, changes inshareholders’ equity, and cash flows for each of the three years in the period ended December 31, 2007of State Street Corporation and our report dated February 14, 2008 expressed an unqualified opinionthereon.
Boston, MassachusettsFebruary 14, 2008
134
ITEM 9B. OTHER INFORMATION
None.
PART III
ITEM 10. DIRECTORS, EXECUTIVE OFFICERS AND CORPORATE GOVERNANCE
Information concerning our directors will appear in our Proxy Statement for the 2008 AnnualMeeting of Shareholders, to be filed pursuant to Regulation 14A on or before April 30, 2008, underthe caption ‘‘Election of Directors.’’ Such information is incorporated herein by reference.
Information about two current directors of State Street who will be retiring as directors at the 2008Annual Meeting of Shareholders is as follows:
TENLEY E. ALBRIGHT, M.D. Director since 1993
Physician and surgeon. Dr. Albright, age 72, Director, Collaborative Initiatives at MIT, is Chairman ofWestern Resources, Inc., a real estate holding company. Dr. Albright’s concentration in medicine andhealth services stems from her specialty of general surgery over 23 years. She is a faculty member andlecturer in surgery at Harvard Medical School and an honorary member of New England BaptistHospital. Dr. Albright is consultant to and formerly chairman of the Board of Regents of the NationalLibrary of Medicine at the National Institutes of Health. She has served on the Board of theWhitehead Institute for Biomedical Research, was recently elected to the Board of Research!America,and is a member of the corporation of Woods Hole Oceanographic Institution. Dr. Albright graduatedfrom Harvard Medical School after attending Radcliffe College, and has received eight honorarydegrees.
ARTHUR L. GOLDSTEIN Director since 1995
Retired Chairman and Chief Executive Officer of Ionics, Incorporated, an international companyinvolved in the purification and treatment of water. He was Chief Executive Officer of Ionics,Incorporated from 1971 to 2003 and was Chairman from 1991 to 2004. Mr. Goldstein, age 72, is adirector of Cabot Corporation. He is a member of the National Academy of Engineering. He is atrustee of the California Institute of Technology, the Massachusetts General Physicians’Organization, Inc., a trustee and treasurer of Partners HealthCare System, where he serves as chairmanof its finance committee and a member of the MIT Energy Initiative External Advisory Board.Mr. Goldstein received a B.S. degree in chemical engineering from Rensselaer Polytechnic Institute, anM.S. in chemical engineering from the University of Delaware, and an M.B.A. from Harvard BusinessSchool.
Information concerning our executive officers appears under the caption ‘‘Executive Officers of theRegistrant’’ in Item 4A of this Form 10-K.
Information concerning our Examining and Audit Committee will appear in our Proxy Statementfor the 2008 Annual Meeting of Shareholders, to be filed pursuant to Regulation 14A on or beforeApril 30, 2008, under the caption ‘‘Corporate Governance at State Street—Committees of the Board ofDirectors.’’ Such information is incorporated herein by reference.
Information concerning compliance with Section 16(a) of the Securities Exchange Act will appearin our Proxy Statement for the 2008 Annual Meeting of Shareholders, to be filed pursuant toRegulation 14A on or before April 30, 2008, under the caption ‘‘Section 16(a) Beneficial OwnershipReporting Compliance.’’ Such information is incorporated herein by reference.
135
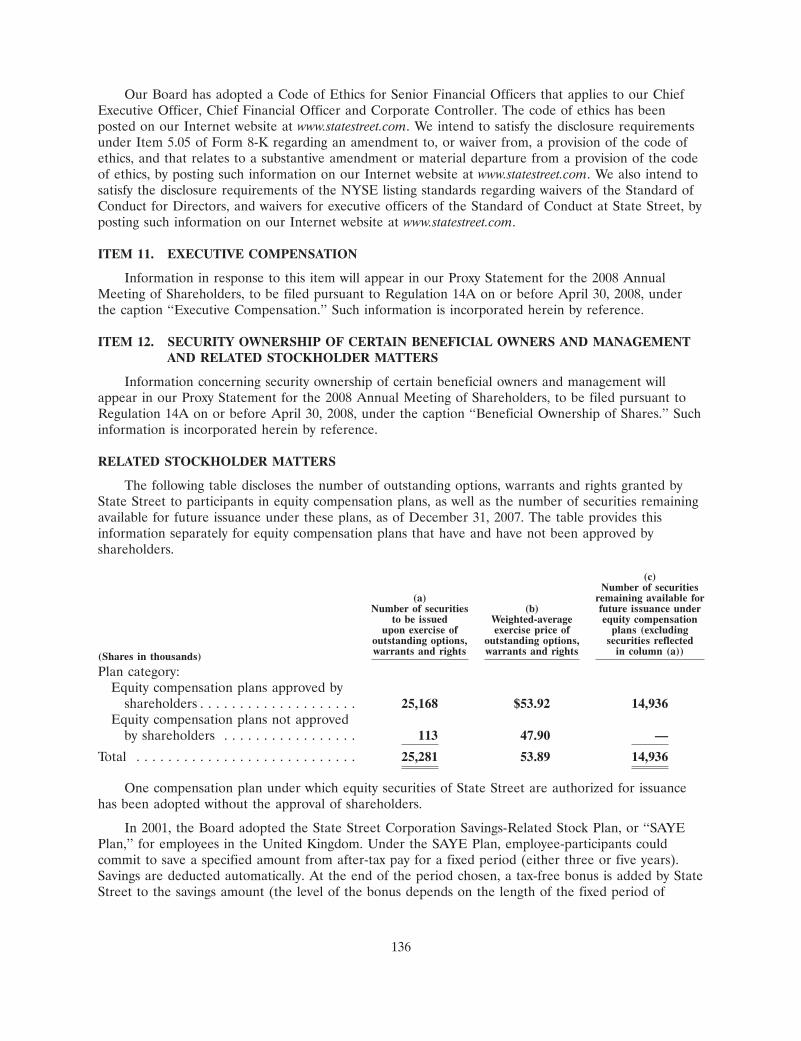
Our Board has adopted a Code of Ethics for Senior Financial Officers that applies to our ChiefExecutive Officer, Chief Financial Officer and Corporate Controller. The code of ethics has beenposted on our Internet website at www.statestreet.com. We intend to satisfy the disclosure requirementsunder Item 5.05 of Form 8-K regarding an amendment to, or waiver from, a provision of the code ofethics, and that relates to a substantive amendment or material departure from a provision of the codeof ethics, by posting such information on our Internet website at www.statestreet.com. We also intend tosatisfy the disclosure requirements of the NYSE listing standards regarding waivers of the Standard ofConduct for Directors, and waivers for executive officers of the Standard of Conduct at State Street, byposting such information on our Internet website at www.statestreet.com.
ITEM 11. EXECUTIVE COMPENSATION
Information in response to this item will appear in our Proxy Statement for the 2008 AnnualMeeting of Shareholders, to be filed pursuant to Regulation 14A on or before April 30, 2008, underthe caption ‘‘Executive Compensation.’’ Such information is incorporated herein by reference.
ITEM 12. SECURITY OWNERSHIP OF CERTAIN BENEFICIAL OWNERS AND MANAGEMENTAND RELATED STOCKHOLDER MATTERS
Information concerning security ownership of certain beneficial owners and management willappear in our Proxy Statement for the 2008 Annual Meeting of Shareholders, to be filed pursuant toRegulation 14A on or before April 30, 2008, under the caption ‘‘Beneficial Ownership of Shares.’’ Suchinformation is incorporated herein by reference.
RELATED STOCKHOLDER MATTERS
The following table discloses the number of outstanding options, warrants and rights granted byState Street to participants in equity compensation plans, as well as the number of securities remainingavailable for future issuance under these plans, as of December 31, 2007. The table provides thisinformation separately for equity compensation plans that have and have not been approved byshareholders.
(c)Number of securities
(a) remaining available forNumber of securities (b) future issuance under
to be issued Weighted-average equity compensationupon exercise of exercise price of plans (excluding
outstanding options, outstanding options, securities reflectedwarrants and rights warrants and rights in column (a))(Shares in thousands)
Plan category:Equity compensation plans approved by
shareholders . . . . . . . . . . . . . . . . . . . . 25,168 $53.92 14,936Equity compensation plans not approved
by shareholders . . . . . . . . . . . . . . . . . 113 47.90 —
Total . . . . . . . . . . . . . . . . . . . . . . . . . . . . 25,281 53.89 14,936
One compensation plan under which equity securities of State Street are authorized for issuancehas been adopted without the approval of shareholders.
In 2001, the Board adopted the State Street Corporation Savings-Related Stock Plan, or ‘‘SAYEPlan,’’ for employees in the United Kingdom. Under the SAYE Plan, employee-participants couldcommit to save a specified amount from after-tax pay for a fixed period (either three or five years).Savings are deducted automatically. At the end of the period chosen, a tax-free bonus is added by StateStreet to the savings amount (the level of the bonus depends on the length of the fixed period of
136
savings), and participants have the option to receive the savings and bonus amount in cash, or to usethe amount to purchase common stock from State Street at an exercise price equal to the market priceof the stock as of the date of joining the SAYE Plan less a discount fixed by State Street at the date ofjoining. For participants joining the SAYE Plan in 2001, the discount was 15%. There was no discountfor participants joining in 2002. Options granted under the SAYE Plan are non-transferable. If aparticipant withdraws from participation before the end of the fixed period, the options to purchasestock are forfeited. If a participant terminates during the period due to retirement, disability,redundancy or sale of the employer from State Street’s group, the options may be exercised within sixmonths of the occurrence, or one year if by reason of death. Under the SAYE Plan, an aggregate of170,000 shares of common stock was authorized for issuance. The SAYE Plan has been discontinuedand no new participations under the SAYE Plan are permitted. At December 31, 2007, a total of 1,777shares of common stock are eligible to be purchased under outstanding options.
In addition, individual directors who are not our employees have received annual awards ofdeferred stock for a number of shares based on the amount of their annual retainer, payable after thedirector leaves the Board or attains a specific age. The number of deferred shares includes, in the caseof certain directors, additional deferred share amounts in respect of an accrual under a terminatedretirement plan, and for all directors is increased to reflect dividends paid on the common stock. Also,directors who are not our employees may receive their annual retainer payable at their option either inshares of our common stock or cash, and may further elect to defer either 50% or 100% until aftertermination of their services as a director. The number of deferred shares is increased to reflectdividends paid on the common stock. Deferred stock awards totaling 229,149 shares of common stockwere outstanding at December 31, 2007; awards made through June 30, 2003 have not been approvedby shareholders. Awards of deferred stock made or non-deferred retainer shares paid to individualdirectors after June 30, 2003 have been or will be made under our 1997 or 2006 Equity Incentive Plan,approved by shareholders.
ITEM 13. CERTAIN RELATIONSHIPS AND RELATED TRANSACTIONS, AND DIRECTORINDEPENDENCE
Information concerning certain relationships and related transactions and director independencewill appear in our Proxy Statement for the 2008 Annual Meeting of Shareholders, to be filed pursuantto Regulation 14A on or before April 30, 2008, under the captions ‘‘Related Person Transactions’’ and‘‘Corporate Governance at State Street.’’ Such information is incorporated herein by reference.
ITEM 14. PRINCIPAL ACCOUNTING FEES AND SERVICES
Information concerning principal accounting fees and services will appear in our Proxy Statementfor the 2008 Annual Meeting of Shareholders, to be filed pursuant to Regulation 14A on or beforeApril 30, 2008, under the caption ‘‘Relationship with Independent Registered Public Accounting Firm.’’Such information is incorporated herein by reference.
137
PART IV
ITEM 15. EXHIBITS AND FINANCIAL STATEMENT SCHEDULES
(A)(1) FINANCIAL STATEMENTS
The following consolidated financial statements of State Street are included in Item 8 hereof:
Report of Independent Registered Public Accounting FirmConsolidated Statement of Income—Years ended December 31, 2007, 2006 and 2005Consolidated Statement of Condition—As of December 31, 2007 and 2006Consolidated Statement of Changes in Shareholders’ Equity—Years ended December 31, 2007,2006 and 2005Consolidated Statement of Cash Flows—Years ended December 31, 2007, 2006 and 2005Notes to Consolidated Financial Statements
(A)(2) FINANCIAL STATEMENT SCHEDULES
Certain schedules to the consolidated financial statements have been omitted if they were notrequired by Article 9 of Regulation S-X or if, under the related instructions, they wereinapplicable, or the information was contained elsewhere herein.
(A)(3) EXHIBITS
A list of the exhibits filed or incorporated herein by reference is as follows:
2.1 Agreement and Plan of Merger dated as of February 4, 2007 by and between StateStreet Corporation and Investors Financial Services Corp. (the schedules andexhibits have been omitted pursuant to Item 601(b)(2) of Regulation S-K) (filed asExhibit 2.1 to State Street’s Current Report on Form 8-K dated February 4, 2007and incorporated herein by reference)
3.1 Restated Articles of Organization, as amended3.2 Amended and Restated By-Laws dated October 19, 2006 (filed as Exhibit 3.2 to
State Street’s Current Report on Form 8-K dated October 19, 2006 andincorporated herein by reference)
4.1 The description of State Street’s Common Stock is included in State Street’sRegistration Statement on Form 8-A, as filed on January 18, 1995 and March 7,1995 (filed on January 18, 1995 and March 7, 1995 and incorporated herein byreference)(Note: None of the instruments defining the rights of holders of State Street’soutstanding long-term debt are in respect of indebtedness in excess of 10% of thetotal assets of State Street and its subsidiaries on a consolidated basis. State Streethereby agrees to furnish to the Securities and Exchange Commission upon requesta copy of any other instrument with respect to long-term debt of State Street andits subsidiaries.)
10.1† State Street’s Management Supplemental Retirement Plan, Amended and RestatedEffective as of January 1, 2008 (formerly, ‘‘State Street Corporation SupplementalExecutive Retirement Plan’’) (filed as Exhibit 10.1 to State Street’s QuarterlyReport on Form 10-Q for the quarter ended September 30, 2007 filed with theCommission on November 2, 2007 and incorporated herein by reference)
10.2† State Street’s Amended and Restated Supplemental Defined Benefit Pension Planfor Senior Executive Officers (filed as Exhibit 10.1 to State Street’s QuarterlyReport on Form 10-Q for the quarter ended March 31, 2005 and incorporatedherein by reference)
138
10.3† State Street Global Advisors Incentive Plan for 1996 (filed as Exhibit 10.19 toState Street’s Annual Report on Form 10-K for the year ended December 31, 1995filed with the Commission on March 27, 1996 and incorporated herein byreference)
10.4† Forms of Employment Agreement with Officers (Levels 1, 2 and 3) approved bythe Board of Directors on September 1995 (filed as Exhibit 10.20 to State Street’sAnnual Report on Form 10-K for the year ended December 31, 1995 filed with theCommission on March 27, 1996 and incorporated herein by reference)
10.5† State Street Global Advisors Equity Compensation Plan (filed as Exhibit 10 toState Street’s Quarterly Report on Form 10-Q for the quarter endedSeptember 30, 1996 filed with the Commission on November 14, 1996 andincorporated herein by reference)
10.6† State Street’s Executive Compensation Trust Agreement dated December 6, 1996(Rabbi Trust) (filed as Exhibit 10.18 to State Street’s Annual Report on Form 10-Kfor the year ended December 31, 1996 filed with the Commission on March 26,1997 and incorporated herein by reference)
10.7† State Street’s 1997 Equity Incentive Plan, as amended, and forms of awards andagreements thereunder (filed as Exhibit 10.22 to State Street’s Quarterly Report onForm 10-Q for the quarter ended June 30, 1997 filed with the Commission onAugust 14, 1997; Exhibit 10.17 to State Street’s Annual Report on Form 10-K forthe year ended December 31, 1997 filed with the Commission on March 26, 1998;Exhibit 10.1 to State Street’s Quarterly Report on Form 10-Q for the quarterended March 31, 2000 filed with the Commission on May 15, 2000; Exhibit 10.2 toState Street’s Quarterly Report on Form 10-Q for the quarter ended June 30, 2000filed with the Commission on August 11, 2000; Exhibit 12D to State Street’sAnnual Report on Form 10-K for the year ended December 31, 2001 filed with theCommission on February 22, 2002; Exhibit 10.1 to State Street’s Quarterly Reporton Form 10-Q for the quarter ended September 30, 2004 filed with theCommission on November 5, 2004; Exhibit 10.2 to State Street’s Quarterly Reporton Form 10-Q for the quarter ended June 30, 2006 filed with the Commission onAugust 4, 2006; Exhibit 10.2 to State Street’s Quarterly Report on Form 10-Q forthe quarter ended September 30, 2004 filed with the Commission on November 5,2004; Exhibit 10.3 to State Street’s Quarterly Report on Form 10-Q for the quarterended September 30, 2004 filed with the Commission on November 5, 2004;Exhibit 10.4 to State Street’s Quarterly Report on Form 10-Q for the quarterended September 30, 2004 filed with the Commission on November 5, 2004;Exhibit 10.5 to State Street’s Quarterly Report on Form 10-Q for the quarterended September 30, 2004 filed with the Commission on November 5, 2004;Exhibit 10.6 to State Street’s Quarterly Report on Form 10-Q for the quarterended September 30, 2004 filed with the Commission on November 5, 2004;Exhibit 10.7 to State Street’s Quarterly Report on Form 10-Q for the quarterended September 30, 2004 filed with the Commission on November 5, 2004;Exhibit 10.12L to State Street’s Annual Report on Form 10-K for the year endedDecember 31, 2004 filed with the Commission on February 18, 2005; andExhibit 10.1 to State Street’s Quarterly Report on Form 10-Q for the quarterended June 30, 2006 filed with the Commission on August 4, 2006, which exhibitsare incorporated herein by reference)
10.8† State Street’s 2006 Equity Incentive Plan and forms of award agreementsthereunder
139
10.9† State Street’s 2006 Senior Executive Annual Incentive Plan (filed as Appendix C toState Street’s definitive Proxy Statement filed with the Commission on March 13,2006 and incorporated herein by reference)
10.10† State Street’s Management Supplemental Savings Plan, Amended and RestatedEffective as of January 1, 2008 (formerly, ‘‘State Street Corporation 401(k)Restoration and Voluntary Deferral Plan’’) (filed as Exhibit 10.2 to State Street’sQuarterly Report on Form 10-Q for the quarter ended September 30, 2007 filedwith the Commission on November 2, 2007 and incorporated herein by reference)
10.11† State Street’s Savings-Related Stock Plan for United Kingdom employees (filed asExhibit 99.1 to State Street’s Registration Statement on Form S-8 filed onSeptember 23, 2002, Commission File No. 333-100001, and incorporated herein byreference)
10.12† Amended and Restated Deferred Compensation Plan for Directors of State StreetCorporation (filed as Exhibit 10.1 to State Street’s Quarterly Report on Form 10-Qfor the quarter ended March 31, 1999 filed with the Commission on May 5, 1999and incorporated herein by reference)
10.13† Amended and Restated Deferred Compensation Plan for Directors of State StreetBank and Trust Company (filed as Exhibit 10.3 to State Street’s Quarterly Reporton Form 10-Q for the quarter ended June 30, 2006 filed with the Commission onAugust 4, 2006 and incorporated herein by reference)
10.14† Description of compensation arrangements for non-employee directors10.15† Memorandum of agreement of employment of Edward J. Resch, accepted
October 16, 2002 (filed as Exhibit 10.23 to State Street’s Annual Report onForm 10-K for the year ended December 31, 2002 filed with the Commission onFebruary 21, 2003 and incorporated herein by reference)
10.16† Separation Agreement between State Street Corporation and William W. Hunt,dated as of January 2, 2008
10.17A† Form of Indemnification Agreement between State Street Corporation and each ofits directors (filed as Exhibit 10.1 to State Street’s Quarterly Report on Form 10-Qfor the quarter ended March 31, 2007 filed with the Commission on May 4, 2007and incorporated herein by reference)
10.17B† Form of Indemnification Agreement between State Street Corporation and each ofits executive officers (filed as Exhibit 10.2 to State Street’s Quarterly Report onForm 10-Q for the quarter ended March 31, 2007 filed with the Commission onMay 4, 2007 and incorporated herein by reference)
10.17C† Form of Indemnification Agreement between State Street Bank and TrustCompany and each of its directors (filed as Exhibit 10.3 to State Street’s QuarterlyReport on Form 10-Q for the quarter ended March 31, 2007 filed with theCommission on May 4, 2007 and incorporated herein by reference)
10.17D† Form of Indemnification Agreement between State Street Bank and TrustCompany and each of its executive officers (filed as Exhibit 10.4 to State Street’sQuarterly Report on Form 10-Q for the quarter ended March 31, 2007 filed withthe Commission on May 4, 2007 and incorporated herein by reference)
11.1 Computation of Earnings per Share (information appears in note 21 of the Notesto Consolidated Financial Statements included under Part II, Item 8)
12.1 Statement of Ratios of Earnings to Fixed Charges21.1 Subsidiaries of State Street Corporation
140

23.1 Consent of Independent Registered Public Accounting Firm31.1 Rule 13a-14(a)/15d-14(a) Certification of Chairman and Chief Executive Officer31.2 Rule 13a-14(a)/15d-14(a) Certification of Chief Financial Officer32 Section 1350 Certifications
† Denotes management contract or compensatory plan or arrangement
141
SIGNATURES
Pursuant to the requirement of Section 13 or 15(d) of the Securities Exchange Act of 1934, theregistrant has duly caused this report to be signed on its behalf by the undersigned, on February 14,2008, thereunto duly authorized.
STATE STREET CORPORATION
By /s/ EDWARD J. RESCH
EDWARD J. RESCH,Executive Vice President andChief Financial Officer
By /s/ JAMES J. MALERBA
JAMES J. MALERBA,Senior Vice President andCorporate Controller
Pursuant to the requirements of the Securities Exchange Act of 1934, this report has been signedbelow on February 14, 2008 by the following persons on behalf of the registrant and in the capacitiesindicated.
OFFICERS:
/s/ RONALD E. LOGUE /s/ EDWARD J. RESCH
RONALD E. LOGUE, EDWARD J. RESCH,Chairman and Chief Executive Officer; Executive Vice President andDirector Chief Financial Officer
/s/ JAMES J. MALERBA
JAMES J. MALERBA,Senior Vice President and Corporate Controller
DIRECTORS:
/s/ TENLEY E. ALBRIGHT /s/ KENNETT F. BURNES
TENLEY E. ALBRIGHT, M.D. KENNETT F. BURNES
/s/ PETER COYM /s/ NADER F. DAREHSHORI
PETER COYM NADER F. DAREHSHORI
/s/ AMELIA C. FAWCETT /s/ ARTHUR L. GOLDSTEIN
AMELIA C. FAWCETT ARTHUR L. GOLDSTEIN
/s/ DAVID P. GRUBER /s/ LINDA A. HILL
DAVID P. GRUBER LINDA A. HILL
142

/s/ CHARLES R. LAMANTIA /s/ RONALD E. LOGUE
CHARLES R. LAMANTIA RONALD E. LOGUE
/s/ MAUREEN J. MISKOVIC /s/ RICHARD P. SERGEL
MAUREEN J. MISKOVIC RICHARD P. SERGEL
/s/ RONALD L. SKATES /s/ GREGORY L. SUMME
RONALD L. SKATES GREGORY L. SUMME
/s/ DIANA CHAPMAN WALSH /s/ ROBERT E. WEISSMAN
DIANA CHAPMAN WALSH ROBERT E. WEISSMAN
143
EXHIBIT INDEX
(filed herewith)
*3.1 Restated Articles of Organization, as amended*10.8 State Street’s 2006 Equity Incentive Plan and forms of award agreements
thereunder*10.14 Description of compensation arrangements for non-employee directors*10.16 Separation Agreement between State Street and William W. Hunt, dated as
of January 2, 2008*12.1 Statement of Ratios of Earnings to Fixed Charges*21.1 Subsidiaries of State Street Corporation*23.1 Consent of Independent Registered Public Accounting Firm31.1 Rule 13a-14(a)/15d-14(a) Certification of Chairman and Chief Executive
Officer31.2 Rule 13a-14(a)/15d-14(a) Certification of Chief Financial Officer32 Section 1350 Certifications
* Exhibit filed with the SEC, but not printed herein.
144
EXHIBIT 31.1
RULE 13a-14(a)/15d-14(a) CERTIFICATION
I, Ronald E. Logue, certify that:
1. I have reviewed this Annual Report on Form 10-K of State Street Corporation;
2. Based on my knowledge, this report does not contain any untrue statement of a material factor omit to state a material fact necessary to make the statements made, in light of the circumstancesunder which such statements were made, not misleading with respect to the period covered by thisreport;
3. Based on my knowledge, the financial statements, and other financial information included inthis report, fairly present in all material respects the financial condition, results of operations and cashflows of the registrant as of, and for, the periods presented in this report;
4. The registrant’s other certifying officer(s) and I are responsible for establishing andmaintaining disclosure controls and procedures (as defined in Exchange Act Rules 13a-15(e) and15d-15(e)) and internal control over financial reporting (as defined in Exchange Act Rules 13a-15(f)and 15d-15(f)) for the registrant and have:
(a) Designed such disclosure controls and procedures, or caused such disclosure controls andprocedures to be designed under our supervision, to ensure that material information relating tothe registrant, including its consolidated subsidiaries, is made known to us by others within thoseentities, particularly during the period in which this report is being prepared;
(b) Designed such internal control over financial reporting, or caused such internal controlover financial reporting to be designed under our supervision, to provide reasonable assuranceregarding the reliability of financial reporting and the preparation of financial statements forexternal purposes in accordance with generally accepted accounting principles;
(c) Evaluated the effectiveness of the registrant’s disclosure controls and procedures andpresented in this report our conclusions about the effectiveness of the disclosure controls andprocedures, as of the end of the period covered by this report based on such evaluation; and
(d) Disclosed in this report any change in the registrant’s internal control over financialreporting that occurred during the registrant’s most recent fiscal quarter (the registrant’s fourthquarter in the case of an annual report) that has materially affected, or is reasonably likely tomaterially affect, the registrant’s internal control over financial reporting; and
5. The registrant’s other certifying officer(s) and I have disclosed, based on our most recentevaluation of internal control over financial reporting, to the registrant’s auditors and the auditcommittee of the registrant’s board of directors (or persons performing the equivalent functions):
(a) All significant deficiencies and material weaknesses in the design or operation of internalcontrol over financial reporting which are reasonably likely to adversely affect the registrant’sability to record, process, summarize and report financial information; and
(b) Any fraud, whether or not material, that involves management or other employees whohave a significant role in the registrant’s internal control over financial reporting.
Date: February 14, 2008 By: /s/ RONALD E. LOGUE
Ronald E. Logue,Chairman and Chief Executive Officer
EXHIBIT 31.2
RULE 13a-14(a)/15d-14(a) CERTIFICATION
I, Edward J. Resch, certify that:
1. I have reviewed this Annual Report on Form 10-K of State Street Corporation;
2. Based on my knowledge, this report does not contain any untrue statement of a material factor omit to state a material fact necessary to make the statements made, in light of the circumstancesunder which such statements were made, not misleading with respect to the period covered by thisreport;
3. Based on my knowledge, the financial statements, and other financial information included inthis report, fairly present in all material respects the financial condition, results of operations and cashflows of the registrant as of, and for, the periods presented in this report;
4. The registrant’s other certifying officer(s) and I are responsible for establishing andmaintaining disclosure controls and procedures (as defined in Exchange Act Rules 13a-15(e) and15d-15(e)) and internal control over financial reporting (as defined in Exchange Act Rules 13a-15(f)and 15d-15(f)) for the registrant and have:
(a) Designed such disclosure controls and procedures, or caused such disclosure controls andprocedures to be designed under our supervision, to ensure that material information relating tothe registrant, including its consolidated subsidiaries, is made known to us by others within thoseentities, particularly during the period in which this report is being prepared;
(b) Designed such internal control over financial reporting, or caused such internal controlover financial reporting to be designed under our supervision, to provide reasonable assuranceregarding the reliability of financial reporting and the preparation of financial statements forexternal purposes in accordance with generally accepted accounting principles;
(c) Evaluated the effectiveness of the registrant’s disclosure controls and procedures andpresented in this report our conclusions about the effectiveness of the disclosure controls andprocedures, as of the end of the period covered by this report based on such evaluation; and
(d) Disclosed in this report any change in the registrant’s internal control over financialreporting that occurred during the registrant’s most recent fiscal quarter (the registrant’s fourthquarter in the case of an annual report) that has materially affected, or is reasonably likely tomaterially affect, the registrant’s internal control over financial reporting; and
5. The registrant’s other certifying officer(s) and I have disclosed, based on our most recentevaluation of internal control over financial reporting, to the registrant’s auditors and the auditcommittee of the registrant’s board of directors (or persons performing the equivalent functions):
(a) All significant deficiencies and material weaknesses in the design or operation of internalcontrol over financial reporting which are reasonably likely to adversely affect the registrant’sability to record, process, summarize and report financial information; and
(b) Any fraud, whether or not material, that involves management or other employees whohave a significant role in the registrant’s internal control over financial reporting.
Date: February 14, 2008 By: /s/ EDWARD J. RESCH
Edward J. Resch,Executive Vice President and
Chief Financial Officer
EXHIBIT 32
SECTION 1350 CERTIFICATIONS
To my knowledge, this Annual Report on Form 10-K for the year ended December 31, 2007 fullycomplies with the requirements of Section 13(a) or 15(d) of the Securities Exchange Act of 1934, andthe information contained in this Report fairly presents, in all material respects, the financial conditionand results of operations of State Street Corporation.
Date: February 14, 2008 By: /s/ RONALD E. LOGUE
Ronald E. Logue,Chairman and Chief Executive Officer
Date: February 14, 2008 By: /s/ EDWARD J. RESCH
Edward J. Resch,Executive Vice President and
Chief Financial Officer
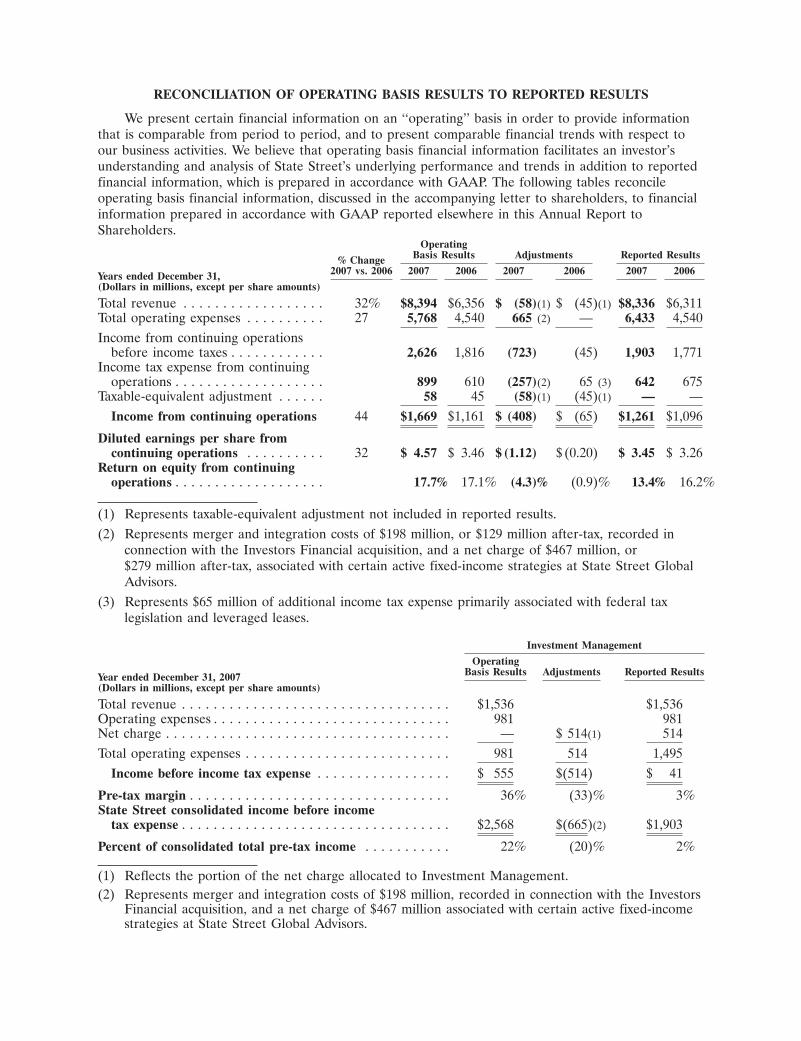
RECONCILIATION OF OPERATING BASIS RESULTS TO REPORTED RESULTS
We present certain financial information on an ‘‘operating’’ basis in order to provide informationthat is comparable from period to period, and to present comparable financial trends with respect toour business activities. We believe that operating basis financial information facilitates an investor’sunderstanding and analysis of State Street’s underlying performance and trends in addition to reportedfinancial information, which is prepared in accordance with GAAP. The following tables reconcileoperating basis financial information, discussed in the accompanying letter to shareholders, to financialinformation prepared in accordance with GAAP reported elsewhere in this Annual Report toShareholders.
OperatingBasis Results Adjustments Reported Results% Change
2007 vs. 2006 2007 2006 2007 2006 2007 2006Years ended December 31,(Dollars in millions, except per share amounts)
Total revenue . . . . . . . . . . . . . . . . . . 32% $8,394 $6,356 $ (58)(1) $ (45)(1) $8,336 $6,311Total operating expenses . . . . . . . . . . 27 5,768 4,540 665 (2) — 6,433 4,540Income from continuing operations
before income taxes . . . . . . . . . . . . 2,626 1,816 (723) (45) 1,903 1,771Income tax expense from continuing
operations . . . . . . . . . . . . . . . . . . . 899 610 (257)(2) 65 (3) 642 675Taxable-equivalent adjustment . . . . . . 58 45 (58)(1) (45)(1) — —
Income from continuing operations 44 $1,669 $1,161 $ (408) $ (65) $1,261 $1,096
Diluted earnings per share fromcontinuing operations . . . . . . . . . . 32 $ 4.57 $ 3.46 $ (1.12) $ (0.20) $ 3.45 $ 3.26
Return on equity from continuingoperations . . . . . . . . . . . . . . . . . . . 17.7% 17.1% (4.3)% (0.9)% 13.4% 16.2%
(1) Represents taxable-equivalent adjustment not included in reported results.(2) Represents merger and integration costs of $198 million, or $129 million after-tax, recorded in
connection with the Investors Financial acquisition, and a net charge of $467 million, or$279 million after-tax, associated with certain active fixed-income strategies at State Street GlobalAdvisors.
(3) Represents $65 million of additional income tax expense primarily associated with federal taxlegislation and leveraged leases.
Investment Management
OperatingBasis Results Adjustments Reported ResultsYear ended December 31, 2007
(Dollars in millions, except per share amounts)
Total revenue . . . . . . . . . . . . . . . . . . . . . . . . . . . . . . . . . . $1,536 $1,536Operating expenses . . . . . . . . . . . . . . . . . . . . . . . . . . . . . . 981 981Net charge . . . . . . . . . . . . . . . . . . . . . . . . . . . . . . . . . . . . — $ 514(1) 514Total operating expenses . . . . . . . . . . . . . . . . . . . . . . . . . . 981 514 1,495
Income before income tax expense . . . . . . . . . . . . . . . . . $ 555 $(514) $ 41
Pre-tax margin . . . . . . . . . . . . . . . . . . . . . . . . . . . . . . . . . 36% (33)% 3%State Street consolidated income before income
tax expense . . . . . . . . . . . . . . . . . . . . . . . . . . . . . . . . . . $2,568 $(665)(2) $1,903
Percent of consolidated total pre-tax income . . . . . . . . . . . 22% (20)% 2%
(1) Reflects the portion of the net charge allocated to Investment Management.(2) Represents merger and integration costs of $198 million, recorded in connection with the Investors
Financial acquisition, and a net charge of $467 million associated with certain active fixed-incomestrategies at State Street Global Advisors.
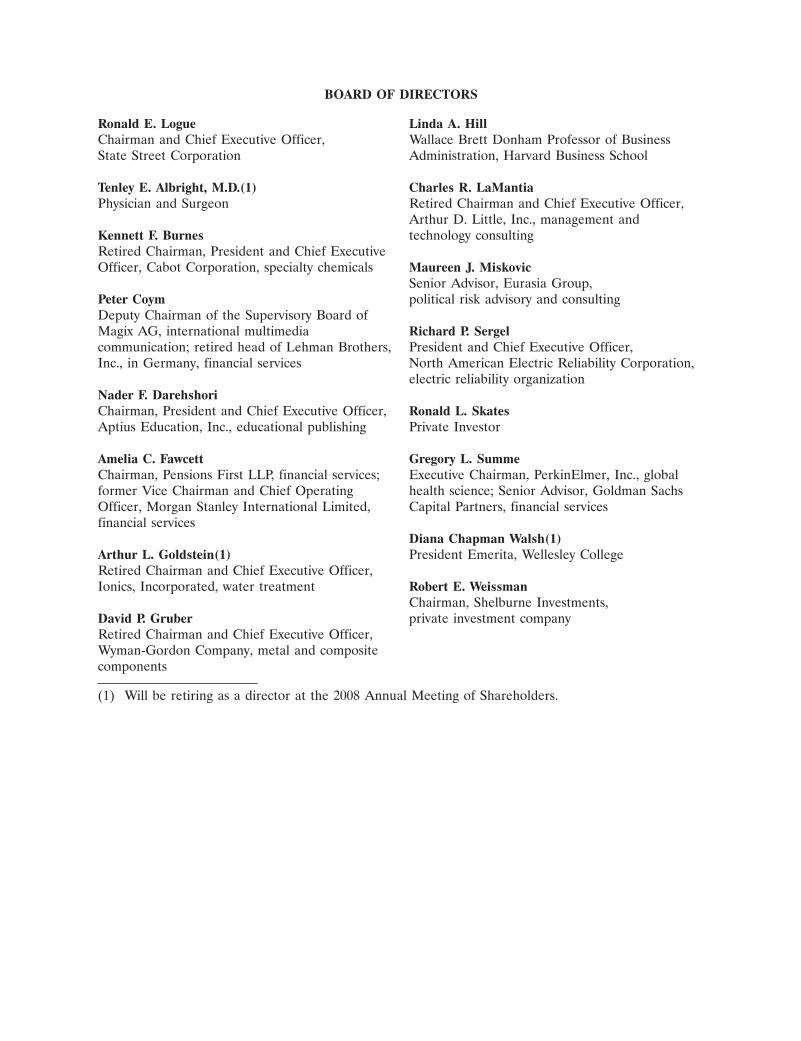
BOARD OF DIRECTORS
Ronald E. Logue Linda A. HillChairman and Chief Executive Officer, Wallace Brett Donham Professor of BusinessState Street Corporation Administration, Harvard Business School
Tenley E. Albright, M.D.(1) Charles R. LaMantiaPhysician and Surgeon Retired Chairman and Chief Executive Officer,
Arthur D. Little, Inc., management andKennett F. Burnes technology consultingRetired Chairman, President and Chief ExecutiveOfficer, Cabot Corporation, specialty chemicals Maureen J. Miskovic
Senior Advisor, Eurasia Group,Peter Coym political risk advisory and consultingDeputy Chairman of the Supervisory Board ofMagix AG, international multimedia Richard P. Sergelcommunication; retired head of Lehman Brothers, President and Chief Executive Officer,Inc., in Germany, financial services North American Electric Reliability Corporation,
electric reliability organizationNader F. DarehshoriChairman, President and Chief Executive Officer, Ronald L. SkatesAptius Education, Inc., educational publishing Private Investor
Amelia C. Fawcett Gregory L. SummeChairman, Pensions First LLP, financial services; Executive Chairman, PerkinElmer, Inc., globalformer Vice Chairman and Chief Operating health science; Senior Advisor, Goldman SachsOfficer, Morgan Stanley International Limited, Capital Partners, financial servicesfinancial services
Diana Chapman Walsh(1)Arthur L. Goldstein(1) President Emerita, Wellesley CollegeRetired Chairman and Chief Executive Officer,Ionics, Incorporated, water treatment Robert E. Weissman
Chairman, Shelburne Investments,David P. Gruber private investment companyRetired Chairman and Chief Executive Officer,Wyman-Gordon Company, metal and compositecomponents
(1) Will be retiring as a director at the 2008 Annual Meeting of Shareholders.

EXECUTIVE LEADERSHIP
Ronald E. Logue(1)(2) David J. Gutschenritter Alison A. QuirkChairman and Chief Executive Executive Vice President and Executive Vice PresidentOfficer Treasurer
Edward J. Resch(1)(2)Joseph C. Antonellis(1)(2) Frederick C. Hindmarsh Executive Vice President andVice Chairman, head of Investor Executive Vice President Chief Financial OfficerServices in North America
Joseph L. Hooley(1)(2) Stephen J. ReydelNicholas J. Bonn Vice Chairman, head of Executive Vice PresidentExecutive Vice President Investor Services and Investment
Arlene M. RockefellerResearch and Trading worldwideDrew J. Breakspear Executive Vice PresidentExecutive Vice President and Robert Kaplan
Michael RogersGeneral Auditor Executive Vice PresidentExecutive Vice President
Marc P. Brown Karen C. KeenanDennis E. RossExecutive Vice President Executive Vice PresidentExecutive Vice President
James C. Caccivio Russell J. KennettGeorge A. Russell, Jr.Executive Vice President Executive Vice PresidentExecutive Vice President
Jeffrey N. Carp(1)(2) John L. Klinck, Jr.Stanley W. Shelton(1)(2)Executive Vice President, Executive Vice PresidentExecutive Vice President,Chief Legal Officer and Secretary
Mark Lazberger State Street Global MarketsTimothy J. Caverly Executive Vice President
William SlatteryExecutive Vice PresidentPeter G. Leahy Executive Vice President
Joseph W. Chow(1)(2) Executive Vice PresidentMark J. SnyderExecutive Vice President
Clifford M. Lewis Executive Vice PresidentDonald E. Conover Executive Vice President
Craig V. StarbleExecutive Vice PresidentNancy H. Loucks Executive Vice President
Jeff D. Conway Executive Vice PresidentGeorge SullivanExecutive Vice President
Mark A. Marinella Executive Vice PresidentMaureen P. Corcoran Executive Vice President
Anne P. TangenExecutive Vice PresidentVirginia M. Meany Executive Vice President
Albert J. Cristoforo Executive Vice PresidentRobert R. TarterExecutive Vice President
Madge M. Meyer Executive Vice PresidentDenise A. DeAmore Executive Vice President
K. K. TseExecutive Vice PresidentDouglas J. Miller Executive Vice President
Jayne K. Donahue Executive Vice PresidentBrian J. WalshExecutive Vice President and
Sharon B. Morin Executive Vice PresidentChief Compliance OfficerExecutive Vice President
Keith R. WasleySharon E. Donovan HartDavid C. O’Leary(1)(2) Executive Vice PresidentExecutive Vice PresidentExecutive Vice President,
Wendy A. WatsonGary E. Enos Global Human ResourcesExecutive Vice PresidentExecutive Vice President
Peter O’NeillMichael L. WilliamsStefan M. Gavell Executive Vice PresidentExecutive Vice PresidentExecutive Vice President
Christopher PerrettaMichael J. WilsonStefan Gmur Executive Vice PresidentExecutive Vice PresidentExecutive Vice President
James S. Phalen(1)(2)Simon J. Taylor-WilsonPamela D. Gormley Executive Vice President, InterimExecutive Vice PresidentExecutive Vice President President and Chief Executive
Officer, State Street Global Advisors Marcel R. ZutterAlan D. GreeneExecutive Vice PresidentExecutive Vice President David C. Phelan(1)
Executive Vice President, GeneralCounsel and Assistant Secretary
(1) Designated as executive officer for SEC purposes.(2) Member of State Street Operating Group.

STATE STREET WORLDWIDE
Australia Mauritius United StatesMelbourne Port LouisSydney California
Netherlands AlamedaAustria Amsterdam IrvineVienna Los Angeles
New Zealand SacramentoBelgium Wellington San FranciscoBrussels Walnut Creek
People’s Republic of ChinaCanada Beijing GeorgiaMontreal Hangzhou AtlantaOttawa Hong KongToronto IllinoisVancouver Poland Chicago
KrakowCayman Islands MassachusettsGeorge Town, Grand Cayman Singapore Andover
Singapore BostonChile CambridgeSantiago South Africa Franklin
Cape Town GraftonFrance MiltonParis South Korea Quincy
Seoul WestboroughGermany WestwoodCologne SwitzerlandEschborn Zurich MissouriFrankfurt Kansas CityMunich Taiwan
Taipei New HampshireIndia NashuaBangalore United Arab EmiratesMumbai Dubai New Jersey
Fair LawnIreland United Kingdom PrincetonDroghedaDublin England New YorkKilkenny London New York
WindsorItaly North CarolinaMilan Guernsey Winston-Salem
Saint Peter PortJapan PennsylvaniaTokyo Jersey Malvern
Saint HelierLuxembourgLuxembourg Scotland
Edinburgh


To Our Shareholders
Ronald E. LogueChairman and
Chief Executive Officer
08-STT0087_10KCoverWrap_2007_FIN.qxd:10-K COVER MECH 3/4/08 3:36 PM Page 4

08-STT00870208© 2008 STATE STREET CORPORATION
State Street Corporation
State Street Financial Center
One Lincoln Street
Boston, Massachusetts 02111-2900
+1 617 786 3000
www.statestreet.com
State Street Corporation
2007 Annual Report to Shareholders
200730%
Cert no. SW-COC-002514
08-STT0087_10KCoverWrap_2007_FIN.qxd:10-K COVER MECH 3/6/08 2:15 PM Page 2