state of the world’s cities - people.iup.edu · simone cecchini, jorge rodríguez, maren...
TRANSCRIPT

STATE OF THE
Harmonious Cities2008/2009
WORLD’S CITIES
First published by Earthscan in the UK and USA in 2008 for and on behalf of the United Nations Human Settlements Programme(UN-HABITAT).
Copyright © United Nations Human Settlements Programme, 2008.
All rights reserved
United Nations Human Settlements Programme (UN-HABITAT)P.O. Box 30030, Nairobi, KenyaTel: +254 20 7621 234Fax: +254 20 7624 266/7Website: www.unhabitat.org
DISCLAIMER
The designations employed and the presentation of the material in this report do not imply the expression of any opinion whatsoever on the part of the Secretariet of the United Nations concerning the legal status of any country, territory, city or area, or of its authorities, or concerning delimitation of its frontiers or boundaries, or regarding its economic system or degree of development. The analysis, conclusions and recommendations of this reports do not necessarily reflect the views of the United Nations Human Settlements Programme or its Governing Council.
HS/1031/08 E (paperback)HS/1032/08 E (hardback)
ISBN: 978-1-84407-696-3 (Earthscan paperback) ISBN: 978-92-1-132010-7 (UN-HABITAT paperback)ISBN: 978-1-84407-695-6 (Earthscan hardback) ISBN: 978-92-1-132011-4 (UN-HABITAT hardback)
Design and layout by Michael Jones Software, Nairobi, Kenya.Printed and bound in Malta by Gutenberg Press Ltd.
For a full list of Earthscan publications contact:
EarthscanDunstan House14a St Cross StreetLondon EC1N 8XA, UKTel: +44 (0)20 7841 1930Direct: +44 (0)20 7841 1930Fax: +44 (0)20 7242 1474E-mail: [email protected]: www.earthscan.co.uk
22883 Quicksilver Drive, Sterling, VA20166-2012, USA
Earthscan publishes in association with the International Institute for Environment and Development.
A catalogue record of this book is available from the British Library.
Library of Congress Cataloging-in-Publications Data has been applied for.
The paper used for this book is FSC-certified. FSC (the Forest Stewardship Council) is an international network to promote responsible management of the world’s forests.
ContributorsSignificant contributions in the analysis of data and drafting of background papers:Adriana Allen for “Addressing Rural-Urban Disparities for Harmonious Development”Federico Butera for “Cities and Climate Change” and “Energy Consumption in Cities”Patricia McCarney and Richard Stren for “Metropolitan Governance: Governing in a City of Cities”Simone Cecchini, Jorge Rodríguez, Maren Jiménez, Daniela González, Ernesto Espindola and Hernan Pizarro of the UN Economic Commission for Latin America and the Caribbean (ECLAC) for collating urban/city Gini coefficients for Latin America and the Caribbean, in consultation with Miguel Ojeda and Lucy WinchesterJorge Carrillo and Sarah Lowder of UN Economic and Social Commission for Asia and the Pacific (ESCAP) for collating urban/city Gini coefficients for Asia and the Pacific
Additional contributions in the preparation of thematic papers and in the analysis and review of data:Carmen Bellet and Josep Ma Llop Torne for “The Role of Intermediate Cities”Jordi Borja, whose ideas were adapted from “La Ciudad Conquistada” (Barcelona, 2007)Suochen Dong, Marlene Fernandes, Yasser Rajjal, David Schmidt, Maram Tawil, Vinod Tewari for Metropolitan Governance Surveys in China, Brazil, Amman, Cape Town and IndiaAli Farzin for “Urban Inequalities in Iran”Pietro Garau for “Preliminary analysis of surveys on slum upgrading polices”Padmashree Gehl Sampath for “Institutional Analysis and Innovation” and research on economic policies and migrationPrabha Khosla for “Gender Sensitive Urban Governance” and analysis of gender disaggregated slum data Enzo Mingione and Serena Vicari for “Inequalities in European Cities”Afsaneh Moharami for “Drivers of Decline/Growth in Iranian Cities”Mark Montgomery for analysis and review of global urban dataAriane Mueller for “Best Practices and Climate Change in Cities”Maria da Piedade for Gini coefficient data in Brazilian citiesPatricia Romero-Lankao for “Climate Change and Cities – Latin America”German Solinis “Without harmony, there will be no cities in the urbanized world”Raquel Szalachman for “Human Settlements and the Environment in Latin America and the Caribbean”Vinod Tewari for “Urbanization Trends in Asia”, “Drivers of City Growth” and Gini coefficients for urban IndiaPablo Vaggione for “Planning for Urban Harmony”Darcy Varney “Inclusive Urban Planning for Harmonious Development”Luciano Vettoretto for “Regional Planning towards Spatial Strategies: Learning from the European Experience” Yu Zhu for “Urbanization Trends in China” and “Drivers of City Growth in China”
Input to production of maps and graphs:Deborah Balk for text and maps on “Cities at Risk in Low Elevation Coastal Zones”Bangladesh Centre for Advanced Studies for map on “Flood-prone areas in Dhaka”Centre for Urban Studies (Bangladesh) for map on “Slum settlements in Dhaka”European Commission Directorate for Regional Policy for map on “Intra-city Differences in Unemployment in London, Berlin, Stockholm and Madrid, 2001”Kenya Bureau of Statistics for map on “Poverty Incidence in Nairobi, Mombasa and Kisumu”Rashid Seedat and the South African Cities Network for input to various graphs related to inequality in South African citiesThailand Department of Land Transport, Pollution Control Department of Thailand and Clean Air Initiative for Asian Cities Centre for text and data on “Air Quality in Bangkok”World Resources Institute for flowchart on “World GHG Emissions”
Input to boxes:Suochen Dong, Cristina Martínez Fernández, Padmashree Gehl Sampath, Asa Jonsson, Prabha Khosla, Xue Li, Frederico Neto, Madanmohan Rao, Wandia Seaforth, Deborah Wei Mullin, Xiaojun Zhang
Additional research:Sai Balakrishnan, Haddy Guisse, Lusungu Kayani, Jennifer Venema
Country information:Maria Alvarez Gancedo, Wesley Aruga, Kangwa Chama, John Leo Chome, Bharat Dahiya, Suocheng Dong, María D. Franco Delgado, Ali El-Faramawy, Eden Garde, David Houssou, Dodo Juliman, George Kozonguizi, Cecilia Martinez, Alberto Paranhos, Basilisa Sanou, Fole Sherman, Roshan Raj Shrestha, Ileana Ramirez, Tewodros Tigabu, Conrad de Tissera, Merlin Totinon, Pinky Vilakazi
ContentsPart 1: SPATIAL HARMONY
1.1 The Spatial Distribution of the World’s Cities . . . . . . . . . . . . . . . . . . . . .41.2 Urban Growth Patterns . . . . . . . . . . . . . . . . . . . . . . . . . . . . . . . . . . . . . . .101.3 Which Cities are Growing and Why . . . . . . . . . . . . . . . . . . . . . . . . . . . . 241.4 Shrinking Cities . . . . . . . . . . . . . . . . . . . . . . . . . . . . . . . . . . . . . . . . . . . . . 40
Boxes and City StoriesEconomic policies and migration: The case of Dhaka 25How governments are propelling urban growth 27New entrants in the league of cities 36Bangalore: India’s silicon plateau 38Planning for growth while anticipating decline 43Urban regeneration halts population decline in a European town 47
Figures1 1 1: Urbanization levels (percentage urban) by ecosystem, 2000 51 1 2: The world’s megacities, 2007 and 2025 61 1 3: Urban population (millions) by region, 2005 and 2050 71 2 2: City growth and decline by city size in the developed world, 1990-2000 121 2 3: Annual growth rate of the world’s cities by region and city size, 1990-2000 161 2 4: City growth and decline by city size in the developing world, 1990-2000 171 2 5: Distribution of urban population in the developing world by city size, 2000 181 3 1: Net migration rate and natural growth rate in Shanghai, 1995 - 2006 251 3 2: Number of new cities after 1990 in the developing world 361 4 1: Proportion of cities experiencing accelerated, rapid, moderate, slow and negative growth rates in the developing and developed world in the 1990s 40
Tables1 3 1: Drivers of growth in the developing world’s fastest growing cities 281 3 2: Number and total population of new cities established since 1990 361 4 1: Declining cities in the developing world (1990-2000) 40
Maps1 2 1: Cities that experienced very high or negative population growth rates between 1990 and 2000 11
Part 2: SOCIAL HARMONY
2.1 Why Urban Inequality Matters . . . . . . . . . . . . . . . . . . . . . . . . . . . . . . . 502.2 Urban Inequalities: Regional Trends . . . . . . . . . . . . . . . . . . . . . . . . . . . 622.3 Education, Employment and City Size . . . . . . . . . . . . . . . . . . . . . . . . . 822.4 Slums: The Good, the Bad and the Ugly . . . . . . . . . . . . . . . . . . . . . . . . . 902.5 Slum Cities and Cities with Slums . . . . . . . . . . . . . . . . . . . . . . . . . . . . 106
Boxes and City StoriesMeasuring inequality at the city level 51Bhutan’s gross national happiness index 59New dimensions of inequality in emerging economies:Recent evidence from China, India and Brazil 60China’s urban transition 78Slum households and shelter deprivations: degrees and characteristics 92Urban poor adversely affected by Zimbabwe’s political crisis 96Woman-headed households suffer disproportionately from inadequate housing 104Locating slums: Geographic concentration and clustering 107Years of sanctions and conflict take their toll on Iraq’s cities 117Helping to locate slums using Earth Observation and Geoinformation Technologies 118
Figures2 1 1: Urban inequalities in China, India and Malaysia, 1969-2002 542 1 2: Social mobility and equity in South African cities – Class composition 592.2.1: Average Gini coefficient of selected cities by region 632.2.2: Average urban Gini coefficient by region 632 2 4: Urban inequalities in Latin America and the Caribbean 672.2.5: Urban and rural Gini coefficients for selected developing countries 682.2.6: Gini coefficient for selected cities in Latin America and the Caribbean 692 2 7: Urban inequalities in selected countries in Latin America and the Caribbean, 1989 - 2006 702 2 8: Urban inequalities in Africa 712.2.9: Gini coefficient in selected African cities 722.2.10: Urban and rural Gini coefficients for selected African countries 732.2.11: Relationship between economic growth and change of Gini coefficient in selected African cities 742.2.12: Gini coefficients for selected Asian cities 752.2.14: Gini coefficients for urban and rural areas in Asia 772 3 1: Proportion of children enrolled in primary education in Latin American cities and rural areas 832 3 2: Proportion of children enrolled in primary education in Asian cities and rural areas 842 3 3: Proportion of children enrolled in primary school in sub-Saharan African countries
experiencing huge rural-urban disparities in access to education 852 3 4: Proportion of children enrolled in school in sub-Saharan African countries where access to education is generalized across urban and rural areas 852 4 1: Proportion of urban populations living in slums by region, 2005 912 4 2: Slum population by region (millions), 2005 912 4 3 A: Distribution of slum dwellers by degree of shelter deprivation (%), Africa 942 4 3 B: Distribution of moderately deprived slum dwellers (one deprivation) by type of deprivation
(%), Africa 942 4 3 C: Distribution of severely deprived slum dwellers (two deprivations) by type of deprivation
(%), Africa 942 4 3 D: Distribution of extremely deprived slum dwellers (three+ deprivations) by type of
deprivation (%), Africa 952 4 4: Slum prevalence in Africa, 2005 972 4 5: Slum prevalence in Asia, 2005 992 4 6 A: Distribution of slum dwellers by degree of shelter deprivation (%) Asia 1012 4 6 B: Distribution of moderately deprived slum dwellers (one deprivation) by type of deprivation (%), Asia 1012 4 7: Slum prevalence in Latin America and the Caribbean, 2005 1022 4 8 A: Distribution of slum dwellers by degree of shelter deprivation (%) Latin America 1032 4 8 B: Distribution of moderately deprived slum dwellers (one deprivation) by type of deprivation (%), Latin America 1032 5 1 A: Percentage of slum households by size of city: Countries with high concentration of slums
in small cities/towns as well as in capital/large cities 1082 5 1 B: Percentage of slum households by size of city: Countries with high concentration of slums
in small cities/towns and low or moderate concentration of slums in capital/large cities 1092 5 1 C: Percentage of slum households by city size - Countries with low or moderate
concentration of slums in capital/large cities as well as in small cities and towns 1102 5 1 D: Percentage of slum households by size of city: Countries with slum concentration higher in capital/large cities than in small cities and towns 1122 5 2: Percentage of non-slum or slum households living in slum areas 1132 5 3: Poverty incidence in Nairobi, Mombasa and Kisumu, 1999 119
Tables2.1.1: Change in urban inequalities (Gini coefficient) and GDP per capita (PPP) in selected countries 542 4 1: Proportion of urban population living in slums 2005 90
Maps2 2 3: Intra-city differences in unemployment in London, Berlin, Stockholm and Madrid, 2001 642 2 13: Urban inequalities in Asia 76
Part 3: ENVIRONMENTAL HARMONY
3.1 Urban Environmental Risks and Burdens . . . . . . . . . . . . . . . . . . . . . . 1223.2 Cities and Climate Change . . . . . . . . . . . . . . . . . . . . . . . . . . . . . . . . . . 1303.3 Cities at Risk from Rising Sea Levels . . . . . . . . . . . . . . . . . . . . . . . . 1403.4 Energy Consumption in Cities . . . . . . . . . . . . . . . . . . . . . . . . . . . . . . . 1563.5 Urban Energy Consumption at the Household Level . . . . . . . . . . . . 1643.6 Urban Mobility . . . . . . . . . . . . . . . . . . . . . . . . . . . . . . . . . . . . . . . . . . . . . 174
Boxes and City StoriesBangkok’s strategy to tackle air pollution 124Ougadougou’s Green Brigade 125The informal recycling economy of Asian cities 127Does the urban environment affect emotional well-being? 128“Heat island” effect 131Poverty reduction as an adaptation strategy 139African cities at risk 151Dhaka’s extreme vulnerability to climate change 152Cuba: A culture of safety 154Energy-efficient buildings in Beijing 167Embedded energy 168Cape Town: Scaling the energy ladder 173
Figures3 1 1: Air quality in Mega cities 123 Annual Average of PM10 in Bangkok during 1992 - 2005 1243 1 2: Proportion of children in urban areas in selected African countries with acute respiratory
infections by type of fuel used for cooking 1253 1 3: Waste production (kg/year) per capita in selected cities 1293.2.1: World GHG emissions flow chart 1323 2 2: Global greenhouse gas emissions in 2000, by source 1333 2 3: Relationship between urban density and CO2 emissions 1343 2 4: Per capita CO2 emissions in selected cities 1353 2 5: Carbon emissions in USA, European Union, China and India, 2005 and 2030 1363 3 1: Urban density (persons per sq km) by ecosystem, 1995 1413 3 2: Urban density by ecosystem 1443 3 3: Countries with the largest urban population in the low elevation coastal zone 1443 3 4: Latin America and Caribbean cities at risk due to sea-level rise 1463 3 5: Asian cities at risk due to sea-level rise 1473 3 6: African cities at risk due to sea-level rise 1483 3 7: Population distribution, urban places, and low elevation coastal zones in North Africa 1493 3 8: Proportion of population and land at risk due to sea level rise in Africa 1503 3 9: Flood-prone slum and non-slum settlements in Dhaka 1533 4 1: Linear and circular urban metabolism 1563 4 2: Energy consumption by region 1593 4 3: Energy consumption in selected cities in high-income, industrialized economies 1603 4 4: Energy consumption in selected cities in middle-income countries 1603 4 5: Energy consumption in selected Asian cities 1603 4 6: Ecological Footprint of countries by income (2003) 1623 4 7: Ecological footprint by components in selected cities 1633 4 9: Ecological Footprint of selected cities and of the countries where they are located 1633 5 1: Share of energy consumption in residential and commercial sectors in selected cities in
high-income countries 1653 5 2: Household energy use patterns in EU-15, 1997 1683 5 3: Low-income household energy use patterns in Cape Town, 1996 1683 5 4: Share of energy used for cooking in urban households in India, 1999/2000 1693 5 5: Emissions by common cooking fuels per meal 1693 5 6: Distribution of urban households by type of fuel for cooking in selected countries 1703 5 7: Greenhouse gas emissions from a typical biomass cookstove 1703 5 8: Proportion of family income used for energy in low-income households in selected cities and countries 1703 5 9: Electricity consumption per household (kWh/year) in selected cities and countries 1723 5 10: Share of commercial and residential electricity consumption in selected cities 1723 5 11: Household electricity consumption differences in Cape Town 1733 6 1: Share of motorized and non-motorized private and public transport in selected regions and countries 1763 6 2: Relationship between length of freeway per person and passenger car kilometres 1763 6 3: Energy use by travel mode by region 1773 6 4: Total transport (private and public) CO2 emissions in selected regions and countries 1793 6 5: Car ownership in selected cities 1793 6 6: Private car ownership in selected large and megacities 1793 6 7: Private car ownership in selected cities 1803 6 8: Transport mode split in selected cities 1803 6 9: Transport mode split in cities in the developed world 180
Tables3 2 1: GHG Emissions on a regional scale 1363 2 2: Adaptation strategies 1383 3 1: Urban population at risk from sea level rise 1423 3 2: Urban density by ecosystem 143
Maps3 4 8: Ecological footprint of Berlin for the year 2000 163
Part 4: PLANNING FOR HARMONIOUS CITIES
4.1 Inclusive Urban Planning for Harmonious Urban Development . . . .1844.2 Building Bridges: Social Capital and Urban Harmony . . . . . . . . . . . .1964.3 Unifying the Divided City . . . . . . . . . . . . . . . . . . . . . . . . . . . . . . . . . . . . 2044.4 Addressing Rural-Urban Disparities for Harmonious Regional
Development . . . . . . . . . . . . . . . . . . . . . . . . . . . . . . . . . . . . . . . . . . . . . . 2164.5 Metropolitan Governance: Governing in a City of Cities . . . . . . . . . 226
Boxes and City StoriesSearching for the soul of the city 194Identifying bonds and bridges in slum and non-slum areas of Addis Ababa 200Urban plus Rural as opposed to Urban versus Rural 217Achieving Spatially Balanced Human Settlements in Cuba 224The European Spatial Development Perspective 225
Figures4 2 1: Levels of trust and community participation by country and settlement type in Latin America 197
Table 4 4 1: Poverty and the rural-urban continuum 223
xi
comprehensive analysis of urbanization trends and the growth of cities in the last two decades. Using a wealth of significant and comparative data on cities, the report analyzes global and regional trends that reflect the pace and scale of urbanization in the developing world and the key drivers of urban growth in the world’s fastest growing cities. The purpose of this analysis is to explore the spatial nuances and implications of economic and social policies.
Urban growth rates are highest in the developing world, which absorbs an average of 5 million new urban residents every month and is responsible for 95 per cent of the world’s urban population growth. Urban growth is as a result of a combination of factors: geographical location, natural population growth, rural-to-urban migration, infrastructure development, national policies, corporate strategies, and other major political, social and economic forces, including globalization. In the 1990s, cities in the developing world grew at an average annual rate of 2.5 per cent. More than half of the urban areas in the developing world grew at the high annual rate of between 2 and 4 per cent or more during this period, while more than one-third grew at the moderate or slow rate of less than 2 per cent a year. Although urban growth rates are slowing down in most regions of the developing world, levels of urbanization are expected to rise, with the least urbanized regions of Asia and Africa transforming from largely rural societies to predominantly urban regions during the course of this century. By 2050, the urban population of the developing world will be 5.3 billion; Asia alone will host 63 per cent of the world’s urban population, or 3.3 billion people, while Africa, with an urban population of 1.2 billion, will host nearly a quarter of the world’s urban population.
In sharp contrast, the urban population of the developed world, including countries of the Commonwealth of Independent States, is expected to remain largely unchanged, rising only slightly from just over 900 million in 2005 to 1.1 billion in 2050. Many cities in this region are actually experiencing population loss, largely due to low rates of natural population increase and declining fertility rates. The phenomenon of declining populations is generally associated with the developed world; however, the phenomenon of shrinking urban populations can be observed in some cities in the developing world. There is, therefore, a need to combine new methods and techniques that respond to urban growth and expansion in some cities, while responding to the emerging trend of population and economic decline in others. Smart planning for growth should be combined with smart planning for contraction if more harmonious urban development is to be achieved.
Urban change in the developing world does not always follow identical patterns or trends. Urbanization in Africa is characterized by disproportionately high concentrations of people and investments in the largest city (in most cases, the capital) and by very high annual slum growth rates of more than 4 per cent. Urbanization in the region, especially in sub-Saharan Africa, is therefore characterized by urban primacy and slum formation.
In Asia, an emerging trend is that of metropolitan expansion, which is becoming a prominent feature of large cities. Urban populations are shifting or relocating to suburban locations or satellite towns linked to the main city through commuter networks. This phenomenon is particularly prevalent in large Indian cities, where ring towns or “bedroom communities” have formed around cities such as New Delhi and Mumbai. Urban growth patterns in China, on the other hand, have tended to produce “city regions” along the eastern coastal belt, which are responsible for much of the economic growth experienced by the country in recent years. In countries where urban primacy is still the rule, such as the Philippines and Indonesia, the trend has been to promote the growth of intermediate cities in order to direct migrants away from the largest city.
Urban development in Latin America and the Caribbean, the most urbanized region in the developing world, is also characterized by a high degree of urban primacy with one-fifth of the region’s urban residents living in cities with populations of 5 million or more. However, one of the most distinctive features of urbanization in the region is the rapid growth of small cities, which are home to nearly 40 per cent of the region’s urban population. Another distinctive characteristic of the region is that urban growth is often the result of people moving from one city to another, and not from rural areas to urban areas.
Central governments play a critical role in determining the prosperity and growth of cities
Geography clearly matters when explaining the economic dynamism and growth of cities and regions (location, comparative advantages, agglomeration factors, proximity etc.). For instance, cities located near the sea, along a river bank or in a delta have historically dominated, and continue to dominate, the urban landscape of countries and regions. Fourteen of the world’s 19 largest cities with populations of more than 10 million are located near a large water body that serves to link local economies to regional and global supply chains and trade.
However, geography alone does not determine which cities will grow or prosper. This report shows that the growth of cities is neither random nor entirely organic. National policies, corporate strategies and the comparative advantages that cities offer in global, regional and local markets to a large extent determine which cities will grow and thrive and which will decline in size or economic or political significance. National policies that include pro-urban approaches to economic development play a critical role in the growth of cities, as has been witnessed in China’s southern and eastern regions in recent years.
In many cities, national economic policies and investments are mostly the result of government decisions and budget allocations. The State, in its various institutional forms, exerts a critical influence on determining which cities and regions will benefit most from public resources. Governments also promote and/or regulate private or public investments for

xii
STAT
E OF
THE
WOR
LD’S
CIT
IES
2008
/9
the construction of infrastructure and other investments that contribute to urban development. Central governments in many countries are concentrating more attention and resources on particular city-regions to redirect regional or national development. They are also using cities to connect to the global space of business and financial flows, while concurrently using such cities to propel social change in particular directions.
In many countries, urban growth is initially driven by national governments, and then further propelled by local authorities and other actors, such as the private sector. This has led to cities competing with each other for resources and for inclusion in regional and national development plans and strategies. The growth of cities through local initiatives reflects a rising trend towards greater urban entrepreneurialism and more intense city competition.
Balanced urban and regional development can be achieved through consistent and targeted investments in transport and communications infrastructure
Cities can no longer be treated as distinct spaces unconnected to the regions surrounding them. Linkages between rural and urban areas and between cities have created new opportunities that rely on connectivity to enable the flow of people and resources from one area to another. Investments in urban, inter-urban and rural-urban transport and communications infrastructure are, therefore, critical for balanced regional development and for enhancing the economic potential of cities and the regions surrounding them.
Central governments play a pivotal role in allocating and mobilizing financial resources either to support urban economic development or to redress regional/territorial disparities. This report shows that targeted investments in transport and communications infrastructure, in particular, are the most significant drivers of urban growth and economic development in the developing world.
A preliminary UN-HABITAT analysis of the fastest growing cities in the developing world shows that more than 40 per cent benefitted from the diversification, expansion or improvement of regional or national transport systems, including roads, airports, urban and inter-urban railway lines and ports. Investment in transport and communications infrastructure not only increases the overall productivity of cities, nations and regions, it also promotes balanced urban and regional development. Policies to promote economic development, including designation of special economic zones or industrial hubs, are also playing an important role in the growth of cities, particularly in Asia.
Social Harmony
Cities are becoming more unequal
In many cities, wealth and poverty coexist in close proximity: rich, well-serviced neighbourhoods and gated residential
communities are often situated near dense inner-city or peri-urban slum communities that lack even the most basic of services. This report presents a preliminary global analysis of income and/or consumption distribution at the urban and/or city level. It shows that income distribution varies considerably among less-developed regions with some regions, notably Africa and Latin America, exhibiting extremely high levels of urban inequality compared to Europe and Asia, where urban inequality levels are relatively low.
Latin American and Caribbean cities are among the most unequal in the world, with Brazilian and Colombian cities topping the list, closely followed by some cities in Argentina, Chile, Ecuador, Guatemala and Mexico. Urban inequalities in this highly unequal region are not only increasing, but are becoming more entrenched, which suggests that failures in wealth distribution are largely the result of structural or systemic flaws.
In Africa, urban income inequalities are highest in Southern Africa, with South African and Namibian cities exhibiting levels of urban inequality that rival even those of Latin American cities. Cities in sub-Saharan Africa that have recently emerged from apartheid systems of governance tend to be the most unequal. South Africa stands out as a country that has yet to break out of an economic and political model that concentrates resources, although the adoption of redistributive strategies and policies in recent years have reduced inequalities slightly. Unfortunately, rising economic growth rates in several African countries have not reduced income or consumption disparities; on the contrary, urban inequalities in many African cities, including Maputo, Nairobi and Abidjan, remain high as wealth becomes more concentrated. In general, urban inequalities in African countries tend to be higher than rural inequalities, and Northern African cities tend to be more equal than sub-Saharan African cities.
Asian cities, on the other hand, tend to be more equal than cities in other parts of the developing world, although levels of urban inequality have risen or remain high in some cities, including Hong Kong and Ho Chi Minh City. High levels of urban inequality have also been reported in cities in Thailand and the Philippines. Cities in China tend to be more equal than other Asian cities, with Beijing being among the most equal city in the region, although some Chinese cities, such as Shenzhen, are experiencing relatively high inequality levels similar to those of Bangkok and Manila. China’s booming economy has also led to rural-urban and regional disparities, with populations living in cities located on the eastern part of the country enjoying significantly higher per capita incomes than rural populations living in remote western parts of the country. In Bangladesh, India, Pakistan and Indonesia, levels of urban inequality are generally low and are comparable to many cities in Europe, Canada and Australia. However, recent analyses suggest that India will experience rising levels of urban inequality in the future as a result of liberalization and industrialization policies coupled with lack of adequate investment in provision of public goods to the most vulnerable populations.
xiii
High levels of urban inequality are socially destabilizing and economically unsustainable
High levels of inequality in cities can lead to negative social, economic and political consequences that have a destabilizing impact on societies. Inequalities create social and political fractures within society that can develop into social unrest. This is particularly true in places experiencing both high levels of inequality and endemic poverty, which increase the risk of political tension and social divisions that can threaten national security and economic development. Social unrest and insecurity, in turn, reduce incentives for investment and force governments to increase the amount of public resources devoted to internal security – resources that might have otherwise been spent on more productive sectors of the economy or on social services and infrastructure.
This report shows that the benefits of economic growth are not realized in societies experiencing extremely high levels of inequality and poverty. In fact, recent evidence shows that societies that have low levels of inequality are more effective in reducing poverty levels than those that are highly unequal. Economic growth benefits larger groups of people and is “absorbed” better by egalitarian societies than by those where disparities between the rich and the poor are very wide, as the former tend to concentrate the benefits of wealth creation, leaving the majority behind. Inequalities also have a dampening effect on economic efficiency as they raise the cost of redistribution and affect the allocation of resources for investment.
A significant conclusion of this report is inequality is not a natural consequence of economic growth and that while the relationship between economic growth and urban income inequality is neither simple nor correlational, levels of inequality can be controlled or reduced by forward-looking mitigation efforts on the part of governments. UN-HABITAT analysis of urban inequalities in 28 developing countries indicates that since the 1980s nearly half of these countries managed to reduce levels of urban inequality while enjoying positive economic growth. Malaysia, for instance, has been steadily reducing levels of urban inequality since the early 1970s through the implementation of pro-poor policies and through human resources and skills development. Similarly, Indonesia’s “Growth, Stability and Equity” programme has ensured that income distribution and poverty alleviation are integral components of economic growth and development. Policies promoting equity in Rwanda have also ensured that the high economic growth rates that the country is currently experiencing do not increase inequality levels. These countries have shown that it is possible to grow economically without increasing inequality levels, and that reduction of inequalities is, in fact, a pro-growth strategy.
Focused and targeted investments and interventions can significantly improve the lives of slum dwellers
Slum dwellers in many of the world’s poorest cities experience multiple deprivations that are direct expressions
of poverty: many of their houses are unfit for habitation and they often lack adequate food, education, health and basic services that the better-off take for granted. Frequently, their neighbourhoods are not recognized by local and central authorities. In many parts of the world, these “invisible”, unplanned parts of cities are growing faster than the more visible, planned parts.
In some cities, slum dwellers constitute the majority of the urban population and slums are the most common type of human settlement, giving rise to what this report refers to as “slum cities”, while in others, slums are small pockets of deprivation physically isolated from the rest of the city. Slum prevalence is highest in sub-Saharan-Africa (62 per cent), followed by Southern Asia (43 per cent) and Eastern Asia (37 per cent). Northern Africa has the lowest slum prevalence in the developing world (15 per cent).
However, new UN-HABITAT data shows that not all slum dwellers suffer from the same degree or magnitude of deprivation, nor are all slums homogenous. In other words, not all slum dwellers around the world suffer the same fate: some are worse off than others. In general, however, the poorest regions of the world tend to host the largest slum populations that suffer from multiple shelter deprivations, including lack of access to improved water and sanitation, overcrowding, non-durable housing and insecure tenure. For instance, surveys conducted in Angola, the Democratic Republic of the Congo, Guinea Bissau, Sudan and Sierra Leone show that slum dwellers there are likely to experience a combination of shelter deprivations, whereas in countries such as Benin, Burkina Faso, Burundi, Cameroon, Gabon, Kenya, Ghana and Senegal, most slum dwellers tend to suffer from one or two shelter deprivations. The report also shows that woman-headed households suffer disproportionately from multiple shelter deprivations; in Haiti, for instance, nearly 60 per cent of woman-headed households suffer from three shelter deprivations, while in Kenya and Nicaragua, one-third of woman-headed households experience four shelter deprivations.
The report also shows that slum dwellers across regions suffer from similar deprivations: slum dwellers in Colombia, Turkey and Zimbabwe, for instance, suffer mostly from overcrowding, whereas slum dwellers in Egypt and Mexico suffer most from lack of improved sanitation. In many cities, however, living in a non-slum area is no guarantee against poor living conditions. UN-HABITAT data shows that a slum resident in Cairo can be better-off than a non-slum dweller in Lagos, Luanda and many other cities in sub-Saharan Africa in terms of indicators such as health, education or environmental conditions. These differentiated levels of social inequality and exclusion can adversely affect cities and regions’ social and economic development.
By identifying the particular deprivation that is prevalent in slums, governments and local authorities can focus public resources for the improvement of slums more effectively. In the case of Benin, for instance, targeted investments in sanitation facilities in slums could easily elevate a quarter of the slum households to non-slum status. By disaggregating

xiv
STAT
E OF
THE
WOR
LD’S
CIT
IES
2008
/9
the type and level of shelter deprivation in slums (i.e. severe or non-severe), policymakers can be in a better position to devise policy responses that are better focused and targeted. Furthermore, by categorizing slums according to the type or intensity of deprivation they experience, it is possible to better target interventions in cities and even within specific neighbourhoods. This information can be combined with other urban and slum indicators in order to make more informed decisions about how to improve the lives of slum dwellers and build cities that are more socially harmonious.
Environmental Harmony
Cities provide an opportunity to mitigate or even reverse the impact of global climate change as they provide theeconomies of scale that reduce per capita costs and demand for resources
Cities that are not properly planned or managed can be a burden on natural resources and can easily threaten the quality of the air and water, thereby negatively impacting the natural and living environment. Because of their compact form and economies of scale, cities offer major opportunities to reduce energy demand and to minimize pressures on surrounding land and natural resources. Well-planned and well-regulated cities hold the key not only to minimizing environmental losses, but to generating creative solutions to enhance the quality of the environment and to mitigate the negative consequences of climate change.
However, if cities can harness the inherent advantages that urbanization provides, they can, in fact, be part of the solution to global environmental challenges, including the rise in greenhouse gas emissions brought about by fossil fuel consumption. Although cities and urban-based activities are usually blamed for the increase in greenhouse gas emissions globally, evidence suggests that these emissions are more related to consumption patterns and gross domestic product (GDP) per capita than they are to urbanization levels per se. For instance, the megacity of São Paulo in Brazil produces one-tenth the emissions of San Diego in the United States, even though the latter is one-quarter the size of the former.
This report presents a first general account of how cities consume energy, disaggregating the information in three sectors: industry; residential and commercial buildings; and transport, taking into account the stage of development of countries and their income levels. Although per capita energy consumption tends to be higher in rich industrialized cities, there are significant variations between cities in different regions. For example, cities in Europe, which tend to be compact and which encourage use of public transport, use energy more efficiently than cities in North America, where urban sprawl, high-energy-consuming lifestyles and high dependence on motorized private transport is the norm.
The findings further show that energy use differs between cities in the developed world and those in developing countries. Heating and lighting of residential and commercial buildings consume more than 50 per cent of energy in cities such as New
York, London and Tokyo, while transport accounts for more than half of the energy consumed in Hong Kong, Bangkok, Cape Town and Mexico City. In some Chinese cities, such as Beijing and Shanghai, industry is the main consumer of energy. Variations between regions and cities can also be found at the household level. The bulk of energy in low-income households in developing countries is used for cooking, whereas space heating and lighting use up the bulk of energy in households in high-income countries. For urban poor households the climb up the energy ladder – from biomass fuels to cleaner energy sources, such as electricity or natural gas – not only improves their quality of life, but also reduces greenhouse emissions. There is, therefore, a need to introduce new energy-efficient and environmentally-friendly technologies in low-income communities in order to reduce their environmental impact and lessen environmental hazards.
Data on energy consumption at the city, sub-city and household levels is still scant, however, which calls for the need to set up a global monitoring mechanism to measure energy consumption in cities, their impact on greenhouse gas emissions and the mitigation and adaptation solutions that are being implemented.
Evidence shows that compact and well-regulated cities with environmentally-friendly public transport systems have a positive environmental impact
Although the rich generally consume more energy than the poor, the report shows with convincing evidence that urban form and density and environmentally-friendly public transport systems strongly influence energy consumption at the city level and that some cities in developed countries now produce fewer carbon emissions per capita than cities in some less developed countries. Cities that are more compact, use more clean energy and are less dependant on motorized transport are not only more energy-efficient but contribute less to greenhouse gas emissions.
A comparison of transport-related carbon emissions in various regions around the world shows that emissions are highest in North America and Australia. North American cities are suffering from urban sprawl and expansion and increased use of private motorized transport, which contribute to the exceptionally high levels of emissions in this region. Western Europe, on the other hand, produces approximately a quarter of the transport-related emissions of North America, a difference that can be explained by the tendency of European cities to promote the use of clean energy and the more prevalent use of public transport in the region. Increased use of environmentally-friendly public transport systems and halting of urban sprawl in cities can therefore substantially reduce emissions at the city level.
Sea level rise could have a devastating impact on coastal cities
Global mean projections indicate that global warming could lead to a rise in sea levels in the coming decades. Sea
xv
level rise brought about by climate change could have a devastating impact on coastal cities and urban populations. Globally, nearly 60 per cent of the world’s population living in low elevation coastal zones – the continuous area along coastlines that is less than 10 metres above sea level and which is most vulnerable to sea level rise – is urban. Some regions, such as Asia and Africa, are particularly vulnerable, as many coastal cities in these regions do not have the infrastructure to withstand extreme weather conditions. Parts of cities such as Dhaka in Bangladesh and Alexandria in Egypt could in effect be swept away as the infrastructure to withstand extreme flooding in these and other cities in the developing world is insufficient. Because the urban poor tend to live in hazardous locations, such as flood plains, they are particularly vulnerable in the event of sea level rise as their housing is often of a non-durable nature and their settlements often lack adequate drainage, embankments and other infrastructure. These cities need to urgently adopt mitigation and adaptation strategies in order to avert catastrophic consequences in the future.
Planning for Harmonious Cities
Cities are not just brick and mortar: they symbolize the dreams, aspirations and hopes of societies. The management of a city’s human, social, cultural and intellectual assets is, therefore, as important for harmonious urban development as is the management of a city’s physical assets.
Urban planning has to go beyond being just a technical exercise to one that is cognizant of a city’s various tangible and intangible assets. Innovative approaches to urban planning have to also respond to the following emerging priorities and concerns: regional disparities; urban inequalities; and metropolitan expansion or the growth of “city regions”. This report presents some of the elements required to implement innovative planning solutions for sustainable and harmonious urban development with examples of cities that are making a difference.
Commitment to pro-poor, inclusive urban development
Pro-poor social programmes, inclusive governance structures and investment in public goods and services have gone a long way in reducing inequalities in many cities. Investments in infrastructure and basic services for the poorest or most vulnerable groups have not only drastically reduced urban poverty levels, but also bridged the urban income divide.
This report presents the main conclusions of an analysis of the policies and interventions that cities are implementing to achieve more harmonious urban development. The analysis was conducted by UN-HABITAT and the Cities Alliance and covers approximately 52 cities in 21 countries. This study provides a better understanding of what drives city/country’s performance in reducing intra-city inequalities by upgrading slums and preventing their formation. The report shows that successful slum improvement or reduction initiatives share six attributes, and when governments harness all or some of them the possibility of success is higher. These attributes
are: i) awareness and political commitment; ii) institutional innovation; iii) policy reforms and institutional strengthening; iv) effective policy implementation; v) setting up monitoring and evaluation mechanisms; and v) scaling up actions.
Political commitment, especially by the top leadership, plays a critical role in reducing urban poverty and slum prevalence. Some of the most successful cities in this regard have benefitted from visionary mayors and political leaders who have radically transformed city landscapes by introducing reforms and strengthening institutions that enhance a city’s economic vitality and environmental sustainability while simultaneously reducing poverty levels and slum prevalence. Political commitment coupled with performance monitoring, either from the bottom up or from the top down, have shown to improve the quality of urban services in many cities, and made local authorities more accountable to citizens.
Governing in a city of cities
The report advocates for the need to consider metropolitan and regional governance structures to respond to the growing demands and challenges of urban agglomerations that are expanding outside the traditional city limits. The “city of cities” or “city regions” should be able to respond to issues such as transport, crime, pollution, poverty and exclusion through effective metropolitan governance arrangements. These new structures of governance would address fundamental challenges, such as territorial isolation, fragmentation of technical and political interests, legal restrictions on municipalities to intervene beyond the politico-administrative jurisdictions, and different levels of functionality of the fiscal and administrative systems.
Metropolitan governance arrangements affect the levels of harmony and disharmony in cities. Harmony can be enhanced through effective leadership, efficient financing, effective evaluation mechanisms and forms of citizen participation, and institutional reforms addressing multi-level and inter-jurisdictional challenges to better govern metropolitan areas.
Competitive cooperation between cities that are part of the same urban agglomeration can help to overcome disharmonies related to spatial or territorial disparities and inequalities in the access to housing and basic services. They can also contribute to more balanced development between rich and poor municipalities and between the urban agglomeration and the hinterland. Metropolitan governance structures that coordinate with other levels of government can also put in place mitigation and adaptation measures that can contribute to the improvement of the quality of the environment.
Effective metropolitan governance offers the potential for more harmonious urban development responding to the following fundamental concerns: i) spatial disparities, ensuring that government policies promote convergence of leading and lagging regions and cities, supporting further development in the former and dealing with asymmetric growth and regional disparities in the latter; ii) an increasingly divided urban society, ensuring that governments adopt pro-poor growth policies and reforms by designing interventions in those

xvi
STAT
E OF
THE
WOR
LD’S
CIT
IES
2008
/9
sectors and areas in which poor people earn their living and where economic development faces distributional challenges; iii) increased environmental costs, ensuring that governments adopt policies to enhance energy efficiency related to the functionally of the city such as public transport and anti-sprawl policies that improve the quality of the environment without impairing economic growth; iv) ensuring that governments adopt policies to protect intangible assets, such as cultural heritage, and create social spaces that contribute to “humanizing” cities.
Coordination and collaboration between national, provincial and local authorities can achieve harmonious regional and urban development, provided they share a common vision and demonstrate sufficient political will
Improved coordination between the three levels of government – local, provincial and national – involves a change in the national and urban governance paradigm, in which central governments have the responsibility to put forward legislation, adopt social and economic policies and allocate budgets through a continuous dialogue with regional and local authorities in support of city growth. On their part, local authorities, working with regional authorities, need to develop clear visions and strategies that articulate short- and medium-term responses to enhance economic and social conditions in their cities. When local authorities set up good local governance structures for effective urban management and city development, and when they improve coordination with the other two levels of government, there are more chances to achieve harmonious regional and urban development. Economic and social policies need to address the needs of both cities and the regions in which cities are located, including urban-rural interfaces. If this is not done, it is likely that regional disparities will continue to widen.
Hong Kong ©Xing Zhang
s
2
STAT
E OF
THE
WOR
LD’S
CIT
IES
2008
/9
SPATIAL HARMONYPart One
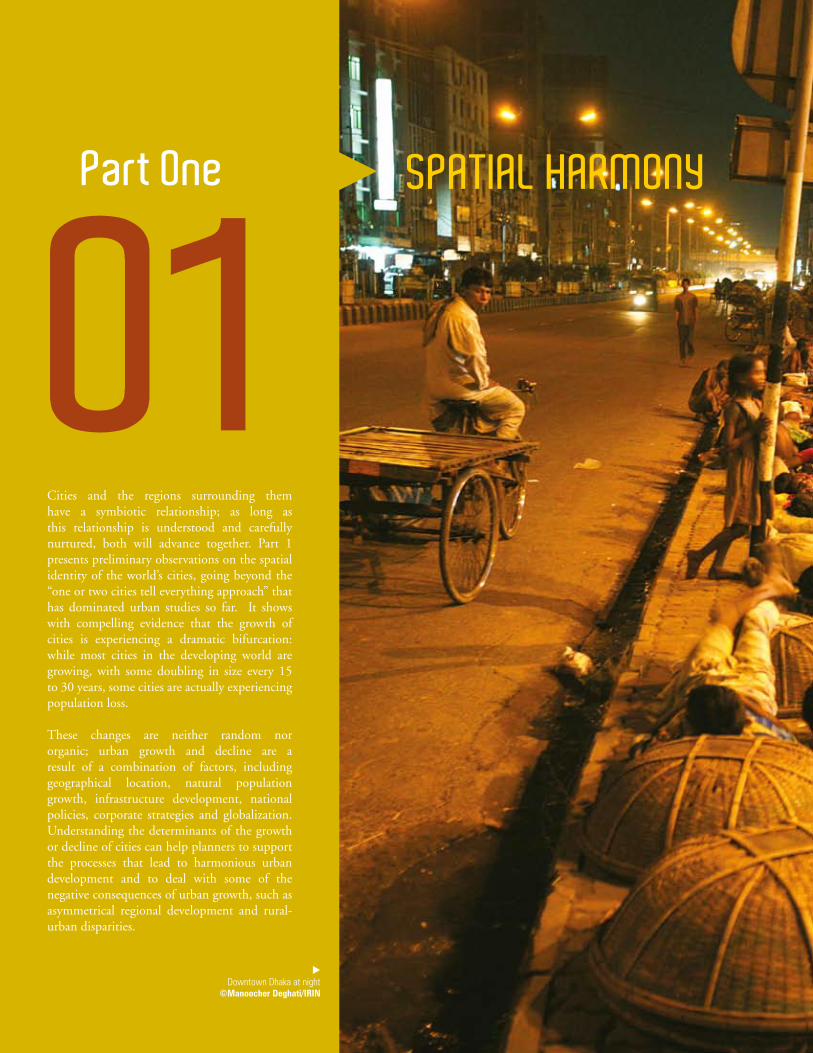
01Cities and the regions surrounding them have a symbiotic relationship; as long as this relationship is understood and carefully nurtured, both will advance together. Part 1 presents preliminary observations on the spatial identity of the world’s cities, going beyond the “one or two cities tell everything approach” that has dominated urban studies so far. It shows with compelling evidence that the growth of cities is experiencing a dramatic bifurcation: while most cities in the developing world are growing, with some doubling in size every 15 to 30 years, some cities are actually experiencing population loss.
These changes are neither random nor organic; urban growth and decline are a result of a combination of factors, including geographical location, natural population growth, infrastructure development, national policies, corporate strategies and globalization. Understanding the determinants of the growth or decline of cities can help planners to support the processes that lead to harmonious urban development and to deal with some of the negative consequences of urban growth, such as asymmetrical regional development and rural-urban disparities.
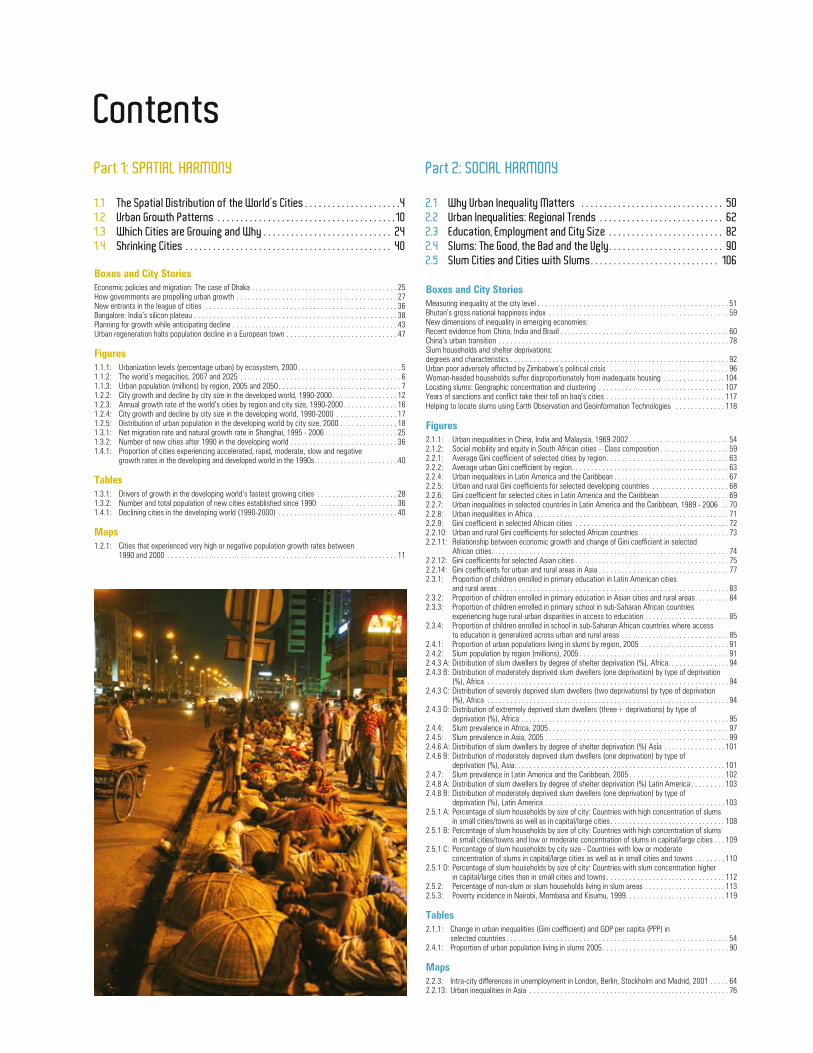
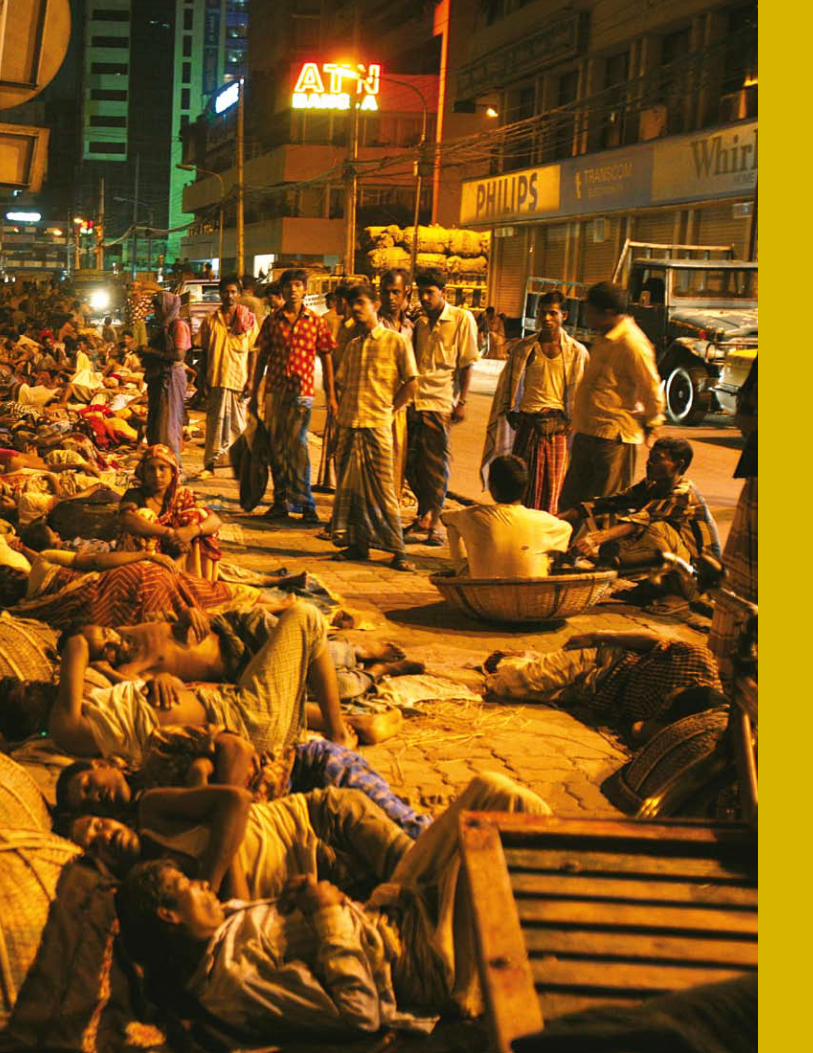
Downtown Dhaka at night©Manoocher Deghati/IRIN
s
3
SPATIAL HARMONY

4
STAT
E OF
THE
WOR
LD’S
CIT
IES
2008
/9
Geography matters
The evolution of cities is intimately linked to geography. Archaeological evidence shows that many of the oldest human settlements were located along the banks of mighty rivers and lakes,
in deltas or along coastlines. Locations near water offered opportunities for fishing and agriculture, which helped ensure a steady food supply. Coastal cities and cities located in river deltas also served to link local economies to regional and global supply chains and trade; such cities have continued to provide vital economic links throughout time.
1.1The Spatial Distribution of the World’s Cities
Coastal areas have always been preferred locations for human settlements, both in ancient times and today. Cities located near the sea have an obvious advantage: they provide access to sea trade routes and links.1 Globally, coastal zones are the most urbanized ecosystems, with 65 per cent of their inhabitants residing in urban areas; Europe, North America, Oceania, and Latin America have the most urbanized coastal areas, with more than 80 per cent of the population along coastlines living in cities.
s
Montevideo cityscape from port district©Sonja Fagnan/iStockphoto

5
Settling near large bodies of water has clearly been an important factor in the economic and demographic growth of cities. Inland water ecosystems, like coastal areas, also tend to be highly urbanized. Globally, 55 per cent of the world’s population residing in inland water ecosystems was urban in 2000. In Africa, slightly more than 50 per cent of the population residing along the shores of inland lakes and rivers was urban in 2000, while in Asia, the figure was 47 per cent.2 (Figure 1.1.1)
While coastal zones tend to be the most urbanized ecosystems in all regions of the world, they do not support the largest share of urban populations in countries with coastlines; in all regions of the world, except Oceania, cultivated ecosystems – or agricultural land – support the largest urban populations. In China, for instance, more than 85 per cent of the urban land area and urban population is located in cultivated ecosystems; China’s coastal zone, however, represents just 2 per cent of the total land area but is home to 23 per cent of the urban population of the country and 14 per cent of the total population. 3
Cities located near the sea, along a river bank or in a delta tend to be the largest cities in all regions of the world. Port cities, in particular, continue to dominate the urban landscape of countries and regions. Fourteen of the world’s 19 largest cities are port cities located along a coastline or in a river delta. (Fig. 1.1.2) A similar pattern exists at the regional level. Fourteen of the 20 largest cities in both Africa and Latin America and the Caribbean are located on a coastline or along a river bank. In Asia, the dominance of port cities is even greater: 17 of the region’s 20 largest cities are either coastal, on a river bank or in a delta. In general, large cities – both coastal and inland – in the developing world tend to be larger and more dense than those in the developed world, as most cities with populations greater than 500,000 are located in
low- or middle-income countries, with Asia having the largest number of cities with populations of 1 million or more.4
Rivers and delta regions have played an equally important role in the growth of Asian cities as coastlines; half of the largest cities in the region developed along important rivers that serve as gateways to coastal and inland areas. In the developed world (including Japan), 35 of the 40 largest cities are either coastal or situated along a river bank. In Europe, rivers have played a more important role in determining the growth and importance of a city than the sea; more than half of the 20 largest cities in the region developed along river banks. These cities have played, and continue to play, an important role in the economy of the region. As the volume of sea trade has more than doubled in the last 30 years, and is likely to grow, port cities are likely to gain even more economic importance in the future.5
Cities in other ecosystems are now growing faster around the world than cities in coastal zones. Globally, cities located in mountainous regions grew at almost the same rate as cities located in coastal zones (approximately 2.5 per cent a year) between 1995 and 2000. Although cultivated and dryland ecosystems supported the largest share of the total urban population of Africa between 1995 and 2000, the urban population in forested and mountainous areas grew the fastest during the same period. Urban growth in these areas, however, could have negative implications for the continent’s already fragile environment, and for climate change. In Asia, cities in both coastal and cultivated areas grew at the same rate (3 per cent a year), while in Latin America, cities in dryland, forest and inland water areas grew at the same rate (2.2 per cent a year) during this period. Projections suggest that in the next 15 years, cities in coastal, dryland, inland water, and mountainous ecosystems will grow steadily at an average rate of 2 per cent per year.6
FIGURE 1 1 1: URBaNIZaTIoN levelS (peRCeNTage URBaN) By eCoSySTeM, 2000
Source: Balk et al., 2008.

6
STAT
E OF
THE
WOR
LD’S
CIT
IES
2008
/9
National economic and industrial policies make a difference
In the last two decades, some inland cities have taken advantage of the opening up of economies, the elimination of trade restrictions, and the reduction of tariff and transport costs to foster economic and population growth.7 Other inland cities have used their proximity to larger urban agglomerations to improve their transport and communication systems to become more competitive. Many small cities are developing urban-scale economies, enhancing their ability to manage urbanization with added commuting technology and basic services, and are improving the delivery of social services to attract people and capital. As a consequence, some cities are growing very rapidly, other less rapidly and some not at all; in fact, numerous cities are experiencing a decline in their populations and in their economies.
These changes are neither random nor entirely organic; the growth of cities is determined by a variety of factors, many of which have to do with national policies. Governments and private capital often determine which cities will grow and which will not by deciding on the location of key investments, such as roads, airports, universities, communications, or capital, which influence a range of economic activities that lead to population growth or in-migration.8 The city of Shenzhen in China, for instance, grew at the astounding annual rate of
20 per cent during the 1990s after it was declared a Special Economic Zone by the Chinese authorities in the 1980s. As an industrial growth pole, the city is now one of the most important transport and industrial hubs in China, and a key driver of the country’s economy.
When central authorities implement macroeconomic policies or adopt specific economic or industrial reforms, some areas benefit more than others. The economic reforms have a cumulative impact; they in turn, influence the spatial distribution of new investments and employment in specific regions.9 To some extent, the movement of rural populations to urban areas and movement of populations between different areas is linked to these spatial influences: people generally migrate to places where they think there are more opportunities, and the concentration of economic activity in cities is a major attractor for people from rural areas. However, rural-to-urban migration is becoming less prevalent in many regions as urban-to-urban migration and natural population growth gain momentum. Mobility from one city to another is becoming one of the predominant types of population movements in Latin America, where half of the people moving from one state to another originate from and end up in cities.10
FIGURE 1 1 2: The woRlD’S MegaCITIeS, 2007 aND 2025
2007 2025
Population (Thousands) Population (Thousands)
1 Tokyo 35,676 1 Tokyo 36,400
2 Mexico City 19,028 2 Mumbai 26,385
3 New York-Newark 19,040 3 Delhi 22,498
4 São Paulo 18,845 4 Dhaka 22,015
5 Mumbai 18,978 5 São Paulo 21,428
6 Delhi 15,926 6 Mexico City 21,009
7 Shanghai 14,987 7 New York-Newark 20,628
8 Kolkata 14,787 8 Kolkata 20,560
9 Buenos Aires 12,795 9 Shanghai 19,412
10 Dhaka 13,485 10 Karachi 19,095
11 Los Angeles-Long Beach-Santa Ana 12,500 11 Kinshasa 16,762
12 Karachi 12,130 12 Lagos 15,796
13 Rio de Janeiro 11,748 13 Cairo 15,561
14 Osaka-Kobe 11,294 14 Manila 14,808
15 Cairo 11,893 15 Beijing 14,545
16 Beijing 11,106 16 Buenos Aires 13,768
17 Manila 11,100 17 Los Angeles-Long Beach-Santa Ana 13,672
18 Moscow 10,452 18 Rio de Janeiro 13,413
19 Istanbul 10,061 19 Jakarta 12,363
20 Istanbul 12,102
21 Guangzhou, Guangdong 11,835
22 Osaka-Kobe 11,368
23 Moscow 10,526
24 Lahore 10,512
25 Shenzhen 10,196
26 Chennai 10,129
Source: UN-HABITAT 2008Data from UN Population Division, World Urbanization Prospects 2007. Figures for 2025 are projections.Note: Population figures are for urban agglomeration, not city proper. Megacities are cities with populations of more than 10 million. : New megacities
: Cities located near a large water body (sea, river or delta)
7
Reconciling geography and economy with policy
Geography and national economic policies alone do not determine which cities will grow and which will decline. In an increasingly globalizing world, countries and cities that take advantage of global, regional and local markets tend to thrive while those that are not part of this marketplace tend to decline in size and significance. The concentration of economic activities and population generates efficiency gains in certain regions and urban centres that benefit from international, national and local factors, while leaving other regions and cities behind. This has led to regional imbalances in the incidence of poverty, on the one hand, and also intra-regional imbalances on the other. Whereas the top one-third of developing countries experienced a relatively large increase in the ratio of trade to Gross Domestic Product over the past twenty years, the remaining two-thirds of developing countries actually trade much less today than twenty years ago.11
Spatial and regional disparities have become more visible and have increased in many countries, particularly over the last two decades.12 In Peru, the incidence of poverty in coastal
FIGURE 1 1 3: URBaN popUlaTIoN (MIllIoNS) By RegIoN, 2005 aND 2050
s
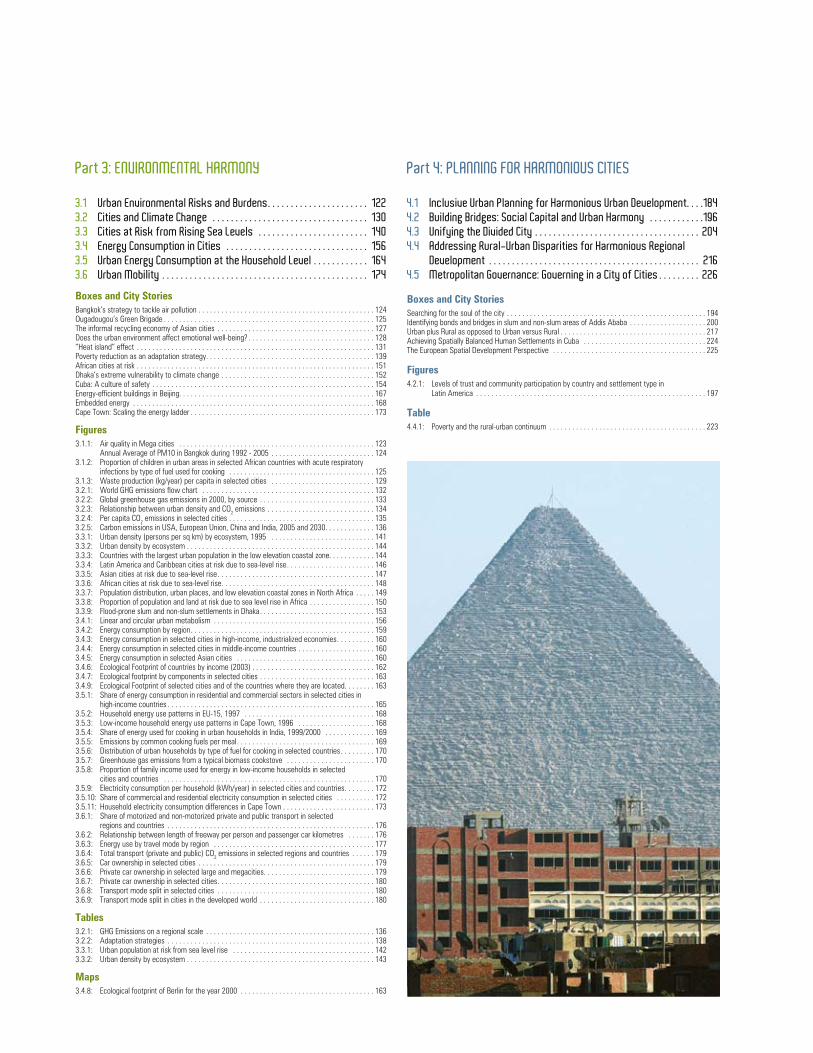
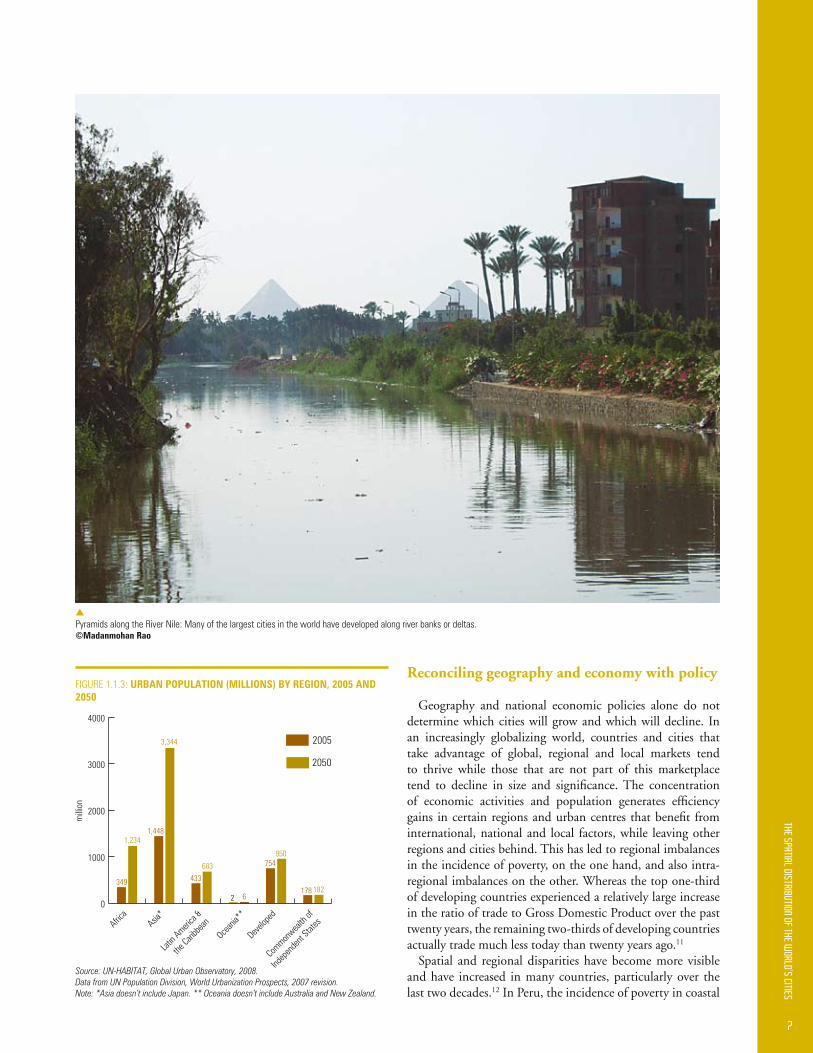
Pyramids along the River Nile: Many of the largest cities in the world have developed along river banks or deltas ©Madanmohan Rao
Source: UN-HABITAT, Global Urban Observatory, 2008. Data from UN Population Division, World Urbanization Prospects, 2007 revision. Note: *Asia doesn’t include Japan. ** Oceania doesn’t include Australia and New Zealand.

8
STAT
E OF
THE
WOR
LD’S
CIT
IES
2008
/9
s
Dhaka: This megacity is expected to absorb an additional 9 million inhabitants in the next 15 years ©Maciej Dakowicz
of income for a poor farmer, meaning that many children raised in rural areas cannot access a full education. Disparities at national and local levels have isolated entire areas and groups, and, in many cases, these inequalities are aligned to political and ethnic divisions. Regional rivalries and disputes have become major concerns of national policy makers, who understand that if sections of a country’s population cannot savour the sweetness of economic growth and prosperity, their discontent may eventually spark off social unrest or conflict. Policymakers are becoming increasingly aware that economic growth and prosperity that excludes large portions of a country’s population may not pave the way for peace and democratic institutions.
The Chinese authorities have acknowledged that “a most severe social crisis can erupt at the time when an economy reaches its most flourishing stage”.17 Official data corroborates this statement: incidents of social unrest, including strikes, demonstrations and riots, increased in China by nearly 50 per cent in the period from 2003 to 2005.18 Voices of discontent are also being heard in other countries. In South Africa, for instance, the minister in charge of safety and security acknowledged that in 2005 alone, there were 881 protests in slums, approximately five times the number of any comparable previous period; unofficial sources indicate that at least 50 of these protests turned violent.19 And in Kenya, many people believe that regional and intra-city disparities
districts was 46 per cent in 1997, while for districts at an altitude greater than 3,500 meters above sea level it was 63.3 per cent.13 In Mexico, the poorest areas are mainly in the indigenous and rural south, while the north has benefited from strong investments and economic integration with the United States and Canada.14 In China, large economic and social gaps exist between the mostly urban coastal areas and inland regions, with coastal areas growing five times as fast as inland areas. Income disparities between rural and urban areas in China are becoming more apparent and are rising. Urban per capita disposable income in 2003 was 3.23 times that of rural per capita net income, while urban per capita consumption was 3.6 times rural per capita consumption.15
Concentration of economic activities does not automatically lead to population growth. In Thailand, from 1987 to 1996, the capital city of Bangkok accounted for more than 52 per cent of the rise in GDP, but only 11 per cent of the increase in population. In contrast, the northeast region, which accounted for only 11 per cent of the GDP, experienced a 32 per cent increase in population.16
Numerous examples point to an increase in spatial disparities and uneven regional development around the world. What is clear is that these asymmetries are reflected in economic, social and health indicators and in development opportunities. In many developing countries, the average cost of education in a full-time four-year university is equivalent to 30 or 40 years
9
and inequitable distribution of resources were the root causes of the ethnic tensions and violent conflicts that engulfed most of the country in January 2008.20
In Russia, India, Brazil, and most other developing and transition economies, the spatial dimension of inequalities has begun to attract considerable policy interest.21 Yet, despite new interest in policy concerns arising from spatial and regional disparities, the dynamics of urban change that lead to spatial disparities in an increasingly urbanized world are not well understood.
Cities that are located near target markets and that have well-developed infrastructure (particularly transport and communications), are physically attractive or have a unique cultural identity are well-positioned to take advantage of regional or national development priorities and globalization. The success or failure of these cities and regions often depends on past or present national policies and historical events that have impacted them in different ways, however, in the vast majority of cases, natural geographical advantages play a more crucial role.23
After the widespread application of sectoral and spatial regional strategies during the 1970 and 1980s, recent years have witnessed a progressive disenchantment with the implementation of regional planning strategies.24 Recent development has largely been based on economic growth strategies and different forms of medium- and long-term redistribution mechanisms – including targeting poor populations, enacting labour-intensive industrialization policies, enforcing employment generation policies, and the like – that do not have a clear spatial dimension.
This report advocates for decision-makers at all levels to become more cognizant of the regional and spatial dimensions of economic and social policies and institutions. Understanding the dynamics of urban growth is critical to propelling further urban development and to dealing with asymmetric growth and regional disparities. Through the analysis of these spatial disparities, the report seeks to raise several policy-relevant issues. The report also highlights the real need for regional and national governments to integrate regional considerations when formulating economic and social
NoTeS
1 The Coastal Portal, 2007 2 Balk, McGranahan, & Anderson, 2008 3 Balk, McGranahan, & Anderson, 2008 4 Balk, McGranahan, & Anderson, 2008 5 Organisation for Economic Cooperation and Development (OECD), 2007 6 Balk, McGranahan, & Anderson, in press 7 Overman & Venables, 2005 8 DFID, 2005 9 Satterthwaite, 2007 10 Economic Commission for Latin America and the Caribbean (ECLAC), 2000 11 Rodriguez & Rodrik, 2000 12 Kanbur & Venables, 2005 13 Kanbur & Venables, 2005 14 Jiménez, 2005
15 UNDP, China 2006 16 Benn, 2005 17 Yuanzhu, 2005 18 Lum, 2006 19 Wines, 2005 20 Warah, 2008 21 Kanbur & Venables, 2005 22 In order to have a larger time frame of analysis, a new study was conducted
from 1980 to 2000 for all the cities in the sample This study, which has data for four different points in time, permitted a better understanding of trends in a longer perspective
23 DFID, 2005 24 Parr, 1999 25 Martine, 2001
policies; otherwise, regional disparities and spatial inequalities may continue to grow.
Governments need to pursue national objectives while implementing a policy of interregional equity. This means that they need to provide continuous support to economically dynamic cities and regions and, at the same time, create conditions to mitigate imbalances. These efforts hinge on governments’ ability to identify patterns of spatial organization of both economic activities and population that best combine environmental benefits with economic and social benefits.25 By doing so, governments will reverse regional polarization and reduce spatial inequalities, thus creating conditions for more harmonious regional development.
s
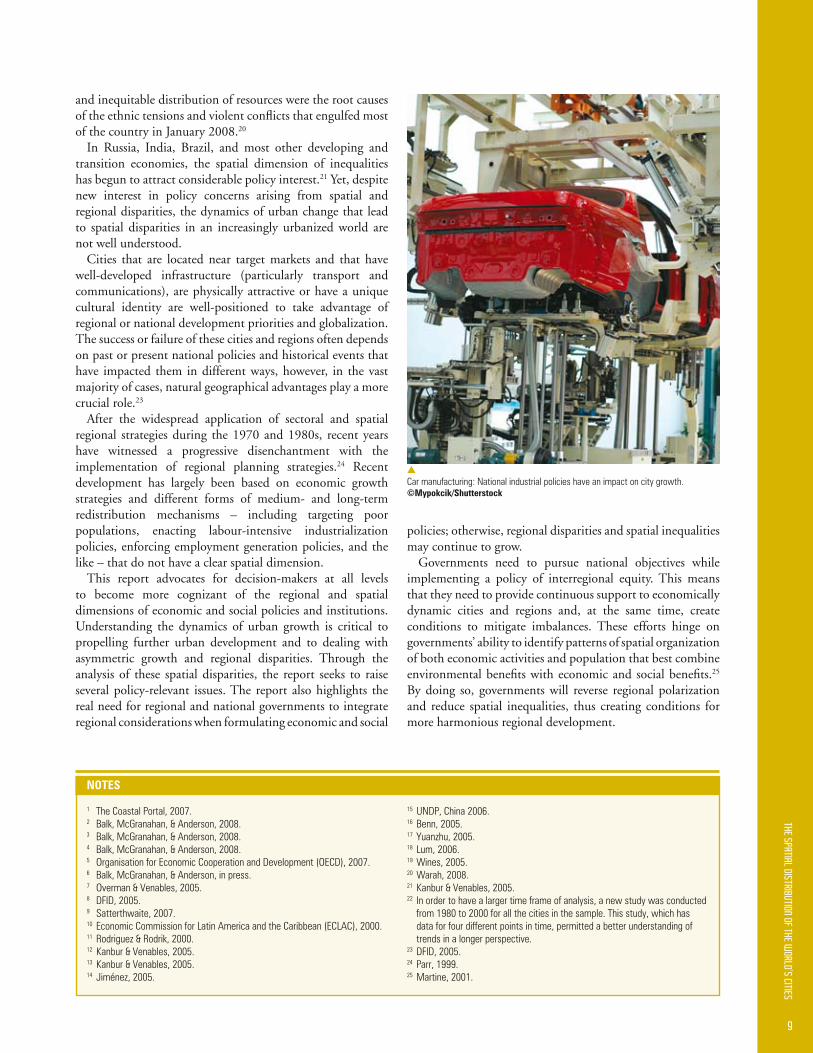
Car manufacturing: National industrial policies have an impact on city growth ©Mypokcik/Shutterstock
10
STAT
E OF
THE
WOR
LD’S
CIT
IES
2008
/9
Methodology
This part of the report aims to provide a preliminary analysis of the spatial and demographic identity of the world’s cities, going beyond the “one or two cities tell everything” approach that has tended to dominate most urban studies so far. The chapters analyze population changes in 2,695 cities with populations of more than 100,000 (1,408 cities from the developing countries and 1,287 from the developed countries) from 1990 to 2000. This sample of cities represented nearly 53 per cent of the world’s urban population in 1990. Cities, towns and “urban villages” with populations under 100,000 were not included in the analysis because no global database systematically identifies smaller cities, although a rough estimate would suggest that they comprise some 40 per cent of the world’s urban population. The data used for this analysis is based primarily on statistics from the United Nations Demographic Yearbooks for various years between 1985 and 2004 (depending on the years for which data was available in each country), published by the United Nations Statistics Division. For the purposes of this analysis, most of the data is roughly for the period between 1990 and 2000. The results of the analysis differ from the UN Population Division’s World Urbanization Prospects series in two key areas: 1) The analysis is based on “city proper” populations (the single political jurisdiction that contains the city centre) rather than on the populations of urban agglomerations (the built up or densely populated area containing the city proper, suburbs and continuously settled commuter areas) or metropolitan areas (the set of formal local government areas that normally comprise the urban area as a whole and its primary commuter areas); and 2) the cities included in the sample include those with populations under 750,000 – small cities with populations of between 100,000 and 500,000 that are not included in the World Urbanization Prospects. Although, the analysis presented here does not cover all cities of the world, as data for many cities is either unavailable or outdated, it does point to general trends. The analysis was undertaken by UN-HABITAT’s Global Urban Observatory in 2007.
1.2Urban Growth Patterns
s
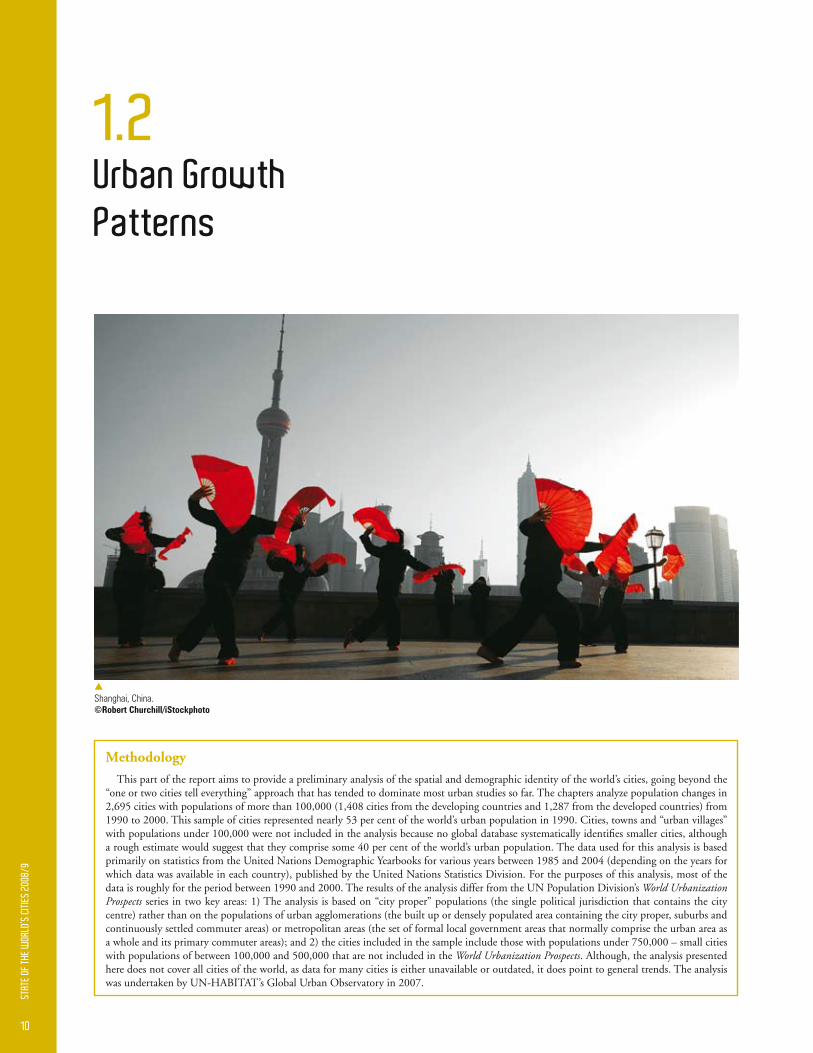
Shanghai, China ©Robert Churchill/iStockphoto
11
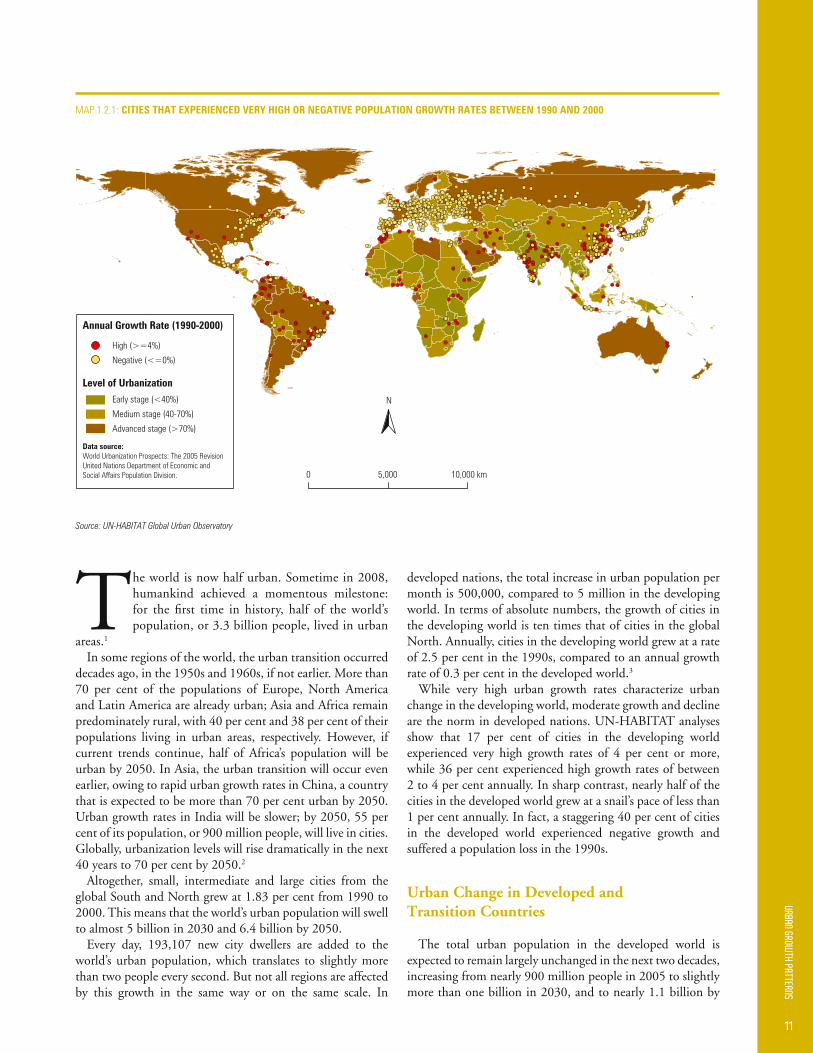
The world is now half urban. Sometime in 2008, humankind achieved a momentous milestone: for the first time in history, half of the world’s population, or 3.3 billion people, lived in urban
areas.1 In some regions of the world, the urban transition occurred
decades ago, in the 1950s and 1960s, if not earlier. More than 70 per cent of the populations of Europe, North America and Latin America are already urban; Asia and Africa remain predominately rural, with 40 per cent and 38 per cent of their populations living in urban areas, respectively. However, if current trends continue, half of Africa’s population will be urban by 2050. In Asia, the urban transition will occur even earlier, owing to rapid urban growth rates in China, a country that is expected to be more than 70 per cent urban by 2050. Urban growth rates in India will be slower; by 2050, 55 per cent of its population, or 900 million people, will live in cities. Globally, urbanization levels will rise dramatically in the next 40 years to 70 per cent by 2050.2
Altogether, small, intermediate and large cities from the global South and North grew at 1.83 per cent from 1990 to 2000. This means that the world’s urban population will swell to almost 5 billion in 2030 and 6.4 billion by 2050.
Every day, 193,107 new city dwellers are added to the world’s urban population, which translates to slightly more than two people every second. But not all regions are affected by this growth in the same way or on the same scale. In
developed nations, the total increase in urban population per month is 500,000, compared to 5 million in the developing world. In terms of absolute numbers, the growth of cities in the developing world is ten times that of cities in the global North. Annually, cities in the developing world grew at a rate of 2.5 per cent in the 1990s, compared to an annual growth rate of 0.3 per cent in the developed world.3
While very high urban growth rates characterize urban change in the developing world, moderate growth and decline are the norm in developed nations. UN-HABITAT analyses show that 17 per cent of cities in the developing world experienced very high growth rates of 4 per cent or more, while 36 per cent experienced high growth rates of between 2 to 4 per cent annually. In sharp contrast, nearly half of the cities in the developed world grew at a snail’s pace of less than 1 per cent annually. In fact, a staggering 40 per cent of cities in the developed world experienced negative growth and suffered a population loss in the 1990s.
Urban Change in Developed andTransition Countries
The total urban population in the developed world is expected to remain largely unchanged in the next two decades, increasing from nearly 900 million people in 2005 to slightly more than one billion in 2030, and to nearly 1.1 billion by
MAP 1 2 1: CITIeS ThaT eXpeRIeNCeD veRy hIgh oR NegaTIve popUlaTIoN gRowTh RaTeS BeTweeN 1990 aND 2000
N
Source: UN-HABITAT Global Urban Observatory

12
STAT
E OF
THE
WOR
LD’S
CIT
IES
2008
/9
2050 – growth resulting from in-migration of people from poorer countries, not natural population growth. On average, 2.3 million people migrate into developed countries each year.4 This means that immigration – both legal and illegal – accounts for approximately one-third of the urban growth in the developed world. Without immigration, the urban population of the developed world would likely decline or remain the same in the coming decades.
Low levels of natural population increase and declining fertility rates are prevailing trends in developed countries. Consequently populations are likely to shrink in dozens of rich nations, sometimes dramatically: projections show that Bulgaria’s population will fall by 35 per cent by 2050; Ukraine’s will plummet by 33 per cent, Russia’s will decline by 25 per cent and Poland’s will reduce by 20 per cent. There will be 10 per cent fewer Germans and 7 per cent fewer Italians. The populations of 46 countries, including Germany, Italy, Japan, most of the former Soviet states, and several small island states, are expected to be smaller in 2050 than they are now.5
These demographic trends are reflected at the city level, as well. In the last 30 years, more cities in the developed world shrank than grew. From 1990 to 2000, 4 cities out of 10 in the developed regions experienced a population loss. In contrast, only 6 out of 100 cities experienced a rapid growth rate. In Europe – where the number of people aged 60 or older surpassed the number of children under the age of 15 a decade ago – 5 out of 10 cities experienced a decrease in their populations in the same decade and only 3 per cent grew at a rapid rate.
Considering that most countries in the developed world have already attained high levels of urbanization, and given their overall low levels of population growth, they are not
expected to experience serious growth in the coming decades. It is also possible that the population decline observed in previous decades will continue.
Despite a certain level of homogeneity and predictability in the rates of urban growth in the developed world, a high degree of variation in city size and patterns of growth and decline exists among the different regions. For instance, Australia and New Zealand have no cities of more than 5 million inhabitants; in Australia, the largest cities have populations of between 1 and 5 million. By far the largest proportion of Europe’s total urban population (almost 70 per cent) lives in small cities of fewer than 500,000 inhabitants; Europe is also the only region in the world that does not have any megacities – cities with populations of more than 10 million. In the United States, on the other hand, while 80 per cent of the country’s population is classified as living in a metropolitan area, one-third of this population lives in large cities with populations of 5 million or more.6 In some cases, the greater metropolitan area of a city consists of many small cities, the combined population of which is often larger than the population of the city proper. For instance, the population of the Las Vegas metropolitan area was 1.6 million in 2000, but only 478,000 people lived within the Las Vegas city limits.
Patterns of population growth and decline of cities are largely influenced by the share of population distribution in the different sub-regions and countries. While a quarter of the cities in Australia and New Zealand grew at high growth rates of between 2 and 4 per cent in the 1990s, nearly half of the cities in Europe experienced a decline in their populations; the majority were small cities with populations of between 100,000 and 500,000. In Japan, 25 per cent of cities decreased in size, while 65 per cent grew at the slow pace of less than 1 per cent annually. In North America, the patterns of growth
Source: UN-HABITAT Global Urban Observatory 2008. Note: UN-HABITAT calculations based on UN Demographic Yearbooks (various years between 1990 and 2003.)Analysis based on a sample of 1,287 cities with populations of more than 100,000.
FIGURE 1 2 2: CITy gRowTh aND DeClINe By CITy SIZe IN The DevelopeD woRlD, 1990-2000
Small cities: cities with 100,000 to 500,000 inhabitantsIntermediate cities: cities with 500,000 to 1 million inhabitantsBig cities: cities with 1 million to 5 million inhabitantsLarge cities: cities with 5 million or more inhabitants

13
and decline are not so homogenous. While one-fifth of cities experienced a decline in population, a similar proportion grew at a high rate from 1990 to 2000; the fastest-growing cities were either small or intermediate cities.
European cities, in general, are not growing any more, including cities in the nations of the Commonwealth of Independent States.7 The population of urban centres with more than 100,000 inhabitants, taken together, remained stable during the years 1991 to 2001. Among the large cities with populations of more than 5 million, the proportion of inhabitants increased by 1.4 per cent, mainly because of the growth experienced by Moscow, the capital of the Russian Federation, which grew at the rate of 2.1 per cent annually. However, at present, the continent has none of the world’s 100 fastest growing large cities with populations of more than 1 million inhabitants.
Large cities in Europe are not growing rapidly, owing in part to relatively low rates of natural population increase in countries, as well as more decentralized patterns of urban development.8 Larger cities and metropolitan conurbations in the United Kingdom, with the exception of London, are almost all declining in size.9 In Germany, Italy and Poland, more than half of the cities are decreasing in size. Among the big European urban centers with populations of between 1 and 5 million, all experienced negative growth rates, with the exception of Baku – the largest port city and capital of Azerbaijan – which grew at the rate of approximately 3.5 per cent annually in the 1990s.
Increasing suburbanization may account for population decrease in some cities. The regions surrounding Stockholm, Helsinki, Sofia, Madrid, and inner London all saw their share of the national population increase by more than 5 per cent between 1995 and 2004, while populations within the city limits decreased. The populations of Dublin, Berlin and Budapest also declined, but the populations of cities and regions surrounding them increased during the same period. Population movements between European cities can also be attributed to the relaxing of immigration restrictions in the European Union, which saw populations move from economically less attractive countries to more attractive ones.10
Despite the fact that on average, the population of small European cities did not grow between 1990 and 2000, an analysis of individual cities shows that four small urban centers – York, United Kingdom; Ulyanovsk, Russia; Almere, the Netherlands; and Andizhan, Uzbekistan – experienced an annual growth rate of more than 5 per cent. Of the four, the city of York experienced the fastest annual growth rate in Europe (9 per cent) due largely to its successful economic transformation from a manufacturing centre into an information technology and biosciences hub. Ulyanovsk, a small but important industrial city in Russia, and Almere in the Netherlands both grew at the rate of 5.4 per cent a year. Andizhan, an administrative centre in Uzbekistan that is one of the main producers of cotton fibre and an agriculture and industrial development pole in the Eastern part of the
s
A suburb in Madrid, Spain: Increasing suburbanization has led to population decrease in several European cities ©iStockphoto
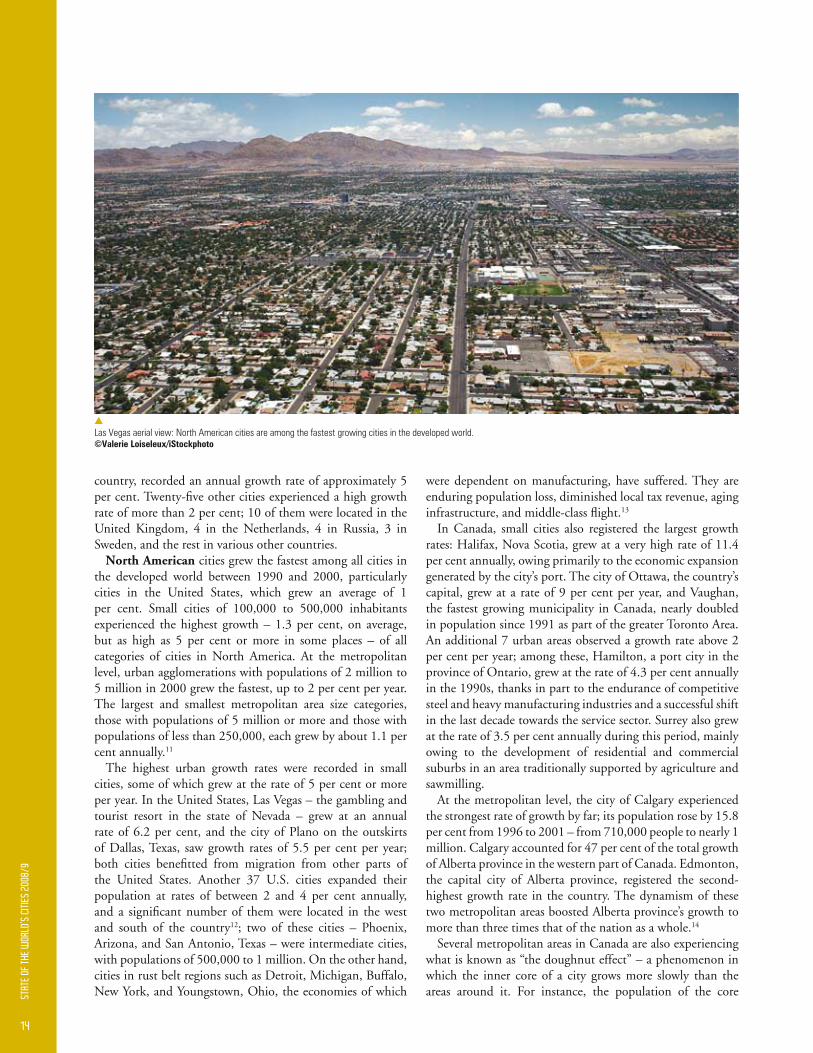
14
STAT
E OF
THE
WOR
LD’S
CIT
IES
2008
/9
country, recorded an annual growth rate of approximately 5 per cent. Twenty-five other cities experienced a high growth rate of more than 2 per cent; 10 of them were located in the United Kingdom, 4 in the Netherlands, 4 in Russia, 3 in Sweden, and the rest in various other countries.
North American cities grew the fastest among all cities in the developed world between 1990 and 2000, particularly cities in the United States, which grew an average of 1 per cent. Small cities of 100,000 to 500,000 inhabitants experienced the highest growth – 1.3 per cent, on average, but as high as 5 per cent or more in some places – of all categories of cities in North America. At the metropolitan level, urban agglomerations with populations of 2 million to 5 million in 2000 grew the fastest, up to 2 per cent per year. The largest and smallest metropolitan area size categories, those with populations of 5 million or more and those with populations of less than 250,000, each grew by about 1.1 per cent annually.11
The highest urban growth rates were recorded in small cities, some of which grew at the rate of 5 per cent or more per year. In the United States, Las Vegas – the gambling and tourist resort in the state of Nevada – grew at an annual rate of 6.2 per cent, and the city of Plano on the outskirts of Dallas, Texas, saw growth rates of 5.5 per cent per year; both cities benefitted from migration from other parts of the United States. Another 37 U.S. cities expanded their population at rates of between 2 and 4 per cent annually, and a significant number of them were located in the west and south of the country12; two of these cities – Phoenix, Arizona, and San Antonio, Texas – were intermediate cities, with populations of 500,000 to 1 million. On the other hand, cities in rust belt regions such as Detroit, Michigan, Buffalo, New York, and Youngstown, Ohio, the economies of which
were dependent on manufacturing, have suffered. They are enduring population loss, diminished local tax revenue, aging infrastructure, and middle-class flight.13
In Canada, small cities also registered the largest growth rates: Halifax, Nova Scotia, grew at a very high rate of 11.4 per cent annually, owing primarily to the economic expansion generated by the city’s port. The city of Ottawa, the country’s capital, grew at a rate of 9 per cent per year, and Vaughan, the fastest growing municipality in Canada, nearly doubled in population since 1991 as part of the greater Toronto Area. An additional 7 urban areas observed a growth rate above 2 per cent per year; among these, Hamilton, a port city in the province of Ontario, grew at the rate of 4.3 per cent annually in the 1990s, thanks in part to the endurance of competitive steel and heavy manufacturing industries and a successful shift in the last decade towards the service sector. Surrey also grew at the rate of 3.5 per cent annually during this period, mainly owing to the development of residential and commercial suburbs in an area traditionally supported by agriculture and sawmilling.
At the metropolitan level, the city of Calgary experienced the strongest rate of growth by far; its population rose by 15.8 per cent from 1996 to 2001 – from 710,000 people to nearly 1 million. Calgary accounted for 47 per cent of the total growth of Alberta province in the western part of Canada. Edmonton, the capital city of Alberta province, registered the second-highest growth rate in the country. The dynamism of these two metropolitan areas boosted Alberta province’s growth to more than three times that of the nation as a whole.14
Several metropolitan areas in Canada are also experiencing what is known as “the doughnut effect” – a phenomenon in which the inner core of a city grows more slowly than the areas around it. For instance, the population of the core
s
Las Vegas aerial view: North American cities are among the fastest growing cities in the developed world ©valerie loiseleux/iStockphoto
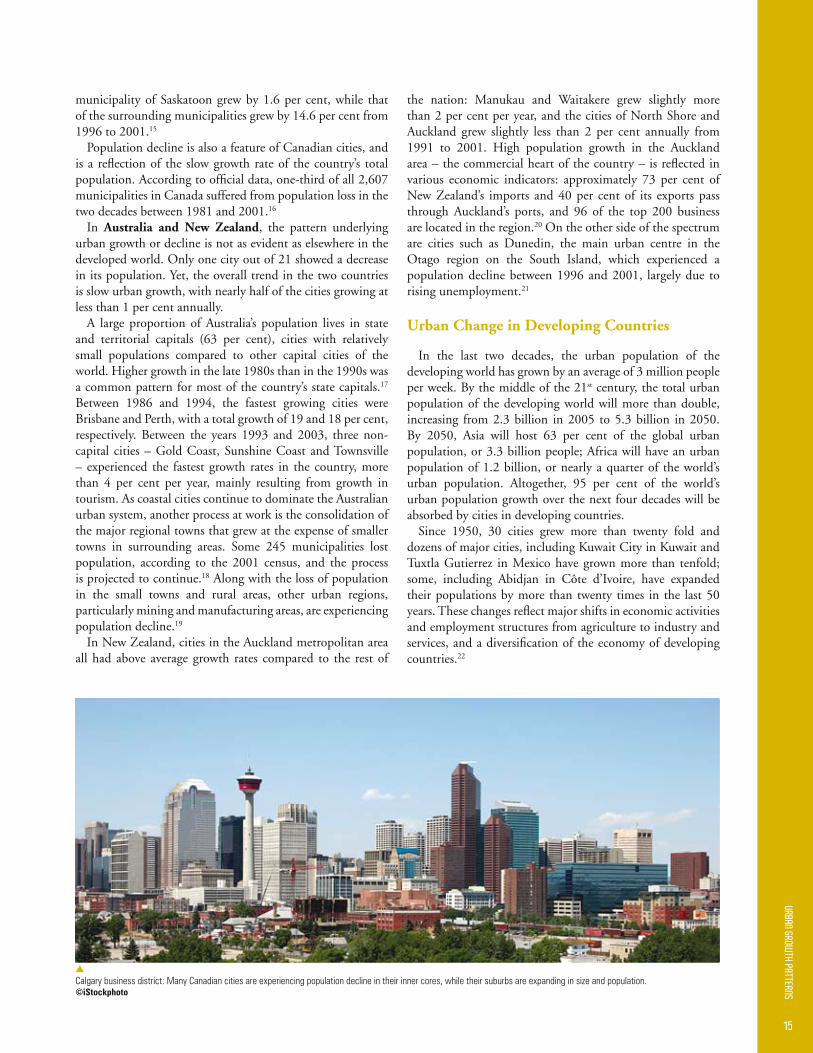
15
municipality of Saskatoon grew by 1.6 per cent, while that of the surrounding municipalities grew by 14.6 per cent from 1996 to 2001.15
Population decline is also a feature of Canadian cities, and is a reflection of the slow growth rate of the country’s total population. According to official data, one-third of all 2,607 municipalities in Canada suffered from population loss in the two decades between 1981 and 2001.16
In Australia and New Zealand, the pattern underlying urban growth or decline is not as evident as elsewhere in the developed world. Only one city out of 21 showed a decrease in its population. Yet, the overall trend in the two countries is slow urban growth, with nearly half of the cities growing at less than 1 per cent annually.
A large proportion of Australia’s population lives in state and territorial capitals (63 per cent), cities with relatively small populations compared to other capital cities of the world. Higher growth in the late 1980s than in the 1990s was a common pattern for most of the country’s state capitals.17 Between 1986 and 1994, the fastest growing cities were Brisbane and Perth, with a total growth of 19 and 18 per cent, respectively. Between the years 1993 and 2003, three non-capital cities – Gold Coast, Sunshine Coast and Townsville – experienced the fastest growth rates in the country, more than 4 per cent per year, mainly resulting from growth in tourism. As coastal cities continue to dominate the Australian urban system, another process at work is the consolidation of the major regional towns that grew at the expense of smaller towns in surrounding areas. Some 245 municipalities lost population, according to the 2001 census, and the process is projected to continue.18 Along with the loss of population in the small towns and rural areas, other urban regions, particularly mining and manufacturing areas, are experiencing population decline.19
In New Zealand, cities in the Auckland metropolitan area all had above average growth rates compared to the rest of
the nation: Manukau and Waitakere grew slightly more than 2 per cent per year, and the cities of North Shore and Auckland grew slightly less than 2 per cent annually from 1991 to 2001. High population growth in the Auckland area – the commercial heart of the country – is reflected in various economic indicators: approximately 73 per cent of New Zealand’s imports and 40 per cent of its exports pass through Auckland’s ports, and 96 of the top 200 business are located in the region.20 On the other side of the spectrum are cities such as Dunedin, the main urban centre in the Otago region on the South Island, which experienced a population decline between 1996 and 2001, largely due to rising unemployment.21
Urban Change in Developing Countries
In the last two decades, the urban population of the developing world has grown by an average of 3 million people per week. By the middle of the 21st century, the total urban population of the developing world will more than double, increasing from 2.3 billion in 2005 to 5.3 billion in 2050. By 2050, Asia will host 63 per cent of the global urban population, or 3.3 billion people; Africa will have an urban population of 1.2 billion, or nearly a quarter of the world’s urban population. Altogether, 95 per cent of the world’s urban population growth over the next four decades will be absorbed by cities in developing countries.
Since 1950, 30 cities grew more than twenty fold and dozens of major cities, including Kuwait City in Kuwait and Tuxtla Gutierrez in Mexico have grown more than tenfold; some, including Abidjan in Côte d’Ivoire, have expanded their populations by more than twenty times in the last 50 years. These changes reflect major shifts in economic activities and employment structures from agriculture to industry and services, and a diversification of the economy of developing countries.22
s
Calgary business district: Many Canadian cities are experiencing population decline in their inner cores, while their suburbs are expanding in size and population ©iStockphoto

16
STAT
E OF
THE
WOR
LD’S
CIT
IES
2008
/9
Although city growth is slowing down in most of the developing world, levels of urbanization within countries are expected to rise, with the least urbanized countries in Africa and Asia achieving an urban transition before 2050. On average, cities of the developing world grew at an estimated annual rate of 2.5 per cent from 1990 to 2000. At this rate, the developing world’s urban population will double in 29 years. Some cities are growing faster than others: the populations of 218 cities, including Shanghai, Beijing, Riyadh, Addis Ababa, Nairobi, Lagos, and Khartoum, grew at a very high rate of 4 per cent or more in the 1990s. The exceptionally high population growth rates of some cities in the developing world imply that a city such as Dhaka, the capital of Bangladesh, will take just 12 years to absorb an additional 8 million inhabitants, a feat that took New York City – the world’s largest metropolis in 1950 – nearly 150 years.23
Large cities in the developing world, with populations of more than 5 million people, on the other hand, did not experience such high growth rates in the 1990s; the average annual growth rate of large cities was 1.8 per cent, with the exception of those in China, which grew at the phenomenally high rate of approximately 4 per cent per year. (Figure 1.2.2) Much of the growth observed in Chinese cities such as Beijing and Shanghai between 1982 and 1998 can be attributed to the expansion of city borders to include populations that lived on the periphery.24 Chinese cities grew rapidly in the 1990s, and by 2005, 40 per cent of the country’s population was classified as urban.
Over the next 10 years, the urban population in many developing countries is expected to grow at an average annual rate of slightly more than 2 per cent, down from 3.8 per cent during the 1980s and 4 per cent during the 1950s and early 1960s.25 This suggests an inverse relationship between levels of urbanization and urban growth rates.
Urban growth rates vary not only within regions and countries, but also among cities. Only a fraction of 1,408 cities sampled (2 per cent) grew at more than 10 per cent annually from 1990 to 2000. More than one half of the cities grew at very high growth rate of more than 4 per cent a year or high growth rate of between 2 and 4 per cent a year. One third of the cities grew at the moderate rate of 1 to 2 per cent or slow rate of 0 to 1 per cent. Ten per cent of the cities experienced negative growth rates or declining populations.
It may seem paradoxical that regions experiencing high urban growth also have cities with declining populations, but the growth of some cities and contraction of others signals the start of a new urban cycle in the developing world that may lead to closer alignment with trends in developed regions. Out of a sample of 1,408 cities in the developing world, 143 experienced the collective loss of 13 million people from 1990 to 2000. As in Europe and the rest of the developed world, the developing world may experience urban saturation levels, which could lead to slower growth rates.26 It is still too early, however, to know whether urban contraction will continue and become more pronounced, as the number of cities growing rapidly or moderately far outweighs the number of cities experiencing population decrease; the latter represent just 5 per cent of the total urban population of the developing world.
The most interesting aspect of urban growth in the developing world is not one that has much to do with city size or growth rates, as is commonly believed – though both happen on a greater order of magnitude in the developing world than in the developed world. The real story is the absolute size of the increments of growth, especially in Asia and Africa, and the role that different cities play in this growth.27 The timing and scope of these changes vary considerably among less-developed regions.
Source: UN-HABITAT Global Urban Observatory, 2008. Note: UN-HABITAT calculations based on UN Statistics Division, Demographic Year books (1985 - 2004), various years, and UN Population Division, World Urbanization Prospects, 2005 revision.Analysis based on a sample of 2,695 cities with populations of more than 100,000.
FIGURE 1 2 3: aNNUal gRowTh RaTe oF The woRlD’S CITIeS By RegIoN aND CITy SIZe, 1990-2000
Small cities: cities with 100,000 to 500,000 inhabitantsIntermediate cities: cities with 500,000 to 1 million inhabitantsBig cities: cities with 1 million to 5 million inhabitantsLarge cities: cities with 5 million or more inhabitants
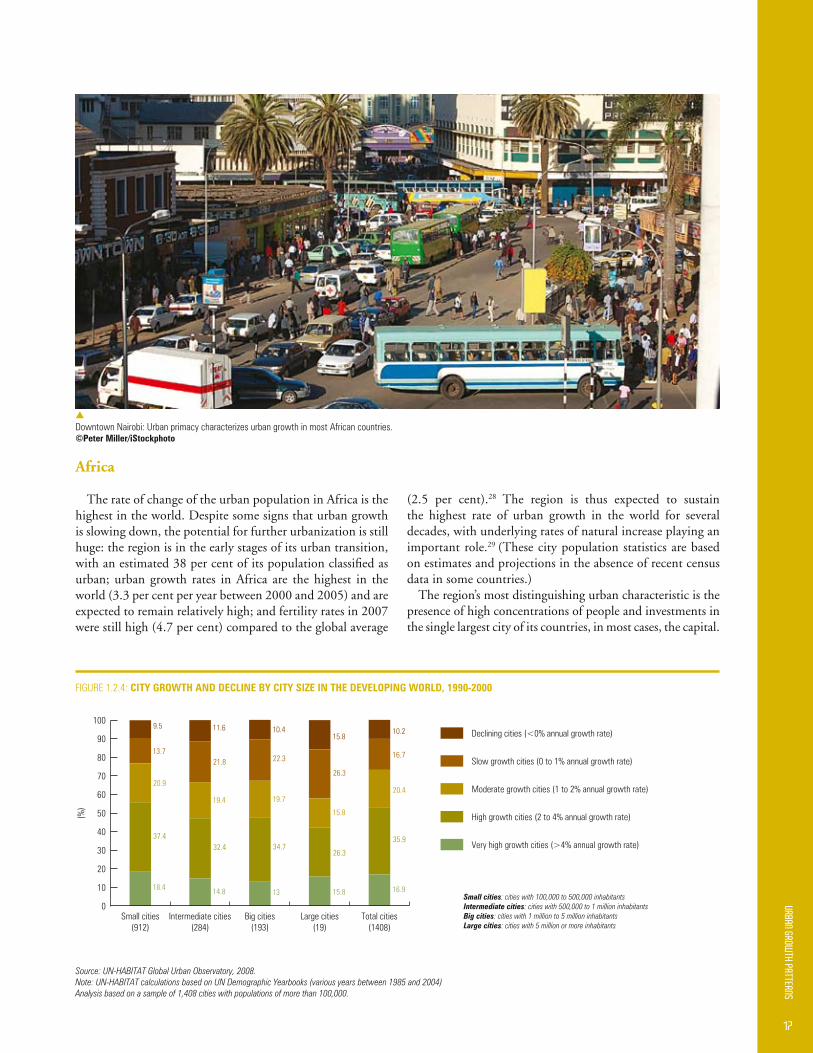
17
Source: UN-HABITAT Global Urban Observatory, 2008. Note: UN-HABITAT calculations based on UN Demographic Yearbooks (various years between 1985 and 2004)Analysis based on a sample of 1,408 cities with populations of more than 100,000.
Africa
The rate of change of the urban population in Africa is the highest in the world. Despite some signs that urban growth is slowing down, the potential for further urbanization is still huge: the region is in the early stages of its urban transition, with an estimated 38 per cent of its population classified as urban; urban growth rates in Africa are the highest in the world (3.3 per cent per year between 2000 and 2005) and are expected to remain relatively high; and fertility rates in 2007 were still high (4.7 per cent) compared to the global average
(2.5 per cent).28 The region is thus expected to sustain the highest rate of urban growth in the world for several decades, with underlying rates of natural increase playing an important role.29 (These city population statistics are based on estimates and projections in the absence of recent census data in some countries.)
The region’s most distinguishing urban characteristic is the presence of high concentrations of people and investments in the single largest city of its countries, in most cases, the capital.
FIGURE 1 2 4: CITy gRowTh aND DeClINe By CITy SIZe IN The DevelopINg woRlD, 1990-2000
s
Downtown Nairobi: Urban primacy characterizes urban growth in most African countries ©peter Miller/iStockphoto
Small cities: cities with 100,000 to 500,000 inhabitantsIntermediate cities: cities with 500,000 to 1 million inhabitantsBig cities: cities with 1 million to 5 million inhabitantsLarge cities: cities with 5 million or more inhabitants

18
STAT
E OF
THE
WOR
LD’S
CIT
IES
2008
/9
This phenomenon, known as “urban primacy”, characterizes urbanization in Africa today, as it did in Latin America and the Caribbean in past decades. By 1990, approximately half of the 54 countries in Africa concentrated more than 10 per cent of their urban populations in one single primate city.30 More than half of Africa’s urban population lives in big cities with populations of between 1 and 5 million, compared to 26 per cent in Latin America and the Caribbean and 38 per cent in Asia. Between 1990 and 2000, big cities in Africa, including Nairobi, Addis Ababa and Dakar, experienced the fastest annual growth rates among all cities of this size in the developing world, averaging 3.3 per cent, versus an average of 2.5 per cent for the developing world as a whole.31 Today, the region has 17 of the word’s 100 fastest growing cities with populations of more than 1 million.32 Concomitantly, Africa has a preponderance of smaller cities of fewer than 100,000 inhabitants, meaning that for every big city there exists a multitude of small towns.
In the 1990s, small African cities (with populations of between 100,000 and 500,000) recorded the fastest growth rates (4.16 per cent per year) of all cities in the developing world, followed by Asian small cities (3 per cent).33
Urban growth in Africa is a consequence of many factors, including positive factors such as economic growth and negative events such as conflict and disaster. Forced movements of people provoked by drought, famine, ethnic conflicts, civil strife, and war have driven much of the urban growth in the region. Luanda and other important provincial centres of Angola experienced an influx of more than 2 million people in only two years (1992-1994) as a consequence of the armed conflict in that country.34 Civil conflict also drove the population of Khartoum, Sudan, up from 2.3 million in 1990 to 3.9 million in 2000, and Monrovia, the capital of Liberia, grew from 535,000 inhabitants to 776,000 inhabitants in the same period. The population of the capital of the Democratic Republic of the Congo, Kinshasa, also grew from 3.6 million
to 5 million from 1990 to 2000 for similar reasons. Other war-torn countries, such as Somalia, have also witnessed an increase in their urban populations for similar reasons.
The HIV/AIDS epidemic has also impacted urban growth in various countries. In southern Africa, the sub-region with the highest prevalence of the disease, life expectancy has fallen from an estimated 62 years in 1990 to 49 years in 2005. As a consequence, the growth rate of the population in southern Africa has fallen, from 2.5 per cent annually in the period between 1990 and 2005 to 0.6 per cent annually from 2005 to 2010; it is expected to continue declining in the foreseeable future.35 In Zambia, for instance, the population of the capital Lusaka has increased by only 0.7 per cent annually from 1990 to 2000, a trend that is prevalent throughout the country’s urban centres; the populations of the Zambian cities of Luanshya, Ndola and Mufulira have actually experienced a decline in population in recent years. How much of this decline is directly attributable to the HIV/AIDS pandemic is not clear, but the high prevalence of the disease in the country’s urban areas is significant enough to have made an impact on population growth rates. In fact, in Zambia, HIV prevalence among urban populations is twice that of rural populations – a trend that is common in many sub-Saharan African countries, including Tanzania and Burundi.36
Africa has been said to have urbanized in the absence of a stable economic basis to sustain its growth. Economic development has recently, however, shown encouraging progress around the continent, particularly in sub-Saharan Africa. Growth has been more resilient in sub-Saharan Africa than in most other parts of the world during the recent global economic downturns, with real gross domestic product (GDP) increasing by more than 3 per cent per year between 2001 and 2003.37 Recent World Bank reports indicate that 16 countries in the region experienced economic growth rates of 4.5 per cent per year in the last decade and that economic growth in the region as a whole averaged 5.3 per cent in 2006.38 Yet,
FIGURE 1 2 5: DISTRIBUTIoN oF URBaN popUlaTIoN IN The DevelopINg woRlD By CITy SIZe, 2000
Source: UN-HABITAT Global Urban Observatory, 2008. Note: UN-HABITAT Global Urban Observatory, 2008. Data from UN-Statistics Division, Demographic Yearbook (various years), UN Population Division, World Urbanization Prospects 2005.Analysis based on a sample of 1,408 cities. Data for Asia includes China and India.Data only includes cities with populations of 100,000 + inhabitants.
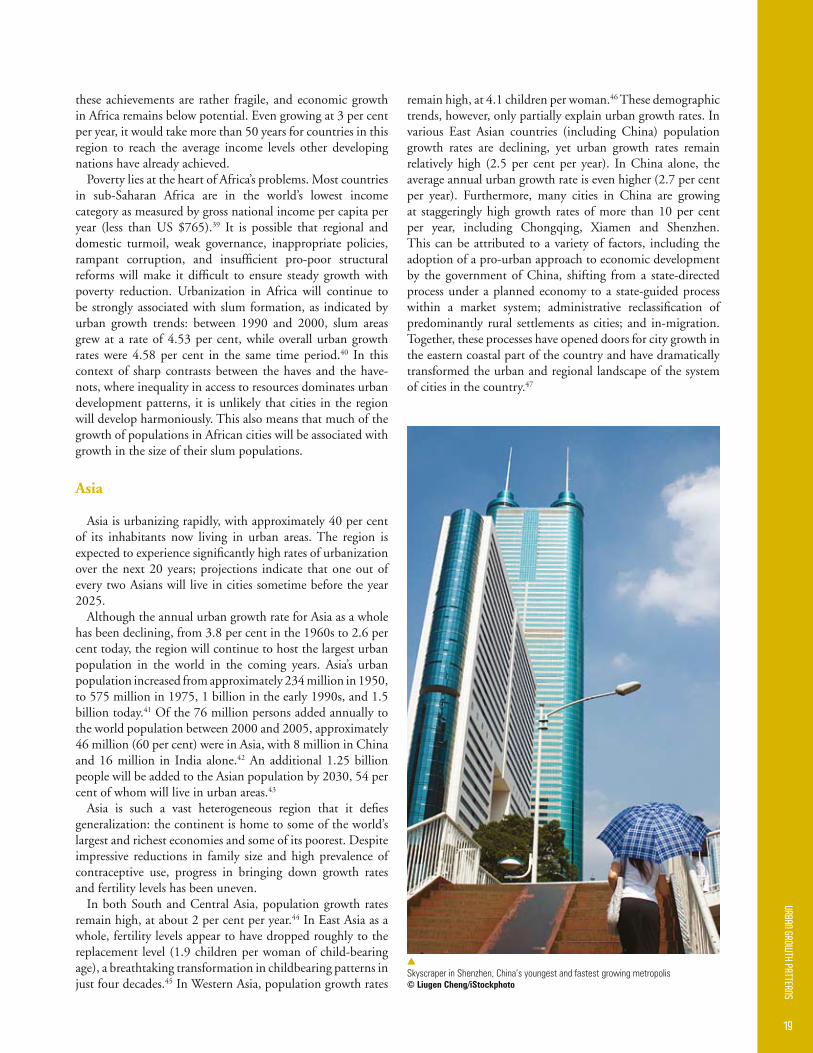
19
these achievements are rather fragile, and economic growth in Africa remains below potential. Even growing at 3 per cent per year, it would take more than 50 years for countries in this region to reach the average income levels other developing nations have already achieved.
Poverty lies at the heart of Africa’s problems. Most countries in sub-Saharan Africa are in the world’s lowest income category as measured by gross national income per capita per year (less than US $765).39 It is possible that regional and domestic turmoil, weak governance, inappropriate policies, rampant corruption, and insufficient pro-poor structural reforms will make it difficult to ensure steady growth with poverty reduction. Urbanization in Africa will continue to be strongly associated with slum formation, as indicated by urban growth trends: between 1990 and 2000, slum areas grew at a rate of 4.53 per cent, while overall urban growth rates were 4.58 per cent in the same time period.40 In this context of sharp contrasts between the haves and the have-nots, where inequality in access to resources dominates urban development patterns, it is unlikely that cities in the region will develop harmoniously. This also means that much of the growth of populations in African cities will be associated with growth in the size of their slum populations.
Asia
Asia is urbanizing rapidly, with approximately 40 per cent of its inhabitants now living in urban areas. The region is expected to experience significantly high rates of urbanization over the next 20 years; projections indicate that one out of every two Asians will live in cities sometime before the year 2025.
Although the annual urban growth rate for Asia as a whole has been declining, from 3.8 per cent in the 1960s to 2.6 per cent today, the region will continue to host the largest urban population in the world in the coming years. Asia’s urban population increased from approximately 234 million in 1950, to 575 million in 1975, 1 billion in the early 1990s, and 1.5 billion today.41 Of the 76 million persons added annually to the world population between 2000 and 2005, approximately 46 million (60 per cent) were in Asia, with 8 million in China and 16 million in India alone.42 An additional 1.25 billion people will be added to the Asian population by 2030, 54 per cent of whom will live in urban areas.43
Asia is such a vast heterogeneous region that it defies generalization: the continent is home to some of the world’s largest and richest economies and some of its poorest. Despite impressive reductions in family size and high prevalence of contraceptive use, progress in bringing down growth rates and fertility levels has been uneven.
In both South and Central Asia, population growth rates remain high, at about 2 per cent per year.44 In East Asia as a whole, fertility levels appear to have dropped roughly to the replacement level (1.9 children per woman of child-bearing age), a breathtaking transformation in childbearing patterns in just four decades.45 In Western Asia, population growth rates
s
Skyscraper in Shenzhen, China’s youngest and fastest growing metropolis© liugen Cheng/iStockphoto
remain high, at 4.1 children per woman.46 These demographic trends, however, only partially explain urban growth rates. In various East Asian countries (including China) population growth rates are declining, yet urban growth rates remain relatively high (2.5 per cent per year). In China alone, the average annual urban growth rate is even higher (2.7 per cent per year). Furthermore, many cities in China are growing at staggeringly high growth rates of more than 10 per cent per year, including Chongqing, Xiamen and Shenzhen. This can be attributed to a variety of factors, including the adoption of a pro-urban approach to economic development by the government of China, shifting from a state-directed process under a planned economy to a state-guided process within a market system; administrative reclassification of predominantly rural settlements as cities; and in-migration. Together, these processes have opened doors for city growth in the eastern coastal part of the country and have dramatically transformed the urban and regional landscape of the system of cities in the country.47

20
STAT
E OF
THE
WOR
LD’S
CIT
IES
2008
/9
Patna, Pune, and Surat have maintained their fast pace of urban growth.
The slowing down of growth in large cities in India could be explained by the “doughnut effect”, whereby the inner city grows at a slower pace than the surrounding metropolitan areas. For example, the growth rate of the city of Mumbai was 1.5 per cent annually from 1991 to 2001, but the brand new satellite city of Navi Mumbai grew at the rate of 6.9 per cent annually. A survey released in the year 2000 revealed that 43 per cent of the families currently settled in Navi Mumbai migrated from Mumbai and that the percentage of migrants has most likely gone up since then because of improved mass transport links with the main city, as well as improvements in infrastructure.49 Similarly, while India’s capital city, New Delhi (not including the whole metropolitan area), experienced negative population growth (-0.2 per cent annually) between 1991 and 2001, the neighbouring city of Noida grew at the rate of 5.8 per cent per year. Other ring towns forming part of the Delhi metropolitan region, such as Ghaziabad, Loni, Gurgaon, Bahadurgarh, and Faridabad, have also been experiencing high growth rates in the past two decades. This
Metropolitan growth: a prominent feature of Asian cities
The majority of the largest cities in the developing world are located in Asia. In 2000, the region contained 227 cities with 1 million or more residents and 21 cities with 5 million or more inhabitants. Of every 10 big or large cities from the global South, more than 7 are located in Asia. Moreover, of the 100 fastest growing cities with populations of more than 1 million inhabitants in the world, 66 are in Asia. Among these fastest growing cities, 33 are Chinese. In fact, China hosts half of the urban population of the developing world that lives in big cities. The potential of urban growth of large Chinese cities is tremendous: on average, they grew at the rate of 3.9 per cent each year from 1990 to 2000 – more than two times faster than the world’s average.
In sharp contrast, India’s large cities are a surprising minority, representing only 10 per cent of all Asian cities of this size. Big Indian cities (those with populations of between 1 and 5 million) are growing fast (at the rate of 2.5 per cent annually), however, since the 1980s, their pace of growth has slowed slightly.48 In fact, the six largest metropolitan areas in the country have shown a decline in their growth rates, while secondary metropolitan areas such as Indore, Kanpur, Jaipur,
s
A housing complex in Delhi, India ©Maciej Dakowicz

21
indicates a growing trend among Indian metropolitan areas in which populations are moving to suburban locations or satellite towns as commuter networks improve. The development of second-tier metropolitan cities is a response to the improved economies of Indian cities and increasing congestion in the primary metropolitan areas.50
Countering metropolitan growth by unleashing the potential of intermediate cities
A distinct characteristic of urbanization in Asia is that with varying degrees of success or failure – and quite often total failure or limited impact – intermediate cities (with populations of between 500,000 and 1 million) have been used as mechanisms of population redistribution and regional development to slow down metropolitan growth. Government officials often assumed that development of intermediate cities would stimulate rural economies by providing linkages between rural and urban areas and that they would increase rural employment and incomes as a way to provide economic opportunities to neglected or impoverished areas. The planning of intermediate cities has often served to promote spatial integration via a more dispersed population.
Although a relatively small share (18 per cent) of its population lives in intermediate-sized cities, India’s urbanization is being fueled by the growth of cities in the intermediate range. This is a distinctive pattern of urban growth in the country. A large share of India’s population lives in small cities – 39 per cent, compared to 12 per cent in China and 18 per cent in the rest of Asia. The country’s small cities may be experiencing a level of saturation, as their growth has begun to slow significantly. From 1991 to 2001, 41 per cent of India’s small cities experienced a moderate or slow growth rate, and 7 per cent experienced a decline in population. This pattern of slow or no growth in the 1990s may indicate that Indians from large and small cities are migrating to intermediate cities for better opportunities. These findings run counter the conventional assumption that all Indian cities are growing rapidly, a pattern that is noticeable in intermediate and big cities.
In countries in which urban primacy is the rule, such as the Philippines, Thailand, the Republic of Korea, and Indonesia, the role of intermediate cities has been to gradually redirect the flow of migrants away from the primate city. In the more industrialized nations, such as the Republic of Korea, medium-sized cities are viewed as instruments for bringing about a more balanced distribution of population and the amelioration of income inequalities within and between sub-national regions. In the less industrialized nations, such as Indonesia and the Philippines, intermediate cities have been perceived as a bridge, promoting the growth of rural industries based on the processing of farm products for export.51
In sharp contrast, population growth in China is now taking place in the two extreme poles: small and large cities, which are experiencing the fastest annual growth rates in the country (3.47 per cent and 3.89 per cent, respectively). The country’s efforts to sustain the population growth of medium-sized cities and to settle “floating populations” through the
reform of the household registration (Hukou) system have not yielded the expected results.52
Asia’s economic growth in the last two decades has been phenomenal. The region now constitutes one-third of the world’s economy. Its economic dynamism has contributed to the reduction of income poverty53 and also to the expansion of cities and towns. Of the 140 new big and large cities that emerged in the world after 1990, 111 were located in Asia. This trend is not consistent across the continent. On the one hand, the emerging economies of India and China are likely to represent 50 per cent of global GDP in the next decade. On the other hand, the region is also home to the majority of the world’s most impoverished people.54 In Southern Asia and Western Asia, urban growth over the last 15 years has been accompanied by a commensurate growth in slums. In both sub-regions, annual slum and urban growth rates are quite similar (2.2 and 2.9 per cent in Southern Asia, and 2.7 and 2.96 per cent in Western Asia from 1990 to 2000).55 Disparities in Asia are not only between sub-regions and countries, but also among and within human settlements of growing economies. Some urban areas are expanding and have become economic powerhouses; other areas, often less dynamic cities or remote rural areas, are lagging behind.56 Even China – the GDP of which is growing at the dazzling rate of 9.5 per cent annually, and which accounts for 75 per cent of global poverty reduction – recognizes that “GDP growth does not necessarily indicate corresponding social development… and economic growth is achieved at the expense of social harmony”.57 While the balance between urban growth and social and economic development in various Asian countries seems elusive to achieve in the short- or mid-term, it is conceivable that policy change can usher in such harmony in the foreseeable future. Achieving harmonious cities depends largely on how well and how fast countries are able to achieve this balance.
Latin America and the Caribbean
Latin America and the Caribbean is the most urbanized region in the developing world, with 77 per cent of its population living in urban areas. The region will continue urbanizing over the next two decades, when the proportion of the urban population will reach 85 per cent. Urban growth in this region started in the early 1940s and reached its peak during the 1960s, at 4.6 per cent per year. Urban growth began to slow down in the 1980s, declining to 3.0 per cent per year, and reduced even further, to 1.7 per cent per year in 2005. Urban growth in the region took place despite economic instability, social and institutional crises and clear anti-urban policies.58
The slowing of urban growth in Latin America and the Caribbean is concomitant with declining population growth rates, which have fallen consistently over the last three decades. Although countries in the region span all stages of the demographic transition,59 most of the region’s population is contracting; the mean number of children born to women has fallen from 6 to 3,60 average life expectancy is comparable
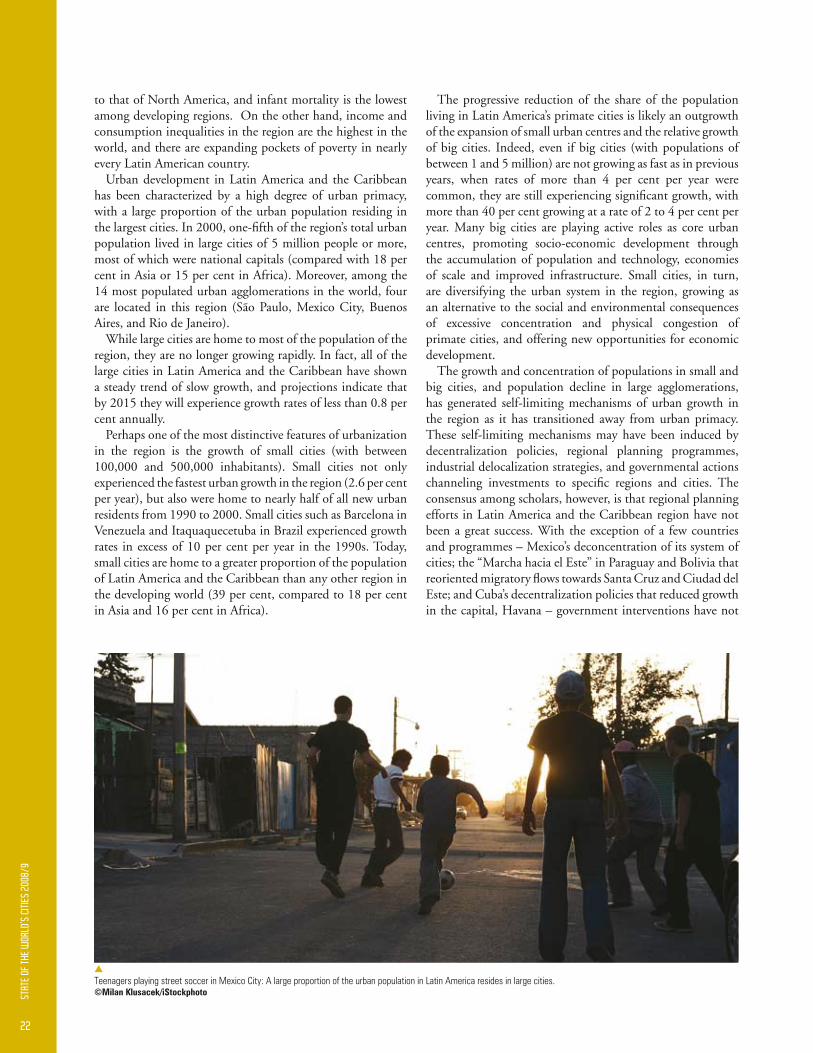
22
STAT
E OF
THE
WOR
LD’S
CIT
IES
2008
/9
to that of North America, and infant mortality is the lowest among developing regions. On the other hand, income and consumption inequalities in the region are the highest in the world, and there are expanding pockets of poverty in nearly every Latin American country.
Urban development in Latin America and the Caribbean has been characterized by a high degree of urban primacy, with a large proportion of the urban population residing in the largest cities. In 2000, one-fifth of the region’s total urban population lived in large cities of 5 million people or more, most of which were national capitals (compared with 18 per cent in Asia or 15 per cent in Africa). Moreover, among the 14 most populated urban agglomerations in the world, four are located in this region (São Paulo, Mexico City, Buenos Aires, and Rio de Janeiro).
While large cities are home to most of the population of the region, they are no longer growing rapidly. In fact, all of the large cities in Latin America and the Caribbean have shown a steady trend of slow growth, and projections indicate that by 2015 they will experience growth rates of less than 0.8 per cent annually.
Perhaps one of the most distinctive features of urbanization in the region is the growth of small cities (with between 100,000 and 500,000 inhabitants). Small cities not only experienced the fastest urban growth in the region (2.6 per cent per year), but also were home to nearly half of all new urban residents from 1990 to 2000. Small cities such as Barcelona in Venezuela and Itaquaquecetuba in Brazil experienced growth rates in excess of 10 per cent per year in the 1990s. Today, small cities are home to a greater proportion of the population of Latin America and the Caribbean than any other region in the developing world (39 per cent, compared to 18 per cent in Asia and 16 per cent in Africa).
The progressive reduction of the share of the population living in Latin America’s primate cities is likely an outgrowth of the expansion of small urban centres and the relative growth of big cities. Indeed, even if big cities (with populations of between 1 and 5 million) are not growing as fast as in previous years, when rates of more than 4 per cent per year were common, they are still experiencing significant growth, with more than 40 per cent growing at a rate of 2 to 4 per cent per year. Many big cities are playing active roles as core urban centres, promoting socio-economic development through the accumulation of population and technology, economies of scale and improved infrastructure. Small cities, in turn, are diversifying the urban system in the region, growing as an alternative to the social and environmental consequences of excessive concentration and physical congestion of primate cities, and offering new opportunities for economic development.
The growth and concentration of populations in small and big cities, and population decline in large agglomerations, has generated self-limiting mechanisms of urban growth in the region as it has transitioned away from urban primacy. These self-limiting mechanisms may have been induced by decentralization policies, regional planning programmes, industrial delocalization strategies, and governmental actions channeling investments to specific regions and cities. The consensus among scholars, however, is that regional planning efforts in Latin America and the Caribbean region have not been a great success. With the exception of a few countries and programmes – Mexico’s deconcentration of its system of cities; the “Marcha hacia el Este” in Paraguay and Bolivia that reoriented migratory flows towards Santa Cruz and Ciudad del Este; and Cuba’s decentralization policies that reduced growth in the capital, Havana – government interventions have not
s
Teenagers playing street soccer in Mexico City: A large proportion of the urban population in Latin America resides in large cities ©Milan Klusacek/iStockphoto

23
1 UNFPA, 2007, p 1 Earlier UN estimates indicated that this urban transition would occur in 2007
2 UN Population Division, 2007 3 This growth rate considers cities with more than 100,000 inhabitants in the
period 1990-2000 Urban growth of the total urban population has been estimated at 2 67 per cent for the developing world and 0 54 per cent for the developed world for the years 2000-2005
4 U N Department of Economic and Social Affairs Population Division, 2007 5 U N Department of Economic and Social Affairs Population Division, 2007 6 Metropolitan areas with populations between 2 and 5 million contained 14
per cent of the population Cities with populations between 1 and 2 million contained 13 per cent, and those with populations between 250,000 and 1 million and less than 250,000 contained 16 and 7 per cent, respectively United Nations Census Bureau, 2007
7 The Commonwealth of Independent States (CIS) consists of 11 former Soviet Republics: Armenia, Azerbaijan, Belarus, Georgia, Kazakhstan, Kyrgyzstan, Moldova, Russia, Tajikstan, Ukraine and Uzbekistan.
8 Satterthwaite, 2007 9 Lupton & Power, 2004 10 European Commission, 2007 11 United States Census Bureau, 2007 12 Population growth varied significantly by region in the 1990s, with higher
rates in the west (19 7 per cent) and south (17 3 per cent) and much lower rates in the midwest (7 9 per cent) and northeast (5 5 per cent), U S Census Bureau, 2007
13 Innovations for an Urban World Summit, Bellagio Italy, July 2007 14 Statistics Canada, 2007 15 Ibid 16 Statistics Canada, 2007 17 Between 1986 and 1994, the population living in capital cities grew by 10
per cent, and since then the annual rate of growth has been decreasing Australian Bureau of Statistics, 1996
18 Martinez-Fernandez & Wu, 2007 19 Australian Bureau of Statistics, 1996 20 Statistics New Zealand, 1999a 21 Statistics New Zealand, 1999b 22 Satterthwaite, 2007 23 Kasarda & Crenshaw, 1991, p 467-501 24 Municipality of Shanghai, n d 25 UN DESA, 2007 26 The trend of urban population decrease is well known and largely associated
with cities in the western world, especially in Europe and some parts of North America, where the number of shrinking cities has increased faster in the last 50 years than the numbers of expanding ones
27 UNFPA, 2007, p 8 28 In some parts of sub-Saharan Africa, fertility rates are even higher Central
Africa, for instance, had a fertility rate of 6 1 in 2007 29 UNFPA, 2007, p 11 30 UN-HABITAT, in press 31 The average growth rate for cities in the developing world is 2 58 per cent 32 The fastest growth observed during the years 1990 to 2000 Refer to
database used by UN-HABITAT in this Report In the study, “The Transition
to a Predominantly Urban World and Its Underpinnings”, David Satterthwaite indicates that Africa has 25 such cities, considering a longer period starting in 1950
33 Interestingly, around 10 per cent of small cities in the region experienced a population loss
34 OCHA, 2003 35 UN DESA, 2007 36 Demographic and Health Surveys, various years between 2000 and 2004 37 This growth is important if compared with about 1 5 per cent in the
advanced economies Only countries in Asia and countries in transition grew faster than SSA BBC News, n d
38 BBC News, n d 39 World Bank, 200340 UN-HABITAT, 2006a 41 UN DESA, 2007 42 Ibid UN-HABITAT estimations, 2007 43 Cohen, 2004 44 UNFPA, n d 45 Eberstadt, 1998 46 United Nations Economic and Social Council, 1997 47 Zhu, 2006 48 The growth rate of big and large Indian cities declined from 36 per cent
during the years 1981-1991 to 34 per cent in the next decade Cited in Bhagat, 2005
49 Survey done by the Tata Institute of Social Sciences in 2000 50 Bangalore is the only big metropolitan area with positive growth rates
Secondary metro cities are Pune, Surat, Patna, Kanpur, Jaipur, and Indore Congested primary cities are Mumbai, Chennai, Kolkota and Delhi Cited in Bhagat, 2005
51 This rural-based development strategy is designed to provide non-agricultural employment and thus prevent a mass migration to primate and regional cities already undersupplied with essential services Asian Urban Center of Kobe, 1987
52 Wang, 2003 53 The percentage of people living on less than one dollar a day declined from
35 per cent in 1990 to about 20 per cent in 2003 ADB, DFID and World Bank, 2006
54 ADB, DFID and World Bank, 2006 55 UN-HABITAT, 2006a, p 20 56 Blair, 2006 57 Government of China, 11th Five-Year Plan period (2006-2010) 58 Rodriguez, 2007 In only 50 years, the percentage of the total population
living in urban areas rose from 42 per cent in 1950 to 75 per cent in 2000 59 Bolivia and Haiti: incipient transition El Salvador, Guatemala, Honduras,
Nicaragua, and Paraguay: moderate transition Brazil, Colombia, Costa Rica, Ecuador, Mexico, Panama, Peru, the Dominican Republic, and Venezuela: transition in progress Cuba, Argentina, Chile, and Uruguay: advanced transition
60 ECLAC, UNFPA, PAHO, 1999 61 The number of poor grew by 3 million persons between 1990 and 2001,
about 7 million in 2000-2001, and 17 million in 2002 ECLAC, 2002 62 Cohen, 2004
NoTeS
managed to reorient growth to secondary cities. Governments and programmes have also not succeeded, for the most part, in stimulating growth in poor regions, or helping the poor, even in regions in which economic growth has occurred.
In Latin America and the Caribbean, per capita GDP grew on average by 1.1 per cent per year in the 1990s and by a mere 0.7 per cent per year in the four years from 2000 to 2004. Since the beginning of the 21st century, poverty levels in absolute terms have increased, particularly in urban areas, revealing a lack of improvement in the living conditions of the population at large.61 Clearly, the region’s economic
growth and social development have not happened as expected, at least in the last 10 years. Slum growth and slum prevalence declined in some countries in the late 1980s and 1990s, when the process of re-democratization resulted in the adoption of progressive policies aimed at promoting more inclusive governance and reducing inequalities. However, one consistent factor in the region’s tumultuous economic and political history is the persistence of mass poverty in the face of enormous wealth. The region continues to have the greatest income inequality in the world,62 which hampers its potential to achieve harmonious urban development.
24
STAT
E OF
THE
WOR
LD’S
CIT
IES
2008
/9
Urban growth is a result of a combination of factors: geographical location, natural population growth, rural-to-urban migration, infrastructure development, government policies, corporate
strategies, and other major political and economic forces, including globalization.1 In some regions, such as Latin America, urban growth is, in fact, largely a result of urban-to-urban migration. And in many Asian countries, including China, national economic policies often play a significant role in determining which cities will grow in size and importance.
Demographic factors
Contrary to common perception, migration from rural to urban areas is no longer the dominant determinant of urban growth in developing countries. In demographic terms, the main cause of urban growth in most countries is natural increase – when births in cities outpace deaths. United Nations estimates indicate that natural increase accounts for some 60 per cent of urban growth.2 Several demographic dynamics interact in most cities to influence growth or contraction. In Iran, for instance, the population of urban areas has increased over the past five decades as a result of both high natural population growth rates and rapid rural-urban migration. In contrast, cities in the State of Kerala in India experienced a decline in population over the past 50 years, as Keralites migrated to other states and literacy rates among women increased, impacting fertility rates.3 In Cuba, the country with the lowest birth rate in Latin America and the Caribbean, urban growth has leveled off as the population has aged. A country’s demographic patterns are, therefore, an important determinant of urban growth. Yet, countries with similar demographic patterns may experience different patterns of urban change, with some cities growing faster than others.
Demographic determinants that account for the remaining 40 per cent of urban growth are migration, both intra-national (rural to urban and urban to urban) and international, and the transformation of rural settlements into urban places, a process known as “reclassification”. Overall, for every 60 million new urban dwellers added every year to the cities of the global South, approximately 36 million are born there,
12 million migrate in and the remaining 12 million become urban residents by virtue of the reclassification of their rural lands to urban areas.
These demographic factors are influenced by a country’s stage of development and its level of urbanization. In countries with low levels of urbanization, migration is often the primary engine driving city growth, as is the case in various countries in Africa and Asia. For instance, the net migration rate into Ho Chi Minh City in Viet Nam was twice that of the natural increase rate between 1999 and 2004.4 Studies have also shown that more than 60 per cent of population increase in Dhaka, Bangladesh, is due to in-migration.5 But even in such a case, immigration is driven by industrial policies that centre development in the capital city.
As the urban base grows, the patterns reverse, with natural increase becoming responsible for a higher proportion of urban growth.6 For instance, in Latin America and the Caribbean, where almost 80 per cent of the population lives in cities, natural growth accounted for more than 60 per cent of urban growth in 2005, despite steep declines in fertility rates, while migration accounted for less than 20 per cent of urban growth that year. In countries with youthful populations, natural increase is a big contributor to urban growth. In India, for instance, where 35 per cent of the population is under 15 years old, natural increase accounted for 56 per cent of urban growth in 2001, while net migration accounted for 23 per cent.7
In contrast, in China, where two-fifths of the population is urban and fertility rates are extremely low (an outcome of the one-child policy),8 rural-to-urban migration was the main cause of population growth, accounting for 55 per cent of growth in 1990, while natural increase accounted for only 23 per cent of growth. In Shanghai – and possibly in other major Chinese cities – natural increase has played a limited role in urban growth since then. Of the 16.4 million people counted in the 2000 population census for Shanghai, 5.5 million were migrants.9
In many countries, the largest movements of population are taking place between cities and not from rural to urban areas. In Latin America and the Caribbean, half of all migrations originate and end in cities.10 In São Paulo, for instance, one-third of all urban growth can be attributed to urban-to- urban
1.3Which Cities are Growing and Why
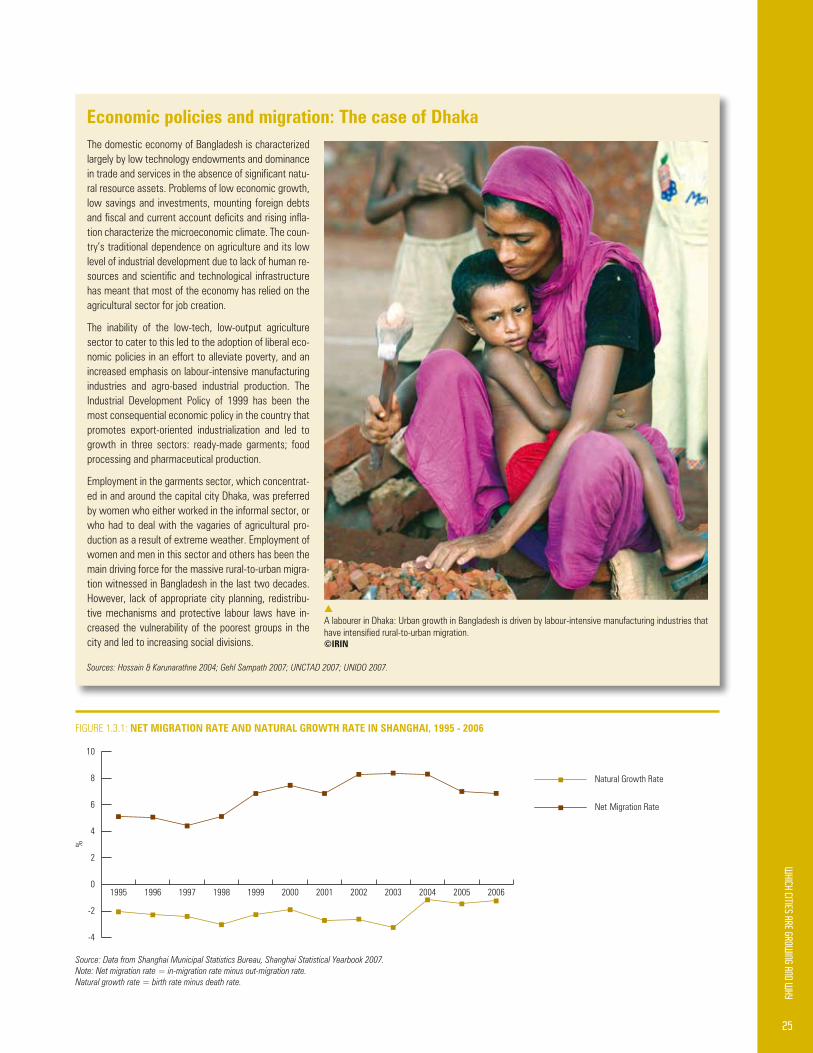
25
The domestic economy of Bangladesh is characterized largely by low technology endowments and dominance in trade and services in the absence of significant natu-ral resource assets Problems of low economic growth, low savings and investments, mounting foreign debts and fiscal and current account deficits and rising infla-tion characterize the microeconomic climate The coun-try’s traditional dependence on agriculture and its low level of industrial development due to lack of human re-sources and scientific and technological infrastructure has meant that most of the economy has relied on the agricultural sector for job creation.
The inability of the low-tech, low-output agriculture sector to cater to this led to the adoption of liberal eco-nomic policies in an effort to alleviate poverty, and an increased emphasis on labour-intensive manufacturing industries and agro-based industrial production The Industrial Development Policy of 1999 has been the most consequential economic policy in the country that promotes export-oriented industrialization and led to growth in three sectors: ready-made garments; food processing and pharmaceutical production
Employment in the garments sector, which concentrat-ed in and around the capital city Dhaka, was preferred by women who either worked in the informal sector, or who had to deal with the vagaries of agricultural pro-duction as a result of extreme weather Employment of women and men in this sector and others has been the main driving force for the massive rural-to-urban migra-tion witnessed in Bangladesh in the last two decades However, lack of appropriate city planning, redistribu-tive mechanisms and protective labour laws have in-creased the vulnerability of the poorest groups in the city and led to increasing social divisions
Sources: Hossain & Karunarathne 2004; Gehl Sampath 2007; UNCTAD 2007; UNIDO 2007.
economic policies and migration: The case of Dhaka
FIGURE 1 3 1: NeT MIgRaTIoN RaTe aND NaTURal gRowTh RaTe IN ShaNghaI, 1995 - 2006
Source: Data from Shanghai Municipal Statistics Bureau, Shanghai Statistical Yearbook 2007. Note: Net migration rate = in-migration rate minus out-migration rate.Natural growth rate = birth rate minus death rate.
s
A labourer in Dhaka: Urban growth in Bangladesh is driven by labour-intensive manufacturing industries that have intensified rural-to-urban migration.©IRIN
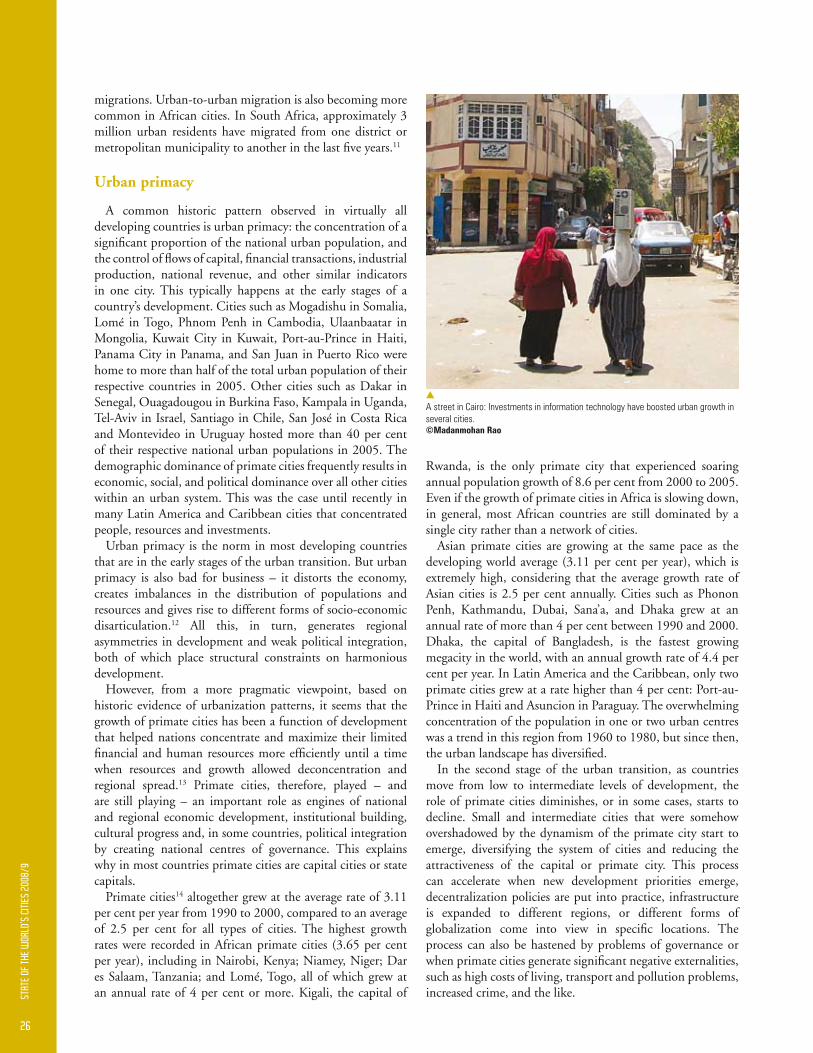
26
STAT
E OF
THE
WOR
LD’S
CIT
IES
2008
/9
Rwanda, is the only primate city that experienced soaring annual population growth of 8.6 per cent from 2000 to 2005. Even if the growth of primate cities in Africa is slowing down, in general, most African countries are still dominated by a single city rather than a network of cities.
Asian primate cities are growing at the same pace as the developing world average (3.11 per cent per year), which is extremely high, considering that the average growth rate of Asian cities is 2.5 per cent annually. Cities such as Phonon Penh, Kathmandu, Dubai, Sana’a, and Dhaka grew at an annual rate of more than 4 per cent between 1990 and 2000. Dhaka, the capital of Bangladesh, is the fastest growing megacity in the world, with an annual growth rate of 4.4 per cent per year. In Latin America and the Caribbean, only two primate cities grew at a rate higher than 4 per cent: Port-au-Prince in Haiti and Asuncion in Paraguay. The overwhelming concentration of the population in one or two urban centres was a trend in this region from 1960 to 1980, but since then, the urban landscape has diversified.
In the second stage of the urban transition, as countries move from low to intermediate levels of development, the role of primate cities diminishes, or in some cases, starts to decline. Small and intermediate cities that were somehow overshadowed by the dynamism of the primate city start to emerge, diversifying the system of cities and reducing the attractiveness of the capital or primate city. This process can accelerate when new development priorities emerge, decentralization policies are put into practice, infrastructure is expanded to different regions, or different forms of globalization come into view in specific locations. The process can also be hastened by problems of governance or when primate cities generate significant negative externalities, such as high costs of living, transport and pollution problems, increased crime, and the like.
migrations. Urban-to-urban migration is also becoming more common in African cities. In South Africa, approximately 3 million urban residents have migrated from one district or metropolitan municipality to another in the last five years.11
Urban primacy
A common historic pattern observed in virtually all developing countries is urban primacy: the concentration of a significant proportion of the national urban population, and the control of flows of capital, financial transactions, industrial production, national revenue, and other similar indicators in one city. This typically happens at the early stages of a country’s development. Cities such as Mogadishu in Somalia, Lomé in Togo, Phnom Penh in Cambodia, Ulaanbaatar in Mongolia, Kuwait City in Kuwait, Port-au-Prince in Haiti, Panama City in Panama, and San Juan in Puerto Rico were home to more than half of the total urban population of their respective countries in 2005. Other cities such as Dakar in Senegal, Ouagadougou in Burkina Faso, Kampala in Uganda, Tel-Aviv in Israel, Santiago in Chile, San José in Costa Rica and Montevideo in Uruguay hosted more than 40 per cent of their respective national urban populations in 2005. The demographic dominance of primate cities frequently results in economic, social, and political dominance over all other cities within an urban system. This was the case until recently in many Latin America and Caribbean cities that concentrated people, resources and investments.
Urban primacy is the norm in most developing countries that are in the early stages of the urban transition. But urban primacy is also bad for business – it distorts the economy, creates imbalances in the distribution of populations and resources and gives rise to different forms of socio-economic disarticulation.12 All this, in turn, generates regional asymmetries in development and weak political integration, both of which place structural constraints on harmonious development.
However, from a more pragmatic viewpoint, based on historic evidence of urbanization patterns, it seems that the growth of primate cities has been a function of development that helped nations concentrate and maximize their limited financial and human resources more efficiently until a time when resources and growth allowed deconcentration and regional spread.13 Primate cities, therefore, played – and are still playing – an important role as engines of national and regional economic development, institutional building, cultural progress and, in some countries, political integration by creating national centres of governance. This explains why in most countries primate cities are capital cities or state capitals.
Primate cities14 altogether grew at the average rate of 3.11 per cent per year from 1990 to 2000, compared to an average of 2.5 per cent for all types of cities. The highest growth rates were recorded in African primate cities (3.65 per cent per year), including in Nairobi, Kenya; Niamey, Niger; Dar es Salaam, Tanzania; and Lomé, Togo, all of which grew at an annual rate of 4 per cent or more. Kigali, the capital of
s
A street in Cairo: Investments in information technology have boosted urban growth in several cities ©Madanmohan Rao

27
UN-HABITAT analysis of 245 cities that are ex-periencing the fastest growth in the developing world shows very clearly that spatial influences of macroeconomic and industrial policies and related investments (or economic development), are the main drivers of city growth in 78 per cent of the cities analyzed Investments in transport infrastructure (roads, ports, airports) were by and large the most important contributor to city growth Forty per cent of the cities analyzed ex-perienced high growth rates as a direct result of the diversification, expansion or improvement of regional or urban transport infrastructure The designation of regions or cities as special eco-nomic zones contributed to the rapid growth of one-fifth of these cities. The development of in-formation and services-related sectors, such as banking and financial systems, including different forms of trade, was the third most important con-tributor to city growth, representing 16 per cent of the cities
In a large number of these cities, economic poli-cies and investments are mostly the result of na-tional government decisions and allocations The State, in its various institutional forms, exerts a critical influence in the growth of these cities. For instance, decisions to designate cities or regions as free trade areas or special economic zones are made at the central government level; likewise, the mobilization and allocation of huge public (and often private) investments for the construction of transport and communication infrastructure and the improvement of these services is usually a central government responsibility This suggests that urban growth in many countries is initially driven by national governments, and then further propelled by local authorities and the private sec-tor In this scenario, central governments quite often determine which cities will benefit from in-vestments and macroeconomic decisions
National governments in a number of countries, including Thailand, the Philippines, South Korea, Mexico and Brazil, are concentrating more at-tention and resources on particular city-regions Others, like Malaysia and China, are using cities to connect the nation to the global space of busi-ness flows, while concurrently using such cities to propel social change in particular directions It is clear that the growth of the fastest cities in the developing world cannot be adequately un-derstood without an examination of the matrices of state territorial organization within and through which it occurs
This does not mean that local authorities are not
how governments are propelling urban growth
Analysis by UN-HABITAT Global Urban Observatory 2008. Data and other information on the 245 fastest growing cities derived from various sources, including Wai-Chung et al. 2004, South African Cities Network 2006 and Harvey 1989.
playing an important role in economic and urban growth. Local authorities, in conjunction with po-litical and economic local and regional elites, are transforming their cities into dynamic economic areas oriented towards global, regional and lo-cal growth sectors Cities such as Salem, Pim-pri, Chinchawad and Pune in India, Guadalajara and Ensenada in Mexico, Maracay in Venezuela, Cuenca in Ecuador and Zambaoanga in the Philip-pines, to name just a few cities, are all growing at the annual rate of 3 per cent or more by adopt-ing pro-growth strategies through place market-ing and promotion, focusing on high-potential economic sectors. Major urban centres in South Africa have also adopted different forms of eco-nomic development strategies as part of integrat-ed development plans, which were implemented through local economic development units As a consequence of this, economic growth in these cities was higher than population growth by slightly more than 1 percentage point over the 1996-2001 period
The growth of cities through local initiatives re-flects a rising trend towards greater urban entre-preneurialism and more intense city competition However, many cities in the developing world, particularly in the small and intermediate ranks, do not have adequate financial and human re-sources to conceive and implement medium- and long-term development strategies These cities, and many other large agglomerations, often com-pete with each other to gain recognition as impor-tant urban centres and to be included in regional and national development plans and strategies, which gives them the authority to be considered in the allocation of budgets and to be part of stra-tegic alliances that combine private and public resources etc
This articulation of local initiatives with central government economic and political decisions is bringing about changes in the governance para-digm in which the private sector is also involved in specific plans and funding. At the national or regional level, the central government decides on macroeconomic policies with clear spatial implications, implements institutional reforms and mobilizes huge domestic resources to sup-port infrastructure and communication develop-ment On their part local authorities design local development strategies or refashion their policies, programmes and projects in order to link up with wider initiatives that mobilize public and private investments at a larger scale
However, while developing countries are using macro and microeconomic policies to jump-start economic development, they often lack the regu-latory competence and strategic focus to enact policies for infrastructure and other public goods to promote regional balance Moreover, there is a lack of policies and institutions that focus on more equitable distribution of the gains of economic de-velopment, not only between regions or cities, but within cities Cities in countries that do relatively well to balance their needs and create spheres of harmony not only have strategic industrial and innovation policies that cater to the need for bet-ter infrastructure to achieve economies of scale; they also have the institutional mechanisms that distribute the gains of economic growth more evenly Often, developing countries’ focus on economic development is not accompanied by concomitant policies to improve the quality of ru-ral life This leads to a widening rural-urban divide in employment, schooling and medical services, among others, which fuels further migration to cities, and worsens the divide
s
Crowd of people crossing the street at a busy intersection in Central District, Hong Kong©Christine gonsalves/iStockphoto
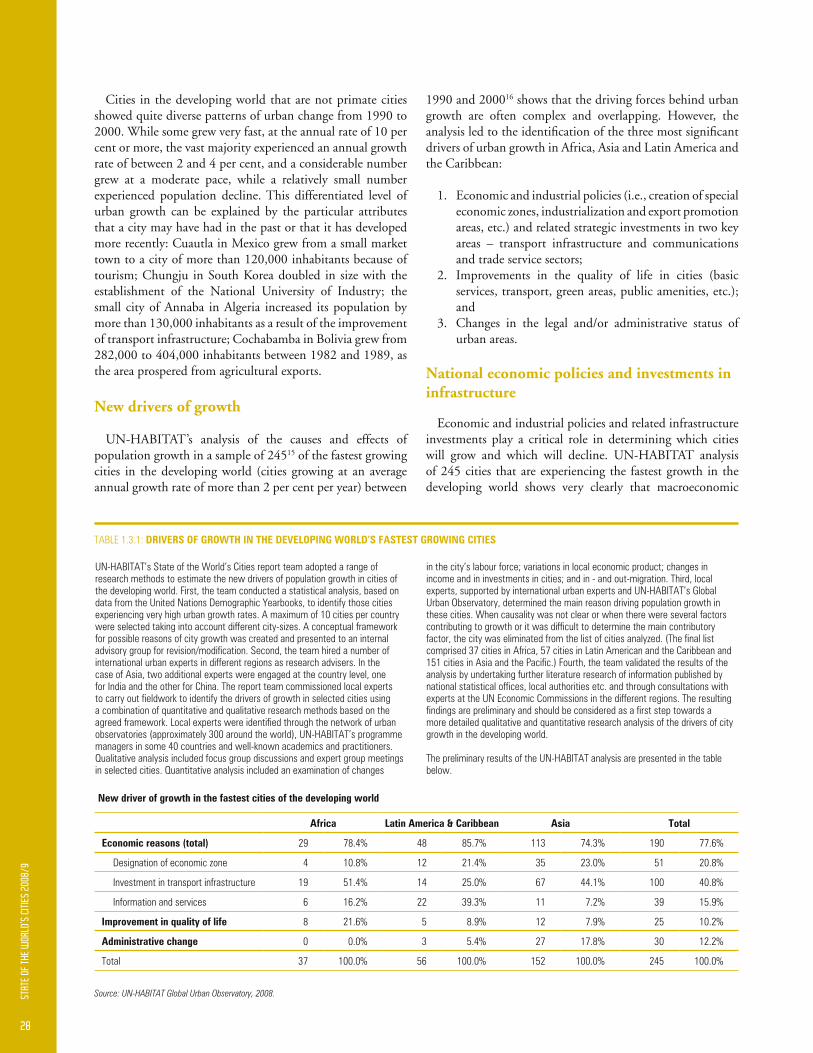
28
STAT
E OF
THE
WOR
LD’S
CIT
IES
2008
/9
Cities in the developing world that are not primate cities showed quite diverse patterns of urban change from 1990 to 2000. While some grew very fast, at the annual rate of 10 per cent or more, the vast majority experienced an annual growth rate of between 2 and 4 per cent, and a considerable number grew at a moderate pace, while a relatively small number experienced population decline. This differentiated level of urban growth can be explained by the particular attributes that a city may have had in the past or that it has developed more recently: Cuautla in Mexico grew from a small market town to a city of more than 120,000 inhabitants because of tourism; Chungju in South Korea doubled in size with the establishment of the National University of Industry; the small city of Annaba in Algeria increased its population by more than 130,000 inhabitants as a result of the improvement of transport infrastructure; Cochabamba in Bolivia grew from 282,000 to 404,000 inhabitants between 1982 and 1989, as the area prospered from agricultural exports.
New drivers of growth
UN-HABITAT’s analysis of the causes and effects of population growth in a sample of 24515 of the fastest growing cities in the developing world (cities growing at an average annual growth rate of more than 2 per cent per year) between
TABLE 1 3 1: DRIveRS oF gRowTh IN The DevelopINg woRlD’S FaSTeST gRowINg CITIeS
New driver of growth in the fastest cities of the developing world
africa latin america & Caribbean asia Total
economic reasons (total) 29 78 4% 48 85 7% 113 74 3% 190 77 6%
Designation of economic zone 4 10 8% 12 21 4% 35 23 0% 51 20 8%
Investment in transport infrastructure 19 51 4% 14 25 0% 67 44 1% 100 40 8%
Information and services 6 16 2% 22 39 3% 11 7 2% 39 15 9%
Improvement in quality of life 8 21 6% 5 8 9% 12 7 9% 25 10 2%
administrative change 0 0 0% 3 5 4% 27 17 8% 30 12 2%
Total 37 100 0% 56 100 0% 152 100 0% 245 100 0%
Source: UN-HABITAT Global Urban Observatory, 2008.
1990 and 200016 shows that the driving forces behind urban growth are often complex and overlapping. However, the analysis led to the identification of the three most significant drivers of urban growth in Africa, Asia and Latin America and the Caribbean:
1. Economic and industrial policies (i.e., creation of special economic zones, industrialization and export promotion areas, etc.) and related strategic investments in two key areas – transport infrastructure and communications and trade service sectors;
2. Improvements in the quality of life in cities (basic services, transport, green areas, public amenities, etc.); and
3. Changes in the legal and/or administrative status of urban areas.
National economic policies and investments in infrastructure
Economic and industrial policies and related infrastructure investments play a critical role in determining which cities will grow and which will decline. UN-HABITAT analysis of 245 cities that are experiencing the fastest growth in the developing world shows very clearly that macroeconomic
UN-HABITAT’s State of the World’s Cities report team adopted a range of research methods to estimate the new drivers of population growth in cities of the developing world First, the team conducted a statistical analysis, based on data from the United Nations Demographic Yearbooks, to identify those cities experiencing very high urban growth rates A maximum of 10 cities per country were selected taking into account different city-sizes A conceptual framework for possible reasons of city growth was created and presented to an internal advisory group for revision/modification. Second, the team hired a number of international urban experts in different regions as research advisers In the case of Asia, two additional experts were engaged at the country level, one for India and the other for China The report team commissioned local experts to carry out fieldwork to identify the drivers of growth in selected cities using a combination of quantitative and qualitative research methods based on the agreed framework. Local experts were identified through the network of urban observatories (approximately 300 around the world), UN-HABITAT’s programme managers in some 40 countries and well-known academics and practitioners Qualitative analysis included focus group discussions and expert group meetings in selected cities Quantitative analysis included an examination of changes
in the city’s labour force; variations in local economic product; changes in income and in investments in cities; and in - and out-migration Third, local experts, supported by international urban experts and UN-HABITAT’s Global Urban Observatory, determined the main reason driving population growth in these cities When causality was not clear or when there were several factors contributing to growth or it was difficult to determine the main contributory factor, the city was eliminated from the list of cities analyzed. (The final list comprised 37 cities in Africa, 57 cities in Latin American and the Caribbean and 151 cities in Asia and the Pacific.) Fourth, the team validated the results of the analysis by undertaking further literature research of information published by national statistical offices, local authorities etc. and through consultations with experts at the UN Economic Commissions in the different regions The resulting findings are preliminary and should be considered as a first step towards a more detailed qualitative and quantitative research analysis of the drivers of city growth in the developing world
The preliminary results of the UN-HABITAT analysis are presented in the table below

29
policies and related investments, or economic development, were the main drivers of city growth in 78 per cent of the cities analyzed. More than half of the cities that grew because of economic reasons did so because of investment in transport infrastructure (roads, ports, airports, and the like). The designation of regions or cities as special economic zones contributed to the development of one-fifth of these cities. The development of information technology and financial services related sectors, such as banking and financial systems, including different forms of trade, was the third most important contributor to city growth, representing 16 per cent of cities that were driven by economic factors.
Cities that are oriented towards global or national growth sectors that specialize in industrial development, or are transport hubs and markets, are experiencing the fastest urban and economic growth. In general terms, these cities have more infrastructure investments, more robust labour
markets, more employment opportunities and higher incomes than other cities. All of these factors make the fastest growing cities attractive to potential migrants in search of economic opportunities. The reasons for growth vary according to regions. While in Asia the designation of economic zones and investments in infrastructure appear to be the most important contributors to urban growth, in Latin America and the Caribbean, service sector development appears to play a larger role. In Africa, improvements in quality of life appear to be an important factor of city growth, particularly in the cities of North Africa.
The pathways of growth for cities driven by economic development are diverse: economic reforms that facilitate access to capital markets and foreign investment; political changes that make possible greater local fiscal autonomy and permit import and export licenses; government and corporate strategies that increase investments in strategic economic sectors; and national or local initiatives that position cities in global, regional or local spaces of economic flows.
The growth of these cities is not random; very often, they benefit from economic policies because of where they are located geographically. In modern economic urban growth analysis, geography continues to play a key role in determining the economic policies and related investments in cities. Proximity to various geographic features or political entities that facilitate trade often explains the rationale for deciding which city will benefit the most from economic policies and investments: proximity to coastlines and navigable rivers with the consequent reduction of transport costs17; proximity to major cities and important urban agglomerations; proximity to markets, infrastructure and transport systems; proximity to natural resources, including water, minerals, hydrocarbon deposits, and the like; and proximity to transnational borders.18 For example, Gaborone, the capital of Botswana and one of Africa’s fastest growing cities, has experienced an annual growth rate of 3.3 per cent as a result of its strategic location at the frontier of the South African border. This city is becoming a thriving financial, industrial, administrative and educational hub for the region, attracting investments and generating opportunities that are magnets for accelerated migration.19 Many other cities across the developing world experienced important population growth by taking advantage of their strategic geographic location for trade activities: General Santos in the Philippines; Ensenada and Nuevo Laredo in Mexico; Barquisimeto, Ciudad Bolivar and Maracay in Venezuela; Teresina and Fortaleza in Brazil, to name just a few.
Geography is not the only deciding factor in the growth of such cities. A city that might have emerged because of geographic comparative advantages can continue to thrive as a result of agglomeration economies and good urban management. It is also possible to find cities that prosper and grow without a clear geographic advantage, mainly because of their capacity to develop self-organizing spatial patterns of development that are based on agglomeration effects and effective governance and urban management structures.
s
Bangkok’s advanced transport infrastructure: In many Asian cities, investment in urban infrastructure has boosted urban growth ©iStockphoto
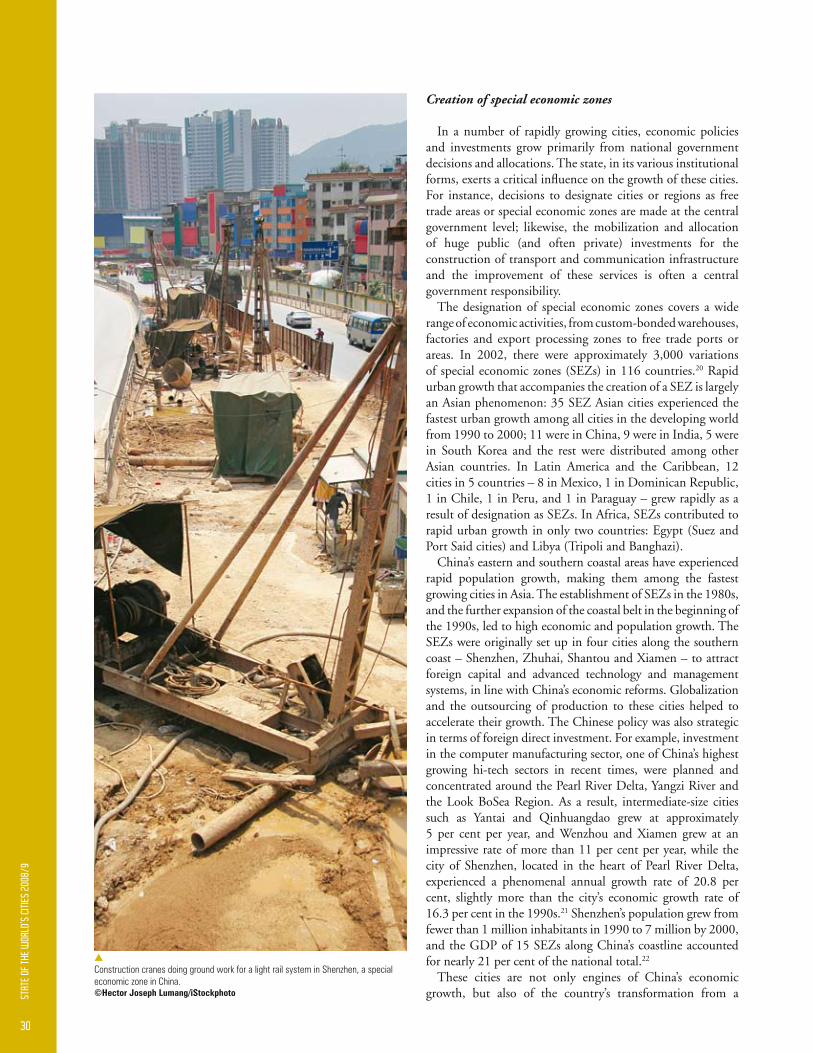
30
STAT
E OF
THE
WOR
LD’S
CIT
IES
2008
/9
Creation of special economic zones
In a number of rapidly growing cities, economic policies and investments grow primarily from national government decisions and allocations. The state, in its various institutional forms, exerts a critical influence on the growth of these cities. For instance, decisions to designate cities or regions as free trade areas or special economic zones are made at the central government level; likewise, the mobilization and allocation of huge public (and often private) investments for the construction of transport and communication infrastructure and the improvement of these services is often a central government responsibility.
The designation of special economic zones covers a wide range of economic activities, from custom-bonded warehouses, factories and export processing zones to free trade ports or areas. In 2002, there were approximately 3,000 variations of special economic zones (SEZs) in 116 countries.20 Rapid urban growth that accompanies the creation of a SEZ is largely an Asian phenomenon: 35 SEZ Asian cities experienced the fastest urban growth among all cities in the developing world from 1990 to 2000; 11 were in China, 9 were in India, 5 were in South Korea and the rest were distributed among other Asian countries. In Latin America and the Caribbean, 12 cities in 5 countries – 8 in Mexico, 1 in Dominican Republic, 1 in Chile, 1 in Peru, and 1 in Paraguay – grew rapidly as a result of designation as SEZs. In Africa, SEZs contributed to rapid urban growth in only two countries: Egypt (Suez and Port Said cities) and Libya (Tripoli and Banghazi).
China’s eastern and southern coastal areas have experienced rapid population growth, making them among the fastest growing cities in Asia. The establishment of SEZs in the 1980s, and the further expansion of the coastal belt in the beginning of the 1990s, led to high economic and population growth. The SEZs were originally set up in four cities along the southern coast – Shenzhen, Zhuhai, Shantou and Xiamen – to attract foreign capital and advanced technology and management systems, in line with China’s economic reforms. Globalization and the outsourcing of production to these cities helped to accelerate their growth. The Chinese policy was also strategic in terms of foreign direct investment. For example, investment in the computer manufacturing sector, one of China’s highest growing hi-tech sectors in recent times, were planned and concentrated around the Pearl River Delta, Yangzi River and the Look BoSea Region. As a result, intermediate-size cities such as Yantai and Qinhuangdao grew at approximately 5 per cent per year, and Wenzhou and Xiamen grew at an impressive rate of more than 11 per cent per year, while the city of Shenzhen, located in the heart of Pearl River Delta, experienced a phenomenal annual growth rate of 20.8 per cent, slightly more than the city’s economic growth rate of 16.3 per cent in the 1990s.21 Shenzhen’s population grew from fewer than 1 million inhabitants in 1990 to 7 million by 2000, and the GDP of 15 SEZs along China’s coastline accounted for nearly 21 per cent of the national total.22
These cities are not only engines of China’s economic growth, but also of the country’s transformation from a
s
Construction cranes doing ground work for a light rail system in Shenzhen, a special economic zone in China ©hector Joseph lumang/iStockphoto
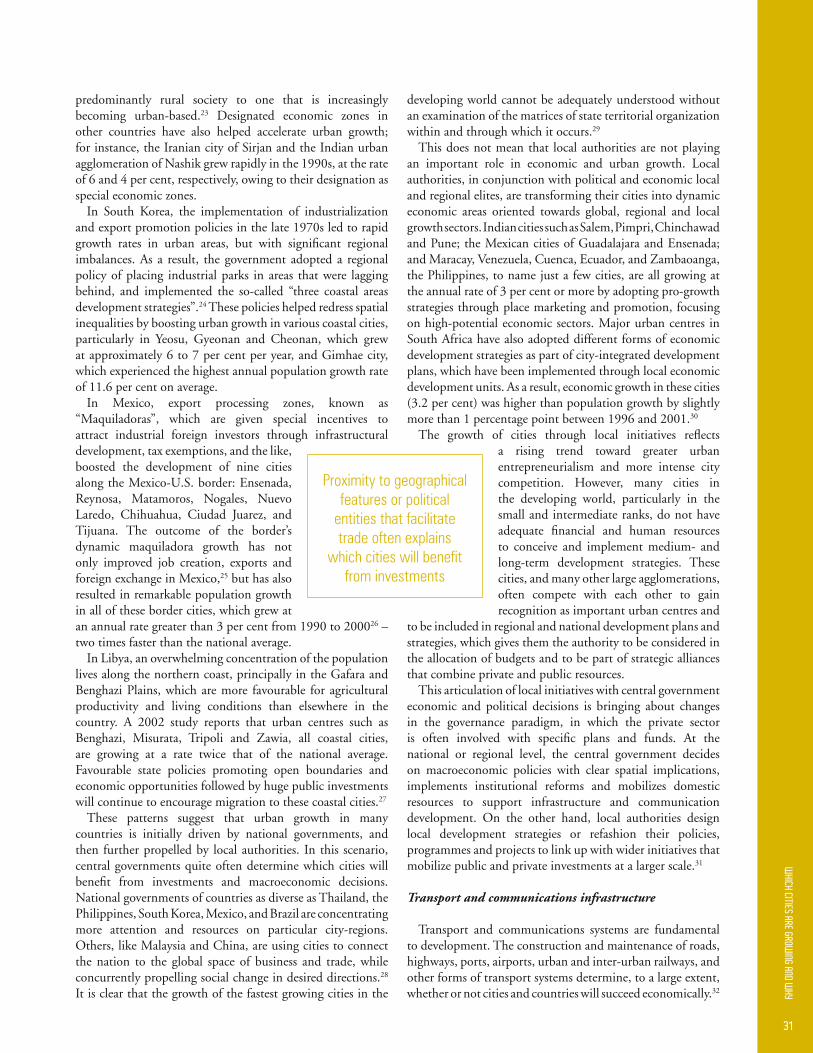
31
predominantly rural society to one that is increasingly becoming urban-based.23 Designated economic zones in other countries have also helped accelerate urban growth; for instance, the Iranian city of Sirjan and the Indian urban agglomeration of Nashik grew rapidly in the 1990s, at the rate of 6 and 4 per cent, respectively, owing to their designation as special economic zones.
In South Korea, the implementation of industrialization and export promotion policies in the late 1970s led to rapid growth rates in urban areas, but with significant regional imbalances. As a result, the government adopted a regional policy of placing industrial parks in areas that were lagging behind, and implemented the so-called “three coastal areas development strategies”.24 These policies helped redress spatial inequalities by boosting urban growth in various coastal cities, particularly in Yeosu, Gyeonan and Cheonan, which grew at approximately 6 to 7 per cent per year, and Gimhae city, which experienced the highest annual population growth rate of 11.6 per cent on average.
In Mexico, export processing zones, known as “Maquiladoras”, which are given special incentives to attract industrial foreign investors through infrastructural development, tax exemptions, and the like, boosted the development of nine cities along the Mexico-U.S. border: Ensenada, Reynosa, Matamoros, Nogales, Nuevo Laredo, Chihuahua, Ciudad Juarez, and Tijuana. The outcome of the border’s dynamic maquiladora growth has not only improved job creation, exports and foreign exchange in Mexico,25 but has also resulted in remarkable population growth in all of these border cities, which grew at an annual rate greater than 3 per cent from 1990 to 200026 – two times faster than the national average.
In Libya, an overwhelming concentration of the population lives along the northern coast, principally in the Gafara and Benghazi Plains, which are more favourable for agricultural productivity and living conditions than elsewhere in the country. A 2002 study reports that urban centres such as Benghazi, Misurata, Tripoli and Zawia, all coastal cities, are growing at a rate twice that of the national average. Favourable state policies promoting open boundaries and economic opportunities followed by huge public investments will continue to encourage migration to these coastal cities.27
These patterns suggest that urban growth in many countries is initially driven by national governments, and then further propelled by local authorities. In this scenario, central governments quite often determine which cities will benefit from investments and macroeconomic decisions. National governments of countries as diverse as Thailand, the Philippines, South Korea, Mexico, and Brazil are concentrating more attention and resources on particular city-regions. Others, like Malaysia and China, are using cities to connect the nation to the global space of business and trade, while concurrently propelling social change in desired directions.28
It is clear that the growth of the fastest growing cities in the
developing world cannot be adequately understood without an examination of the matrices of state territorial organization within and through which it occurs.29
This does not mean that local authorities are not playing an important role in economic and urban growth. Local authorities, in conjunction with political and economic local and regional elites, are transforming their cities into dynamic economic areas oriented towards global, regional and local growth sectors. Indian cities such as Salem, Pimpri, Chinchawad and Pune; the Mexican cities of Guadalajara and Ensenada; and Maracay, Venezuela, Cuenca, Ecuador, and Zambaoanga, the Philippines, to name just a few cities, are all growing at the annual rate of 3 per cent or more by adopting pro-growth strategies through place marketing and promotion, focusing on high-potential economic sectors. Major urban centres in South Africa have also adopted different forms of economic development strategies as part of city-integrated development plans, which have been implemented through local economic development units. As a result, economic growth in these cities (3.2 per cent) was higher than population growth by slightly more than 1 percentage point between 1996 and 2001.30
The growth of cities through local initiatives reflects a rising trend toward greater urban entrepreneurialism and more intense city competition. However, many cities in the developing world, particularly in the small and intermediate ranks, do not have adequate financial and human resources to conceive and implement medium- and long-term development strategies. These cities, and many other large agglomerations, often compete with each other to gain recognition as important urban centres and
to be included in regional and national development plans and strategies, which gives them the authority to be considered in the allocation of budgets and to be part of strategic alliances that combine private and public resources.
This articulation of local initiatives with central government economic and political decisions is bringing about changes in the governance paradigm, in which the private sector is often involved with specific plans and funds. At the national or regional level, the central government decides on macroeconomic policies with clear spatial implications, implements institutional reforms and mobilizes domestic resources to support infrastructure and communication development. On the other hand, local authorities design local development strategies or refashion their policies, programmes and projects to link up with wider initiatives that mobilize public and private investments at a larger scale.31
Transport and communications infrastructure
Transport and communications systems are fundamental to development. The construction and maintenance of roads, highways, ports, airports, urban and inter-urban railways, and other forms of transport systems determine, to a large extent, whether or not cities and countries will succeed economically.32
Proximity to geographical features or political
entities that facilitate trade often explains
which cities will benefit from investments
32
STAT
E OF
THE
WOR
LD’S
CIT
IES
2008
/9
and Performance Measurement System (LPPMS), which promoted the development of cities conducive to business, industry and entrepreneurship, and in which infrastructure development played a key role.36
Investments in transport facilities in various transnational border cities that combine large transport and distribution functions with trade activities have also boosted urban growth. In many cases, the strategic border location has been enhanced by industrial development, tourism or the development of a port: the Iraqi city of Basra, the country’s main port, located close to the Kuwaiti and Iranian borders in the southeast part of the country, experienced population growth of 4.5 per cent per year in the 1990s; Nuevo Laredo, a small city of only 300,000 people that accounts for 70 per cent of all Mexican goods exported to the United States by road, expanded its population at a rate of 3.4 per cent per year; and the Venezuelan city of San Cristobal on the Colombian border grew at 2.6 per cent per year. In addition to these cities, many other urban centres that are positioned at the convergence of land or sea border transport systems experienced accelerated economic and population growth between 1990 and 2000.
In many other cases, the expansion of regional transport networks boosted the development of urban centres located along railways and roads lines, often as trade and tourism places. This has been the case with the Latin America and Caribbean cities of Bayamo in Cuba, Chiclayo in Peru and San Cristobal in Venezuela, all of which grew at a rate of between 1 and 2 per cent annually following the development of provincial transport networks that were linked to national railway and roadway systems. In Africa, the expansion of transport infrastructure in the 1990s contributed to the growth of dozens of cities, both on the coastline and in the interior. Cities such as Annaba and Tebessa in Algeria grew at an annual rate of 3 per cent or more because a national railway line passed through them, and the city of Tiaret grew at a similar rate as a result of the construction of a high plateau line. Populations in the cities of Kaduna and Maiduguri in Nigeria also expanded with the improvement of the road and railway systems, the former for industrial development and the latter for transport services.
Connectivity through the development of infrastructure has been vital for the growth of cities in close proximity to larger urban centres. A considerable number of small and intermediate cities grew as bedroom communities, residential suburbs or satellite cities, offering the amenities of urban life – proximity, convenience and diversity – without the disadvantages, such as air pollution, congestion and crime. Investments in transport have effectively reduced the “commuter territory” in many places, linking metropolitan and sub-regional spaces and interconnecting various urban settlements in neighboring geographic locations.
In Asia, the development of better commuter systems has led to the growth of new cities, such as Ghaziabad, Noida, Faridabad, and Meerut, which have boomed as satellite cities of New Delhi, each with annual urban growth rates of between 3 and 6 per cent. The planned city of Navi Mumbai grew at a staggering pace of 7 per cent per year
Investments in transport infrastructure and related reforms in the sector, including finance and regulations, deliver major economic development benefits,33 contribute to poverty alleviation, and improve the quality of life of citizens.
Transport connectivity is the most important driver of city growth in developing regions, particularly in Asia and Africa. Two-fifths of the 245 cities in the UN-HABITAT sample of the developing world’s fastest growing cities have benefitted from diversification and improvement of regional transport systems, in terms of infrastructure and technology. Investments in transport not only increase the overall productivity of nations’ and regions’ economies, but they can also contribute to the maintenance of balanced regional development and the reduction of socio-economic disparities across space and people. Transport connects areas with economic potential to isolated places that otherwise would be left far behind.
Many countries improve their transport and technology systems when they open or liberalize their economies to reduce tariff and transport costs. These related initiatives have opened an array of markets and fostered growth in individual cities. Transport connectivity is integral to the economic growth of second and third-tier inland cities that have a functional connection to coastal settlements, transnational borders and other larger cities. As a result of transport and communication investments, inland urban centres are growing both economically and demographically. A study on population change from 1995 to 2000 shows that cities in coastal areas are not the fastest growing cities any more; in fact, cities in almost all ecosystems are growing at roughly the same of rate of 2.2 per cent per year. In Africa, cities in mountainous and forested areas grew the fastest, at the rate of 3.6 and 3.7 per cent annually, compared to the growth rate of 3.3 per cent per year for cities in coastal zones. In Latin America and the Caribbean, cities in dryland, forest and inland water ecosystems grew equally at the rate of 2.2 per cent per year, which is higher than the growth rate of coastal cities during this period (2.0 per cent per year).34 Better transport and communications infrastructure in several countries has made these cities more attractive destinations for economic activities, contributing to high rates of growth.
For similar reasons, inland Chinese cities such as Xinyang and Nanyang grew at an impressive rate of 15 per cent per year as a result of national efforts to develop transport infrastructure and communication technology in central China. New urban centres are also developing some 200 kilometres from the coastline in the eastern part of the country; these cities are already creating a new wave of urban settlements in the interior with strong linkages to the coastal region.35 In other Asian countries, coastal cities are receiving a new boost; for instance, the cities of Tirunelveli and Tiruchirappalli in the southern part of India, and Sirjan in the Islamic Republic of Iran, experienced growth rates of around 5 per cent per year, mainly because they have developed into important transport hubs.
In the Philippines, cities such as Mandaue, Davao and Cebu experienced significant urban and economic population growth as a result of the implementation of the Local Productivity

33
in the 1990s as part of the deconcentration strategy of the megacity of Mumbai; two other cities in the vicinity, Kalyan-Dombivli and Thane, experienced more spontaneous growth by offering more affordable housing solutions and adequate transport facilities. Information technology (IT) hubs, such as Bangalore and Hyderabad, are also experiencing growth driven by the establishment of international software companies that attract young professionals to the IT sector.
In South Korea, various cities have been experiencing rapid urban growth as part of the greater Seoul Metropolitan Area: Seongnam, which grew as a residential city; Suwon and Puchon, which became satellite cities that share the same subway line; and Incheon, which in 2001 built its own international airport. In Iran, the metropolitan areas of Isfahan and Tehran gave a boost to well-connected neighbouring cities: Khomeini-Shahr city, which grew at the rate of approximately 4 per cent per year, boosted by infrastructure development and the relocation of various companies from Isfahan; and Karaj city, which grew at an impressive rate of 8 per cent per year from 1994 to 2003, benefited from the commuter surface connection Teheran-Karaj, Mehrshahar Express Line and a privileged geographic location at the crossroads of the western and northern routes of the country.
Proximity to a large urban agglomeration is an important determinant of growth in many small and intermediate
Latin American cities. Between 1990 and 2000, small and intermediate cities grew faster when transport and communication infrastructure was extended to them or substantially improved. Better connectivity allowed them to exploit the employment opportunities, improved access to public amenities, and recreational and cultural services offered by big cities. Simultaneously, the small and intermediate cities were in a better position to offer land, housing and labour at a fraction of what they would cost in a big city, sometimes with a higher quality of life. They were also in a better position to offer specialized services around tourist attractions and scenic natural environments with comparative advantages. Alajuela city in the vicinity of San Jose, the capital of Costa Rica, experienced rapid urban growth, at a rate of 4 per cent per year, by hosting the main airport serving the country. The location of an international airport in the small city of São José dos Pinhais in Curitiba, Brazil, combined with good road infrastructure and industrial development, propelled the growth of the city at an annual rate of more than 9 per cent. San Bernardo in the Santiago Metropolitan Region in Chile saw growth of approximately 3 per cent per year as a result of the construction of a new highway that attracted industrial development. Likewise, the city of Cabimas in Venezuela grew at a rate of 3 per cent per year as a result of its oil production and its reliable highway connection to the city of Maracaibo.
s
Subway in Seoul, Korea; Transport connectivity is one of the most important drivers of urban growth in developing countries ©Juergen Sack/iStockphoto

34
STAT
E OF
THE
WOR
LD’S
CIT
IES
2008
/9
s
Luxurious residential buildings in Dubai Marina: The city’s remarkable growth has been propelled by a combination of innovative real estate projects, financial services and development of the tourism industry ©Shao weiwei/iStockphoto
industrial development zones, grew at the annual rate of 5 per cent. The coastal city of Karachi in Pakistan increased its population by more than 3 million people from 1990 to 2000, mainly as a result of high fertility rates, national and international in-migrations, trade activities related to the port, and the growth of information and communication technology industries. Dubai in the United Arab Emirates experienced a remarkable growth rate of 7 per cent per year during the 1990s by combining innovative real estate projects with IT, industrial and finance services, free trade zones and the development of the tourism industry.
Improvement in the quality of life
Of the 245 sample cities, 25 experienced rapid urban growth principally by improving the quality of life and well-being of their citizens. Some cities developed clear visions and strategies for their potential futures, articulating short- and medium-term responses that contributed to enhancing social, economic and, in some cases, environmental conditions, including personal safety and health, transport and other public services.
Cities such as Curitiba, Goiania and Fortaleza in Brazil and Gaziantep in Turkey grew at a rate of more than 2 per cent per year, largely by setting up good governance structures that enabled them to bring benefits to their inhabitants by expanding their connection to infrastructure, piped water, sewerage, electricity, and telephone, and by developing social amenities such as schools and health centres.38 The small city of Rishon LeZion in Israel doubled its population in
Information technology and financial services sectors
The development of economic infrastructure related to information technology and financial services was identified as the third most important economic driver of city growth in the developing world in the UN-HABITAT analysis. Investments in information and communication technology (telephone, cellular and radio services, and electronic communication), and related communication services, such as financial, banking, insurance, and other various forms of trade, were the primary boosters of growth in 39 of the 245 fastest growing cities in the developing world.
In addition to the already well-known urban centres that experienced significant economic and population growth in recent years as a result of financial trade and communication services, such as Singapore, Kuala Lumpur, Beijing, and Hong Kong, other cities in countries from India to Venezuela, Pakistan to Mexico, Cameroon to Puerto Rico also witnessed rapid growth as a result of public and private investments in communication technology and related services, including various other forms of trade. Hyderabad in India was transformed into a dynamic economic region oriented toward global growth sectors, inspired by the infrastructure-led growth model, focusing on industrial development, particularly in the information technology (IT) sector.37 Likewise, the city of Bangalore has become a major centre of information technology and software services in the country with an annual population growth rate of 2.2 per cent from 1991 to 2001. The city of Gumi, known as the Korean Silicon Valley, and the Chinese cities of Xian and Changsha, two high-tech
35
20 years, starting in the mid 1980s, through the creation of employment opportunities, high-quality schools and services –including innovative urban transport – open spaces and green areas within the city. Today, Rishon LeZion is the fastest growing metropolitan area in the country, growing at 3.3 per cent per year, with the highest average per capita income and a record number of square metres of park space per resident.39
A similar situation has been observed in the city of Bacolod in the Philippines: despite experiencing a rapid growth rate of 2.4 per cent per year in the 1990s, it was ranked first in the country’s quality of life assessment in 2006.40 In China, the city of Yantai in the eastern part of the country grew at an accelerated annual rate of more than 7 per cent from 1990 to 2000 following its complete transformation into a “safer, greener and better serviced city”. This award-winning city has successfully competed with large Asian cities for new investments by embracing sustainable development principles that combine strategies to create a more conducive environment for business and good-quality housing solutions. The city of Dubai in the United Arab Emirates is a first-class example of economic and urban development based on risk-taking and profit-oriented strategies that are boosting economic and urban growth based on the concept of a “quality of life city”. Many other cities in developing countries are enhancing their attractiveness through the development of high-quality services in various sectors, including the city of Davao in the Philippines, which is considered one of the most competitive and liveable cities in the country.41
In the 1990s, quality of life was an important driver of growth in cities that implemented place-specific development strategies, raising living standards by building economic infrastructure and social amenities. These cities boosted their economic and urban growth by exploring natural advantages, often in the tourism and leisure industries. Good examples of this are the Chilean cities of Temuco, La Serena and Villa del Mar and Rishon LeZion in Israel. The Moroccan cities of Saîda, Taghazout, Mogador and El Haouzia implemented a “Sustainable Development of Coastal Tourism Programme”, which provides water, electricity, roads, and telecommunication infrastructure to new real estate developments along the coasts. Similarly, various South Korean cities have developed the “Corporate Cities” concept, merging business, research, tourism, and residential areas in new urban developments. 42
An important driver of city growth related to quality of life is the construction of a prominent public or private institution, often a university or research institute. The Algerian cities of Blida, Tlemcen, Sidi-bel-Abbès and Setif, the city of Bobo Dioulasso in Burkina Fasso and Concepción in Chile grew, to a large extent, as a result of the attraction of their institutes of higher learning.
Administrative and/or legal changes incity status
Between 1990 and 2000, 30 cities in the UN-HABITAT sample of 245 rapidly growing cities experienced administrative and political changes, often absorbing large populations that were not previously part of the city. This form of urban growth – of urban change, in fact – is largely influenced by governments’ decisions to modify the legal and administrative status of urban areas very often as a response to economic growth or as a way to induce economic development. These modifications involve changes in the size of cities, their boundaries, forms of classification and definition.
Another dimension of change in administrative designation is the reclassification of rural areas into cities. Reclassification accounts for approximately a quarter of urban population increase in the developing world. Scholars have pointed out that in most parts of the world where reclassification occurs, it tends to be in areas that have experienced, or are experiencing, the fastest economic growth. In China, for instance, 25 per cent of urban growth in the country has been attributed to reclassification; this phenomenon is particularly prevalent in the eastern part of the country.43
An obvious form of urban growth resulting from geopolitical decisions is the transfer of capital cities to other small cities or to new, previously undeveloped locations. Other cities were designated capitals of their provinces or departments, and by virtue of this change experienced significant population growth, as was the case in Samarinda, Indonesia.
The change of administrative and legal status is an important driver of many cities’ growth; 12 per cent of the 245 cities analyzed by UN-HABITAT recorded administrative changes as the most significant factor in their growth between 1990 and 2000. Twenty-seven of the 30 cities that experienced an administrative or legal change in their status were in Asia, while the remaining 3 were in Latin America and the Caribbean; no city sampled in Africa grew as a result of change in status. In Asia, more than half of the legal and administrative city definitional changes occurred in China (8), South Korea (9) and Indonesia (3). In China, contrary to the policies restricting urban development before the era of economic reforms, the government adopted a more positive attitude toward the designation of cities and towns in the 1990s44; this not only increased the number of cities, but also led to a population increase in cities. Cities such as Lu’an, Xinyang and Nanyang grew at an astounding annual rate of more than 15 per cent following their changed ranking from county-level cities to prefecture-level cities and the expansion of the urban area.45 A similar situation occurred in the small South Korean cities of Gyeongiu, Yeosu, Gumi, and Pohang, which merged with other counties in 1995, precipitating population growth of approximately 5 per cent in each of the cities. In Indonesia, the cities of Sukabumi and Bogor grew at a rate of more than 10 per cent every year as a result of the expansion of the administrative area.

36
STAT
E OF
THE
WOR
LD’S
CIT
IES
2008
/9
Between 1990 and 2000, urbanization in developing regions was characterized by the entry of new cities that did not exist as such in 1990. This constellation of 694 new cities started out as rural towns and became urban areas by virtue of changes in their administrative status, natural growth or in-migration.
These significant changes took place mostly in Asia, where more than 295 settlements became small cities, followed by 171 new small cities in Latin America and the Caribbean. More than 90 per cent of the cities in which populations grew from fewer than
100,000 to more than 1 million people were also in Asia, owing to a variety of factors, including changes in administrative and legal boundaries and changes in political status of settlements.
Among the cities that emerged after 1990, 73 per cent joined the category of small cities, 19 per cent became intermediate cities and 7.5 per cent developed into big cities.
Not only did the number of cities increase, but many of the cities that existed in 1990 also became larger: 122 small cities (13 per cent) became intermediate or big cities; 66
intermediate cities (23 per cent) became big or large cities; and 10 big cities (5 per cent) developed into large cities. On the other hand, 17 cities contracted, changing from big to intermediate or from intermediate to small.
These changes are not only a matter of numbers – they also represent a qualitative change in what the world perceives to be “small”, “intermediate” and “large” in terms of city size over time. The emergence of “hyper-large” or “meta-city” urban agglomerations with more than 20 million inhabitants has led to a fundamental shift in conceptions of city size.
TABLE 1 3 2: NUMBeR aND ToTal popUlaTIoN oF New CITIeS eSTaBlISheD SINCe 1990
FIGURE 1 3 2: NUMBeR oF New CITIeS aFTeR 1990 IN The DevelopINg woRlD
Source: UN-HABITAT Global Urban Observatory 2008Data source: UN Demographic Yearbooks, various years (1985 - 2004)
New entrants in the league of cities
New small cities New intermediate cities New big cities Total
Number Population Number Population Number Population Number Population
Africa 44 6,335,094 1 523,265 0 0 45 6,858,359
Latin America & Caribbean 171 27,138,867 6 3,930,127 2 3,008,885 179 34,077,879
Asia 295 60,825,858 125 86,595,611 50 65,491,865 470 212,913,334
excluding China & India 72 13,374,321 5 3,109,207 0 0 77 16,483,528
China 78 26,331,991 119 82,966,103 49 64,485,448 246 173,783,542
India 145 21,119,546 1 520,301 1 1,006,417 147 22,646,264
TOTAL 510 94,299,819 132 91,049,003 52 68,500,750 694 253,849,572
Source: UN-HABITAT Global Urban Observatory 2008Data source: UN Demographic Yearbooks, various years (1985 - 2004)
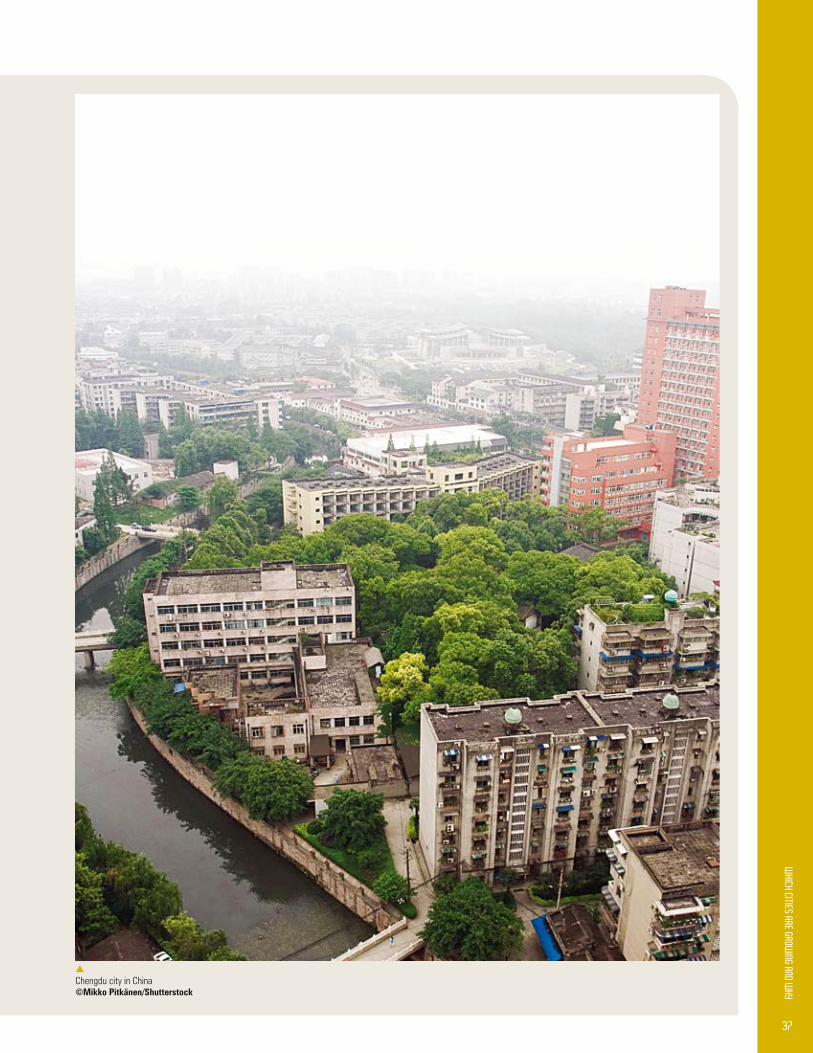
37
s
Chengdu city in China©Mikko pitkänen/Shutterstock
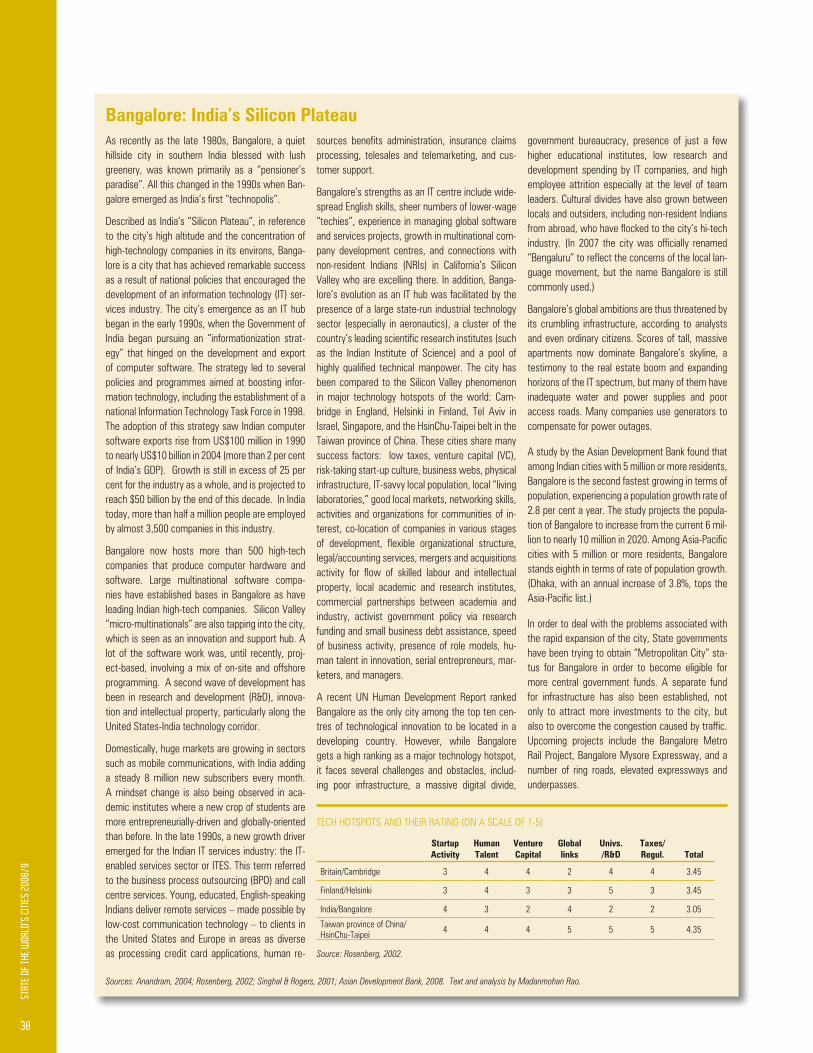
38
STAT
E OF
THE
WOR
LD’S
CIT
IES
2008
/9
As recently as the late 1980s, Bangalore, a quiet hillside city in southern India blessed with lush greenery, was known primarily as a “pensioner’s paradise” All this changed in the 1990s when Ban-galore emerged as India’s first “technopolis”.
Described as India’s “Silicon Plateau”, in reference to the city’s high altitude and the concentration of high-technology companies in its environs, Banga-lore is a city that has achieved remarkable success as a result of national policies that encouraged the development of an information technology (IT) ser-vices industry The city’s emergence as an IT hub began in the early 1990s, when the Government of India began pursuing an “informationization strat-egy” that hinged on the development and export of computer software The strategy led to several policies and programmes aimed at boosting infor-mation technology, including the establishment of a national Information Technology Task Force in 1998 The adoption of this strategy saw Indian computer software exports rise from US$100 million in 1990 to nearly US$10 billion in 2004 (more than 2 per cent of India’s GDP) Growth is still in excess of 25 per cent for the industry as a whole, and is projected to reach $50 billion by the end of this decade In India today, more than half a million people are employed by almost 3,500 companies in this industry
Bangalore now hosts more than 500 high-tech companies that produce computer hardware and software Large multinational software compa-nies have established bases in Bangalore as have leading Indian high-tech companies Silicon Valley “micro-multinationals” are also tapping into the city, which is seen as an innovation and support hub A lot of the software work was, until recently, proj-ect-based, involving a mix of on-site and offshore programming A second wave of development has been in research and development (R&D), innova-tion and intellectual property, particularly along the United States-India technology corridor
Domestically, huge markets are growing in sectors such as mobile communications, with India adding a steady 8 million new subscribers every month A mindset change is also being observed in aca-demic institutes where a new crop of students are more entrepreneurially-driven and globally-oriented than before In the late 1990s, a new growth driver emerged for the Indian IT services industry: the IT-enabled services sector or ITES This term referred to the business process outsourcing (BPO) and call centre services Young, educated, English-speaking Indians deliver remote services – made possible by low-cost communication technology – to clients in the United States and Europe in areas as diverse as processing credit card applications, human re-
Bangalore: India’s Silicon plateau
Sources: Anandram, 2004; Rosenberg, 2002; Singhal & Rogers, 2001; Asian Development Bank, 2008. Text and analysis by Madanmohan Rao.
sources benefits administration, insurance claims processing, telesales and telemarketing, and cus-tomer support
Bangalore’s strengths as an IT centre include wide-spread English skills, sheer numbers of lower-wage “techies”, experience in managing global software and services projects, growth in multinational com-pany development centres, and connections with non-resident Indians (NRIs) in California’s Silicon Valley who are excelling there In addition, Banga-lore’s evolution as an IT hub was facilitated by the presence of a large state-run industrial technology sector (especially in aeronautics), a cluster of the country’s leading scientific research institutes (such as the Indian Institute of Science) and a pool of highly qualified technical manpower. The city has been compared to the Silicon Valley phenomenon in major technology hotspots of the world: Cam-bridge in England, Helsinki in Finland, Tel Aviv in Israel, Singapore, and the HsinChu-Taipei belt in the Taiwan province of China These cities share many success factors: low taxes, venture capital (VC), risk-taking start-up culture, business webs, physical infrastructure, IT-savvy local population, local “living laboratories,” good local markets, networking skills, activities and organizations for communities of in-terest, co-location of companies in various stages of development, flexible organizational structure, legal/accounting services, mergers and acquisitions activity for flow of skilled labour and intellectual property, local academic and research institutes, commercial partnerships between academia and industry, activist government policy via research funding and small business debt assistance, speed of business activity, presence of role models, hu-man talent in innovation, serial entrepreneurs, mar-keters, and managers
A recent UN Human Development Report ranked Bangalore as the only city among the top ten cen-tres of technological innovation to be located in a developing country However, while Bangalore gets a high ranking as a major technology hotspot, it faces several challenges and obstacles, includ-ing poor infrastructure, a massive digital divide,
TECH HOTSPOTS AND THEIR RATING (ON A SCALE OF 1-5)
Source: Rosenberg, 2002.
government bureaucracy, presence of just a few higher educational institutes, low research and development spending by IT companies, and high employee attrition especially at the level of team leaders Cultural divides have also grown between locals and outsiders, including non-resident Indians from abroad, who have flocked to the city’s hi-tech industry. (In 2007 the city was officially renamed “Bengaluru” to reflect the concerns of the local lan-guage movement, but the name Bangalore is still commonly used )
Bangalore’s global ambitions are thus threatened by its crumbling infrastructure, according to analysts and even ordinary citizens Scores of tall, massive apartments now dominate Bangalore’s skyline, a testimony to the real estate boom and expanding horizons of the IT spectrum, but many of them have inadequate water and power supplies and poor access roads Many companies use generators to compensate for power outages
A study by the Asian Development Bank found that among Indian cities with 5 million or more residents, Bangalore is the second fastest growing in terms of population, experiencing a population growth rate of 2.8 per cent a year. The study projects the popula-tion of Bangalore to increase from the current 6 mil-lion to nearly 10 million in 2020. Among Asia-Pacific cities with 5 million or more residents, Bangalore stands eighth in terms of rate of population growth (Dhaka, with an annual increase of 3 8%, tops the Asia-Pacific list.)
In order to deal with the problems associated with the rapid expansion of the city, State governments have been trying to obtain “Metropolitan City” sta-tus for Bangalore in order to become eligible for more central government funds A separate fund for infrastructure has also been established, not only to attract more investments to the city, but also to overcome the congestion caused by traffic. Upcoming projects include the Bangalore Metro Rail Project, Bangalore Mysore Expressway, and a number of ring roads, elevated expressways and underpasses
Startup activity
human Talent
venture Capital
global links
Univs. /R&D
Taxes/ Regul. Total
Britain/Cambridge 3 4 4 2 4 4 3 45
Finland/Helsinki 3 4 3 3 5 3 3 45
India/Bangalore 4 3 2 4 2 2 3 05
Taiwan province of China/HsinChu-Taipei 4 4 4 5 5 5 4 35

39
NoTeS
1 Ofori-Amoah, 2007 2 UN Department of Economic and Social Affairs (DESA), 2006 3 Veni 2005 4 Thanh, 2006 5 Pantelic, 2000 6 UN DESA, 2006 7 Census of India, 1991 8 UNFPA, 2007 9 Zhu 2004 10 ECLAC 2007 11 South African Cities Network, 2006 12 Kasarda & Crenshaw, 1991 13 Ibid 14 Urban primacy exists where the largest city has a size that exceeds the
expected size under the rank-size rule In an ideal system of cities, there is a lognormal frequency distribution by size, which forms a rank-size distribution There are several ways to measure “urban primacy” Some define it as a ratio of twice or three times the population size of the second-largest city Others use the ratio of twice the size of the combined second and third-largest cities In this Report, primate cities are considered as concentrations of more than 20 per cent of the country’s urban population
15 The sample comprised 37 cities in Africa, 57 cities in Latin America and the Caribbean and 151 cities in Asia
16 A maximum of 10 cities experiencing the fastest population growth per category of city size were selected in each country, using a matrix with various possible reasons for population growth Based on the results and frequencies of different factors, a table was prepared with the most frequent three factors: 1) administrative change; 2) economic reasons separated into three indicators: a) designation of economic zone; b) investments in infrastructure; c) service sector development; and 3) improvements in quality of life For each city, only one factor was taken into account (i e , designation of economic zone) despite the fact that in reality, more than one factor contributes to city growth (designation of economic zone plus infrastructure investments) In combination with economic reasons, quality of life was not selected as a main reason for growth Some cities with fast growth were not included in the analysis, either because they were not clear enough or not confirmed. This method should be considered as a preliminary qualitative approach to city growth analysis The sources of information were consultation with experts in cities or regions, advice from ECLAC and ESCAP professionals in the area, UN-HABITAT programme managers in a number of countries, two special advisers for China and India, city council web sites, specialized articles, national statistical web sites, and the like
17 Some academicians argue that coastal areas, and particularly port cities, are no longer playing the same determinant role as in the past in the economic development of cities However, leading thinkers note that the core coastal region has a mere 10 per cent of the world’s population but produces at least 35 per cent of the world gross national project. See Gallup, Sachs & Mellinger, 1998
18 In this sense, it is interesting to note that countries located in disadvantageous geographic areas, such as landlocked nations, are in typically poor, with the exception of a handful of countries in Western Europe that are deeply integrated into the regional European market and connected by different transport means See Gallup, Sachs & Mellinger, 1998
19 Urban growth in Gaborone is also explained by the reclassification of traditional villages and urban towns as “urban villages” This administrative process is a key factor in urban growth The share of “urban villages” in the urban population has increased from 10 per cent in 1981 to 60 per cent in 2001. Botswana, Central Statistics Office, website accessed in November 2007
20 Changwon, 2005 21 Shenzhen’s economy grew also at the fast rate of 16 3 per cent China
Statistical Yearbook 2002-2006, National Bureau of Statistics of China – 2002-2006 editions
22 National Bureau of Statistics of China (2002 - 2006), China Statistical Yearbook 2002 - 2006, Beijing.
23 Hu & Yueng, 1992 24 East Coast Development, South Coast Development, and West Coast
Development 25 From 1983 to 2000, annual growth in maquiladora employment and exports
averaged almost 14 per cent and 21 per cent, respectively At about 1 3 million workers, maquiladora employment represented 29 per cent of Mexico’s manufacturing jobs in 2000, up from slightly more than 7 per cent in 1983 Vargas, 2001
26 Except the city of Chihuahua, which grew at 2 per cent 27 Antipolis, 2002 28 Henry, 2004 29 Olds & Yeung, 2004 30 South African Cities Network, 2006 31 Harvey, 1989 32 World Bank, 2004b 33 A 1 per cent increase in the stock of infrastructure is associated with a 1 per
cent increase in GDP World Bank, 2004 34 Balk, McGranahan & Anderson, forthcoming 35 Small-sized cities concentrated 18 6 per cent of foreign direct investment
in 1990, and most of these cities (95 per cent) are located in the Eastern region Moreover, foreign investment from Hong Kong is mainly located in rural settlements of the Pearl River Delta that will contribute to the rapid rural urbanization of this area China Urban Statistical Yearbook, 1991
36 Department of the Interior and Local Government, the Philippines, UN-HABITAT & UNDP, 2007
37 Kennedy, 2007 38 Bazoglu, 2007 39 The city enjoys the best quality of life, with 17 square metres of parks per
resident compared to the national average of 5 sq m http://duns100 dundb co il/companies
40 This assessment included criteria such as incidence of theft and murder, number of hospital beds, length of life expectancy, cleanliness of roads and public open spaces, and competitiveness of the economy Bacolod, 2007
41 Davao city, 2007 42 Quote by Lim Byoung-Soo, Assistant Ministry of Culture and Tourism 43 The People’s Government of Lu’an, n d 44 Zhu, 2003 45 Lu’an City remained at county level until September 1999, when the
Lu’an Prefecture was removed and the City of Lu’an was promoted to the prefecture level The former area of the county level Lu’an City was divided into two parts and became Jin’an and Yu’an districts of the prefecture level Lu’an City In March of 2000, Lu’an City was put under the direct administration of Anhui Provincial Government The People’s Government of Lu’an, n d
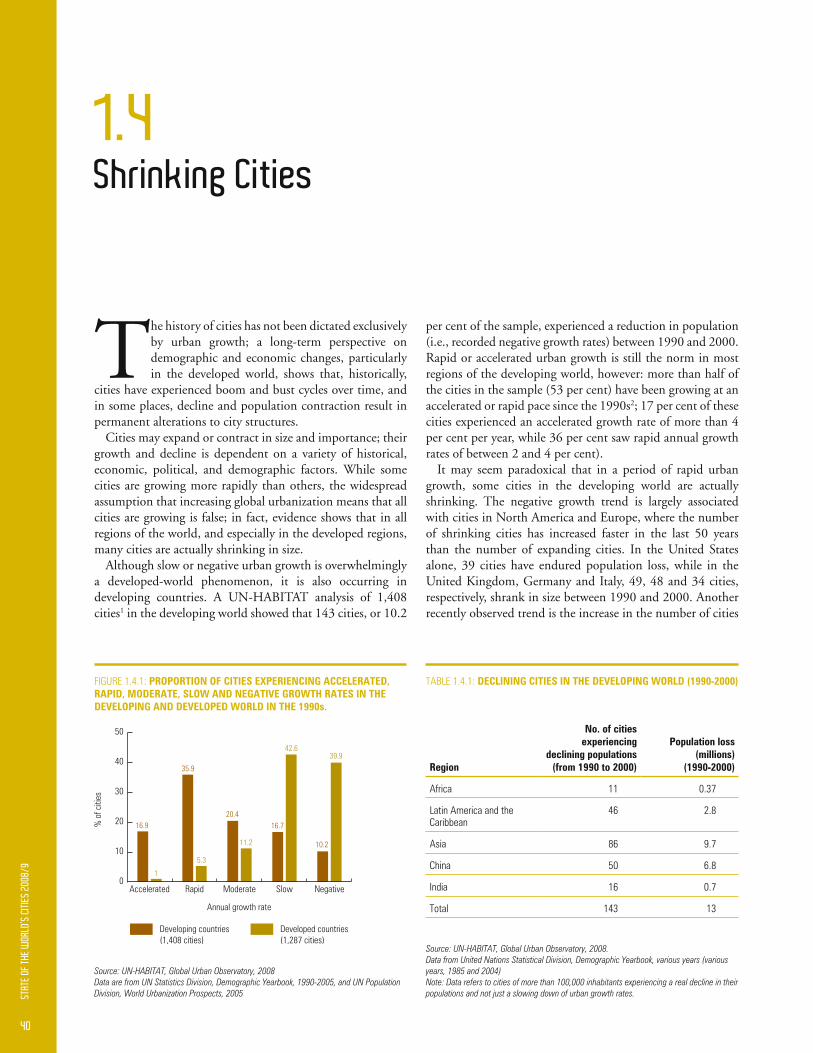
40
STAT
E OF
THE
WOR
LD’S
CIT
IES
2008
/9
The history of cities has not been dictated exclusively by urban growth; a long-term perspective on demographic and economic changes, particularly in the developed world, shows that, historically,
cities have experienced boom and bust cycles over time, and in some places, decline and population contraction result in permanent alterations to city structures.
Cities may expand or contract in size and importance; their growth and decline is dependent on a variety of historical, economic, political, and demographic factors. While some cities are growing more rapidly than others, the widespread assumption that increasing global urbanization means that all cities are growing is false; in fact, evidence shows that in all regions of the world, and especially in the developed regions, many cities are actually shrinking in size.
Although slow or negative urban growth is overwhelmingly a developed-world phenomenon, it is also occurring in developing countries. A UN-HABITAT analysis of 1,408 cities1 in the developing world showed that 143 cities, or 10.2
per cent of the sample, experienced a reduction in population (i.e., recorded negative growth rates) between 1990 and 2000. Rapid or accelerated urban growth is still the norm in most regions of the developing world, however: more than half of the cities in the sample (53 per cent) have been growing at an accelerated or rapid pace since the 1990s2; 17 per cent of these cities experienced an accelerated growth rate of more than 4 per cent per year, while 36 per cent saw rapid annual growth rates of between 2 and 4 per cent).
It may seem paradoxical that in a period of rapid urban growth, some cities in the developing world are actually shrinking. The negative growth trend is largely associated with cities in North America and Europe, where the number of shrinking cities has increased faster in the last 50 years than the number of expanding cities. In the United States alone, 39 cities have endured population loss, while in the United Kingdom, Germany and Italy, 49, 48 and 34 cities, respectively, shrank in size between 1990 and 2000. Another recently observed trend is the increase in the number of cities
1.4Shrinking Cities
FIGURE 1 4 1: pRopoRTIoN oF CITIeS eXpeRIeNCINg aCCeleRaTeD, RapID, MoDeRaTe, Slow aND NegaTIve gRowTh RaTeS IN The DevelopINg aND DevelopeD woRlD IN The 1990s.
Source: UN-HABITAT, Global Urban Observatory, 2008Data are from UN Statistics Division, Demographic Yearbook, 1990-2005, and UN Population Division, World Urbanization Prospects, 2005
TABLE 1 4 1: DeClININg CITIeS IN The DevelopINg woRlD (1990-2000)
Source: UN-HABITAT, Global Urban Observatory, 2008.Data from United Nations Statistical Division, Demographic Yearbook, various years (various years, 1985 and 2004) Note: Data refers to cities of more than 100,000 inhabitants experiencing a real decline in their populations and not just a slowing down of urban growth rates.
Region
No. of cities experiencing
declining populations (from 1990 to 2000)
population loss (millions)
(1990-2000)
Africa 11 0 37
Latin America and the Caribbean
46 2 8
Asia 86 9 7
China 50 6 8
India 16 0 7
Total 143 13
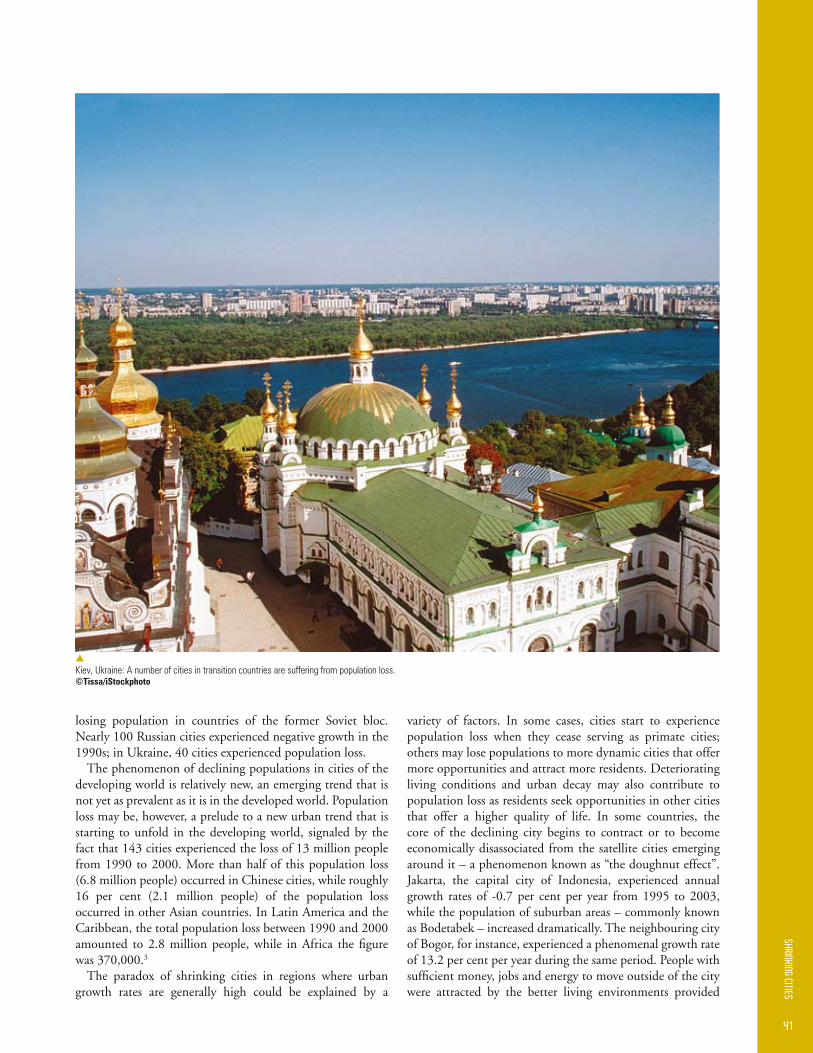
41
s
Kiev, Ukraine: A number of cities in transition countries are suffering from population loss ©Tissa/iStockphoto
losing population in countries of the former Soviet bloc. Nearly 100 Russian cities experienced negative growth in the 1990s; in Ukraine, 40 cities experienced population loss.
The phenomenon of declining populations in cities of the developing world is relatively new, an emerging trend that is not yet as prevalent as it is in the developed world. Population loss may be, however, a prelude to a new urban trend that is starting to unfold in the developing world, signaled by the fact that 143 cities experienced the loss of 13 million people from 1990 to 2000. More than half of this population loss (6.8 million people) occurred in Chinese cities, while roughly 16 per cent (2.1 million people) of the population loss occurred in other Asian countries. In Latin America and the Caribbean, the total population loss between 1990 and 2000 amounted to 2.8 million people, while in Africa the figure was 370,000.3
The paradox of shrinking cities in regions where urban growth rates are generally high could be explained by a
variety of factors. In some cases, cities start to experience population loss when they cease serving as primate cities; others may lose populations to more dynamic cities that offer more opportunities and attract more residents. Deteriorating living conditions and urban decay may also contribute to population loss as residents seek opportunities in other cities that offer a higher quality of life. In some countries, the core of the declining city begins to contract or to become economically disassociated from the satellite cities emerging around it – a phenomenon known as “the doughnut effect”. Jakarta, the capital city of Indonesia, experienced annual growth rates of -0.7 per cent per year from 1995 to 2003, while the population of suburban areas – commonly known as Bodetabek – increased dramatically. The neighbouring city of Bogor, for instance, experienced a phenomenal growth rate of 13.2 per cent per year during the same period. People with sufficient money, jobs and energy to move outside of the city were attracted by the better living environments provided

42
STAT
E OF
THE
WOR
LD’S
CIT
IES
2008
/9
by suburban enclave housing; simultaneously, the poor in Jakarta were relocated to the fringe areas to make room for the expansion of the formal sector in the central city.4
A similar phenomenon is evident in Seoul, which grew from a small, unknown capital of the Republic of Korea to one of the world’s large-population cities. Seoul started experiencing negative growth at a rate of -0.7 per cent per year in the 1990s. This transformation came about in a context of intensive suburbanization and sprawl into the neighbouring Gyeongii Province, which received 64 per cent of Seoul’s emigrants in 2005.5 In other cities, such as Shanghai in China, in-migration is responsible for much of the growth of the city, as natural population growth has been declining since 1995. In China, rapid urban growth rates in one part of the country are accompanied by slow or negative urban growth rates in other parts of the country. This is not only an outcome of demographic changes and population mobility, but in many cases is associated with uneven regional development.
Understanding which cities are experiencing a boom in terms of economic and demographic growth, and which cities are going through economic and population decline, is important for maximizing gains, locating or relocating investments and opportunities, and for planning for more sustainable and balanced regional development. Knowing which cities, parts of cities, metropolitan areas, and even regions are not growing – or are experiencing population loss – is essential for policymakers and urban planners, who need accurate data to anticipate trends, design recovery policies and rethink strategies for bringing opportunities to cities and preventing excessive out-migration.6
Growth and contraction are not two different phenomena; they are two sides of the same coin of urban change.7 Evidence about how these dual trends are changing urban areas today
can help shift thinking from a broad assumption that all cities are growing dynamics of city growth that are necessary for improving quality of life in all cities.8 City and regional planning requires new methods and techniques that respond to urban development, expansion and growth management, but also new methods and techniques that respond to decline or out-migration. “Smart planning for growth” should be combined with “smart planning for contraction” if more harmonious urban and regional development is to be achieved.
The phenomenon of shrinking urban populations can be perceived as a sign of a new era in the history of some cities, in which the initial impulse of all-embracing and ever-accelerating urbanization gives way to a more complex, subtle and ambivalent process.9
Shrinking cities are often associated with economic and political failure. Until recently, many European cities were reluctant to even admit that they were shrinking in size.10 The primary assumption was that people who move out of cities “vote with their feet”, making judgments about the quality of life in the cities they leave behind. This is true to some extent: when a city shrinks in size, the reasons are usually economic. In most shrinking cities, unemployment is high and business opportunities are either unexploited or unavailable.11
Yet, urban decline occurs even in regions that prospering. In some cases, the reasons have to do with urban environmental degradation, inner-city decay and suburbanization. The reality today is that not even big urban centers are protected from population loss. They are also threatened by some of the urban and environmental manifestations of economic and population decline, such as abandonment of residential areas and obsolete industrial areas, wastage of infrastructure and deterioration of the inner city, among others.
s
Years of civil war in Afghanistan led to abandonment of residential and commercial areas in cities such as Kabul ©Rasna warah
43
In order to arrest out-migration from cities, poli-cymakers and urban planners should consider the following:
• Management of shrinking cities requires in-novative skills and strategies for “keeping people”, or containing population flight.
• Flexible design and placement of assets (such as industrial infrastructure, commercial build-ings, and infrastructure for water, sewage, electricity, and industrial land) facilitate trans-formation into new uses when necessary
• Regional connectivity and networking schemes aid cooperative public policy in changing urban areas
• Public-private partnerships allow for innova-tion, renewal and for adapting fiscal bases of cities
• Knowledge transfer and economic diversifica-tion assist regions in moving from outdated economic activities to new businesses and sources of revenue
• Urban policies should facilitate planning for in-dustrial environmental impacts in the declining phases of cities, and for management of the environmental legacy of industrial activities
• Issues surrounding the environmental legacy of shrinking cities are a global phenomenon: planners and policymakers need to be aware of the environmental changes that lead to shrinkage (drought, climate change); and the ways in which shrinkage leads to environmen-tal changes (mining, heavy industry)
planning for growth while anticipating decline
Martinez-Fernandez, MC and C-T Wu (2007) Urban Development in a Different Reality, Berlin 2006.
Shrinking cities in the developing world
In 2000, nearly 100 million people were living in cities whose populations were declining, representing 8.3 per cent of the total urban population in developing nations. Half of the population loss in shrinking cities took place in big cities of between 1 and 5 million, and almost one-fourth in intermediate cities of 500,000 to 1 million. These cities are not only experiencing a dramatic decline in their populations, but also in their economic and social bases.
Asian cities are the most affected by population decline; they account for 60 per cent of all shrinking cities in the developing world. Most of these cities are in China; Indian cities account for approximately 20 per cent. The cities experiencing population decline in the two countries differ in terms of size: in China, urban contraction concerns intermediate and big cities, and in India, it occurs mostly in small urban centers. In some cities, population loss is seasonal, often related to harvesting or planting seasons. Many rural migrants find temporary work in cities and return to their villages or small towns in time for the harvesting season. In these cases, urban population sizes of both the cities and the villages grow or contract, depending on the time of year and the season.
In the cities of Latin America and the Caribbean, growth slowed considerably in the late 1980s – a trend that has been amply documented. The reality of urban population loss in the region, however, still goes largely unrecognized, with the exception of some studies that find urban sprawl and increasing suburbanization are responsible for population decline in specific parts of cities. UN-HABITAT’s analysis shows that some 46 cities in the region, mainly in Brazil, Mexico and Venezuela, experienced population loss in the 1990s.
In African cities, signs of decline are almost negligible. Some urban areas, however, are either experiencing slow growth or are suffering from population loss. This phenomenon is confined mainly to small towns and cities. The UN-HABITAT analysis of urban growth from 1990 to 2000 reveals that of the 11 African cities that experienced declining populations,
10 were small cities.12 It is possible that some cities lost populations as a result of war, disasters or civil conflicts, but in most cases, population loss has been a transitory process. Recent studies on migration and urbanization in Africa have produced empirical evidence demonstrating new patterns of return migration from urban to rural areas that may have an impact on population decline in the future. These patterns are more visible in once-booming economies such as Côte d’Ivoire, Cameroon and Zimbabwe and are apparently fuelled by the high cost of living in urban areas, unemployment and the relatively low cost of food, education and housing in rural areas.13 In many African countries, migration to a city is often temporary, as many migrants retain their rural roots even while working in the city. This also explains why the majority of woman-headed households in Africa are found in rural areas, as males tend to migrate to cities, leaving their wives and children behind.14
Why are some cities in developingcountries shrinking?
The UN-HABITAT analysis of 143 cities with declining populations in the developing world provides a preliminary overview of the causes behind these changes, which can be grouped into four types.15
Suburbanization and the growth of nucleations
This process involves the systematic rapid growth of areas on the outskirts of cities, while growth in the inner core slows down, remains stagnant or declines. Suburbanization is associated more with urban sprawl than with urban decline per se. However, the movement of populations out of a city’s borders may not always mean that residents are moving to peri-urban municipalities or to the countryside; their movement may also be to neighbouring cities with

44
STAT
E OF
THE
WOR
LD’S
CIT
IES
2008
/9
different politico-administrative structures. Many formerly monocentric cities in the developing world are becoming increasingly polycentric, developing urban nucleations with their own downtowns, employment centres and other features of independent cities. These adjacent urban areas expand their populations, often at the expense of the original city that experiences a decline in population, accompanied by a decline in economic activities and opportunities. In other cases, economic growth provokes land use changes promoted by business ventures that inflate land values in some parts of the city; this process ends up displacing poor and middle-income residents to neighbouring cities, thereby leading to a reduction in the number of inhabitants in the original city.
Migration from the central city to suburban areas or neighbouring cities generates simultaneous growth and decline, known as the “doughnut effect”. This type of outward sprawl is often precipitated by middle- or high-income families who move out of the inner city to less-dense neighbouring cities that have better amenities.
Urban sprawl does not always generate low-density suburban areas and new urban nucleations. The City of La Paz in Bolivia, for instance, lost an average of 10,000 people every year from 1989 to 2003 to the nearby El Alto settlement, owing to lack of affordable housing in the capital city and the difficulties of expanding a city that is located in a small, steep basin. Those who moved were mostly poor urban residents. Urban contraction is expected to continue in La Paz, as the city has been experiencing a negative annual growth rate of approximately -1.1 per cent since the 1990s.
Studies of urbanization patterns in the developing world show that urban sprawl, suburbanization and the growth of nucleations will continue as the globalization of consumption patterns produces increasing homogeneity in the cities of the South. This trend will be further exacerbated by improvements in commuting technology and infrastructure, and the development of behaviours that drastically affect the dynamics of population distribution in various cities.
Economic decline
A number of cities are experiencing dramatic declines in their economic and social bases, which is related to a far-reaching structural crisis. Others are affected by long-term economic depressions or lack of economic impetus. These cities have lost or are losing significant numbers of people as a result of economic changes. The Indonesian cities of Pekalongan and Tegal experienced negative urban growth of -1.3 and -2.2 per cent, respectively, from 1995 to 2003, owing to the decline of processing industries; in both cases, the labour force migrated to the nearby larger cities of Semarang and Jakarta.
In most cases, depopulation is provoked by obsolete industries and incremental declines in single factory-based
industries, as evident in the small cities of Linhares, Brazil, and Valera, Venezuela, where the number of residents decreased by 2 per cent in the 1990s as a result of the decline of the main agricultural industry. The closing of a brick factory in Orizaba, Mexico, and the difficulties in reactivating the economy through new industries, explains the dramatic decline of population in this city that witnessed a reduction of more than 100,000 inhabitants at an annual growth rate of -6.5 per cent from 1990 to 2000. Likewise, the Chinese cities of Fuxin and Kaiyuan were affected by over-mining of coal that caused internal migrations to other cities; the cities subsequently lost 1.7 and 1 per cent of their populations, respectively. The copper mining city of Mufulira in Zambia experienced a massive economic decline in the late 1980s and 1990s and a progressive reduction of inhabitants in the same
decade; population decrease in this city was largely a result of investments that halted production and drastically reduced social benefits and to mine workers, impacting their well-being.
Economic decline in one city can also lead to prosperity in another as capital and infrastructure investments move between regions and cities. This was the case in the city of São Caetano do Sul, part of the São Paulo metro area in Brazil. The city, selected as an industrial development pole by the federal government, benefited from the government’s infrastructural and industrial development during the second half of the 20th century, but was negatively affected by
the building of a new highway in the neighbouring district of San Bernando and the transfer of many businesses to a new industrial park located along the highway in the 1990s. The resulting economic decline has had a devastating effect on São Caetano in terms of physical decay, social problems and population loss, as the city experienced a negative growth rate of -3.4 per cent during this period.
A similar simultaneous loss of economic dynamism, disinvestment and increasing unemployment in one city and prosperous development in nearby agglomerations or other competitive cities in the region are observed in Barra Mansa, Brazil, the port of Coatzacoalcos, and the cities of Tampico and Torreon in Mexico that lost population by -2.1, -6.5, -3.8 and -3 per cent, respectively, in the 1990s. In these, as in other cities, urban decline is prompted by a loss of employment opportunities, leading to an exodus of both high- and low-income residents, which leaves the city and its region with very few resources in terms of employment and fiscal base. In many cases, the decline – and possible renewal – of cities cannot be divorced from their wider regional contexts. Declining cities are almost always concentrated in declining regions. The decay of a cluster of four coal-mining cities located in the Taeback Mountain Region in South Korea (Taeback, Jeongsun, Samcheok, and Youngwol) further illustrates this point. The import of cheaper oil and coal from international markets and the rationalization in
Many formerly mono-centric cities in the
developing world are becoming increasingly polycentric, developing urban nucleations with their own downtowns, employment centres and other features of independent cities
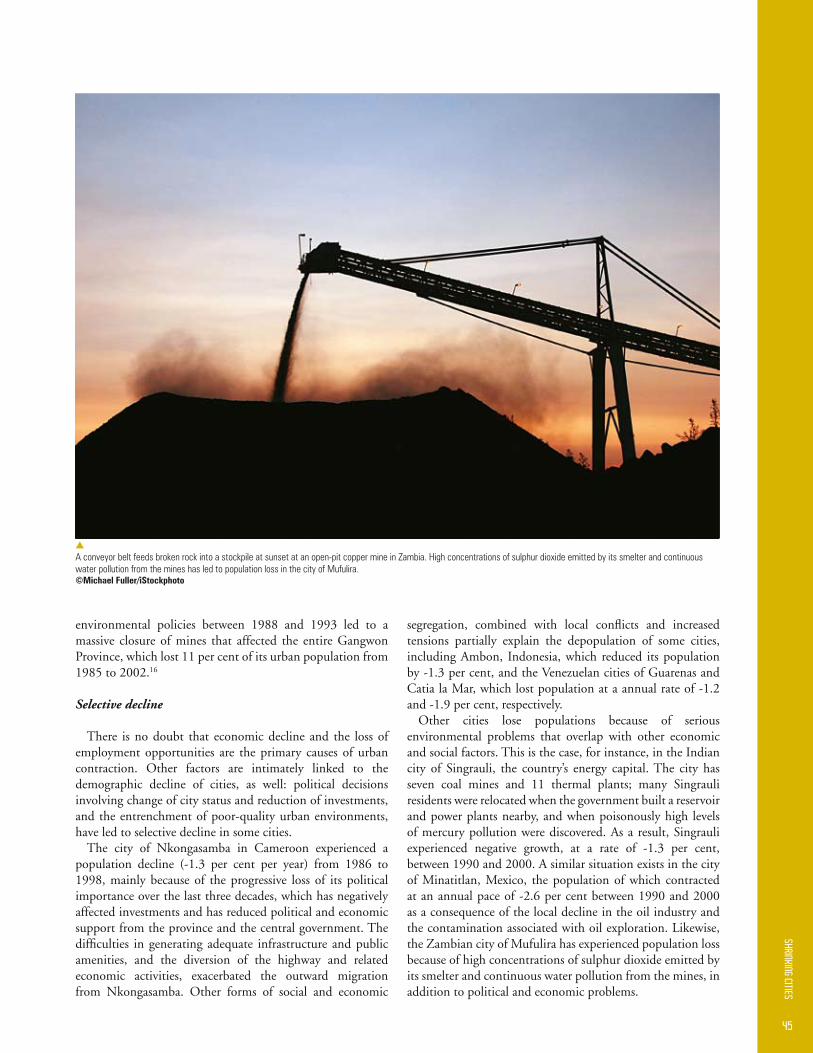
45
s
A conveyor belt feeds broken rock into a stockpile at sunset at an open-pit copper mine in Zambia High concentrations of sulphur dioxide emitted by its smelter and continuous water pollution from the mines has led to population loss in the city of Mufulira ©Michael Fuller/iStockphoto
environmental policies between 1988 and 1993 led to a massive closure of mines that affected the entire Gangwon Province, which lost 11 per cent of its urban population from 1985 to 2002.16
Selective decline
There is no doubt that economic decline and the loss of employment opportunities are the primary causes of urban contraction. Other factors are intimately linked to the demographic decline of cities, as well: political decisions involving change of city status and reduction of investments, and the entrenchment of poor-quality urban environments, have led to selective decline in some cities.
The city of Nkongasamba in Cameroon experienced a population decline (-1.3 per cent per year) from 1986 to 1998, mainly because of the progressive loss of its political importance over the last three decades, which has negatively affected investments and has reduced political and economic support from the province and the central government. The difficulties in generating adequate infrastructure and public amenities, and the diversion of the highway and related economic activities, exacerbated the outward migration from Nkongasamba. Other forms of social and economic
segregation, combined with local conflicts and increased tensions partially explain the depopulation of some cities, including Ambon, Indonesia, which reduced its population by -1.3 per cent, and the Venezuelan cities of Guarenas and Catia la Mar, which lost population at a annual rate of -1.2 and -1.9 per cent, respectively.
Other cities lose populations because of serious environmental problems that overlap with other economic and social factors. This is the case, for instance, in the Indian city of Singrauli, the country’s energy capital. The city has seven coal mines and 11 thermal plants; many Singrauli residents were relocated when the government built a reservoir and power plants nearby, and when poisonously high levels of mercury pollution were discovered. As a result, Singrauli experienced negative growth, at a rate of -1.3 per cent, between 1990 and 2000. A similar situation exists in the city of Minatitlan, Mexico, the population of which contracted at an annual pace of -2.6 per cent between 1990 and 2000 as a consequence of the local decline in the oil industry and the contamination associated with oil exploration. Likewise, the Zambian city of Mufulira has experienced population loss because of high concentrations of sulphur dioxide emitted by its smelter and continuous water pollution from the mines, in addition to political and economic problems.

46
STAT
E OF
THE
WOR
LD’S
CIT
IES
2008
/9
s
An abandoned building in Philadelphia, U S A : Economic decline often leads to population decline in cities ©iStockphoto
Reclassification of cities
Cities in the developing world grow through natural increase, migrations and the reclassification of rural areas as urban centres. Through reclassification, the city’s boundaries are redefined, villages abolished and towns established. In recent years, the annexation of surrounding areas by cities has become one of the main determinants of urban growth and urbanization.
In some cases, the opposite happens: adoption of new administrative rules and settlement definitions can lead to urban contraction, simply as a consequence of boundary drawing. As cities are divided into smaller administrative urban areas, their physical space and number of inhabitants shrinks. This has happened in several Chinese cities – namely, Chaozhou, Yancheng, Jingmen, Pingxiang, Xiaogan, and Yulin–Guangxi – which were reduced from a prefecture level, with a population of more than 1 million inhabitants, to county-level cities and counties with populations of approximately half a million people. Other intermediate Chinese cities with populations of between 500,000 and 1 million residents were also divided into smaller urban administrative units, leading to population
losses that varied from 9 to 1 per cent, particularly in the cities of Heyuan, Jincheng, Qingyuan, Yangiiang, Quijing, Deyang, and Huaihua. In other cases, the creation of new political regions and municipalities near a city provokes loss of population in the existing city, as happened with Nova Iguaçu in Brazil, which reduced its population by -6.2 per cent with the creation of Belford Roxo, Querimados, Japeri, and Mesquita municipalities in the beginning of the 1990s.
Is urban contraction a trend of the future?
While debate on the consequences of shrinking cities is intense in North America and Western and Central Europe, it is not yet a well-recognized issue in the developing world. The problem of shrinking cities in developing regions is woefully underrepresented in international comparative research despite the links between urban population growth and decline. This report provides a first insight into the scope of the urban contraction process in the developing world and also explores some of the different possible causes for it, producing a preliminary typology aimed at better understanding this phenomenon.
47
NoTeS
The municipality of Leinefelde-Worbis in the for-mer East Germany has succeeded in addressing the problems faced by shrinking cities through an innovative and integrated participatory ap-proach to urban regeneration The living envi-ronment has been significantly upgraded, with redundant housing stock demolished and more than 2,500 apartments refurbished to high envi-ronmental standards. As a result of the project, the economy has revitalized and depopulation trends have gradually been reversed
The “ZukunftsWerkStadt” project aimed to achieve sustainable urban development in the context of the dramatic changes in East Germany after reunification. It sought to dramatically im-prove living conditions, urban infrastructure and the urban environment; create new job opportu-nities; promote affordable and attractive housing opportunities in a diversified and balanced hous-ing market; improve social and economic stabil-ity; and encourage active community life
The creation of employment has been a key as-pect of the approach, as has the revitalization of infrastructure, both physical and social The
improved living conditions and resurgent local economy have created a base for social and fi-nancial stability High-quality public services and infrastructure, including access to good schools, an efficient and convenient public transport sys-tem and facilities for sports and leisure pursuits, have made the city attractive to new migrants and encouraged residents to stay The munici-pality’s integrated approach and work with pri-vate partners created essential conditions for sustainable private investment in the locality, and the new urban environment is attracting new residents
A range of options were developed to deal with the municipality’s various housing problems With growing unemployment rates, many inhab-itants of this small town, comprising just 20,000 inhabitants, had left for other more prosperous regions in Germany The low-quality, standard-ized prefabricated units they left behind made up the bulk of the housing stock Architectural com-petitions were held for all key projects and high environmental standards were applied through-out, whether for new construction, refurbish-ment or demolition of surplus apartments
The project strategy has given residents, land-lords, businesses and the municipality a positive economic outlook The spatial anonymity of socialist urbanism has been replaced with clear distinctions between private and public spaces Different housing types and sizes have been de-veloped to encourage diversity
The investment has been largely absorbed by the local building trade and the job market, which has been advantageous to the local community Leinefelde-Worbis currently hosts 1,200 businesses, and its unemployment figure of 15.1 per cent is significantly lower than the regional (Thuringia) average of 18 1 per cent The municipal debt is one-third lower than the regional average, despite its below-average per capita tax income Families with young children are taking advantage of the improved schooling and living environment, and elderly and retired people are utilizing the improved local services In addition, 1,300 people commute regularly into the town, and the 6 per cent increase in population in 2006 indicates that people are re-turning to the area
Urban regeneration halts population decline in a european town
Source: Building and Social Housing Foundation, 2008.
1 The rationale for choosing this sample of cities is explained in Chapter 1 2 2 Calculations based on years for which data exists 3 Data on the decline of population in the city refers to the entire city or a part
of the city in a metropolitan region 4 Indonesia’s Urban Studies, 2007 and Rustiadi & Panuju, n.d. 5 National Statistics Office South Korea, 2005. 6 Refer to various documents of the Shrinking Cities Association 7 Martinez Fernandez & Chung-Tong, 2007 8 Ibid 9 Sitar & Sverdlov 10 In the last five years, the situation has changed significantly. The term
“shrinkage” has become common across Europe Today, for instance, innumerable activities and events in Germany deal with the shrinkage issue
Refer to Thorsten, 2006 11 Delken, 2007 12 Yet, data in this region is quite questionable not only because of the lack of
consistent definitions and problems of city boundaries that are common to other regions, but also because of the structural weakness of the statistical systems
13 Beauchemin & Bocquier, 2004 14 UN-HABITAT, 2006a 15 Wiechmann Thorsten suggests a typology based on four types:
suburbanization, industrial transformation, selective collapses, and political strategies Refer to the Thorsten, 2006
16 Shin, 2006
At present, it is difficult to predict whether the trend of urban decline in the cities of the developing world will continue into the future. It may be that contraction represents a broader phenomenon of an urban life cycle that is only emerging now. Declining fertility rates coupled with changes in rural-to-urban migration flows may contribute to the decline of populations in some towns and cities. From a physical
perspective, shrinking cities are characterized by abandoned or vacant commercial sites, deserted or unoccupied houses, wasted infrastructure, and neighbourhoods in physical decay. This phenomenon could be arrested through strategies that enhance the liveability and economic viability of cities, and through diversification of economic activities to attract people and investments.