state of literacy - education for all in india...state of literacy provisional population totals –...
TRANSCRIPT
6STATE OF LITERACY
Figures ! Maps " Tables/Statements # Notes
98
6State of Literacy
Literacy level and educational attainment are vital indicators of development in a society. Attainment of universal primary education is one of the Millennium Development Goals of the United Nations to be achieved by the year 2015. Planning Commission has also targeted in the eleventh Five Year Plan to increase literacy rate of persons of age 7 years or more to 85% and reducing gender gap in literacy to 10 percentage points by 2011-12. Literacy rate and educational development are considered to be key variables a�ecting demographic indicators like fertility, mortality (especially infant mortality) rate and migration. It greatly contributes in improving quality of life, particularly with regard to life expectancy, infant mortality, learning levels and nutritional levels of children. Higher level of literacy and educational development lead to greater awareness on the one hand and help people in acquiring new skills on the other.
LITERATES AND ILLITERATES
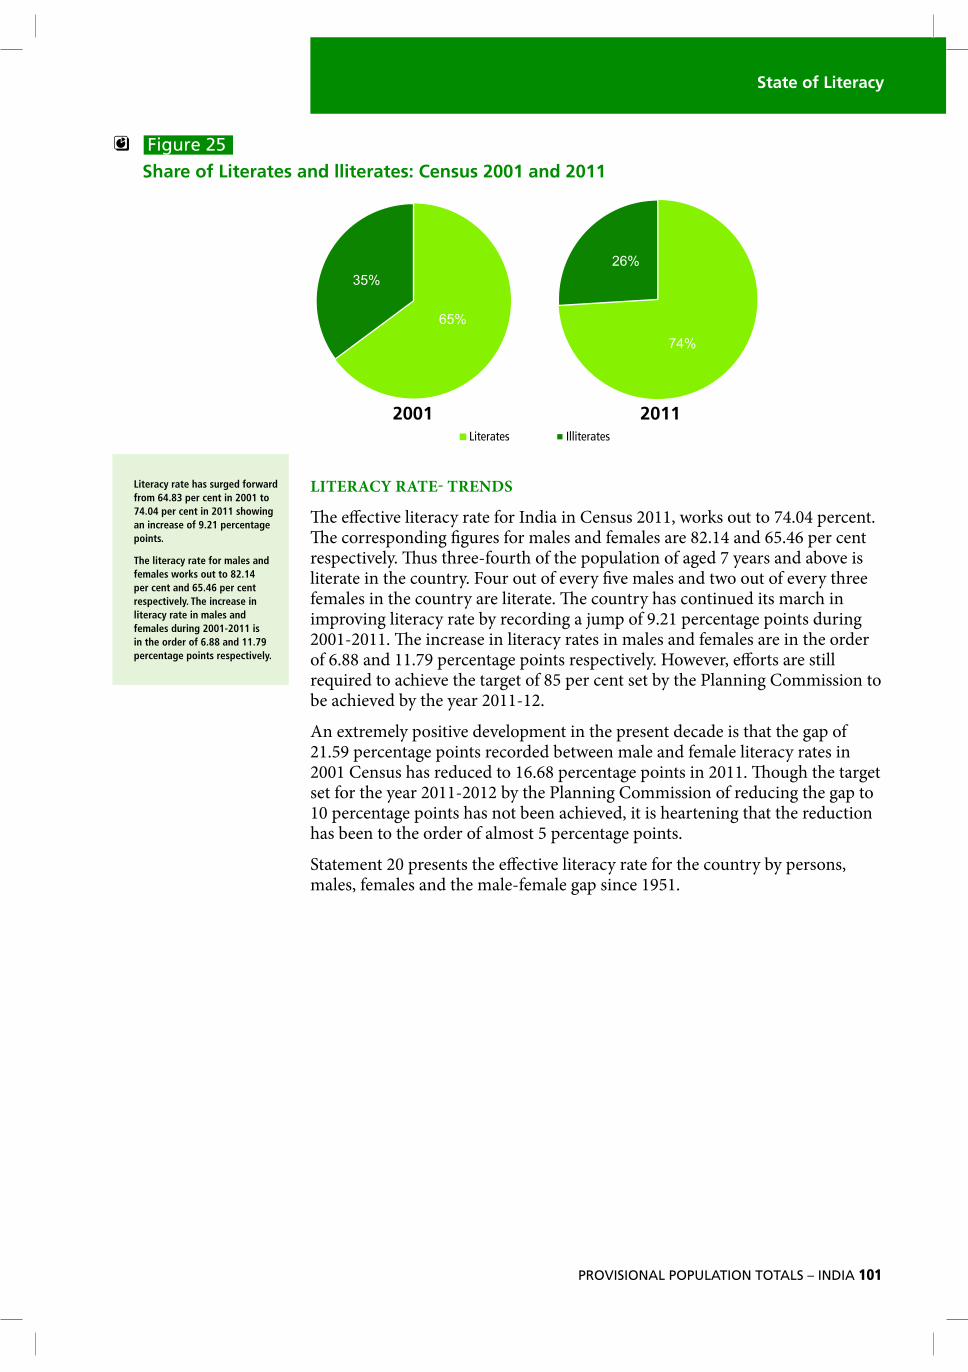
!e number of literates and illiterates aged seven and above in India as per the provisional population totals of Census 2011 is 778,454,120 and 272,950,015 respectively. !ere has been a marked improvement in the proportion of literates in the last decade. Literates in 2011 constitute 74 per cent of the total population aged seven and above as compared to 65 percent in 2001. On the other hand, illiterates form 26 per cent of the total population in 2011 as compared to 35 percent in 2001. In absolute terms, 217,700,941 additional persons have become literate during the decade 2001-2011. A signi"cant milestone reached in Census 2011, is that the total number of illiterates has come down from 304,146,862 in 2001 to 272,950,015-a decline of 31,196,847 persons. Before analysing further trends, it would be apt to discuss certain underlying concepts and de"nitions regarding Literacy in the Census of India.
As per provisional population
totals of Census 2011, literates
constitute 74 per cent of the total
population aged seven and above
and illiterates form 26 per cent.
A significant milestone reached
in Census 2011 is that a decline
of 31,196,847 among illiterates is
noted.
State of Literacy
PROVISIONAL POPULATION TOTALS – INDIA 99
CONCEPTS AND DEFINITIONS
Literates and Illiterates- Concept
Information on literacy is canvassed regarding every individual in the Census. For the purposes of Census, a person aged seven and above, who can both read and write with understanding in any language, is treated as literate. A person, who can only read but cannot write, is not literate. In the Censuses prior to 1991, children below "ve years of age were necessarily treated as illiterates.
!e age limit was raised to 7 years based on the advice of experts that the ability to read and write with understanding is not ordinarily achieved until that age. It was, therefore decided at the 1991 Census that all children in the age group 0-6, would be treated as illiterate by de"nition and the population aged seven years and above only would be classi"ed as literate or illiterate. !e same criterion has been retained in the Censuses of 2001 and 2011. It should be clearly understood that it is not necessary that to be treated as literate, a person should have received any formal education or acquired any minimum educational standard.
LITERACY RATE - DEFINITION
In earlier Censuses up to 1981, it was customary to work out the literacy rate taking into account the total population. Since literacy rate is more meaningful if the sub-population in the age group 0-6 is excluded from the total population, it was decided in 1991 to calculate literacy rate for the population seven years and above. !e same concept has been retained in all Censuses since 1991.
!e literacy rate taking into account the total population in the denominator has now been termed as ‘crude literacy rate’, while the literacy rate calculated taking into account the 7 and above population in the denominator is called the e�ective literacy rate. !e formula for computing crude literacy rate and e�ective literacy rate are as follows:
Number of Literate persons X 100 Crude Literacy Rate = _________________________________________
Total Population
Number of Literate persons aged 7 and above X 100 Effective Literacy Rate = _________________________________________
Population aged 7 and above
E�ective literacy rate and literacy rate have been used interchangably in this chapter.
LITERATES AND ILLITERATES BY GENDER
‘Educate one man, you educate one person, but educate a woman and you educate a whole civilisation’.
-Mahatma Gandhi
As per the provisional population totals of Census 2011, out of the provisional total population of 1,210,193,422, the number of persons aged seven years and above is 1,051,404,135. Out of this, 778,454,120 are literates and 272,950,015 are illiterates. !ere has been an increase of 186,504,094 persons in the age group seven years and above during 2001-2011, while 217,700,941 additional persons have become literate during the decade.
100
A signi"cant milestone reached in Census 2011, is that the total number of illiterates has come down from 304,146,862 in 2001 to 272,950,015 in 2011, showing a decline of 31,196,847 persons.
One of the interesting features of Census 2011 is that out of total of 217,700,941 literates added during the decade, females (110,069,001) out number males (107,631,940). A reverse trend was noticed during 1991-2001. !e decadal increase in number of literates among males is of 31.98 percentage points while the corresponding increase in case of females is of 49.10 percentage points.
A notable feature is that out of the total decrease of 31,196,847 in the number of illiterates, the females (17,122,197) out number males (14,074,650). !e above two changes are a clear indication of the fact that the gender gap in literacy is shrinking in the country. !is trend of rising female literates will have far reaching consequences on the development of society.
Figure 25 gives a comparative picture of literacy and illiteracy in the country in 2001 and 2011 censuses.
Table 2 presents the total population, child population in the age group 0-6, literates and literacy rates for the country and the States and Union Territories as reported at the Census, 2011.
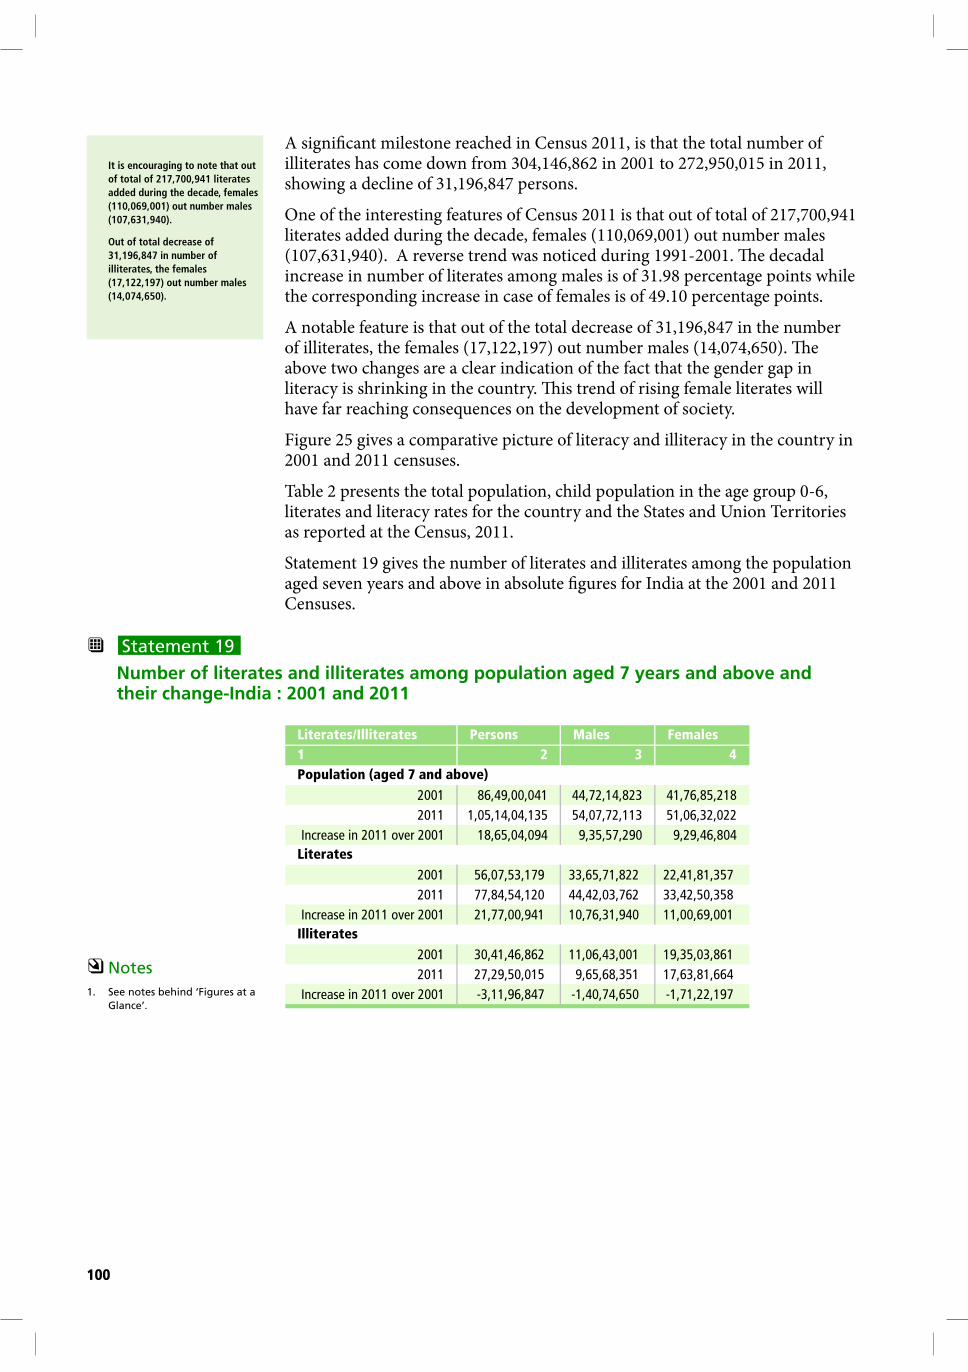
Statement 19 gives the number of literates and illiterates among the population aged seven years and above in absolute "gures for India at the 2001 and 2011 Censuses.
" Statement 19
Number of literates and illiterates among population aged 7 years and above and their change-India : 2001 and 2011
Literates/Illiterates Persons Males Females
1 2 3 4
Population (aged 7 and above)
2001 86,49,00,041 44,72,14,823 41,76,85,218
2011 1,05,14,04,135 54,07,72,113 51,06,32,022
Increase in 2011 over 2001 18,65,04,094 9,35,57,290 9,29,46,804
Literates
2001 56,07,53,179 33,65,71,822 22,41,81,357
2011 77,84,54,120 44,42,03,762 33,42,50,358
Increase in 2011 over 2001 21,77,00,941 10,76,31,940 11,00,69,001
Illiterates
2001 30,41,46,862 11,06,43,001 19,35,03,861
2011 27,29,50,015 9,65,68,351 17,63,81,664
Increase in 2011 over 2001 -3,11,96,847 -1,40,74,650 -1,71,22,197
Note:
# Notes
1. See notes behind ‘Figures at a
Glance’.
It is encouraging to note that out
of total of 217,700,941 literates
added during the decade, females
(110,069,001) out number males
(107,631,940).
Out of total decrease of
31,196,847 in number of
illiterates, the females
(17,122,197) out number males
(14,074,650).
State of Literacy
PROVISIONAL POPULATION TOTALS – INDIA 101
Figure 25
Share of Literates and lliterates: Census 2001 and 2011
LITERACY RATE- TRENDS
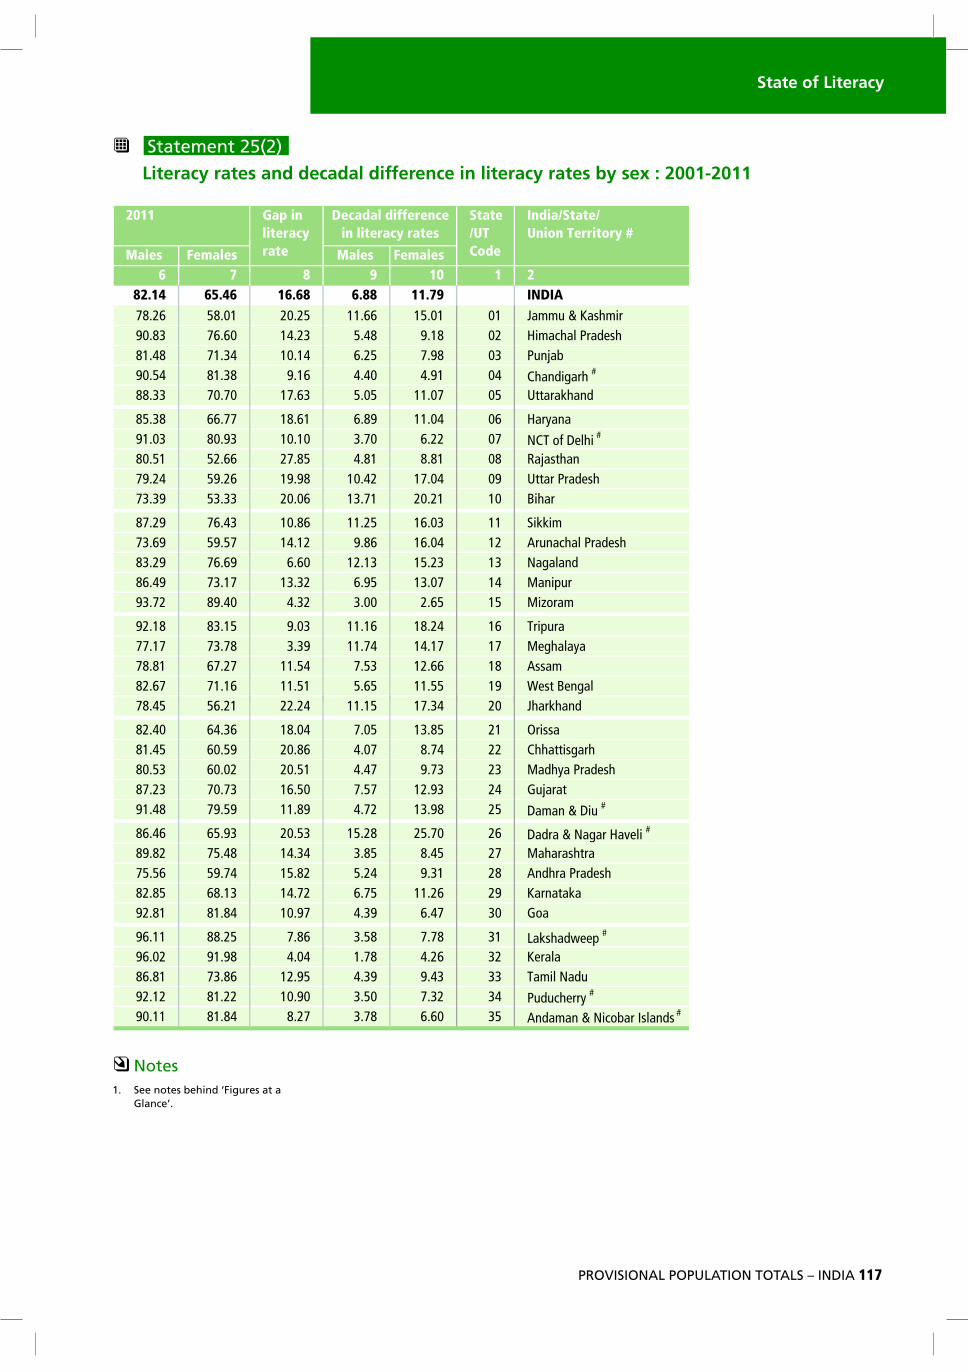
!e e�ective literacy rate for India in Census 2011, works out to 74.04 percent. !e corresponding "gures for males and females are 82.14 and 65.46 per cent respectively. !us three-fourth of the population of aged 7 years and above is literate in the country. Four out of every "ve males and two out of every three females in the country are literate. !e country has continued its march in improving literacy rate by recording a jump of 9.21 percentage points during 2001-2011. !e increase in literacy rates in males and females are in the order of 6.88 and 11.79 percentage points respectively. However, e�orts are still required to achieve the target of 85 per cent set by the Planning Commission to be achieved by the year 2011-12.
An extremely positive development in the present decade is that the gap of 21.59 percentage points recorded between male and female literacy rates in 2001 Census has reduced to 16.68 percentage points in 2011. !ough the target set for the year 2011-2012 by the Planning Commission of reducing the gap to 10 percentage points has not been achieved, it is heartening that the reduction has been to the order of almost 5 percentage points.
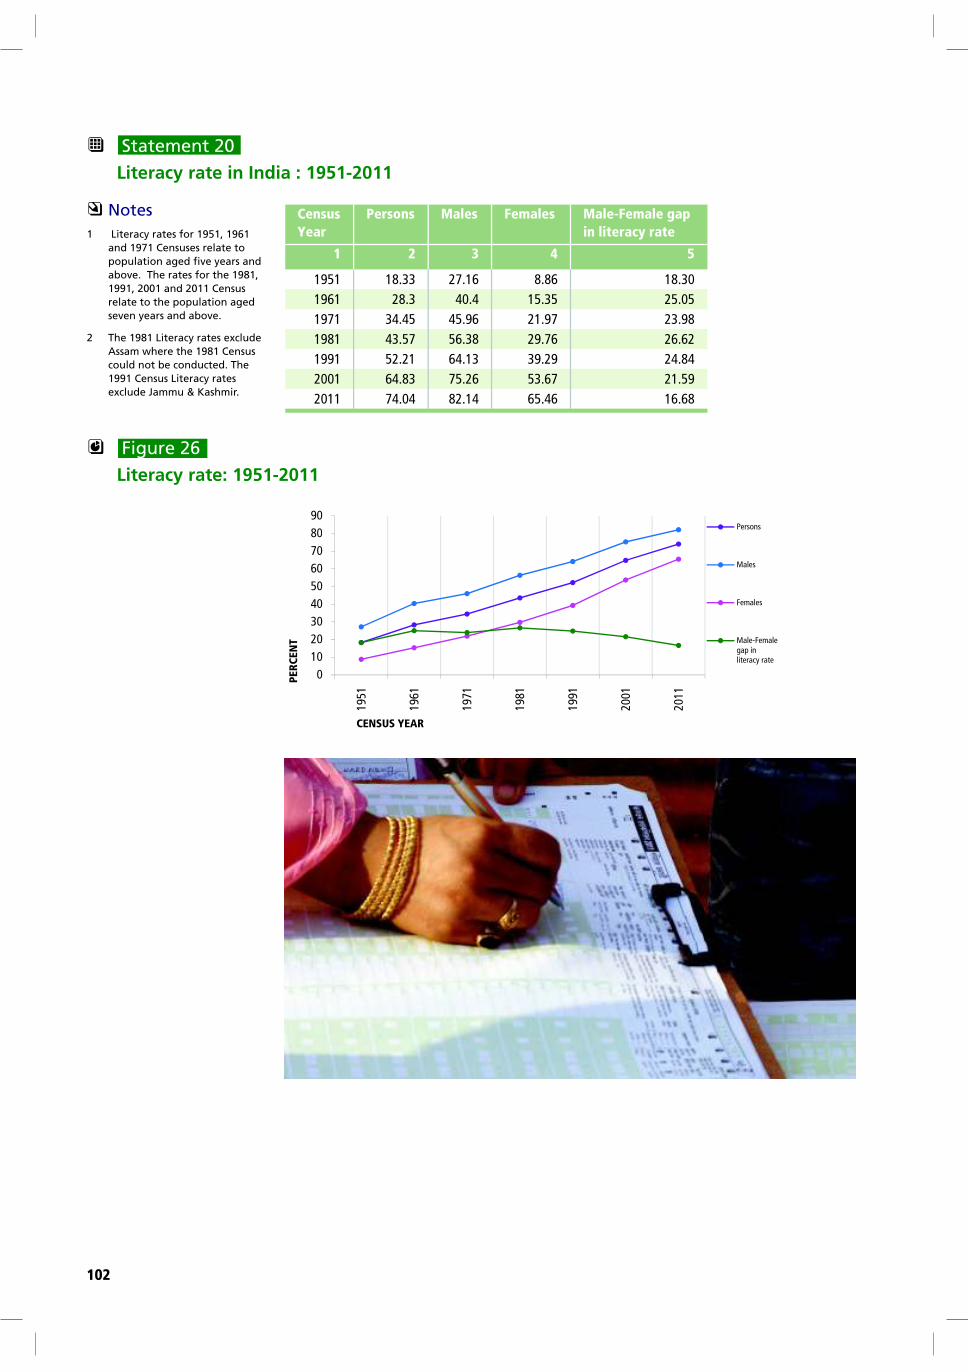
Statement 20 presents the e�ective literacy rate for the country by persons, males, females and the male-female gap since 1951.
65%
35%
26%
74%
Literacy rate has surged forward
from 64.83 per cent in 2001 to
74.04 per cent in 2011 showing
an increase of 9.21 percentage
points.
The literacy rate for males and
females works out to 82.14
per cent and 65.46 per cent
respectively. The increase in
literacy rate in males and
females during 2001-2011 is
in the order of 6.88 and 11.79
percentage points respectively.
Literates Illiterates
2001 2011
102
" Statement 20
Literacy rate in India : 1951-2011
# Notes
1 Literacy rates for 1951, 1961
and 1971 Censuses relate to
population aged five years and
above. The rates for the 1981,
1991, 2001 and 2011 Census
relate to the population aged
seven years and above.
2 The 1981 Literacy rates exclude
Assam where the 1981 Census
could not be conducted. The
1991 Census Literacy rates
exclude Jammu & Kashmir.
Figure 26
Literacy rate: 1951-2011
Census
Year
Persons Males Females Male-Female gap
in literacy rate
1 2 3 4 5
1951 18.33 27.16 8.86 18.30
1961 28.3 40.4 15.35 25.05
1971 34.45 45.96 21.97 23.98
1981 43.57 56.38 29.76 26.62
1991 52.21 64.13 39.29 24.84
2001 64.83 75.26 53.67 21.59
2011 74.04 82.14 65.46 16.68
.80
90Persons
10
20
30
40
50
60
70
80
RC
EN
T
Persons
Males
Females
Male-Female gap in literacy rate
0
1951
1961
1971
1981
1991
2001
2011
PE
R
CENSUS YEAR
State of Literacy
PROVISIONAL POPULATION TOTALS – INDIA 103
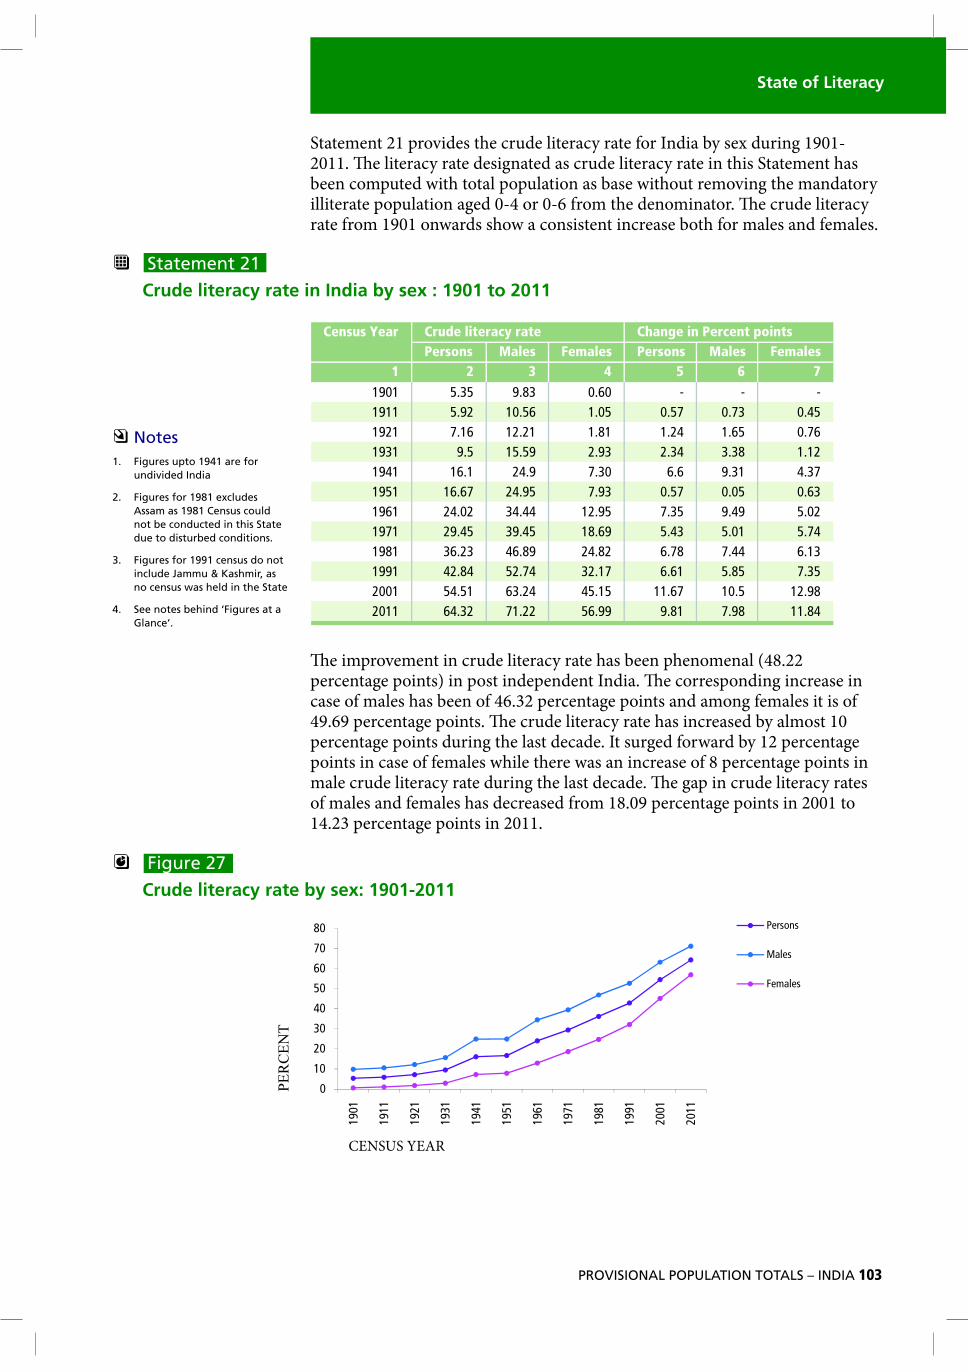
Statement 21 provides the crude literacy rate for India by sex during 1901-2011. !e literacy rate designated as crude literacy rate in this Statement has been computed with total population as base without removing the mandatory illiterate population aged 0-4 or 0-6 from the denominator. !e crude literacy rate from 1901 onwards show a consistent increase both for males and females.
" Statement 21
Crude literacy rate in India by sex : 1901 to 2011
# Notes
1. Figures upto 1941 are for
undivided India
2. Figures for 1981 excludes
Assam as 1981 Census could
not be conducted in this State
due to disturbed conditions.
3. Figures for 1991 census do not
include Jammu & Kashmir, as
no census was held in the State
4. See notes behind ‘Figures at a
Glance’.
!e improvement in crude literacy rate has been phenomenal (48.22 percentage points) in post independent India. !e corresponding increase in case of males has been of 46.32 percentage points and among females it is of 49.69 percentage points. !e crude literacy rate has increased by almost 10 percentage points during the last decade. It surged forward by 12 percentage points in case of females while there was an increase of 8 percentage points in male crude literacy rate during the last decade. !e gap in crude literacy rates of males and females has decreased from 18.09 percentage points in 2001 to 14.23 percentage points in 2011.
Persons Males Females Persons Males Females
1 2 3 4 5 6 7
1901 5.35 9.83 0.60 - - -
1911 5.92 10.56 1.05 0.57 0.73 0.45
1921 7.16 12.21 1.81 1.24 1.65 0.76
1931 9.5 15.59 2.93 2.34 3.38 1.12
1941 16.1 24.9 7.30 6.6 9.31 4.37
1951 16.67 24.95 7.93 0.57 0.05 0.63
1961 24.02 34.44 12.95 7.35 9.49 5.02
1971 29.45 39.45 18.69 5.43 5.01 5.74
1981 36.23 46.89 24.82 6.78 7.44 6.13
1991 42.84 52.74 32.17 6.61 5.85 7.35
2001 54.51 63.24 45.15 11.67 10.5 12.98
2011 64.32 71.22 56.99 9.81 7.98 11.84
Census Year Crude literacy rate Change in Percent points
Figure 27
Crude literacy rate by sex: 1901-2011
0
10
20
30
40
50
60
70
80
1901
1911
1921
1931
1941
1951
1961
1971
1981
1991
2001
2011
Person
Males
Females
s
CENSUS YEAR
PERCENT
104
LITERACY TRENDS IN EAG STATES
Statement 22(a) presents the e�ective literacy rate for eight Empowered Action Group (EAG) States and non EAG States. It is evident from this Statement that the literacy rate for all three categories of person, male and female has been higher in non EAG States as compared to EAG States in the three Censuses of 1991, 2001 and 2011. However, it is satisfying to note that change in percentage points of literacy rate in EAG States is higher for all three categories during 2001-2011 as compared to non EAG States which indicates that EAG States are catching up with non EAG States.
" Statement 22(a)
Effective Literacy Rate in EAG and Non EAG States
Statement 22(b) presents the male-female gap in e�ective literacy rate for EAG and non-EAG States for Censuses of 1991, 2001 and 2011. It may be observed that the male female gap in literacy is declining at faster pace in EAG States. !e decline is of 5.92 percentage points in EAG States as compared to 4.38 percentage points in case of non-EAG States during 2001-2011.
" Statement 22(b)
Male-Female Gap in Effective Literacy Rate
It is heartening to note that the percentage increase in number of literates is remarkable in all the EAG States. Bihar (74.83 per cent), Jharkhand (59.24 per cent) and Uttar Pradesh (56.40 per cent) have shown the highest rise. Rajasthan (40.68 per cent) and Chhattisgarh (39.61 per cent) are in the middle and Madhya Pradesh (38.73 per cent), Uttarakhand (37.05 per cent) and Orissa (36.68 per cent) bring up the rear.
P M F P M F P M F
India 52.21 64.13 39.29 64.83 75.26 53.67 74.04 82.14 65.46
Non EAG States 60.09 70.34 49.2 70.64 79.25 61.53 78.24 84.76 71.42
1991 2001 2011
EAG States 41.65 56 25.68 57.22 70.09 43.21 68.86 78.96 57.99
# Notes
1. Figures for 1991 census do not
include Jammu & Kashmir, as
no census was held in the State
2. See notes behind ‘Figures at a
Glance’.
# Notes
1. Figures for 1991 census do not
include Jammu & Kashmir, as
no census was held in the State
2. See notes behind ‘Figures at a
Glance’.
1991 2001 2011
India 24.85 21.59 16.68
Non EAG States 21.14 17.72 13.34
EAG States 30.32 26.89 20.97
State of Literacy
PROVISIONAL POPULATION TOTALS – INDIA 105
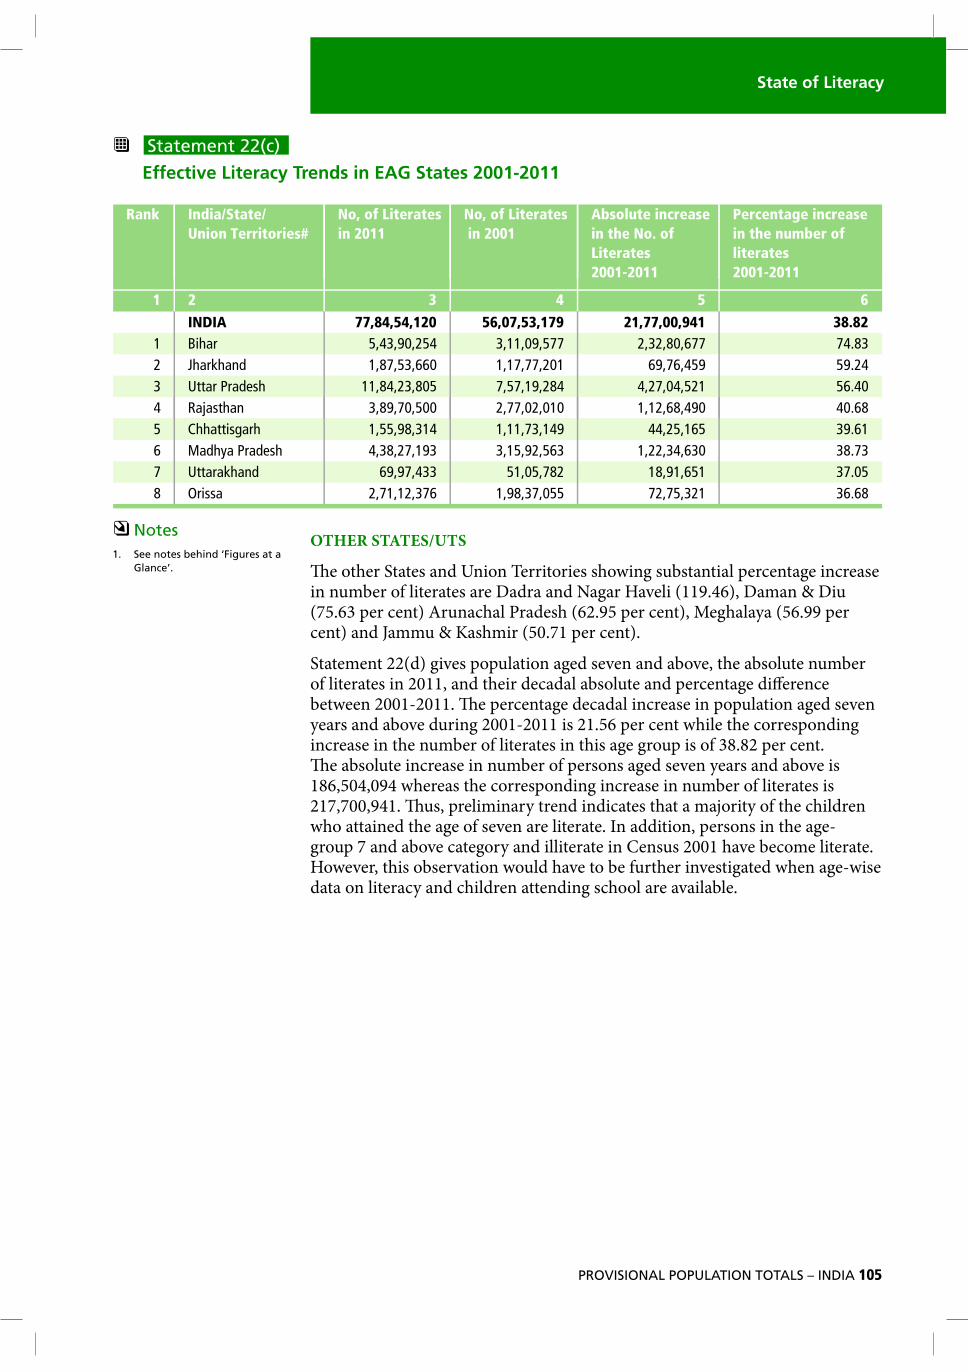
" Statement 22(c)
Effective Literacy Trends in EAG States 2001-2011
Rank India/State/
Union Territories#
No, of Literates
in 2011
No, of Literates
in 2001
Absolute increase
in the No. of
Literates
2001-2011
Percentage increase
in the number of
literates
2001-2011
1 2 3 4 5 6
INDIA 77,84,54,120 56,07,53,179 21,77,00,941 38.82
1 Bihar 5,43,90,254 3,11,09,577 2,32,80,677 74.83
2 Jharkhand 1,87,53,660 1,17,77,201 69,76,459 59.24
3 Uttar Pradesh 11,84,23,805 7,57,19,284 4,27,04,521 56.40
4 Rajasthan 3,89,70,500 2,77,02,010 1,12,68,490 40.68
5 Chhattisgarh 1,55,98,314 1,11,73,149 44,25,165 39.61
6 Madhya Pradesh 4,38,27,193 3,15,92,563 1,22,34,630 38.73
7 Uttarakhand 69,97,433 51,05,782 18,91,651 37.05
8 Orissa 2,71,12,376 1,98,37,055 72,75,321 36.68
Figures at a Glance'
# Notes
1. See notes behind ‘Figures at a
Glance’.
OTHER STATES/UTS
!e other States and Union Territories showing substantial percentage increase in number of literates are Dadra and Nagar Haveli (119.46), Daman & Diu (75.63 per cent) Arunachal Pradesh (62.95 per cent), Meghalaya (56.99 per cent) and Jammu & Kashmir (50.71 per cent).
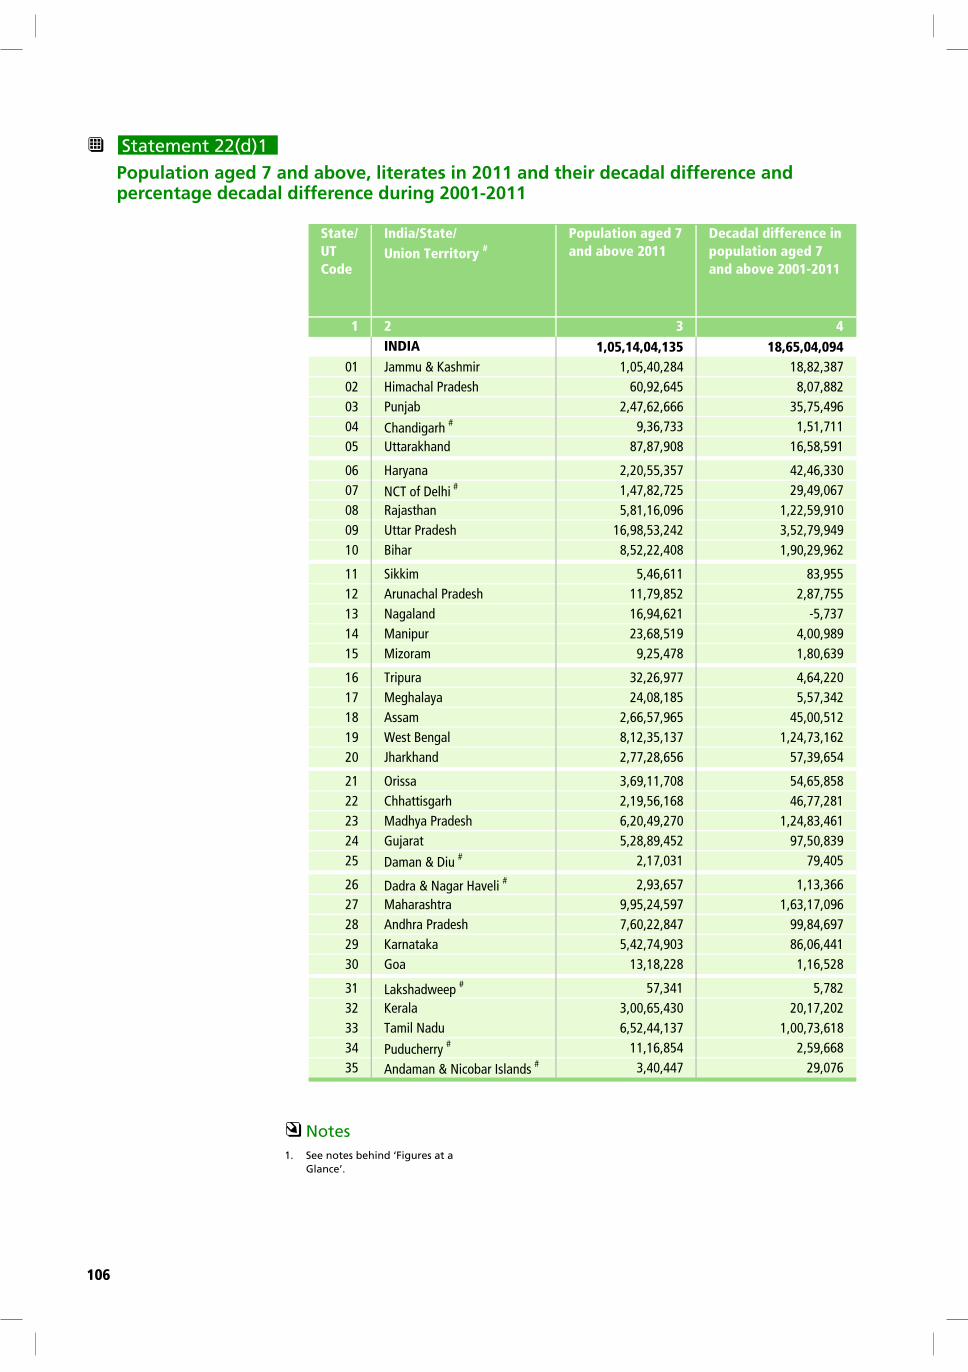
Statement 22(d) gives population aged seven and above, the absolute number of literates in 2011, and their decadal absolute and percentage di�erence between 2001-2011. !e percentage decadal increase in population aged seven years and above during 2001-2011 is 21.56 per cent while the corresponding increase in the number of literates in this age group is of 38.82 per cent. !e absolute increase in number of persons aged seven years and above is 186,504,094 whereas the corresponding increase in number of literates is 217,700,941. !us, preliminary trend indicates that a majority of the children who attained the age of seven are literate. In addition, persons in the age-group 7 and above category and illiterate in Census 2001 have become literate. However, this observation would have to be further investigated when age-wise data on literacy and children attending school are available.
106
" Statement 22(d)1
Population aged 7 and above, literates in 2011 and their decadal difference and percentage decadal difference during 2001-2011
# Notes
1. See notes behind ‘Figures at a
Glance’.
State/
UT
Code
India/State/
Union Territory #
Population aged 7
and above 2011
Decadal difference in
population aged 7
and above 2001-2011
1 2 3 4
INDIA 1,05,14,04,135 18,65,04,094
01 Jammu & Kashmir 1,05,40,284 18,82,387
02 Himachal Pradesh 60,92,645 8,07,882
03 Punjab 2,47,62,666 35,75,496
04 Chandigarh # 9,36,733 1,51,711
05 Uttarakhand 87,87,908 16,58,591
06 Haryana 2,20,55,357 42,46,330
07 NCT of Delhi # 1,47,82,725 29,49,067
08 Rajasthan 5,81,16,096 1,22,59,910
09 Uttar Pradesh 16,98,53,242 3,52,79,949
10 Bihar 8,52,22,408 1,90,29,962
11 Sikkim 5,46,611 83,955
12 Arunachal Pradesh 11,79,852 2,87,755
13 Nagaland 16,94,621 -5,737
14 Manipur 23,68,519 4,00,989
15 Mizoram 9,25,478 1,80,639
16 Tripura 32,26,977 4,64,220
17 Meghalaya 24,08,185 5,57,342
18 Assam 2,66,57,965 45,00,512
19 West Bengal 8,12,35,137 1,24,73,162
20 Jharkhand 2,77,28,656 57,39,654
21 Orissa 3,69,11,708 54,65,858
22 Chhattisgarh 2,19,56,168 46,77,281
23 Madhya Pradesh 6,20,49,270 1,24,83,461
24 Gujarat 5,28,89,452 97,50,839
25 Daman & Diu # 2,17,031 79,405
26 Dadra & Nagar Haveli # 2,93,657 1,13,366
27 Maharashtra 9,95,24,597 1,63,17,096
28 Andhra Pradesh 7,60,22,847 99,84,697
29 Karnataka 5,42,74,903 86,06,441
30 Goa 13,18,228 1,16,528
31 Lakshadweep # 57,341 5,782
32 Kerala 3,00,65,430 20,17,202
33 Tamil Nadu 6,52,44,137 1,00,73,618
34 Puducherry # 11,16,854 2,59,668
35 Andaman & Nicobar Islands # 3,40,447 29,076

State of Literacy
PROVISIONAL POPULATION TOTALS – INDIA 107
" Statement 22(d)2
Population aged 7 and above, literates in 2011 and their decadal difference and percentage decadal difference during 2001-2011
# Notes
1. See notes behind ‘Figures at a
Glance’.
Percentage
decadal
difference
2001-2011
Number of
literates
2011
Decadal
difference in
number of
literates
2001-2011
Percentage
decadal
difference
2001-2011
State/
UT
Code
India/State/
Union Territory #
5 6 7 8 1 2
21.56 77,84,54,120 21,77,00,941 38.82 INDIA
21.74 72,45,053 24,37,767 50.71 01 Jammu & Kashmir
15.29 51,04,506 10,62,885 26.30 02 Himachal Pradesh
16.88 1,89,88,611 42,31,641 28.68 03 Punjab
19.33 8,09,653 1,66,408 25.87 04 Chandigarh #
23.26 69,97,433 18,91,651 37.05 05 Uttarakhand
23.84 1,69,04,324 48,10,647 39.78 06 Haryana
24.92 1,27,63,352 30,98,588 32.06 07 NCT of Delhi #
26.74 3,89,70,500 1,12,68,490 40.68 08 Rajasthan
26.22 11,84,23,805 4,27,04,521 56.40 09 Uttar Pradesh
28.75 5,43,90,254 2,32,80,677 74.83 10 Bihar
18.15 4,49,294 1,30,959 41.14 11 Sikkim
32.26 7,89,943 3,05,158 62.95 12 Arunachal Pradesh
-0.34 13,57,579 2,25,256 19.89 13 Nagaland
20.38 18,91,196 5,15,280 37.45 14 Manipur
24.25 8,47,592 1,86,147 28.14 15 Mizoram
16.80 28,31,742 8,09,643 40.04 16 Tripura
30.11 18,17,761 6,59,886 56.99 17 Meghalaya
20.31 1,95,07,017 54,91,663 39.18 18 Assam
18.14 6,26,14,556 1,54,18,155 32.67 19 West Bengal
26.10 1,87,53,660 69,76,459 59.24 20 Jharkhand
17.38 2,71,12,376 72,75,321 36.68 21 Orissa
27.07 1,55,98,314 44,25,165 39.61 22 Chhattisgarh
25.19 4,38,27,193 1,22,34,630 38.73 23 Madhya Pradesh
22.60 4,19,48,677 1,21,20,927 40.64 24 Gujarat
57.70 1,88,974 81,374 75.63 25 Daman & Diu #
62.88 2,28,028 1,24,124 119.46 26 Dadra & Nagar Haveli #
19.61 8,25,12,225 1,85,46,282 28.99 27 Maharashtra
15.12 5,14,38,510 1,15,04,187 28.81 28 Andhra Pradesh
18.85 4,10,29,323 1,05,94,361 34.81 29 Karnataka
9.70 11,52,117 1,66,555 16.90 30 Goa
11.21 52,914 8,231 18.42 31 Lakshadweep #
7.19 2,82,34,227 27,48,539 10.78 32 Kerala
18.26 5,24,13,116 1,18,88,571 29.34 33 Tamil Nadu
30.29 9,66,600 2,70,233 38.81 34 Puducherry #
9.34 2,93,695 40,560 16.02 35 Andaman & Nicobar Islands #
108
EFFECTIVE LITERACY RATES IN STATES/UTS BY GENDER
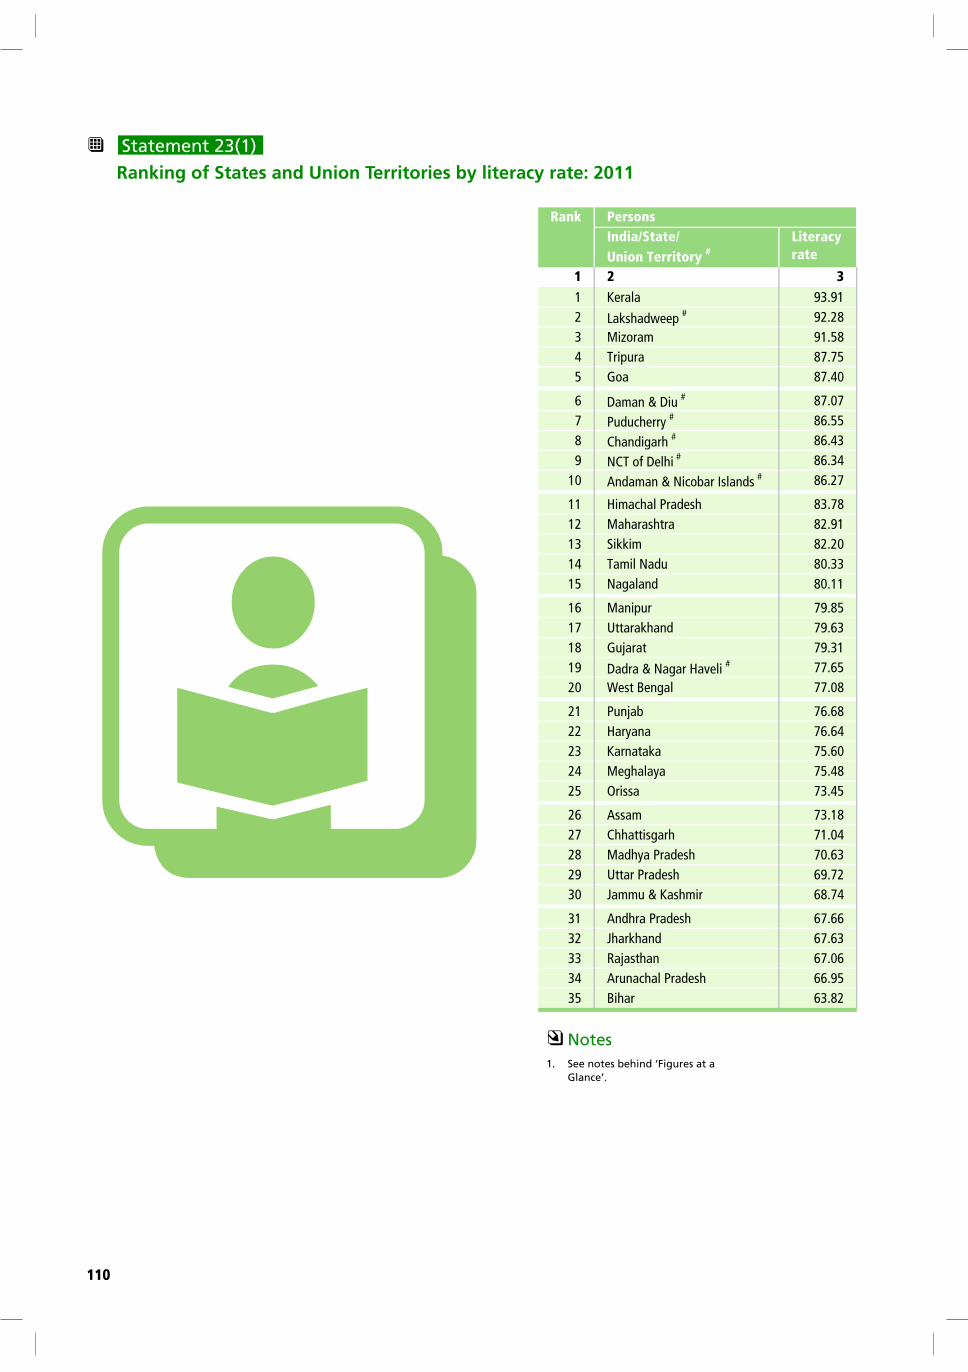
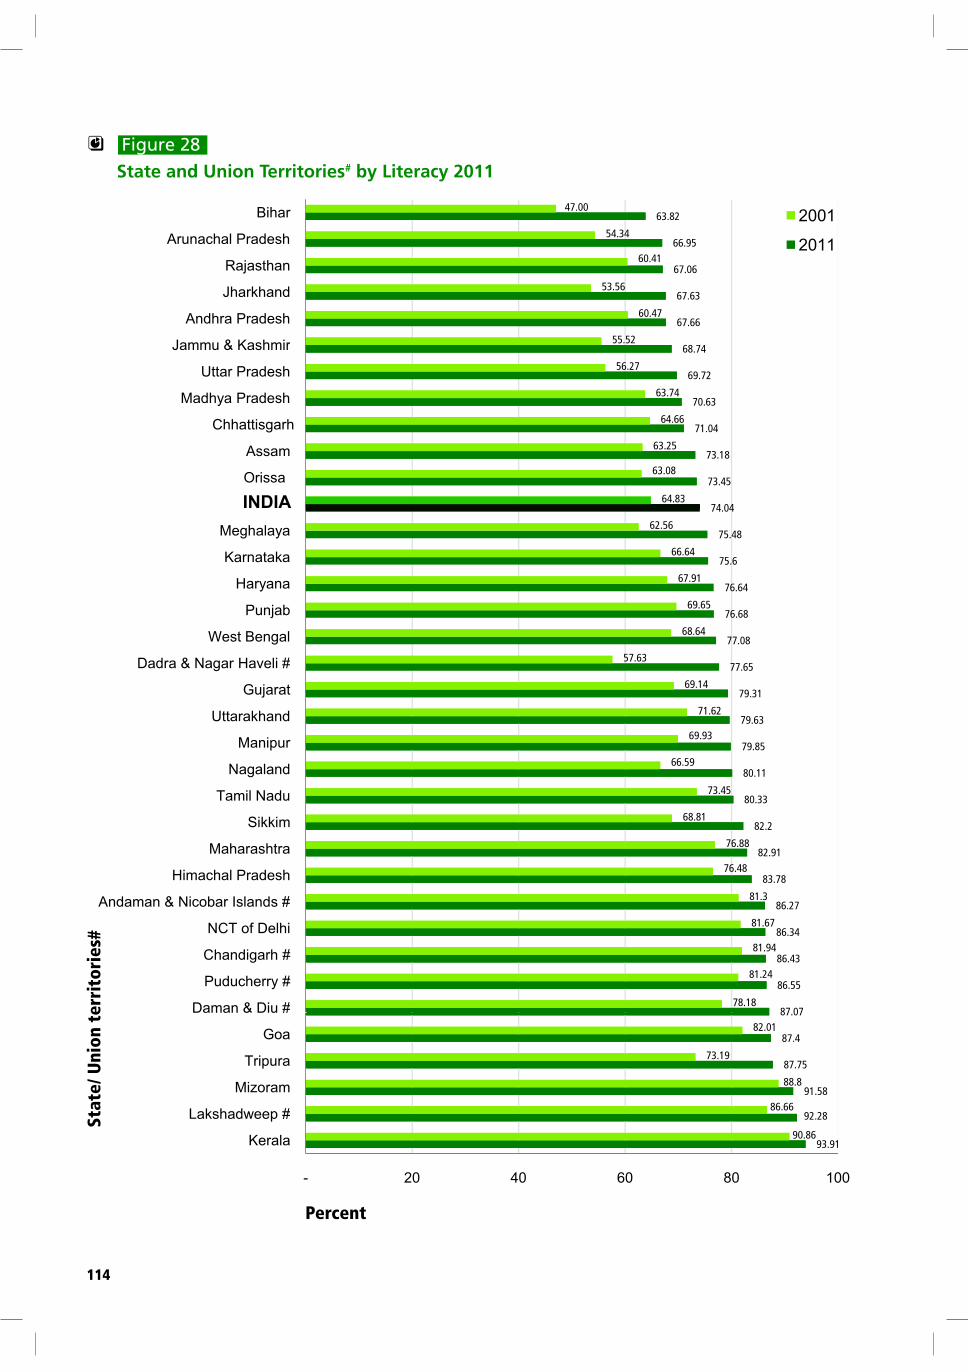
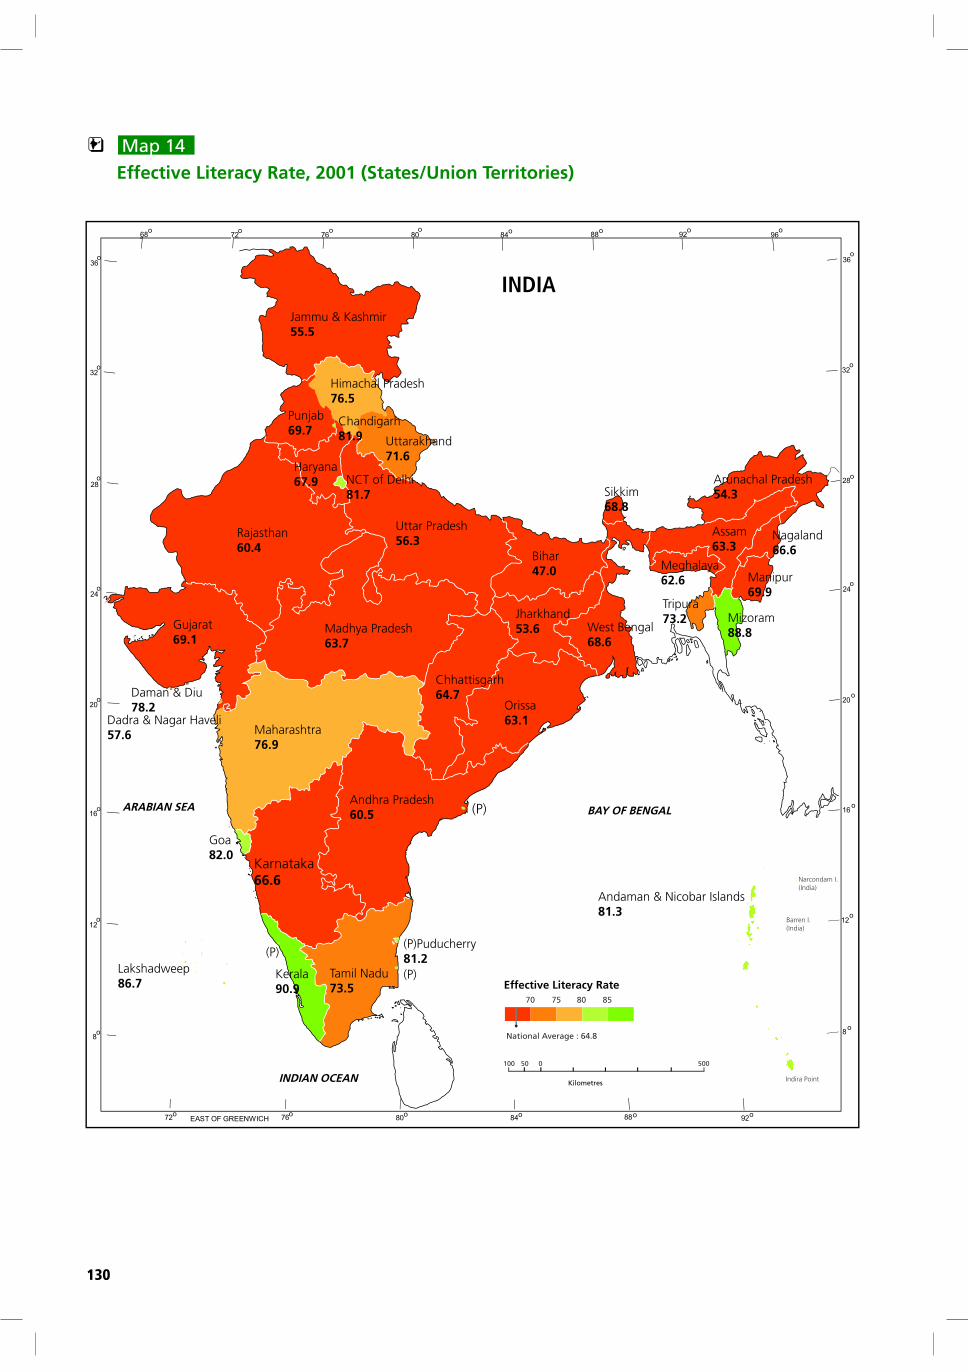
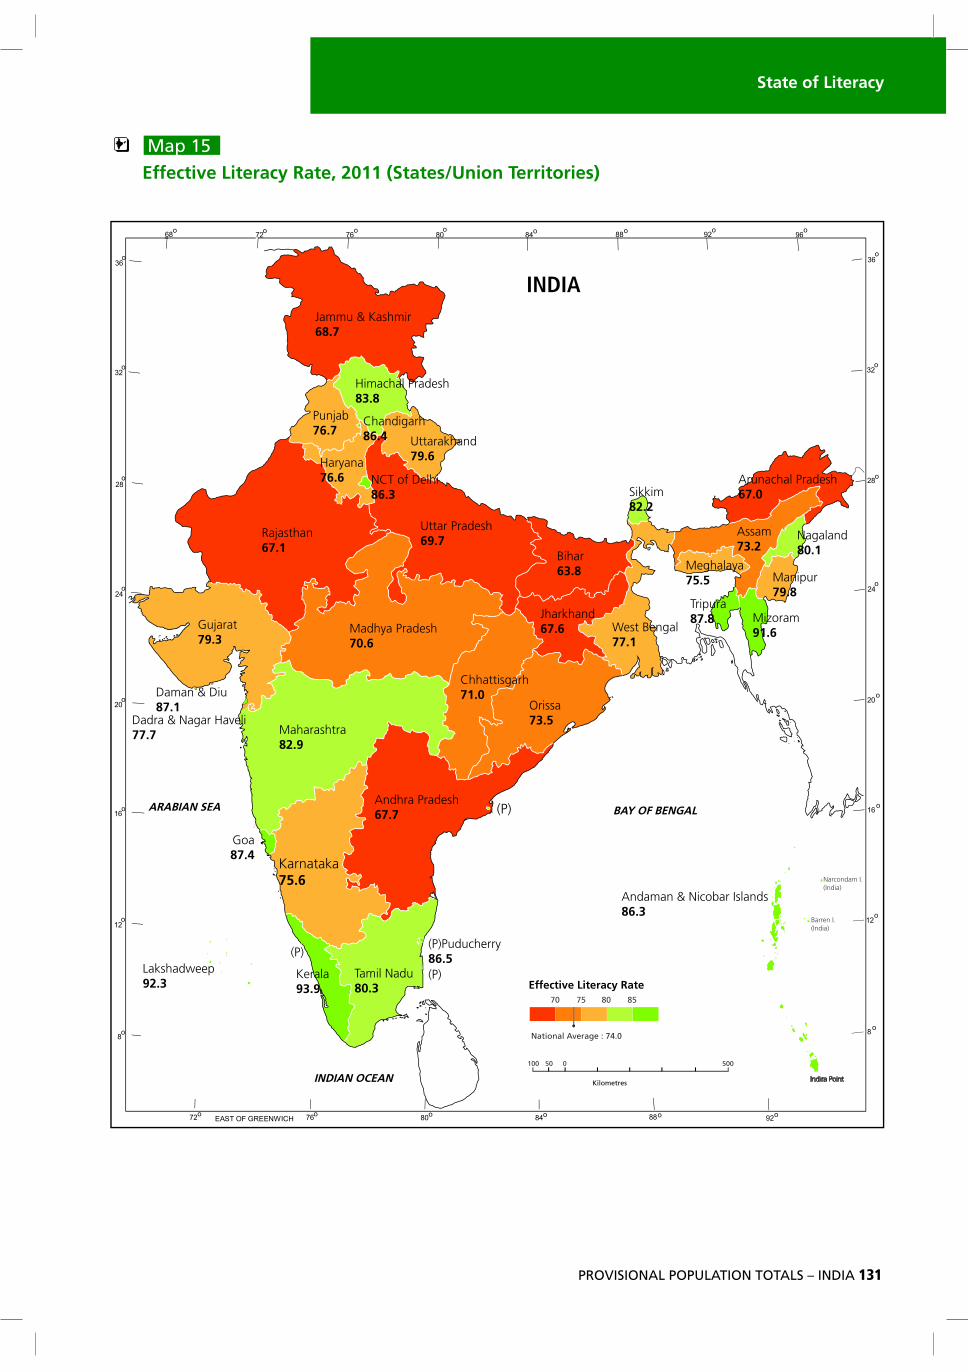
Kerala ranks "rst in the country with a literacy rate of 93.91 per cent, closely followed by Lakshadweep (92.28 per cent) and Mizoram (91.58 per cent). Bihar with a literacy rate of 63.82 per cent ranks last in the country preceded by Arunachal Pradesh (66.95 per cent) and Rajasthan (67.06 per cent). Among the major States, Maharashtra (82.91 per cent) comes a#er Kerala, followed by Tamil Nadu (80.33 per cent). !e States and Union Territories with literacy rates below the National average (74.04 per cent) are Jammu and Kashmir in the North, Rajasthan in the West, Andhra Pradesh in the South, Madhya Pradesh, Chhattisgarh, Uttar Pradesh in Central, Bihar, Jharkhand, Orissa in the East and Arunachal Pradesh and Assam in the North-East of the country. Ten States and Union Territories viz., Kerala, Lakshadweep, Mizoram, Tripura, Goa, Daman & Diu, Puducherry, Chandigarh, NCT of Delhi and Andaman & Nicobar Islands have achieved literacy rate of above 85 per cent, the target set by Planning Commission for the year 2011-2012. !e States and Union Territories, which have literacy rate below the National average in respect of all the three categories i.e., persons, males and females are Arunachal Pradesh, Chhattisgarh, Madhya Pradesh, Andhra Pradesh, Bihar, Rajasthan, Jammu and Kashmir, Jharkhand and Uttar Pradesh.
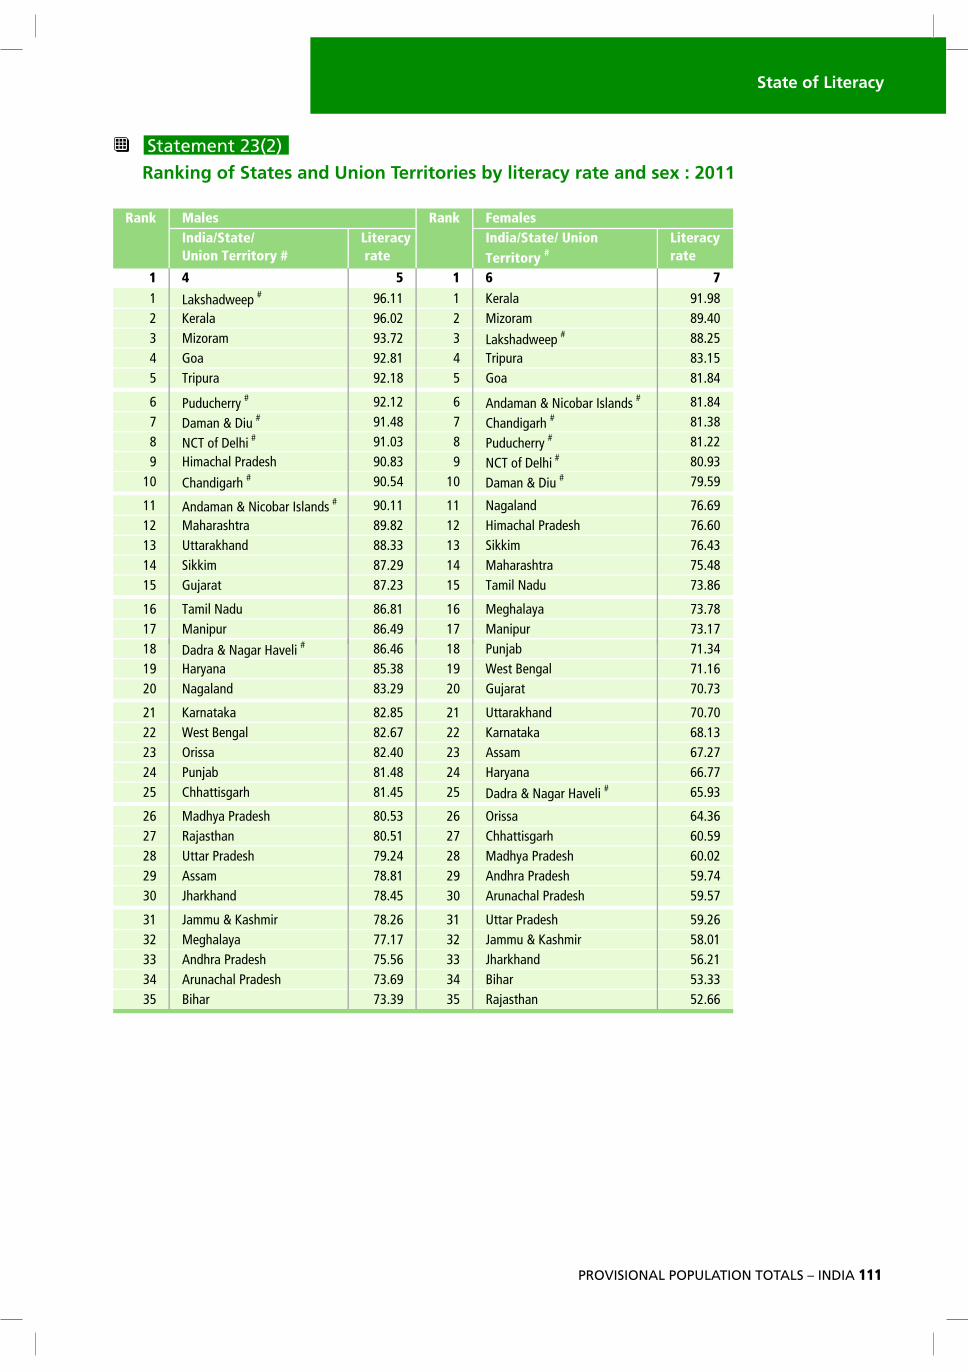
Kerala holds the "rst rank in the country in female literacy with 91.98 per cent. Rajasthan (52.66 per cent) has recorded the lowest female literacy rate preceded by Bihar (53.33 per cent). Similarly, the States and Union Territories with female literacy rate below the National average (65.46 per cent) are Orissa, Chhattisgarh, Madhya Pradesh, Andhra Pradesh, Arunachal Pradesh, Uttar Pradesh, Jammu and Kashmir, Jharkhand, Bihar and Rajasthan.
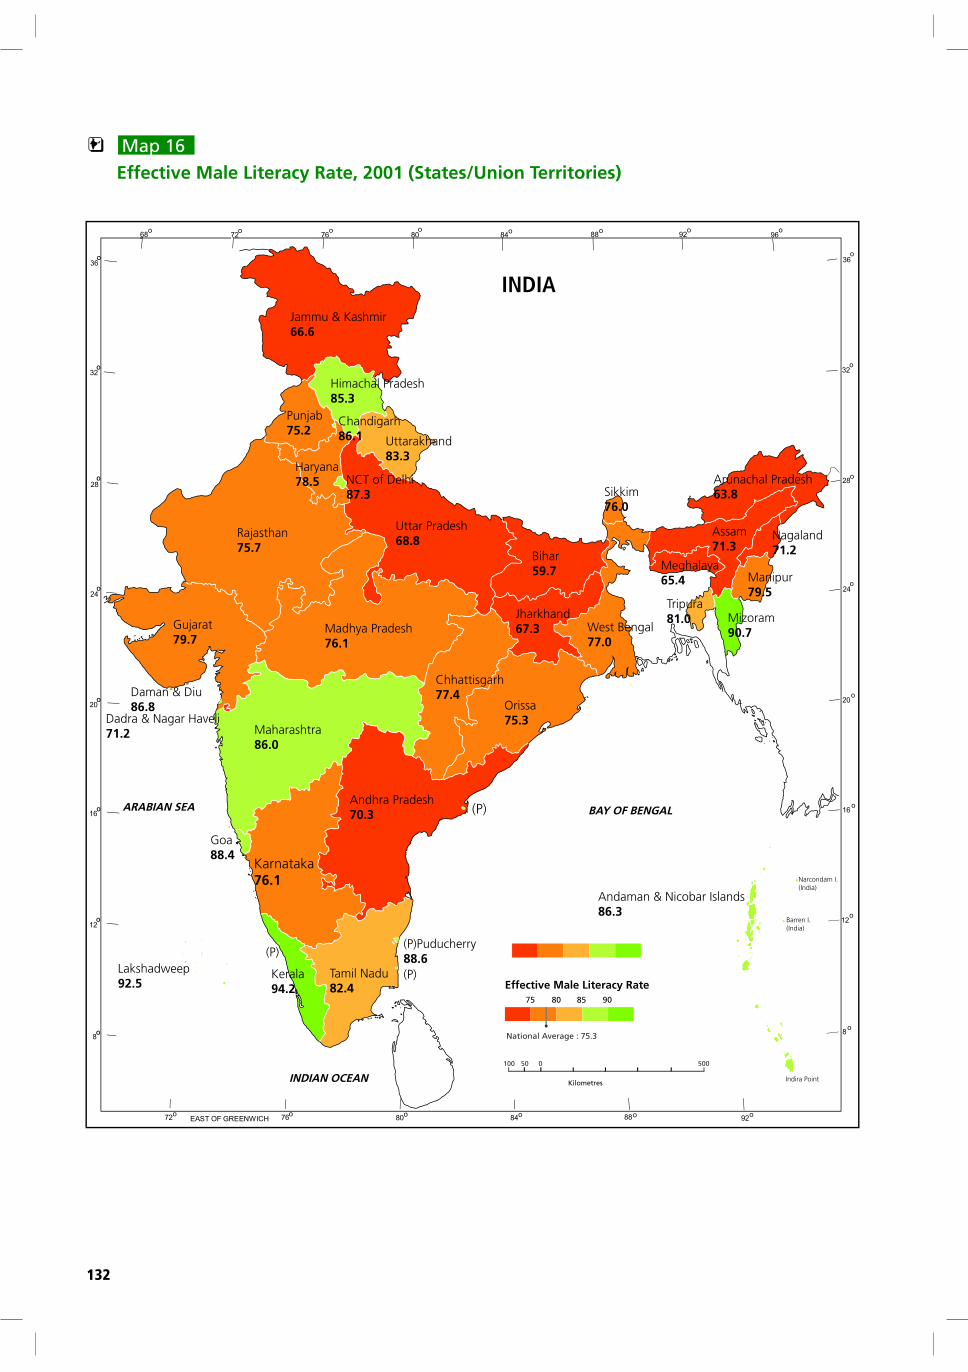
Lakshadweep (96.11 per cent) holds the "rst rank in the country with respect to male literacy rate. Kerala (96.02 per cent) ranks second. Bihar (73.39 per cent) has recorded the lowest literacy rate in case of males preceded again by Arunachal Pradesh (73.69 per cent). !e States and Union Territories with literacy rates below the National average for males (82.14 per cent) are Madhya Pradesh, Assam, Meghalaya, Arunachal Pradesh, Andhra Pradesh, Bihar, Rajasthan, Jammu and Kashmir, Chhattisgarh, Punjab, Jharkhand and Uttar Pradesh.
Maps 14 to 19 depicts e�ective literacy rate for persons, males and females for 2001 and 2011 censuses.
Statement 23 presents States and Union Territories arranged in descending order according to the 2011 literacy rate for persons, males and females separately.
Ten States and Union Territories
viz., Kerala, Lakshadweep,
Mizoram, Tripura, Goa, Daman &
Diu, Puducherry, Chandigarh, NCT
of Delhi and Andaman & Nicobar
Islands have achieved literacy
rate of above 85 per cent, the
target set by the Planning
Commission to be achieved by
2011-2012.
State of Literacy
PROVISIONAL POPULATION TOTALS – INDIA 109
110
" Statement 23(1)
Ranking of States and Union Territories by literacy rate: 2011
# Notes
1. See notes behind ‘Figures at a
Glance’.
India/State/
Union Territory #
Literacy
rate
1 2 3
1 Kerala 93.91
2 Lakshadweep # 92.28
3 Mizoram 91.58
4 Tripura 87.75
5 Goa 87.40
6 Daman & Diu # 87.07
7 Puducherry # 86.55
8 Chandigarh # 86.43
9 NCT of Delhi # 86.34
10 Andaman & Nicobar Islands # 86.27
11 Himachal Pradesh 83.78
12 Maharashtra 82.91
13 Sikkim 82.20
14 Tamil Nadu 80.33
15 Nagaland 80.11
16 Manipur 79.85
17 Uttarakhand 79.63
18 Gujarat 79.31
19 Dadra & Nagar Haveli # 77.65
20 West Bengal 77.08
21 Punjab 76.68
22 Haryana 76.64
23 Karnataka 75.60
24 Meghalaya 75.48
25 Orissa 73.45
26 Assam 73.18
27 Chhattisgarh 71.04
28 Madhya Pradesh 70.63
29 Uttar Pradesh 69.72
30 Jammu & Kashmir 68.74
31 Andhra Pradesh 67.66
32 Jharkhand 67.63
33 Rajasthan 67.06
34 Arunachal Pradesh 66.95
35 Bihar 63.82
Rank Persons
State of Literacy
PROVISIONAL POPULATION TOTALS – INDIA 111
Statement 23(2)
Ranking of States and Union Territories by literacy rate and sex : 2011
India/State/
Union Territory #
Literacy
rate
India/State/ Union
Territory #
Literacy
rate
1 4 5 1 6 7
1 Lakshadweep # 96.11 1 Kerala 91.98
2 Kerala 96.02 2 Mizoram 89.40
3 Mizoram 93.72 3 Lakshadweep # 88.25
4 Goa 92.81 4 Tripura 83.15
5 Tripura 92.18 5 Goa 81.84
6 Puducherry # 92.12 6 Andaman & Nicobar Islands
# 81.84
7 Daman & Diu # 91.48 7 Chandigarh
# 81.38
8 NCT of Delhi # 91.03 8 Puducherry
# 81.22
9 Himachal Pradesh 90.83 9 NCT of Delhi # 80.93
10 Chandigarh # 90.54 10 Daman & Diu
# 79.59
11 Andaman & Nicobar Islands # 90.11 11 Nagaland 76.69
12 Maharashtra 89.82 12 Himachal Pradesh 76.60
13 Uttarakhand 88.33 13 Sikkim 76.43
14 Sikkim 87.29 14 Maharashtra 75.48
15 Gujarat 87.23 15 Tamil Nadu 73.86
16 Tamil Nadu 86.81 16 Meghalaya 73.78
17 Manipur 86.49 17 Manipur 73.17
18 D d & N H li# 86 46 18 Punjab 71 34
Males RankRank Females
18 Dadra & Nagar Haveli # 86.46 18 Punjab 71.34
19 Haryana 85.38 19 West Bengal 71.16
20 Nagaland 83.29 20 Gujarat 70.73
21 Karnataka 82.85 21 Uttarakhand 70.70
22 West Bengal 82.67 22 Karnataka 68.13
23 Orissa 82.40 23 Assam 67.27
24 Punjab 81.48 24 Haryana 66.77
25 Chhattisgarh 81.45 25 Dadra & Nagar Haveli # 65.93
26 Madhya Pradesh 80.53 26 Orissa 64.36
27 Rajasthan 80.51 27 Chhattisgarh 60.59
28 Uttar Pradesh 79.24 28 Madhya Pradesh 60.02
29 Assam 78.81 29 Andhra Pradesh 59.74
30 Jharkhand 78.45 30 Arunachal Pradesh 59.57
31 Jammu & Kashmir 78.26 31 Uttar Pradesh 59.26
32 Meghalaya 77.17 32 Jammu & Kashmir 58.01
33 Andhra Pradesh 75.56 33 Jharkhand 56.21
34 Arunachal Pradesh 73.69 34 Bihar 53.33
35 Bihar 73.39 35 Rajasthan 52.66
112
EFFECTIVE LITERACY RATE- DECADAL VARIATION
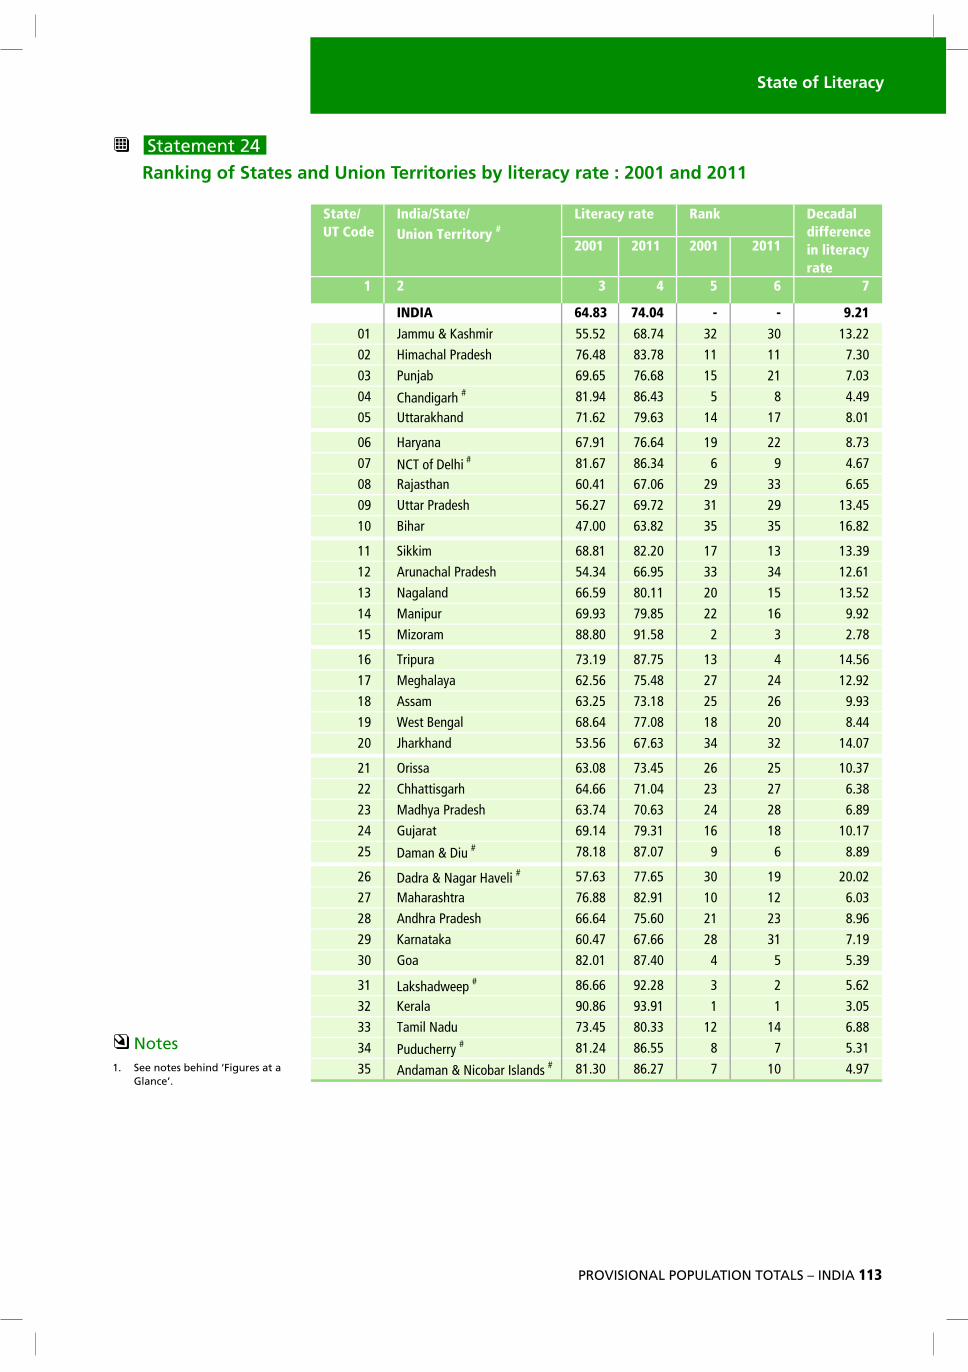
Kerala, Mizoram, Lakshadweep and Tripura are the consistent forerunners for both Census 2001 and Census 2011. Nagaland, Manipur, Tripura and Dadra and Nagar Haveli showed improvement in rank by more than 5 points in Census 2011 over the previous decade. Of the States/Union Territories that showed signi�cant improvement, Dadra and Nagar Haveli improved the most from thirtieth rank to nineteenth rank by 11 points. Punjab, Chhattisgarh, Sikkim, Madhya Pradesh and Rajasthan showed decrease in rank by more than 4 points from the Census 2001. Of these States, Punjab decreased the most from ��eenth rank to twenty-�rst rank slipping down by 6 points. Literacy rate in 2001 showed an increase of 9.21 percentage points for the country as a whole. �e States and Union Territories that have recorded decadal di�erence of 10 percentage points in literacy rate of 2001-2011 are Dadra & Nagar Haveli (20.02 per cent), Bihar (16.82 per cent), Tripura (14.56 per cent), Jharkhand (14.07 per cent), Nagaland (13.52 per cent), Uttar Pradesh (13.45 per cent), Sikkim (13.39 per cent), Jammu & Kashmir (13.22 per cent), Meghalaya( 12.92 per cent), Arunachal Pradesh (12.61 per cent), Orissa(10.37 per cent) and Gujarat( 10.17 per cent). Literary rates for persons at Census of India, 2001 & 2011, by States and Union Territories have been presented in �gure-28. Statement 24 presents ranking of States and Union Territories by literacy rate of 2001 and 2011 along with decadal di�erence.
State of Literacy
PROVISIONAL POPULATION TOTALS – INDIA 113
Statement 24
Ranking of States and Union Territories by literacy rate : 2001 and 2011
2001 2011 2001 2011
1 2 3 4 5 6 7
INDIA 64.83 74.04 - - 9.21
01 Jammu & Kashmir 55.52 68.74 32 30 13.22
02 Himachal Pradesh 76.48 83.78 11 11 7.30
03 Punjab 69.65 76.68 15 21 7.03
04 Chandigarh # 81.94 86.43 5 8 4.49
05 Uttarakhand 71.62 79.63 14 17 8.01
06 Haryana 67.91 76.64 19 22 8.73
07 NCT of Delhi # 81.67 86.34 6 9 4.67
08 Rajasthan 60.41 67.06 29 33 6.65
09 Uttar Pradesh 56.27 69.72 31 29 13.45
10 Bihar 47.00 63.82 35 35 16.82
11 Sikkim 68.81 82.20 17 13 13.39
12 Arunachal Pradesh 54.34 66.95 33 34 12.61
13 Nagaland 66.59 80.11 20 15 13.52
14 Manipur 69.93 79.85 22 16 9.92
15 Mizoram 88.80 91.58 2 3 2.78
16 Tripura 73.19 87.75 13 4 14.56
17 Meghalaya 62.56 75.48 27 24 12.92
18 Assam 63.25 73.18 25 26 9.93
19 West Bengal 68.64 77.08 18 20 8.44
20 Jharkhand 53.56 67.63 34 32 14.07
21 Orissa 63.08 73.45 26 25 10.37
22 Chhattisgarh 64.66 71.04 23 27 6.38
23 Madhya Pradesh 63.74 70.63 24 28 6.89
24 Gujarat 69.14 79.31 16 18 10.17
25 Daman & Diu # 78.18 87.07 9 6 8.89
26 Dadra & Nagar Haveli # 57.63 77.65 30 19 20.02
27 Maharashtra 76.88 82.91 10 12 6.03
28 Andhra Pradesh 66.64 75.60 21 23 8.96
29 Karnataka 60.47 67.66 28 31 7.19
30 Goa 82.01 87.40 4 5 5.39
31 Lakshadweep # 86.66 92.28 3 2 5.62
32 Kerala 90.86 93.91 1 1 3.05
33 Tamil Nadu 73.45 80.33 12 14 6.88
34 Puducherry # 81.24 86.55 8 7 5.31
35 Andaman & Nicobar Islands # 81.30 86.27 7 10 4.97
State/
UT Code
India/State/
Union Territory #
Literacy rate Rank Decadal
difference
in literacy
rate
! Notes
1. See notes behind ‘Figures at a
Glance’.
114
" Figure 28
State and Union Territories# by Literacy 2011
55 52
60.47
53.56
60.41
54.34
47.00
67.66
67.63
67.06
66.95
63.82
J & K h i
Andhra Pradesh
Jharkhand
Rajasthan
Arunachal Pradesh
Bihar 2001
2011
64.83
63.08
63.25
64.66
63.74
56.27
55.52
74 04
73.45
73.18
71.04
70.63
69.72
68.74
INDIA
Orissa
Assam
Chhattisgarh
Madhya Pradesh
Uttar Pradesh
Jammu & Kashmir
57.63
68.64
69.65
67.91
66.64
62.56
77.65
77.08
76.68
76.64
75.6
75.48
74.04
Dadra & Nagar Haveli #
West Bengal
Punjab
Haryana
Karnataka
Meghalaya
76 88
68.81
73.45
66.59
69.93
71.62
69.14
82.2
80.33
80.11
79.85
79.63
79.31
M h ht
Sikkim
Tamil Nadu
Nagaland
Manipur
Uttarakhand
Gujarat
78.18
81.24
81.94
81.67
81.3
76.48
76.88
87 07
86.55
86.43
86.34
86.27
83.78
82.91
Daman & Diu #
Puducherry #
Chandigarh #
NCT of Delhi
Andaman & Nicobar Islands #
Himachal Pradesh
Maharashtra
90.86
86.66
88.8
73.19
82.01
93.91
92.28
91.58
87.75
87.4
87.07
- 20 40 60 80 100
Kerala
Lakshadweep #
Mizoram
Tripura
Goa
a a & u #
20 40 60 80 100
Percent
Sta
te
/ U
nio
n t
errit
orie
s#

State of Literacy
PROVISIONAL POPULATION TOTALS – INDIA 115
EFFECTIVE LITERACY RATE- GENDER GAP
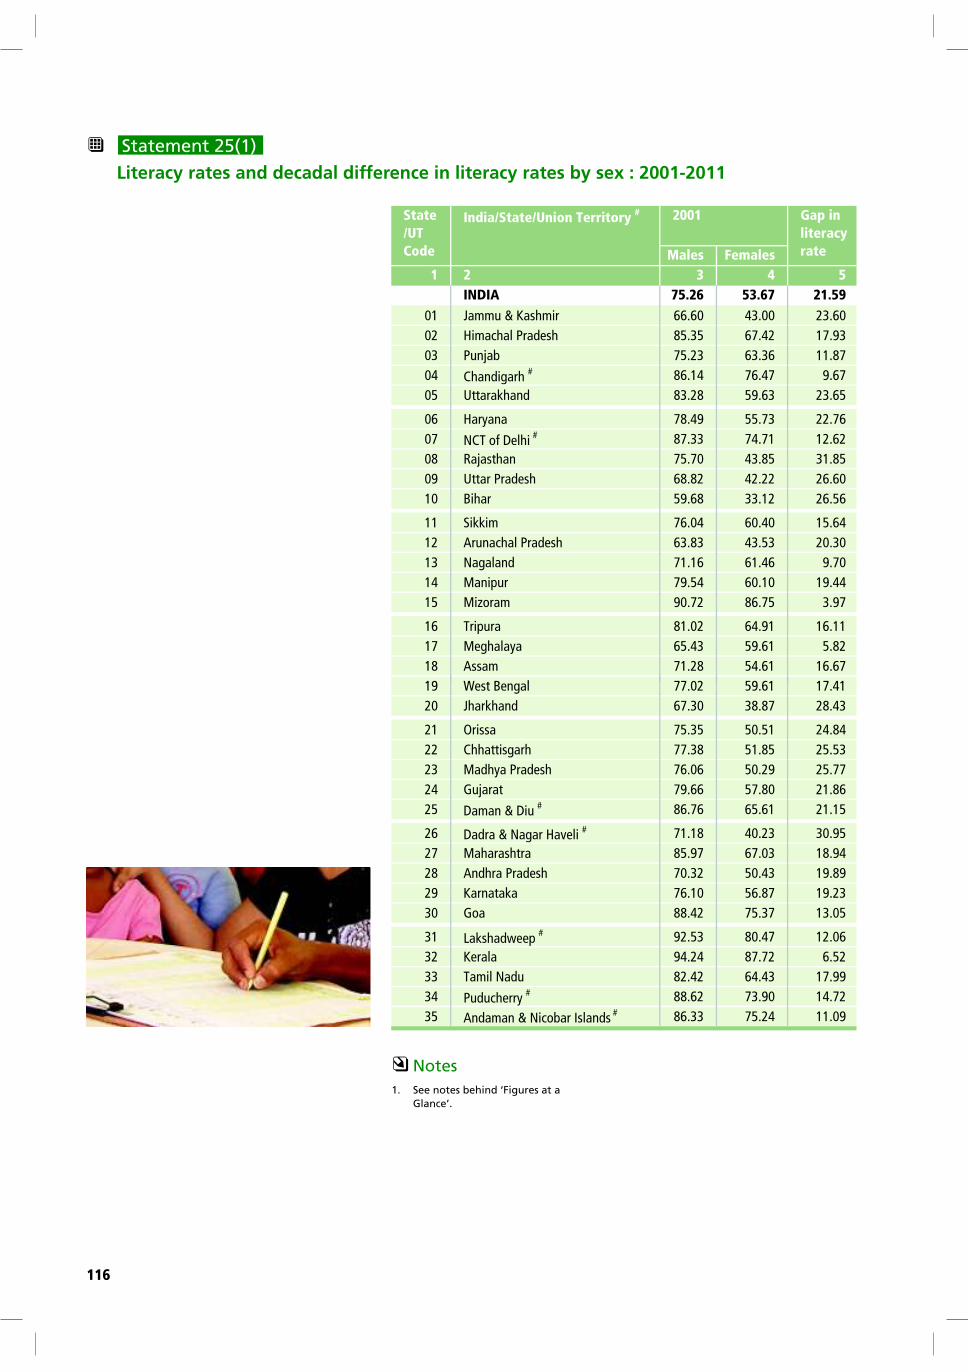
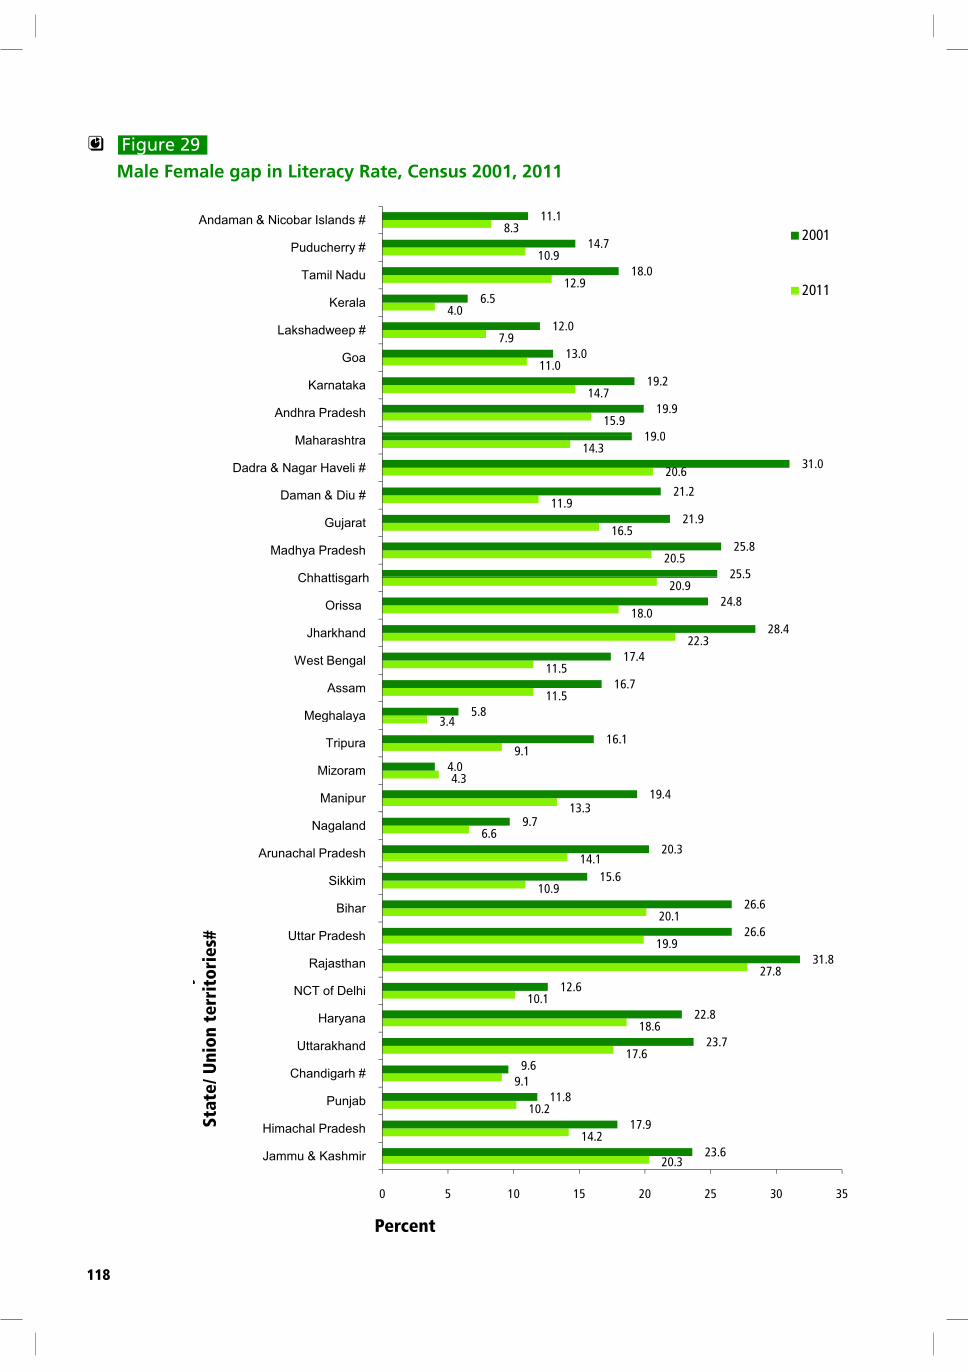
At the National level, the male-female gap for Census 2001 stood at 21.59 whereas for Census 2011 it is only 16.68. �e decadal di�erence in literacy rates for males and females stands at 6.88 and 11.79 percentage points respectively, indicating a substantial improvement in respect of females. In Census 2001, in 12 States and Union Territories, the male-female gap was higher than the National average and for 23 States and Union Territories, it was below the National average. In Census 2011, in 11 States, the male female gap is higher than the National average and for 24 States and Union Territories, it is below the National average. �e North-Eastern States of Meghalaya and Mizoram and Kerala from the South have reported minimum di�erentials in male-female gap in Census 2011 as well as in Census 2001. Mizoram had also reported the lowest di�erential even during 1991 Census followed by Kerala and Meghalaya. �ese States are consistent forerunners since decades. It is interesting to note that although average literacy rate in Meghalaya (75.48 per cent) is not high the male-female gap (3.39 percentage points) in literacy rate is lowest. Rajasthan, Jharkhand, Chhattisgarh, Madhya Pradesh and Jammu & Kashmir are at the bottom, showing huge gap in male-female di�erentials in literacy both at 2001 and 2011 Censuses. �e States and Union Territories which have achieved male-female gap of literacy rate of 10 percentage points or below, the target set by the Planning Commission to be achieved by year 2011-2012, are Punjab, Chandigarh, NCT of Delhi, Nagaland, Mizoram, Tripura, Meghalaya, Lakshadweep, Kerala and Andaman & Nicobar Islands. Male-Female literacy gap for States and Union Territories as per Census 2001 & 2011 has been presented in �gure-29. Statement 25 presents literacy rate and decadal di�erence in literacy rate by sex for 2001-2011.
The gap of 21.59 percentage
points recorded between male
and female literacy rates in
2001 Census has reduced to
16.68 percentage points in 2011.
Planning Commission has set up
target of reducing this gap to 10
percentage points by the year
2011-2012.
The States/Union Territories
which have achieved male-
female gap in literacy rate of
10 percentage points or less
are Punjab, Chandigarh, NCT of
Delhi, Nagaland, Mizoram, Tripura,
Meghalaya, Lakshadweep, Kerala
and Andaman & Nicobar Islands.
116
Statement 25(1)
Literacy rates and decadal difference in literacy rates by sex : 2001-2011
! Notes
1. See notes behind ‘Figures at a
Glance’.
Males Females
1 2 3 4 5
INDIA 75.26 53.67 21.59
01 Jammu & Kashmir 66.60 43.00 23.60
02 Himachal Pradesh 85.35 67.42 17.93
03 Punjab 75.23 63.36 11.87
04 Chandigarh # 86.14 76.47 9.67
05 Uttarakhand 83.28 59.63 23.65
06 Haryana 78.49 55.73 22.76
07 NCT of Delhi # 87.33 74.71 12.62
08 Rajasthan 75.70 43.85 31.85
09 Uttar Pradesh 68.82 42.22 26.60
10 Bihar 59.68 33.12 26.56
11 Sikkim 76.04 60.40 15.64
12 Arunachal Pradesh 63.83 43.53 20.30
13 Nagaland 71.16 61.46 9.70
14 Manipur 79.54 60.10 19.44
15 Mizoram 90.72 86.75 3.97
16 Tripura 81.02 64.91 16.11
17 Meghalaya 65.43 59.61 5.82
18 Assam 71.28 54.61 16.67
19 West Bengal 77 02 59 61 17 41
Gap in
literacy
rate
State
/UT
Code
India/State/Union Territory # 2001
19 West Bengal 77.02 59.61 17.41
20 Jharkhand 67.30 38.87 28.43
21 Orissa 75.35 50.51 24.84
22 Chhattisgarh 77.38 51.85 25.53
23 Madhya Pradesh 76.06 50.29 25.77
24 Gujarat 79.66 57.80 21.86
25 Daman & Diu # 86.76 65.61 21.15
26 Dadra & Nagar Haveli # 71.18 40.23 30.95
27 Maharashtra 85.97 67.03 18.94
28 Andhra Pradesh 70.32 50.43 19.89
29 Karnataka 76.10 56.87 19.23
30 Goa 88.42 75.37 13.05
31 Lakshadweep # 92.53 80.47 12.06
32 Kerala 94.24 87.72 6.52
33 Tamil Nadu 82.42 64.43 17.99
34 Puducherry # 88.62 73.90 14.72
35 Andaman & Nicobar Islands # 86.33 75.24 11.09
State of Literacy
PROVISIONAL POPULATION TOTALS – INDIA 117
Statement 25(2)
Literacy rates and decadal difference in literacy rates by sex : 2001-2011
! Notes
1. See notes behind ‘Figures at a
Glance’.
Males Females Males Females
6 7 8 9 10 1 2
82.14 65.46 16.68 6.88 11.79 INDIA
78.26 58.01 20.25 11.66 15.01 01 Jammu & Kashmir
90.83 76.60 14.23 5.48 9.18 02 Himachal Pradesh
81.48 71.34 10.14 6.25 7.98 03 Punjab
90.54 81.38 9.16 4.40 4.91 04 Chandigarh #
88.33 70.70 17.63 5.05 11.07 05 Uttarakhand
85.38 66.77 18.61 6.89 11.04 06 Haryana
91.03 80.93 10.10 3.70 6.22 07 NCT of Delhi #
80.51 52.66 27.85 4.81 8.81 08 Rajasthan
79.24 59.26 19.98 10.42 17.04 09 Uttar Pradesh
73.39 53.33 20.06 13.71 20.21 10 Bihar
87.29 76.43 10.86 11.25 16.03 11 Sikkim
73.69 59.57 14.12 9.86 16.04 12 Arunachal Pradesh
83.29 76.69 6.60 12.13 15.23 13 Nagaland
86.49 73.17 13.32 6.95 13.07 14 Manipur
93.72 89.40 4.32 3.00 2.65 15 Mizoram
92.18 83.15 9.03 11.16 18.24 16 Tripura
77.17 73.78 3.39 11.74 14.17 17 Meghalaya
78.81 67.27 11.54 7.53 12.66 18 Assam
82.67 71.16 11.51 5.65 11.55 19 West Bengal
78 45 56 21 22 24 11 15 17 34 20 Jharkhand
State
/UT
Code
India/State/
Union Territory #
2011 Gap in
literacy
rate
Decadal difference
in literacy rates
78.45 56.21 22.24 11.15 17.34 20 Jharkhand
82.40 64.36 18.04 7.05 13.85 21 Orissa
81.45 60.59 20.86 4.07 8.74 22 Chhattisgarh
80.53 60.02 20.51 4.47 9.73 23 Madhya Pradesh
87.23 70.73 16.50 7.57 12.93 24 Gujarat
91.48 79.59 11.89 4.72 13.98 25 Daman & Diu #
86.46 65.93 20.53 15.28 25.70 26 Dadra & Nagar Haveli #
89.82 75.48 14.34 3.85 8.45 27 Maharashtra
75.56 59.74 15.82 5.24 9.31 28 Andhra Pradesh
82.85 68.13 14.72 6.75 11.26 29 Karnataka
92.81 81.84 10.97 4.39 6.47 30 Goa
96.11 88.25 7.86 3.58 7.78 31 Lakshadweep #
96.02 91.98 4.04 1.78 4.26 32 Kerala
86.81 73.86 12.95 4.39 9.43 33 Tamil Nadu
92.12 81.22 10.90 3.50 7.32 34 Puducherry #
90.11 81.84 8.27 3.78 6.60 35 Andaman & Nicobar Islands #
118
" Figure 29
Male Female gap in Literacy Rate, Census 2001, 2011
12.9
10.9
8.3
18.0
14.7
11.1
Tamil Nadu
Puducherry #
Andaman & Nicobar Islands #
2001
2011
15.9
14.7
11.0
7.9
4.0
19 0
19.9
19.2
13.0
12.0
6.5
Andhra Pradesh
Karnataka
Goa
Lakshadweep #
Kerala2011
20.5
16.5
11.9
20.6
14.3
25 5
25.8
21.9
21.2
31.0
19.0
Madhya Pradesh
Gujarat
Daman & Diu #
Dadra & Nagar Haveli #
Maharashtra
3 4
11.5
11.5
22.3
18.0
20.9
5.8
16.7
17.4
28.4
24.8
25.5
Meghalaya
Assam
West Bengal
Jharkhand
Orissa
Chhattisgarh
14 1
6.6
13.3
4.3
9.1
3.4
20.3
9.7
19.4
4.0
16.1
Arunachal Pradesh
Nagaland
Manipur
Mizoram
Tripura
Meghalaya
10 1
27.8
19.9
20.1
10.9
14.1
12.6
31.8
26.6
26.6
15.6
NCT of Delhi
Rajasthan
Uttar Pradesh
Bihar
Sikkim
ory
#
14.2
10.2
9.1
17.6
18.6
10.1
17.9
11.8
9.6
23.7
22.8
Himachal Pradesh
Punjab
Chandigarh #
Uttarakhand
Haryana
te a
nd
Un
ion
Te
rrit
20.323.6
0 5 10 15 20 25 30 35
Jammu & KashmirSta
t
Percent
Sta
te
/ U
nio
n t
errit
orie
s#
State of Literacy
PROVISIONAL POPULATION TOTALS – INDIA 119
EFFECTIVE LITERACY RATE- A COMPARISON WITH NATIONAL SAMPLE
SURVEY ORGANISATION (64TH ROUND)
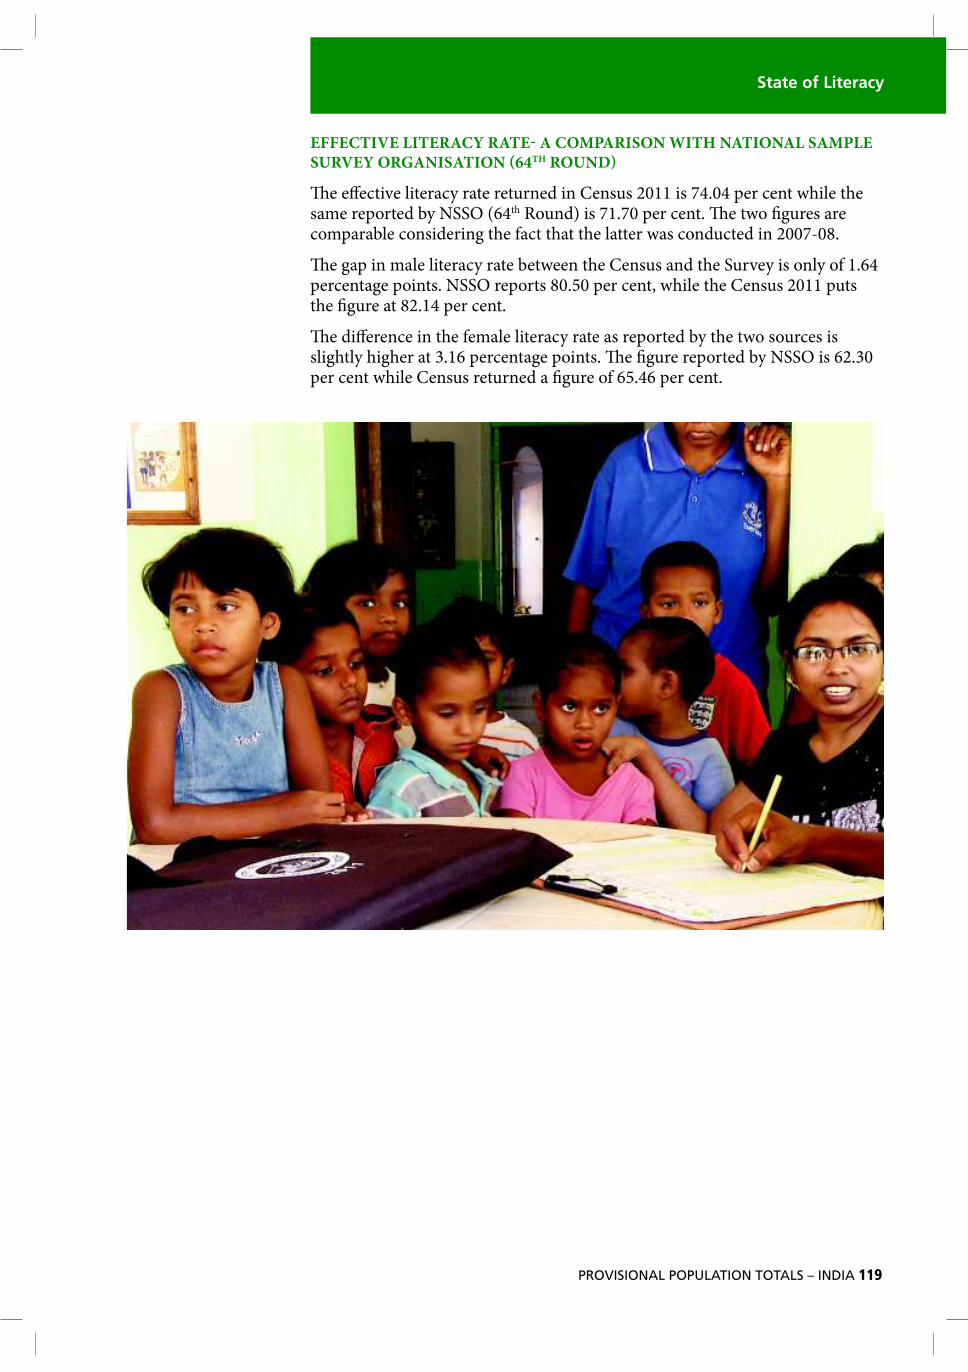
�e e�ective literacy rate returned in Census 2011 is 74.04 per cent while the same reported by NSSO (64th Round) is 71.70 per cent. �e two �gures are comparable considering the fact that the latter was conducted in 2007-08.
�e gap in male literacy rate between the Census and the Survey is only of 1.64 percentage points. NSSO reports 80.50 per cent, while the Census 2011 puts the �gure at 82.14 per cent.
�e di�erence in the female literacy rate as reported by the two sources is slightly higher at 3.16 percentage points. �e �gure reported by NSSO is 62.30 per cent while Census returned a �gure of 65.46 per cent.
120
Statement 26(1)
Comparison of literacy rates of Census 2011 with National Sample Survey (64th round) by Gender
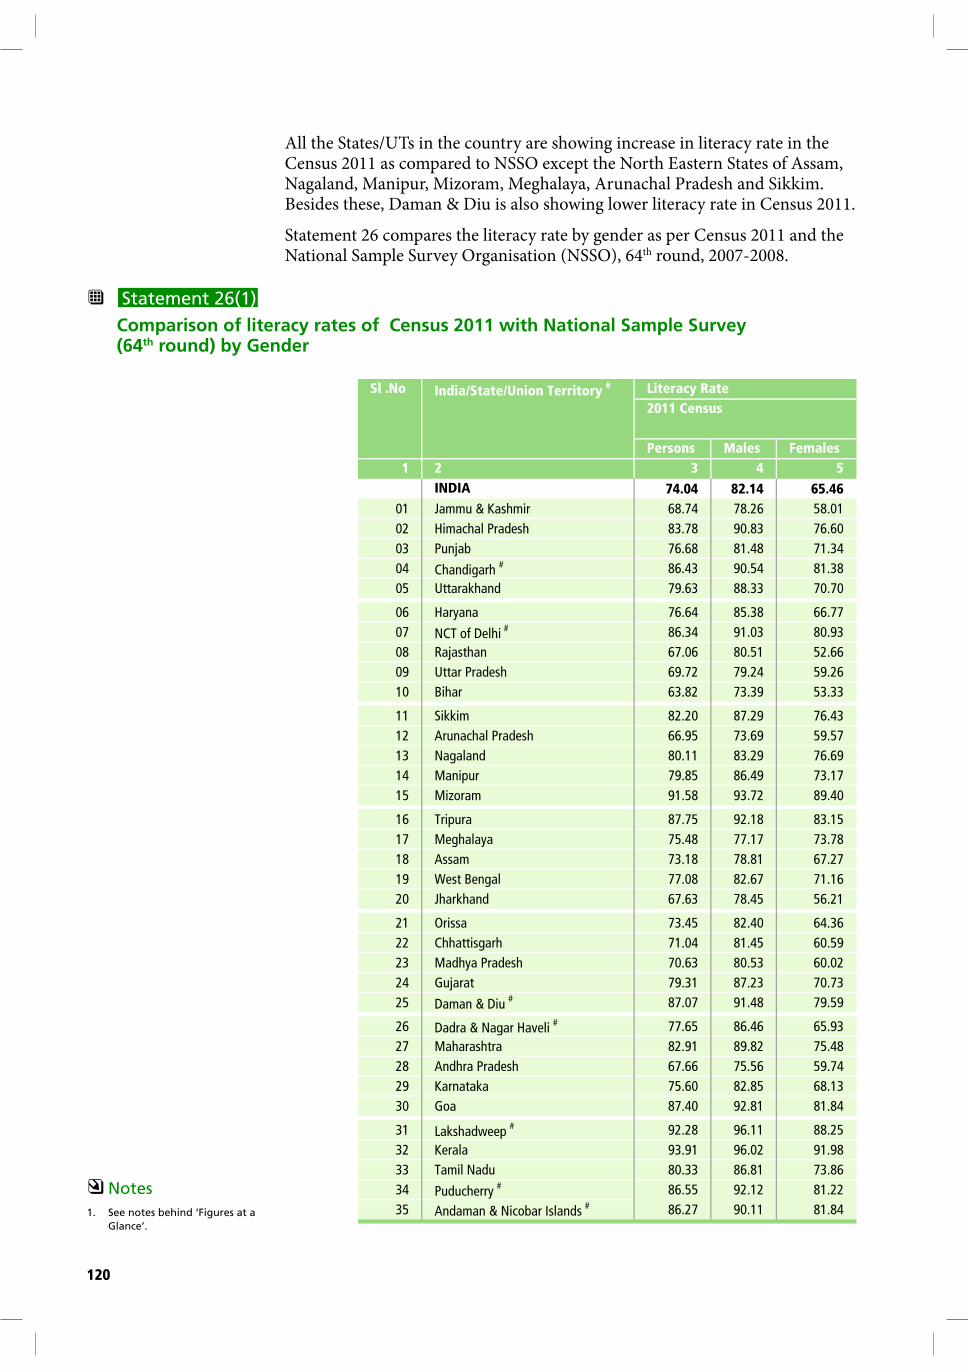
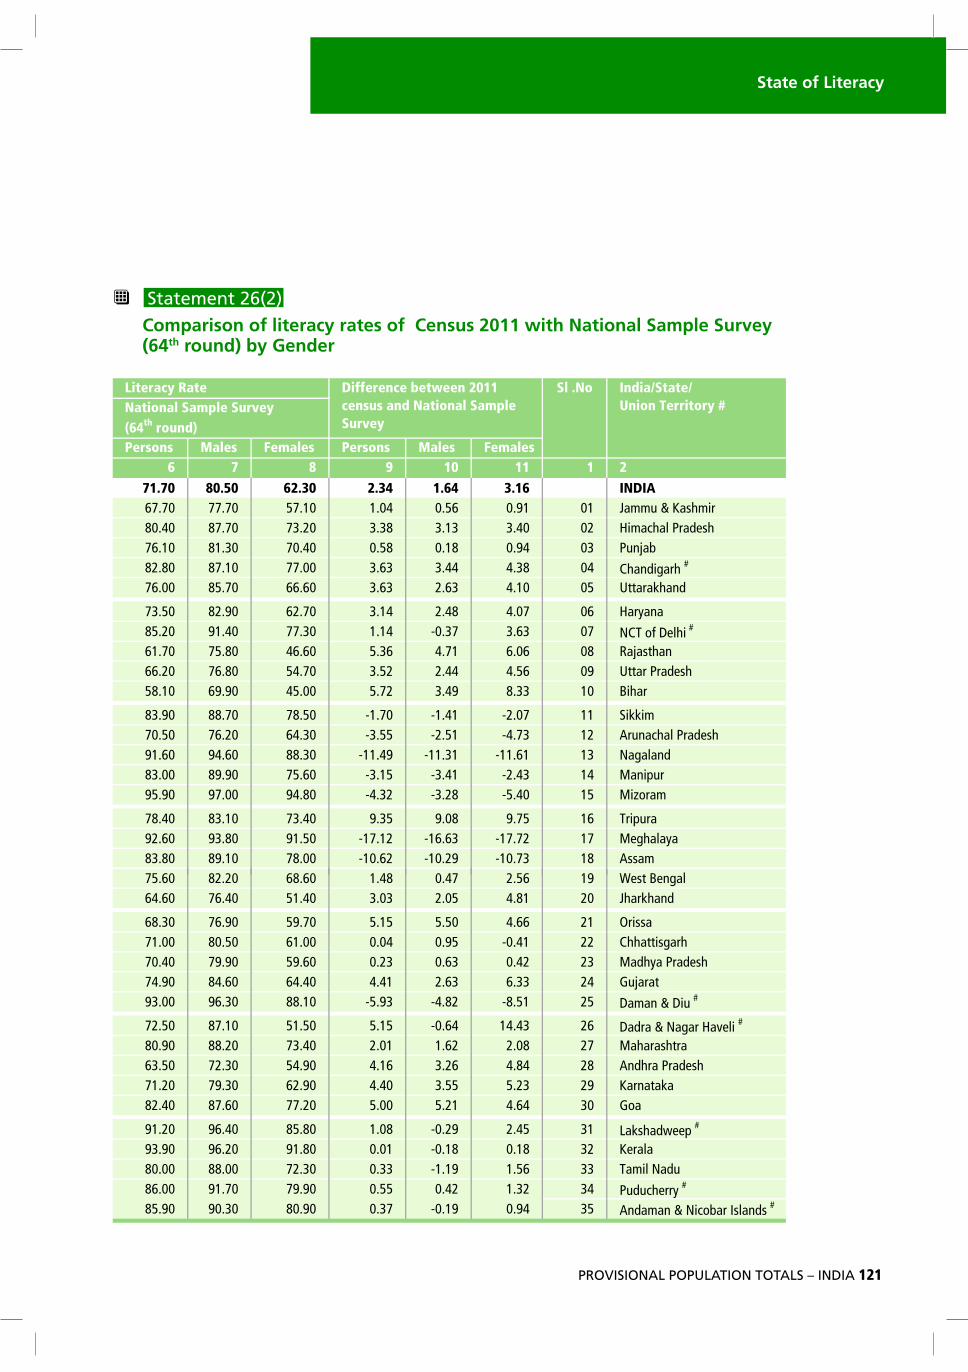
All the States/UTs in the country are showing increase in literacy rate in the Census 2011 as compared to NSSO except the North Eastern States of Assam, Nagaland, Manipur, Mizoram, Meghalaya, Arunachal Pradesh and Sikkim. Besides these, Daman & Diu is also showing lower literacy rate in Census 2011.
Statement 26 compares the literacy rate by gender as per Census 2011 and the National Sample Survey Organisation (NSSO), 64th round, 2007-2008.
! Notes
1. See notes behind ‘Figures at a
Glance’.
Persons Males Females
1 2 3 4 5
INDIA 74.04 82.14 65.46
01 Jammu & Kashmir 68.74 78.26 58.01
02 Himachal Pradesh 83.78 90.83 76.60
03 Punjab 76.68 81.48 71.34
04 Chandigarh # 86.43 90.54 81.38
05 Uttarakhand 79.63 88.33 70.70
06 Haryana 76.64 85.38 66.77
07 NCT of Delhi # 86.34 91.03 80.93
08 Rajasthan 67.06 80.51 52.66
09 Uttar Pradesh 69.72 79.24 59.26
10 Bihar 63.82 73.39 53.33
11 Sikkim 82.20 87.29 76.43
12 Arunachal Pradesh 66.95 73.69 59.57
13 Nagaland 80.11 83.29 76.69
14 Manipur 79.85 86.49 73.17
15 Mizoram 91.58 93.72 89.40
16 Tripura 87.75 92.18 83.15
17 Meghalaya 75.48 77.17 73.78
18 Assam 73.18 78.81 67.27
19 West Bengal 77.08 82.67 71.16
20 Jharkhand 67.63 78.45 56.21
21 Orissa 73.45 82.40 64.36
22 Chhattisgarh 71.04 81.45 60.59
23 Madhya Pradesh 70.63 80.53 60.02
24 Gujarat 79.31 87.23 70.73
25 Daman & Diu # 87.07 91.48 79.59
26 Dadra & Nagar Haveli # 77.65 86.46 65.93
27 Maharashtra 82.91 89.82 75.48
28 Andhra Pradesh 67.66 75.56 59.74
29 Karnataka 75.60 82.85 68.13
30 Goa 87.40 92.81 81.84
31 Lakshadweep # 92.28 96.11 88.25
32 Kerala 93.91 96.02 91.98
33 Tamil Nadu 80.33 86.81 73.86
34 Puducherry # 86.55 92.12 81.22
35 Andaman & Nicobar Islands # 86.27 90.11 81.84
Sl .No India/State/Union Territory # Literacy Rate
2011 Census
State of Literacy
PROVISIONAL POPULATION TOTALS – INDIA 121
Statement 26(2)
Comparison of literacy rates of Census 2011 with National Sample Survey (64th round) by Gender
Persons Males Females Persons Males Females
6 7 8 9 10 11 1 2
71.70 80.50 62.30 2.34 1.64 3.16 INDIA
67.70 77.70 57.10 1.04 0.56 0.91 01 Jammu & Kashmir
80.40 87.70 73.20 3.38 3.13 3.40 02 Himachal Pradesh
76.10 81.30 70.40 0.58 0.18 0.94 03 Punjab
82.80 87.10 77.00 3.63 3.44 4.38 04 Chandigarh #
76.00 85.70 66.60 3.63 2.63 4.10 05 Uttarakhand
73.50 82.90 62.70 3.14 2.48 4.07 06 Haryana
85.20 91.40 77.30 1.14 -0.37 3.63 07 NCT of Delhi #
61.70 75.80 46.60 5.36 4.71 6.06 08 Rajasthan
66.20 76.80 54.70 3.52 2.44 4.56 09 Uttar Pradesh
58.10 69.90 45.00 5.72 3.49 8.33 10 Bihar
83.90 88.70 78.50 -1.70 -1.41 -2.07 11 Sikkim
70.50 76.20 64.30 -3.55 -2.51 -4.73 12 Arunachal Pradesh
91.60 94.60 88.30 -11.49 -11.31 -11.61 13 Nagaland
83.00 89.90 75.60 -3.15 -3.41 -2.43 14 Manipur
95.90 97.00 94.80 -4.32 -3.28 -5.40 15 Mizoram
78.40 83.10 73.40 9.35 9.08 9.75 16 Tripura
92.60 93.80 91.50 -17.12 -16.63 -17.72 17 Meghalaya
83.80 89.10 78.00 -10.62 -10.29 -10.73 18 Assam
75 60 82 20 68 60 1 48 0 47 2 56 19 West Bengal
Sl .No India/State/
Union Territory #
Literacy Rate Difference between 2011
census and National Sample
SurveyNational Sample Survey
(64th
round)
75.60 82.20 68.60 1.48 0.47 2.56 19 West Bengal
64.60 76.40 51.40 3.03 2.05 4.81 20 Jharkhand
68.30 76.90 59.70 5.15 5.50 4.66 21 Orissa
71.00 80.50 61.00 0.04 0.95 -0.41 22 Chhattisgarh
70.40 79.90 59.60 0.23 0.63 0.42 23 Madhya Pradesh
74.90 84.60 64.40 4.41 2.63 6.33 24 Gujarat
93.00 96.30 88.10 -5.93 -4.82 -8.51 25 Daman & Diu #
72.50 87.10 51.50 5.15 -0.64 14.43 26 Dadra & Nagar Haveli #
80.90 88.20 73.40 2.01 1.62 2.08 27 Maharashtra
63.50 72.30 54.90 4.16 3.26 4.84 28 Andhra Pradesh
71.20 79.30 62.90 4.40 3.55 5.23 29 Karnataka
82.40 87.60 77.20 5.00 5.21 4.64 30 Goa
91.20 96.40 85.80 1.08 -0.29 2.45 31 Lakshadweep #
93.90 96.20 91.80 0.01 -0.18 0.18 32 Kerala
80.00 88.00 72.30 0.33 -1.19 1.56 33 Tamil Nadu
86.00 91.70 79.90 0.55 0.42 1.32 34 Puducherry #
85.90 90.30 80.90 0.37 -0.19 0.94 35 Andaman & Nicobar Islands #
122
ILLITERATES AT STATE/UT LEVEL
�e absolute number of illiterates decreased by 31,196,847 during the last decade. �e maximum, contribution in this decrease has come from Uttar Pradesh (7,424,572) followed by Bihar (4,250,715). �ese two States together account for 37.43 per cent of the total decrease in illiterates. �e other major States showing sizeable decrease in number of illiterates are West Bengal (9.44 per cent), Gujarat (7.60 per cent), Maharashtra (7.15 per cent), Karnataka (6.37 per cent), Tamil Nadu (5.82 per cent), Orissa (5.80 per cent), Andhra Pradesh (4.87 per cent) and Jharkhand (3.96 per cent).
�e States where number of illiterates has increased are Rajasthan (3.18 percent), Chhattisgarh (0.81 per cent) and Madhya Pradesh (0.80 per cent). In absolute terms the number of illiterates in Rajasthan increased by 991,420 followed by Chhattisgarh 252,116 and Madhya Pradesh 248,831.Statement 27 gives the number of illiterates, decadal decrease in illiterates and percentage contribution in its decrease during 2001-2011 at the State/Union Territory level.
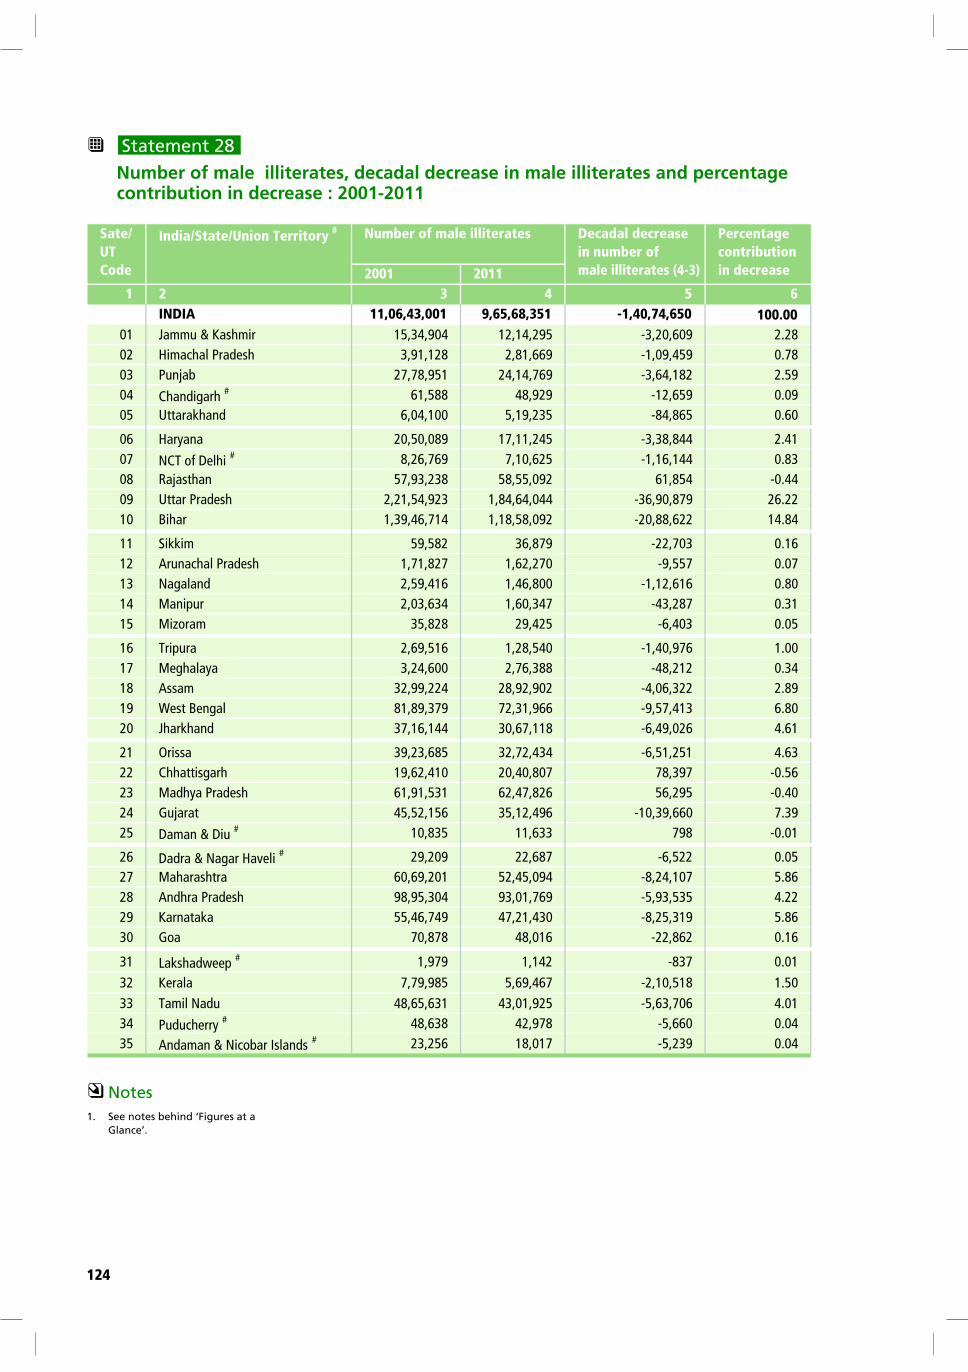
MALE ILLITERATES AT STATE/UT LEVEL
�e absolute number of male illiterates has decreased by 14,074,650 during the decade 2001-2011. It is encouraging to note that in all the States and Union Territories except Rajasthan, Chhattisgarh, Madhya Pradesh and Daman & Diu, the number of male illiterates has decreased. Even in the States/UTs where the number of male illiterates has increased, the increase is not sizeable in absolute terms. �e States which have contribution of more than !ve percentage points in decadal decrease are Uttar Pradesh (26.22 per cent), Bihar (14.84 per cent), Gujarat (7.39 per cent), West Bengal (6.80 per cent), Maharashtra and Karnataka (5.86 per cent) each. Statement 28 presents State level !gures of male illiterates in the 2001 and 2011 Censuses, the decadal decrease in male illiterates and the percentage contribution in their decrease.
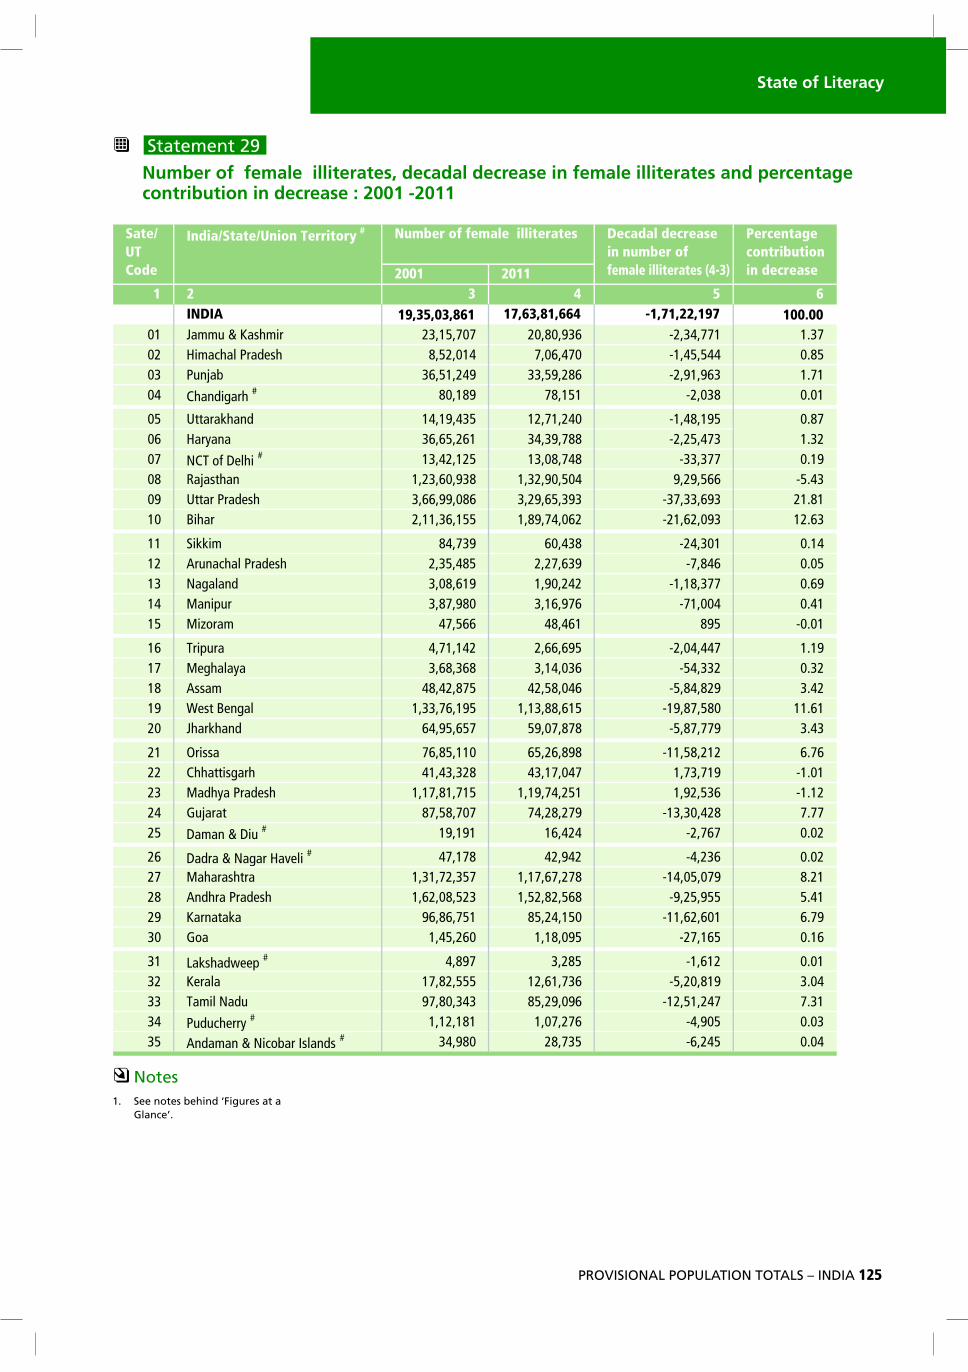
FEMALE ILLITERATES AT STATE/UT LEVEL
It is encouraging to note that the number of female illiterates has gone down by 17,122,197 during 2001-2011. However, the number of female illiterates has increased in Rajasthan (929,566), Madhya Pradesh (192,536), Chhattisgarh (173,719) and Mizoram (895). �e States which have contributed signi!cantly in decreasing the number of female illiterates are Uttar Pradesh (21.81 per cent), Bihar (12.63 per cent), West Bengal (11.61 per cent), Maharashtra (8.21 per cent),), Gujarat (7.77 per cent), Tamil Nadu (7.31 per cent) , Karnataka (6.79 per cent), Orissa (6.76 per cent) and Andhra Pradesh (5.41 per cent).Statement 29 presents the State/ Union Territory level !gures of female illiterates in the 2001 and 2011 Censuses, the decadal decrease in female illiterates and the percentage contribution in their decrease.

State of Literacy
PROVISIONAL POPULATION TOTALS – INDIA 123
Statement 27
Number of illiterates, decadal decrease in illiterates and percentage contribution in decrease : 2001, 2011
2001 2011
1 2 3 4 5 6
INDIA 30,41,46,862 27,29,50,015 -3,11,96,847 100.00
01 Jammu & Kashmir 38,50,611 32,95,231 -5,55,380 1.78
02 Himachal Pradesh 12,43,142 9,88,139 -2,55,003 0.82
03 Punjab 64,30,200 57,74,055 -6,56,145 2.10
04 Chandigarh # 1,41,777 1,27,080 -14,697 0.05
05 Uttarakhand 20,23,535 17,90,475 -2,33,060 0.75
06 Haryana 57,15,350 51,51,033 -5,64,317 1.81
07 NCT of Delhi # 21,68,894 20,19,373 -1,49,521 0.48
08 Rajasthan 1,81,54,176 1,91,45,596 9,91,420 -3.18
09 Uttar Pradesh 5,88,54,009 5,14,29,437 -74,24,572 23.80
10 Bihar 3,50,82,869 3,08,32,154 -42,50,715 13.63
11 Sikkim 1,44,321 97,317 -47,004 0.15
12 Arunachal Pradesh 4,07,312 3,89,909 -17,403 0.06
13 Nagaland 5,68,035 3,37,042 -2,30,993 0.74
14 Manipur 5,91,614 4,77,323 -1,14,291 0.37
15 Mizoram 83,394 77,886 -5,508 0.02
16 Tripura 7,40,658 3,95,235 -3,45,423 1.11
17 Meghalaya 6,92,968 5,90,424 -1,02,544 0.33
18 Assam 81,42,099 71,50,948 -9,91,151 3.18
19 West Bengal 2,15,65,574 1,86,20,581 -29,44,993 9.44
20 Jharkhand 1,02,11,801 89,74,996 -12,36,805 3.96
21 Orissa 1,16,08,795 97,99,332 -18,09,463 5.80
22 Chhattisgarh 61,05,738 63,57,854 2,52,116 -0.81
23 Madhya Pradesh 1,79,73,246 1,82,22,077 2,48,831 -0.80
24 Gujarat 1,33,10,863 1,09,40,775 -23,70,088 7.60
25 Daman & Diu # 30,026 28,057 -1,969 0.01
26 Dadra & Nagar Haveli # 76,387 65,629 -10,758 0.03
27 Maharashtra 1,92,41,558 1,70,12,372 -22,29,186 7.15
28 Andhra Pradesh 2,61,03,827 2,45,84,337 -15,19,490 4.87
29 Karnataka 1,52,33,500 1,32,45,580 -19,87,920 6.37
30 Goa 2,16,138 1,66,111 -50,027 0.16
31 Lakshadweep # 6,876 4,427 -2,449 0.01
32 Kerala 25,62,540 18,31,203 -7,31,337 2.34
33 Tamil Nadu 1,46,45,974 1,28,31,021 -18,14,953 5.82
34 Puducherry # 1,60,819 1,50,254 -10,565 0.03
35 Andaman & Nicobar Islands # 58,236 46,752 -11,484 0.04
Sate/
UT
Code
India/State/Union Territory # Number of illiterates Decadal
decrease in
number of
illiterates (4-3)
Percentage
contribution
in decrease
! Notes
1. See notes behind ‘Figures at a
Glance’.
124
Statement 28
Number of male illiterates, decadal decrease in male illiterates and percentage contribution in decrease : 2001-2011
2001 2011
654321
056,47,04,1-153,86,56,9100,34,60,11AIDNI 100.00
01 Jammu & Kashmir 15,34,904 12,14,295 -3,20,609 2.28
87.0954,90,1-966,18,2821,19,3hsedarP lahcamiH20
95.2281,46,3-967,41,42159,87,72bajnuP30
04 Chandigarh # 61,588 48,929 -12,659 0.09
06.0568,48-532,91,5001,40,6dnahkarattU50
14.2448,83,3-542,11,71980,05,02anayraH60
07 NCT of Delhi # 8,26,769 7,10,625 -1,16,144 0.83
44.0-458,16290,55,85832,39,75nahtsajaR80
22.62978,09,63-440,46,48,1329,45,12,2hsedarP rattU90
48.41226,88,02-290,85,81,1417,64,93,1rahiB01
61.0307,22-978,63285,95mikkiS11
70.0755,9-072,26,1728,17,1hsedarP lahcanurA21
08.0616,21,1-008,64,1614,95,2dnalagaN31
13.0782,34-743,06,1436,30,2rupinaM41
50.0304,6-524,92828,53maroziM51
00.1679,04,1-045,82,1615,96,2arupirT61
43.0212,84-883,67,2006,42,3ayalahgeM71
98.2223,60,4-209,29,82422,99,23massA81
08.6314,75,9-669,13,27973,98,18lagneB tseW91
16.4620,94,6-811,76,03441,61,73dnahkrahJ02
36.4152,15,6-434,27,23586,32,93assirO12
65.0-793,87708,04,02014,26,91hragsittahhC22
04.0-592,65628,74,26135,19,16hsedarP ayhdaM32
93.7066,93,01-694,21,53651,25,54tarajuG42
25 Daman & Diu # 10,835 11,633 798 -0.01
26 Dadra & Nagar Haveli # 29,209 22,687 -6,522 0.05
68.5701,42,8-490,54,25102,96,06arthsarahaM72
22.4535,39,5-967,10,39403,59,89hsedarP arhdnA82
68.5913,52,8-034,12,74947,64,55akatanraK92
61.0268,22-610,84878,07aoG03
31 Lakshadweep # 1,979 1,142 -837 0.01
05.1815,01,2-764,96,5589,97,7alareK23
10.4607,36,5-529,10,34136,56,84udaN limaT33
34 Puducherry # 48,638 42,978 -5,660 0.04
35 Andaman & Nicobar Islands # 23,256 18,017 -5,239 0.04
Sate/
UT
Code
India/State/Union Territory # Number of male illiterates Decadal decrease
in number of
male illiterates (4-3)
Percentage
contribution
in decrease
! Notes
1. See notes behind ‘Figures at a
Glance’.
State of Literacy
PROVISIONAL POPULATION TOTALS – INDIA 125
Statement 29
Number of female illiterates, decadal decrease in female illiterates and percentage contribution in decrease : 2001 -2011
2001 2011
654321
INDIA 19,35,03,861 17,63,81,664 -1,71,22,197 100.00
01 Jammu & Kashmir 23,15,707 20,80,936 -2,34,771 1.37
58.0445,54,1-074,60,7410,25,8hsedarP lahcamiH20
17.1369,19,2-682,95,33942,15,63bajnuP30
04 Chandigarh # 80,189 78,151 -2,038 0.01
78.0591,84,1-042,17,21534,91,41dnahkarattU50
23.1374,52,2-887,93,43162,56,63anayraH60
07 NCT of Delhi # 13,42,125 13,08,748 -33,377 0.19
34.5-665,92,9405,09,23,1839,06,32,1nahtsajaR80
18.12396,33,73-393,56,92,3680,99,66,3hsedarP rattU90
36.21390,26,12-260,47,98,1551,63,11,2rahiB01
41.0103,42-834,06937,48mikkiS11
50.0648,7-936,72,2584,53,2hsedarP lahcanurA21
96.0773,81,1-242,09,1916,80,3dnalagaN31
14.0400,17-679,61,3089,78,3rupinaM41
10.0-598164,84665,74maroziM51
91.1744,40,2-596,66,2241,17,4arupirT61
23.0233,45-630,41,3863,86,3ayalahgeM71
24.3928,48,5-640,85,24578,24,84massA81
16.11085,78,91-516,88,31,1591,67,33,1lagneB tseW91
34.3977,78,5-878,70,95756,59,46dnahkrahJ02
67.6212,85,11-898,62,56011,58,67assirO12
10.1-917,37,1740,71,34823,34,14hragsittahhC22
23 Madhya Pradesh 1,17,81,715 1,19,74,251 1,92,536 -1.12
77.7824,03,31-972,82,47707,85,78tarajuG42
25 Daman & Diu # 19,191 16,424 -2,767 0.02
26 Dadra & Nagar Haveli # 47,178 42,942 -4,236 0.02
12.8970,50,41-872,76,71,1753,27,13,1arthsarahaM72
28 Andhra Pradesh 1,62,08,523 1,52,82,568 -9,25,955 5.41
97.6106,26,11-051,42,58157,68,69akatanraK92
61.0561,72-590,81,1062,54,1aoG03
31 Lakshadweep # 4,897 3,285 -1,612 0.01
40.3918,02,5-637,16,21555,28,71alareK23
13.7742,15,21-690,92,58343,08,79udaN limaT33
34 Puducherry # 1,12,181 1,07,276 -4,905 0.03
35 Andaman & Nicobar Islands # 34,980 28,735 -6,245 0.04
Sate/
UT
Code
India/State/Union Territory # Number of female illiterates Decadal decrease
in number of
female illiterates (4-3)
Percentage
contribution
in decrease
! Notes
1. See notes behind ‘Figures at a
Glance’.
126
LITERATES BY RANGE
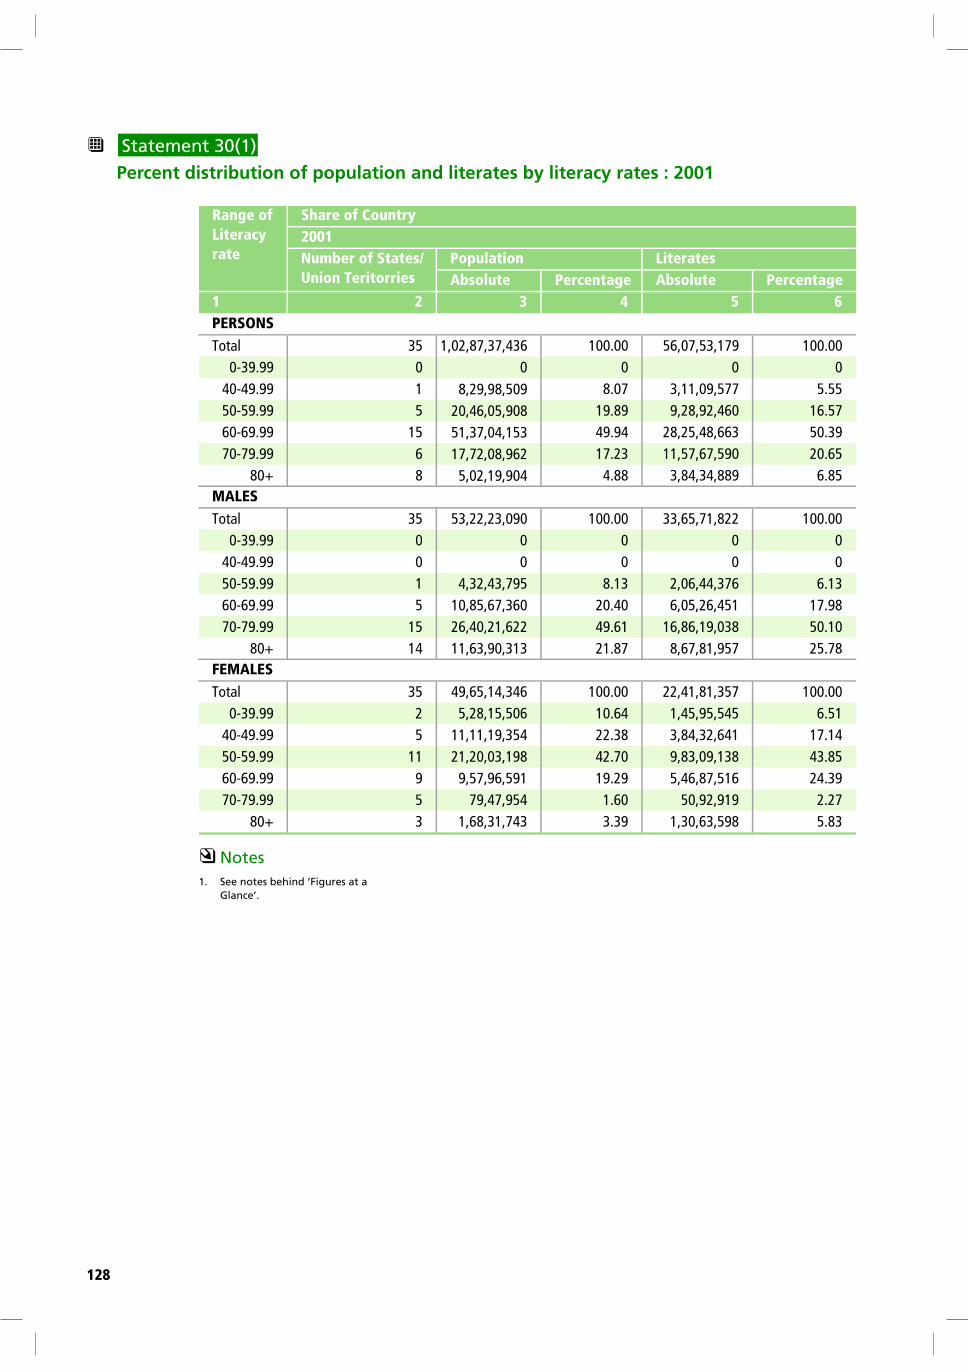
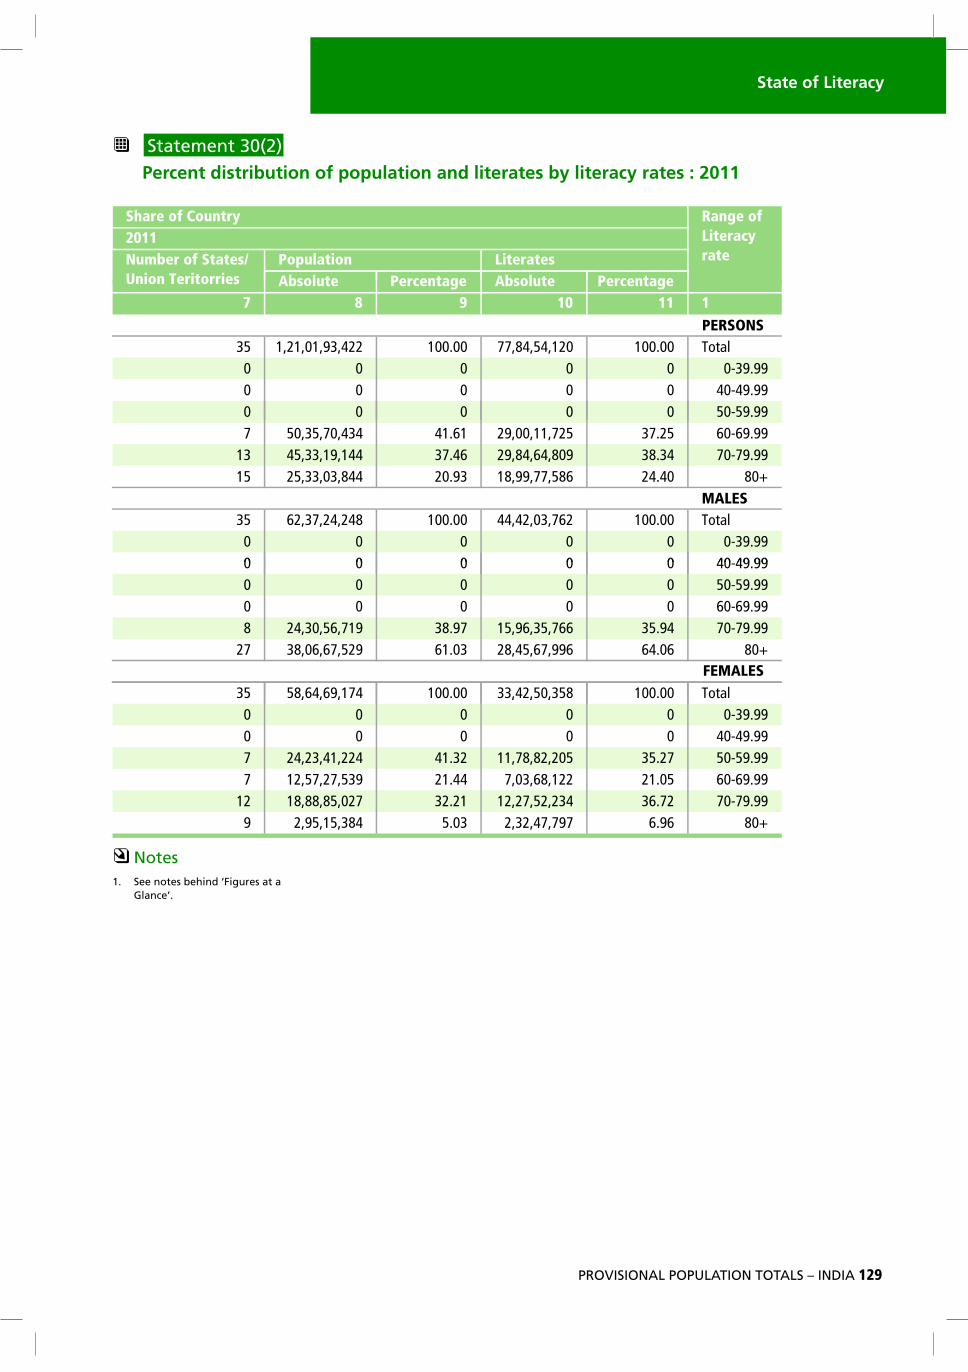
In Census 2001, only one State had reported literacy rate below !"y per cent and had a share of eight per cent of the country’s total population and 5.55 per cent of country’s total literates. It is really satisfying to note that in Census 2011 none of the State/Union Territory has reported literacy rate below sixty per cent. �e number of the States and Union Territories having more than eighty per cent literacy rate in Census 2001 was eight. �is has increased to 15 at the Census 2011.
�ere was only one State having male literacy rate in the range of the !"y-sixty per cent in Census 2001, accounting for 8.13 per cent of the country’s male population. It is heartening to note that in Census 2011, in all the States and Union Territories the male literacy rate is above seventy per cent. �e number of States and Union Territories having male literacy of seventy per cent and above was twenty nine in Census 2001 covering seventy one per cent of population. �e corresponding number for Census 2011 is thirty !ve covering cent per cent country’s male population.
�ere were seven States/ Union Territories having female literacy rate in the range of !"y per cent and below and had a share of thirty three per cent of the country’s total female population whereas in Census 2011, the corresponding number stands at zero. Census 2011 marks the decade when the country achieved more than !"y per cent literacy for females in all States. �e number of States and Union Territories having female literacy of seventy per cent and above was only eight in Census 2001 covering around !ve per cent of population. �e corresponding number for Census 2011 is as high as twenty one covering more than thirty seven per cent female population.
Statement 30 presents comparable !gures for population and literates in absolute numbers and in percent for 2001 and 2011 Censuses by Range of literacy rates.
�e state of Literacy in India as per the provisional population totals of Census 2011 presents a highly encouraging picture. �e highlights have been the decline of the number of illiterates and the increase in the number of literates across the country. �e most encouraging trend has been the narrowing down of the gender gap in literacy. �ough a detailed analysis would reveal more contours, a prima facie inference is that a large proportion of the children born a"er 2001 are becoming literate. A note of caution has however to be struck. A few States have shown a tendency to slip back into illiteracy a"er having attained a certain level of literacy. �is slide back has to be arrested and the momentum to be sustained in order to achieve the cherished goal of universal literacy.

State of Literacy
PROVISIONAL POPULATION TOTALS – INDIA 127
128
Statement 30(1)
Percent distribution of population and literates by literacy rates : 2001
! Notes
1. See notes behind ‘Figures at a
Glance’.
Absolute Percentage Absolute Percentage
1 2 3 4 5 6
Total 35 1,02,87,37,436 100.00 56,07,53,179 100.00
0-39.99 0 0 0 0 0
40-49.99 1 8,29,98,509 8.07 3,11,09,577 5.55
50-59.99 5 20,46,05,908 19.89 9,28,92,460 16.57
60-69.99 15 51,37,04,153 49.94 28,25,48,663 50.39
70-79.99 6 17,72,08,962 17.23 11,57,67,590 20.65
80+ 8 5,02,19,904 4.88 3,84,34,889 6.85
Total 35 53,22,23,090 100.00 33,65,71,822 100.00
0-39.99 0 0 0 0 0
40-49.99 0 0 0 0 0
50-59.99 1 4,32,43,795 8.13 2,06,44,376 6.13
60-69.99 5 10,85,67,360 20.40 6,05,26,451 17.98
70-79.99 15 26,40,21,622 49.61 16,86,19,038 50.10
80+ 14 11,63,90,313 21.87 8,67,81,957 25.78
Total 35 49,65,14,346 100.00 22,41,81,357 100.00
0-39.99 2 5,28,15,506 10.64 1,45,95,545 6.51
40-49.99 5 11,11,19,354 22.38 3,84,32,641 17.14
50-59.99 11 21,20,03,198 42.70 9,83,09,138 43.85
60-69.99 9 9,57,96,591 19.29 5,46,87,516 24.39
70-79.99 5 79,47,954 1.60 50,92,919 2.27
80+ 3 1,68,31,743 3.39 1,30,63,598 5.83
Number of States/
Union Teritorries
Population Literates
PERSONS
MALES
FEMALES
Range of
Literacy
rate
Share of Country
2001
State of Literacy
PROVISIONAL POPULATION TOTALS – INDIA 129
Statement 30(2)
Percent distribution of population and literates by literacy rates : 2011
! Notes
1. See notes behind ‘Figures at a
Glance’.
Absolute Percentage Absolute Percentage
Number of States/
Union Teritorries
Population Literates
Range of
Literacy
rate
Share of Country
2011
Absolute Percentage Absolute Percentage
7 8 9 10 11 1
PERSONS
35 1,21,01,93,422 100.00 77,84,54,120 100.00 Total
0 0 0 0 0 0-39.99
0 0 0 0 0 40-49.99
0 0 0 0 0 50-59.99
Union Teritorries
7 50,35,70,434 41.61 29,00,11,725 37.25 60-69.99
13 45,33,19,144 37.46 29,84,64,809 38.34 70-79.99
15 25,33,03,844 20.93 18,99,77,586 24.40 80+
MALES
35 62,37,24,248 100.00 44,42,03,762 100.00 Total
0 0 0 0 0 0-39.99
0 0 0 0 0 40 49 990 0 0 0 0 40-49.99
0 0 0 0 0 50-59.99
0 0 0 0 0 60-69.99
8 24,30,56,719 38.97 15,96,35,766 35.94 70-79.99
27 38,06,67,529 61.03 28,45,67,996 64.06 80+
35 58,64,69,174 100.00 33,42,50,358 100.00 Total
FEMALES
, , , , , ,
0 0 0 0 0 0-39.99
0 0 0 0 0 40-49.99
7 24,23,41,224 41.32 11,78,82,205 35.27 50-59.99
7 12,57,27,539 21.44 7,03,68,122 21.05 60-69.99
12 18,88,85,027 32.21 12,27,52,234 36.72 70-79.99
9 2,95,15,384 5.03 2,32,47,797 6.96 80+
130
" Map 14
Effective Literacy Rate, 2001 (States/Union Territories)
Arunachal Pradesh
54.3
INDIA
Effective Literacy Rate, 2001
(States/Union Territories)
Effective Literacy Rate
Jammu & Kashmir55.5
Punjab69.7
Rajasthan60.4
Gujarat69.1
Maharashtra76.9
Goa82.0
Karnataka66.6
Kerala90.9
Tamil Nadu73.5
Andhra Pradesh60.5
Chhattisgarh64.7
Orissa63.1
Tripura73.2Jharkhand
53.6
(P)Puducherry81.2
(P)
(P)
(P)
Lakshadweep86.7
Andaman & Nicobar Islands81.3
Indira Point
Barren I.(India)
Narcondam I.(India)
BAY OF BENGAL
INDIAN OCEAN
ARABIAN SEA
Daman & Diu78.2
Himachal Pradesh76.5
Chandigarh81.9 Uttarakhand
71.6Haryana67.9
Uttar Pradesh56.3
Dadra & Nagar Haveli57.6
West Bengal68.6
Madhya Pradesh63.7
Sikkim68.8
Bihar47.0
NCT of Delhi81.7
Meghalaya62.6
Assam63.3
Mizoram88.8
Manipur69.9
Nagaland66.6
75 80 8570
National Average : 64.8
0100 50050
Kilometres
State of Literacy
PROVISIONAL POPULATION TOTALS – INDIA 131
" Map 15
Effective Literacy Rate, 2011 (States/Union Territories)
Arunachal Pradesh67.0
INDIA
Effective Literacy Rate, 2011
(States/Union Territories)
Effective Literacy Rate
Jammu & Kashmir68.7
Punjab76.7
Rajasthan67.1
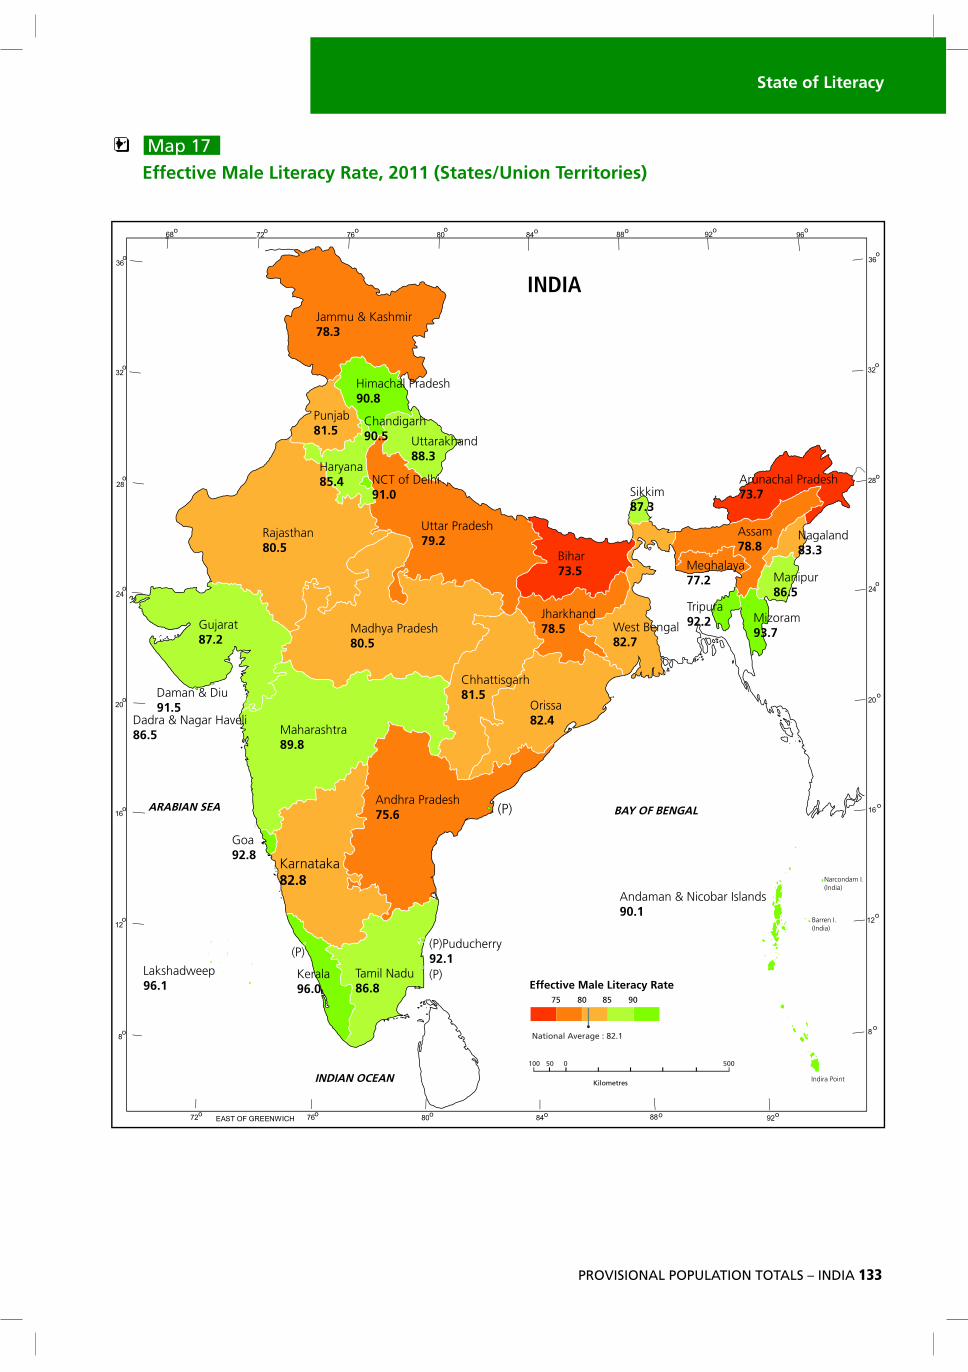
Gujarat79.3
Maharashtra82.9
Goa87.4
Karnataka75.6
Kerala93.9
Tamil Nadu80.3
Andhra Pradesh67.7
Chhattisgarh71.0
Orissa73.5
Tripura87.8Jharkhand
67.6
(P)Puducherry86.5
(P)
(P)
(P)
Lakshadweep92.3
Andaman & Nicobar Islands86.3
Indira Point
Barren I.(India)
Narcondam I.(India)
BAY OF BENGAL
INDIAN OCEAN
ARABIAN SEA
Daman & Diu87.1
Himachal Pradesh83.8
Chandigarh86.4 Uttarakhand
79.6Haryana76.6
Uttar Pradesh69.7
Dadra & Nagar Haveli77.7
West Bengal77.1
Madhya Pradesh70.6
Sikkim82.2
Bihar63.8
NCT of Delhi86.3
Meghalaya75.5
Assam73.2
Mizoram91.6
Manipur79.8
Nagaland80.1
75 80 8570
National Average : 74.0
0100 50050
Kilometres
132
" Map 16
Effective Male Literacy Rate, 2001 (States/Union Territories)
Effective Male Literacy Rate
Arunachal Pradesh63.8
INDIA
Effective Male Literacy Rate, 2001
(States/Union Territories)
Jammu & Kashmir66.6
Punjab75.2
Rajasthan75.7
Gujarat79.7
Maharashtra86.0
Goa88.4
Karnataka76.1
Kerala94.2
Tamil Nadu82.4
Andhra Pradesh70.3
Chhattisgarh77.4
Orissa75.3
Tripura81.0Jharkhand
67.3
(P)Puducherry88.6
(P)
(P)
(P)
Lakshadweep92.5
Andaman & Nicobar Islands86.3
Indira Point
Barren I.(India)
Narcondam I.(India)
BAY OF BENGAL
INDIAN OCEAN
ARABIAN SEA
Daman & Diu86.8
Himachal Pradesh85.3
Chandigarh86.1 Uttarakhand
83.3Haryana78.5
Uttar Pradesh68.8
Dadra & Nagar Haveli71.2
West Bengal77.0
Madhya Pradesh76.1
Sikkim76.0
Bihar59.7
NCT of Delhi87.3
Meghalaya65.4
Assam71.3
Mizoram90.7
Manipur79.5
Nagaland71.2
80 85 9075
National Average : 75.3
0100 50050
Kilometres
State of Literacy
PROVISIONAL POPULATION TOTALS – INDIA 133
" Map 17
Effective Male Literacy Rate, 2011 (States/Union Territories)
Arunachal Pradesh73.7
INDIA
Effective Male Literacy Rate, 2011
(States/Union Territories)
Effective Male Literacy Rate
Jammu & Kashmir78.3
Punjab81.5
Rajasthan80.5
Gujarat87.2
Maharashtra89.8
Goa92.8
Karnataka82.8
Kerala96.0
Tamil Nadu86.8
Andhra Pradesh75.6
Chhattisgarh81.5
Orissa82.4
Tripura92.2
Jharkhand78.5
(P)Puducherry92.1
(P)
(P)
(P)
Lakshadweep96.1
Andaman & Nicobar Islands90.1
Indira Point
Barren I.(India)
Narcondam I.(India)
BAY OF BENGAL
INDIAN OCEAN
ARABIAN SEA
Daman & Diu91.5
Himachal Pradesh90.8
Chandigarh90.5 Uttarakhand
88.3Haryana85.4
Uttar Pradesh79.2
Dadra & Nagar Haveli86.5
West Bengal82.7
Madhya Pradesh80.5
Sikkim87.3
Bihar73.5
NCT of Delhi91.0
Meghalaya77.2
Assam78.8
Mizoram93.7
Manipur86.5
Nagaland83.3
80 85 9075
National Average : 82.1
0100 50050
Kilometres
134
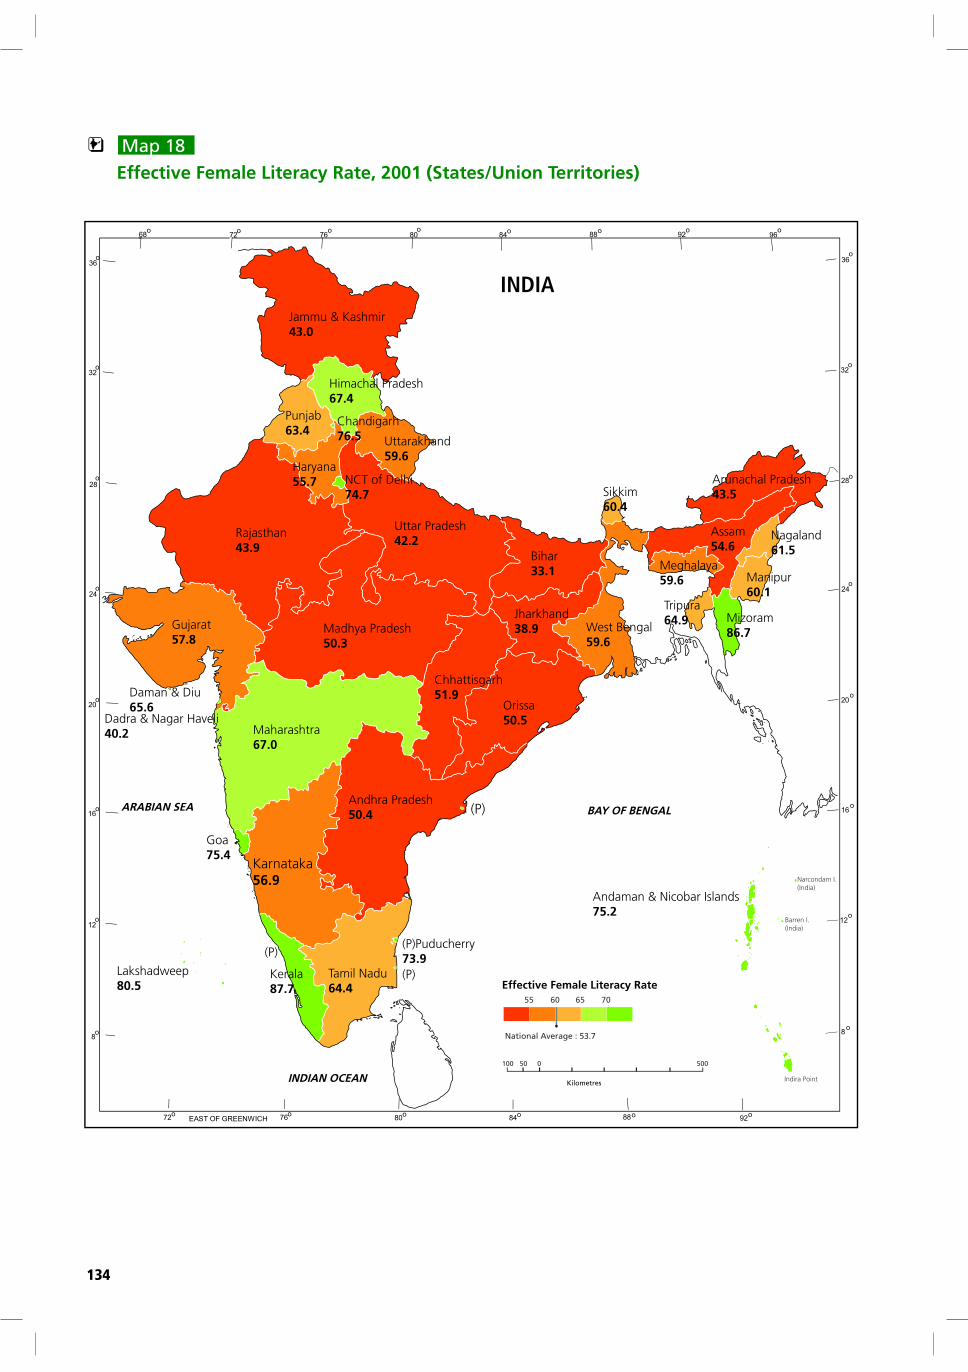
" Map 18
Effective Female Literacy Rate, 2001 (States/Union Territories)
Arunachal Pradesh43.5
INDIA
Effective Female Literacy Rate, 2001
(States/Union Territories)
Jammu & Kashmir43.0
Punjab63.4
Rajasthan43.9
Gujarat57.8
Maharashtra67.0
Goa75.4
Karnataka56.9
Kerala87.7
Tamil Nadu64.4
Andhra Pradesh50.4
Chhattisgarh51.9
Orissa50.5
Tripura64.9
Jharkhand38.9
(P)Puducherry73.9
(P)
(P)
(P)
Lakshadweep80.5
Andaman & Nicobar Islands75.2
Indira Point
Barren I.(India)
Narcondam I.(India)
BAY OF BENGAL
INDIAN OCEAN
ARABIAN SEA
Daman & Diu65.6
Himachal Pradesh67.4
Chandigarh76.5 Uttarakhand
59.6Haryana55.7
Uttar Pradesh42.2
Dadra & Nagar Haveli40.2
West Bengal59.6
Madhya Pradesh50.3
Sikkim60.4
Bihar33.1
NCT of Delhi74.7
Meghalaya59.6
Assam54.6
Mizoram86.7
Manipur60.1
Nagaland61.5
60 65 7055
National Average : 53.7
0100 50050
Kilometres
Effective Female Literacy Rate
State of Literacy
PROVISIONAL POPULATION TOTALS – INDIA 135
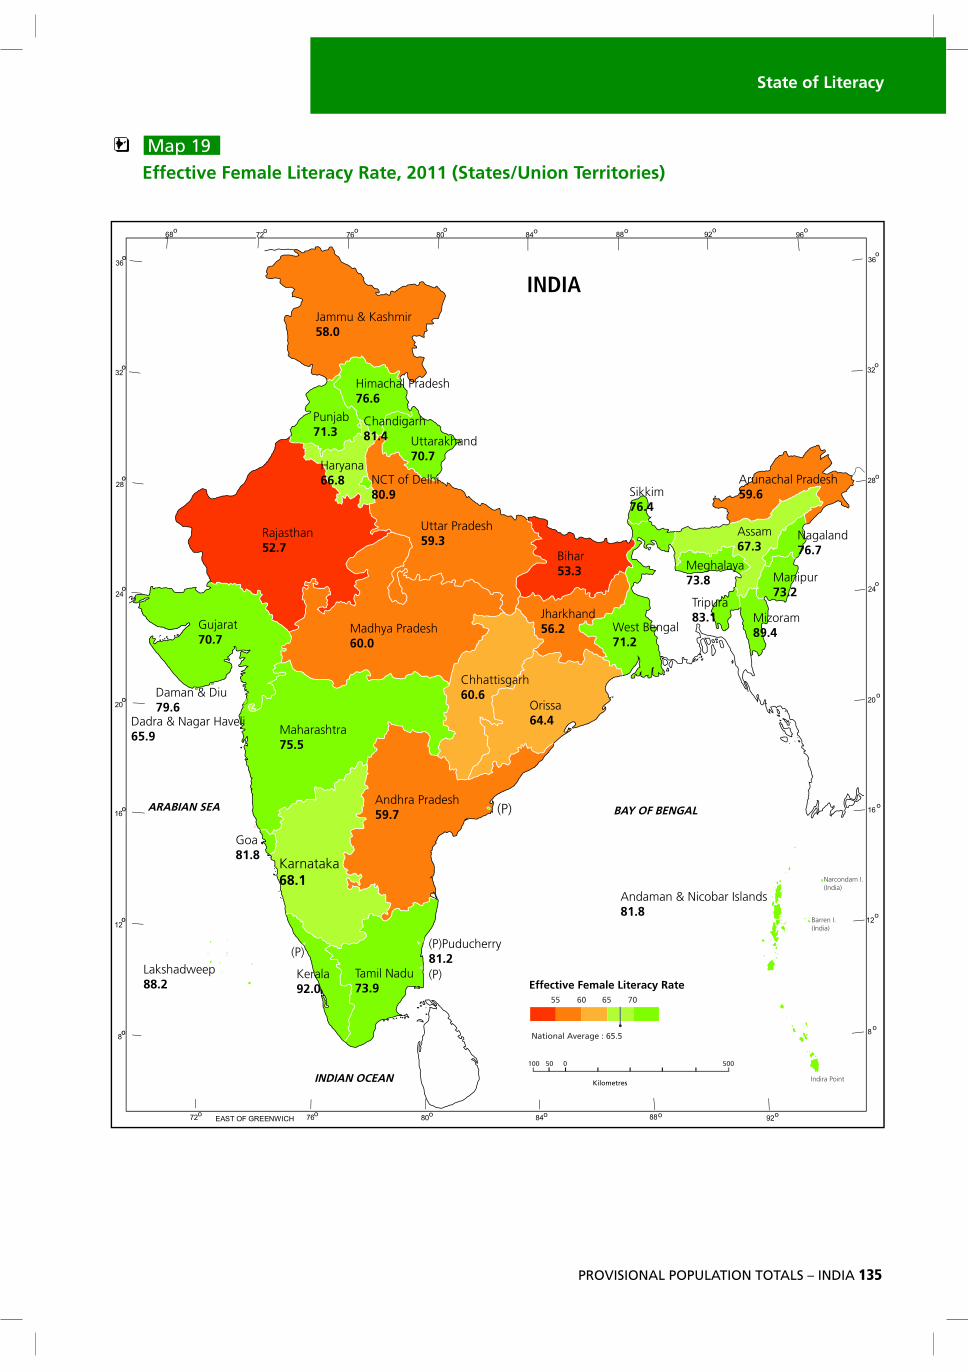
" Map 19
Effective Female Literacy Rate, 2011 (States/Union Territories)
Arunachal Pradesh59.6
INDIA
Effective Female Literacy Rate, 2011
(States/Union Territories)
0100 50050
Kilometres
Effective Female Literacy Rate
Jammu & Kashmir58.0
Punjab71.3
Rajasthan52.7
Gujarat70.7
Maharashtra75.5
Goa81.8
Karnataka68.1
Kerala92.0
Tamil Nadu73.9
Andhra Pradesh59.7
Chhattisgarh60.6
Orissa64.4
Tripura83.1Jharkhand
56.2
(P)Puducherry81.2
(P)
(P)
(P)
Lakshadweep88.2
Andaman & Nicobar Islands81.8
Indira Point
Barren I.(India)
Narcondam I.(India)
BAY OF BENGAL
INDIAN OCEAN
ARABIAN SEA
Daman & Diu79.6
Himachal Pradesh76.6
Chandigarh81.4 Uttarakhand
70.7Haryana66.8
Uttar Pradesh59.3
Dadra & Nagar Haveli65.9
West Bengal71.2
Madhya Pradesh60.0
Sikkim76.4
Bihar53.3
NCT of Delhi80.9
Meghalaya73.8
Assam67.3
Mizoram89.4
Manipur73.2
Nagaland76.7
60 65 7055
National Average : 65.5
136