state auto financial corp

1
STATE AUTO FINANCIAL CORP. Exchange NMS Symbol STFC Price $29.92 (8/31/2007) 52Wk Range 35.14-24.42 Yield 2.01 P/E 9.56 *7 Year Price Score 94.03 *12 Month Price Score 85.28 *NYSE Composite Index=100 Interim Earnings (Per Share) Qtr. Mar Jun Sep Dec 2004 0.80 0.85 0.12 0.93 2005 1.00 0.94 0.41 0.71 2006 0.97 0.10 0.75 1.08 2007 0.74 0.56 ... ... Interim Dividends (Per Share) Amt Decl Ex Rec Pay 0.10Q 11/3/2006 12/13/2006 12/15/2006 12/29/2006 0.10Q 3/2/2007 3/14/2007 3/16/2007 3/30/2007 0.10Q 5/4/2007 6/13/2007 6/15/2007 6/29/2007 0.15Q 8/17/2007 9/12/2007 9/14/2007 9/28/2007 Indicated Div: $0.60 (Div. Reinv. Plan) Valuation Analysis Forecast P/E 10.25 (1/10/2007) Market Cap $1.2 Billion Book Value 871.7 Million Price/Book 1.41 Price/Sales 1.11 Dividend Achiever Status 10 Year Growth Rate 17.40% Total Years of Dividend Growth 15 TRADING VOLUME (thousand shares) 5 7.5 10 12.5 15 17.5 20 22.5 25 27.5 30 32.5 35 37.5 40 2-for-1 1998 1999 2000 2001 2002 2003 2004 2005 2006 2007 0 1 2 3 Business Summary: Insurance (MIC: 8.2 SIC: 6331 NAIC: 524126) State Auto Financial is a property and casualty insurance holding company. Co. is mainly engaged in writing both personal and business lines of insurance. As of Dec 31 2006, Co. operated through its subsidiaries: State Auto Property and Casualty Insurance Company, Milbank Insurance Company, Farmers Casualty Insurance Company, State Auto Insurance Company of Ohio, State Auto National Insurance Company, Stateco Financial Services, Inc., Strategic Insurance Software, Inc. and 518 Property Management and Leasing, LLC. Co.'s principal lines of business include personal and commercial automobile, homeowners, commercial multi-peril, workers' compensation, general liability and property insurance. Recent Developments: For the quarter ended June 30 2007, net income increased 470.7% to $23.4 million from $4.1 million in the year-earlier quarter. Revenues were $278.7 million, down 0.5% from $280.0 million the year before. Net premiums earned were $253.3 million versus $256.7 million in the prior-year quarter, a decrease of 1.3%. Net investment income was unchanged at $20.6 million versus a year ago. Prospects: Looking ahead, Co. expects its new Interactive Voice Response service, which allows it to accept premium payments over the phone, to drive better policy retention results. Co. also expects the new policy discounts introduced in 2006 for nonstandard auto, and the competitive rates resulting from the introduction of its CustomFitsm products for standard auto, to provide it with new business opportunities. As of June 30 2007, Co. had introduced CustomFitsm in 20 states, which represented about 82.0% of its standard personal auto written premium volume. Co. also noted that it has launched the second generation of the product into a state in 2007 with additional states to follow by year-end. Financial Data Address: 518 East Broad Street, Columbus, OH 43215-3976 Telephone: 614-464-5000 Web Site: www.STFC.com Officers: Robert H. Moone - Chmn., Pres., C.E.O. Mark A. Blackburn - Sr. V.P. Transfer Agents: National City Bank, Cleveland, OH Investor Contact: 614-464-5078 No of Institutions: 86 Shares: 10,856,214 % Held: 26.43 (US$ in Thousands) 6 Mos 3 Mos 12/31/2006 12/31/2005 12/31/2004 12/31/2003 12/31/2002 12/31/2001 Earnings Per Share 3.13 2.67 2.90 3.06 2.70 1.58 0.93 0.52 Cash Flow Per Share 2.28 2.34 2.29 5.62 3.69 3.51 3.25 1.64 Tang Book Value Per Share 21.16 20.93 20.35 18.85 16.41 13.71 11.89 10.23 Dividends Per Share 0.400 0.390 0.380 0.270 0.170 0.150 0.135 0.125 Dividend Payout % 12.78 14.61 13.10 8.82 6.30 9.49 14.52 24.04 Income Statement Premium Income 505,200 251,900 1,023,800 1,050,300 1,006,800 960,568 896,595 555,207 Total Revenue 554,200 275,500 1,117,400 1,139,500 1,092,400 1,041,696 967,479 623,272 Benefits & Claims 303,400 143,000 587,600 613,400 619,200 651,223 653,474 427,074 Income Before Taxes 69,700 40,800 161,700 172,000 151,600 83,277 37,790 17,976 Income Taxes 15,500 10,000 41,300 46,100 41,600 19,655 795 (2,639) Net Income 54,200 30,800 120,400 125,900 110,000 63,622 36,995 20,615 Average Shares 41,800 41,800 41,600 41,100 40,800 40,153 39,743 39,681 Balance Sheet Total Assets 2,299,900 2,280,500 2,255,100 2,274,900 2,023,700 1,836,667 1,592,995 1,367,496 Total Liabilities 1,428,200 1,420,300 1,420,900 1,511,400 1,365,500 1,294,376 1,129,226 967,303 Stockholders' Equity 871,700 860,200 834,200 763,500 658,200 542,291 463,769 400,193 Shares Outstanding 41,200 41,100 41,000 40,500 40,100 39,559 39,001 38,937 Statistical Record Return on Assets % 5.79 4.85 5.32 5.86 5.68 3.71 2.50 1.82 Return on Equity % 15.71 13.40 15.07 17.71 18.28 12.65 8.56 5.24 Loss Ratio % 60.06 56.77 57.39 58.40 61.50 67.80 72.88 76.92 Net Margin % 9.78 11.18 10.78 11.05 10.07 6.11 3.82 3.31 Price Range 35.14-28.53 36.01-28.53 39.54-28.53 36.69-24.47 30.93-22.68 26.82-15.33 17.19-13.10 17.67-12.50 P/E Ratio 11.23-9.12 13.49-10.69 13.63-9.84 11.99-8.00 11.46-8.40 16.97-9.70 18.48-14.09 33.98-24.04 Average Yield % 1.25 1.20 1.14 0.91 0.62 0.70 0.87 0.81 264

Post on 11-Jun-2016

213 views

Category:

Documents


0 download

TRANSCRIPT

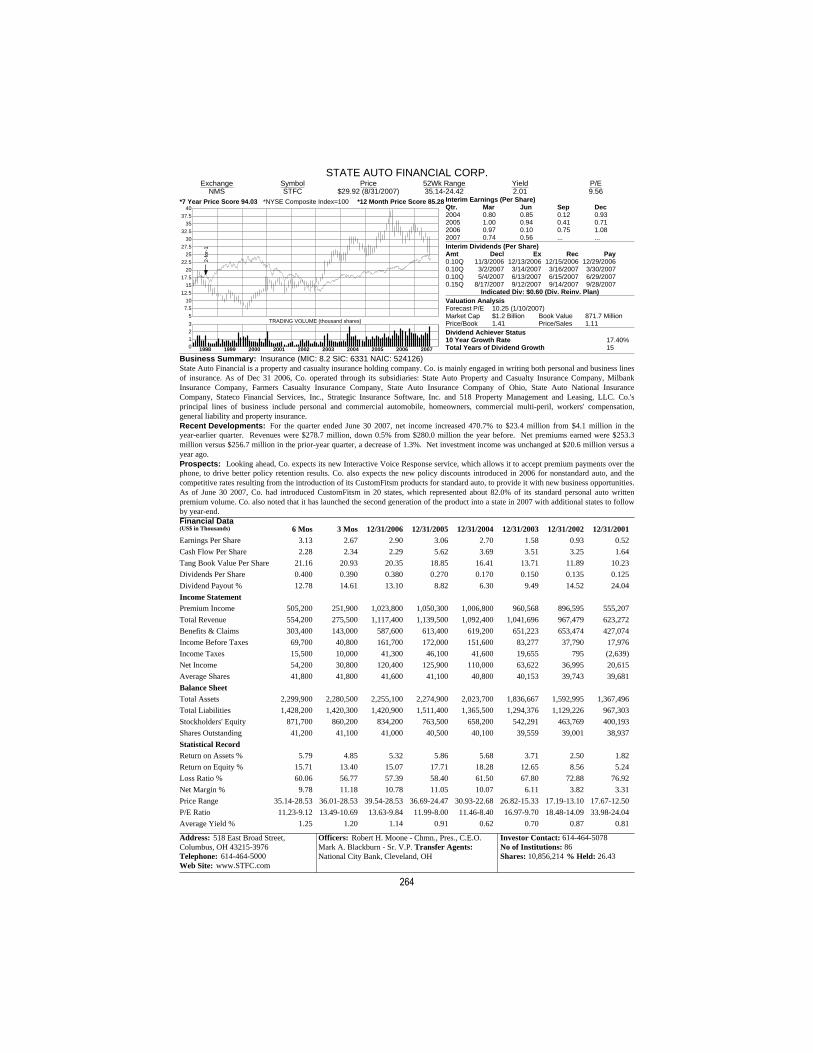
STATE AUTO FINANCIAL CORP.Exchange

NMSSymbolSTFC

Price$29.92 (8/31/2007)

52Wk Range35.14-24.42

Yield2.01

P/E9.56

*7 Year Price Score 94.03 *12 Month Price Score 85.28*NYSE Composite Index=100 Interim Earnings (Per Share)Qtr. Mar Jun Sep Dec2004 0.80 0.85 0.12 0.932005 1.00 0.94 0.41 0.712006 0.97 0.10 0.75 1.082007 0.74 0.56 ... ...Interim Dividends (Per Share)Amt Decl Ex Rec Pay0.10Q 11/3/2006 12/13/2006 12/15/2006 12/29/20060.10Q 3/2/2007 3/14/2007 3/16/2007 3/30/20070.10Q 5/4/2007 6/13/2007 6/15/2007 6/29/20070.15Q 8/17/2007 9/12/2007 9/14/2007 9/28/2007

Indicated Div: $0.60 (Div. Reinv. Plan)Valuation AnalysisForecast P/E 10.25 (1/10/2007)Market Cap $1.2 Billion Book Value 871.7 MillionPrice/Book 1.41 Price/Sales 1.11Dividend Achiever Status10 Year Growth Rate 17.40%Total Years of Dividend Growth 15

TRADING VOLUME (thousand shares)5

7.5

10

12.5

15

17.5

20

22.5

25

27.5

30

32.5

35

37.5

402-

for-

1

1998 1999 2000 2001 2002 2003 2004 2005 2006 20070123

Business Summary: Insurance (MIC: 8.2 SIC: 6331 NAIC: 524126)State Auto Financial is a property and casualty insurance holding company. Co. is mainly engaged in writing both personal and business linesof insurance. As of Dec 31 2006, Co. operated through its subsidiaries: State Auto Property and Casualty Insurance Company, MilbankInsurance Company, Farmers Casualty Insurance Company, State Auto Insurance Company of Ohio, State Auto National InsuranceCompany, Stateco Financial Services, Inc., Strategic Insurance Software, Inc. and 518 Property Management and Leasing, LLC. Co.'sprincipal lines of business include personal and commercial automobile, homeowners, commercial multi-peril, workers' compensation,general liability and property insurance.Recent Developments: For the quarter ended June 30 2007, net income increased 470.7% to $23.4 million from $4.1 million in theyear-earlier quarter. Revenues were $278.7 million, down 0.5% from $280.0 million the year before. Net premiums earned were $253.3million versus $256.7 million in the prior-year quarter, a decrease of 1.3%. Net investment income was unchanged at $20.6 million versus ayear ago.Prospects: Looking ahead, Co. expects its new Interactive Voice Response service, which allows it to accept premium payments over thephone, to drive better policy retention results. Co. also expects the new policy discounts introduced in 2006 for nonstandard auto, and thecompetitive rates resulting from the introduction of its CustomFitsm products for standard auto, to provide it with new business opportunities.As of June 30 2007, Co. had introduced CustomFitsm in 20 states, which represented about 82.0% of its standard personal auto writtenpremium volume. Co. also noted that it has launched the second generation of the product into a state in 2007 with additional states to followby year-end.Financial Data

Address: 518 East Broad Street,Columbus, OH 43215-3976 Telephone: 614-464-5000Web Site: www.STFC.com

Officers: Robert H. Moone - Chmn., Pres., C.E.O.Mark A. Blackburn - Sr. V.P. Transfer Agents: National City Bank, Cleveland, OH

Investor Contact: 614-464-5078No of Institutions: 86Shares: 10,856,214 % Held: 26.43

(US$ in Thousands) 6 Mos 3 Mos 12/31/2006 12/31/2005 12/31/2004 12/31/2003 12/31/2002 12/31/2001Earnings Per Share 3.13 2.67 2.90 3.06 2.70 1.58 0.93 0.52

Cash Flow Per Share 2.28 2.34 2.29 5.62 3.69 3.51 3.25 1.64

Tang Book Value Per Share 21.16 20.93 20.35 18.85 16.41 13.71 11.89 10.23

Dividends Per Share 0.400 0.390 0.380 0.270 0.170 0.150 0.135 0.125

Dividend Payout % 12.78 14.61 13.10 8.82 6.30 9.49 14.52 24.04

Income StatementPremium Income 505,200 251,900 1,023,800 1,050,300 1,006,800 960,568 896,595 555,207

Total Revenue 554,200 275,500 1,117,400 1,139,500 1,092,400 1,041,696 967,479 623,272

Benefits & Claims 303,400 143,000 587,600 613,400 619,200 651,223 653,474 427,074

Income Before Taxes 69,700 40,800 161,700 172,000 151,600 83,277 37,790 17,976

Income Taxes 15,500 10,000 41,300 46,100 41,600 19,655 795 (2,639)

Net Income 54,200 30,800 120,400 125,900 110,000 63,622 36,995 20,615

Average Shares 41,800 41,800 41,600 41,100 40,800 40,153 39,743 39,681

Balance SheetTotal Assets 2,299,900 2,280,500 2,255,100 2,274,900 2,023,700 1,836,667 1,592,995 1,367,496

Total Liabilities 1,428,200 1,420,300 1,420,900 1,511,400 1,365,500 1,294,376 1,129,226 967,303

Stockholders' Equity 871,700 860,200 834,200 763,500 658,200 542,291 463,769 400,193

Shares Outstanding 41,200 41,100 41,000 40,500 40,100 39,559 39,001 38,937

Statistical RecordReturn on Assets % 5.79 4.85 5.32 5.86 5.68 3.71 2.50 1.82

Return on Equity % 15.71 13.40 15.07 17.71 18.28 12.65 8.56 5.24

Loss Ratio % 60.06 56.77 57.39 58.40 61.50 67.80 72.88 76.92

Net Margin % 9.78 11.18 10.78 11.05 10.07 6.11 3.82 3.31

Price Range 35.14-28.53 36.01-28.53 39.54-28.53 36.69-24.47 30.93-22.68 26.82-15.33 17.19-13.10 17.67-12.50

P/E Ratio 11.23-9.12 13.49-10.69 13.63-9.84 11.99-8.00 11.46-8.40 16.97-9.70 18.48-14.09 33.98-24.04

Average Yield % 1.25 1.20 1.14 0.91 0.62 0.70 0.87 0.81

264