state and trends of carbon pricing october 2016 washington...
TRANSCRIPT
2016
Washington DC October 2016
State and Trends of Carbon Pricing
Pub
lic D
iscl
osur
e A
utho
rized
Pub
lic D
iscl
osur
e A
utho
rized
Pub
lic D
iscl
osur
e A
utho
rized
Pub
lic D
iscl
osur
e A
utho
rized

2016
State and Trends of Carbon Pricing Washington DC
October 2016
This report was prepared jointly by the World Bank, Ecofys and Vivid Economics.
The World Bank team included Richard Zechter, Thomas Kerr, Alexandre Kossoy, Grzegorz Peszko, Klaus Oppermann, Celine Ramstein and Nicolai Prytz.
The Ecofys team included Noémie Klein, Long Lam, Lindee Wong, Kornelis Blok, Maarten Neelis, Yannick Monschauer, Sam Nierop and Tom Berg.
The Vivid Economics team included John Ward, Thomas Kansy, Luke Kemp, Bryan Vadheim and Nick Kingsmill.
© 2016 International Bank for Reconstruction and Development/The World Bank1818 H Street NW, Washington DC 20433Telephone: 202-473-1000; Internet: www.worldbank.orgSome rights reserved1 2 3 4 17 16 15
This work is a product of the staff of The World Bank with external contributions. The findings, interpretations, and conclusions expressed in this work do not necessarily reflect the views of The World Bank, its Board of Executive Directors, or the governments they represent. The World Bank does not guarantee the accuracy of the data included in this work. The boundaries, colors, denominations, and other information shown on any map in this work do not imply any judgment on the part of The World Bank concerning the legal status of any territory or the endorsement or acceptance of such boundaries.Nothing herein shall constitute or be considered to be a limitation upon or waiver of the privileges and immunities of The World Bank, all of which are specifically reserved.
Rights and Permissions
This work is available under the Creative Commons Attribution 3.0 IGO license (CC BY 3.0 IGO) http://creativecommons.org/licenses/by/3.0/igo. Under the Creative Commons Attribution license, you are free to copy, distribute, transmit, and adapt this work, including for commercial purposes, under the following conditions:
Attribution—Please cite the work as follows: World Bank, Ecofys and Vivid Economics. 2016. State and Trends of Carbon Pricing 2016 (October), by World Bank, Washington, DC.
Doi: 10.1596/978-1-4648-1001-5 License: Creative Commons Attribution CC BY 3.0 IGO
Translations—If you create a translation of this work, please add the following disclaimer along with the attribution: This translation was not created by The World Bank and should not be considered an official World Bank translation. The World Bank shall not be liable for any content or error in this translation.
Adaptations—If you create an adaptation of this work, please add the following disclaimer along with the attribution: This is an adaptation of an original work by The World Bank. Responsibility for the views and opinions expressed in the adaptation rests solely with the author or authors of the adaptation and are not endorsed by The World Bank.
Third-party content—The World Bank does not necessarily own each component of the content contained within the work. The World Bank therefore does not warrant that the use of any third-party-owned individual component or part contained in the work will not infringe on the rights of those third parties. The risk of claims resulting from such infringement rests solely with you. If you wish to re-use a component of the work, it is your responsibility to determine whether permission is needed for that re-use and to obtain permission from the copyright owner. Examples of components can include, but are not limited to, tables, figures, or images.
All queries on rights and licenses should be addressed to the Publishing and Knowledge Division, The World Bank, 1818 H Street NW, Washington, DC 20433, USA; fax: 202-522-2625; e-mail: [email protected] (electronic): 978-1-4648-1001-5DOI: 10.1596/978-1-4648-1001-5
Photo credits: page 17: dioxin / photocase.de; page 21: peych_p / fotolia.com; page 57: zettberlin / photocase.de; page 79: assistant / fotolia.com
Cover and interior design: Meike Naumann Visuelle Kommunikation
2
Reflecting the growing momentum for carbon pricing worldwide, the 2016 edition of the State and Trends of Carbon Pricing report targets the wide audience of public and private stakeholders engaged in carbon pricing design and implementation. This report also provides critical input for negotiators involved in implementation of the Paris Agreement at the meeting of the Conference of the Parties (COP) in Marrakesh.
As in the previous editions, the report provides an up-to-date overview of existing and emerging carbon pricing instruments around the world, including national and subnational initiatives. Furthermore, it gives an overview of current corporate carbon pricing initiatives.
Another key focus of the report is on the importance of aligning carbon pricing with the broader policy landscape. The analysis provides lessons for policymakers on how to maximize synergies between climate mitigation and other related policies, while managing potential tensions and tradeoffs.
This year’s report provides new modelling analysis to demonstrate the crucial benefits that an international carbon market established under Article 6 of the Paris Agreement could provide in reducing the costs to countries of achieving their emission reduction targets. An international carbon market could thus enable greater ambition in taking steps to reduce greenhouse gas emissions to a level consistent with the 2°C climate stabilization goal.
The task team responsible for this report intends to select new relevant topics to be explored in future editions. These topics could include, for example, the interaction of carbon taxes and fiscal policy. As part of the World Bank’s expanded carbon pricing intelligence program, additional analytical topics such as the effectiveness of carbon pricing may also be explored.
The report benefited greatly from the valuable written contributions and perspectives of our colleagues in the climate and carbon finance community, ensuring the quality and clarity of this report: Conor Barry, Carter Brandon, Karan Capoor, Hannah Cushing, Kurt van Dender, Shari Friedman, Dafei Huang, Ying Liu, Blanca Moreno-Dodson, Guoqiang Qian, Nigel Topping, and Peter Zapfel. Section 4 strongly benefited from the contribution of Ajay Gambir and Adam Hawkes of Imperial College London.
We wish to extend our gratitude to those who offered their cooperation and insights during the development of this report: Emilie Alberola, Pedro Barata, Richard Baron, Joaquim Barris, Nicolette Bartlett, Adrien de Bassompierre, Garo Batmanian, Stefanie Bradtner, Derik Broekhoff, Cyril Cassisa, Marcos Castro Rodrigues, Zhibin Chen, Gerald Crane, Todd Croad, Neydi Sagnite Cruz García, Oscar Diamond, Charlie Dixon, Michael Döring, Maxime Durande, Beth Elliott, Etienne Espagne, Jasmin Faller, Christine Fedigan, Alexis Gazzo, Cécile Goubet, Katharina Grave, Duncan Gray, Greenhouse Gas Inventory and Research Center of Korea, Kelley Hamrick, Andries Hof, Xiaochen Huang, Aurélie Jardin, Frank Jotzo, Junki Kawamura, Alex Kazaglis, Pauline Maree Kennedy, Susanna Laaksonen-Craig, Sara Law, Franck Lecocq, Benoît Leguet, Lina Li, Rob Macquarie, Binzhang Meng, Cecil Morden, Aya Naito, Meike Naumann, Norwegian Ministry of Finance, Julien Perez, Annie Petsonk, Rodrigo Pizarro Gariazzo, Ulrika Raab, Isabel Saldarriaga Arango, Misato Sato, Igor Shishlov, Gerardo Spatuzzi, Gemma Toop, Ian Trim, Mariëlle Vosbeek, and Emilio Wills Valderrama.
Oversight and guidance on drafting was provided respectively by Alexandre Kossoy for Section 2 on carbon pricing initiatives around the world, Grzegorz Peszko for Section 3 on aligning carbon pricing with the broader policy landscape, and Klaus Oppermann for Section 4 on building an international carbon market after Paris.
We also acknowledge the support from the Partnership for Market Readiness.
3
°C Degrees Celsius
A AAU Assigned Amount Unit
C CCER Chinese Certified Emission ReductionCDM Clean Development MechanismCER Certified Emission ReductionCi-Dev Carbon Initiative for DevelopmentCMA Conference of the Parties serving as the Meeting of the Parties to the Paris AgreementCO2 Carbon dioxideCO2e Carbon dioxide equivalentCOP Conference of the PartiesCORSIA Carbon Offset and Reduction Scheme for International AviationCP1 First Commitment Period under the Kyoto ProtocolCP2 Second Commitment Period under the Kyoto ProtocolCPP Clean Power Plan
D DRC Development and Reform Commission
E EBRD European Bank for Reconstruction and DevelopmentERF Emissions Reduction FundERU Emission Reduction UnitETS Emissions Trading SystemEU European UnionEU ETS European Union Emissions Trading System
G GDP Gross Domestic ProductGGIRCA Greenhouse Gas Industrial Reporting and Control ActGHG Greenhouse gasGt GigatonGtCO2e Gigaton of carbon dioxide equivalent
I ICAO International Civil Aviation OrganizationIEA International Energy AgencyIET International Emissions TradingIFC International Finance CorporationINDC Intended Nationally Determined ContributionIPCC Intergovernmental Panel on Climate ChangeITMO Internationally Transferred Mitigation Outcomes
LIST OF ABBREVIATIONS AND
ACRONYMS
4
J JCM Joint Crediting Mechanism
K ktCO2e Kiloton of carbon dioxide equivalent
L LNG Liquefied Natural Gas
M MoU Memorandum of Understanding MRV Monitoring, Reporting and Verification
Mt MegatonMtCO2e Megaton of Carbon Dioxide EquivalentMW Megawatt
N NDC Nationally Determined ContributionNDRC China’s National Development and Reform Commission
O OECD Organisation for Economic Co-operation and Development
P PMR Partnership for Market Readinessppm Parts per million
R RBCF Results-based Climate Finance REDD+ Reducing Emissions from Deforestation, Forest Degradation, and the role of conservation,
sustainable management of forests, and enhancement of forest carbon stocksRGGI Regional Greenhouse Gas Initiative
S SBSTA Subsidiary Body for Scientific and Technological AdviceSGER Specific Gas Emitters Regulation
T t Ton (note that, unless specified otherwise, ton in this report refers to a metric ton = 1,000 kg) tCO2 Ton of carbon dioxidetCO2e Ton of carbon dioxide equivalent
U UK United KingdomUN United NationsUNFCCC United Nations Framework Convention on Climate ChangeUS United States
5
List of abbreviations and acronyms 4
Executive summary 10
1 Introduction 17
2 Existing and emerging carbon pricing initiatives around the world
21
2.1 Overview, recent developments, and emerging trends 222.1.1 Global overview of carbon pricing initiatives 222.1.2 Recent developments and emerging trends 28
2.2 International carbon pricing initiatives 322.3 Regional, national, and subnational carbon pricing initiatives 422.4 Internal carbon pricing initiatives 54
3 Aligning carbon pricing with the broader policy landscape
57
3.1 Aligning policies with multiple objectives 593.1.1 Complementary policies 593.1.2 Overlapping policies 683.1.3 Countervailing policies 74
3.2 Measuring the effectiveness of carbon prices in the presence of multiple policies
76
3.3 Key conclusions 77
4 Building an international carbon market after Paris 79
4.1 The benefits of an international carbon market 824.1.1 Short-term: Benefits to 2030 834.1.2 Long-term: Benefits to 2050 and 2100 86
4.2 Barriers to establishing an international carbon market 884.2.1 Introduction 884.2.2 Market uncertainty 894.2.3 Loss of environmental integrity 894.2.4 Potential loss of co-benefits 904.2.5 Comparability of effort and prices 904.2.6 Loss of regulatory control 914.2.7 Undesirable distributional implications 92
CONTENTS
6
4.3 Beyond barriers: potential ways forward 934.3.1 Collaboration and market design 934.3.2 Finance 934.3.3 Comparing mitigation effort 944.3.4 Sectoral approaches 954.3.5 International standards 96
4.4 Evolution towards a new international carbon market 96
Annex I – Conversion rates 98
Annex II – Existing platforms for international cooperation
99
Annex III – Overview of carbon pricing in INDCs 101
Annex IV– Modeling tools to support policy alignment and effectiveness
110
Annex V – Detailed modeling results and comparisons 114
Annex VI – Calculation of implications of using an international carbon market for meeting mitigation targets
118
Glossary 129
7

Contents
Figures 1 Summary map of existing, emerging and potential regional, national and subnational carbon pricing initiatives (ETS and tax)
12
2 Regional, national and subnational carbon pricing initiatives: share of global emissions covered
13
3 Prices in existing carbon pricing initiatives 144 Summary map of existing, emerging and potential regional,
national and subnational carbon pricing initiatives (ETS and tax)25
5 Regional, national and subnational carbon pricing initiatives: share of global emissions covered
26
6 Prices in existing carbon pricing initiatives 277 Carbon price and emissions coverage of implemented
carbon pricing initiatives28
8 Map of countries that have signed and/or ratified the Paris Agreement
32
9 Self-reported INDC implementation costs per region (in US$ trillion)
34
10 Potential supply of CERs until 2020 3811 Annual and cumulative CER and ERU issuance, secondary CER
prices (left), and voluntary offset issuance and prices (right)38
12 Carbon pricing initiatives implemented or scheduled for implementation, with sectoral coverage and GHG emissions covered
43
13 Mandatory carbon prices in several jurisdictions compared to internal carbon prices publicly disclosed to CDP
55
14 2030 regional resource and emission flows under full international trading
84
15 2050 regional resource and emission flows under full international trading
87
16 Transition scenario: Bottom-up pathway to greater international cooperation
97
17 Traditional techno-economic models allow for qualitative policy assessment “on the side”
111
18 Agent-based models show more realistically expected emission reductions resulting from the current distorted policy and market incentives
112
19 Impact on policy distortions and policy reforms on the switching costs between a solar PV and coal generation
113
20 High-level structure of TIAM 119
8
Tables 1 Market update of mechanisms under the Kyoto Protocol 372 Key developments in the Chinese pilot ETSs 463 Opportunities for better alignment of carbon pricing 774 International carbon market options 815 Annual cost savings from international cooperation 836 2050 cost savings from international cooperation 867 An overview of approaches, barriers and solutions 968 Currency conversion rates, as of August 1, 2016 989 Unconditional and conditional targets and intended use of carbon
pricing and/or market instruments stated in INDCs101
10 Regional emissions and financial flows in 2030 under full IET 11411 Regional emissions and financial flows under full IET in 2050
based on equal per capita emissions115
12 Cost savings from the use of international carbon markets in 2050 11713 Details of countries in each of the 14 TIAM-Grantham regions 12014 Regional economic growth rates used in modeling analysis 12215 Derived 2020 targets for CO2 from fossil fuel combustion and
industrial processes for each TIAM-Grantham region, under weak/unilateral Cancún pledges
122
16 Derived 2030 targets for CO2 from fossil fuel combustion and industrial processes for each TIAM-Grantham region, under INDCs
124
17 2050 CO2 emissions from fossil fuel combustion and industrial processes for TIAM-Grantham regions under equal per capita emissions for CO2 from fossil fuel combustion
127
Boxes 1 Carbon pricing in numbers 242 Self-determined INDC implementation costs 343 Summary of selected changes in regional, national and subnational
carbon pricing initiatives52
4 Use of internal carbon pricing by governments in decision making 565 Air quality benefits of fuel switching 626 Demand-side abatement and ETS in the Republic of Korea ETS 657 France is pioneering legislation on carbon-related disclosure
requirements67
8 Ongoing climate policy institutions in Australia 739 Mexico’s energy reform combines fossil fuel subsidy removal with
introducing carbon pricing75
10 Burden sharing assumptions 8511 Heterogeneous linkage 95
9
CARBON PRICING INITIATIVES AROUND THE WORLD
2 015 witnessed an historic global step forward in taking action on climate change. In Paris, world
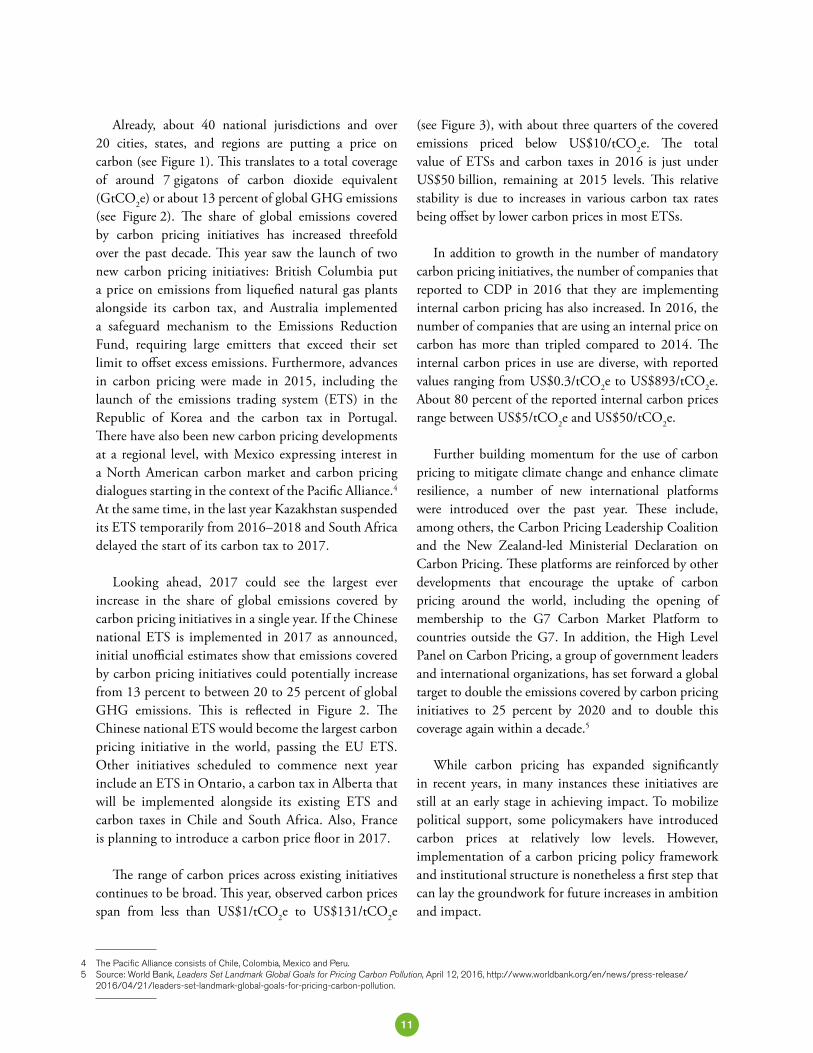
leaders reached an agreement at the 21st Conference of the Parties (COP 21) to the United Nations Framework Convention on Climate Change (UNFCCC) to keep the global average temperature increase to well below 2°C and pursue efforts to hold the increase to 1.5°C. The Paris Agreement encouraged all countries, for the first time, to make individual, voluntary commitments to contribute to this global goal, marking the beginning of a new era in the cooperative effort to limit climate change. On October 5, 2016—less than a year after the agreement was adopted—the conditions for the Paris Agreement to take effect were met.1 The Paris Agreement will enter into force on November 4, 2016.
The vast majority of governments around the globe—189 countries representing 96 percent of global greenhouse gas (GHG) emissions and 98 percent of the world’s population2—have committed to reduce their GHG emissions and adapt to the changing climate through their Intended Nationally Determined Contributions (INDCs).3 The urgent priority now is for governments to ensure implementation of these commitments, requiring sustained efforts to influence investment and consumption decisions made every day by firms and households.
While implementation of INDCs will rely on a range of policies and programs, carbon pricing initiatives will play an increasing role, with about 100 Parties —accounting for 58 percent of global GHG emissions—planning or considering these instruments. The pivotal role of carbon pricing in supporting efforts to decarbonize is also reflected in the Paris Agreement. Article 6 of the Agreement provides a basis for facilitating international recognition of cooperative carbon pricing approaches and identifies new concepts that may pave the way for this cooperation to be pursued.
Executive summary
1 While this report covers the period from January 1, 2015 until September 1, 2016, the authors decided to include the entry into force of the Paris Agreement given its global significance. The authors recognize that other significant developments have occurred after September 1, 2016 and before the publication of the report. These developments include the agreement reached at the 39th Assembly of the International Civil Aviation Organization (ICAO) on a global market-based measure to control CO2 emissions from international aviation (see footnote 103 in the International aviation section in Section 2.2 for further details), the announcement of a minimum federal carbon price in Canada, and the adoption of the carbon pricing legislation in Washington State, which happened after September 1, 2016 and before the publication of the report. They will be discussed in the 2017 edition of the Carbon Pricing Watch and the State and Trends of Carbon Pricing report.
2 As of September 1, 2016. The 189 countries submitted 162 INDCs, with the European Union submitting an INDC on behalf of its 28 member states.3 INDCs are voluntary statements which were invited by the COP without prescription related to form. Nationally Determined Contributions (NDCs) are legally
distinct and will be under the Paris Agreement as and when it enters into force. They will be governed by Article 4 of the Agreement. Each Party to the UNFCCC that wishes to become a Party to the Agreement will have an obligation to communicate an NDC. The level of prescription attached to these will be determined by the negotiations of the operative elements of Article 4, which mainly take place under the Ad Hoc Working Group on the Paris Agreement.
10
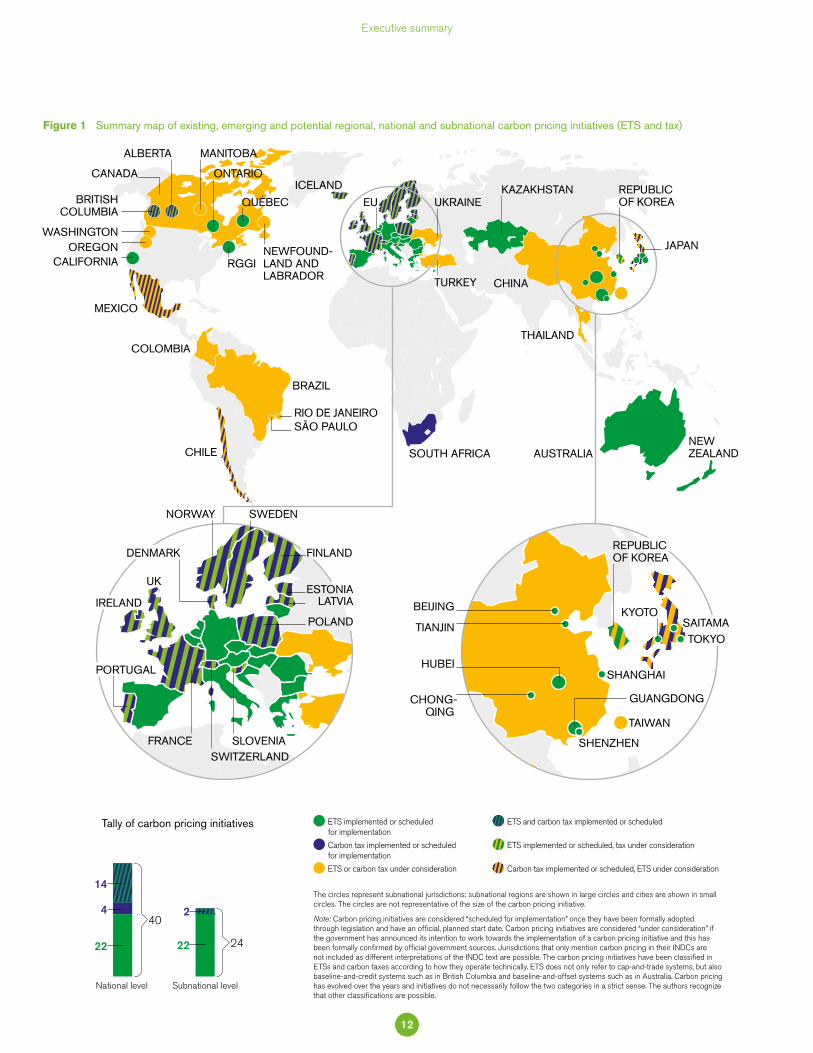
Already, about 40 national jurisdictions and over 20 cities, states, and regions are putting a price on carbon (see Figure 1). This translates to a total coverage of around 7 gigatons of carbon dioxide equivalent (GtCO2e) or about 13 percent of global GHG emissions (see Figure 2). The share of global emissions covered by carbon pricing initiatives has increased threefold over the past decade. This year saw the launch of two new carbon pricing initiatives: British Columbia put a price on emissions from liquefied natural gas plants alongside its carbon tax, and Australia implemented a safeguard mechanism to the Emissions Reduction Fund, requiring large emitters that exceed their set limit to offset excess emissions. Furthermore, advances in carbon pricing were made in 2015, including the launch of the emissions trading system (ETS) in the Republic of Korea and the carbon tax in Portugal. There have also been new carbon pricing developments at a regional level, with Mexico expressing interest in a North American carbon market and carbon pricing dialogues starting in the context of the Pacific Alliance.4 At the same time, in the last year Kazakhstan suspended its ETS temporarily from 2016–2018 and South Africa delayed the start of its carbon tax to 2017.
Looking ahead, 2017 could see the largest ever increase in the share of global emissions covered by carbon pricing initiatives in a single year. If the Chinese national ETS is implemented in 2017 as announced, initial unofficial estimates show that emissions covered by carbon pricing initiatives could potentially increase from 13 percent to between 20 to 25 percent of global GHG emissions. This is reflected in Figure 2. The Chinese national ETS would become the largest carbon pricing initiative in the world, passing the EU ETS. Other initiatives scheduled to commence next year include an ETS in Ontario, a carbon tax in Alberta that will be implemented alongside its existing ETS and carbon taxes in Chile and South Africa. Also, France is planning to introduce a carbon price floor in 2017.
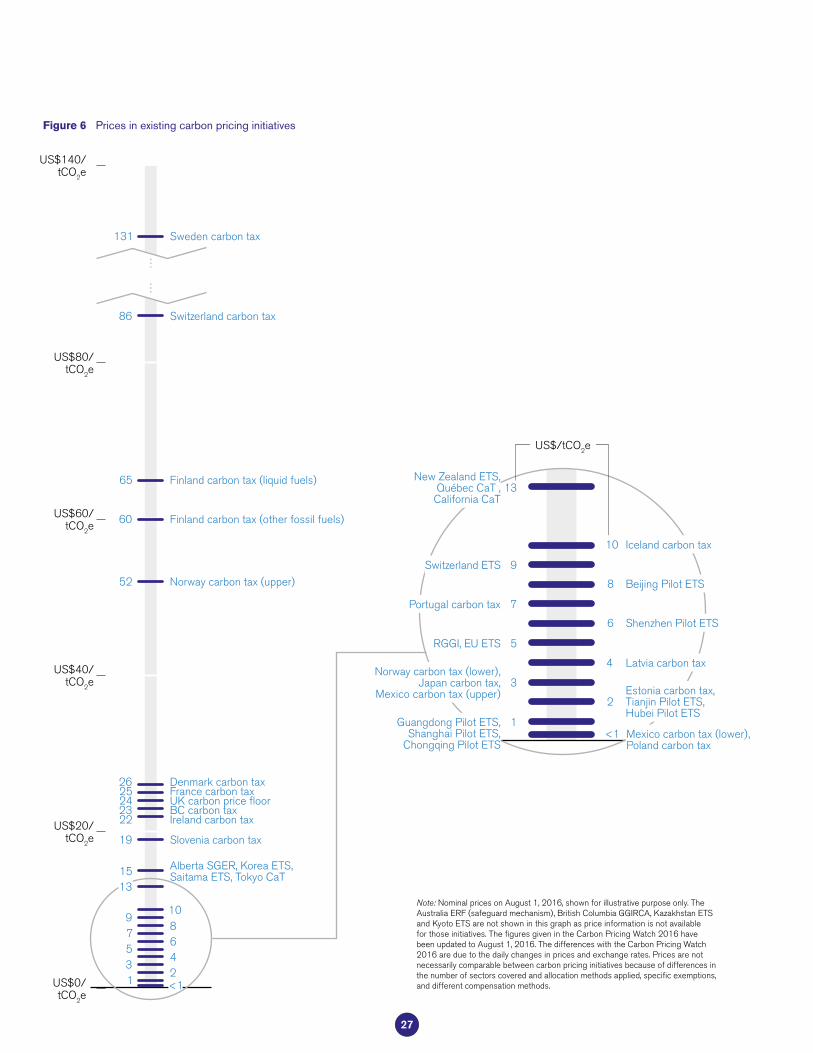
The range of carbon prices across existing initiatives continues to be broad. This year, observed carbon prices span from less than US$1/tCO2e to US$131/tCO2e
(see Figure 3), with about three quarters of the covered emissions priced below US$10/tCO2e. The total value of ETSs and carbon taxes in 2016 is just under US$50 billion, remaining at 2015 levels. This relative stability is due to increases in various carbon tax rates being offset by lower carbon prices in most ETSs.
In addition to growth in the number of mandatory carbon pricing initiatives, the number of companies that reported to CDP in 2016 that they are implementing internal carbon pricing has also increased. In 2016, the number of companies that are using an internal price on carbon has more than tripled compared to 2014. The internal carbon prices in use are diverse, with reported values ranging from US$0.3/tCO2e to US$893/tCO2e. About 80 percent of the reported internal carbon prices range between US$5/tCO2e and US$50/tCO2e.
Further building momentum for the use of carbon pricing to mitigate climate change and enhance climate resilience, a number of new international platforms were introduced over the past year. These include, among others, the Carbon Pricing Leadership Coalition and the New Zealand-led Ministerial Declaration on Carbon Pricing. These platforms are reinforced by other developments that encourage the uptake of carbon pricing around the world, including the opening of membership to the G7 Carbon Market Platform to countries outside the G7. In addition, the High Level Panel on Carbon Pricing, a group of government leaders and international organizations, has set forward a global target to double the emissions covered by carbon pricing initiatives to 25 percent by 2020 and to double this coverage again within a decade.5
While carbon pricing has expanded significantly in recent years, in many instances these initiatives are still at an early stage in achieving impact. To mobilize political support, some policymakers have introduced carbon prices at relatively low levels. However, implementation of a carbon pricing policy framework and institutional structure is nonetheless a first step that can lay the groundwork for future increases in ambition and impact.
4 The Pacific Alliance consists of Chile, Colombia, Mexico and Peru.5 Source: World Bank, Leaders Set Landmark Global Goals for Pricing Carbon Pollution, April 12, 2016, http://www.worldbank.org/en/news/press-release/
2016/04/21/leaders-set-landmark-global-goals-for-pricing-carbon-pollution.
11
Executive summary
Summary map of existing, emerging and potential regional, national and subnational carbon pricing initiatives (ETS and tax) Figure 1
ETS implemented or scheduled for implementation
Carbon tax implemented or scheduled for implementation
ETS or carbon tax under consideration
ETS and carbon tax implemented or scheduled
ETS implemented or scheduled, tax under consideration
Carbon tax implemented or scheduled, ETS under consideration
The circles represent subnational jurisdictions: subnational regions are shown in large circles and cities are shown in small circles. The circles are not representative of the size of the carbon pricing initiative.
Note: Carbon pricing initiatives are considered “scheduled for implementation” once they have been formally adopted through legislation and have an official, planned start date. Carbon pricing initiatives are considered “under consideration” if the government has announced its intention to work towards the implementation of a carbon pricing initiative and this has been formally confirmed by official government sources. Jurisdictions that only mention carbon pricing in their INDCs are not included as different interpretations of the INDC text are possible. The carbon pricing initiatives have been classified in ETSs and carbon taxes according to how they operate technically. ETS does not only refer to cap-and-trade systems, but also baseline-and-credit systems such as in British Columbia and baseline-and-offset systems such as in Australia. Carbon pricing has evolved over the years and initiatives do not necessarily follow the two categories in a strict sense. The authors recognize that other classifications are possible.
Tally of carbon pricing initiatives
National level Subnational level
22
14
440
24
2
22
NEW ZEALAND
BRITISH COLUMBIA
WASHINGTONOREGON
CALIFORNIA
MEXICO
CHILE
BRAZIL
RIO DE JANEIROSÃO PAULO
RGGI
ALBERTA MANITOBA
ONTARIO
NEWFOUND- LAND AND LABRADOR
QUÉBEC
ICELAND
EU
TURKEY
UKRAINEKAZAKHSTAN
CHINA
THAILAND
JAPAN
SOUTH AFRICA
REPUBLIC OF KOREA
PORTUGAL
IRELAND
SWEDEN
FRANCESWITZERLAND
SLOVENIA
ESTONIA
FINLAND
LATVIA
UK
POLAND
NORWAY
DENMARK
KYOTOBEIJING
TIANJIN
HUBEISHANGHAI
CHONG- QING
SHENZHEN
TAIWAN
GUANGDONG
TOKYOSAITAMA
REPUBLIC OF KOREA
CANADA
AUSTRALIA
COLOMBIA
12
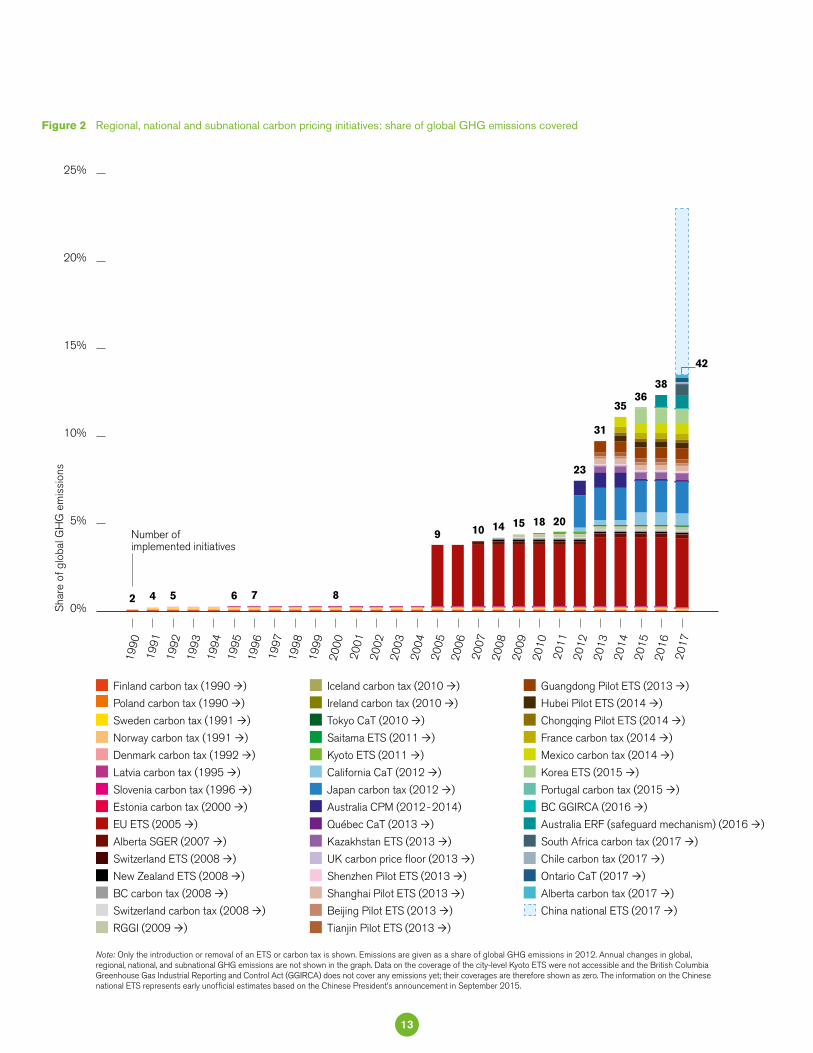
Regional, national and subnational carbon pricing initiatives: share of global GHG emissions coveredFigure 2
Finland carbon tax (1990 )
Poland carbon tax (1990 )
Sweden carbon tax (1991 )
Norway carbon tax (1991 )
Denmark carbon tax (1992 )
Latvia carbon tax (1995 )
Slovenia carbon tax (1996 )
Estonia carbon tax (2000 )
EU ETS (2005 )
Alberta SGER (2007 )
Switzerland ETS (2008 )
New Zealand ETS (2008 )
BC carbon tax (2008 )
Switzerland carbon tax (2008 )
RGGI (2009 )
Iceland carbon tax (2010 )
Ireland carbon tax (2010 )
Tokyo CaT (2010 )
Saitama ETS (2011 )
Kyoto ETS (2011 )
California CaT (2012 )
Japan carbon tax (2012 )
Australia CPM (2012 - 2014)
Québec CaT (2013 )
Kazakhstan ETS (2013 )
UK carbon price floor (2013 )
Shenzhen Pilot ETS (2013 )
Shanghai Pilot ETS (2013 )
Beijing Pilot ETS (2013 )
Tianjin Pilot ETS (2013 )
Guangdong Pilot ETS (2013 )
Hubei Pilot ETS (2014 )
Chongqing Pilot ETS (2014 )
France carbon tax (2014 )
Mexico carbon tax (2014 )
Korea ETS (2015 )
Portugal carbon tax (2015 )
BC GGIRCA (2016 )
Australia ERF (safeguard mechanism) (2016 )
South Africa carbon tax (2017 )
Chile carbon tax (2017 )
Ontario CaT (2017 )
Alberta carbon tax (2017 )
China national ETS (2017 )
Note: Only the introduction or removal of an ETS or carbon tax is shown. Emissions are given as a share of global GHG emissions in 2012. Annual changes in global, regional, national, and subnational GHG emissions are not shown in the graph. Data on the coverage of the city-level Kyoto ETS were not accessible and the British Columbia Greenhouse Gas Industrial Reporting and Control Act (GGIRCA) does not cover any emissions yet; their coverages are therefore shown as zero. The information on the Chinese national ETS represents early unofficial estimates based on the Chinese President’s announcement in September 2015.
Sha
re o
f glo
bal G
HG
em
issi
ons
25%
20%
15%
10%
5%
0%
1990
1992
1995
2000
1998
2003
2004
2005
1991
1994
1997
2002
1993
1996
2001
1999
2006
2007
2008
2009
2010
2011
2012
2013
2014
2015
2016
2017
2 4 5 6 7 8
9 10 14 15 18 20
23
31
3536
38
Number of implemented initiatives
42
13

Executive summary
Prices in existing carbon pricing initiativesFigure 3
US$140/ tCO2e
US$20/ tCO2e
US$40/ tCO2e
US$60/ tCO2e
US$80/ tCO2e
US$0/ tCO2e
……
Norway carbon tax (upper)52
Alberta SGER, Korea ETS, Saitama ETS, Tokyo CaT15
UK carbon price floor24
8642
10
531
79
131 Sweden carbon tax
60 Finland carbon tax (other fossil fuels)
65 Finland carbon tax (liquid fuels)
26 Denmark carbon tax
22 Ireland carbon tax
19 Slovenia carbon tax
25 France carbon tax
86 Switzerland carbon tax
23 BC carbon tax
<1
13
US$/tCO2e
7 Portugal carbon tax
9 Switzerland ETS
6 Shenzhen Pilot ETS
8 Beijing Pilot ETS
13 New Zealand ETS,
Québec CaT , California CaT
3 Norway carbon tax (lower),
Japan carbon tax, Mexico carbon tax (upper)
1 Guangdong Pilot ETS, Shanghai Pilot ETS,
Chongqing Pilot ETS
5 RGGI, EU ETS
10 Iceland carbon tax
4 Latvia carbon tax
Estonia carbon tax, 2 Tianjin Pilot ETS, Hubei Pilot ETS
Mexico carbon tax (lower), Poland carbon tax
<1
Note: Nominal prices on August 1, 2016, shown for illustrative purpose only. The Australia ERF (safeguard mechanism), British Columbia GGIRCA, Kazakhstan ETS and Kyoto ETS are not shown in this graph as price information is not available for those initiatives. The figures given in the Carbon Pricing Watch 2016 have been updated to August 1, 2016. The differences with the Carbon Pricing Watch 2016 are due to the daily changes in prices and exchange rates. Prices are not necessarily comparable between carbon pricing initiatives because of differences in the number of sectors covered and allocation methods applied, specific exemptions, and different compensation methods.
14
ALIGNING CARBON PRICING WITH THE
BROADER POLICY LANDSCAPE
Carbon pricing can be most effective and acceptable to the public when it is well aligned with the broader policy context in a country. By necessity, policymakers must balance multiple objectives, of which climate mitigation is just one. An integrated package of climate mitigation policies that also supports other key objectives is more likely to gain widespread support and to be implemented more effectively than inconsistent policies that work at cross-purposes. In order for carbon pricing to have an optimum impact, policymakers should maximize the synergies with complementary policies, manage potential tensions with overlapping policies and address any trade-offs associated with countervailing policies.6 Section 3 of the report discusses these issues in depth.
A key objective is to combine carbon pricing with complementary policies in a way that enhances the performance of each of the policies. This will ensure that carbon pricing is effective in changing behaviors and that its consequences are acceptable to society. Opportunities for synergies exist: in the power sector carbon pricing works best in the context of efficient electricity markets, where producers and consumers respond to full cost-covering price signals to allocate resources. At the same time, when carbon pricing encourages an increasing share of renewables in fast growing, relatively small power systems, the challenges can be addressed successfully with complementary policies supporting flexibility of the system and its ability to incorporate power from renewable sources. To encourage the efficient use of energy and increased use of public transport, a carbon price needs to be accompanied by additional measures to remove barriers and to provide infrastructure that enables consumers to respond to the price signal.
Facilitating access to long-term financing of upfront capital costs can also be essential for carbon pricing to increase the rate at which abatement opportunities are adopted. Finally, it should be noted that carbon prices can help achieve other objectives—for instance by increasing the efficiency of raising tax revenue or helping to reduce local air pollution.
Policymakers also have to manage overlapping policies that operate in parallel with carbon pricing. For example, renewable and energy efficiency support measures, while motivated by other objectives, can provide the same incentive effect as carbon pricing. There is a wide range of legitimate reasons for these overlapping policies, such as green industrial policy, supporting penetration of certain transformational technologies, or avoiding lock-in of capital in assets that may be stranded in the future. However, these policies represent an implicit carbon cost, which can far exceed the level of the explicit carbon price and increase the overall social cost of reducing emissions. Policymakers can manage the interactions between these policies and carbon pricing in a way that exploits their parallel objectives, while mitigating unwanted effects and minimizing costs.
Finally, policymakers may have to address the challenge
of a range of countervailing policies that adversely affect the impact of carbon prices on the behavior of investors and consumers. Often, as with the case of fossil fuel subsidies, these policies are unsuccessful or inefficient in achieving their stated objectives, e.g. lowering the cost of energy for less affluent households. There are ways to achieve these objectives without distorting the intended carbon price signal. Carbon pricing does not have to wait for the phasing out of countervailing policies. Instead it can be used as part of a package of gradual reforms of fossil fuel subsidies, for example by using revenues to help address some of the political economy barriers to subsidy removal. However, in other instances, such as where regulations protect banking or fiscal prudency
6 Source: OECD and World Bank Group, The FASTER Principles for Successful Carbon Pricing: An Approach Based on Initial Experience, 2015.
15
Executive summary
that discourages low-carbon investments, there may be a legitimate trade-off with carbon prices. Policymakers will need to determine whether there are ways to manage these tensions at the margin and/or decide which objective should take precedence.
The dynamic nature of the complex interactions between carbon pricing, other climate change policies and the broader domestic policy landscape means that problems cannot always be fully anticipated. The management of these interactions will be an evolutionary and iterative process. Understanding this, policymakers should incorporate regular processes of review and evaluation so as to be able to respond to challenges that may emerge, without causing inconsistent policy twists and turns that could undermine the confidence of businesses to plan and invest. There are analytical tools that policymakers can use to better understand the effectiveness of carbon pricing and its complex interaction with multiple policies jointly influencing choices made by economic actors.
BUILDING AN INTERNATIONAL CARBON MARKET
AFTER PARIS
As well as being a powerful tool to realize domestic abatement opportunities, carbon pricing can support international cooperation on mitigation through the establishment of an international carbon market. Such a market allows those who have the financial responsibility for reducing emissions to purchase emission reductions wherever this is most cost-effective. This flexibility can significantly reduce costs, allowing for an increase in ambition.
Modeling analysis undertaken for this report shows that an international market could reduce the cost of delivering the emission reductions identified in the current INDCs by about a third by 2030. The modeling also finds that by the middle of the century, an international market has the potential to reduce global
mitigation costs by 50 percent. At the same time, the analysis highlights that some of the poorer regions in the world may be able to generate financial flows from selling emission reductions amounting to 2–5 percent of gross domestic product in 2050. These benefits might be realized while also promoting greater knowledge sharing and technical cooperation, and increasing political and public commitment to pursue low-carbon growth. Another co-benefit of an international carbon market is that it increases the ability of policymakers to address the challenges of carbon leakage and the impact on competitiveness that domestic carbon pricing creates.
The development of mechanisms that will realize these opportunities has been given renewed impetus by Article 6 of the Paris Agreement. However, there are a number of legitimate barriers must be addressed. In particular, sellers may fear that selling emission reductions today will make it more difficult to realize their NDCs or other commitments in the future. This, in turn, could cause potential buyers to be concerned that there will not be a robust and liquid carbon market which they can access. Other challenges include concerns about losing control of the value of the domestic carbon price and the political challenges created by the scale of international transfers that may be generated. The latter issue particularly relates to fears that countries with low ambition may be rewarded through the receipt of international transfers. Another concern is the loss of the co-benefits associated with reducing emissions.
Given these barriers, the same learning-by-doing process that policymakers could adopt to promote domestic alignment between carbon pricing and other domestic policies and objectives can also yield dividends in the development of an international carbon market. Solutions to many of these barriers include technical cooperation, results-based climate finance, sectoral approaches, mechanisms to measure and reflect differential ambition and the greater use of international standards. The use of a combination of these approaches is one possible route to the development of an international carbon market.
16

Introduction
section 1
1 Introduction
7 While this report covers the period from January 1, 2015 until September 1, 2016, the authors decided to include the entry into force of the Paris Agreement given its global significance. The authors recognize that other significant developments have occurred after September 1, 2016 and before the publication of the report. These developments include the agreement reached at the 39th Assembly of the International Civil Aviation Organization (ICAO) on a global market-based measure to control CO2 emissions from international aviation, the announcement of a minimum federal carbon price in Canada, and the adoption of the carbon pricing legislation in Washington State, which happened after September 1, 2016 and before the publication of the report. They will be discussed in the 2017 edition of the Carbon Pricing Watch and the State and Trends of Carbon Pricing report.
8 Source: UNFCCC, Historic Paris Agreement on Climate Change - 195 Nations Set Path to Keep Temperature Rise Well Below 2 Degrees Celsius, December 12, 2015, http://newsroom.unfccc.int/unfccc-newsroom/finale-cop21/.
9 As of August 1, 2016. The share of global GHG emissions based on the 2012 GHG emissions in the Emissions Database for Global Atmospheric Research (EDGAR) database, including international transport emissions.
10 Source: Climate Action Tracker, Climate Pledges Will Bring 2.7 °C of Warming, Potential for More Action, December 8, 2015, http://climateactiontracker.org/news/253/Climate-pledges-will-bring-2.7C-of-warming-potential-for-more-action.html; IEA, World Energy Outlook Special Briefing for COP21, November 26, 2015.
11 The aggregate impact of these INDCs will be continued growth of emissions, from the 2014 level of 53 GtCO2e to 56 GtCO2e in 2030. Compared to emissions levels under a least cost trajectory for 2°C, the emissions level from the implementation of INDCs is 15 GtCO2e higher in 2030. This emissions level is projected following the implementation of unconditional and conditional pledges. Source: UNFCCC, Synthesis Report on the Aggregate Effect of the Intended Nationally Determined Contributions: An Update, May 2, 2016.
T he Paris Agreement will enter into force on November 4, 2016, less than a year after its adoption
at the 21st Conference of the Parties (COP 21) to the United Nations Framework Convention on Climate Change (UNFCCC) in Paris.7 At COP 21, world leaders agreed to keep the global average temperature increase well below 2°C. Also, ambition was ramped up, with consensus reached on pursuing efforts to hold the increase to 1.5°C.8 The Paris Agreement has been lauded as a significant global step forward in taking action on climate change.
Parties have been conveying their commitments to reduce greenhouse gas (GHG) emissions and adapt their development plans to the changing climate through their Intended Nationally Determined
Contributions (INDCs). Parties that have submitted INDCs account for 96 percent of the world’s GHG emissions and 98 percent of the global population.9 The urgent priority now is for governments to ensure implementation of these commitments, requiring sustained efforts to influence investment and consumption decisions made every day by firms and households. Despite the large number of INDCs that have been put forward so far, the global average temperature rise resulting from their implementation will reach 2.7°C,10 falling short of the goal.11 The decision in the Paris Agreement to gradually ratchet up ambition in future years through a five year revision cycle will therefore be important to meet the long term temperature objective.
18
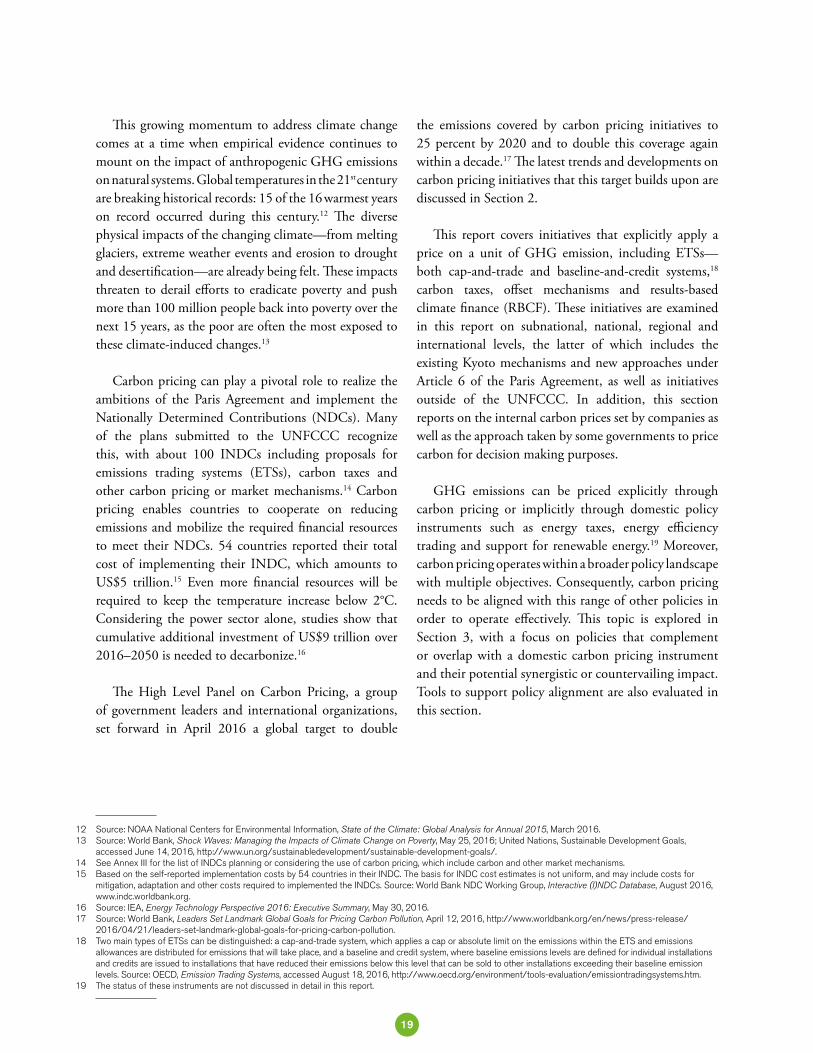
This growing momentum to address climate change comes at a time when empirical evidence continues to mount on the impact of anthropogenic GHG emissions on natural systems. Global temperatures in the 21st century are breaking historical records: 15 of the 16 warmest years on record occurred during this century.12 The diverse physical impacts of the changing climate—from melting glaciers, extreme weather events and erosion to drought and desertification—are already being felt. These impacts threaten to derail efforts to eradicate poverty and push more than 100 million people back into poverty over the next 15 years, as the poor are often the most exposed to these climate-induced changes.13
Carbon pricing can play a pivotal role to realize the ambitions of the Paris Agreement and implement the Nationally Determined Contributions (NDCs). Many of the plans submitted to the UNFCCC recognize this, with about 100 INDCs including proposals for emissions trading systems (ETSs), carbon taxes and other carbon pricing or market mechanisms.14 Carbon pricing enables countries to cooperate on reducing emissions and mobilize the required financial resources to meet their NDCs. 54 countries reported their total cost of implementing their INDC, which amounts to US$5 trillion.15 Even more financial resources will be required to keep the temperature increase below 2°C. Considering the power sector alone, studies show that cumulative additional investment of US$9 trillion over 2016–2050 is needed to decarbonize.16
The High Level Panel on Carbon Pricing, a group of government leaders and international organizations, set forward in April 2016 a global target to double
the emissions covered by carbon pricing initiatives to 25 percent by 2020 and to double this coverage again within a decade.17 The latest trends and developments on carbon pricing initiatives that this target builds upon are discussed in Section 2.
This report covers initiatives that explicitly apply a price on a unit of GHG emission, including ETSs—both cap-and-trade and baseline-and-credit systems,18 carbon taxes, offset mechanisms and results-based climate finance (RBCF). These initiatives are examined in this report on subnational, national, regional and international levels, the latter of which includes the existing Kyoto mechanisms and new approaches under Article 6 of the Paris Agreement, as well as initiatives outside of the UNFCCC. In addition, this section reports on the internal carbon prices set by companies as well as the approach taken by some governments to price carbon for decision making purposes.
GHG emissions can be priced explicitly through carbon pricing or implicitly through domestic policy instruments such as energy taxes, energy efficiency trading and support for renewable energy.19 Moreover, carbon pricing operates within a broader policy landscape with multiple objectives. Consequently, carbon pricing needs to be aligned with this range of other policies in order to operate effectively. This topic is explored in Section 3, with a focus on policies that complement or overlap with a domestic carbon pricing instrument and their potential synergistic or countervailing impact. Tools to support policy alignment are also evaluated in this section.
12 Source: NOAA National Centers for Environmental Information, State of the Climate: Global Analysis for Annual 2015, March 2016.13 Source: World Bank, Shock Waves: Managing the Impacts of Climate Change on Poverty, May 25, 2016; United Nations, Sustainable Development Goals,
accessed June 14, 2016, http://www.un.org/sustainabledevelopment/sustainable-development-goals/.14 See Annex III for the list of INDCs planning or considering the use of carbon pricing, which include carbon and other market mechanisms.15 Based on the self-reported implementation costs by 54 countries in their INDC. The basis for INDC cost estimates is not uniform, and may include costs for
mitigation, adaptation and other costs required to implemented the INDCs. Source: World Bank NDC Working Group, Interactive (I)NDC Database, August 2016, www.indc.worldbank.org.
16 Source: IEA, Energy Technology Perspective 2016: Executive Summary, May 30, 2016.17 Source: World Bank, Leaders Set Landmark Global Goals for Pricing Carbon Pollution, April 12, 2016, http://www.worldbank.org/en/news/press-release/
2016/04/21/leaders-set-landmark-global-goals-for-pricing-carbon-pollution.18 Two main types of ETSs can be distinguished: a cap-and-trade system, which applies a cap or absolute limit on the emissions within the ETS and emissions
allowances are distributed for emissions that will take place, and a baseline and credit system, where baseline emissions levels are defined for individual installations and credits are issued to installations that have reduced their emissions below this level that can be sold to other installations exceeding their baseline emission levels. Source: OECD, Emission Trading Systems, accessed August 18, 2016, http://www.oecd.org/environment/tools-evaluation/emissiontradingsystems.htm.
19 The status of these instruments are not discussed in detail in this report.
19
1 Introduction
In addition to driving domestic emission reductions, carbon pricing also supports international cooperation on mitigation. The Paris Agreement lays the basis for facilitating international recognition of cross-border approaches to cooperation on emissions mitigation, including pursuing cooperation through an international
carbon market. Section 4 evaluates the benefits of an international carbon market and analyses the barriers that may hold back the establishment of such a market. Potential ways to move forward to overcome these barriers are discussed and a scenario to transition to an international carbon market is presented.
» Mexico is convinced that in order to stabilize the increase in global temperature to 1.5°C above
pre-industrial levels, a fair and real carbon price must be set. For this reason, my country has implemented
different measures to promote a price on carbon such as carbon taxing and clean energy certificates
which will allow us to launch a carbon national market by 2018. «
Enrique Peña Nieto, President of Mexico
» We should now follow up the Paris Agreement with adequate actions, national policies, investment schemes
and regional and international initiatives and partnerships. I iterate Ethiopia’s commitment to
the global efforts to overcome dangerous climate change and ensure sustainable development. We will use every policy instrument, including carbon pricing, which is
found to be effective, efficient and fair. « Hailemariam Dessalegn, Prime Minister of Ethiopia
These statements were made on April 21, 2016 in conjunction with a call by the Carbon Pricing Panel for the world to expand carbon pricing to cover 25 percent of global emissions by 2020—double the current level—and to achieve 50 percent coverage within the next decade.
20
Existing and emerging carbon pricing initiatives
around the world
section 2
2.1OVERVIEW, RECENT DEVELOPMENTS,
AND EMERGING TRENDS
2.1.1Global overview of
carbon pricing initiatives
T he COP invited Parties to submit their INDCs as part of the groundwork for the adoption of the Paris
Agreement. About 100 Parties stated in their INDCs that they are planning or considering the use of carbon pricing,20 as specified in Box 1 and detailed further in Section 2.2.21 These Parties account for 58 percent of global GHG emissions. Among the Parties planning or considering the use of carbon pricing are three of the world’s five largest emitters, i.e. China, India and Brazil.22
On a regional, national and subnational level, about 40 national jurisdictions and over 20 cities, states, and regions are putting a price on carbon in 2016, as displayed
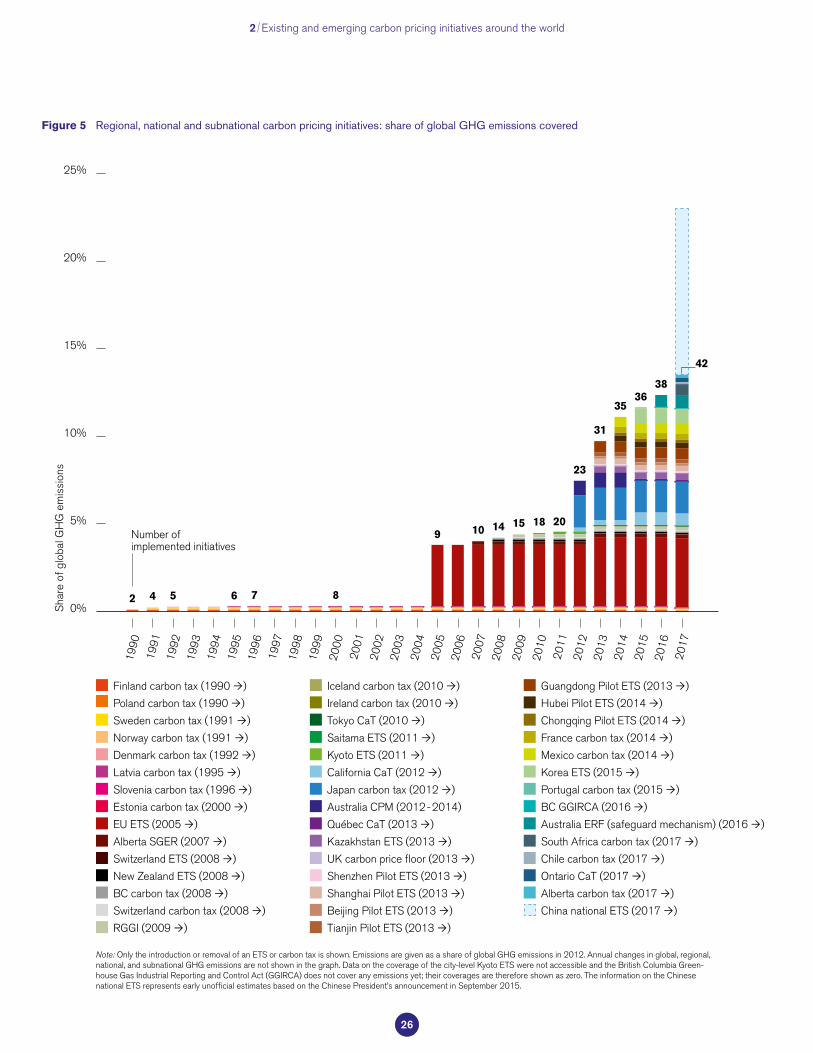
in Figure 4 and Box 1. These jurisdictions, which include seven out of the world’s ten largest economies,23 are responsible for almost a quarter of global GHG emissions.24 On average, the carbon pricing initiatives implemented and scheduled for implementation cover about half of the emissions in these jurisdictions. This translates to a total coverage of about 7 gigatons of carbon dioxide equivalent (GtCO2e) or about 13 percent of global GHG emissions, as displayed in Figure 5. This figure shows that the emissions covered by carbon pricing have increased threefold over the past decade. In addition, the number of initiatives implemented or scheduled for implementation has jumped from 9 to 42 over the same period.25
If the Chinese national ETS is implemented in 2017 as announced26—although coverage data has not been officially released—initial estimates show that emissions covered by carbon pricing initiatives could potentially increase from 13 percent to between 20 to 25 percent of global GHG emissions27 as illustrated in Figure 5.
2 Existing and emerging carbon pricing instruments
around the world
20 For the purpose of this report, carbon pricing includes carbon and other market mechanisms. The authors recognize that different interpretations are possible since references to market mechanisms in INDCs are not always presented in a clear and consistent manner.
21 As of September 1, 2016.22 The other two Parties, the United States (US) and the EU, did not state the use of carbon pricing in their INDCs, despite carbon pricing initiatives already being
implemented in those jurisdictions at a regional, national and/or subnational level. The number of Parties planning or considering the use of carbon pricing in their INDCs is therefore not comparable with the jurisdictions with carbon pricing initiatives implemented, scheduled or under consideration.
23 The seven economies are the US (carbon pricing initiatives at a subnational level), China, Japan, Germany, UK, France and Italy. The world’s largest economies were determined using the World Bank’s GDP data for 2014.
24 Figures as of August 1, 2016. 25 In 2006, carbon pricing initiatives covered 4 percent of annual global GHG emissions; in 2016, this figure stands at 13 percent. Similarly, 9 carbon pricing
initiatives were implemented or scheduled for implementation in 2006, increasing to 42 in 2016.26 Chinese President Xi Jinping made this announcement on September 25, 2015 as part of the “US-China Joint Presidential Statement on Climate Change”.27 The emissions to be covered under the Chinese national ETS are estimated to be about half of China’s national GHG emissions, based on the sector scope, as stated in
the “US-China Joint Presidential Statement on Climate Change”, and public emissions data from the International Energy Agency. This estimate has not been validated by Chinese authorities. Informed researchers have judged that the GHG emissions coverage could potentially be about 40 percent of China’s total GHG emissions.
22
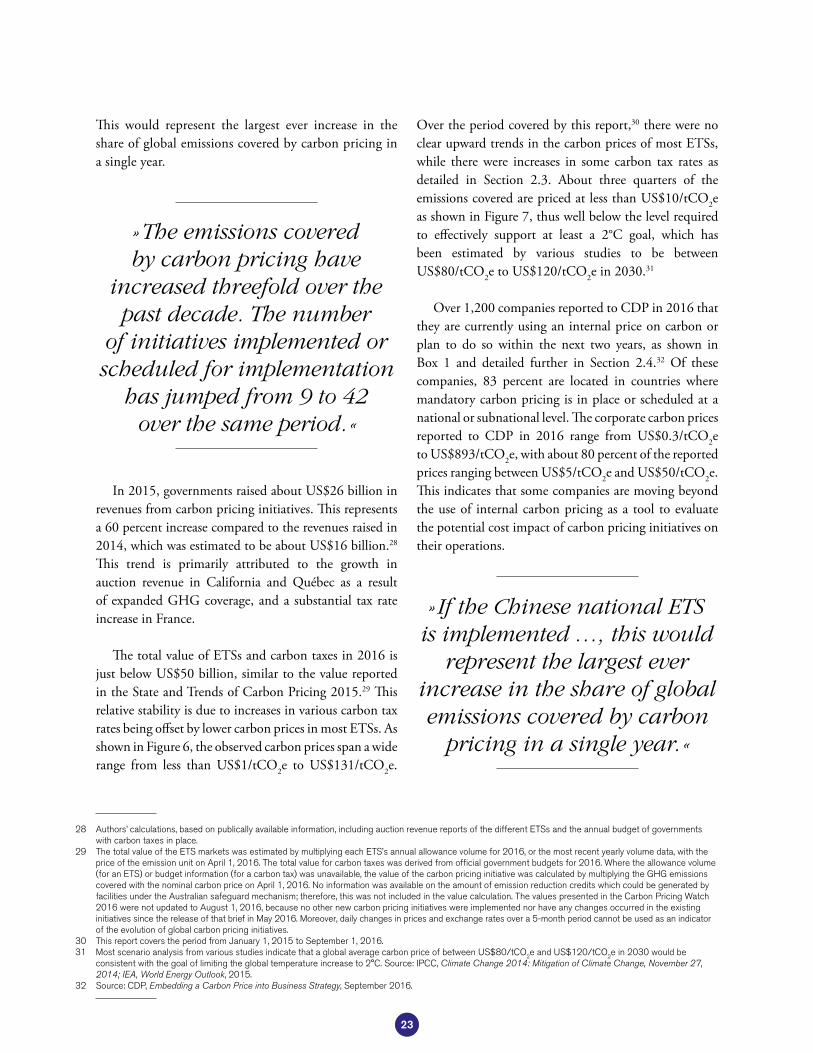
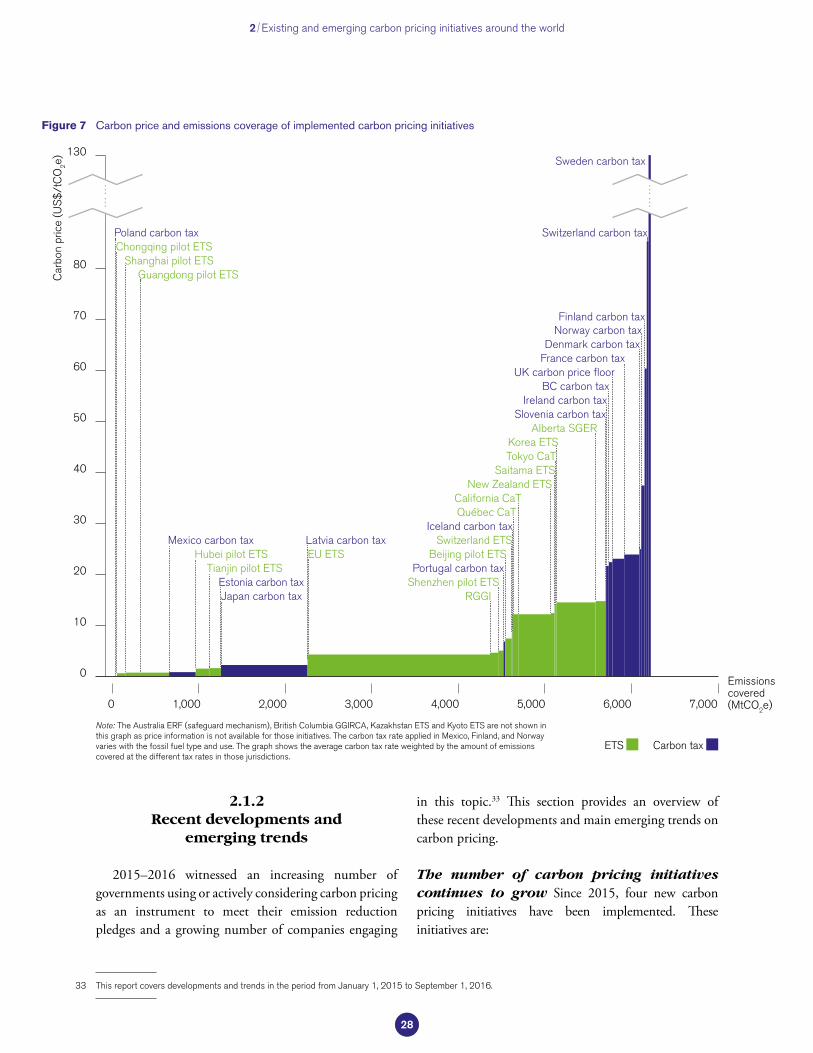
Over the period covered by this report,30 there were no clear upward trends in the carbon prices of most ETSs, while there were increases in some carbon tax rates as detailed in Section 2.3. About three quarters of the emissions covered are priced at less than US$10/tCO2e as shown in Figure 7, thus well below the level required to effectively support at least a 2°C goal, which has been estimated by various studies to be between US$80/tCO2e to US$120/tCO2e in 2030.31
Over 1,200 companies reported to CDP in 2016 that they are currently using an internal price on carbon or plan to do so within the next two years, as shown in Box 1 and detailed further in Section 2.4.32 Of these companies, 83 percent are located in countries where mandatory carbon pricing is in place or scheduled at a national or subnational level. The corporate carbon prices reported to CDP in 2016 range from US$0.3/tCO2e to US$893/tCO2e, with about 80 percent of the reported prices ranging between US$5/tCO2e and US$50/tCO2e. This indicates that some companies are moving beyond the use of internal carbon pricing as a tool to evaluate the potential cost impact of carbon pricing initiatives on their operations.
» If the Chinese national ETS is implemented …, this would
represent the largest ever increase in the share of global emissions covered by carbon
pricing in a single year. «
This would represent the largest ever increase in the share of global emissions covered by carbon pricing in a single year.
In 2015, governments raised about US$26 billion in revenues from carbon pricing initiatives. This represents a 60 percent increase compared to the revenues raised in 2014, which was estimated to be about US$16 billion.28 This trend is primarily attributed to the growth in auction revenue in California and Québec as a result of expanded GHG coverage, and a substantial tax rate increase in France.
The total value of ETSs and carbon taxes in 2016 is just below US$50 billion, similar to the value reported in the State and Trends of Carbon Pricing 2015.29 This relative stability is due to increases in various carbon tax rates being offset by lower carbon prices in most ETSs. As shown in Figure 6, the observed carbon prices span a wide range from less than US$1/tCO2e to US$131/tCO2e.
» The emissions covered by carbon pricing have
increased threefold over the past decade. The number
of initiatives implemented or scheduled for implementation
has jumped from 9 to 42 over the same period. «
28 Authors’ calculations, based on publically available information, including auction revenue reports of the different ETSs and the annual budget of governments with carbon taxes in place.
29 The total value of the ETS markets was estimated by multiplying each ETS’s annual allowance volume for 2016, or the most recent yearly volume data, with the price of the emission unit on April 1, 2016. The total value for carbon taxes was derived from official government budgets for 2016. Where the allowance volume (for an ETS) or budget information (for a carbon tax) was unavailable, the value of the carbon pricing initiative was calculated by multiplying the GHG emissions covered with the nominal carbon price on April 1, 2016. No information was available on the amount of emission reduction credits which could be generated by facilities under the Australian safeguard mechanism; therefore, this was not included in the value calculation. The values presented in the Carbon Pricing Watch 2016 were not updated to August 1, 2016, because no other new carbon pricing initiatives were implemented nor have any changes occurred in the existing initiatives since the release of that brief in May 2016. Moreover, daily changes in prices and exchange rates over a 5-month period cannot be used as an indicator of the evolution of global carbon pricing initiatives.
30 This report covers the period from January 1, 2015 to September 1, 2016.31 Most scenario analysis from various studies indicate that a global average carbon price of between US$80/tCO2e and US$120/tCO2e in 2030 would be
consistent with the goal of limiting the global temperature increase to 2°C. Source: IPCC, Climate Change 2014: Mitigation of Climate Change, November 27, 2014; IEA, World Energy Outlook, 2015.
32 Source: CDP, Embedding a Carbon Price into Business Strategy, September 2016.
23
2 Existing and emerging carbon pricing initiatives around the world
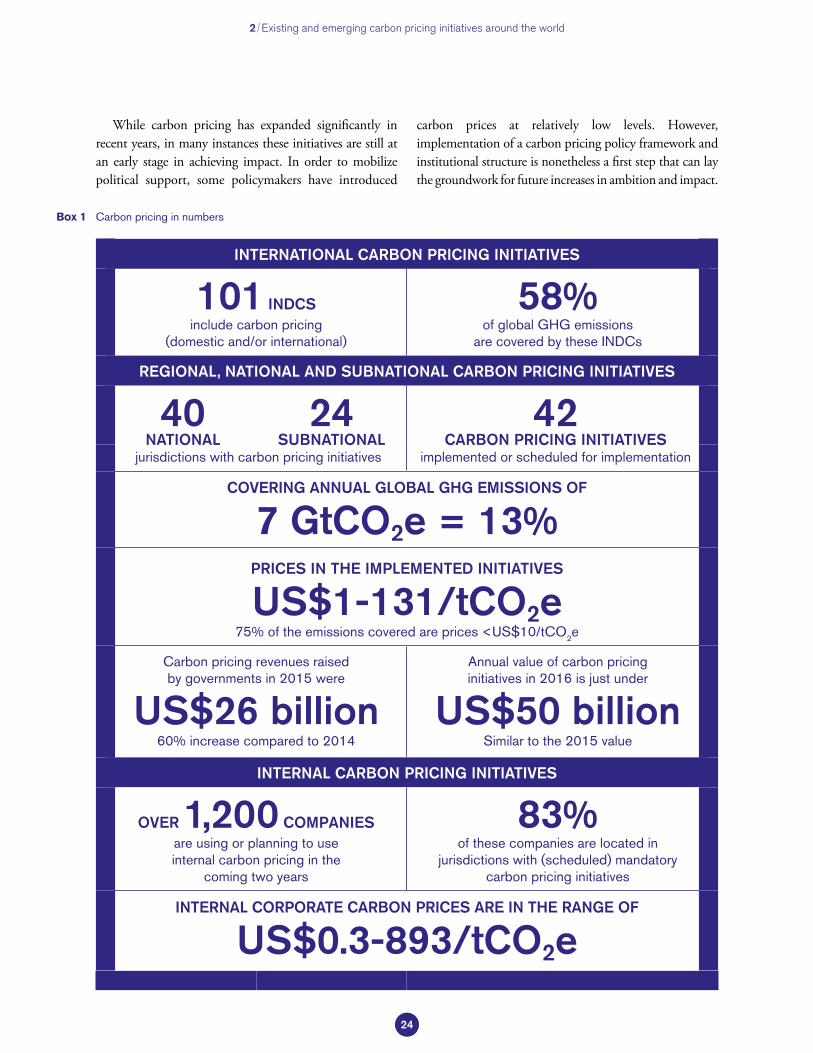
Carbon pricing in numbersBox 1
INTERNATIONAL CARBON PRICING INITIATIVES
101 INDCS include carbon pricing
(domestic and/or international)
58%of global GHG emissions
are covered by these INDCs
REGIONAL, NATIONAL AND SUBNATIONAL CARBON PRICING INITIATIVES
40NATIONAL
24SUBNATIONAL
42CARBON PRICING INITIATIVES
jurisdictions with carbon pricing initiatives implemented or scheduled for implementation
COVERING ANNUAL GLOBAL GHG EMISSIONS OF
7 GtCO2e = 13% PRICES IN THE IMPLEMENTED INITIATIVES
US$1-131/tCO2e75% of the emissions covered are prices <US$10/tCO2e
Carbon pricing revenues raised by governments in 2015 were
US$26 billion60% increase compared to 2014
Annual value of carbon pricing initiatives in 2016 is just under
US$50 billionSimilar to the 2015 value
INTERNAL CARBON PRICING INITIATIVES
OVER 1,200 COMPANIESare using or planning to use internal carbon pricing in the
coming two years
83%of these companies are located in
jurisdictions with (scheduled) mandatory carbon pricing initiatives
INTERNAL CORPORATE CARBON PRICES ARE IN THE RANGE OF
US$0.3-893/tCO2e
While carbon pricing has expanded significantly in recent years, in many instances these initiatives are still at an early stage in achieving impact. In order to mobilize political support, some policymakers have introduced
carbon prices at relatively low levels. However, implementation of a carbon pricing policy framework and institutional structure is nonetheless a first step that can lay the groundwork for future increases in ambition and impact.
24
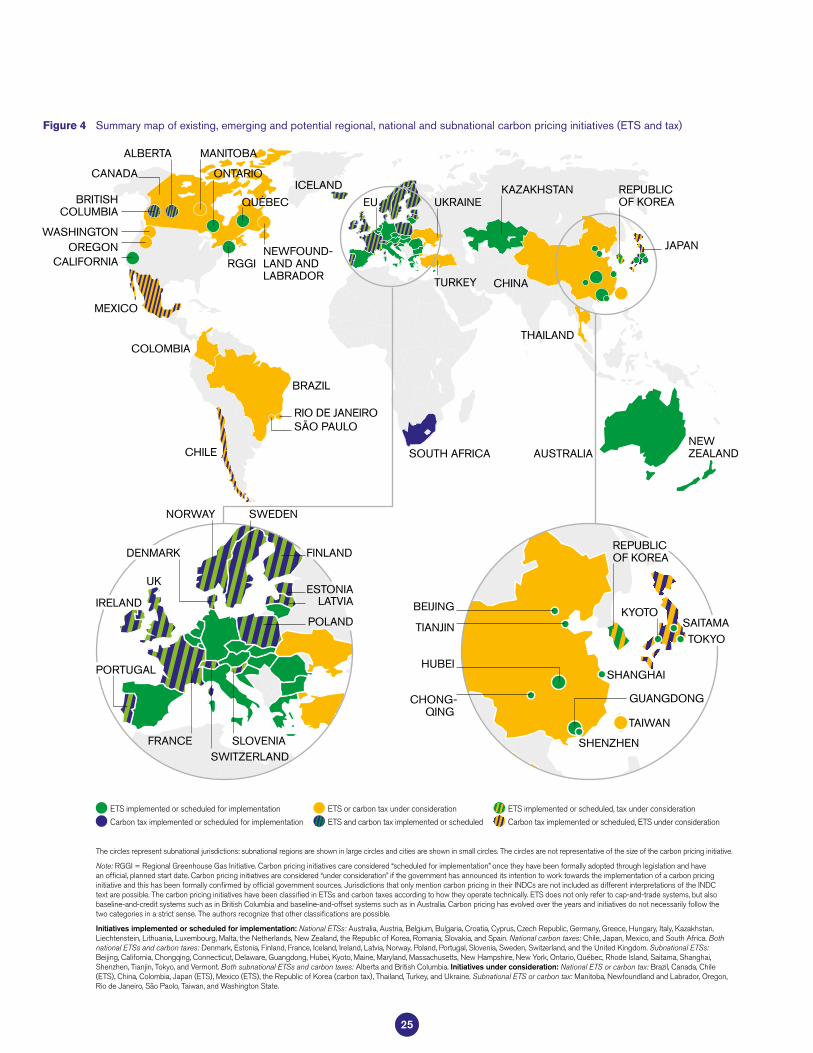
Summary map of existing, emerging and potential regional, national and subnational carbon pricing initiatives (ETS and tax) Figure 4
ETS implemented or scheduled for implementation
Carbon tax implemented or scheduled for implementation ETS or carbon tax under consideration
ETS and carbon tax implemented or scheduled ETS implemented or scheduled, tax under consideration
Carbon tax implemented or scheduled, ETS under consideration
The circles represent subnational jurisdictions: subnational regions are shown in large circles and cities are shown in small circles. The circles are not representative of the size of the carbon pricing initiative.
Note: RGGI = Regional Greenhouse Gas Initiative. Carbon pricing initiatives care considered “scheduled for implementation” once they have been formally adopted through legislation and have an official, planned start date. Carbon pricing initiatives are considered “under consideration” if the government has announced its intention to work towards the implementation of a carbon pricing initiative and this has been formally confirmed by official government sources. Jurisdictions that only mention carbon pricing in their INDCs are not included as different interpretations of the INDC text are possible. The carbon pricing initiatives have been classified in ETSs and carbon taxes according to how they operate technically. ETS does not only refer to cap-and-trade systems, but also baseline-and-credit systems such as in British Columbia and baseline-and-offset systems such as in Australia. Carbon pricing has evolved over the years and initiatives do not necessarily follow the two categories in a strict sense. The authors recognize that other classifications are possible.
Initiatives implemented or scheduled for implementation: National ETSs: Australia, Austria, Belgium, Bulgaria, Croatia, Cyprus, Czech Republic, Germany, Greece, Hungary, Italy, Kazakhstan, Liechtenstein, Lithuania, Luxembourg, Malta, the Netherlands, New Zealand, the Republic of Korea, Romania, Slovakia, and Spain. National carbon taxes: Chile, Japan, Mexico, and South Africa. Both national ETSs and carbon taxes: Denmark, Estonia, Finland, France, Iceland, Ireland, Latvia, Norway, Poland, Portugal, Slovenia, Sweden, Switzerland, and the United Kingdom. Subnational ETSs: Beijing, California, Chongqing, Connecticut, Delaware, Guangdong, Hubei, Kyoto, Maine, Maryland, Massachusetts, New Hampshire, New York, Ontario, Québec, Rhode Island, Saitama, Shanghai, Shenzhen, Tianjin, Tokyo, and Vermont. Both subnational ETSs and carbon taxes: Alberta and British Columbia. Initiatives under consideration: National ETS or carbon tax: Brazil, Canada, Chile (ETS), China, Colombia, Japan (ETS), Mexico (ETS), the Republic of Korea (carbon tax), Thailand, Turkey, and Ukraine. Subnational ETS or carbon tax: Manitoba, Newfoundland and Labrador, Oregon, Rio de Janeiro, São Paolo, Taiwan, and Washington State.
NEW ZEALAND
BRITISH COLUMBIA
WASHINGTONOREGON
CALIFORNIA
MEXICO
CHILE
BRAZIL
RIO DE JANEIROSÃO PAULO
RGGI
ALBERTA MANITOBA
ONTARIO
NEWFOUND- LAND AND LABRADOR
QUÉBEC
ICELAND
EU
TURKEY
UKRAINEKAZAKHSTAN
CHINA
THAILAND
JAPAN
SOUTH AFRICA
REPUBLIC OF KOREA
PORTUGAL
IRELAND
SWEDEN
FRANCESWITZERLAND
SLOVENIA
ESTONIA
FINLAND
LATVIA
UK
POLAND
NORWAY
DENMARK
KYOTOBEIJING
TIANJIN
HUBEISHANGHAI
CHONG- QING
SHENZHEN
TAIWAN
GUANGDONG
TOKYOSAITAMA
REPUBLIC OF KOREA
CANADA
AUSTRALIA
COLOMBIA
25
2 Existing and emerging carbon pricing initiatives around the world
Regional, national and subnational carbon pricing initiatives: share of global GHG emissions coveredFigure 5
Finland carbon tax (1990 )
Poland carbon tax (1990 )
Sweden carbon tax (1991 )
Norway carbon tax (1991 )
Denmark carbon tax (1992 )
Latvia carbon tax (1995 )
Slovenia carbon tax (1996 )
Estonia carbon tax (2000 )
EU ETS (2005 )
Alberta SGER (2007 )
Switzerland ETS (2008 )
New Zealand ETS (2008 )
BC carbon tax (2008 )
Switzerland carbon tax (2008 )
RGGI (2009 )
Iceland carbon tax (2010 )
Ireland carbon tax (2010 )
Tokyo CaT (2010 )
Saitama ETS (2011 )
Kyoto ETS (2011 )
California CaT (2012 )
Japan carbon tax (2012 )
Australia CPM (2012 - 2014)
Québec CaT (2013 )
Kazakhstan ETS (2013 )
UK carbon price floor (2013 )
Shenzhen Pilot ETS (2013 )
Shanghai Pilot ETS (2013 )
Beijing Pilot ETS (2013 )
Tianjin Pilot ETS (2013 )
Guangdong Pilot ETS (2013 )
Hubei Pilot ETS (2014 )
Chongqing Pilot ETS (2014 )
France carbon tax (2014 )
Mexico carbon tax (2014 )
Korea ETS (2015 )
Portugal carbon tax (2015 )
BC GGIRCA (2016 )
Australia ERF (safeguard mechanism) (2016 )
South Africa carbon tax (2017 )
Chile carbon tax (2017 )
Ontario CaT (2017 )
Alberta carbon tax (2017 )
China national ETS (2017 )
Note: Only the introduction or removal of an ETS or carbon tax is shown. Emissions are given as a share of global GHG emissions in 2012. Annual changes in global, regional, national, and subnational GHG emissions are not shown in the graph. Data on the coverage of the city-level Kyoto ETS were not accessible and the British Columbia Green-house Gas Industrial Reporting and Control Act (GGIRCA) does not cover any emissions yet; their coverages are therefore shown as zero. The information on the Chinese national ETS represents early unofficial estimates based on the Chinese President’s announcement in September 2015.
Sha
re o
f glo
bal G
HG
em
issi
ons
25%
20%
15%
10%
5%
0%
1990
1992
1995
2000
1998
2003
2004
2005
1991
1994
1997
2002
1993
1996
2001
1999
2006
2007
2008
2009
2010
2011
2012
2013
2014
2015
2016
2017
2 4 5 6 7 8
9 10 14 15 18 20
23
31
3536
38
Number of implemented initiatives
42
26
Prices in existing carbon pricing initiativesFigure 6
US$140/ tCO2e
US$20/ tCO2e
US$40/ tCO2e
US$60/ tCO2e
US$80/ tCO2e
US$0/ tCO2e
……
Norway carbon tax (upper)52
Alberta SGER, Korea ETS, Saitama ETS, Tokyo CaT15
UK carbon price floor24
8642
10
531
79
131 Sweden carbon tax
60 Finland carbon tax (other fossil fuels)
65 Finland carbon tax (liquid fuels)
26 Denmark carbon tax
22 Ireland carbon tax
19 Slovenia carbon tax
25 France carbon tax
86 Switzerland carbon tax
23 BC carbon tax
<1
13
US$/tCO2e
7 Portugal carbon tax
9 Switzerland ETS
6 Shenzhen Pilot ETS
8 Beijing Pilot ETS
13 New Zealand ETS,
Québec CaT , California CaT
3 Norway carbon tax (lower),
Japan carbon tax, Mexico carbon tax (upper)
1 Guangdong Pilot ETS, Shanghai Pilot ETS,
Chongqing Pilot ETS
5 RGGI, EU ETS
10 Iceland carbon tax
4 Latvia carbon tax
Estonia carbon tax, 2 Tianjin Pilot ETS, Hubei Pilot ETS
Mexico carbon tax (lower), Poland carbon tax
<1
Note: Nominal prices on August 1, 2016, shown for illustrative purpose only. The Australia ERF (safeguard mechanism), British Columbia GGIRCA, Kazakhstan ETS and Kyoto ETS are not shown in this graph as price information is not available for those initiatives. The figures given in the Carbon Pricing Watch 2016 have been updated to August 1, 2016. The differences with the Carbon Pricing Watch 2016 are due to the daily changes in prices and exchange rates. Prices are not necessarily comparable between carbon pricing initiatives because of differences in the number of sectors covered and allocation methods applied, specific exemptions, and different compensation methods.
27
2.1.2Recent developments and
emerging trends
2015–2016 witnessed an increasing number of governments using or actively considering carbon pricing as an instrument to meet their emission reduction pledges and a growing number of companies engaging
in this topic.33 This section provides an overview of these recent developments and main emerging trends on carbon pricing.
The number of carbon pricing initiatives continues to grow Since 2015, four new carbon pricing initiatives have been implemented. These initiatives are:
33 This report covers developments and trends in the period from January 1, 2015 to September 1, 2016.
2 Existing and emerging carbon pricing initiatives around the world
Carbon price and emissions coverage of implemented carbon pricing initiativesFigure 7
Chongqing pilot ETSPoland carbon tax
Shanghai pilot ETSGuangdong pilot ETS
Mexico carbon taxHubei pilot ETS
Tianjin pilot ETSEstonia carbon taxJapan carbon tax
Latvia carbon taxEU ETS
RGGIShenzhen pilot ETSPortugal carbon tax
Beijing pilot ETSSwitzerland ETS
Iceland carbon taxQuébec CaTCalifornia CaT
New Zealand ETSSaitama ETS
Tokyo CaTKorea ETS
Alberta SGER
Norway carbon tax
Sweden carbon tax
Switzerland carbon tax
Finland carbon tax
Slovenia carbon taxIreland carbon tax
BC carbon taxUK carbon price floor
France carbon taxDenmark carbon tax
0
10
20
30
40
50
60
70
80
130
0 1,000 2,000 3,000 4,000 5,000 7,0006,000
Emissions covered (MtCO2e)
Car
bon
pric
e (U
S$
/tC
O2e)
Note: The Australia ERF (safeguard mechanism), British Columbia GGIRCA, Kazakhstan ETS and Kyoto ETS are not shown in this graph as price information is not available for those initiatives. The carbon tax rate applied in Mexico, Finland, and Norway varies with the fossil fuel type and use. The graph shows the average carbon tax rate weighted by the amount of emissions covered at the different tax rates in those jurisdictions.
Carbon tax ETS
……
……
28
In 2015: – An ETS in the Republic of Korea – A carbon tax in Portugal, which is in addition to the
existing European Union Emissions Trading System (EU ETS)34
In 2016: – The Greenhouse Gas Industrial Reporting and
Control Act (GGIRCA) in British Columbia, which enables a price to be put on emissions of industrial facilities or sectors exceeding a specific limit, in addition to the province’s existing revenue neutral carbon tax
– The safeguard mechanism to the Emissions Reduction Fund (ERF) in Australia, launching a baseline-and-offset system following the abolishment of the Australian Carbon Pricing Mechanism in 2014
Furthermore, two new carbon pricing initiatives are scheduled for implementation: Ontario passed legislation for the introduction of an ETS in 2017 and Alberta enacted a law establishing a carbon tax, which will start from 2017 alongside the existing carbon pricing initiative.
A major step forward for carbon pricing took place in September 2015, when the Chinese President Xi Jinping announced that the Chinese national ETS will commence in 2017.35 In 2016, momentum for carbon pricing at the regional level also experienced a boost with Mexico announcing measures to enable a national carbon market starting in 2018, with an ETS as the preferred option. Also, Chile and Colombia are considering setting up an ETS.
In addition, France announced its intention to introduce a carbon floor price36 for the power sector from 2017 and Canada started exploring options for carbon pricing on a national level. On a subnational
level in North America, Newfoundland and Labrador announced its plan to introduce a carbon pricing initiative and Washington State, Oregon and Manitoba continue their efforts to introduce carbon pricing initiatives. Furthermore, the global aviation sector may implement an international carbon offsetting mechanism in 2021, details of which are expected later this year.
At the same time, initiatives in Kazakhstan and South Africa have experienced setbacks over the past year, with Kazakhstan temporarily suspending its ETS from 2016–2018 and South Africa delaying the start of its carbon tax to 2017.
Looking ahead, 2017 could see carbon pricing initiatives being launched across five continents for the first time in history, increasing the emissions covered under carbon pricing to an all-time high. These initiatives include the carbon pricing initiatives scheduled for implementation in Alberta, Chile, Ontario and South Africa, and the intended launch of the Chinese national ETS and France’s carbon price floor.
34 For further details on the Republic of Korea ETS and Portugal carbon tax, please refer to Kossoy et al., State and Trends of Carbon Pricing, September 2015.35 This announcement was made on September 25, 2015 as part of the “United States (US)-China Joint Presidential Statement on Climate Change”.36 A minimum carbon price for the power sector in France on top of the carbon price through the EU ETS.
» Looking ahead, 2017 could see carbon pricing initiatives being
launched across five continents for the first time
in history, increasing the emissions covered
under carbon pricing to an all-time high. «
29
Carbon pricing can play a pivotal role to implement the Paris Agreement and NDCs Carbon pricing can serve as a tool through which countries and regions cooperate to achieve their GHG mitigation targets, exchange emission reduction outcomes and enhance financial flows. The COP 21 decision and the 101 INDCs mentioning carbon pricing recognize this important role for carbon pricing. Article 6 of the Paris Agreement provides a basis for facilitating international recognition of cooperative carbon pricing approaches and identifies two separate concepts that may pave the way for this cooperation to be pursued through carbon pricing, as explained in Section 2.2 and further analyzed in Section 4.
To continue to build momentum, the Carbon Pricing Leadership Coalition (CPLC) was launched at COP 21 in Paris to bring together governments, business and non-governmental organizations that seek to take action to accelerate the global uptake of carbon pricing.37 Also, at COP 21 the G7 Carbon Market Platform opened up its membership to countries outside the G7,38 aiming to engage countries in policy dialogues on carbon pricing. Following the adoption of the Paris Agreement, 18 countries signed the New Zealand-led Ministerial Declaration on Carbon Pricing.39 The signatories committed to work together on developing standards and guidelines for the environmental integrity of international market mechanisms used toward NDCs. These initiatives and others such as Caring for Climate, the Partnership for Market Readiness (PMR) and the World Bank’s Networked Carbon Markets initiative are providing substantial technical information, allowing government and businesses leaders to take informed decisions on policy design and implementation and strengthen further cooperation on carbon pricing. A description of these initiatives can be found in Annex II.
Governments are broadening and deepening the use of carbon pricing Various jurisdictions are expanding their use of carbon pricing to cover GHG emissions from a wider range of sources across the economy. As planned, California and Québec expanded their ETSs from January 1, 2015: coverage rose from 35 and 30 percent of emissions in California and Québec respectively to 85 percent in both jurisdictions by the inclusion of transport fuels. Also, the carbon taxes introduced in Portugal in 2015 and planned in Alberta for 2017 put a price on GHG emissions from the fossil fuels that were not yet covered under their respective existing carbon pricing initiatives, following in the footsteps of other European countries such as Ireland in 2010 and France in 2014.40 In preparation for the national Chinese ETS, several Chinese ETS pilots extended their coverage with new sectors and added companies outside the ETS pilots.
More jurisdictions are exploring options for regional carbon pricing initiatives In 2016, carbon pricing at a regional level gained momentum with Mexico announcing measures to enable a national carbon market starting in 2018 and expressing a strong interest in a North American carbon market. A milestone was reached on August 31, 2016 when Mexico, Ontario and Québec issued a joint declaration to cooperate on carbon markets. In addition, dialogues to explore regional carbon pricing have been taking place in the context of the Pacific Alliance—Chile, Colombia, Mexico and Peru. These dialogues focus on the growing momentum to use carbon pricing policies to achieve regional green growth, the opportunities for improved regional collaboration and future carbon pricing pathways for the region.
Jurisdictions find innovative uses for carbon pricing revenues Governments raised about US$26 billion in revenues from ETSs and carbon taxes in 2015. Some jurisdictions use these revenues to
37 Source: Carbon Pricing Leadership, Homepage, accessed May 5, 2016, http://www.carbonpricingleadership.org/.38 Source: Federal Ministry for the Environment, Nature Conservation, Building and Nuclear Safety, G7 Opens Carbon Market Platform to Countries Worldwide,
December 2015.39 The countries that have signed the declaration are Australia, Canada, Chile, Colombia, Germany, Iceland, Indonesia, Italy, Japan, Mexico, the Netherlands, New
Zealand, Panama, Papua New Guinea, the Republic of Korea, Senegal, Ukraine and the US. Source: Ministry for the Environment, Ministerial Declaration on Carbon Markets, December 12, 2015.
40 For further details on the Portugal carbon tax, please refer to Kossoy et al., State and Trends of Carbon Pricing, September 2015.
2 Existing and emerging carbon pricing initiatives around the world
30
reduce budget deficits or lower income taxes, while other jurisdictions are channeling carbon pricing revenues toward complementary activities that accelerate the transition to a low-carbon economy. The designs of many emerging carbon pricing initiatives include earmarking of revenues for emissions mitigation activities. In Ontario, the auction revenues must be used for GHG emission reduction programs, while funds raised from the Alberta carbon tax will be used to support mitigation activities and distributed to vulnerable households to offset the impact of the carbon tax. In the GGIRCA in British Columbia, payments from emitters will be used to encourage the development of clean technologies. In addition, the entire revenue from the existing British Columbia revenue-neutral carbon tax is returned to taxpayers through reductions in other taxes in the province, with a built-in protection for lower-income taxpayers. The complementary role of carbon pricing revenues to other policies is discussed further in Section 3.
Carbon pricing initiatives continue to be fine-tuned, adapting to new circumstances Existing carbon pricing initiatives continue to learn from past experiences. With the decreasing emissions cap in the EU ETS, the number of allowances available for free allocation will fall. One focus of the ongoing revision of the EU ETS is a more targeted distribution of this decreasing number of free allowances to sectors that are most at risk of carbon leakage. In the New Zealand ETS, the measure that allows non-forestry ETS facilities to surrender one allowance for every two tons of CO2e emitted is being phased out to align the ETS with the national 2030 emission reduction target. New measures to address the perceived shortage of allowances in the carbon market were introduced in the Republic of Korea ETS, one year following the start of the initiative. California and the Regional Greenhouse Gas Initiative (RGGI) are also reviewing their ETSs, with the lessons learned informing the post-2020 ETS design. Following
three years of operation, Kazakhstan has temporarily suspended its ETS to address the issues it has faced so far and adapt it to changes in the economy.
The use of internal carbon pricing is growing The number of companies that have reported to CDP in 2016 that they are currently using an internal price has more than tripled compared to 2014.41 The largest increases came from companies located in Brazil, China, India, Japan, Mexico, the Republic of Korea and the United States (US).
In addition, companies are increasingly being requested by institutional investors to disclose their risk to climate change and measures to respond to it,42 which could include the use of an internal carbon price. Institutional investors representing over US$24 trillion in assets have committed to engage with governments on the risks of weak climate policy and the need for a carbon price. They also agreed to discuss with companies in which they invest on ways to minimize climate risks.43 At the same time, institutional investors are also facing increasing pressure to evaluate the climate risks associated with their investments. From 2016, the French Energy Transition Law requires investors to disclose the GHG emissions of their assets.44 Investors must also report on the way climate risks are incorporated in their investment strategy.
Governments are also using an internal carbon price for decision making purposes, such as assessing the climate impact of investments on infrastructure in project appraisals. Half of the ten Organisation for Economic Co-operation and Development (OECD) countries with the highest GHG emissions reported the use of internal carbon prices.45 Internal carbon prices used ranged from US$5/tCO2e to over US$400/tCO2e depending on the country, year and sector for which a decision is to be made. Section 2.4 further explores the use of internal carbon pricing by companies and governments.
41 Source: CDP, Embedding a Carbon Price into Business Strategy, September 2016.42 Organizations such as the Financial Stability Board – Taskforce on Climate-related Financial Disclosures are developing voluntary, consistent climate-related
financial risk disclosures for use by companies in providing information to investors, lenders, insurers, and other stakeholders. Source: FSB Task Force on Climate-Related Financial Disclosures, About the Task Force, August 18, 2016, https://www.fsb-tcfd.org/about/.
43 Through the Global Investor Statement on Climate Change. Source: Investor Platform for Climate Actions, Investor Actions, accessed April 7, 2016, http://investorsonclimatechange.org/.
44 Source: French Government, ION 2015-992 of 17 August 2015 on the Energy Transition to Green Growth - Article 173, August 17, 2015, https://www.legifrance.gouv.fr/affichTexteArticle.do;jsessionid=55442A1B2A15AFEF95F92C05F3C4B064.tpdila22v_1?idArticle=JORFARTI000031045547&cidTexte=-JORFTEXT000031044385&dateTexte=29990101&categorieLien=id.
45 In total, 17 of the 23 surveyed governments from OECD countries reported the use of an internal carbon price for decision making.
31
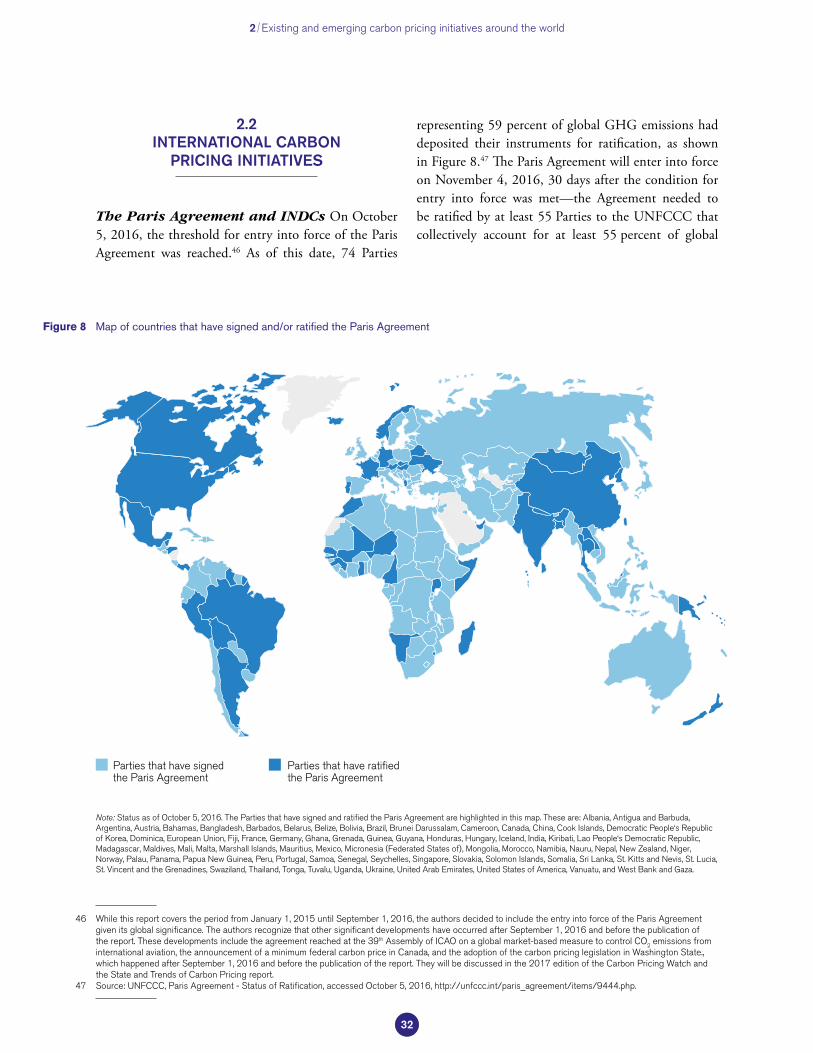
2.2INTERNATIONAL CARBON
PRICING INITIATIVES
The Paris Agreement and INDCs On October 5, 2016, the threshold for entry into force of the Paris Agreement was reached.46 As of this date, 74 Parties
representing 59 percent of global GHG emissions had deposited their instruments for ratification, as shown in Figure 8.47 The Paris Agreement will enter into force on November 4, 2016, 30 days after the condition for entry into force was met—the Agreement needed to be ratified by at least 55 Parties to the UNFCCC that collectively account for at least 55 percent of global
46 While this report covers the period from January 1, 2015 until September 1, 2016, the authors decided to include the entry into force of the Paris Agreement given its global significance. The authors recognize that other significant developments have occurred after September 1, 2016 and before the publication of the report. These developments include the agreement reached at the 39th Assembly of ICAO on a global market-based measure to control CO2 emissions from international aviation, the announcement of a minimum federal carbon price in Canada, and the adoption of the carbon pricing legislation in Washington State., which happened after September 1, 2016 and before the publication of the report. They will be discussed in the 2017 edition of the Carbon Pricing Watch and the State and Trends of Carbon Pricing report.
47 Source: UNFCCC, Paris Agreement - Status of Ratification, accessed October 5, 2016, http://unfccc.int/paris_agreement/items/9444.php.
2 Existing and emerging carbon pricing initiatives around the world
Note: Status as of October 5, 2016. The Parties that have signed and ratified the Paris Agreement are highlighted in this map. These are: Albania, Antigua and Barbuda, Argentina, Austria, Bahamas, Bangladesh, Barbados, Belarus, Belize, Bolivia, Brazil, Brunei Darussalam, Cameroon, Canada, China, Cook Islands, Democratic People‘s Republic of Korea, Dominica, European Union, Fiji, France, Germany, Ghana, Grenada, Guinea, Guyana, Honduras, Hungary, Iceland, India, Kiribati, Lao People‘s Democratic Republic, Madagascar, Maldives, Mali, Malta, Marshall Islands, Mauritius, Mexico, Micronesia (Federated States of), Mongolia, Morocco, Namibia, Nauru, Nepal, New Zealand, Niger, Norway, Palau, Panama, Papua New Guinea, Peru, Portugal, Samoa, Senegal, Seychelles, Singapore, Slovakia, Solomon Islands, Somalia, Sri Lanka, St. Kitts and Nevis, St. Lucia, St. Vincent and the Grenadines, Swaziland, Thailand, Tonga, Tuvalu, Uganda, Ukraine, United Arab Emirates, United States of America, Vanuatu, and West Bank and Gaza.
Map of countries that have signed and/or ratified the Paris AgreementFigure 8
Parties that have signed the Paris Agreement
Parties that have ratified the Paris Agreement
32
48 The Agreement will remain open for signature until April 21, 2017. Any Party to the UNFCCC that has not signed the Agreement by then may deposit its instrument of accession after that date. A Party to the UNFCCC that has signed the Agreement may deposit its instrument of ratification, acceptance or approval following signature.
49 Source: UNFCCC, Paris Agreement - Status of Ratification, accessed October 5, 2016, http://unfccc.int/paris_agreement/items/9444.php.50 Source: UNFCCC, INDCs as Communicated by Parties, accessed August 8, 2016, http://www4.unfccc.int/Submissions/INDC/Submission%20Pages/
submissions.aspx.51 As of September 1, 2016. The 189 countries submitted 162 INDCs, with the European Union submitting an INDC on behalf of its 28 member states.52 Based on the authors’ assessments of INDCs. INDCs that only mention a Reducing Emissions from Deforestation and Forest Degradation and sustainable forest
management, conservation of forests, and enhancement of carbon sinks (REDD+) mechanism are not included. We recognize that other interpretations on the mentioning of carbon pricing in the INDCs are possible, leading to a different count.
53 This analysis is based on the number of INDCs that make a reference to forms of national or international carbon pricing in their INDCs. However, the authors recognize that there are different interpretations possible for the text in INDCs and the mention of carbon pricing in a domestic context may not necessarily mean that a domestic carbon pricing initiative is formally under consideration. Also, not all Parties that already have a carbon pricing initiative implemented, scheduled or under consideration have reported this in their INDC. The number of Parties planning or considering the use of carbon pricing in their INDC is therefore not comparable with the jurisdictions with carbon pricing initiatives implemented, scheduled or under consideration.
54 Source: UNFCCC, Synthesis Report on the Aggregate Effect of the Intended Nationally Determined Contributions, October 30, 2015.
GHG emissions.48 In total, 191 Parties, which are collectively responsible for 96 percent of global GHG emissions, have signed the Paris Agreement.49 Once the Agreement enters into force, its provisions will become legally binding to the Parties that have ratified it and its operation will be governed by the COP serving as the meeting of the Parties to the Paris Agreement (CMA).
The COP has invited Parties to submit their INDCs prior to depositing their instrument of ratification, acceptance, approval or accession to the Agreement. INDCs are voluntary statements which were invited by the COP without prescription related to form. For Parties ratifying the Agreement that have already submitted an INDC, their INDC will be considered their first NDC, unless the Party decides to revise it. NDCs are legally distinct from INDCs and will be under the Agreement as and when it enters into force. They will be governed by Article 4 of the Agreement. Each Party to the UNFCCC that wishes to become a Party to the Agreement will have an obligation to communicate an NDC. The level of prescription attached to these will be determined by the negotiations on the operative elements of Article 4, which mainly take place under the Ad Hoc Working Group on the Paris Agreement. 162 INDCs have so far been submitted,50 accounting for 96 percent of the global GHG emissions and 98 percent of the world’s population.51
About two thirds of the submitted INDCs stated that they are planning or considering the use of carbon pricing as an instrument to cost-effectively reduce GHG emissions. These 101 INDCs are from Parties that account for 58 percent of global emissions.52
More specifically:53 – Eight INDCs from Parties responsible for five
percent of global GHG emissions mention that both international and domestic carbon pricing initiatives are under consideration.
– Six INDCs from Parties that represent almost a quarter of the global emissions mention the use of a domestic carbon pricing initiative.
– 87 INDCs from Parties that account for about 29 percent of the global emissions state intentions to use international carbon pricing initiatives.
A detailed list of INDCs is provided in Annex III. Many Parties request financial and technological support through international carbon markets to implement their INDC.54 Box 2 summarizes the costs Parties have reported as estimates for their INDC implementation.
33
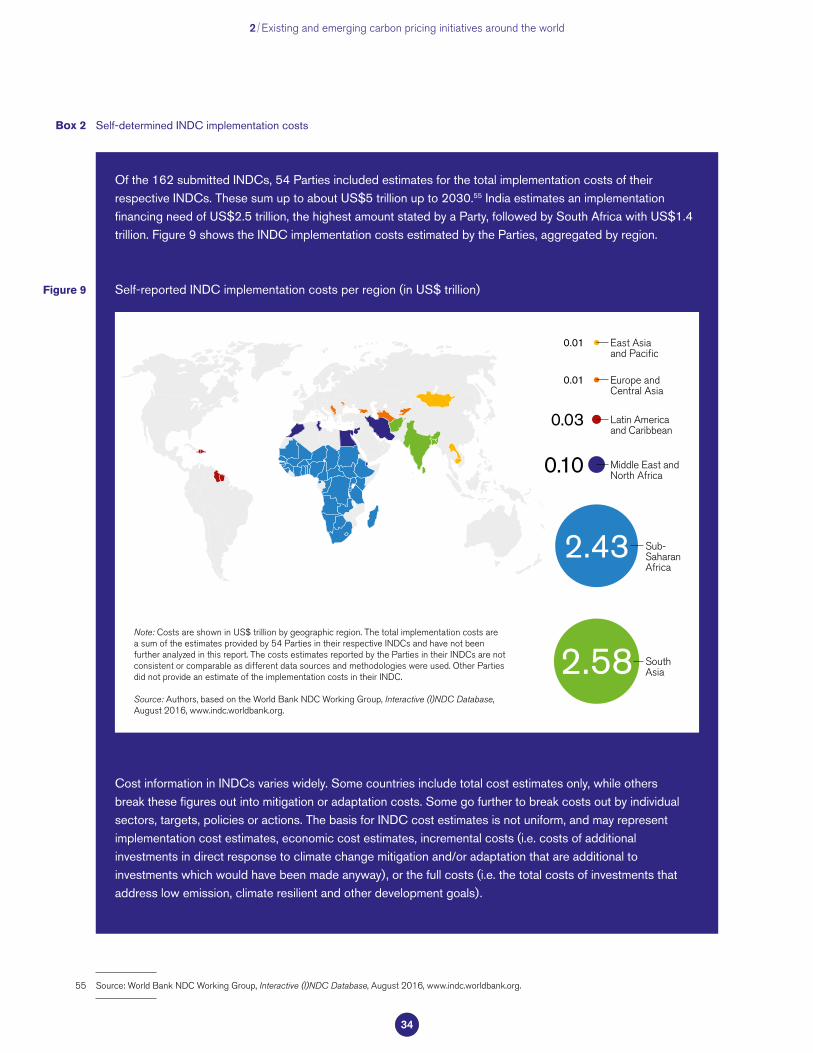
55 Source: World Bank NDC Working Group, Interactive (I)NDC Database, August 2016, www.indc.worldbank.org.
2 Existing and emerging carbon pricing initiatives around the world
Self-reported INDC implementation costs per region (in US$ trillion)Figure 9
Note: Costs are shown in US$ trillion by geographic region. The total implementation costs are a sum of the estimates provided by 54 Parties in their respective INDCs and have not been further analyzed in this report. The costs estimates reported by the Parties in their INDCs are not consistent or comparable as different data sources and methodologies were used. Other Parties did not provide an estimate of the implementation costs in their INDC.
Source: Authors, based on the World Bank NDC Working Group, Interactive (I)NDC Database, August 2016, www.indc.worldbank.org.
2.58 South Asia
2.43 Sub- Saharan Africa
0.10 Middle East and North Africa
0.03 Latin America and Caribbean
0.01 Europe and Central Asia
0.01 East Asia and Pacific
Self-determined INDC implementation costsBox 2
Of the 162 submitted INDCs, 54 Parties included estimates for the total implementation costs of their respective INDCs. These sum up to about US$5 trillion up to 2030.55 India estimates an implementation financing need of US$2.5 trillion, the highest amount stated by a Party, followed by South Africa with US$1.4 trillion. Figure 9 shows the INDC implementation costs estimated by the Parties, aggregated by region.
Cost information in INDCs varies widely. Some countries include total cost estimates only, while others break these figures out into mitigation or adaptation costs. Some go further to break costs out by individual sectors, targets, policies or actions. The basis for INDC cost estimates is not uniform, and may represent implementation cost estimates, economic cost estimates, incremental costs (i.e. costs of additional investments in direct response to climate change mitigation and/or adaptation that are additional to investments which would have been made anyway), or the full costs (i.e. the total costs of investments that address low emission, climate resilient and other development goals).
34
Article 6 of the Paris Agreement recognizes that Parties can voluntarily cooperate in the implementation of their NDCs to allow for higher ambition in mitigation and adaptation actions. Paragraph 136 of the first COP 21 Decision (Adoption of the Paris Agreement) recognizes the “important role of providing incentives for emission reduction activities, including tools such as domestic policies and carbon pricing”.56
Articles 6.2–6.3 of the Paris Agreement cover cooperative approaches where Parties could opt to meet their NDCs by using internationally transferred mitigation outcomes (ITMOs). ITMOs aim to provide a basis for facilitating international recognition of cross-border applications of subnational, national, regional and international carbon pricing initiatives. However, the precise nature of ITMOs has not yet been defined. ITMOs might cover outcomes from various existing and future approaches. Discussions at this stage encompass market and non-market approaches, e.g. credits from the Japanese Joint Crediting Mechanism (JCM), mitigation outcomes issued from the new mechanism established under Article 6.4, or renewable energy certificates. Such approaches should be voluntary, promote sustainable development, and ensure environmental integrity.
ITMOs should follow accounting principles approved by the COP to avoid double counting on the basis of corresponding adjustments for emissions covered by NDCs. The different forms and types of NDCs have implications for this accounting.57 Some stress that robust rules on additionality and quantifying mitigation outcomes should avoid the transfer of ITMOs that are not matched with mitigation action, i.e. “hot air”.58 In order to ensure environmental integrity, it is also proposed that Parties designate a supervisory body overseeing the trade of ITMOs.59 The point of application of the guidance for cooperative approaches under Article 6.2 is another area of discussion. The
guidance could apply to the generation, to the transfer or only to the use of an ITMO toward an NDC.
Articles 6.4 establishes a mechanism for countries to contribute to GHG emissions mitigation and sustainable development. This mechanism is under the authority and guidance of the CMA. It is open to all countries and the emission reductions can be used to meet the NDC of either the host country or another country. The mechanism is intended to incentivize mitigation activities by both public and private entities. The architecture of the mechanism is under discussion. Parties agreed that the new mechanism should build on the lessons learned from the existing Kyoto mechanisms while taking into consideration that both developed and developing Parties have emission reduction targets as stated in their NDCs.60 Some argue that the new mechanism could act to facilitate trade in the context of NDCs through the exchange of ITMOs. The types of activities to be covered by the mechanism are under discussion with considerations to include activities at various levels, allowing for example projects, sectors and aggregation.61 It remains unclear whether Reducing Emissions from Deforestation, Forest Degradation, and the role of conservation, sustainable management of forests, and enhancement of forest carbon stocks (REDD+) will be included in the new mechanism and how it will be linked to Article 5 on sinks and removals.62
The mechanism established under Article 6.4 will go beyond offsetting, as it aims to deliver overall mitigation through voluntary contributions. Ways to implement this are currently being discussed. Some Parties argue that the mechanism will lead to overall mitigation since it assists countries in implementing NDCs. Others are of the opinion that there should be specific considerations on how to achieve overall mitigation. This could for example be at the point of issuance of a mitigation outcome, e.g. by issuing fewer outcomes than emission reductions, or at the point of use of the outcome, e.g. by discounting.
56 Source: UNFCCC, Decisions Adopted by the Conference of the Parties: Decision 1/CP.21, January 29, 2016.57 Source: Ibid.58 Source: Wuppertal Institute, Carbon Mechanisms Review: The Dawning of a New Era, April 19, 2016.59 Source: World Resources Institute, Staying on Track from Paris: Advancing the Key Elements of the Paris Agreement, May 16, 2016.60 Source: IISD, Bonn Highlights: Thursday, 19 May 2016, May 20, 2016.61 Source: Ibid.62 Source: Ibid.
35
Table 1
Moreover, opinions differ on ways to include sustainable development aspects into the mechanism. Options discussed range from loose national criteria to internationally agreed indicators for monitoring, reporting and valuation of sustainable development.63 A share of the proceeds from activities under the new mechanism will be used to cover administrative expenses. In addition, some of the proceeds will be disbursed to support the adaptation needs of developing countries that are particularly vulnerable to the adverse effects of climate change.
To operationalize the Paris Agreement, the COP mandated the Subsidiary Body for Scientific and Technological Advice (SBSTA) to develop the guidance for cooperative approaches under Article 6.2 as well as the rules, modalities and procedures for the mechanism under Article 6.4. It requested the SBSTA to recommend this output for consideration and adoption by the CMA at its first session. The SBSTA began working on these topics during its May 2016 meeting in Bonn and invited parties and observer organizations to submit their views on these topics by September 30, 2016.64 International cooperation through carbon pricing is further discussed in Section 4.
Clean Development Mechanism and Joint Implementation International demand for Kyoto credits—Certified Emission Reductions (CERs) and Emission Reduction Units (ERUs)—is almost exhausted. The EU, which was the biggest source of demand historically, has most likely already fulfilled its demand for international credits. In 2015, EU ETS installations exchanged just under 23 million CERs for EU allowances (EUAs). This means that to date, EU ETS installations have used almost 1.5 GtCO2e of CERs and ERUs of the total 1.6 GtCO2e allowed under this system between 2008 and 2020.65 The remaining 0.1 GtCO2e
of residual demand is likely to already be in the hands of EU ETS installations. So far, over 2.5 GtCO2e of CERs and ERUs have been issued.66
No other substantial source of demand for CERs currently exists. Some carbon pricing initiatives at the national level provide the possibility of demand for CERs, such as in Korea, Mexico and South Africa, although only domestic CERs are accepted in these initiatives. Some countries continue purchasing for compliance, such as Norway. The CDM Executive Board is investigating ways to broaden demand for CERs and participation in the CDM67 and Paragraph 106 of the first COP 21 Decision68 encourages Parties to promote the voluntary cancelation of Kyoto credits. A CDM online platform for voluntary cancelations of CERs was launched in September 2015, as part of an effort to increase demand for credits. The platform allows direct sales from project owners of smaller quantities of certificates. To date, this platform has resulted in voluntary cancelations of over 40,000 CERs,69 which represents less than 1 percent of the total 13.5 million CERs canceled since voluntary cancelation of CERs was made possible.70 Over two thirds of these canceled CERs were converted into Korean Carbon Units.71
The International Civil Aviation Organization’s (ICAO) new Carbon Offsetting and Reduction Scheme for International Aviation (CORSIA) is expected to be approved at ICAO’s 39th Assembly in October 2016 (see the International aviation section). This would establish a new source of demand for emission units,72 which might include CERs. Airlines might be allowed to buy emission units before the start of the CORSIA and bank them for later compliance. The eligibility of emission units might nevertheless be restricted to specific vintages and to the initial phases of the CORSIA.73
63 Source: Wuppertal Institute, Carbon Mechanisms Review: The Dawning of a New Era, April 19, 2016.64 Source: UNFCCC, Guidance on Cooperative Approaches Referred to in Article 6, Paragraph 2, of the Paris Agreement, May 24, 2016.65 Source: European Commission, Updated Information on Exchange and International Credit Use in the EU ETS, May 2, 2016, http://ec.europa.eu/clima/news/
articles/news_2016050201_en.htm.66 About 1.7 GtCO2e of CERs and over 0.8 GtCO2e of ERUs. As of July 31, 2016. Source: UNFCCC data, August 2016. The authors recognize that there is also
demand from sovereigns. However, this demand is uncertain and difficult to estimate.67 Source: UNFCCC, Options for Using the Clean Development Mechanism as a Tool for Other Uses, February 22, 2016.68 Source: UNFCCC, Decisions Adopted by the Conference of the Parties: Decision 1/CP.21, January 29, 2016.69 Source: UNFCCC, Total Amount of Cancelled Offsets to Date, accessed August 31, 2016, https://offset.climateneutralnow.org/vchistory.70 Source: UNFCCC, CDM Registry: Voluntary Cancellations as at 31 July 2016, August 1, 2016.71 Source: UNEP DTU Partnership, CDM/JI Pipeline Analysis and Database, accessed September 1, 2016, http://www.cdmpipeline.org/.72 Emission units could include credits and allowances from ETSs. 73 Source: ICAO, 2016 Global Aviation Dialogues (GLADS), March–April 2016.
2 Existing and emerging carbon pricing initiatives around the world
36
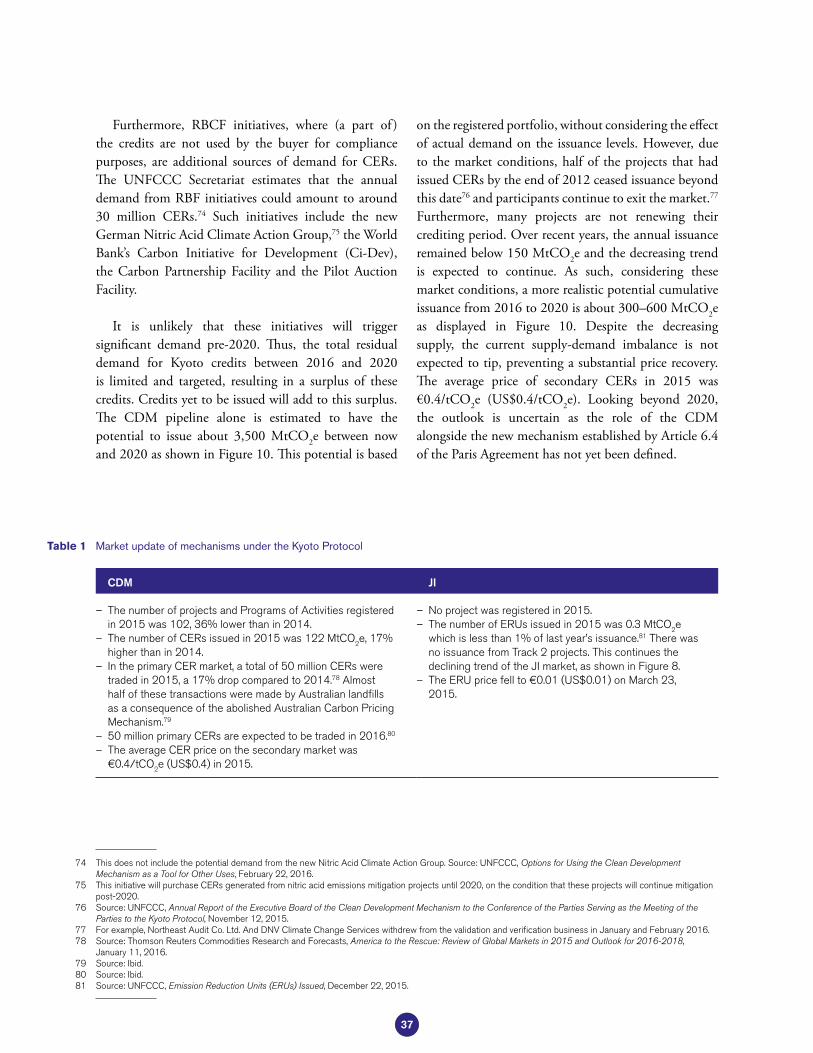
Market update of mechanisms under the Kyoto ProtocolTable 1
CDM JI
– The number of projects and Programs of Activities registered in 2015 was 102, 36% lower than in 2014.
– The number of CERs issued in 2015 was 122 MtCO2e, 17% higher than in 2014.
– In the primary CER market, a total of 50 million CERs were traded in 2015, a 17% drop compared to 2014.78 Almost half of these transactions were made by Australian landfills as a consequence of the abolished Australian Carbon Pricing Mechanism.79
– 50 million primary CERs are expected to be traded in 2016.80 – The average CER price on the secondary market was €0.4/tCO2e (US$0.4) in 2015.
– No project was registered in 2015. – The number of ERUs issued in 2015 was 0.3 MtCO2e which is less than 1% of last year’s issuance.81 There was no issuance from Track 2 projects. This continues the declining trend of the JI market, as shown in Figure 8.
– The ERU price fell to €0.01 (US$0.01) on March 23, 2015.
Furthermore, RBCF initiatives, where (a part of ) the credits are not used by the buyer for compliance purposes, are additional sources of demand for CERs. The UNFCCC Secretariat estimates that the annual demand from RBF initiatives could amount to around 30 million CERs.74 Such initiatives include the new German Nitric Acid Climate Action Group,75 the World Bank’s Carbon Initiative for Development (Ci-Dev), the Carbon Partnership Facility and the Pilot Auction Facility.
It is unlikely that these initiatives will trigger significant demand pre-2020. Thus, the total residual demand for Kyoto credits between 2016 and 2020 is limited and targeted, resulting in a surplus of these credits. Credits yet to be issued will add to this surplus. The CDM pipeline alone is estimated to have the potential to issue about 3,500 MtCO2e between now and 2020 as shown in Figure 10. This potential is based
on the registered portfolio, without considering the effect of actual demand on the issuance levels. However, due to the market conditions, half of the projects that had issued CERs by the end of 2012 ceased issuance beyond this date76 and participants continue to exit the market.77 Furthermore, many projects are not renewing their crediting period. Over recent years, the annual issuance remained below 150 MtCO2e and the decreasing trend is expected to continue. As such, considering these market conditions, a more realistic potential cumulative issuance from 2016 to 2020 is about 300–600 MtCO2e as displayed in Figure 10. Despite the decreasing supply, the current supply-demand imbalance is not expected to tip, preventing a substantial price recovery. The average price of secondary CERs in 2015 was €0.4/tCO2e (US$0.4/tCO2e). Looking beyond 2020, the outlook is uncertain as the role of the CDM alongside the new mechanism established by Article 6.4 of the Paris Agreement has not yet been defined.
74 This does not include the potential demand from the new Nitric Acid Climate Action Group. Source: UNFCCC, Options for Using the Clean Development Mechanism as a Tool for Other Uses, February 22, 2016.
75 This initiative will purchase CERs generated from nitric acid emissions mitigation projects until 2020, on the condition that these projects will continue mitigation post-2020.
76 Source: UNFCCC, Annual Report of the Executive Board of the Clean Development Mechanism to the Conference of the Parties Serving as the Meeting of the Parties to the Kyoto Protocol, November 12, 2015.
77 For example, Northeast Audit Co. Ltd. And DNV Climate Change Services withdrew from the validation and verification business in January and February 2016.78 Source: Thomson Reuters Commodities Research and Forecasts, America to the Rescue: Review of Global Markets in 2015 and Outlook for 2016-2018,
January 11, 2016.79 Source: Ibid.80 Source: Ibid.81 Source: UNFCCC, Emission Reduction Units (ERUs) Issued, December 22, 2015.
37
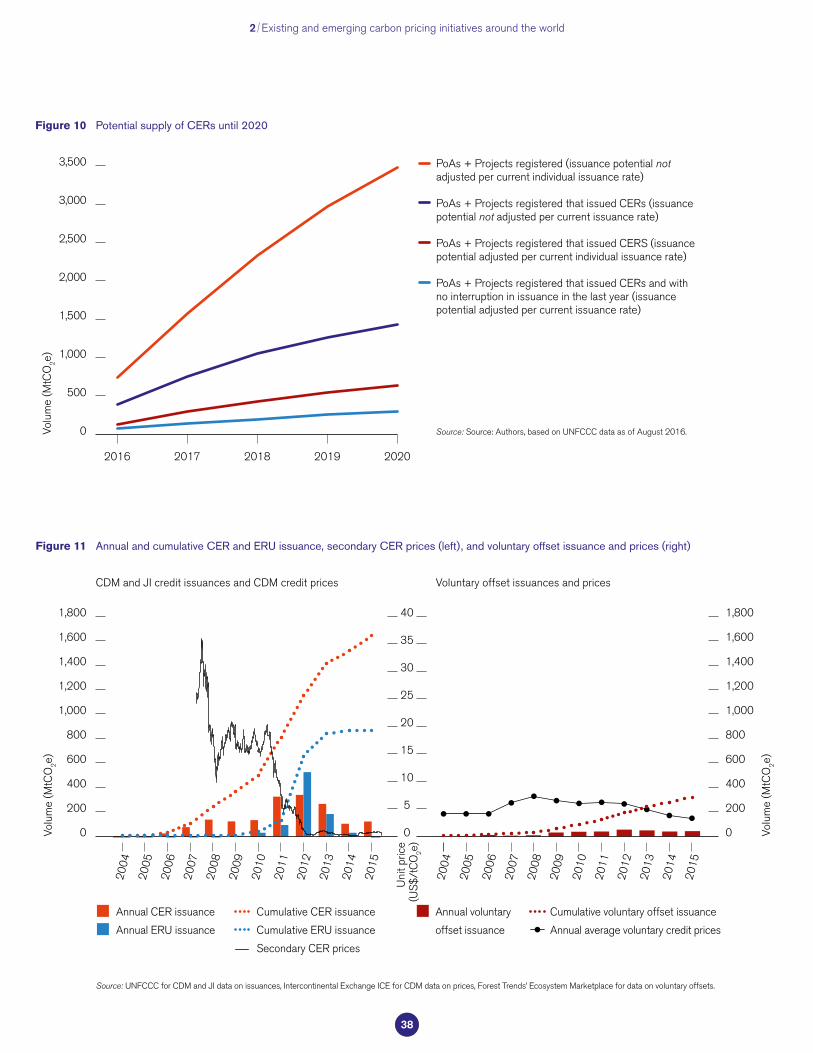
2 Existing and emerging carbon pricing initiatives around the world
Source: UNFCCC for CDM and JI data on issuances, Intercontinental Exchange ICE for CDM data on prices, Forest Trends’ Ecosystem Marketplace for data on voluntary offsets.
Annual and cumulative CER and ERU issuance, secondary CER prices (left), and voluntary offset issuance and prices (right)Figure 11
Annual CER issuance
Annual ERU issuance
Cumulative CER issuance
Cumulative ERU issuance
Secondary CER prices
Annual voluntary
offset issuance
Cumulative voluntary offset issuance
Annual average voluntary credit prices
CDM and JI credit issuances and CDM credit prices Voluntary offset issuances and prices
Volu
me
(MtC
O2e)
1,800
1,600
1,400
1,200
1,000
800
600
400
200
0
2011
2010
2008
2007
2006
2004
2009
2005
2012
2013
2015
2014
Volu
me
(MtC
O2e)
40
35
30
25
20
15
10
5
0
Uni
t pric
e (U
S$/t
CO
2e)
1,800
1,600
1,400
1,200
1,000
800
600
400
200
0
2011
2010
2008
2007
2006
2009
2005
2012
2013
2015
2014
2004
Potential supply of CERs until 2020Figure 10
PoAs + Projects registered (issuance potential not adjusted per current individual issuance rate)
PoAs + Projects registered that issued CERs (issuance potential not adjusted per current issuance rate)
PoAs + Projects registered that issued CERS (issuance potential adjusted per current individual issuance rate)
PoAs + Projects registered that issued CERs and with no interruption in issuance in the last year (issuance potential adjusted per current issuance rate)
Source: Source: Authors, based on UNFCCC data as of August 2016.
20202019201820172016
3,500
3,000
2,500
2,000
500
1,500
1,000
0Volu
me
(MtC
O2e)
38
International Emissions Trading The final accounting phase of the first commitment period of the Kyoto Protocol (CP1), known as the true-up period, ended on November 18, 2015.82 The 37 Annex B Parties submitted their true-up period reports by January 2016 and the reports were reviewed by experts by April 2016.83 A final compilation and accounting report was published for each of those Parties in August 2016. These reports will be considered at the COP 22 in Marrakech in November 2016, which will mark the official end of all reporting, review and accounting processes for CP1. The Parties used Kyoto mechanisms for compliance, including trading of Assigned Amount Units (AAUs), CERs and ERUs.84 Ukraine was the only Annex B Party that was not in full compliance with the Protocol in CP1, failing to transfer 1.9 billion AAUs from the 4 billion units in its holding account to its retirement account before the deadline.85 The largest exporters of AAUs were Poland, Romania and the Czech Republic.86 The 37 Annex B Parties emitted 66 GtCO2e during CP1 and held 80 billion AAUs in their retirement and holding accounts at the end of the true-up period.87 Although the resulting surplus of 14 billion units can be used to meet some of the obligations in the second commitment period of the
Kyoto Protocol (2013–2020), Annex B Parties will only carry over 5 billion units. Under the rules agreed in the Kyoto Protocol, CERs and ERUs can be carried over to the second commitment period (CP2), up to the value of 2.5 percent of the AAUs assigned to a Party in CP1.88 The emission reduction targets in CP2 are not yet legally binding as 144 Parties are required to ratify the Doha Amendment for it to enter into force: currently 66 Parties have done so.89
Voluntary carbon market In 2015, 84 MtCO2e of carbon offsets worth US$278 million were purchased.90 The volume purchased increased by 10% compared to 2014, mainly driven by voluntary offsetting in the private sector in jurisdictions without mandatory carbon pricing.91 Despite the larger volume, the overall market value declined by 7% due to a reduction in the average carbon price from US$4/tCO2e in 2014 to US$3/tCO2e in 2015 as shown in Figure 11. The cumulative issuance on the voluntary market is 330 million credits, which is about one-eighth the volume of CDM and JI issuances. However, annual issuance levels and prices in the voluntary market have been more stable over time than in the Kyoto credits market.
82 The true-up period refers to the additional period given for fulfilling commitments under each commitment of the Kyoto Protocol. Source: UNFCCC, True-up Period Information Report by the Secretariat, November 25, 2015, http://unfccc.int/kyoto_protocol/reporting/items/9044.php.
83 Source: UNFCCC, Reporting and Review Process for the True-up Period of the First Commitment Period of Kyoto Protocol, accessed September 3, 2016, http://unfccc.int/kyoto_protocol/reporting/true-up_period_reports_under_the_kyoto_protocol/items/9049.php.
84 Source: UNFCCC, Final Compilation and Accounting Report for the First Commitment Period of the Kyoto Protocol, August 2, 2016, http://unfccc.int/kyoto_ protocol/final_compilation_and_accounting_report_for_the_first_commitment_period/items/9691.php.
85 Source: UNFCCC, Preliminary Findings of the Enforcement Branch of the Compliance Committee: Ukraine, June 21, 2016.86 Source: Shishlov et al., Compliance of the Parties to the Kyoto Protocol in the First Commitment Period, June 10, 2016.87 Source: UNFCCC, True-up Period Information Report by the Secretariat, November 25, 2015, http://unfccc.int/kyoto_protocol/reporting/items/9044.php.88 Source: UNFCCC, Report of the Conference of the Parties Serving as the Meeting of the Parties to the Kyoto Protocol on Its First Session, Held at Montreal from
28 November to 10 December 2005, March 30, 2006.89 As of September 1, 2016. Source: UNFCCC, Status of the Doha Amendment, May 3, 2016, http://unfccc.int/kyoto_protocol/doha_amendment/items/7362.php.90 Source: Ecosystem Marketplace, Raising Ambition: State of the Voluntary Carbon Markets 2016, June 9, 2016.91 Note that the 2014 market size reported in Kossoy et al., State and Trends of Carbon Pricing, September 2015 was bigger than the current market size because
Ecosystem Marketplace amended in 2015 its methodology to calculate the volumes of offsets issued.
39
Reducing Emissions from Deforestation, Forest Degradation, and the role of conservation, sustainable management of forests, and enhancement of forest carbon stocks REDD+ was included in the Paris Agreement as a standalone article. Article 5 requests Parties to take action with regard to reducing emissions from deforestation and encourages them to implement and support the REDD+ related guidance and decisions that have been agreed under the Convention. COP 21 in Paris also adopted a new framework for REDD+ which complements the Warsaw Framework on REDD+ adopted at COP 19.92 Building on the New York Declaration on Forests, Norway, Germany and the United Kingdom (UK) jointly pledged US$5 billion to REDD+ over 2015–2020 at COP 21.93 Such commitments provide a basis for meeting the initial financing required to achieve the ambitious forest-related emission targets included in many INDCs.94
Results-based climate finance The use of RBCF mechanisms has continued to expand and develop. The Nitric Acid Climate Action Group was launched at COP 21 by the German Government. This initiative will purchase CERs generated from nitric acid emissions mitigation projects until 2020, on the condition that these projects will continue mitigation post-2020. On November 30, 2015, the World Bank announced the Transformative Carbon Asset Facility. Starting in 2017, this facility will provide RBCF to developing countries for the implementation of large
scale emission reduction programs with a focus on sectoral or policy-level programs. The initial target funding of US$500 million will support about 10–15 programs, and is expected to leverage over US$2 billion of finance.95 Other existing RBCF initiatives include the World Bank’s Carbon Initiative for Development, BioCarbon Fund, Carbon Partnership Facility, Forest Carbon Partnership Facility, Pilot Auction Facility and KfW-CAF Performance Based Climate Finance Facility in Latin America. The Pilot Auction Facility held its second auction in May 2016 and plans a third one by January 2017.96 In addition, in March 2016, the Green Climate Fund Board decided to assess the applicability of RBCF to sectors supported by the fund.97 International aviation At its 39th Assembly from 27 September – 7 October 2016, ICAO is expected to decide on a Global Market-Based Measure, as part of a basket of measures to achieve carbon-neutral growth from 2020, i.e., to ensure that net emissions of international flights are stabilized at 2020 levels, with any additional emissions above 2020 levels to be offset.98 The Draft Assembly Resolution on the mechanism was reviewed during the ICAO high-level meeting in Montréal in May 2016,99 with a further draft issued by the ICAO Council in September 2016.100 It is expected that ICAO will adopt technical standards with criteria that emissions programs would need to meet, including provisions to ensure no double-claiming.101 It is also foreseen that ICAO will develop a technical advisory
92 Source: UNFCCC, Decisions Adopted by the Conference of the Parties: Decision 1/CP.21, January 29, 2016; UNFCCC, Methodological Issues Related to Non-Carbon Benefits Resulting from the Implementation of the Activities Referred to in Decision 1/CP.16, Paragraph 70, December 11, 2015; UNFCCC, Alternative Policy Approaches, such as Joint Mitigation and Adaptation Approaches for the Integral and Sustainable Management of Forests, December 11, 2015.
93 Source: Federal Ministry for the Environment, Nature Conservation, Building and Nuclear Safety, Unlocking the Potential of Forests and Land Use, November 30, 2015.
94 Source: World Resources Institute, Forests Are in the Paris Agreement! Now What?, January 5, 2016, http://www.wri.org/blog/2016/01/forests-are-paris-agreement-now-what.
95 Source: World Bank, Carbon Pricing: It’s on the Move, November 30, 2015, http://www.worldbank.org/en/news/feature/2015/11/30/carbon-pricing-its-on-the-move.
96 Source: Pilot Auction Facility, Second Auction Results, accessed August 22, 2016, http://www.pilotauctionfacility.org/content/second-auction-results.97 Source: Green Climate Fund, Decisions of the Board – Twelfth Meeting of the Board, March 29, 2016.98 Source: ICAO, Market-Based Measures, accessed April 6, 2016, http://www.icao.int/environmental-protection/Pages/market-based-measures.aspx.99 Source: ICAO, High-Level Meeting on a Gobal Market-Based Measure Scheme, May 12, 2016.
100 Source: ICAO, Consolidated Statement of Continuing ICAO Policies and Practices Related To Environmental Protection – Global Market-Based Measure (MBM) Scheme, A39-WP/52, September 1, 2016.
101 Source: ICAO, 2016 Global Aviation Dialogues (GLADS), March–April 2016.
2 Existing and emerging carbon pricing initiatives around the world
40
102 Source: ICAO, Consolidated Statement of Continuing ICAO Policies and Practices Related To Environmental Protection – Global Market-Based Measure (MBM) Scheme, A39-WP/52, September 1, 2016.
103 Under this global market-based measure, countries (and/or airlines) will have to purchase carbon offsets to compensate for any increase in carbon emissions from international flights starting in 2021. The type of offsets that will be eligible will be defined at a later stage. Aviation currently represents approximately 2 percent of worldwide emissions—as much as the 7th largest emitting country in the world—a number anticipated to rise exponentially by 2050, and today the sector is not regulated under international climate agreements.
104 Source: ICAO, Climate Change: Global Market-based Measure (MBM), accessed September 3, 2016, http://www.icao.int/environmental-protection/Pages/ market-based-measures.aspx.
105 Source: The White House, Fact Sheet: U.S.-China Cooperation on Climate Change, September 3, 2016, https://www.whitehouse.gov/the-press-of-fice/2016/09/03/fact-sheet-us-china-cooperation-climate-change-0.
106 Source: ECAC, Declaration of Directors General of Civil Aviation of EU Member States and the Other Member States of the European Civil Aviation Conference: Adhering to the Global Market-Based Measure (GMBM) Scheme From the Start, September 3, 2016.
107 Source: ICAO, Resolution Drafting 7 & 9, August 22, 2016.108 Source: Republic of the Marshall Islands, Marshall Islands signals its intention to join a new scheme to reduce aviation emissions; urges others to urgently follow its
lead, September 6, 2016.109 Source: ICAO, Aviation Outlook, November 22, 2010.110 Source: US EPA, Aircraft, accessed September 1, 2016, https://www3.epa.gov/otaq/aviation.htm.111 Source: ICAO, Draft Assembly Resolution Text on a Global Market-Based Measure Scheme, March 11, 2016; Stockholm Environment Institute, Supply and
Sustainability of Carbon Offsets and Alternative Fuels for International Aviation, June 7, 2016.112 Source: UNFCCC, Issuance Certified Emission Reduction (CERs), accessed August 18, 2016, https://cdm.unfccc.int/Issuance/cers_iss.html; ICAO, 2016 Global
Aviation Dialogues (GLADs) on Market-Based Measures to Address Climate Change, March 14, 2016.113 Source: JCM Indonesia Secretariat, The Joint Crediting Mechanism’s First Emission Reduction Carbon Credit Issuance in the World, May 13, 2016.114 Source: New Mechanisms Information Platform, Recent Development of The Joint Crediting Mechanism (JCM), August 22, 2016.115 Source: JCM, Issuance of Credits, accessed August 18, 2016, https://www.jcm.go.jp/projects/issues.
body to make recommendations on the eligibility of emission units based on those standards, and taking into account relevant developments in the UNFCCC and Article 6 of the Paris Agreement.102
If adopted, the CORSIA will start in 2021,103
commencing with a pilot phase (2021-2023), followed by Phase 1 (2024-2026) and Phase 2 (2027-2035). Countries can participate in the pilot phase and Phase 1 on a voluntary basis.104 Phase 2 of the CORSIA will apply to all countries that exceed a certain threshold based on their share of international aviation activities. The US and China have announced that they would likely be early participants in the CORSIA105 and the 44 member states of the European Civil Aviation Conference have also signaled the possibility that they would join the CORSIA from the start.106 Least Developed Countries, Small Island Developing States and Landlocked Developing Countries are slated to be exempt from all phases, even if they meet the inclusion criteria for Phase 2.107 However, several are expected to voluntarily participate from the commencement of the CORSIA, including the Marshall Islands.108
Because ICAO addresses only international aviation, CO2 emissions from domestic flights—accounting for 38 percent of global aviation emissions—will not be covered by the CORSIA.109 However, a number of
countries have signaled their intent to regulate their domestic aviation emissions,110 including bringing them under domestic cap-and-trade programs (see Figure 12). The CORSIA itself has the potential to generate a cumulative estimated emission units demand of 3.3–4.5 GtCO2e between 2021 and 2035 if all additional emissions from international flights beyond 2020 levels are covered.111 The precise amount will depend on the extent to which countries voluntarily subscribe to it. This new source of demand for emission units could exceed the average annual issuance of 293 million CERs during the first commitment period of the Kyoto Protocol (2008-2012) by 2030.112
Joint Crediting Mechanism The JCM, a bilateral offset crediting scheme between Japan and 16 partner countries, issued its first credits in May 2016.113 Two Indonesia-based projects generated emission reduction credits totaling 40 tCO2e. These units have been used for offsetting purposes by the governments of Japan and Indonesia as well as project participants from the private sector.114 As of July 2016, 15 projects are registered and there were almost 100 financing programs and demonstration projects in the JCM pipeline during the period of 2013-2016 fiscal years, all of which receive supporting finance from the Japanese Ministry of Environment. However, no further credits have been issued since May 2016.115
41
2.3REGIONAL, NATIONAL,
AND SUBNATIONAL CARBON PRICING INITIATIVES
Carbon pricing has been implemented or is scheduled to commence in 40 national and over 20 subnational jurisdictions. Together, these carbon pricing initiatives cover about 7 GtCO2e, or about 13 percent of annual global GHG emissions.116 ETSs cover about 9 percent of annual global GHG emissions, while a further 4 percent are covered by carbon taxes. About a quarter of all jurisdictions with carbon pricing initiatives have both an ETS and carbon tax in place.117 As highlighted in Figure 12, 16 of the 42 carbon pricing initiatives implemented or scheduled for implementation apply to at least half of the total GHG emissions of the jurisdiction. The sectors and/or fuels covered by carbon pricing initiatives vary per jurisdiction. ETSs and taxes typically cover GHG emissions from power and industry sectors. Most carbon taxes cover all fossil fuels for energy use, generally with exemptions for companies already covered under an ETS.
The GHG emissions covered by carbon pricing would be significantly higher if policy instruments implicitly putting a price on carbon such as energy taxes were taken into account. In 2012, the effective rates of specific taxes on energy use,118 including carbon taxes covered at least 27 GtCO2e or half of the annual global GHG emissions.119 This means that the share of global GHG emissions facing an explicit and/or implicit price on carbon is significantly higher than the 13 percent coverage of carbon pricing initiatives. Summing the emissions covered by explicit carbon pricing through ETSs and carbon taxes and implicit pricing through energy taxes, the coverage could potentially be up to
116 These numbers are revised on a regular basis to reflect updated figures on GHG emissions in each jurisdiction, changes in the design and coverage of existing carbon pricing initiatives, the inclusion of new initiatives, and the availability of new data. Thus, these figures and the ones from previous reports are not necessarily comparable.
117 15 of the 64 jurisdictions with carbon pricing initiatives have both an ETS and carbon tax implemented or scheduled for implementation.118 A specific tax on energy use is a tax with a fixed value per unit of quantity such as US$ per megawatt hour or US$ per tCO2e.119 Based on data from the OECD for 41 countries, representing about 80 percent of global energy use and carbon emissions from energy use. The tax base of
effective tax rates on CO2 emissions from energy use was taken from OECD, Taxing Energy Use 2015 – OECD and selected partner economies, 2015. The tax bases were calculated as at April 1, 2012 (except in the case of Brazil and Australia, calculated as at June 1, 2012), employing energy use data sourced from IEA, Extended world energy balances 2009, 2014. Forthcoming OECD publications will feature more recent editions and analyses of this dataset.
120 Countries and regions are listed in alphabetical order. This report covers developments in the period from January 1, 2015 to September 1, 2016.
2 Existing and emerging carbon pricing initiatives around the world
Figure 1260 percent, or four times larger emissions covered by explicit carbon pricing initiatives only. In some cases, emissions are subject to both an implicit and explicit carbon price, due to overlapping policies that may have different objectives. It may therefore not always be desirable to combine these types of initiatives as policies that implicitly put a price on carbon do not have emission reductions as an objective. On the other hand, there are barriers to achieving emission reductions that explicit carbon pricing initiatives cannot overcome alone, and complementary policies are needed. This highlights the importance of aligning carbon pricing initiatives with the broader policy landscape to ensure the different policies can meet their objectives, as discussed in Section 3.
Further details on the main developments in regional, national and subnational carbon pricing initiatives over 2015–16 are presented by jurisdiction below.120 It should be noted that this section is not intended to be exhaustive, but rather a summary of the most recent developments in carbon pricing initiatives implemented and currently being designed or proposed.
» 16 of the 42 carbon pricing initiatives
implemented or scheduled for implementation apply to at least half of the total
GHG emissions of the jurisdiction. «
42
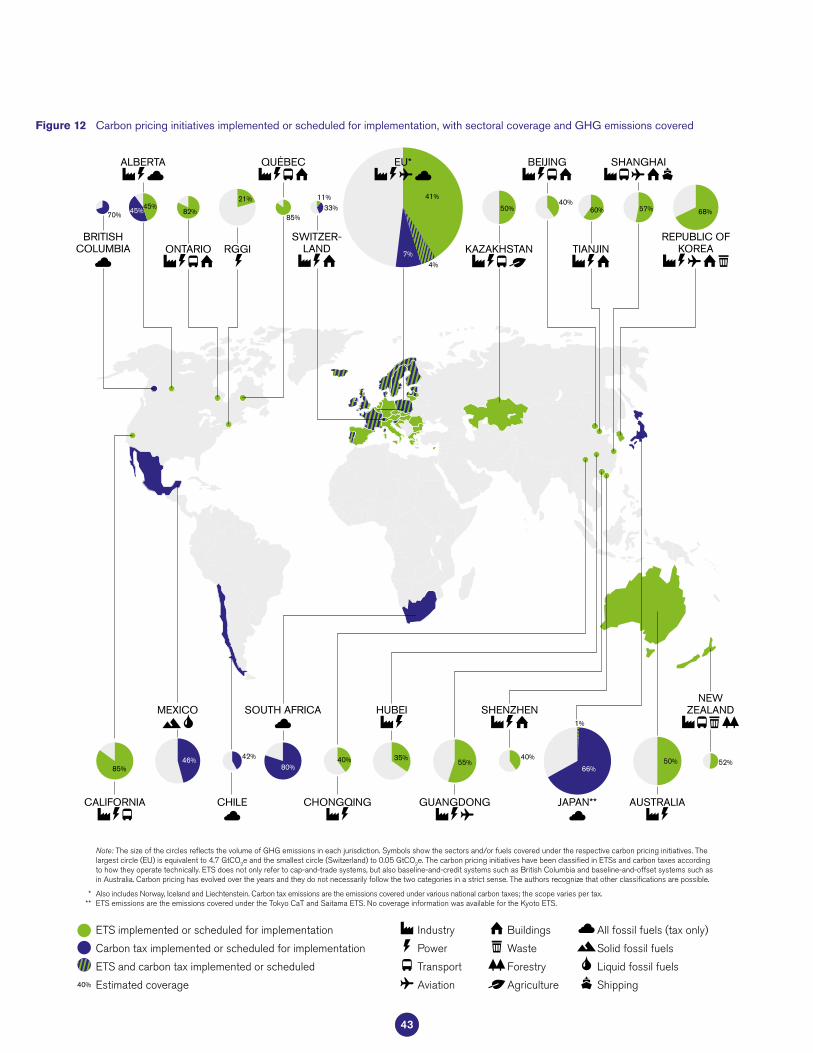
Carbon pricing initiatives implemented or scheduled for implementation, with sectoral coverage and GHG emissions coveredFigure 12
ETS implemented or scheduled for implementation
Carbon tax implemented or scheduled for implementation
ETS and carbon tax implemented or scheduled
Estimated coverage40%
Industry
Power
Transport
Aviation
Buildings
Waste
Forestry
Agriculture
All fossil fuels (tax only)
Solid fossil fuels
Liquid fossil fuels
Shipping
80%
SOUTH AFRICA
35%
HUBEI
GUANGDONG
55%
CHONGQING
40%
CALIFORNIA
85%
40%
BEIJING
57%
SHANGHAI
82%
ONTARIO
85%
QUÉBEC
21%
RGGI
50%
KAZAKHSTAN
68%
REPUBLIC OF KOREA
60%
TIANJIN
46%
MEXICO
4%
41%
7%
EU*
JAPAN**
66%
1%
70%
BRITISH COLUMBIA
45%
ALBERTA
45%
CHILE
42% 40%
SHENZHEN
AUSTRALIA
50% 52%
NEW ZEALAND
33%11%
SWITZER- LAND
***
Note: The size of the circles reflects the volume of GHG emissions in each jurisdiction. Symbols show the sectors and/or fuels covered under the respective carbon pricing initiatives. The largest circle (EU) is equivalent to 4.7 GtCO2e and the smallest circle (Switzerland) to 0.05 GtCO2e. The carbon pricing initiatives have been classified in ETSs and carbon taxes according to how they operate technically. ETS does not only refer to cap-and-trade systems, but also baseline-and-credit systems such as British Columbia and baseline-and-offset systems such as in Australia. Carbon pricing has evolved over the years and they do not necessarily follow the two categories in a strict sense. The authors recognize that other classifications are possible.
Also includes Norway, Iceland and Liechtenstein. Carbon tax emissions are the emissions covered under various national carbon taxes; the scope varies per tax.ETS emissions are the emissions covered under the Tokyo CaT and Saitama ETS. No coverage information was available for the Kyoto ETS.
43
Australia The ERF has been used since April 2015 by the Australian Government to purchase Australian Carbon Credit Units (ACCUs) from approved, voluntary emission reduction projects through an auction.121 As of September 1, 2016, the Australian Government has held three auctions and contracted 143 MtCO2e of emission reductions, which will be achieved over a period of up to ten years.122 The average price of ACCUs in the latest government auction held in April 2016 was A$10/tCO2e (US$7/tCO2e).
The ERF includes the safeguard mechanism, which came into effect on July 1, 2016, launching a baseline-and-offset system. It intends to ensure that emission reductions purchased by the Australian Government are not offset by significant increases in emissions above business-as-usual levels elsewhere in the economy. The safeguard mechanism requires facilities with annual emissions of over 100 kilotons of CO2e (ktCO2e) to limit their emissions to their individual absolute baseline levels.123 Facilities that exceed their emission baseline levels can purchase and surrender ACCUs for compliance.124 Facilities can implement emission reduction projects to generate ACCUs for their own compliance. They can also sell these ACCUs to other facilities or the government. There are rules in place to avoid double counting of emission reductions.125 The Australian government intends to review the ERF and safeguard mechanism in 2017.126
Canada Canada is back as a strong player in the climate space, with carbon pricing now under consideration on a national level. The “Vancouver Declaration on clean
growth and climate change” 127 released on March 3, 2016 includes a commitment to form several working groups, one of which will focus on carbon pricing mechanisms. These focus groups will make proposals for a national climate policy framework in fall 2016.
Developments at the provincial level in Canada include the commencement of the GGIRCA in British Columbia on January 1, 2016. This established a baseline-and-credit system that will cover liquefied natural gas (LNG) facilities currently under construction, once they become operational.128 Facilities under the GGIRCA are required to meet a GHG emission intensity target. Facilities can reduce their emissions intensity to meet the target, or purchase compliance units. Three types of compliance units are available: earned credits can be purchased from facilities that outperform the emissions intensity target, local offset credits or funded units, purchased from the province at a set price of CAN$25/tCO2e (US$19/tCO2e). The revenues from funded units will go to a technology fund focused on accelerating market adoption of innovative clean technologies to reduce GHG emissions in British Columbia.129 The facilities will continue to be subject to the British Columbia carbon tax.
On June 7, 2016, the Alberta legislature passed the
Climate Leadership Implementation Act.130 This Act establishes a carbon tax that applies to transport and heating fuels that are not covered by the Specified Gas Emitters Regulation (SGER)—the current carbon pricing initiative in Alberta. From January 1, 2017, a carbon tax of CAN$20/tCO2e (US$15/tCO2e) will apply.131 The
121 Source: Australian Government Clean Energy Regulator, About the Emissions Reduction Fund, February 15, 2016, http://www.cleanenergyregulator.gov.au/ERF/About-the-Emissions-Reduction-Fund.
122 Source: Australian Government Clean Energy Regulator, Auction Results April 2016, May 6, 2016, http://www.cleanenergyregulator.gov.au/ERF/Auctions- results/april-2016.
123 The baseline of each facility covered under the safeguard mechanism is generally determined based on the facility’s highest annual emissions in the period 2009/10–2013/14. Facilities need to surrender one ACCU for every ton of CO2 emitted above their baseline as part of their annual compliance. Facilities do not receive credits for emission reductions below their baseline. Source: Australian Government Clean Energy Regulator, The Safeguard Mechanism, January 13, 2016, http://www.cleanenergyregulator.gov.au/ERF/About-the-Emissions-Reduction-Fund/the-safeguard-mechanism.
124 Source: Ibid.125 To avoid double counting of emission reductions, the net emissions of a facility are increased by the amount of ACCUs generated in that year for accounting
purposes. The net emission reductions will be accounted for in the facility that surrenders the generated ACCUs. Source: Ibid.126 Source: Australian Government Clean Energy Regulator, The Safeguard Mechanism - Overview, April 6, 2016, http://www.environment.gov.au/climate-change/
emissions-reduction-fund/publications/factsheet-erf-safeguard-mechanism.127 Source: Canadian Intergovernmental Conference Secretariat, Vancouver Declaration on Clean Growth and Climate Change, March 3, 2016.128 Source: Government of British Columbia, Explore B.C.’s LNG Projects, accessed April 5, 2016, https://engage.gov.bc.ca/lnginbc/lng-projects/.129 Source: Government of British Columbia, World’s Cleanest LNG Legislation Comes into Force, December 18, 2015, https://news.gov.bc.ca/releases/
2015ENV0084-002116.130 Source: Legislative Assembly of Alberta, Bill 20: Climate Leadership Implementation Act, May 24, 2016.131 Source: Alberta Government, Carbon Levy and Rebates, accessed June 14, 2016, http://www.alberta.ca/climate-carbon-pricing.cfm.
2 Existing and emerging carbon pricing initiatives around the world
44
Alberta Government expects that its carbon pricing initiatives—the carbon tax and SGER—will raise CAN$9.6 billion (US$7.4 billion) in revenue in the first five years.132 The revenue will be used for mitigation activities, as well as tax rebates and adjustments for low and middle income households, small businesses and communities affected by the carbon tax.133 Facilities under the SGER that meet their compliance obligations through contributions to the Climate Change and Environmental Management Fund already faced a carbon price of CAN$20/tCO2e (US$15/tCO2e) from January 1, 2016 onward.134 The carbon price will further increase to CAN$30/tCO2e (US$23/tCO2e) from January 1, 2017. In total, the two carbon pricing initiatives in Alberta will cover 90 percent the province’s GHG emissions,135 up from about 45 percent currently covered by the SGER.
Manitoba, Ontario, and Québec signed a memorandum of understanding (MoU) that stated their intention to link their ETSs under the Western Climate Initiative.136 This follows separate announcements from Manitoba137 and Ontario138 in 2015 of their respective plans to introduce ETSs. Ontario subsequently passed its ETS legislation and its ETS is expected to be launched on January 1, 2017, covering 82 percent of Ontario’s annual GHG emissions.139 The design and scope of the Ontario Cap-and-Trade Program is similar to the California and Québec Cap-and-Trade Programs.140 The Ontario ETS will cover industries, electricity generators and suppliers and distributors of heating fuels with GHG emissions of more than
25 ktCO2e per year. Electricity importers and suppliers and distributors of more than 200 liters of fuel per year are also covered under the initiative. Free allowances will be provided to industries exposed to international competition, five percent of the allowances will be held in a strategic reserve and the remainder of the allowances will be auctioned. With an expected carbon price of CAN$18/tCO2e (US$14/tCO2e) in the first year of operation, the Ontario ETS will generate about CAN$1.9 billion (US$1.5 billion) in revenue per year.141 The revenue will be invested in GHG emission reduction programs across the economy.142
On June 7, 2016, Newfoundland and Labrador announced plans for a carbon pricing initiative that applies to onshore industrial facilities with annual GHG emissions exceeding 25 ktCO2e, covering 19% of the province’s GHG emissions. Prior to the launch of the initiative, a two year emissions monitoring period will be implemented, which will help establish emission reduction targets.143 The province is seeking to engage with the federal government to extend coverage of the initiative to offshore industrial facilities, covering an additional 19% of GHG emissions.144
China On September 25, 2015, the Chinese President announced that the Chinese national ETS will commence in 2017.145 The national ETS will cover power generation, petrochemicals, chemicals, building materials, steel, non-ferrous metals, paper and aviation.146 The National Development and Reform Commission (NDRC) is responsible for developing the
132 Source: based on correspondence with the government of Alberta, September 15, 2016.133 Source: Ibid.134 Source: Alberta Government, Climate Change and Emissions Management Act: Specified Gas Emitters Regulation, December 23, 2015.135 Source: based on correspondence with the government of Alberta, September 15, 2016.136 Source: Manitoba Government, Memorandum of Understanding Concerning Concerted Climate Change Actions and Market-Based Mechanisms, December 7,
2015.137 Source: Manitoba Government, Manitoba Introduces Comprehensive Plan to Address Climate Change, Create Green Jobs, December 3, 2015,
http://news.gov.mb.ca/news/index.html?item=36950.138 Source: Ontario Ministry of the Environment and Climate Change, Cap and Trade System to Limit Greenhouse Gas Pollution in Ontario, April 13, 2015,
https://news.ontario.ca/opo/en/2015/04/cap-and-trade-system-to-limit-greenhouse-gas-pollution-in-ontario.html.139 Source: Government of Ontario, Ontario Regulation 144/16: The Cap and Trade Program, May 19, 2016.140 Source: Government of Ontario, Ontario’s Climate Change Strategy, December 18, 2015, https://dr6j45jk9xcmk.cloudfront.net/documents/4928/cli-
mate-change-strategy-en.pdf.141 Source: Ontario Ministry of Finance, Investing in the Low-Carbon Economy, February 24, 2016.142 Source: Government of Ontario, Ensuring Accountability and Transparency, June 2, 2016, https://www.ontario.ca/page/cap-and-trade-program-overview#section-3.143 Source: Government of Newfoundland and Labrador, Provincial Government Announces Plan for Greenhouse Gas Emissions Reductions, June 7, 2016,
http://www.releases.gov.nl.ca/releases/2016/exec/0607n02.aspx.144 Source: based on correspondence with the government of Newfoundland and Labrador, September 1, 2016.145 Source: National Development and Reform Commission, China Starts the National Carbon Emissions Trading System in 2017, September 26, 2015,
http://qhs.ndrc.gov.cn/qjfzjz/201509/t20150930_753474.html.146 Source: National Development and Reform Commission, Notice on the Focus Work for Realising a Well-Operating National Emissions Trading System, January 11,
2016, http://qhs.ndrc.gov.cn/qjfzjz/201601/t20160122_791850.html.
45
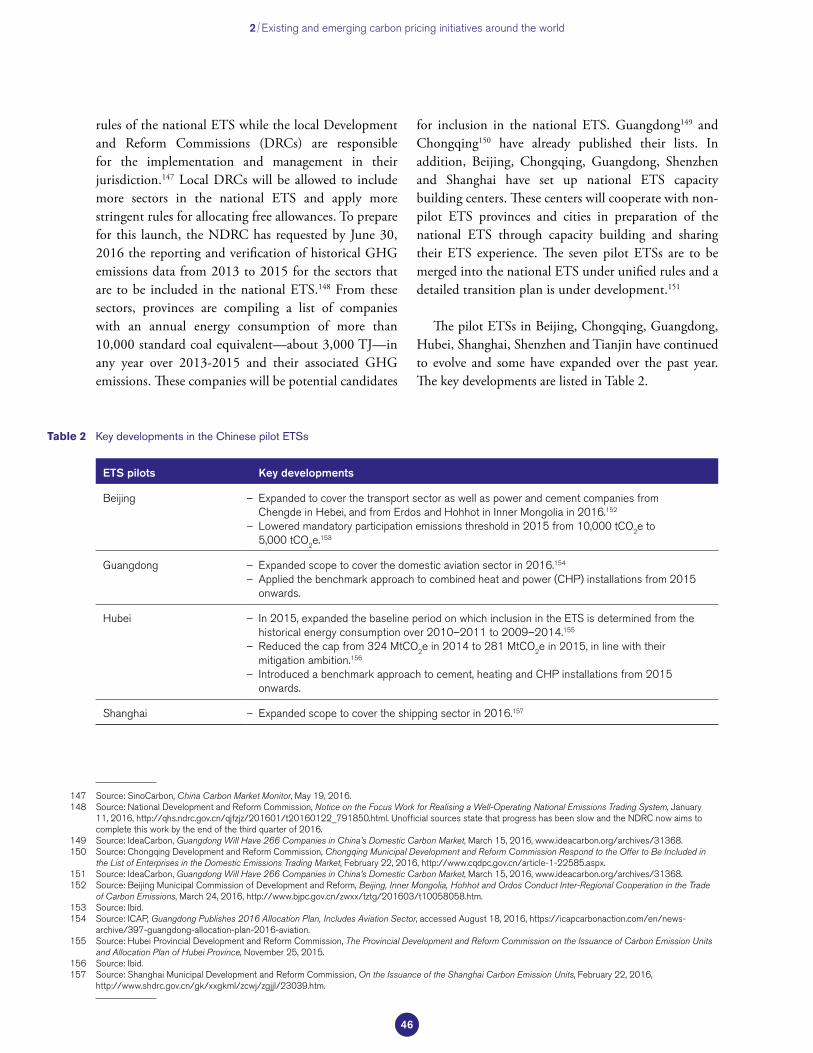
rules of the national ETS while the local Development and Reform Commissions (DRCs) are responsible for the implementation and management in their jurisdiction.147 Local DRCs will be allowed to include more sectors in the national ETS and apply more stringent rules for allocating free allowances. To prepare for this launch, the NDRC has requested by June 30, 2016 the reporting and verification of historical GHG emissions data from 2013 to 2015 for the sectors that are to be included in the national ETS.148 From these sectors, provinces are compiling a list of companies with an annual energy consumption of more than 10,000 standard coal equivalent—about 3,000 TJ—in any year over 2013-2015 and their associated GHG emissions. These companies will be potential candidates
for inclusion in the national ETS. Guangdong149 and Chongqing150 have already published their lists. In addition, Beijing, Chongqing, Guangdong, Shenzhen and Shanghai have set up national ETS capacity building centers. These centers will cooperate with non-pilot ETS provinces and cities in preparation of the national ETS through capacity building and sharing their ETS experience. The seven pilot ETSs are to be merged into the national ETS under unified rules and a detailed transition plan is under development.151
The pilot ETSs in Beijing, Chongqing, Guangdong, Hubei, Shanghai, Shenzhen and Tianjin have continued to evolve and some have expanded over the past year. The key developments are listed in Table 2.
147 Source: SinoCarbon, China Carbon Market Monitor, May 19, 2016.148 Source: National Development and Reform Commission, Notice on the Focus Work for Realising a Well-Operating National Emissions Trading System, January
11, 2016, http://qhs.ndrc.gov.cn/qjfzjz/201601/t20160122_791850.html. Unofficial sources state that progress has been slow and the NDRC now aims to complete this work by the end of the third quarter of 2016.
149 Source: IdeaCarbon, Guangdong Will Have 266 Companies in China’s Domestic Carbon Market, March 15, 2016, www.ideacarbon.org/archives/31368.150 Source: Chongqing Development and Reform Commission, Chongqing Municipal Development and Reform Commission Respond to the Offer to Be Included in
the List of Enterprises in the Domestic Emissions Trading Market, February 22, 2016, http://www.cqdpc.gov.cn/article-1-22585.aspx.151 Source: IdeaCarbon, Guangdong Will Have 266 Companies in China’s Domestic Carbon Market, March 15, 2016, www.ideacarbon.org/archives/31368.152 Source: Beijing Municipal Commission of Development and Reform, Beijing, Inner Mongolia, Hohhot and Ordos Conduct Inter-Regional Cooperation in the Trade
of Carbon Emissions, March 24, 2016, http://www.bjpc.gov.cn/zwxx/tztg/201603/t10058058.htm.153 Source: Ibid.154 Source: ICAP, Guangdong Publishes 2016 Allocation Plan, Includes Aviation Sector, accessed August 18, 2016, https://icapcarbonaction.com/en/news-
archive/397-guangdong-allocation-plan-2016-aviation.155 Source: Hubei Provincial Development and Reform Commission, The Provincial Development and Reform Commission on the Issuance of Carbon Emission Units
and Allocation Plan of Hubei Province, November 25, 2015.156 Source: Ibid.157 Source: Shanghai Municipal Development and Reform Commission, On the Issuance of the Shanghai Carbon Emission Units, February 22, 2016,
http://www.shdrc.gov.cn/gk/xxgkml/zcwj/zgjjl/23039.htm.
2 Existing and emerging carbon pricing initiatives around the world
Key developments in the Chinese pilot ETSsTable 2
ETS pilots Key developments
Beijing – Expanded to cover the transport sector as well as power and cement companies from Chengde in Hebei, and from Erdos and Hohhot in Inner Mongolia in 2016.152
– Lowered mandatory participation emissions threshold in 2015 from 10,000 tCO2e to 5,000 tCO2e.153
Guangdong – Expanded scope to cover the domestic aviation sector in 2016.154 – Applied the benchmark approach to combined heat and power (CHP) installations from 2015 onwards.
Hubei – In 2015, expanded the baseline period on which inclusion in the ETS is determined from the historical energy consumption over 2010–2011 to 2009–2014.155
– Reduced the cap from 324 MtCO2e in 2014 to 281 MtCO2e in 2015, in line with their mitigation ambition.156
– Introduced a benchmark approach to cement, heating and CHP installations from 2015 onwards.
Shanghai – Expanded scope to cover the shipping sector in 2016.157
46

Among the pilots, only Guangdong held auctions in 2015, raising CNY16 million (US$2.4 million) of revenue. The auction volume in Guangdong decreased from 8 MtCO2e for 2014 to 2 MtCO2e for 2015.158 Three auctions were held for Guangdong’s 2015 vintage allowances with a total volume of 1.1 MtCO2e at an auction reserve price of CNY14/tCO2e ($US2/tCO2e). In the fourth auction for 2015 vintage allowances held in June 2016, the number of bids was lower than the volume of 0.9 MtCO2e on auction, and the allowances were withdrawn from the auction and canceled.159 The total traded volume of allowances in the Chinese ETS pilots was 32 MtCO2e in 2015.160
The China Certified Emission Reduction (CCER) scheme has continued to grow: as of August 1, 2016, 762 CCER projects were registered, and a total of 53 MtCO2e of credits were issued by 254 of these projects.161 The total transaction volume of CCERs in the pilot ETSs was 64 MtCO2e, with the Shanghai ETS accounting for 55 percent of this volume.162 Over 2015–2016, CCER prices ranged from CNY10/tCO2e to CNY33/tCO2e (US$2–5/tCO2e).163 The CCER prices are influenced by quantitative limits on CCER usage for compliance purposes, which are between 5–10 percent of their annual emissions depending on the pilot ETS. The price of CCERs are also dependent on the pilot ETS in which they can be used for compliance. Various geographical, temporal and project type restrictions apply for the different Chinese pilot ETSs.164 The NDRC is currently working on the rules for CCER use in the national ETS.
EU To provide greater price stability and predictability in the EU ETS, the market stability reserve was legislated in October 2015 and will start shaping the supply of allowances from January 2019.165 In addition, in July 2015 the European Commission put forward a proposal to revise the EU ETS post-2020.166 The key changes include an increase in the annual cap reduction factor from 1.74 to 2.2 percent, better targeted and updated rules for free allocation of allowances to sectors at the highest risk of carbon leakage, and the establishment of funds to finance low-carbon innovation in industry and modernization of the energy sectors in lower-income member states. The proposal does not include any provisions for the use of international credits after 2020. The other two legislative bodies of the EU, the European Council and Parliament, are currently discussing the proposal. So far, the proposal has not led to a significant increase in the EUA price, due to the persisting oversupply in the EU ETS. The EUA price was €4/tCO2e (US$4/tCO2e) on August 1, 2016.
A separate proposal for the Effort Sharing Regulation was tabled on July 20, 2016.167 This legislative proposal establishes the binding emission reduction targets of each of the Member States over the period 2021–2030 for the emissions not covered by the EU ETS. The proposal includes a one-off flexibility mechanism that permits some Member States to use a limited number of allowances from their share of the EU ETS auction volume to meet their emission reduction target in the non-ETS sectors, effectively reducing the allowance
158 Source: IN-EN, 2015 Market Situation of Auctioned Allowances in the Guangdong Carbon Market, September 15, 2015, http://naau.org.ua/vprovadzhennya- standartu-dstu-iso-14065-2015/.
159 Information compiled by SinoCarbon based on the data from the carbon exchanges of the seven Chinese pilot ETSs.160 Ibid.161 Source: National Development and Reform Commission, China Certified Emission Reduction Exchange Info-Platform, accessed August 18, 2016,
http://cdm.ccchina.gov.cn/ccer.aspx.162 Source: Shanghai Environment and Energy Exchange, Homepage, accessed August 18, 2016, http://www.cneeex.com/.163 The prices are based on CCER transaction data on the Shanghai Environment and Energy Exchange and the Beijing Environment Exchange between September
2015 and August 2016. Other pilot ETSs rarely disclose CCER prices.164 The detailed restrictions on the use of CCERs for each pilot ETS can be found in Source: SinoCarbon, China Carbon Market Monitor, May 19, 2016.165 Source: European Commission, Structural Reform of the European Carbon Market, accessed April 5, 2016, http://ec.europa.eu/clima/policies/ets/reform/
index_en.htm.166 Source: European Commission, Amending Directive 2003/87/EC to Enhance Cost-Effective Emission Reductions and Low-Carbon Investments, July 15, 2015.167 Source: European Commission, Proposal for an Effort Sharing Regulation 2021-2030, accessed August 17, 2016, http://ec.europa.eu/clima/policies/effort/
proposal/index_en.htm.
47
supply in the EU ETS.168 This one-off mechanism is limited to 100 MtCO2e EU-wide over the period 2021–2030, or less than 1 percent of the allowance supply in the same period.
The European Commission announced cooperative initiatives with China and the Republic of Korea in June and July 2016, respectively.169 The cooperation with China focuses on addressing the challenges of implementing an ETS and establishes a dialogue to discuss developments in emissions trading. Similarly, the European Commission will provide technical assistance on the implementation of emissions trading to the Republic of Korea.
Finland In January 2016, the carbon tax rate for light and heavy fuel oil, coal and natural gas increased from €44/tCO2 (US$49/tCO2) to €54/tCO2 (US$60/tCO2). The purpose of the increase is to encourage the use of biomass and low emissions heating fuels, and improve the competitive position of peat and natural gas, especially compared to coal.170
France The carbon tax in France puts a carbon price on the use of fossil fuels not covered by the EU ETS, such as in the residential, service and transport sectors. The carbon tax rate increased from €14.5/tCO2 (US$16/tCO2) to €22/tCO2 (US$24/tCO2) in January 2016, and will continue to increase by €8.5/tCO2 (US$9/tCO2) per year to reach €56/tCO2 (US$62/tCO2) in 2020. This follows the trajectory to reach €100/tCO2 (US$111/tCO2) in
2030.171 The government also announced its intention to introduce a carbon price floor for the electricity sector in France from 2017.172 Further details on the carbon price floor will included in the 2017 Finance Bill.173
Japan The second compliance period of the linked Saitama and Tokyo ETSs started on April 1, 2015. The emission reduction target increased for district heating and cooling facilities as well as office buildings that source less than 20 percent of their total energy needs from district heating and cooling to 15 and 17 percent under the Saitama and Tokyo ETSs respectively, compared to the historical baseline emissions level.174 For other (commercial and industrial) facilities, the target increased to 13 and 15 percent, respectively. In December 2015, the first trades between the Saitama and Tokyo ETSs took place.175 As of September 1, 2016, about 5,600 tCO2e Saitama credits had been purchased by entities under the Tokyo ETS.176
Kazakhstan Kazakhstan has suspended its ETS for two years starting from January 1, 2016 to address the imbalances in the system.177 Over this period, the government will revise the rules on the issuance of emissions allowances, free allocation and the price stabilization reserve. These new rules will also reflect changes to the economy that have taken place since the Kazakhstan ETS rules were designed. During the suspension period, ETS facilities do not have a compliance obligation, but they are nonetheless required to report their emissions.
168 The Member States that are proposed to be eligible to use the one-off flexibility mechanism are those that have emission reduction targets significantly above both the EU average and their cost effective abatement potential. The proposal also states that Member States that did not allocate any free allowances to industrial installations in 2013 are eligible to use the one-off flexibility mechanism. Source: European Commission, Proposal for a Regulation of the European Parliament and of the Council on Binding Annual Greenhouse Gas Emission Reductions by Member States from 2021 to 2030 for a Resilient Energy Union and to Meet Commitments under the Paris Agreement and Amending Regulation No 525/2013 of the European Parliament and the Council on a Mechanism for Monitoring and Reporting Greenhouse Gas Emissions and Other Information Relevant to Climate Change, July 20, 2016.
169 Source: European Commission, EU Steps up Cooperation on Emissions Trading with China: New €10 Million Project Announced, accessed June 28, 2016, http://ec.europa.eu/clima/news/articles/news_2016062801_en.htm; European Commission, EU Launches €3.5 Million Emissions Trading Cooperation Project with Korea, July 8, 2016, http://ec.europa.eu/clima/news/articles/news_2016070801_en.htm.
170 Source: Finlex Data Bank, Government Proposal to Parliament to Amend the Legislation on the Taxation of Energy, September 28, 2015.171 Source: French Ministry of the Environment, Energy and the Sea, The Taxation of Energy Products Applicable in 2016, February 16, 2016,
http://www.developpement-durable.gouv.fr/La-fiscalite-des-produits,11221.html.172 Source: French Ministry of Foreign Affairs and International Development, Official Statements on Foreign Policy on May 6, 2016, accessed May 6, 2016,
http://basedoc.diplomatie.gouv.fr/vues/Kiosque/FranceDiplomatie/kiosque.php?type=bafr.173 Source: French Ministry of the Environment, Energy and the Sea, Actions Taken on the Carbon Price, July 11, 2016, http://www.developpement-durable.gouv.fr/
Les-actions-engagees-sur-le-prix.174 Source: Tokyo Metropolitan Government Bureau of Environment, Greenhouse Gas Emissions Reduction Commitments and Emissions Trading Scheme, May 30,
2014.175 Source: Tokyo Metropolitan Government Bureau of Environment, Information about Emissions Trading, March 2016.176 Source: Tokyo Metropolitan Government Bureau of Environment, Information about Emissions Trading, August 2016.177 Source: Ministry of Energy of the Republic of Kazakhstan, Press Release on the Improvement of the Ecological Legislation of the Republic of Kazakhstan, March
10, 2016, http://energo.gov.kz/index.php?id=5181.
2 Existing and emerging carbon pricing initiatives around the world
48
178 Source: Minister of Environment Rafael Pacchiano Alamán, CPLC High-Level Assembly (HLF) Inaugural Meeting, April 15, 2016.179 Other initiatives include, for example, the framework for a registry of national emissions and Clean Energy Certificates.180 Source: The White House, North American Climate, Clean Energy, and Environment Partnership Action Plan, June 29, 2016. 181 Source: Federal Ministry for the Environment, Nature Conservation, Building and Nuclear Safety, Joint Declaration between the Government of the Federal
Republic of Germany and the Government of the United Mexican States on Climate Action and the Energy Transition and Biodiversity, April 12, 2016.182 Source: Grupo BMV, The Ministry of Environment and Natural Resources (SEMARNAT), the Mexican Stock Exchange and MEXICO2 Sign Agreement to Develop
an Emissions Trading Scheme Pilot, August 15, 2016.183 Source: Mexican Government, Semarnat, Grupo BMV and México2 Drive Pilot Emissions Trading Program, August 15, 2016, https://www.gob.mx/semarnat/
prensa/semarnat-grupo-bmv-y-mexico2-impulsan-programa-piloto-de-comercio-de-emisiones.184 Source: Government of Ontario, Joint Declaration Between the Ministry of Environment and Natural Resources of the United Mexican States, the Government of
Ontario, and the Gouvernement Du Québec, August 31, 2016, https://news.ontario.ca/opo/en/2016/08/joint-declaration-between-the-ministry-of- environment-and-natural-resources-of-the-united-mexican-st.html.
185 Source: Government of New Zealand, Emission Unit Register, accessed April 5, 2016, http://www.eur.govt.nz/.186 Source: New Zealand Ministry for the Environment, Phase out of the One for two Transitional Measure from the New Zealand Emissions Trading Scheme, May 25,
2016, http://www.mfe.govt.nz/climate-change/reducing-greenhouse-gas-emissions/new-zealand-emissions-trading-scheme/legislative.187 Source: New Zealand Ministry for the Environment, New Zealand Emissions Trading Scheme Review 2015/16, November 2015.188 Source: New Zealand Treasury, Improving Alignment of the New Zealand Emissions Trading Scheme with New Zealand’s Provisional 2030 Emissions Reduction
Target, May 26, 2016.189 Source: CommTrade Carbon, Spot NZUs, accessed August 12, 2016, https://www.commtrade.co.nz/.190 Source: Norwegian Department of Finance, Taxes, Fees and Customs in 2016, September 25, 2015, 20.191 Source: Government of Norway, Pricing the Environment, December 9, 2015.192 Source: Korea Exchange, Daily / Closing Price, accessed August 16, 2016, http://global.krx.co.kr/contents/GLB/05/0506/0506030102/
GLB0506030102.jsp.
Mexico Since the implementation of the carbon tax in 2014, the tax has generated almost US$1 billion in revenue.178 The existing carbon tax in combination with other climate initiatives179 are expected to enable a carbon market in 2018, with an ETS being the preferred option. On June 29, 2016, Canada, Mexico and the US announced the North American Climate, Energy, and Environment Partnership which, among other objectives, encourages their subnational governments to share lessons learned about the design of effective carbon pricing systems and supportive policies and measures.180 To support the development of the Mexican carbon market, the German government will provide assistance and share their ETS experiences.181 In addition, to prepare companies for future climate initiatives, the Mexican government is developing a voluntary ETS pilot.182 About 60 companies from the power, industry and transport sector are expected to participate in this pilot ETS.183 There is also strong interest in starting to develop a North American carbon market. On August 31, 2016, Mexico, Ontario and Québec issued a joint declaration to conduct cooperation activities on carbon markets and jointly promote the expansion of carbon market initiatives in North America.184 New Zealand International trade of Kyoto credits in the New Zealand Emission Unit Register ceased on November 18, 2015 at the end of the CP1 true-up period.185 New Zealand AAUs remain eligible for surrender in the domestic ETS. The New Zealand Government is currently reviewing the ETS. One
outcome of this review is the phase out of the “one-for-two” transitional measure over a three-year period from January 1, 2017 in annual steps.186 This measure currently allows non-forestry ETS facilities to surrender one emission allowance for every two tons of CO2e emitted, thereby halving their compliance obligation.187 The ETS reform is intended to improve the alignment of the New Zealand ETS with the national emission reduction target of 30 percent below 2005 levels by 2030.188 Partially as a result of this change, the price of a New Zealand emission allowance has tripled since the start of 2015, increasing to NZD18/tCO2 (US$13/tCO2) on August 1, 2016—the highest level in four years.189
Norway In 2016, the carbon tax rate in Norway ranges between NOK29–436/tCO2e (US$3–52/tCO2e), depending on the fuel and sector.190 Recommendations from the Norwegian Green Tax Commission include introducing a single tax rate of NOK420/tCO2e (US$49/tCO2e) for all non-ETS sectors.191
Republic of Korea Since the start of the Republic of Korea ETS on January 1, 2015, there have been low volumes of trade on the allowance market. No transactions took place between January 16 and October 6, 2015, and the total transaction volume of Korean Allowance Units (KAUs) in 2015 was 0.3 MtCO2e,192 representing a small share of the 573 MtCO2e cap. In 2016, trade remains limited—as of August 1, 2016 the most recent trade took place on July 22, 2016 at KRW17,000/tCO2e (US$15/tCO2e).
49
The limited allowance trade due to a perceived shortage on the market has led to high demand for Korean offset credits over the past year, including Korean CERs,193 which are also eligible for compliance under the ETS. The transaction volume of Korean Credit Units (KCUs) was almost three times as high as KAUs at 0.9 MtCO2e. KCUs are now priced at a similar level to KAUs.194
To address the perceived shortage on the allowance market, the government auctioned 900 ktCO2e KAUs from the market reserve in June 2016.195 Participation in these auctions was limited to the companies in the ETS that had an allowance shortage of greater than 10 percent in 2015. This restriction resulted in only about 270 ktCO2e KAUs being sold. In August 2016, the government also relaxed the rules for ETS participants to earn credits from emission reductions before the ETS was launched.196 These measures essentially increased the supply of emission allowances.197
Furthermore, several changes to the Korea ETS were announced on May 17, 2016, including the transfer of responsibility for the Republic of Korea ETS from the Ministry of Environment to the Ministry of Strategy and Finance.198 In addition, as of June 1, 2016 companies can borrow up to 20 percent of KAUs from the future year’s allocation, up from 10 percent. At the same time, Korea is focusing its efforts on meeting its INDC pledge to reduce GHG emissions by 37 percent below business-as-usual levels by 2030.
The Republic of Korea is also cooperating with its international counterparts on carbon pricing. In December 2015, the carbon exchanges of Korea and Beijing signed an MoU to research cooperation between their respective carbon markets.199 Also, the Republic of Korea and China held the Joint Committee on Climate Change Cooperation and Roundtable on ETS in June, 2016 where views on climate policy and carbon markets were exchanged.200
Slovenia On April 1, 2016, Slovenia brought its carbon tax law in line with EU rules by removing exemptions on liquefied petroleum gas and natural gas.201 A carbon tax rate of €17/tCO2e (US$19/tCO2e) now applies to these fossil fuels; this rate also applies to other fossil fuels.
South Africa In November 2015, South Africa published a draft Carbon Tax Bill, which announced a delayed start for the carbon tax to January 1, 2017.202 Under the draft legislation, offsets can be used for compliance and tax exemptions starting from 60 percent up to a maximum of 95 percent will apply. This means that the effective tax rate will be between R6–48/tCO2e (US$0.4–3/tCO2e), compared to the full tax rate of R120/tCO2e (US$8/tCO2e). The full tax rate will be increased annually to take into account inflation. Following a public consultation process, South Africa is currently revising the bill. On June 21, 2016, South Africa published draft regulations on carbon offsets, including eligibility rules, offset standards and administrative responsibilities.203 Only domestic emission reduction projects will be credited and the scheme will primarily rely on existing international offset standards including the CDM, Verified Carbon Standard and Gold Standard.
193 CERs need to be cancelled before they can be converted to Korean Credit Units, which are Korean offsets that can be used for compliance.194 Source: Korea Exchange, Daily / Closing Price, accessed August 16, 2016, http://global.krx.co.kr/contents/GLB/05/0506/0506030102/
GLB0506030102.jsp.195 Source: Korea Exchange, Emissions Government Supply Spare Announcements, May 27, 2016, http://open.krx.co.kr/contents/OPN/03/03010000/
OPN03010000.jsp#3f45fd180997c3c4c675586a2069c05a=8&view=253.196 Source: Carbon Pulse, South Korea Lowers Bar for Emitters to Earn Early Action Credits, August 4, 2016, http://carbon-pulse.com/23063/.197 Source: Korea Exchange, Government Announces a Supply of Reserve Emission Allowances, May 27, 2016, http://open.krx.co.kr/contents/OPN/03/
03010000/OPN03010000.jsp?srchCate1=3#3f45fd180997c3c4c675586a2069c05a=8&view=252.198 Source: Green Planning Office for Government Policy Coordination and Cooperation, Amended Decree on Climate Change Established to Strengthen the Systems
and Policy Support for the Smooth Settlement of the Emissions Trading Scheme, May 16, 2016.199 Source: Korea Exchange, The KRX Has Signed a MoU with CBEEX for Cooperation, December 21, 2015, http://global.krx.co.kr/contents/
GLB/02/0203/0203000000/GLB0203000000.jsp#ab8758eced0475769e200e7e309baf77=1&view=20404.200 Source: Republic of Korea Ministry of Foreign Affairs, Article 6313: ROK and China to Hold the 1st Meeting of Their Joint Committee for Cooperation on Climate
Change, June 20, 2016, http://www.mofa.go.kr/ENG/press/pressreleases/index.jsp?menu=m_10_20.201 Source: Government of Slovenia, Environmental Tax Regulation on Air Pollution Caused by the Emission of Carbon Dioxide, March 25, 2016.202 Source: Government of South Africa, Draft Carbon Tax Bill, November 2, 2015.203 Source: South Africa National Treasury Department, Draft Carbon Tax Bill: Publication of Proposed Regulations Made in Terms of Clause 20(b) of the Draft Carbon
Tax Bill, 2015, June 20, 2016.
2 Existing and emerging carbon pricing initiatives around the world
50
204 Source: Swiss Federal Office of the Environment, Climate Change: Bundesrat Approves Paris Agreement and Defines Future Benchmarks, March 23, 2016. http://www.bafu.admin.ch/klima/03449/12696/index.html?lang=de&msg-id=61096.
205 Source: Swiss Federal Office of the Environment, Swiss Climate Policy, August 30, 2016, http://www.bafu.admin.ch/klima/13877/14510/index.html?lang=en.206 Source: Swiss Federal Office of the Environment, Imposition of the CO2 Levy on Thermal Fuels, January 8, 2016, http://www.bafu.admin.ch/
klima/13877/14510/14748/index.html?lang=en.207 About two thirds of the carbon tax revenues are redistributed to the public via lower health insurance payments for the country’s citizens and lower social security
contributions for businesses. A third of the carbon tax revenues go to an energy refurbishment fund for buildings and a low-carbon technology fund.208 Source: Swiss Federal Office of the Environment, Linking of the Emission Trading Systems of Switzerland and the EU: Negotiation Process, January 25, 2016,
http://www.bafu.admin.ch/klima/13877/14510/14882/14883/index.html?lang=en.209 Source: Swiss Federal Office of the Environment, Linking the Swiss and EU Emissions Trading Schemes, January 25, 2016, http://www.bafu.admin.ch/
klima/13877/14510/14882/index.html?lang=en.210 Source: Ukrainian Ministry of Ecology and Natural Resources of Ukraine, Concept Implementation in Ukraine: Permission of a Trading System Unit for Greenhouse
Gas Emissions under Directive 2003/87/EC, September 14, 2015.211 Source: National Accreditation Agency of Ukraine, Implementation of ISO Standard 14065: 2015, April 6, 2016, http://naau.org.ua/vprovadzhennya- standartu-
dstu-iso-14065-2015/.212 Source: United States Environmental Protection Agency, Overview of the Clean Power Plan, August 6, 2015.213 Source: Environmental Protection Agency, Carbon Pollution Emission Guidelines for Existing Stationary Sources: Electric Utility Generating Units; Final Rule, October 23, 2016.214 Source: State of West Virginia, Proposed EPA Rules for New and Existing Coal-Fired Power Plants, accessed April 4, 2016, http://www.ago.wv.gov/
publicresources/epa/Pages/default.aspx.215 Source: Attorney General of New York, Joint Statement by A.G. Schneiderman, States, Cities and Counties in Response to Temporary Stay of Clean Power Plan,
February 10, 2016, http://www.ag.ny.gov/press-release/joint-statement-ag-schneiderman-states-cities-and-counties-response-temporary-stay.216 Source: California Air Resources Board, Amendments to Mandatory Reporting and Cap-and-Trade Regulations, February 26, 2016.217 Source: RGGI, Key Items for 2016 Program Review Stakeholder Discussions: Program Elements and EPA Clean Power Plan (CPP), November 17, 2015.218 Source: California Air Resources Board, Staff Report: Initial Statement of Reasons, August 2, 2016.
Switzerland On March 23, 2016, Switzerland announced plans to revise the Federal Act on the Reduction of CO2 Emissions (CO2 Act).204 A public consultation on the revision of the CO2 Act will be held until November 2016. This revised CO2 Act proposes among other things a potential step-wise increase in the carbon tax rate for the period after 2020 to up to CHF240/tCO2e (US$246/tCO2e).205 The last increase in the tax rate took place on January 1, 2016 from CHF60/tCO2e (US$62/tCO2e) to CHF84/tCO2e (US$86/tCO2e), after a government review found that Switzerland’s GHG emissions were higher than the targeted levels for 2014.206 The next review of the tax rate will be conducted based on emissions from 2016 and tax rates may have to be adjusted again on January 1, 2018, depending on the evolution of Switzerland’s GHG emissions trajectory. The carbon tax revenues are redistributed and do not feed into the federal budget.207
Following negotiations which started in 2011, Switzerland and the EU reached an agreement on January 25, 2016 to link their ETSs.208 The agreement needs to be signed and ratified by both sides before it can enter into force. The timeline for this step is open. When the agreement enters into force, Switzerland needs to have integrated the aviation sector into its ETS to be consistent with the sectoral coverage of the EU ETS.209
Ukraine The Ukrainian Government published a concept ETS legislation in September 2015.210 The legislation aims to establish an ETS which is in line
with the EU ETS from 2017, with a goal to join the EU ETS in 2019. The full legislation is expected by late 2016.211
United States On a national level, the final rules of the US Environmental Protection Agency’s Clean Power Plan (CPP) were announced on August 3, 2015.212 The CPP aims to reduce emissions in the power sector by 32 percent of 2005 levels by 2030. Each state has an individual target and states have the flexibility to choose their own compliance mechanisms, including emissions trading within a state or between states.213 Following legal action by some states, the US Supreme Court suspended the implementation of the CPP on February 9, 2016 pending a judicial review.214
Despite the setback to the implementation of the CPP, some states continue to support and prepare for the implementation of the CPP,215 including California and the RGGI states.216 Compliance under the CPP is one of the focuses of the 2016 RGGI program review which is currently underway. In addition, this review also targets post-2020 cap setting, flexibility mechanisms and broadening the RGGI market.217
In August 2016, California released proposed amendments to its Cap-and-Trade program,218 which would extend the system beyond 2020. The cap is proposed to decrease by about 4 percent linearly every year compared to the 2020 cap, reaching a 2030 cap of 201 MtCO2e. This is in line with California’s state wide
51
219 Source: State of Washington Department of Ecology, Ecology Releases Draft Rule to Cap Carbon Pollution, January 6, 2016, http://www.ecy.wa.gov/news/2016/002.html.
220 Source: State of Washington Department of Ecology, Frequently asked questions about the Washington Clean Air Rule, June 3, 2016, http://www.ecy.wa.gov/climatechange/CarbonRuleFAQ.html.
221 Source: State of Washington Department of Ecology, Proposed Rule Making, June 2, 2016. 222 Between January 2015 and April 2016, bills to introduce carbon pricing have been proposed to both the House (HB3176, HB3250, HB3252, HB3470) and the
Senate (SB965 and SB1574-A) of Oregon.223 Source: Oregon Department of Environmental Quality, DEQ’s Study of a Market Approach to Reducing Greenhouse Gas Emissions, accessed August 6, 2016,
http://www.deq.state.or.us/aq/climate/GHGmarket.htm.
target of reducing GHG emissions by 40 percent below the 1990 level by 2030. After 2030, the annual amount by which the cap would be reduced is proposed to be halved to about 2 percent compared to the 2020 cap. Other proposed amendments include collapsing the Allowance Price Containment Reserve (APCR) to a single tier with a single trigger price. The APCR sale price would be fixed at US$60/tCO2e above the auction reserve price. In addition, the amendments also include modalities to take into account a linkage with the Ontario Cap-and-Trade program in 2018. Furthermore, amendments were proposed to ensure that the program can be used as a compliance mechanism for the CPP. These amendments include changes to monitoring, reporting and verification (MRV) requirements, the establishment of an emissions glidepath, adjustments to its compliance periods after 2020 and new provisions for a federally enforceable backstop program. These backstop provisions ensure that California will meet the federal CPP limits and would only be triggered if the California electricity generating units exceeded the glidepath. These amendments are undergoing a stakeholder consultation process.
In January 2016, Washington State released a draft Clean Air Rule which would establish an ETS in the form of a baseline-and-credit system in 2017, covering about 60 percent of the state’s GHG emissions.219 An updated draft Clean Air Rule was released on May 31, 2016, which
2 Existing and emerging carbon pricing initiatives around the world
Initiatives implemented in 2015: Korea (ETS), Portugal (carbon tax)Initiatives implemented in 2016: British Columbia (GGIRCA), Australia (safeguard mechanism)New initiatives scheduled for implementation in 2017: Alberta (tax), Ontario (ETS) New initiatives under consideration: Newfoundland and Labrador (Canada), Canada, Chile, Colombia, FranceInitiatives under consideration with new developments: Manitoba (Canada), China, Mexico, Ukraine, Oregon (US), Washington State (US)
Summary of selected changes in regional, national and subnational carbon pricing initiativesBox 3
proposes that the ETS will initially cover installations with baseline GHG emissions greater than 100 ktCO2e that are not considered to be energy intensive nor trade exposed.220 The Rule proposes that from January 1, 2017 these installations will be required to achieve an annual average emission reduction of 1.7 percent by 2020. From January 1, 2020, installations that are considered to be energy intensive and trade exposed (EITE) will also be covered under the ETS. The draft Rule proposes that the emission reduction commitment of EITE installations will be dependent on their carbon efficiency: high efficiency installations will be rewarded with a lower emission reduction target, while less efficient installations have a larger target. The Department of Ecology expects this rule to be adopted in September, 2016.221
In Oregon, various bills were launched in the past year to establish an ETS, however, these bills were not passed by the legislature.222 Despite these difficulties, the Oregon Department of Environmental Quality is conducting a study on the implementation of market-based approaches to reduce GHG emissions and the impact of a carbon price on businesses and households.223 The outcomes of this study will be presented to the Oregon legislature in February 2017.
Selected changes in regional, national and subnational carbon pricing initiatives are summarized in Box 3.
52
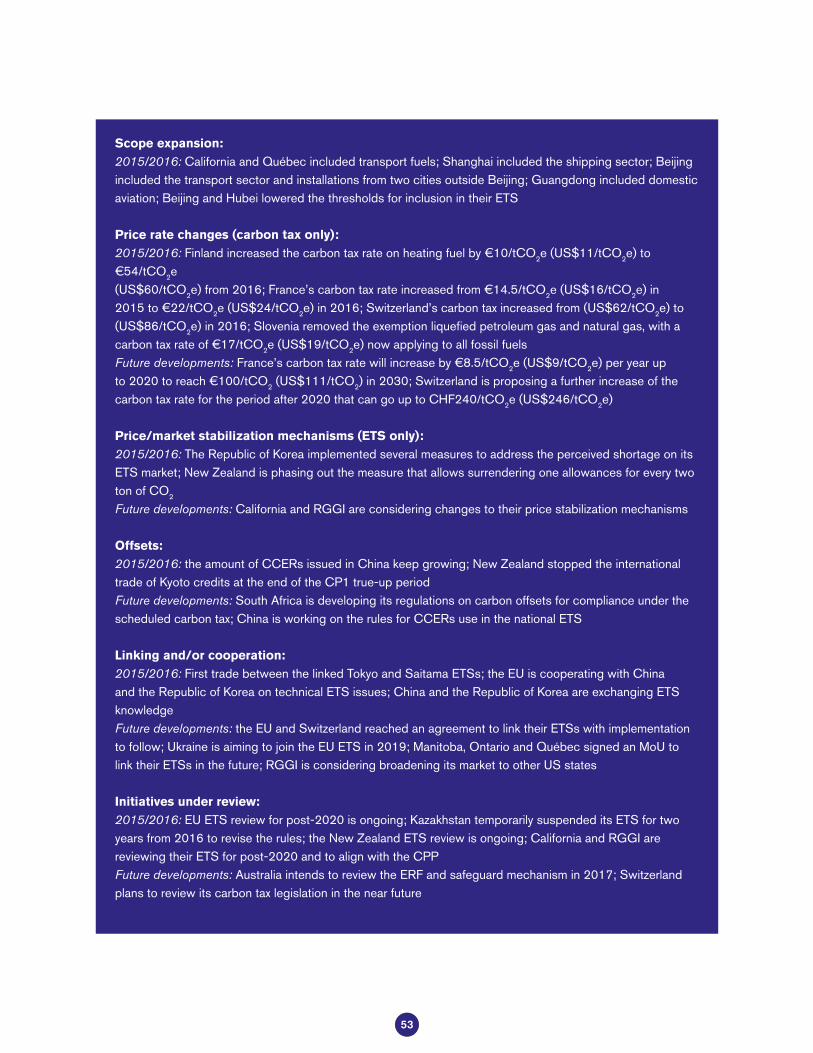
Scope expansion:2015/2016: California and Québec included transport fuels; Shanghai included the shipping sector; Beijing included the transport sector and installations from two cities outside Beijing; Guangdong included domestic aviation; Beijing and Hubei lowered the thresholds for inclusion in their ETS
Price rate changes (carbon tax only):2015/2016: Finland increased the carbon tax rate on heating fuel by €10/tCO2e (US$11/tCO2e) to €54/tCO2e (US$60/tCO2e) from 2016; France’s carbon tax rate increased from €14.5/tCO2e (US$16/tCO2e) in 2015 to €22/tCO2e (US$24/tCO2e) in 2016; Switzerland’s carbon tax increased from (US$62/tCO2e) to (US$86/tCO2e) in 2016; Slovenia removed the exemption liquefied petroleum gas and natural gas, with a carbon tax rate of €17/tCO2e (US$19/tCO2e) now applying to all fossil fuelsFuture developments: France’s carbon tax rate will increase by €8.5/tCO2e (US$9/tCO2e) per year up to 2020 to reach €100/tCO2 (US$111/tCO2) in 2030; Switzerland is proposing a further increase of the carbon tax rate for the period after 2020 that can go up to CHF240/tCO2e (US$246/tCO2e)
Price/market stabilization mechanisms (ETS only):2015/2016: The Republic of Korea implemented several measures to address the perceived shortage on its ETS market; New Zealand is phasing out the measure that allows surrendering one allowances for every two ton of CO2
Future developments: California and RGGI are considering changes to their price stabilization mechanisms
Offsets: 2015/2016: the amount of CCERs issued in China keep growing; New Zealand stopped the international trade of Kyoto credits at the end of the CP1 true-up periodFuture developments: South Africa is developing its regulations on carbon offsets for compliance under the scheduled carbon tax; China is working on the rules for CCERs use in the national ETS
Linking and/or cooperation:2015/2016: First trade between the linked Tokyo and Saitama ETSs; the EU is cooperating with China and the Republic of Korea on technical ETS issues; China and the Republic of Korea are exchanging ETS knowledgeFuture developments: the EU and Switzerland reached an agreement to link their ETSs with implementation to follow; Ukraine is aiming to join the EU ETS in 2019; Manitoba, Ontario and Québec signed an MoU to link their ETSs in the future; RGGI is considering broadening its market to other US states
Initiatives under review:2015/2016: EU ETS review for post-2020 is ongoing; Kazakhstan temporarily suspended its ETS for two years from 2016 to revise the rules; the New Zealand ETS review is ongoing; California and RGGI are reviewing their ETS for post-2020 and to align with the CPPFuture developments: Australia intends to review the ERF and safeguard mechanism in 2017; Switzerland plans to review its carbon tax legislation in the near future
53
2.4INTERNAL CARBON
PRICING INITIATIVES
Internal carbon pricing is now becoming a widely used tool for various applications including supporting corporate strategic investment decision making and helping companies shift to lower-carbon business models. Over 1,200 companies reported to CDP in 2016 that they are currently using an internal price on carbon or plan to do so within the next two years.224 Of these companies, 517 reported to CDP that they are using an internal price on carbon—a more than threefold increase compared to 2014. An additional 732 companies stated that they are planning to implement an internal carbon price over the course of 2017–2018.225 Of the companies that have publicly disclosed that they are using an internal price on carbon or plan to do so within the next two years, 83 percent are headquartered in countries where mandatory carbon pricing is in place or scheduled for implementation at a national or subnational level.
The reported corporate carbon prices in use are diverse, ranging from US$0.3/tCO2e to US$893/tCO2e. Some companies adopt a range of carbon prices to take into account different prices across jurisdictions and/or to factor in future increases in mandatory carbon prices. Figure 13 shows that for some companies, the internal carbon price adopted or the lower end of the internal carbon pricing range implemented is similar to mandatory carbon pricing levels. In Canada, several companies adopted an internal carbon price of about US$11/tCO2e, which is comparable with the price levels of the Alberta SGER in 2016 of
224 Source: CDP, Embedding a Carbon Price into Business Strategy, September 2016.225 Source: Ibid.226 Source: United Nations Global Compact, UN Global Compact Calls on Companies to Set $100 Minimum Internal Price on Carbon, April 22, 2016, https://www.
unglobalcompact.org/news/3381-04-22-2016.227 Source: Caring for Climate, Carbon Pricing, accessed August 31, 2016, http://caringforclimate.org/workstreams/carbon-pricing/.
2 Existing and emerging carbon pricing initiatives around the world
CAN$20/tCO2e (US$15/tCO2e) and the Québec Cap-and-Trade Program of US$13/tCO2e. There were also a few companies with an internal price of US$23/tCO2e, which is the same level as the British Columbia carbon tax rate. In South Africa, a price level of US$9/tCO2e was adopted by some South African companies, which is similar to the full carbon tax rate of R120/tCO2e (US$9/tCO2e) proposed in the draft legislation. Finally, some companies in the UK reported an internal carbon of US$25/tCO2e, which is comparable with the level of the carbon price floor in 2016 of £18/tCO2e ($US24/tCO2e). In total, about half of the companies that have disclosed their internal carbon prices are using values that are higher than the mandatory prices of the jurisdictions they are headquartered in.
The broad internal carbon price range reported also indicates that some companies are moving beyond the use of internal carbon pricing as a strategic risk management tool to evaluate the potential impact of carbon pricing initiatives on their operations. These companies are also using it to explore cost savings and revenue opportunities through innovation. The United Nations Global Compact has called for businesses to adopt an internal carbon price of at least US$100/tCO2e by 2020, which will be needed to keep GHG emissions consistent with a 1.5–2°C pathway.226
Through the Caring for Climate initiative’s Business Leadership Criteria on Carbon Pricing, companies are demonstrating their commitment to leadership on corporate carbon pricing.227 As of September 2016, 68 companies have committed to align with the criteria: setting a material internal carbon price, showing public support for carbon pricing and communication on these activities.
Figure 13
54
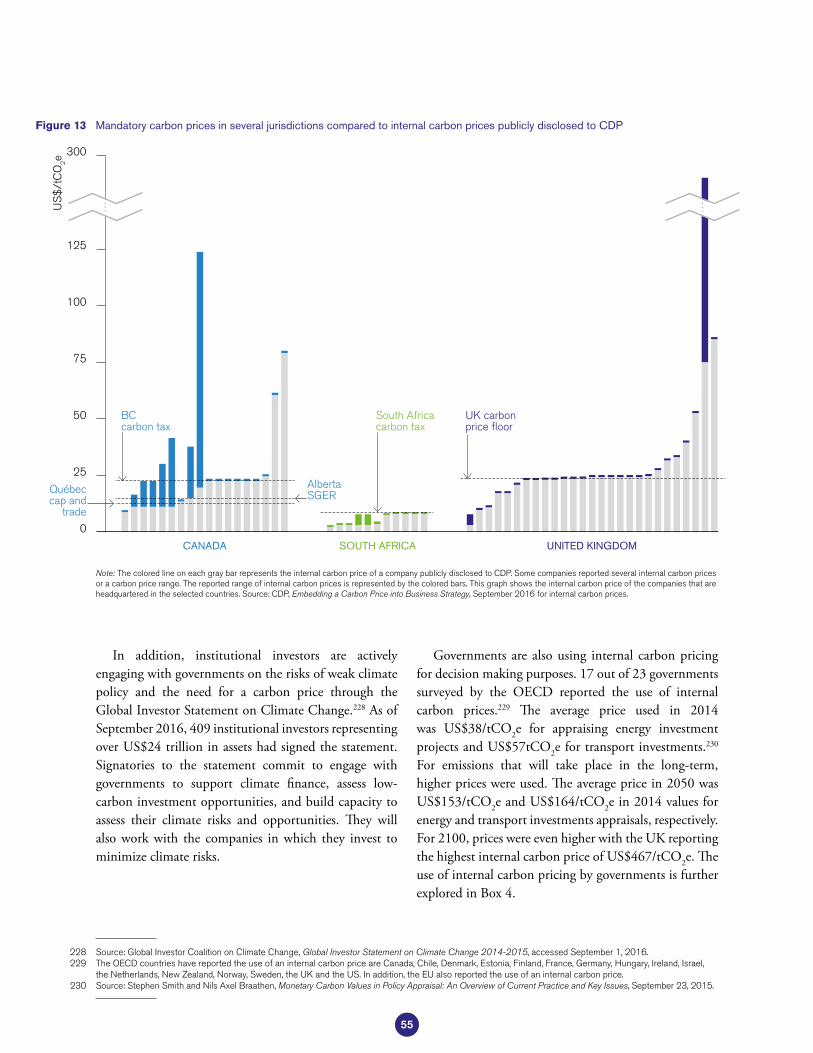
228 Source: Global Investor Coalition on Climate Change, Global Investor Statement on Climate Change 2014-2015, accessed September 1, 2016. 229 The OECD countries have reported the use of an internal carbon price are Canada, Chile, Denmark, Estonia, Finland, France, Germany, Hungary, Ireland, Israel,
the Netherlands, New Zealand, Norway, Sweden, the UK and the US. In addition, the EU also reported the use of an internal carbon price.230 Source: Stephen Smith and Nils Axel Braathen, Monetary Carbon Values in Policy Appraisal: An Overview of Current Practice and Key Issues, September 23, 2015.
In addition, institutional investors are actively engaging with governments on the risks of weak climate policy and the need for a carbon price through the Global Investor Statement on Climate Change.228 As of September 2016, 409 institutional investors representing over US$24 trillion in assets had signed the statement. Signatories to the statement commit to engage with governments to support climate finance, assess low-carbon investment opportunities, and build capacity to assess their climate risks and opportunities. They will also work with the companies in which they invest to minimize climate risks.
Governments are also using internal carbon pricing for decision making purposes. 17 out of 23 governments surveyed by the OECD reported the use of internal carbon prices.229 The average price used in 2014 was US$38/tCO2e for appraising energy investment projects and US$57tCO2e for transport investments.230 For emissions that will take place in the long-term, higher prices were used. The average price in 2050 was US$153/tCO2e and US$164/tCO2e in 2014 values for energy and transport investments appraisals, respectively. For 2100, prices were even higher with the UK reporting the highest internal carbon price of US$467/tCO2e. The use of internal carbon pricing by governments is further explored in Box 4.
Mandatory carbon prices in several jurisdictions compared to internal carbon prices publicly disclosed to CDPFigure 13
Note: The colored line on each gray bar represents the internal carbon price of a company publicly disclosed to CDP. Some companies reported several internal carbon prices or a carbon price range. The reported range of internal carbon prices is represented by the colored bars. This graph shows the internal carbon price of the companies that are headquartered in the selected countries. Source: CDP, Embedding a Carbon Price into Business Strategy, September 2016 for internal carbon prices.
…
0
50
25
75
100
125
300
US
$/t
CO
2e
CANADA SOUTH AFRICA UNITED KINGDOM
…
BC carbon tax
South Africa carbon tax
UK carbon price floor
Alberta SGERQuébec
cap and trade
55
231 Source: Ibid.232 Source: UK Government, Valuation of Energy Use and Greenhouse Gas (GHG) Emissions, December 2015.233 Real 2015 pounds.234 Source: OECD, The Role of Public Procurement in Low-Carbon Innovation, May 11, 2016.235 Source: SBRCUR, Assessment of the Environmental Performances of Constructions and Civil Engineering Works, November 4, 2015.
2 Existing and emerging carbon pricing initiatives around the world
Use of internal carbon pricing by governments in decision makingBox 4
Governments can incentivize the transition to a low-carbon economy not only by setting up a mandatory carbon pricing initiative, but also by incorporating an internal carbon price in their decision making process. Some governments already use this as a tool for in their procurement process, project appraisals and policy design.
Governments generally use three different approaches to set the internal carbon price:231 1. Estimates of the social cost of carbon: the social cost of carbon reflects the value of global damages
caused by a ton of GHG emissions. This approach is subject to a high level of uncertainty as it relies on forecasts of the state of the economy, demographic changes and the cost of adaptation measures.
2. Estimates of the marginal abatement cost: the internal carbon price can be derived from the marginal abatement cost of meeting a national emission reduction target. Estimates of this cost are based on expectations of the cost of emission reduction technologies.
3. The current and estimated future market values of emissions allowances: internal carbon prices can also be based on the market prices of emissions allowances.
In all three cases, costs increase over time as the stock of GHGs is increasing. In the first case, costs increase as future emissions are expected to cause greater damages for each ton of GHG emitted. In the latter two cases, costs are higher as marginal abatement becomes more expensive over time. Examples of how the Dutch and UK government use internal carbon pricing in their decision making are provided below.
Target-consistent internal carbon pricing by the UK governmentSince 2009, the UK government has been using a “target-consistent approach” for internal carbon pricing. The carbon price is based on the estimated cost to meet the UK emission reduction targets.232 In principle, this approach has to be applied to all government policy, program and project appraisals that have a potential impact on GHG emissions. The price for EU ETS sectors, £6/tCO2e (US$8/tCO2e) in 2015, is directly derived from the market value of emission allowances. The price for the non-ETS sectors, £62/tCO2e (US$83/tCO2e) in 2015, is based on the marginal abatement costs needed to meet the UK’s emission reduction target. These internal carbon prices for ETS and non-ETS sectors converge after 2030, assuming a functional global carbon market by 2030 and the price increases to £224/tCO2e
233 (US$295/tCO2e) in 2050. The carbon prices are (among other uses) applied to the carbon footprint of a project and combined with other monetized costs and benefits to determine the project’s overall cost-effectiveness.
Internal carbon pricing in infrastructure procurement by the Dutch governmentThe Dutch House of Commons asked for inclusion of sustainability criteria in all public procurement processes by 2015. To incentivize companies to monitor and reduce their GHG emissions impact, the GHG emission performance of the materials and energy used during the construction works are assessed as part of the tender process.234 CO2 emissions and material consumption were monetized as part of a framework to determine the environmental performance of infrastructure works, using an internal carbon price of €50/tCO2e (US$56/tCO2e).235 This price represents the shadow price for abatement costs and damage costs based on the EU target to reduce emissions by 30% of the 1990 baseline level by 2020.
56
Aligning carbon pricing with the broader
policy landscape
section 3
W hile developing a range of policies and interventions that support their climate
response, countries face a host of other policy objectives including, but by no means limited to, delivering economic growth, employment and macroeconomic stability, improving educational performance and access to health services, supporting efficient infrastructure delivery and ensuring social protection.
In this complex environment, it is necessary for policymakers to consider the way in which climate policies interact with the broader context. An integrated package of climate policies that reduce emissions while also supporting other policy objectives will be more likely to gain widespread stakeholder support and to be implemented more effectively. In contrast, incoherent policy packages that lead to duplication or negative interactions will raise costs and could face resistance.
Ensuring coherent policy packages that recognize multiple objectives, complementarities and tensions is a challenge for all aspects of public policy. This section considers policy interaction from the specific perspective of carbon pricing and the challenges that may arise
when introducing carbon pricing into a complex suite of existing policies. Carbon pricing is often presented as a cross-sectoral cornerstone of a country’s response to emissions mitigation. From a narrow perspective, it helps minimize the market failure caused by firms and individuals not taking account of the costs, in terms of climate damages, that result from activities that lead to further emissions. However, more broadly, creating a policy environment in which a carbon pricing signal complements other policies contributes to a broader focus on using markets and price signals to allocate resources in the economy, with the associated efficiency and social benefits that this can bring.
Building on the World Bank and OECD FASTER principles on alignment,236 this section considers three main axes of interaction between carbon pricing and existing policies: complementarities, overlaps and countervailing effects. Complementary policies are those that are combined with carbon pricing in such a way as to enhance the performance of each. The policy challenge in these cases is to identify and maximize the opportunities for synergy, while also recognizing that even when policies are broadly complementary,
236 Source: OECD and World Bank Group, The FASTER Principles for Successful Carbon Pricing: An Approach Based on Initial Experience, 2015.
3 Aligning carbon pricing with the broader
policy landscape
58
trade-offs are sometimes inevitable. Overlapping policies operate in parallel to carbon pricing, such as renewable support measures and vehicle fuel efficiency standards. Although often motivated by immediate objectives other than climate mitigation, they can trigger the same incentive effect as carbon pricing and contribute to the overall goal of decarbonization. However, because of this overlap, they may also affect and create tension with the carbon pricing signal. The section explores the rationale for these overlapping policies and how policymakers can use them optimally. The section also considers where there may be countervailing policies to the carbon price and how the tensions these create may be managed. Finally, the section identifies a range of tools and modeling techniques that countries might use to better understand how multiple policies may interact to influence the behavior of firms and individuals, and how these can be used as a practical means for analyzing carbon pricing alignment. Annex IV describes these tools in more detail.
These issues are considered for all of the key forms of carbon pricing: carbon taxes, ETSs and offsets, generated either domestically or internationally. Often the interaction issues that arise are the same across each of these policy instruments. The analysis highlights where the interactions differ across instruments.
A special set of issues pertain to alignment of carbon prices with fiscal policies. Unlike most other mitigation instruments, carbon pricing has the potential to raise a reasonable sum of public revenue. This means it can have an important complementary role as a fiscal instrument (“fiscal dividend”). Other fiscal policy instruments, like energy taxes, can be countervailing, overlapping or complementary to a carbon price depending on design.237 Due to complexity of the interactions between carbon pricing and fiscal policies, this aspect of alignment is not covered in this section (beyond a discussion on fossil fuel subsidies reflecting their role as a crucial countervailing policy). A future edition of the State and Trends of Carbon Pricing report may address this issue in more depth.
3.1ALIGNING POLICIES WITH
MULTIPLE OBJECTIVES
3.1.1Complementary policies
Although carbon pricing is a central feature of most cost-effective strategies to reduce emissions, it will be more or less effective depending on the presence of complementary policies. A range of studies show that a combination of policies which incorporate other policy instruments alongside a carbon price will be more effective at reducing emissions than a carbon price acting in isolation.238 This is because there
237 Source: OECD, “Taxing Energy Use”, 2013.238 Source: Carolyn Fischer and Richard G. Newell, “Environmental and Technology Policies for Climate Mitigation,” Journal of Environmental Economics and
Management Vol 55, Issue 2 (March 2008): 142–162. Source: Lisa Ryan et al., Energy Efficiency Policy and Carbon Pricing, IEA Information Paper, 2011, https://www.iea.org/publications/freepublications/publication/EE_Carbon_Pricing.pdf. Source: Felix C. Matthes, Greenhouse Gas Emissions Trading and Complementary Policies: Developing a Smart Mix for Ambitious Climate Policies, June 2010, http://www.oeko.de/oekodoc/1068/2010-114-en.pdf. Source: Christina Hood, Managing Interactions between Carbon Pricing and Existing Energy Policies: Guidance for Policymakers, IAE Insight Series 2013 (Paris, 2013), http://www.iea.org/publications/insights/insightpublications/managinginteractionscarbonpricing_final.pdf.
» An integrated package of climate policies
that reduce emissions while also supporting other
policy objectives will be more likely to gain widespread stakeholder support and to be implemented more
effectively. «
59
3 Aligning carbon pricing with the broader policy landscape
are often a host of barriers that prevent firms and individuals from responding to the carbon price signal and complementary policies can help address these barriers. On other occasions, complementary policies are needed to make some of the implications of carbon pricing palatable for policymakers and society. In many cases, carbon pricing can also work synergistically with complementary policies to support policy objectives other than emission reductions. This provides the opportunity for policymakers to develop carbon pricing as one element of a broader package of reforms that enhance the performance of each policy and support sustainable growth.
This section focuses on four policy domains where there is strong scope for complementarity with carbon pricing: 1. The interaction between carbon pricing and other
policies in power markets, to deliver greater emission reductions while also supporting energy access and reliability.
2. The benefits from policies that both expand infrastructure provision and access, as well as support emission reductions.
3. Overcoming non-price barriers to energy efficiency investments that deliver emission reductions and multiple other benefits in the buildings and transport sectors.
4. Improving access to finance in order to support both emerging emission reduction technologies and overall investments.
Although there are many other types of complementary policy domains,239 these four represent some of the most important examples where there is a growing body of international experience.
1. Addressing multiple objectives in electricity markets
Carbon pricing works by changing the relative prices between polluting and clean activities to induce behavior change toward the latter. For this to be effective, it requires markets to effectively transmit price signals. In the electricity context, this requires an efficient and deep electricity market, where producers and consumers respond to prices, and where regulation promotes competition, efficiency and reliability. In contrast, it is more challenging for carbon pricing to be effective in power systems that are state owned, driven by political rather than economic rules, or where price signals are distorted by dominant players, leaving the systems in a sub-optimal equilibrium with low prices, low incentives to invest and low quality of service.
As described in this section, the inclusion of carbon pricing, if properly integrated into a broader sector reform package, can strengthen efficiency and energy security in electricity systems. At the same time, carbon pricing can introduce potential trade-offs with reliability of supply and access to electricity, especially when promoting variable renewable sources in fast growing, relatively small systems where the grid is poor. Nonetheless, these challenges are manageable and several countries have shown (Europe, US, New Zealand) that they can be addressed successfully with carbon pricing and competitive power markets jointly supporting improved performance of the system, higher customer satisfaction and lower emissions.
239 For example, there will also often be complementary policies that support emission reductions in sectors not covered by a carbon price, such as land-clearing regulations, separating waste/composting, encouraging low-emissions agriculture. A further area not covered explicitly is the complementarity between carbon pricing and R&D/innovation policy. This is discussed extensively in Source: P. Aghion et al., “Path-Dependency, Innovation and the Economics of Climate Change,” Grantham Research Institute on Climate Change and the Environment, LSE (2014). and the sources referenced in that report.
60
These positive feedbacks and trade-offs are explored by distinguishing three major channels through which carbon pricing can have an impact on the electricity sector: – Increasing the attractiveness of dispatching low-
carbon fuels in existing power plants – Incentivizing investment in new low-carbon generation – Raising the price of electricity so that consumers use
it more efficiently.
The first two of these mechanisms are explored in this section, issues relating to reducing the demand for electricity are covered in a separate discussion on energy efficiency.
When can a carbon price help dispatch cleaner generation from the existing fleet? Efficient electricity markets should lead to electricity dispatch decisions being based on which generation source offers maximum value at least variable cost. A well-designed carbon price should lead to lower-carbon and renewable generation sources being structurally favored in these dispatch decisions.
The process of fuel switching works most effectively when wholesale electricity markets are liberalized and structured to encourage rational economic decisions. Many renewable energy technologies, for example, hydro, wind and solar, have near zero variable operational costs. Therefore, once they are producing electricity, it is always economic to dispatch them first, before thermal plants, which need a higher wholesale price to cover their fuel and labor cost. However, in vertically integrated monopolistic markets, there is less pressure to maximize value at least cost. Indeed, in some countries with this market structure, dispatch decisions are made explicitly on an administrative basis or there are non-transparent, informal rules that favor thermal power plants belonging to state-owned incumbents or other strong vested interest groups.
This illustrates a close synergy between the principles of market design and structure that improve the efficiency of the power sector, lower the wholesale price of electricity (hence improving access), and allow carbon pricing to be most effective. In this regard, academic studies suggest that Mexico’s recent deregulation of power generation, which brings it closer to a competitive multi-party generation system, should improve the effectiveness of the country’s recently introduced carbon tax.240
This synergy is even more pronounced in jurisdictions where the carbon price is introduced through an ETS. In these cases, large incumbent (often state-owned) companies, if they represent a large enough proportion of the covered emissions, may use their dominant position in the allowance market to impede independent private generators. Policymakers in the Republic of Korea and China are currently seeking to address these challenges, while this issue was one of the main reasons South Africa elected to pursue a carbon tax rather than an ETS.241
Renewable generation can also add value through greater diversification of fuel sources and reduced dependency on imported fuels. There are also co-benefits in relation to air quality as described in Box 5, although these are typically not factored into dispatch decisions. However, these benefits will be at least partly offset by the fact that the amount of renewable generation electricity available at any one point in time depends on the availability of wind or solar resource, which can vary significantly. This reduces the reliability of these generation sources to the system operator, who finds it more difficult and costlier to ensure that electricity demand and supply are kept in balance in real-time.
240 Source: Rolando Fuentes-Bracamontes, “Can Electricity Reform Help Mexico Achieve Carbon Emission Reductions?,” Journal of Environmental Economics and Policy Vol 3, Issue 3 (2014), http://www.tandfonline.com/doi/abs/10.1080/21606544.2014.931827.
241 Source: South Africa National Treasury, Carbon Tax Policy Paper, 2013.
61

Recent experience suggests that if the electricity systems are operated well, the impact of variable renewable generation on providing reliable supply is negligible until they reach more than 5-10 per cent of annual generation.243 Historically, it was considered that more extensive deployment of variable renewables could only be accommodated by ensuring expensive, conventional generation as back-up. However, it is becoming increasingly understood that a range of complementary policies and technical measures can improve the overall flexibility of the electricity system and hence allow a carbon price to induce a much higher share of renewables with no negative impact on the reliability or cost of energy services. These include:
– Introduce policies that support the quality and availability of weather forecasting to make renewable generation more predictable. For example, in Germany in 2014, solar radiation forecasts were made available on a 15 minute basis, rather than hourly, and wind and solar forecasts were extended to cover 45 hours ahead.244
– Shorten the length of time at which electricity market contracts must be struck in advance of the actual supply of electricity to allow intra-day trading. This allows back-up generation to be matched more closely to when prevailing weather conditions reduce the availability of variable renewable generation, reducing the aggregate need for back-up.
– Introduce grid technologies and procedures, including smart grids, to ensure proper grid operation stability and control in the presence of a significant share of variable generation.
242 Source: The Global Commission on the Economy and Climate, Better Growth, Better Climate: The New Climate Economy Report, September 2014, http://static.newclimateeconomy.report/wp-content/uploads/2014/08/NCE_GlobalReport.pdf.
243 Source: IEA, The Power of Transformation: Wind, Sun and the Economics of Flexible Power Systems, 2014th ed. (Paris, 2014), https://www.iea.org/publications/freepublications/publication/the-power-of-transformation---wind-sun-and-the-economics-of-flexible-power-systems.html.
244 Source: Deutscher Wetterdienst (DWD), “Weather Forecasts for Renewable Energy - a Challenge,” 2015, http://www.dwd.de/EN/research/weatherforecasting/num_modeling/07_weather_forecasts_renewable_energy/weather_forecasts_renewable_energy_node.html.
3 Aligning carbon pricing with the broader policy landscape
Fuel switching encouraged by carbon pricing not only reduces GHG emissions, but often other emissions that impact air quality and human health, such as dust or nitrogen and sulfur oxides. Indeed, pollution from energy use, including power generation, may account for as much as 5 percent of the global burden of disease.242
While the most cost effective way to improve air quality is to tax or regulate local air pollutants directly, carbon pricing can complement these policies by inducing fuel switching and more energy efficiency in supply, distribution networks and final use. Many of the sources of low-cost carbon abatement unlocked by carbon pricing will also tend to be low-cost ways of reducing local air pollution.
However, there are limits to the synergy between carbon pricing and local air pollution reductions. Benefits from local air pollution reduction alone will not justify emission reductions needed for global average temperature increases of well below 2°C. Moreover, some end-of pipe technologies approaches to dealing with air pollution—for example, sulfur dioxide scrubbers, nitrogen oxides removal systems, or electrostatic precipitators to remove dust particles from flue gasses—may be cost-effective in local circumstances, but can reduce power plant efficiency, increasing internal fuel consumption, and hence CO2 intensity.
Air quality benefits of fuel switchingBox 5
62
– Encourage flexible Demand Side Response (DSR) by designing market segments that allow users to be rewarded for voluntarily reducing demand on call by the system operator. The introduction of a carbon price, which will tend to increase the variability in electricity prices over the day, would make DSR measures more financially attractive to consumers, enabling a larger share of renewables while maintaining supply-side reliability.
– Encourage market aggregators to contractually combine several diverse variable and flexible sources on supply and demand side into virtual power plants offering reliable electricity service to the grid.245
– Encourage electricity storage (e.g. through ancillary services markets) as a technical solution that would make renewables substantially more predictable and reliable.
– Expanded use of interconnectors—a further infrastructure solution—is explored below.
When can a carbon price encourage investment in new low-carbon generation? Carbon pricing can lead investors to allocate capital toward low-carbon generation if they expect the cost of environmental impacts will be proportionally and permanently included in the private costs of generation. However, even with carbon pricing established, the risks associated with investment in low-carbon power sources may require the development of complementary policies. One particularly important example is that the impact of carbon pricing on low-carbon power generation investment can be hindered by restricted market access and inconsistent power sector regulations. Depending on the market structure, these issues may include restricted access of some generators to the transmission grid on fair and reasonable terms,246 or difficulties in selling electricity to a single buyer or securing payment for electricity sold.247 Depending on the market context, unbundling, or vertical separation, and the establishment of a strong, independent regulator may be a first step in
addressing issues with market access.248 This is where a carbon price signal can be complementary to good energy policy practice, introduced to improve power system performance. Other policies that might enable a carbon price to encourage investments in low-carbon electricity generation, and the tensions that these can create with the effective and efficient operation of the market, are discussed in relation to overlapping policies below.
2. Investments in supporting infrastructure enable abatement technologies
By promoting investment in appropriate enabling infrastructure, policymakers can encourage greater synergies between carbon pricing and energy and transport policies. This can ensure that producers of low-carbon products can reach their market, and can make it easier for consumers to change their behavior in response to the carbon pricing signal.
A challenge in some power markets is that the geographic locations where carbon pricing might best incentivize renewable generation (for example, windy or sunny locations) are remote from sources of demand. The construction of additional transmission infrastructure can be supported by independent, performance-based regulation of an unbundled transmission sector, providing a stable environment for investment while assuring those reliant on the grid infrastructure that costs will be appropriate. The implications of failing to provide this transmission capacity can be substantial. For example, it is estimated that some provinces in China are curtailing 15–25 percent of wind power output due in part to insufficient local demand coupled with a lack of transmission capacity to other provinces, as well as non-economic dispatch decisions, as discussed earlier.249
Extending transmission lines beyond national borders and construction of interconnectors between electricity markets can also help support the goals of carbon
245 Source: Tildy Bayar, “No Title,” Virtual Power Plants: A New Model for Renewables Integration, September 2013.246 Source: OECD, Aligning Policies for a Low-Carbon Economy, Aligning Policies for a Low-Carbon Economy (Paris: OECD Publishing, 2015),
doi:10.1787/9789264233294-en.247 Securing payment for distributed electricity is a particular problem in a number of developing countries such as Pakistan. Source: Michael Kugelman, Pakistan’s
Interminable Energy Crisis: Is There Any Way Out?, 2015.248 Source: Fereidoon P. Sioshansi, Evolution of Global Electricity Markets: New Paradigms, New Challenges, New Approaches, 2013.249 Source: Canbing Li et al., “Comprehensive Review of Renewable Energy Curtailment and Avoidance: A Specific Example in China,” Renewable and Sustainable
Energy Reviews Vol 41 (2015): 1067–1079, doi:10.1016/j.rser.2014.09.009.
63

pricing. Interconnectors help to diversify the sources of generation and increase the flexibility of the system, making it more likely that unexpected fluctuations in the supply of variable renewables generation can be matched to fluctuating demand.250 For example, in Denmark, the capacity to transfer power to and from neighboring countries, which exceeds the country’s peak demand, is a key tool for dealing with high shares of wind power in the power system.251 To maximize the value from interconnectors, Nordic countries have developed transparent market rules for trading across borders.252
A further expected effect of carbon pricing is to facilitate small-scale distributed renewable generation by households and small and medium-sized enterprises (SMEs). This small-scale generation provides both additional sources of low-carbon electricity generation and increases the efficiency and reliability of the system by reducing losses and costs associated with long-distance electricity transmission and distribution. If carbon pricing is to support this form of distributed generation, it will often need to be complemented by infrastructure upgrades and regulatory change that allow for power to flow in both directions. Net metering, which credits renewable energy system owners for the electricity they add to the grid, can be an important first step. However, net metering typically does not allow electricity credits to exceed the amount of electricity consumed. Therefore, regulatory arrangements that create a level playing field for distributed and consolidated generation, so that all parties are able to participate in the electricity market regardless of size, can further strengthen responsiveness of distributed generation to carbon price signals.253 Germany provides a favorable connection regime and priority dispatch for distributed renewable generation, and also socializes the costs of network upgrades across customers.254
A number of regions include emissions from transport fuels within their carbon pricing system, or are considering to do so, including New Zealand, Québec, California and the Republic of Korea.255 In these cases, investment in supporting infrastructure such as public transport and bicycles can facilitate consumers switching to less-carbon-intensive forms of transport. For example, an academic study of New York found that the price-responsiveness of commuters to changes in the cost of commuting by car was almost four times higher in Manhattan (the borough with the highest level of public transport options) than in Staten Island (the borough with the lowest level of public transport options).256
3. Addressing barriers to energy efficiency increases the response to carbon price signals
There are two barriers that may prevent a carbon price from triggering consumers to adopt energy efficiency measures. First, there can be obstacles that limit the pass-through of the carbon price signal from producers to consumers. Second, even when pass-through rates are high, other market failures may limit the uptake of these measures. Action to address both of these barriers may be needed to achieve the full potential impact of the carbon price.
Facilitating cost pass-through In well-functioning energy and transport systems all costs —including the costs of pollution—are reflected in final prices, while independent regulators, often buttressed by competition authorities, ensure that final consumers are protected from abuse by monopolistic practices or unjustified costs. This cost pass-through is essential if carbon pricing is going to be most effective at reducing emissions. For example, in the brief period during which
250 Source: B Kroposki and R Margolis, Renewable Systems Interconnection: Executive Summary, 2008.251 Source: Energinet DK, Annual Report 2014, 2014.; Ea, The Danish Experience with Integrating Variable Renewable Energy. Study on behalf of Agora
Energiewende, 2015252 Source: Alison Kay, Maximising the Benefits of New and Existing Interconnectors, 2012.253 The IEA Smart Grid Roadmap discusses the policies and regulatory framework needed to accelerate distributed generation. Source: IEA, Technology Roadmap:
Smart Grids, 2011.254 Anaya, Karim L. and Michael G. Pollitt, Integrating Distributed Generation: Regulation and Trends in Three Leading Countries”, EPRG Working Paper, 1423,
Cambridge Working Paper in Economics, 2014; Source: Eric Martinot, “How Is Germany Integrating and Balancing Renewable Energy Today?,” 2015, http://www.martinot.info/Martinot_DE_Integration_Jan2015.pdf.
255 Source: The World Bank Group, Partnership for Market Readiness, and International Carbon Action Partnership, Emissions Trading in Practice: A Handbook on Design and Implementation (Washington D.C., 2016).
256 Source: Deborah Salon, “Neighborhoods, Cars, and Commuting in New York City: A Discrete Choice Approach,” Transportation Research Part A: Policy and Practice Vol 43, Issue 2 (2009): 180–196, doi:10.1016/j.tra.2008.10.002.
3 Aligning carbon pricing with the broader policy landscape
Box 6
64
Australia had its Carbon Pricing Mechanism, retail electricity prices increased by between 10 and 15 percent. This is estimated to have contributed to between 42 and 68 percent of emission reductions in the power sector.257
Typically, carbon cost pass-through rates have been between 51–100 percent.258 The key drivers of cost pass-through rates include how easily consumers can switch from domestic to imported products, as well as market concentration and pricing power. In more competitive markets, prices may reflect actual costs including costs of emissions, but the highest-cost producers will find it difficult to pass the full cost increase to consumers. Hence they will have to reduce emissions, profit or market share. Once again, this is an example of how well regulated but otherwise liberalized and competitive markets can deliver low-cost, affordable service, while also making carbon pricing more effective. In the industrial sectors, the empirical work undertaken after 10 years of the EU ETS confirms that all major energy intensive industries pass through carbon costs to some extent.259
Under some circumstances, the cost pass-through of carbon costs into electricity prices, in particular, has been controversial. This is for two reasons:
– First, under an ETS, energy utilities have sometimes passed part of the value of emission allowances through despite receiving them free of charge. While this can be rationalized from an economic perspective, it has led to understandable concerns over windfall profits for power generators and reduced the broader public legitimacy of carbon pricing.260 This was a major political concern in the early years of EU ETS and the system’s evolving design resolved this problem by auctioning of allowances to all power producers, except for a temporary extension to some utilities in Central and East European Member States.
– Second, there can often be significant social and political economic challenges associated with increasing electricity prices, which can lead to the regulation of end use prices that prevents carbon price costs being passed through to consumers. Box 6 discusses the case of the Republic of Korea, which introduced an ETS in 2015 but has not increased regulated retail tariffs. Similar challenges have also been encountered in the design of the ETS in China.261 Better targeting of social protection through social safety nets represents a more attractive approach to addressing the challenges of potentially regressive implications of carbon pricing.
257 Source: Marianna O’Gorman and Frank Jotzo, Impact of the Carbon Price on Australia’s Electricity Demand, Supply and Emissions, 2014.258 Source: Ibid.259 Source: European Commission, “Ex-post investigation of cost pass-through in the EU ETS, An analysis for six sectors”, 2015260 Source: Jos Sijm, Karsten Neuhoff, and Yihsu Chen, “CO2 Cost Pass Through and Windfall Profits in the Power Sector,” CWPE 0639 and EPRG 0617 Issue May,
CWPE (2006).261 Source: World Resources Institute, “Emissions Trading in China: First Reports from the Field,” 2014, http://www.wri.org/blog/emissions-trading-china-first-
reports-field.262 Source: IEA, Energy Policies of IEA Countries: Republic of Korea, 2012.263 Source: Suduk Kim, Yungsan Kim, and Jeong Shik Shin, “The Korean Electricity Market: Stuck in Transition,” in Evolution of Global Electricity Markets, ed.
Fereidoon P. Sioshansi, First. (San Diego, California: Elsevier Inc., 2013).
The Republic of Korea implemented an ETS in 2015—a jurisdiction where just under than 50 percent of emissions came from the electricity sector in 2010.262 Despite the introduction of an ETS, prices in the retail electricity market remain regulated, notwithstanding a long process of reform.263 At the same time it was recognized that encouraging electricity consumers to improve their consumption efficiency was necessary.
The solution adopted was to make covered firms responsible for both their direct and indirect emissions. Industrial entities have to surrender allowances equal to the sum of their direct emissions plus their electricity consumption multiplied by the emissions intensity of electricity production.
Demand-side abatement and ETS in the Republic of Korea ETSBox 6
65
Removing bottlenecks preventing response to carbon prices Allowing full pass-through of a carbon price is often not sufficient to elicit behavioral change, because other bottlenecks prevent consumers’ response to price signals. The vast and well established “energy efficiency gap” literature identifies numerous other market failures and institutional barriers that prevent the adoption of energy efficiency improvements. These barriers can include:264
– Information on the energy performance of building envelopes and equipment may be costly for consumers to obtain.
– Principal–agent problems, where an owner and operator have incentives to act differently, typically with the tenant benefiting from lower bills, but having no long-term incentive for costly investment.
– High and often hidden transaction costs, for example, when multiple families living in large apartment building have to agree and implement joint investments in improving energy performance of a common building envelope.
– Other systematic behavioral biases in decision-making, which can make households or firms oblivious to otherwise profitable investments, such as incorrect assessments of fuel savings or loss aversion.
There are a range of policies to target these barriers, and their use in conjunction with carbon pricing can contribute to emission reductions over and above those that would have been achieved through carbon pricing alone.265 Information barriers can be addressed by policies such as energy labelling of appliances, buildings and vehicles, while minimum efficient performance standards can also play a role, as can campaigns to disseminate information on the efficient
use and operation of such appliances and vehicles.266 For industrial energy users, energy audits can be an effective tool for increasing the understanding of energy efficiency opportunities. The use of building codes and minimum efficiency standards, coupled with incentive and enforcement systems, and facilitating the development of Energy Service Companies (ESCOs) can also help address principal‐agent problems and transaction cost challenges. For example, in Ukraine, now planning implementation of an ETS, the European Bank for Reconstruction and Development (EBRD) facilitated the development of energy efficiency norms and regulations in the construction industry and supported amendments to budget, tax and procurement codes to facilitate the emergence of ESCOs.267
4. Improving access to finance can increase the uptake of low-carbon solutions
Carbon pricing can change the fundamental economics in carbon-emitting sectors. However, if financing barriers persist, carbon pricing will not necessarily influence the rate at which abatement opportunities are adopted. Although financing barriers can hold back all forms of investment, these problems can be particularly acute in relation to low-carbon technologies for two key reasons. First, renewables and other low-carbon technologies are typically more capital-intensive than conventional alternatives, even though the lifetime costs of low-carbon technologies are often comparable to the conventional alternative. The higher up-front investment cost per kilowatt of installed capacity for renewables (generally between one and a half and eight times higher than for gas-fired power plants)268 can make it difficult to secure low cost and
264 Source: Lisa Ryan et al., Energy Efficiency Policy and Carbon Pricing, IEA Information Paper, 2011, https://www.iea.org/publications/freepublications/ publication/EE_Carbon_Pricing.pdf. Source: Christina Hood, Summing Up The Parts: Combining Policy Instruments for Least-Cost Climate Mitigation Strategies, Information Paper (Paris, September 2011), https://www.iea.org/publications/freepublications/publication/Summing_Up.pdf.
265 Source: Christina Hood, Managing Interactions between Carbon Pricing and Existing Energy Policies: Guidance for Policymakers, IAE Insight Series 2013 (Paris, 2013), http://www.iea.org/publications/insights/insightpublications/managinginteractionscarbonpricing_final.pdf.
266 Source: IEA, “25 Energy Efficiency Policy Recommendations - 2011 Update” (2011).267 Source: EBRD, The EBRD’s Experience with Policy Dialogue in Ukraine Case Study – Energy Efficiency, 2014.268 The median overnight capital cost for per kW of renewable capacity ranges between 1.4 times (large solar PV) and 5.7 times (geothermal) greater than closed
cycle gas turbine costs and 2.1 times (large solar PV) and 8.3 times (geothermal) greater than open cycle gas turbine costs. The median capital intensity of offshore wind, large and small hydro, geothermal and biomass plants are also estimated to be between 1.1 times (large hydro) and 2.6 times (geothermal) greater than the median capital intensity of coal-fired generation. Source: IEA, Projected Costs of Generating Electricity 2015, 2015th ed. (OECD Publishing, 2015), https://www.iea.org/bookshop/711-Projected_Costs_of_Generating_Electricity.
3 Aligning carbon pricing with the broader policy landscape
66
long term financing from investors.269 Projects require longer to provide a return on the capital, making them less attractive to capital providers, especially if the funding base of the capital providers consists of short-term liabilities. Second, many green technology investments often have a limited track record of performance, especially in a specific local context, so there can be more uncertainty about construction costs, technology reliability and performance, policy or counterparty risks.
It will ultimately be essential for the bulk of the capital to be provided on commercially sustainable terms from conventional capital markets and financial
institutions. Consistent with this, many jurisdictions and international initiatives have looked at adjusting existing policies to expose the risk for commercial capital when flowing toward high-carbon investments. One approach is to increase the level of disclosure that firms have to make to investors about their carbon-intensive activities and assets so that investors can assess the materiality of these risks and allocate capital accordingly. This will allow investors to better understand the exposure of firms to emissions that are not currently priced or to higher carbon prices in the future. France has pioneered legislation in this area (see Box 7), while the Task Force on Climate-related Financial Disclosures will publish further recommendations at the end of 2016.
269 Source: OECD, Aligning Policies for a Low-Carbon Economy, Aligning Policies for a Low-Carbon Economy (Paris: OECD Publishing, 2015), doi:10.1787/9789264233294-en.; Source: IEA, Re-Powering Markets (Paris, 2016), https://www.iea.org/publications/freepublications/publication/ REPOWERINGMARKETS.pdf.
270 Source: Task Force on Climate Related financial disclosures, “Phase I Report,” 2016, https://www.fsb-tcfd.org/wp-content/uploads/2016/03/Phase_I_ Report_v15.pdf.
The 2015 Energy Transition Law for Green Growth sets out France’s energy strategy for the coming decades. Article 173 of the Act aims to better integrate climate change considerations into corporate decision-making by changing rules on financial reporting. There are two main provisions:270
1. Article 173-IV strengthened the reporting obligations of company-level GHG emissions. Companies are required to report emissions directly related to their activities as well as the emissions associated with the inputs necessary to their activities and the usage of goods and services produced.
2. Article 173-VI requires investors to publish information regarding their contribution to climate targets and their financial risk exposure to the energy and environmental transition. This law also provides new extra-financial reporting obligations for institutional investors, requiring disclosure of the means implemented to contribute to the energy and environmental transition.
By aiming to reduce the information barriers faced by investors about climate-related risks, the Article intends to ease the provision of private finance for low-carbon options when it becomes clear to investors that such projects can reduce these risks.
France is pioneering legislation on carbon-related disclosure requirementsBox 7
67
In addition, part of the appropriate policy response to these challenges are interventions that increase access to finance across the economy, including for SMEs and households. This might include establishing credit registries, reducing the costs of registering or repossessing collateral and introducing specific legislation to underpin modern financial technology—including leasing and factoring, electronic finance, and mobile finance. Competition law that supports a competitive, dynamic banking sector, which is open to foreign entry, while ensuring that lending practices remain prudent, is also needed.271
Development finance can also play an important role in supporting the commercially sustainable financing of low-carbon technologies. These institutions typically seek to finance projects that will have a broader market replication effect. For instance, the EBRD has provided finance to wind farms in Poland accepting electricity price risk (and, on occasion, the risk associated with the variability in the value of overlapping policies, as discussed below)272 while the International Finance Corporation (IFC) has financed solar power projects in Mexico under similar arrangements.273 In this way, some of the tension between the market arrangements that support emission reductions from operational activity and the market arrangements that support renewables investment, discussed further below, can be overcome.
On occasion, concessional finance—finance provided from public sources at below market rates—can play a catalytic role in helping investors gain more familiarity with particular low-carbon technologies in a given context. An international example is provided by the role of the Clean Technology Fund in Mexico. This fund provided US$45 million of concessional financing for two wind projects in 2010, over US$500 million in commercial resources and spurring investments in
20 further wind projects by 2011.274 Also, the Chilean Development Agency provided low interest rate loans for qualifying domestic investment, which led to the deployment of more than 80 MW of renewable power through support to 14 companies.275 However, while the use of concessional financing can be powerful, it comes with a risk of crowding out private finance; the most effective schemes are carefully planned in the country context to minimize this risk.276
3.1.2Overlapping policies
In contrast to complementary policies, overlapping policies operate in parallel to and independently of carbon pricing. Although often motivated by immediate objectives other than climate mitigation, they partly create the same incentive effect as carbon pricing. For instance, renewables support policies such as feed-in tariffs or green certificates provide low-carbon electricity generators with a financial incentive in addition to the competitive advantage provided by a carbon price. Other examples of overlapping policies are vehicle fuel efficiency standards or power station emissions performance standards, which introduce financial compliance costs for carbon-intensive activities in addition to the cost of the carbon price. While working in the same direction, these policies may affect the carbon price signal and increase the overall social cost of reducing emissions. This is often because they provide additional financial support or create additional financial costs to activities that the carbon price also incentivizes or penalizes. Overlapping policies are often restricted to certain sectors or economic activities, in contrast to the broader cross-sectoral coverage that is typical of carbon pricing. This section discusses the rationale for these policies and provides guidance on how they can be aligned to optimize their interaction.
271 Source: World Bank, Policies and Pitfalls in Expanding Access, Finance, 2008, doi:10.1596/978-0-8213-7291-3.272 Source: EBRD, “Kukinia Wind,” Projects, accessed August 4, 2016, http://www.ebrd.com/work-with-us/projects/psd/kukinia-wind.html.; Source: EBRD, “Orla
Wind Farm,” Projects, accessed August 4, 2016, http://www.ebrd.com/work-with-us/projects/psd/orla-wind-farm.html.; Source: EBRD, “Radzyn Wind Farm,” Projects, accessed August 4, 2016, http://www.ebrd.com/work-with-us/projects/psd/radzyn-wind-farm.html.
273 Source: IFC, “IFC’s and Nafin’s Support to Aura Solar Paves the Way for Developing the Solar Energy Sector in Mexico,” Pressroom, 2011, http://ifcext.ifc.org/ifcext/Pressroom/IFCPressRoom.nsf/0/735C674A60AECD7285257B7A004D43F7.
274 Source: Climate Investment Funds, Rooted in Learning, Growing with Results: Annual Report 2013, 2014.275 Source: Rodrigo Violic, NAMA Design Workshop: Financial Mechanism Design, 2015.276 Source: EBRD, “DFI Guidance for Using Investment Concessional Finance in Private Sector Operations,” 2013, http://www.ebrd.com/downloads/news/roundtable.pdf.
3 Aligning carbon pricing with the broader policy landscape
68
There are four main reasons why policymakers may want to introduce overlapping policies.
Providing long-term investment certainty: Carbon pricing can be an effective tool in achieving emission reductions from changing operational practices, for example, by encouraging a switch between the operations of coal- and gas-fired power stations. For investment decisions, however, the long-term strength of the signal provided by the carbon price may be less clear: under an ETS, it may be difficult for investors to predict the future price of allowances, while under a carbon tax, there may be a concern that policymakers will change the tax rate. In these cases, investors may be deterred from making long term investment decisions if the profitability of these is heavily dependent on carbon prices. To respond to this problem, policymakers may introduce overlapping policies that try to provide greater certainty to investors. This was part of the rationale for a number of overlapping policies within the UK mitigation policy mix including:
– A carbon price floor, requiring power generators to pay a tax equal to the difference between the EU ETS carbon price and a designated floor price so as to provide “greater support and certainty to the carbon price … [and] … create a credible long-term framework to incentivize investment in low-carbon electricity generation by reducing revenue uncertainty for generators and improving the economics of low-carbon investment.” 277 This applied to electricity generators in the UK rather than being systematically being built into the design of the EU ETS as a whole.
– A CO2 emissions performance standard for new electricity generation sources, designed to prevent
the new construction of coal-fired power stations not equipped with carbon capture and storage. The stated reason for introducing this policy was to “provide further clarity on the regulatory environment for fossil fuel power stations”, 278 even though modeling analysis commissioned by the government in relation to the introduction of the policy suggested it would not be binding.
Industrial policy: The use of overlapping policies to support certain low-carbon technologies may be a form of industrial policy which intends to boost jobs and export performance in sectors that are believed to reflect the future comparative advantage of a country. While conventional economic analysis suggests that industrial policy carries substantial risks, more recent thinking suggests that, carried out judiciously, it can be an attractive‚ “second-best” policy to support decarbonization.279 Empirically, there is evidence to suggest that, for some countries, overlapping policies have been successful in this regard. For example, one study identified increases in both gross and net employment in Germany from the development of renewable energy sectors and also project positive net employment effects into the future, with up to 217,000 additional jobs in the renewable energy sector and a net positive employment effect across the economy by 2030.280 Similarly, statistical analysis of the historical relationship between investments in the renewable energy sector and economic growth suggests that a growing renewable energy sector has led to increased economic output in Denmark,281 China,282 and for a panel of OECD countries.283 However, other studies have suggested zero or negative employment effects of such policies due to larger crowding-out and budget effects.284 In all cases, it is necessary for policymakers
277 Source: HM Treasury and HM Revenue and Customs, Carbon Price Floor Consultation: The Government Response, March 2011, https://www.gov.uk/ government/uploads/system/uploads/attachment_data/file/190279/carbon_price_floor_consultation_govt_response.pdf.
278 Source: DECC, Emissions Performance Standard Impact Assessments, 2011, https://www.gov.uk/government/uploads/system/uploads/attachment_data/file/204801/eps_ia.pdf.
279 Source: Dani Rodrik, “Green Industrial Policy,” Oxford Review of Economic Policy Vol 30, Issue 3 (2014): 469–491, doi:10.1093/oxrep/gru025. 280 Source: Ulrike Lehr et al., “Renewable Energy and Employment in Germany,” Energy Policy Vol 36, Issue 1 (2008): 108–117, doi:10.1016/j.enpol.2007.09.004.281 Source: Brian Vad Mathiesen, Henrik Lund, and Kenneth Karlsson, “100% Renewable Energy Systems, Climate Mitigation and Economic Growth,” Applied Energy
Vol 88, Issue 2 (2011): 488–501, doi:10.1016/j.apenergy.2010.03.001.282 Source: Yiping Fang, “Economic Welfare Impacts from Renewable Energy Consumption: The China Experience,” Renewable and Sustainable Energy Reviews Vol
15, Issue 9 (2011): 5120–5128, doi:10.1016/j.rser.2011.07.044. 283 Source: Nicholas Apergis and James E. Payne, “Renewable Energy Consumption and Economic Growth: Evidence from a Panel of OECD Countries,” Energy
Policy Vol 38, Issue 1 (2010): 656–660, doi:10.1016/j.enpol.2009.09.002.284 Crowding out effects occur when investments and job increases displace other planned investments and/or jobs created in the renewables sector or in other
areas of the economy. Budget effects arise due to increases in the cost of energy stemming from the switch to increased renewables generation (assuming that renewable power generation is costlier than non-renewable generation), and will have a particular impact on electricity-intensive industries. Source: Paul Lehmann and Erik Gawel, “Why Should Support Schemes for Renewable Electricity Complement the EU Emissions Trading Scheme?,” Energy Policy Vol 52 (2013): 597–607, doi:10.1016/j.enpol.2012.10.018.
69
to consider carefully whether the associated technology development is likely to be consistent with the country’s current and future comparative advantage. For example, academic analysis of trade and patenting activity suggests that China has been able to develop, and looks set to maintain, a strong comparative advantage in the manufacturing of a range of low-carbon technologies, while Brazil’s comparative advantages lie more closely concentrated in manufacturing related to biomass and hydroelectric power, as well as biofuels.285
Supporting penetration of technologies that can be disruptive in the long-term: Jurisdictions may wish to promote certain low-carbon technologies because it is expected that this will bring down their costs in the medium-to-longer term, reducing the overall social costs of decarbonization over time and even across jurisdictions. For example, there is academic evidence that feed-in tariffs for wind power generation in Denmark led to reductions in production prices for wind turbines and sharp reductions in the costs of producing wind power.286 In these cases, the overlapping policy effectively provides a public good to other producers in the future worldwide. However, if this justification is being adopted, policymakers should be confident that the proposed overlapping policy is the most cost-effective approach to realizing this goal. Some studies of renewable energy technologies suggest that supporting R&D may be a more cost-effective way of reducing technology costs,287 although it is likely to be less effective at addressing barriers to commercialization and scaling-up.
Avoiding lock-in of capital in assets that may be stranded in the future: As well as seeking to reduce future costs, overlapping policies may be introduced for strategic reasons to avoid future higher costs.288 In many cases, under either a carbon tax or an ETS, current carbon prices may be relatively low, but there is a longer-term strategic policy direction toward higher carbon prices in the future. This creates a risk that although it may be economic to invest in and operate certain carbon intensive assets under current (low) carbon prices, these could become uneconomic (or stranded) before the end of their useful life under higher carbon prices, implying significant asset value write-downs. To avoid this risk of stranding, it may be dynamically efficient to invest in a different asset today, even if this would not be incentivized by today’s carbon price alone.
For example, in the transport sector, where infrastructure can shape urban spaces for decades, a recent study of Copenhagen, Denmark and Portland, US suggested that despite prominent national, regional and city-level policies to reduce emissions, large-scale transportation planning departments in both cities had not addressed the issue of path-dependency and carbon lock-in in their planning for new motorway developments and river crossings, respectively.289 As a result, carbon-intensive transport modes had been bolstered despite aggressive GHG reduction strategies, including carbon pricing in the case of Denmark. Following this logic, a recent study showed that it may be more valuable for Brazil to adopt policies to advance public transport options in the short term, even though there are other cheaper abatement opportunities available, because the public transport options avoid locking the Brazilian economy into a transportation system with carbon-intensive patterns.290
3 Aligning carbon pricing with the broader policy landscape
285 Source: John Ward et al., “Self-Interested Low-Carbon Growth in Brazil, China and India,” Global Journal of Emerging Market Economies Vol 4, Issue 3 (2012): 291–318, doi:10.1177/0974910112460436.
286 Source: Judith Lipp, “Lessons for Effective Renewable Electricity Policy from Denmark, Germany and the United Kingdom,” Energy Policy Vol 35, Issue 11 (November 2007): 5481–5495, http://www.sciencedirect.com/science/article/pii/S0301421507002091.
287 Source: E Rubin et al., “A Review of Learning Rates for Electricity Supply Technologies,” Energy Policy Vol 86 (2015): 198–218, http://www.sciencedirect.com/science/article/pii/S0301421515002293.
288 Source: Adrien Vogt-Schilb and Stéphane Hallegatte, “Marginal Abatement Cost Curves and the Optimal Timing of Mitigation Measures,” Energy Policy Vol 66 (2014): 645–653, doi:10.1016/j.enpol.2013.11.045.
289 Source: Patrick Arthur Driscoll, “Breaking Carbon Lock-In: Path Dependencies in Large-Scale Transportation Infrastructure Projects,” Planning Practice & Research Vol 29, Issue 3 (2014): 317–330, doi:10.1080/02697459.2014.929847.
290 Source: Adrien Vogt-Schilb, Stéphane Hallegatte, and Christophe de Gouvello, “Marginal Abatement Cost Curves and the Quality of Emission Reductions: A Case Study on Brazil,” Climate Policy Vol 15, Issue 6 (2014): 703–723, doi:10.1080/14693062.2014.953908.
70
Challenges and pressure points Notwith-standing their own rationale, multiple parallel policies can also create tensions because of the overlap of price signals. The nature of these differ depending on the type of carbon pricing instrument implemented.
Under most ETSs, the cap in the system places an absolute constraint on the quantity of aggregate emissions from covered sources. This means that while an overlapping policy can change the source of emission reductions, the absolute quantity of emissions will remain the same. Instead, two key impacts can result: – The emission reductions incentivized by overlapping
policies may be costlier for society to achieve than the emission reductions that would have been delivered by the ETS.291
– The abatement resulting from the overlapping policy lowers the demand for allowances, reducing the carbon price, which may damage longer-term, low-carbon investment signals. These challenges can be seen in real-world examples.
A recent international study indicated that the carbon price implied in overlapping policies is on average many times higher than the explicit carbon prices from an ETS.292 This reflects both that these policies are seeking to unlock relatively expensive abatement and because overlapping policies can provide stronger financial incentives than may be strictly required by an assessment of the abatement costs.
A number of studies on the EU ETS have attempted to disentangle the role that the carbon price played in reducing emissions, compared with other overlapping policies active in the same sectors. There are significant methodological challenges in undertaking this type of attribution analysis leading to a range of results. According to the OECD, the full range of emission
reductions relative to business-as-usual as a result of the EU ETS appears to be between 3 per cent and 28 per cent, with abatement attributed to carbon prices likely to be higher as the system matured.293 However, in terms of the decomposition of emission reductions from different policies and market drivers, one analysis suggests that around 21 per cent of the industrial emission reductions delivered over phase I and II was a result of the EU ETS.294 This is broadly consistent with—but slightly higher than—a further study which suggests that less than 10 percent can be attributed directly to the price signal from the EU ETS, with around half driven by renewables support policies and a further 10–20 percent resulting from overlapping energy efficiency support policy.295 This same study estimates that around 12.5 percent of the predicted 2020 surplus in EU ETS allowances is likely to be attributable to overlapping policies.296
Similarly, a study of the impact of the UK carbon price floor,297 as described above, suggests that the additional abatement this policy delivered in the UK power sector would be enough to reduce demand for allowances such that carbon prices would fall by between €0.13/tCO2e to €0.18/tCO2e, with an approximate €8 million efficiency loss in 2013. It also notes that in the same year the lower allowance price might have reduced auction revenues for other member states by between €122 million to €166 million.
These same examples also help to identify some of the options for managing the tensions caused by overlapping policies. Typically, the greatest risks emerge when overlapping policies are added to the policy suite without explanation of how they make an additional contribution. A useful rule of thumb is that each policy should be targeted at addressing a different policy challenge or market failure, and this should be
291 In addition, the overlapping policies that are used to incentivize emission reductions may transfer more financial resources to the beneficiaries than is justified by the cost of the abatement opportunity. While this is not a cost to society as a whole, it does represent a transfer to producers, often from customers or taxpayers that can be politically unpalatable.
292 Source: OECD, Effective Carbon Prices (Paris: OECD Publishing, 2013), doi:10.1787/9789264196964-en.293 Source: Johanna Arlinghaus, “Impacts of Carbon Prices on Indicators of Competitiveness: A Review of Empirical Findings,” OECD Environment Working Papers
Issue 87 (2015).294 Source: G. Bel and S. Joseph, “Industrial Emissions Abatement: Untangling the Impact of the EU ETS and the Economic Crisis,” 2014.295 Source: Institute for Climate Economics, Exploring the EU ETS Beyond 2020, November 2015, http://www.i4ce.org/download/copec-report/?wpdmdl=11830. 296 This is the gross surplus of allowances prior to policy measures such as backloading.297 This relates to the original design of the UK carbon price floor. Source: Oliver Sartor and Nicolas Berghmans, Carbon Price Flaw? The Impact of the UK’s CO2
Price Support on the EU ETS, CDC Climate Research, 2011, http://www.cdcclimat.com/IMG/pdf/11-06_climate_brief_6_-_uk_carbon_price_floor.pdf.
71
clearly articulated.298 In the case of the UK carbon price floor, for example, the impact on the EU ETS was understood,299 but it was decided that these impacts were worth absorbing in order to address the challenge of price volatility impeding investment. In addition, any subsequent evaluation and calibration of that policy should be undertaken by reference to this policy objective.
Similarly, the overlap between the EU ETS and European renewables support policies shows how it is possible to adjust the carbon pricing initiative during its design phase to take into account the impact of overlapping policies. In this case, the ETS cap was tightened beforehand to offset much of the reduction in price that would otherwise have materialized. This appears to have been successful: one recent econometric study found that greater renewables penetration has been associated with only a modest decline in the EU allowance price because “the actual deployment of RES is relatively consistent with its expected deployment”.300
In the case of a carbon tax, the dynamics of policy interaction are somewhat different as there is no fixed constraint on emissions. In this case, overlapping policies can provide additional abatement, even in the short term. The challenge that results from policies that overlap with a carbon tax is that the additional abatement might be delivered to society at a lower cost by raising the carbon tax rate instead of supporting particular solutions through the overlapping policy. Alternatively, there is a possibility of redundancy if the carbon tax would have driven the same changes without the overlapping policy.
These challenges can be seen in ongoing discussions on the design of the carbon tax in South Africa. At present, South Africa envisages combining a carbon tax designed by the National Treasury, due to be introduced in 2017, and carbon budgets designed by
the Department for Environmental Affairs that intend to place an overall limit on the amount of emissions that each firm is allowed to emit. Both instruments have attractions, but their overlap could create challenging interactions. In particular, only one will be a binding constraint on firms’ emissions at a particular point in time: if the carbon budget is the binding constraint, then firms will bear any cost of abatement needed to meet the budget, and the tax on remaining emissions will impose additional costs on firms without generating additional environmental benefits, at least in the short-term;301 if the tax is tighter, the carbon budget—and the associated time and political capital spent agreeing it—will be redundant. There are ongoing discussions focused on how to manage these interactions.302
This example highlights the importance of promoting coordination in the institutions responsible for climate mitigation policy. This applies equally to overlapping policies in the context of an ETS as it does with a carbon tax. For example, challenges in ensuring alignment between targets and policies for energy efficiency, renewable energy and carbon emissions have been identified in China due to the presence of multiple bodies with mandates in these policy domains.303
There are also some tensions and pressure points that can arise, regardless of whether carbon prices are introduced by a carbon tax or an ETS. One example is when policymakers use overlapping policies to fix the revenues of renewable projects through long term power purchase agreements or feed-in tariffs in the attempt to reduce revenue risk and hence the cost of their financing. This often leads to demands by other generation sources, including nuclear and thermal, to extend similar long-term price security to them, potentially insulating the whole generation segment from the reach of market price signals, and also reducing the impact of carbon pricing on dispatch decisions. To respond to this problem, some
3 Aligning carbon pricing with the broader policy landscape
298 Source: Christina Hood, Managing Interactions between Carbon Pricing and Existing Energy Policies: Guidance for Policymakers, IAE Insight Series 2013 (Paris, 2013), http://www.iea.org/publications/insights/insightpublications/managinginteractionscarbonpricing_final.pdf.
299 Source: HM Treasury and HM Revenue and Customs, Carbon Price Floor Consultation: The Government Response, March 2011, https://www.gov.uk/ government/uploads/system/uploads/attachment_data/file/190279/carbon_price_floor_consultation_govt_response.pdf.
300 Source: Nicolas Koch et al., Causes of the EU ETS Price Drop: Recession, CDM, Renewable Policies or a Bit of Everything? New Evidence, Energy Policy, vol. 73, 2014, doi:10.1016/j.enpol.2014.06.024.
301 Although a longer-term dynamic incentive to reduce emissions would remain. 302 For example, in Switzerland, a carbon tax is placed on installations not covered by the ETS, but those engaged in particular industrial activities that emit more than
100 tCO2e per year can be exempt from the CO2 tax if they commit to a voluntary reduction.303 Source: Mark Johnson et al., International Review of Trading Schemes for Energy Savings and Carbon Emission Reductions, September 2013, https://www.
thepmr.org/system/files/documents/International Review of Certificate Trading Schemes v4 final agreed.pdf.
72
jurisdictions redesigned renewable support policies to make them less distortive to electricity markets and price signals. This includes green certificates (in several US states, Sweden, Poland and Romania), where the level of price support for renewable generation is established on the certificate market independently of the prices of electricity that are established on the wholesale market. Similarly, recognizing this risk, the European Commission has encouraged Member States to move away from fixed feed-in tariffs toward policies that still provide additional financial support for renewables, while at the same time exposing renewable generators to some price competition.304
Another unwanted effect from overlapping policies was observed in the EU ETS and US when renewable support in some cases contributed to increasing the surplus of allowances, lowering the carbon price and shifting thermal generation from gas to coal, thereby increasing overall emissions in the power system.305 Gas-fired generators usually operate marginal plants (i.e. their short-run costs are the highest in the mix and
set the market price). Therefore, economic dispatch of short run low-cost renewables can crowd-out the most expensive gas plants from the merit order, making their operation uneconomic, while coal power plants are still able to recover their costs.
In seeking to manage the interactions between carbon pricing and overlapping policies, careful ongoing monitoring can allow policymakers to intervene when the tensions between overlapping policies become too great. While retaining this flexibility can be valuable, policymakers also need to create a clear framework to help stakeholders understand how, and under what circumstances, this flexibility will be used.306 The use of independent bodies, with specific expertise, to undertake reviews at clearly scheduled review points can be valuable. Box 8 highlights the experience of Australia, while similar review processes are built into the EU ETS, with the European Commission having systematically studied policy interactions in its impact assessment work in both its 2020 and the 2030 climate and energy policy framework.307
304 Source: European Commission, European Commission Guidance for the Design of Renewables Support Schemes (Brussels, November 2013).305 Source: European Commision, “Energy Challenges and Policy” Issue May (2013): 26; U.S. Department of Energy, Natural Gas Infrastructure Implications of
Increased Demand from the Electric Power Sector, 2015.306 Source: The World Bank Group, Partnership for Market Readiness, and International Carbon Action Partnership, Emissions Trading in Practice: A Handbook
on Design and Implementation (Washington D.C., 2016), https://openknowledge.worldbank.org/handle/10986/23874. Source: Christina Hood, Managing Interactions between Carbon Pricing and Existing Energy Policies: Guidance for Policymakers, IAE Insight Series 2013 (Paris, 2013), http://www.iea.org/ publications/insights/insightpublications/managinginteractionscarbonpricing_final.pdf.
307 Source: The World Bank Group, Partnership for Market Readiness, and International Carbon Action Partnership, Emissions Trading in Practice: A Handbook on Design and Implementation (Washington D.C., 2016), https://openknowledge.worldbank.org/handle/10986/23874.
The Australian Climate Change Authority (CCA) is an independent body with no legislative or executive powers, which consults with the public and advises the Government, and through the Government the Parliament and the public on climate policy. Operational from 2012 and modeled on the UK’s Committee on Climate Change, the CCA has published reviews on the country’s renewable energy and emissions targets.
When Australia’s Carbon Pricing Mechanism was in operation, the CCA was responsible for reviewing overlapping policies, such as the Renewable Energy Target. Most recently, it has provided recommendations on Australia’s future climate policy suite, assessing potential policies against the policy principles in its legislation, including cost-effectiveness, environmental effectiveness, and the distributional impacts of climate policies.
Ongoing climate policy institutions in AustraliaBox 8
73
3.1.3Countervailing
policies
A number of policies can act as a countervailing influence on the carbon price signal, distorting and diminishing the impact it might otherwise have. Three broad types of the countervailing policy can be distinguished: – Sometimes, as with fossil fuel subsidies, the distortion
to the carbon pricing signal arises at the same time as the policy being controversial on its own terms.
– On other occasions, there may be scope to amend the policy to keep its original intent while supporting the carbon price signal—urban mobility policies and interventions may fall into this category.
– There may also be legitimate trade-offs between different policies and public interest objectives—for instance, fiscal and financial stability policies.
Fossil fuel subsidies are the most common and highly publicized countervailing policy to a carbon price. They act as a negative carbon price, making it cheaper for firms and individuals to undertake activities that increase emissions. The OECD estimates suggest that removing all fossil fuel consumption subsidies by 2020 in non-OECD countries could reduce world emissions by 10 percent by 2050.308 Fossil fuel subsidies can also encourage the lock-in of carbon-intensive infrastructure that can make it harder to pursue other climate mitigation policies, both in the short and medium term.
Critically, as well as distorting the carbon price signal, fossil fuel subsidies are usually inefficient and ineffective policy instruments in their own right. One of the main stated objectives of fossil fuel subsidies is to protect poor households from the impact of high energy
bills, increase access to energy and security of supply. However, less than 10 percent of fossil fuel consumption subsidies spent in 2010 reached the bottom 20 percent of income groups in their countries.309 This means that 90 percent of subsidies were captured by those who could afford to pay for energy in the first place. In addition, fossil fuel subsidies tend to incur wasteful use of energy (and the associated infrastructure of extraction, processing and transportation) even before consideration of the impact on emissions. Consumer subsidies also contribute to fiscal deficits and can create financial stress along the value chain in energy systems, leading to neglected investments, maintenance and lower quality of energy services. A reflection of these inefficiencies is provided by studies suggesting that removing fossil fuel consumption subsidies could increase global economic growth by up to 0.7 percent per year by 2050—although several studies estimate lower gains.310 In addition, the growth impact of fossil fuel subsidy reduction or removal will depend on the local context of the economy.311 Several alternative measures contribute better to energy access and affordability than consumption subsidies, including block tariffs or targeted transfers through social security nets.
Despite the well-publicized problems with fossil fuel consumption subsidies, there are a number of barriers to their removal. They are often politically popular and establish vested interest groups benefitting from them, especially in oil- and gas-producing countries.312 Their removal raises prices, which might exacerbate existing difficulties with inflation and can erode the value of compensatory measures accompanying fossil fuel subsidy reform.313 In addition, a lack of information on the consumer side about the extent of subsidies and their damaging impacts makes subsidy removal more politically difficult.314
3 Aligning carbon pricing with the broader policy landscape
308 Source: Javier Arze del Granado, David Coady, and Robert Gillingham, “The Unequal Benefits of Fuel Subsidies: A Review of Evidence for Developing Countries,” World Development Vol 40, Issue 11 (2012): 2234–2248, http://www.sciencedirect.com/science/article/pii/S0305750X12001155. Source: OECD, The Economics of Climate Change Mitigation Policies and Options for Global Action beyond 2012 (Paris: OECD Publishing, 2009), doi:10.1787/9789264073616-en.
309 Source: Javier Arze del Granado, David Coady, and Robert Gillingham, “The Unequal Benefits of Fuel Subsidies: A Review of Evidence for Developing Countries,” World Development Vol 40, Issue 11 (2012): 2234–2248, http://www.sciencedirect.com/science/article/pii/S0305750X12001155.; Source: IEA et al., Joint Report by IEA, OPEC, OECD and World Bank on Fossil-Fuel and Other Energy Subsidies: An Update on the G20 Pittsburgh and Toronto Commitments, October 2011, https://www.iea.org/media/g20/1_2011_Joint_report_IEA_OPEC_OECD_WorldBank_on_fossil_fuel_and_other_energy_subsidies.pdf.
310 Source: Jennifer Ellis, The Effects of Fossil-Fuel Subsidy Reform: A Review of Modelling and Empirical Studies (Geneva, March 2010), https://www.iisd.org/gsi/sites/default/files/effects_ffs.pdf.
311 Source: Ambrus Barany and Dalia Grigonyte, Measuring Fossil Fuel Subsidies, ECFIN Eonomic Brief, March 2015, doi:10.2765/85991. 312 Source: Simon Commander, A Guide to the Political Economy of Reforming Energy Subsidies (Bonn, December 2012), http://ftp.iza.org/pp52.pdf.313 Source: IEA et al., Joint Report by IEA, OPEC, OECD and World Bank on Fossil-Fuel and Other Energy Subsidies: An Update on the G20 Pittsburgh and Toronto
Commitments, October 2011, https://www.iea.org/media/g20/1_2011_Joint_report_IEA_OPEC_OECD_WorldBank_on_fossil_fuel_and_other_energy_subsidies.pdf.314 Source: IMF, Fiscal Policy to Mitigate Climate Change: A Guide for Policymakers, ed. Ruud A. de Mooij, Michael Keen, and Ian W. H. Parry, 2012, https://www.imf.
org/external/pubs/cat/longres.aspx?sk=25864.0.
74
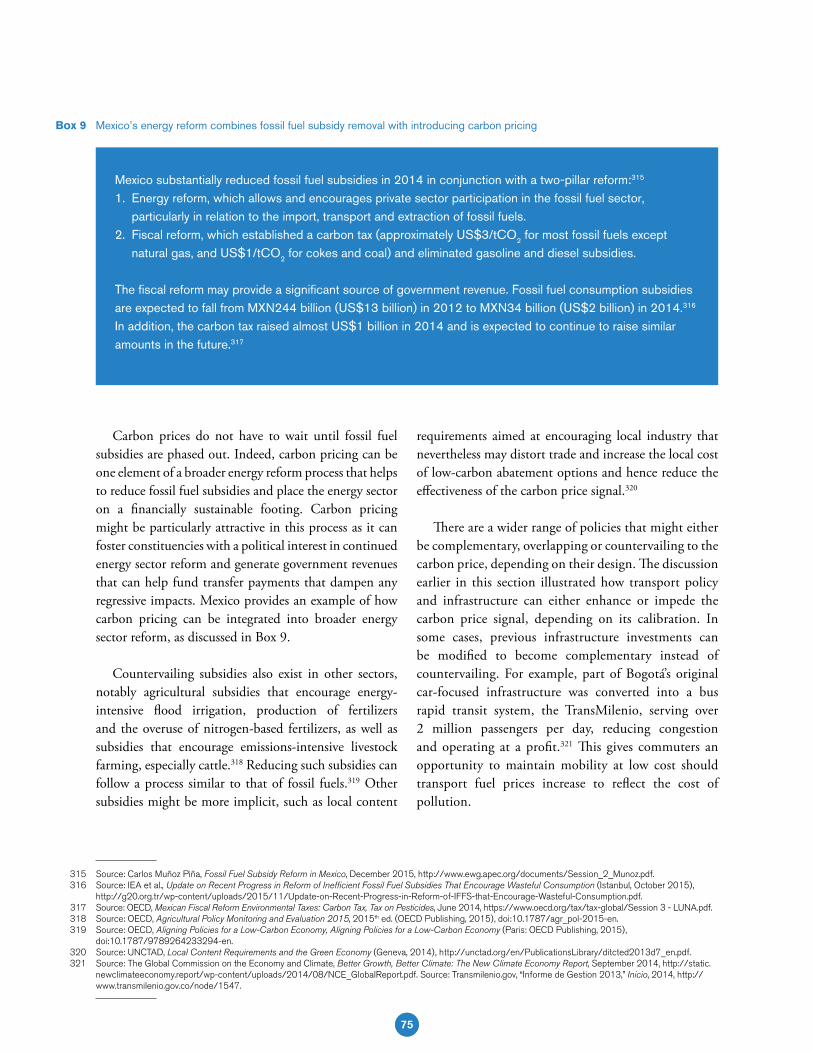
Carbon prices do not have to wait until fossil fuel subsidies are phased out. Indeed, carbon pricing can be one element of a broader energy reform process that helps to reduce fossil fuel subsidies and place the energy sector on a financially sustainable footing. Carbon pricing might be particularly attractive in this process as it can foster constituencies with a political interest in continued energy sector reform and generate government revenues that can help fund transfer payments that dampen any regressive impacts. Mexico provides an example of how carbon pricing can be integrated into broader energy sector reform, as discussed in Box 9.
Countervailing subsidies also exist in other sectors, notably agricultural subsidies that encourage energy-intensive flood irrigation, production of fertilizers and the overuse of nitrogen-based fertilizers, as well as subsidies that encourage emissions-intensive livestock farming, especially cattle.318 Reducing such subsidies can follow a process similar to that of fossil fuels.319 Other subsidies might be more implicit, such as local content
requirements aimed at encouraging local industry that nevertheless may distort trade and increase the local cost of low-carbon abatement options and hence reduce the effectiveness of the carbon price signal.320
There are a wider range of policies that might either be complementary, overlapping or countervailing to the carbon price, depending on their design. The discussion earlier in this section illustrated how transport policy and infrastructure can either enhance or impede the carbon price signal, depending on its calibration. In some cases, previous infrastructure investments can be modified to become complementary instead of countervailing. For example, part of Bogotá’s original car-focused infrastructure was converted into a bus rapid transit system, the TransMilenio, serving over 2 million passengers per day, reducing congestion and operating at a profit.321 This gives commuters an opportunity to maintain mobility at low cost should transport fuel prices increase to reflect the cost of pollution.
315 Source: Carlos Muñoz Piña, Fossil Fuel Subsidy Reform in Mexico, December 2015, http://www.ewg.apec.org/documents/Session_2_Munoz.pdf.316 Source: IEA et al., Update on Recent Progress in Reform of Inefficient Fossil Fuel Subsidies That Encourage Wasteful Consumption (Istanbul, October 2015),
http://g20.org.tr/wp-content/uploads/2015/11/Update-on-Recent-Progress-in-Reform-of-IFFS-that-Encourage-Wasteful-Consumption.pdf. 317 Source: OECD, Mexican Fiscal Reform Environmental Taxes: Carbon Tax, Tax on Pesticides, June 2014, https://www.oecd.org/tax/tax-global/Session 3 - LUNA.pdf.318 Source: OECD, Agricultural Policy Monitoring and Evaluation 2015, 2015th ed. (OECD Publishing, 2015), doi:10.1787/agr_pol-2015-en.319 Source: OECD, Aligning Policies for a Low-Carbon Economy, Aligning Policies for a Low-Carbon Economy (Paris: OECD Publishing, 2015),
doi:10.1787/9789264233294-en.320 Source: UNCTAD, Local Content Requirements and the Green Economy (Geneva, 2014), http://unctad.org/en/PublicationsLibrary/ditcted2013d7_en.pdf.321 Source: The Global Commission on the Economy and Climate, Better Growth, Better Climate: The New Climate Economy Report, September 2014, http://static.
newclimateeconomy.report/wp-content/uploads/2014/08/NCE_GlobalReport.pdf. Source: Transmilenio.gov, “Informe de Gestion 2013,” Inicio, 2014, http://www.transmilenio.gov.co/node/1547.
Mexico substantially reduced fossil fuel subsidies in 2014 in conjunction with a two-pillar reform:315 1. Energy reform, which allows and encourages private sector participation in the fossil fuel sector,
particularly in relation to the import, transport and extraction of fossil fuels.2. Fiscal reform, which established a carbon tax (approximately US$3/tCO2 for most fossil fuels except
natural gas, and US$1/tCO2 for cokes and coal) and eliminated gasoline and diesel subsidies.
The fiscal reform may provide a significant source of government revenue. Fossil fuel consumption subsidies are expected to fall from MXN244 billion (US$13 billion) in 2012 to MXN34 billion (US$2 billion) in 2014.316 In addition, the carbon tax raised almost US$1 billion in 2014 and is expected to continue to raise similar amounts in the future.317
Mexico’s energy reform combines fossil fuel subsidy removal with introducing carbon pricingBox 9
75
There are also some countervailing policies with legitimate policy objectives, where important trade-offs may need to be made. One example relates to the rules for banks (Basel III) and insurers (Solvency II) surrounding investments in low-carbon assets such as renewables. These policies are designed to deliver greater financial stability, but may hold back financing of low-carbon investments that would otherwise be supported by a carbon price. Nonetheless, marginal or incremental changes could be made that preserve the intent of the original policy while improving alignment with carbon pricing. For example, the IFC’s Sustainable Banking Network is developing regulatory guidance on environmentally and socially sustainable banking practices to address some of these challenges.322 Carbon pricing initiatives, on the other hand, could better respect the rules of fiscal and financial prudency if their design refrained from strict earmarking of revenues to enhance directed credit or to create extra-budgetary funds outside of the discipline of a consolidated budget.
3.2MEASURING THE EFFECTIVENESS
OF CARBON PRICES IN THE PRESENCE OF MULTIPLE POLICIES
Before introducing a carbon price, policymakers should understand how it might interact with other policies and what the outcomes of these interactions could be. As a starting tool, qualitative policy-mapping to identify existing policies and economic trends helps to develop an understanding of the context in which carbon pricing acts. It also helps to categorize policies into complementary, overlapping and countervailing, to better understand where pressure points between policies and carbon pricing may occur. Useful mappings should include the policy objective, the instruments that are aimed at achieving the objective, the administrative arrangements, the policy review process and the sectoral and energy-source coverage.
Policymakers can also combine a qualitative understanding of existing policies with quantitative analysis. General equilibrium models are often used to provide a comprehensive macroeconomic assessment of how carbon reduction policies might influence an economy. These are attractive as they account for both the direct impacts and the final incidence of the policy, including the cost, output and employment impacts after the direct impacts have propagated through the economy. Therefore, they are useful to determine the targets or the level of ambition of climate policy that is best for society as a whole. However, the challenge with these models is that comprehensive economic coverage is achieved only by sacrificing details on how policies might be designed and expected to influence firms and individuals. In particular, they tend to collapse all carbon mitigation policies into a single “shadow” carbon price. This makes assessment of multiple climate policies difficult. The treatment of other non-climate related policies may also be relatively coarse.
Alternative approaches may focus on partial equilibrium models that seek to explain behavior within a particular market or sector. While these offer the opportunity of greater granularity in the treatment of sector-specific regulations or incentives, they often fail to capture the impact of policies on the behavior of economic agents and are likely to miss interactions across the economy.
The challenges of ex-ante assessment of the effectiveness of multiple policies has led to an increasing focus on agent-based modeling (ABM) approaches to support the design and implementation of policies. ABMs simulate how individual economic agents, such as firms or households, might react to the incentives generated simultaneously by multiple (complementary, overlapping and countervailing) policies. In particular, they can help policymakers understand the path through which policy shocks might lead to a change in behavior, improving estimation of their impacts on emission and other outcomes.323
3 Aligning carbon pricing with the broader policy landscape
322 Source: IFC, “Sustainable Banking Network,” Sustainability at IFC, 2016, http://www.ifc.org/wps/wcm/connect/Topics_Ext_Content/IFC_External_Corporate_Site/IFC+Sustainability/Partnerships/Sustainable+Banking+Network/.
323 Source: Giorgio Fagiolo and Andrea Roventini, “Macroeconomic Policy in DSGE and Agent-Based Models Redux: New Developments and Challenges Ahead,” Working Paper Issue April (2016).
76
Though ABM in climate policy is relatively new, there are a number of models that help to analyze policy interactions, each differing somewhat in methods and techniques depending on the area of analysis.324 One of the first application looked at effectiveness of climate policies across sectors and countries.325 Other followed with specific studies of energy efficiency policies in Ireland,326 Bulgaria and Croatia.327 ABM has also been used to consider the distributional impacts of a number of possible designs of climate policy packages.328 One particular family of agent-based models involves converting traditional techno-economic marginal cost curves into the financial models representing policy impact from the perspective of investors and consumers. This policy-induced marginal abatement cost methodology (POL-MAC) is described in more details in Annex IV.
Increasing focus on effective implementation of climate policy targets included in the INDCs means that the application of ABM toolkits will expand in the coming years, although comprehensive analysis will need to rely on diversity of models. Future editions of the State and Trends of Carbon Pricing report may further address the emerging experience with designing carbon prices and aligned policies to enhance their joint effectiveness.
3.3KEY CONCLUSIONS
New policies and increased ambition from existing policies will be required to deliver the mitigation contributions outlined in countries’ INDCs. However, these will need to be delivered in a complex policy suite where policymakers must balance a wide range of policy objectives. The way in which these interactions are managed will be of fundamental importance to the effective implementation of the Paris Agreement.
There are a number of ways in which policymakers can seek to enhance the integration of carbon pricing into an existing suite of policy instruments, as summarized in Table 3.
A focus on adaptive evolution over time is particularly important generic recommendation: existing carbon pricing experience shows that the interaction between carbon pricing and other policies is a dynamic, iterative process. The experience also demonstrates that not all of the challenges can be or need to be predicted before the introduction of carbon pricing and that as some interactions are managed, new ones will emerge. Anticipating this, policymakers should build in regular processes of review and evaluation so they are able to respond to challenges that may emerge. Structure and framework should be placed around these reviews to give businesses the confidence to plan and invest. In addition, policymakers can also develop and use analytical tools—including agent-based modeling methodology—to better understand the complex interaction of multiple policies on the choices made by economic actors and plan policy reforms that can effectively deliver results.
Other considerations are more specific to maximizing the synergies from complementary policies, managing the tensions with overlapping policies and identifying and addressing any trade-offs associated with countervailing policies.
In terms of complementary policies, to maximize synergies, policymakers should start by acknowledging and communicating the rationale and need for multiple packages of policies. Linked to this, there will often be ways to develop mutually reinforcing packages of reforms where carbon pricing strengthens the impacts of policies aimed at other policy objectives, while these other policies strengthen the effectiveness of carbon pricing in reducing emissions. These opportunities are most likely to be available in the power sector and end-use energy efficiency, although they can apply more broadly to any carbon intensive sector in need of market-friendly structural reform.
324 Source: M. D. Gerst et al., Agent-Based Modeling of Climate Policy: An Introduction to the ENGAGE Multi-Level Model Framework, Environmental Modelling and Software Vol 44 (2013): 62–75, doi:10.1016/j.envsoft.2012.09.002.
325 European Bank for Reconstruction and Development, Special Report on Climate Change: The Low Carbon Transition, Chapter 3 (2011).326 Jim Scheer, Emrah Durusut, Sam Foster, Unlocking the Energy Efficiency Opportunity, SEAI and Element Energy (2015).327 World Bank, Scaling up Energy Efficiency Investment in Bulgaria and Croatia, Forthcoming. 328 Bernhard Rengs et al., Testing Innovation, Employment and Distributional Impacts of Climate Policy Packages in a Macro-Evolutionary Systems Setting, Issue 83 (2015): 33.
77
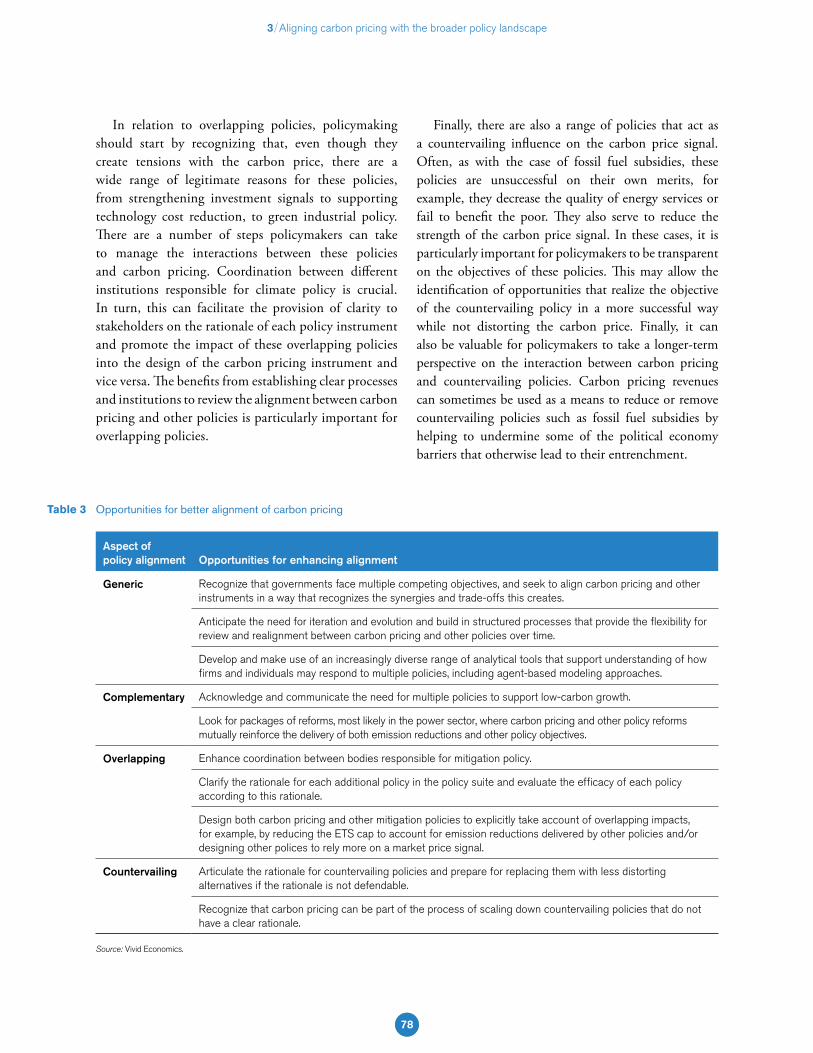
3 Aligning carbon pricing with the broader policy landscape
In relation to overlapping policies, policymaking should start by recognizing that, even though they create tensions with the carbon price, there are a wide range of legitimate reasons for these policies, from strengthening investment signals to supporting technology cost reduction, to green industrial policy. There are a number of steps policymakers can take to manage the interactions between these policies and carbon pricing. Coordination between different institutions responsible for climate policy is crucial. In turn, this can facilitate the provision of clarity to stakeholders on the rationale of each policy instrument and promote the impact of these overlapping policies into the design of the carbon pricing instrument and vice versa. The benefits from establishing clear processes and institutions to review the alignment between carbon pricing and other policies is particularly important for overlapping policies.
Finally, there are also a range of policies that act as a countervailing influence on the carbon price signal. Often, as with the case of fossil fuel subsidies, these policies are unsuccessful on their own merits, for example, they decrease the quality of energy services or fail to benefit the poor. They also serve to reduce the strength of the carbon price signal. In these cases, it is particularly important for policymakers to be transparent on the objectives of these policies. This may allow the identification of opportunities that realize the objective of the countervailing policy in a more successful way while not distorting the carbon price. Finally, it can also be valuable for policymakers to take a longer-term perspective on the interaction between carbon pricing and countervailing policies. Carbon pricing revenues can sometimes be used as a means to reduce or remove countervailing policies such as fossil fuel subsidies by helping to undermine some of the political economy barriers that otherwise lead to their entrenchment.
Source: Vivid Economics.
Opportunities for better alignment of carbon pricingTable 3
Aspect of policy alignment Opportunities for enhancing alignment
Generic Recognize that governments face multiple competing objectives, and seek to align carbon pricing and other instruments in a way that recognizes the synergies and trade-offs this creates.
Anticipate the need for iteration and evolution and build in structured processes that provide the flexibility for review and realignment between carbon pricing and other policies over time.
Develop and make use of an increasingly diverse range of analytical tools that support understanding of how firms and individuals may respond to multiple policies, including agent-based modeling approaches.
Complementary Acknowledge and communicate the need for multiple policies to support low-carbon growth.
Look for packages of reforms, most likely in the power sector, where carbon pricing and other policy reforms mutually reinforce the delivery of both emission reductions and other policy objectives.
Overlapping Enhance coordination between bodies responsible for mitigation policy.
Clarify the rationale for each additional policy in the policy suite and evaluate the efficacy of each policy according to this rationale.
Design both carbon pricing and other mitigation policies to explicitly take account of overlapping impacts, for example, by reducing the ETS cap to account for emission reductions delivered by other policies and/or designing other polices to rely more on a market price signal.
Countervailing Articulate the rationale for countervailing policies and prepare for replacing them with less distorting alternatives if the rationale is not defendable.
Recognize that carbon pricing can be part of the process of scaling down countervailing policies that do not have a clear rationale.
78
Building an inter national carbon
market after Paris
section 4
T he potential for building a new international carbon market has increased following the adoption of the
Paris Agreement. As discussed earlier in Section 2.2, Article 6 of the Agreement recognizes that countries may choose to cooperate in the implementation of their NDCs and identifies two separate concepts that may pave the way for this cooperation to be pursued through an international carbon market: voluntary cooperative approaches and a mechanism to contribute to the mitigation of GHG emissions and support sustainable development. Moreover, according to our analysis, 95 INDCs from Parties state intentions to use international carbon pricing.
An international carbon market enables global emissions to be reduced where it is least cost to do so. This in turn allows for an expansion of ambition. Indeed, the results in this section show that the use of an international carbon market may reduce the cost of delivering the emission reductions identified in the current INDCs by a third by 2030 and more than halve the costs of delivering emission reductions by the middle of the century. Moreover, in the period beyond 2050 it is highly improbable that the emission reductions needed to meet a 2°C or lower target can be achieved without this flexibility. The earlier that an international carbon market is developed, the larger the savings and hence the greater the potential to scale up ambition in the short term. The modeling analysis in this section also shows that some of the poorer regions
in the world may be able to generate financial flows amounting to 2–5 percent of gross domestic product (GDP) in 2050 through the use of an international carbon market. Both buyers and sellers benefit.
International cooperation through a carbon market can also bring a range of further, less tangible benefits. These include greater knowledge-sharing and technical cooperation and encouraging countries that may sell emission reductions to adopt efficient domestic instruments so that they may maximize the value of these sales. Such indirect efficiency gains through an international carbon market are not accounted in the cost
4 Building an inter national carbon
market after Paris
» ...the use of an international carbon market may reduce
the cost of delivering the emission reductions identified
in the current INDCs by a third by 2030 and more than halve the costs of delivering
emission reductions by the middle of the century... «
Note: This chapter strongly benefited from the contribution of Imperial College London.
80
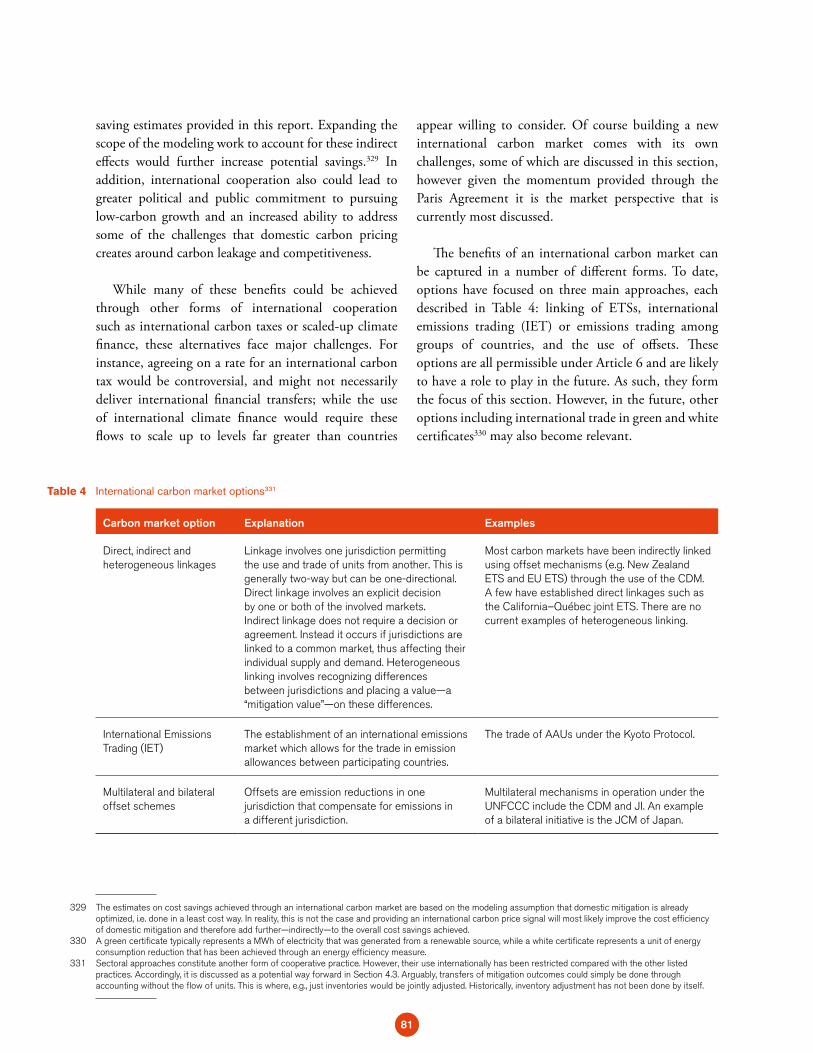
saving estimates provided in this report. Expanding the scope of the modeling work to account for these indirect effects would further increase potential savings.329 In addition, international cooperation also could lead to greater political and public commitment to pursuing low-carbon growth and an increased ability to address some of the challenges that domestic carbon pricing creates around carbon leakage and competitiveness.
While many of these benefits could be achieved through other forms of international cooperation such as international carbon taxes or scaled-up climate finance, these alternatives face major challenges. For instance, agreeing on a rate for an international carbon tax would be controversial, and might not necessarily deliver international financial transfers; while the use of international climate finance would require these flows to scale up to levels far greater than countries
appear willing to consider. Of course building a new international carbon market comes with its own challenges, some of which are discussed in this section, however given the momentum provided through the Paris Agreement it is the market perspective that is currently most discussed.
The benefits of an international carbon market can be captured in a number of different forms. To date, options have focused on three main approaches, each described in Table 4: linking of ETSs, international emissions trading (IET) or emissions trading among groups of countries, and the use of offsets. These options are all permissible under Article 6 and are likely to have a role to play in the future. As such, they form the focus of this section. However, in the future, other options including international trade in green and white certificates330 may also become relevant.
329 The estimates on cost savings achieved through an international carbon market are based on the modeling assumption that domestic mitigation is already optimized, i.e. done in a least cost way. In reality, this is not the case and providing an international carbon price signal will most likely improve the cost efficiency of domestic mitigation and therefore add further—indirectly—to the overall cost savings achieved.
330 A green certificate typically represents a MWh of electricity that was generated from a renewable source, while a white certificate represents a unit of energy consumption reduction that has been achieved through an energy efficiency measure.
331 Sectoral approaches constitute another form of cooperative practice. However, their use internationally has been restricted compared with the other listed practices. Accordingly, it is discussed as a potential way forward in Section 4.3. Arguably, transfers of mitigation outcomes could simply be done through accounting without the flow of units. This is where, e.g., just inventories would be jointly adjusted. Historically, inventory adjustment has not been done by itself.
Carbon market option Explanation Examples
Direct, indirect and heterogeneous linkages
Linkage involves one jurisdiction permitting the use and trade of units from another. This is generally two-way but can be one-directional. Direct linkage involves an explicit decision by one or both of the involved markets. Indirect linkage does not require a decision or agreement. Instead it occurs if jurisdictions are linked to a common market, thus affecting their individual supply and demand. Heterogeneous linking involves recognizing differences between jurisdictions and placing a value—a “mitigation value”—on these differences.
Most carbon markets have been indirectly linked using offset mechanisms (e.g. New Zealand ETS and EU ETS) through the use of the CDM. A few have established direct linkages such as the California–Québec joint ETS. There are no current examples of heterogeneous linking.
International Emissions Trading (IET)
The establishment of an international emissions market which allows for the trade in emission allowances between participating countries.
The trade of AAUs under the Kyoto Protocol.
Multilateral and bilateral offset schemes
Offsets are emission reductions in one jurisdiction that compensate for emissions in a different jurisdiction.
Multilateral mechanisms in operation under the UNFCCC include the CDM and JI. An example of a bilateral initiative is the JCM of Japan.
International carbon market options331 Table 4
81
4 Building an international carbon market after Paris
Despite the attractions of the various forms of an international carbon market, they face a number of important and legitimate barriers that policymakers need to address. In particular, sellers may fear that selling their emission reductions today will make it more difficult to realize their NDCs or other commitments in the future. In turn, this reduces the confidence of potential buyers that they will be able to access a robust and liquid carbon market. Other challenges include concerns over losing control over the value of the domestic carbon price and the loss of the co-benefits associated with reducing emissions. Another issue is the political challenges created by the scale of international transfers that may be generated and especially the concern that countries with low ambition may be rewarded through payments for transferred mitigation outcomes. The scale of many of these challenges varies depending on the particular form of international carbon market pursued.
However, countries and other institutions have already started discussing potential solutions to many of these barriers, although further scale-up is possible and needed. A combination of technical cooperation, RBCF, sectoral approaches, mechanisms to measure and reflect differential ambition, and international standards can all play an important role in an evolutionary learning-by-doing process toward realizing the benefits from an international carbon market.
4.1THE BENEFITS OF AN
INTERNATIONAL CARBON MARKET
This section builds on the 2015 edition of the State and Trends of Carbon Pricing report to provide quantitative estimates of the benefits and implications of international cooperation through new modeling analysis undertaken specifically for this edition of the
report.332 It compares the emission reductions and associated costs (called mitigation costs) that might be incurred if countries need to undertake all of their abatement domestically with a situation in which the use of an international carbon market allows countries to finance emission reduction activities where the costs are lowest. In the modeling undertaken for this study, these mitigation costs are measured in terms of the economy-wide welfare changes333 when comparing a business-as-usual evolution of the energy system (under which there are no emissions constraints) with an evolution where emissions are constrained in line with international climate change targets. These welfare changes are the sum of the changes in costs of the energy system334 (producer surplus) which result from using low-carbon energy technologies in place of carbon-intensive, fossil fuel technologies, plus the changes in consumer happiness or prosperity that results from the reduction in energy demand as prices rise to reflect these higher system costs (consumer surplus). The modeling analysis in this study also examines the financial flows between regions that could result from international cooperation. As with all modeling exercises of this sort, the results should be treated as indicative of expected patterns and magnitudes rather than as precise forecasts.
While this type of analysis has been undertaken before, this is one of the first analyses that take into account the emission reduction commitments pledged in the INDCs, rather than making hypothetical assumptions about countries’ emission reductions.335 The analysis uses the Imperial College London Grantham Institute’s TIMES Integrated Assessment Model (TIAM-Grantham), detailed in Annex VI. The model set up focuses on the gains from CO2 trading only. This means that the estimates of the cost savings are likely to be underestimates, as gains from trading in non-CO2 GHGs are not captured. The volumes of the resource flows are also likely to be underestimates.
332 Source: Alexandre; Kossoy et al., State and Trends of Carbon Pricing 2015, September 2015. 333 Welfare is a measure of prosperity or happiness in an economy. If the fundamental costs of a good or service such as energy services increase, then welfare
reduces, both because providers of that service will produce less, and consumers demand less. 334 In reality, emissions reductions to address climate change will not only occur in the energy system, but also in other systems (such as agriculture, waste, land use)
responsible for emitting greenhouse gases. However, as explained in Annex VI, the principal tool of analysis in this chapter, TIAM-Grantham, focuses primarily on CO2 emission reductions in the energy system.
335 Although such assumptions are required for the period beyond 2030.
82
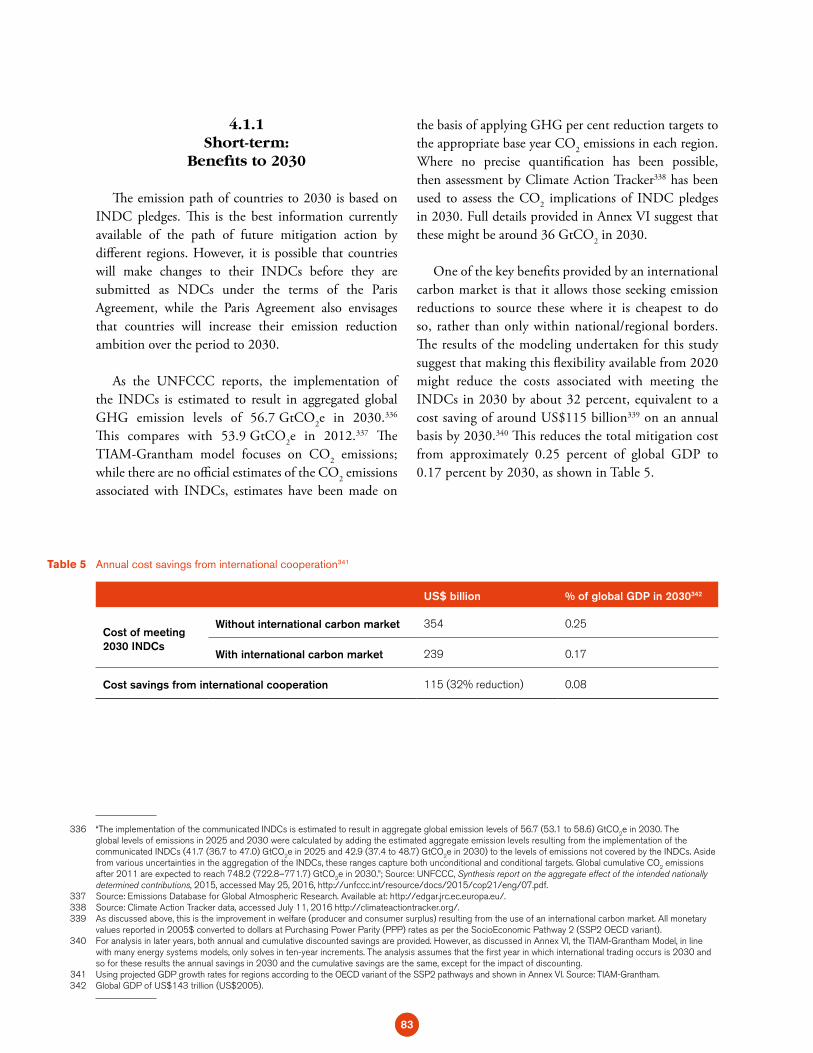
4.1.1Short-term:
Benefits to 2030
The emission path of countries to 2030 is based on INDC pledges. This is the best information currently available of the path of future mitigation action by different regions. However, it is possible that countries will make changes to their INDCs before they are submitted as NDCs under the terms of the Paris Agreement, while the Paris Agreement also envisages that countries will increase their emission reduction ambition over the period to 2030.
As the UNFCCC reports, the implementation of the INDCs is estimated to result in aggregated global GHG emission levels of 56.7 GtCO2e in 2030.336 This compares with 53.9 GtCO2e in 2012.337 The TIAM-Grantham model focuses on CO2 emissions; while there are no official estimates of the CO2 emissions associated with INDCs, estimates have been made on
the basis of applying GHG per cent reduction targets to the appropriate base year CO2 emissions in each region. Where no precise quantification has been possible, then assessment by Climate Action Tracker338 has been used to assess the CO2 implications of INDC pledges in 2030. Full details provided in Annex VI suggest that these might be around 36 GtCO2 in 2030.
One of the key benefits provided by an international carbon market is that it allows those seeking emission reductions to source these where it is cheapest to do so, rather than only within national/regional borders. The results of the modeling undertaken for this study suggest that making this flexibility available from 2020 might reduce the costs associated with meeting the INDCs in 2030 by about 32 percent, equivalent to a cost saving of around US$115 billion339 on an annual basis by 2030.340 This reduces the total mitigation cost from approximately 0.25 percent of global GDP to 0.17 percent by 2030, as shown in Table 5.
336 “The implementation of the communicated INDCs is estimated to result in aggregate global emission levels of 56.7 (53.1 to 58.6) GtCO2e in 2030. The global levels of emissions in 2025 and 2030 were calculated by adding the estimated aggregate emission levels resulting from the implementation of the communicated INDCs (41.7 (36.7 to 47.0) GtCO2e in 2025 and 42.9 (37.4 to 48.7) GtCO2e in 2030) to the levels of emissions not covered by the INDCs. Aside from various uncertainties in the aggregation of the INDCs, these ranges capture both unconditional and conditional targets. Global cumulative CO2 emissions after 2011 are expected to reach 748.2 (722.8–771.7) GtCO2e in 2030.”; Source: UNFCCC, Synthesis report on the aggregate effect of the intended nationally determined contributions, 2015, accessed May 25, 2016, http://unfccc.int/resource/docs/2015/cop21/eng/07.pdf.
337 Source: Emissions Database for Global Atmospheric Research. Available at: http://edgar.jrc.ec.europa.eu/.338 Source: Climate Action Tracker data, accessed July 11, 2016 http://climateactiontracker.org/. 339 As discussed above, this is the improvement in welfare (producer and consumer surplus) resulting from the use of an international carbon market. All monetary
values reported in 2005$ converted to dollars at Purchasing Power Parity (PPP) rates as per the SocioEconomic Pathway 2 (SSP2 OECD variant). 340 For analysis in later years, both annual and cumulative discounted savings are provided. However, as discussed in Annex VI, the TIAM-Grantham Model, in line
with many energy systems models, only solves in ten-year increments. The analysis assumes that the first year in which international trading occurs is 2030 and so for these results the annual savings in 2030 and the cumulative savings are the same, except for the impact of discounting.
341 Using projected GDP growth rates for regions according to the OECD variant of the SSP2 pathways and shown in Annex VI. Source: TIAM-Grantham.342 Global GDP of US$143 trillion (US$2005).
US$ billion % of global GDP in 2030342
Cost of meeting 2030 INDCs
Without international carbon market 354 0.25
With international carbon market 239 0.17
Cost savings from international cooperation 115 (32% reduction) 0.08
Annual cost savings from international cooperation341 Table 5
83
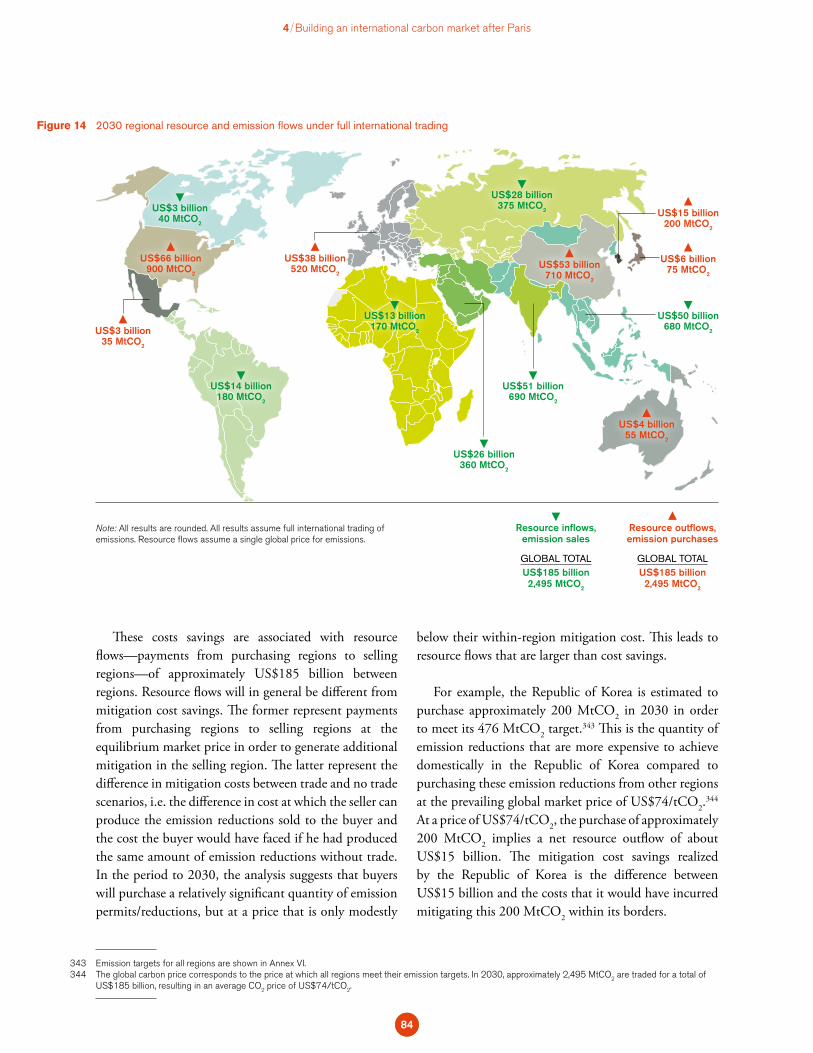
343 Emission targets for all regions are shown in Annex VI.344 The global carbon price corresponds to the price at which all regions meet their emission targets. In 2030, approximately 2,495 MtCO2 are traded for a total of
US$185 billion, resulting in an average CO2 price of US$74/tCO2.
These costs savings are associated with resource flows—payments from purchasing regions to selling regions—of approximately US$185 billion between regions. Resource flows will in general be different from mitigation cost savings. The former represent payments from purchasing regions to selling regions at the equilibrium market price in order to generate additional mitigation in the selling region. The latter represent the difference in mitigation costs between trade and no trade scenarios, i.e. the difference in cost at which the seller can produce the emission reductions sold to the buyer and the cost the buyer would have faced if he had produced the same amount of emission reductions without trade. In the period to 2030, the analysis suggests that buyers will purchase a relatively significant quantity of emission permits/reductions, but at a price that is only modestly
below their within-region mitigation cost. This leads to resource flows that are larger than cost savings.
For example, the Republic of Korea is estimated to purchase approximately 200 MtCO2 in 2030 in order to meet its 476 MtCO2 target.343 This is the quantity of emission reductions that are more expensive to achieve domestically in the Republic of Korea compared to purchasing these emission reductions from other regions at the prevailing global market price of US$74/tCO2.
344 At a price of US$74/tCO2, the purchase of approximately 200 MtCO2 implies a net resource outflow of about US$15 billion. The mitigation cost savings realized by the Republic of Korea is the difference between US$15 billion and the costs that it would have incurred mitigating this 200 MtCO2 within its borders.
4 Building an international carbon market after Paris
2030 regional resource and emission flows under full international trading Figure 14
US$3 billion40 MtCO2
US$66 billion900 MtCO2
US$53 billion710 MtCO2
US$15 billion200 MtCO2
US$6 billion75 MtCO2
US$4 billion55 MtCO2
US$13 billion170 MtCO2
US$14 billion180 MtCO2
US$26 billion360 MtCO2
US$28 billion375 MtCO2
US$50 billion680 MtCO2
US$51 billion690 MtCO2
US$3 billion35 MtCO2
US$38 billion520 MtCO2
Resource inflows,
emission sales
GLOBAL TOTAL US$185 billion2,495 MtCO2
Resource outflows, emission purchases
GLOBAL TOTAL US$185 billion2,495 MtCO2
Note: All results are rounded. All results assume full international trading of emissions. Resource flows assume a single global price for emissions.
84
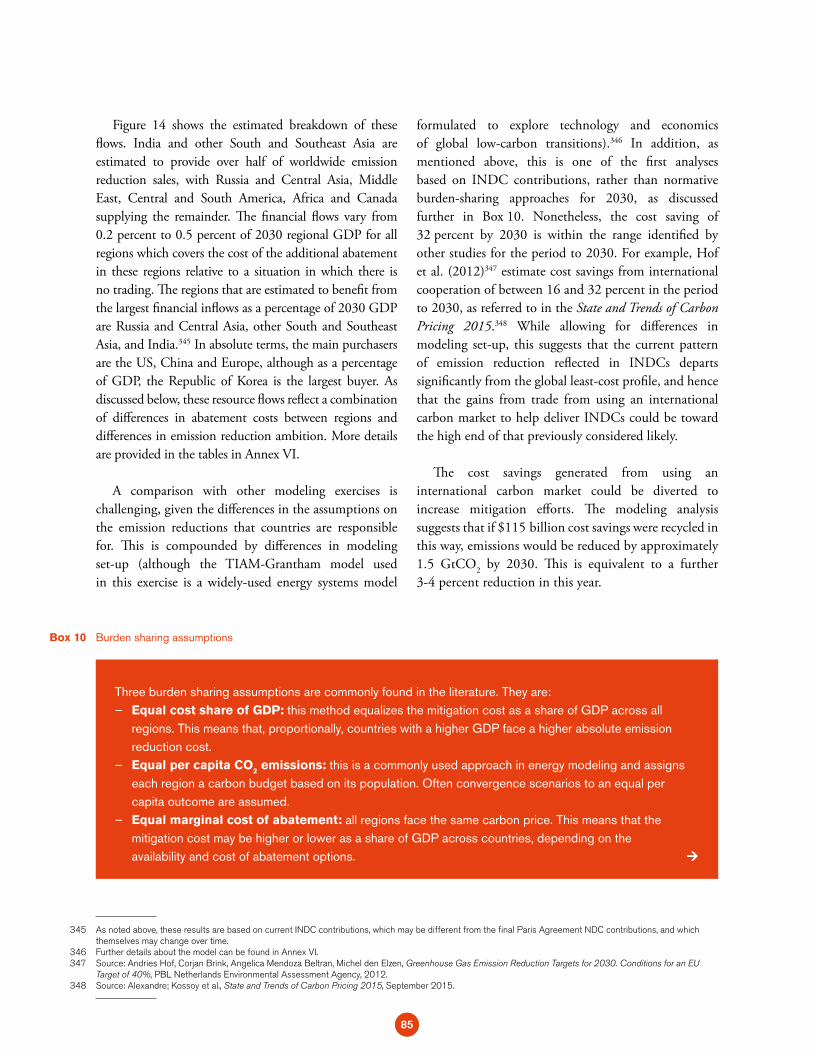
Figure 14 shows the estimated breakdown of these flows. India and other South and Southeast Asia are estimated to provide over half of worldwide emission reduction sales, with Russia and Central Asia, Middle East, Central and South America, Africa and Canada supplying the remainder. The financial flows vary from 0.2 percent to 0.5 percent of 2030 regional GDP for all regions which covers the cost of the additional abatement in these regions relative to a situation in which there is no trading. The regions that are estimated to benefit from the largest financial inflows as a percentage of 2030 GDP are Russia and Central Asia, other South and Southeast Asia, and India.345 In absolute terms, the main purchasers are the US, China and Europe, although as a percentage of GDP, the Republic of Korea is the largest buyer. As discussed below, these resource flows reflect a combination of differences in abatement costs between regions and differences in emission reduction ambition. More details are provided in the tables in Annex VI.
A comparison with other modeling exercises is
challenging, given the differences in the assumptions on the emission reductions that countries are responsible for. This is compounded by differences in modeling set-up (although the TIAM-Grantham model used in this exercise is a widely-used energy systems model
formulated to explore technology and economics of global low-carbon transitions).346 In addition, as mentioned above, this is one of the first analyses based on INDC contributions, rather than normative burden-sharing approaches for 2030, as discussed further in Box 10. Nonetheless, the cost saving of 32 percent by 2030 is within the range identified by other studies for the period to 2030. For example, Hof et al. (2012)347 estimate cost savings from international cooperation of between 16 and 32 percent in the period to 2030, as referred to in the State and Trends of Carbon Pricing 2015.348 While allowing for differences in modeling set-up, this suggests that the current pattern of emission reduction reflected in INDCs departs significantly from the global least-cost profile, and hence that the gains from trade from using an international carbon market to help deliver INDCs could be toward the high end of that previously considered likely.
The cost savings generated from using an international carbon market could be diverted to increase mitigation efforts. The modeling analysis suggests that if $115 billion cost savings were recycled in this way, emissions would be reduced by approximately 1.5 GtCO2 by 2030. This is equivalent to a further 3-4 percent reduction in this year.
345 As noted above, these results are based on current INDC contributions, which may be different from the final Paris Agreement NDC contributions, and which themselves may change over time.
346 Further details about the model can be found in Annex VI.347 Source: Andries Hof, Corjan Brink, Angelica Mendoza Beltran, Michel den Elzen, Greenhouse Gas Emission Reduction Targets for 2030. Conditions for an EU
Target of 40%, PBL Netherlands Environmental Assessment Agency, 2012.348 Source: Alexandre; Kossoy et al., State and Trends of Carbon Pricing 2015, September 2015.
Burden sharing assumptionsBox 10
Three burden sharing assumptions are commonly found in the literature. They are: – Equal cost share of GDP: this method equalizes the mitigation cost as a share of GDP across all
regions. This means that, proportionally, countries with a higher GDP face a higher absolute emission reduction cost.
– Equal per capita CO2 emissions: this is a commonly used approach in energy modeling and assigns each region a carbon budget based on its population. Often convergence scenarios to an equal per capita outcome are assumed.
– Equal marginal cost of abatement: all regions face the same carbon price. This means that the mitigation cost may be higher or lower as a share of GDP across countries, depending on the availability and cost of abatement options.
85
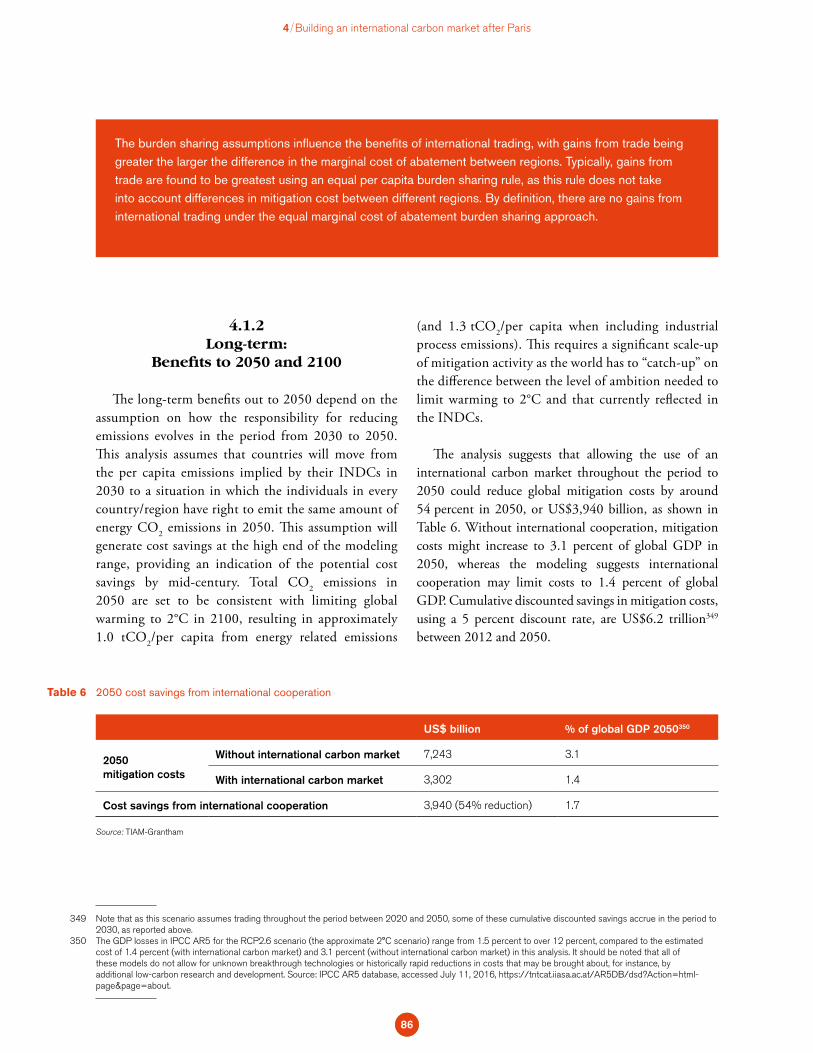
349 Note that as this scenario assumes trading throughout the period between 2020 and 2050, some of these cumulative discounted savings accrue in the period to 2030, as reported above.
350 The GDP losses in IPCC AR5 for the RCP2.6 scenario (the approximate 2°C scenario) range from 1.5 percent to over 12 percent, compared to the estimated cost of 1.4 percent (with international carbon market) and 3.1 percent (without international carbon market) in this analysis. It should be noted that all of these models do not allow for unknown breakthrough technologies or historically rapid reductions in costs that may be brought about, for instance, by additional low-carbon research and development. Source: IPCC AR5 database, accessed July 11, 2016, https://tntcat.iiasa.ac.at/AR5DB/dsd?Action=html-page&page=about.
4.1.2Long-term:
Benefits to 2050 and 2100
The long-term benefits out to 2050 depend on the assumption on how the responsibility for reducing emissions evolves in the period from 2030 to 2050. This analysis assumes that countries will move from the per capita emissions implied by their INDCs in 2030 to a situation in which the individuals in every country/region have right to emit the same amount of energy CO2 emissions in 2050. This assumption will generate cost savings at the high end of the modeling range, providing an indication of the potential cost savings by mid-century. Total CO2 emissions in 2050 are set to be consistent with limiting global warming to 2°C in 2100, resulting in approximately 1.0 tCO2/per capita from energy related emissions
(and 1.3 tCO2/per capita when including industrial process emissions). This requires a significant scale-up of mitigation activity as the world has to “catch-up” on the difference between the level of ambition needed to limit warming to 2°C and that currently reflected in the INDCs.
The analysis suggests that allowing the use of an international carbon market throughout the period to 2050 could reduce global mitigation costs by around 54 percent in 2050, or US$3,940 billion, as shown in Table 6. Without international cooperation, mitigation costs might increase to 3.1 percent of global GDP in 2050, whereas the modeling suggests international cooperation may limit costs to 1.4 percent of global GDP. Cumulative discounted savings in mitigation costs, using a 5 percent discount rate, are US$6.2 trillion349 between 2012 and 2050.
4 Building an international carbon market after Paris
2050 cost savings from international cooperationTable 6
US$ billion % of global GDP 2050350
2050 mitigation costs
Without international carbon market 7,243 3.1
With international carbon market 3,302 1.4
Cost savings from international cooperation 3,940 (54% reduction) 1.7
Source: TIAM-Grantham
The burden sharing assumptions influence the benefits of international trading, with gains from trade being greater the larger the difference in the marginal cost of abatement between regions. Typically, gains from trade are found to be greatest using an equal per capita burden sharing rule, as this rule does not take into account differences in mitigation cost between different regions. By definition, there are no gains from international trading under the equal marginal cost of abatement burden sharing approach.
86
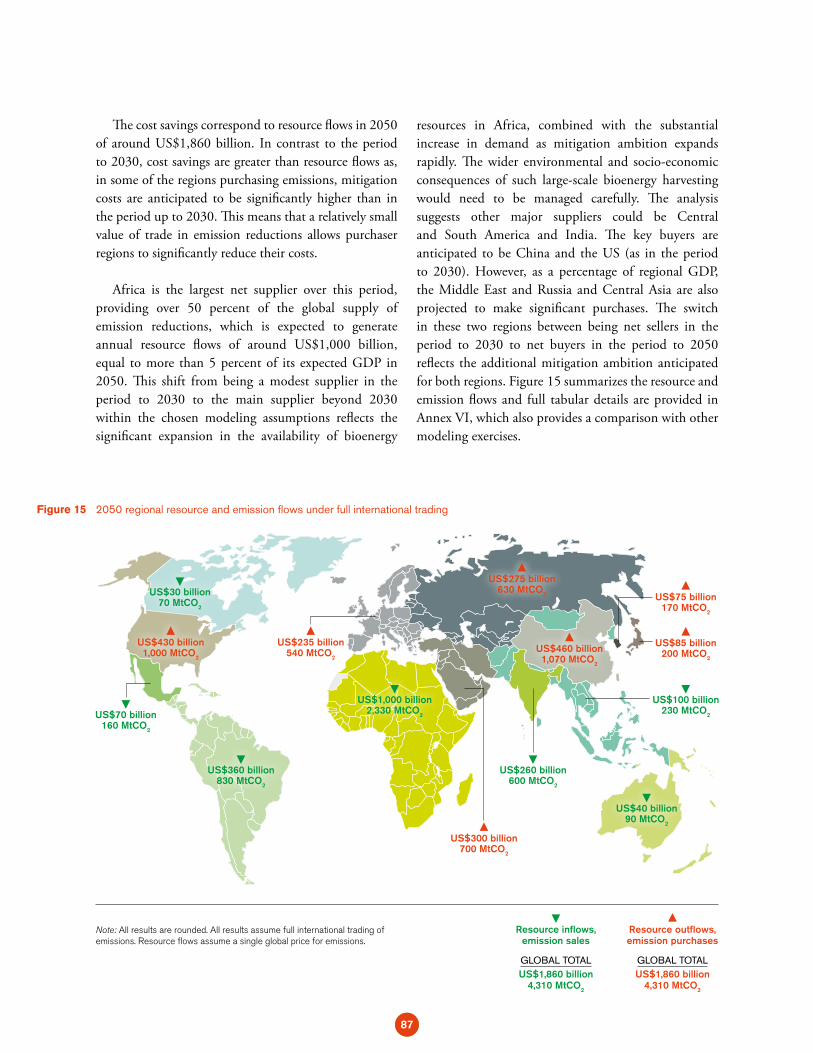
The cost savings correspond to resource flows in 2050 of around US$1,860 billion. In contrast to the period to 2030, cost savings are greater than resource flows as, in some of the regions purchasing emissions, mitigation costs are anticipated to be significantly higher than in the period up to 2030. This means that a relatively small value of trade in emission reductions allows purchaser regions to significantly reduce their costs.
Africa is the largest net supplier over this period, providing over 50 percent of the global supply of emission reductions, which is expected to generate annual resource flows of around US$1,000 billion, equal to more than 5 percent of its expected GDP in 2050. This shift from being a modest supplier in the period to 2030 to the main supplier beyond 2030 within the chosen modeling assumptions reflects the significant expansion in the availability of bioenergy
resources in Africa, combined with the substantial increase in demand as mitigation ambition expands rapidly. The wider environmental and socio-economic consequences of such large-scale bioenergy harvesting would need to be managed carefully. The analysis suggests other major suppliers could be Central and South America and India. The key buyers are anticipated to be China and the US (as in the period to 2030). However, as a percentage of regional GDP, the Middle East and Russia and Central Asia are also projected to make significant purchases. The switch in these two regions between being net sellers in the period to 2030 to net buyers in the period to 2050 reflects the additional mitigation ambition anticipated for both regions. Figure 15 summarizes the resource and emission flows and full tabular details are provided in Annex VI, which also provides a comparison with other modeling exercises.
2050 regional resource and emission flows under full international trading Figure 15
US$30 billion70 MtCO2
US$430 billion1,000 MtCO2
US$460 billion1,070 MtCO2
US$75 billion170 MtCO2
US$85 billion200 MtCO2
US$40 billion90 MtCO2
US$1,000 billion2,330 MtCO2
US$360 billion830 MtCO2
US$300 billion700 MtCO2
US$275 billion630 MtCO2
US$100 billion230 MtCO2
US$260 billion600 MtCO2
US$70 billion160 MtCO2
US$235 billion540 MtCO2
Note: All results are rounded. All results assume full international trading of emissions. Resource flows assume a single global price for emissions.
Resource inflows,
emission sales
GLOBAL TOTAL US$1,860 billion
4,310 MtCO2
Resource outflows, emission purchases
GLOBAL TOTAL US$1,860 billion
4,310 MtCO2
87
351 Source: Igor Shishlov, Romain Morel, and Valentin Bellassen, “Compliance of the Parties to the Kyoto Protocol in the First Commitment Period,” Climate Policy (2016): 1–15, doi:10.1080/14693062.2016.1164658.
352 Source: California Environmental Protection Agency: Air Resources Board, “Auction Information,” 2016; Government of Québec, Québec’s Cap-and-Trade System for Greenhouse Gas Emission Allowances: Technical Overview, 2014.
353 Source: Matthew Ranson and Robert N. Stavins, “Linkage of Greenhouse Gas Emissions Trading Systems : Learning from Experience,” Climate Policy Vol 15, Issue February (2015): 37–41, doi:10.1080/14693062.2014.997658.
Beyond 2050, the modeling analysis suggests that an international transfers of mitigation outcomes are imperative to realizing the goal of keeping the average global temperature increase to below 2°C (assuming countries would be responsible for reducing emissions on an equal per capita basis). Indeed, the model suggests that in some regions, there would not be sufficient abatement potential to achieve this level of emission reduction without recourse to emission reductions in third countries. This challenge is particularly acute in the Republic of Korea and the Middle East where this modeling assessment suggests that there are insufficient carbon sinks within these regions to offset emissions from other sectors such as industrial manufacturing, aviation and shipping.
This dynamic points to a broader consideration regarding the long-term need for an international carbon market and interaction with the need for negative-emission technologies.
4.2BARRIERS TO
ESTABLISHING AN INTERNATIONAL CARBON MARKET
4.2.1Introduction
The international carbon market has already played an important role in some jurisdictions. Much of the activity has been associated with the flexibility mechanisms of the Kyoto Protocol: IET—trading of emission allowances between countries with Kyoto Protocol targets; Joint Implementation—trading of credits from emission reduction projects between countries that each adopted Kyoto Protocol targets; and the CDM—trading of credits from emission reduction projects located in a country without a Kyoto Protocol target. A recent analysis of compliance during the first commitment
period of the Kyoto Protocol (2008–2012) showed that 36 Annex B Parties met their targets. Ukraine was the only Annex B country that was not in full compliance with the Protocol in CP1 as it did not meet the compliance deadline. Nine countries made use of these flexibility mechanisms to ensure compliance.351 Some of the most active buyers were New Zealand, Japan and certain EU countries. Poland, Romania and the Czech Republic were the most important Annex B countries on the supply side. In addition to these international mechanisms, there are various examples of international linking between ETSs, including between California and Québec.352
At the same time, the global significance of the international carbon market has remained limited, as well as fragmented and modest in scope. For instance, the linkage of domestic ETSs has been geographically bound, with no direct links between continents such as Europe and North America.353 In addition, despite the importance of flexibility mechanisms for some countries during the first Kyoto Protocol commitment period, the use of these mechanisms has diminished substantially since 2012 (refer to Section 2.2 for further discussion).
In addition to the low ambition committed under the Kyoto Protocol and barriers related to capacity and investment finance in many developing countries, the limited market-based cooperation to date can be attributed to several other barriers. Most of these are political in nature, but also have technical aspects. These include fears over the potential loss of domestic regulatory control, co-benefits and environmental integrity, a lack of comparable ambition between cooperating countries, potentially inequitable results for national income and market uncertainty. This section examines each of these major barriers to cooperation through an international carbon market, identifying where they are more or less appropriate for different approaches to an international carbon market. This analysis is informed by theory and grounded in the experience of different jurisdictions.
4 Building an international carbon market after Paris
88

4.2.2Market uncertainty
A key barrier to international cooperation is uncertainty about the future, particularly over target achievement and market conditions. Jurisdictions that modeling suggests should be net providers of emission reductions may be unwilling to do so if they remain unconvinced of their ability to meet their domestic targets. The same uncertainty applies to buyers who will need assurance that there will be adequate supply if they are to make use of the international carbon market as a key component of their strategy for delivering their contributions. In practice, countries and firms will often want to access the international market as both sellers and buyers at different points in time354 (even if they are a “net” seller or buyer in the longer term) but will be unable to do so if there is insufficient market liquidity.
This is a fundamental barrier that applies to all carbon market approaches (linking, offset usage and international trading). It will be exacerbated in countries that are likely to be net sellers if domestic policies and regulations are not fully in place to deliver emission reductions. In addition, this barrier is intensified if there is uncertainty on the alignment of domestic MRV arrangements with international standards. It will also be compounded if there is uncertainty at the international level over the standards or norms governing international carbon market access. While such fears over uncertainty are currently difficult to measure, they are real and tangible barriers to cooperation.
4.2.3Loss of environmental
integrity
Loss of environmental integrity is a risk inherent in international cooperation. When cooperating, the environmental integrity of the coordinated system can be compromised by weak integrity in one jurisdiction.
While in principle this can in part be allayed through stringent and comparable MRV, poor standards in MRV and oversight in a participating jurisdiction could undermine the entire scheme.
This risk has posed a substantial challenge to the use of offsets in the past and led to complex rules and procedure on offset generation. Additionality—establishing that the offset reflects a genuine emission reduction that would not have occurred without the prospect of selling the credit—has been a central topic in CDM regulation from the start of this mechanism.355 While project-by-project additionality testing dominated under the CDM, recent trends in CDM regulation moved the concept of additionality to more objective ground, introducing standardized baselines that embed additionality.
A related environmental integrity challenge is double counting, with the risk that efforts to reduce emissions might be included both as a contribution to meeting targets in the country of origin, as well as in the country that pays for the emission reduction. Again, this is a challenge that is most likely to arise when using offsets, although there could be similar problems with IET if national emissions inventories are not well developed, and linking if ETS registries are not adequately regulated.
To address environmental integrity concerns, solutions include either disengaging from cooperative practices or finding more deeply cooperative solutions. As an example of the latter approach, addressing double counting of units can be achieved through cooperation to ensure consistent and stringent international accounting, tracking, reporting and allocation of units.356 This is reflected in the first paragraph of Article 6 of the Paris Agreement, which promotes environmental integrity, while the second paragraph establishes the need for “robust accounting”, including the avoidance of double counting. Other cooperative measures that
354 For instance, under the first phase of the Kyoto Protocol, Switzerland’s trading volume was 13 times the amount of its initial allocation of AAUs. Source: Igor Shishlov, Romain Morel, and Valentin Bellassen, “Compliance of the Parties to the Kyoto Protocol in the First Commitment Period,” Climate Policy (2016): 1–15, doi:10.1080/14693062.2016.1164658.
355 Source: Stefan Bakker et al., “The Future of the CDM: Same Same, but Differentiated?,” Climate Policy Vol 11, Issue 2011 (2011): 752–767, doi:10.3763/cpol.2009.0035; Niklas Höhne, “Policy: Changing the Rules,” Nature Climate Change Vol 1, Issue 1 (2011): 31–33, doi:10.1038/nclimate1073.
356 Source: Lambert Schneider, Anja Kollmuss, and Michael Lazarus, “Addressing the Risk of Double Counting Emission Reductions under the UNFCCC,” Climatic Change (2015): 473–486, doi:10.1007/s10584-015-1398-y.
89
357 Source: Andy Haines et al., “Public Health Benefits of Strategies to Reduce Greenhouse-Gas Emissions: Overview and Implications for Policy Makers,” The Lancet Vol 374, Issue 9707 (2009): 2104–2114, doi:10.1016/S0140-6736(09)61759-1; By Nicholas Z Muller, Robert Mendelsohn, and William Nordhaus, “In the United States Economy,” American Economic Review Vol 101, Issue August (2011): 1649–1675, doi:10.1257/aer.101.5.1649.
358 Source: Antoine Dechezlepretre and Misato Sato, The Impacts of Environmental Regulations on Industrial Activity: Evidence, 2014; Yongsheng Zhang and He-Ling Shi, “From Burden-Sharing to Opportunity-Sharing: Unlocking the Climate Negotiations,” Climate Policy Vol 14, Issue 1 (2014): 63–81, doi:10.1080/14693062.2014.857979.
359 Source: IPCC, Climate Change 2014: Mitigation of Climate Change: Working Group III Contribution to the Fifth Assessment Report of the Intergovernmental Panel on, ed. T. Zwickel and J.C. Minx Edenhofer, O., R. Pichs-Madruga, Y. Sokona, E. Farahani, S. Kadner, K. Seyboth, A. Adler, I. Baum, S. Brunner, P. Eickemeier, B. Kriemann, J. Savolainen, S. Schlömer, C. von Stechow (Cambridge: Cambridge University Press, 2014).
360 Source: Fei Teng and Frank Jotzo, “Reaping the Economic Benefits of Decarbonization for China,” China and World Economy Vol 22, Issue 5 (2014): 37–54, doi:10.1111/j.1749-124X.2014.12083.x.
361 Source: IEA, World Energy Outlook 2016 Special Report: Energy and Air Pollution (Paris, 2016).362 Source: Christian Flachsland, Robert Marschinski, and Ottmar Edenhofer, “To Link or Not to Link: Benefits and Disadvantages of Linking Cap-and-Trade
Systems,” Climate Policy Vol 9, Issue 4 (2009): 358–372, doi:10.3763/cpol.2009.0626.363 Source: David Popp, “Pollution Control Innovations and the Clean Air Act of 1990,” Journal of Policy Analysis and Management, 2003, doi:10.1002/pam.10159;
David Gerard and Lester B. Lave, “Implementing Technology-Forcing Policies: The 1970 Clean Air Act Amendments and the Introduction of Advanced Automotive Emissions Controls in the United States,” Technological Forecasting and Social Change Vol 72, Issue 7 (2005): 761–778, doi:10.1016/j.tech-fore.2004.08.003.
364 Source: Hege Westskog, “Why Should Emissions Trading Be Restricted,” Climate Policy Vol 2, Issue 1 (2002): 97–103, doi:10.1016/S1469-3062(02)00009-8; World Bank Group, Emissions Trading in Practice (Washington, 2016).
can promote environmental integrity include agreeing common standards for MRV and, in the case of market linking, comparable enforcement measures to deal with compliance failures or to address fraud.
4.2.4Potential loss of
co-benefits
All options for an international carbon market involve some jurisdictions making fewer domestic emission reductions than they would make if an international carbon market is not available. While this drives cost savings because the emission reductions take place where abatement is cheaper, it can also lead to the loss of domestic co-benefits.
There are numerous domestic co-benefits of mitigation that are unrelated to climate change, including health benefits due to reduced local air pollutants,357 low-carbon innovation358 and energy security.359 For some countries such as China, these co-benefits are a major driver of emission reduction efforts.360 The co-benefit of reduced air pollution has received a particularly large amount of attention. A recent report by the International Energy Agency (IEA) estimated that globally, 6.5 million fatalities per year can be attributed to energy-related air pollution.361 Such losses also have significant economic implications.
This loss of co-benefits can be a significant barrier to cooperation, but can also often be relatively easily addressed. One way is through the use of additional policies and instruments targeted toward co-benefits,
such as air pollution standards.362 For example, in many countries, such as the US under the Clean Air Act, reductions in many pollutants were in part driven by end-of-pipe technical solutions (such as scrubbers), which allow improvements in air quality to be made independently of the level of CO2 emissions.363
Countries have also made use of partial cooperation in order to allow for the transfer of mitigation outcomes while ensuring a desired level of domestic abatement. Setting a minimum level of domestic abatement is often a politically feasible approach to cooperation that allows for the achievement of co-benefits and can also partially address concerns over environmental integrity.364 However, while this approach of restricted cooperation can be applied to any international carbon market approach, it will also reduce the potential for gains from trade.
4.2.5Comparability of effort and prices
One of the outcomes of the bottom-up system of NDCs that will be established as a result of the Paris Agreement is a diversity of mitigation efforts and targets. This partially reflects the principle of common but differentiated responsibilities and respective capabilities, in light of different national circumstances. These differences, on the one hand, strengthen the rationale and benefits that an international carbon market can provide. However, on the other hand, they can also create political and/or technical challenges in using the international carbon market, especially when considering linking and/or IET.
4 Building an international carbon market after Paris
90
As noted above, substantial gains from using an international carbon market can be realized when there are large differences between the (marginal) costs of emission reductions across jurisdictions. In jurisdictions using a domestic ETS, this is reflected in differences in the domestic carbon price. In this case, the abatement effort can be transferred from locations where marginal costs are high to locations where they are low, with financial transfers flowing in the opposite direction, creating gains from trade.
However, (marginal) abatement costs can differ for two reasons. Firstly, the underlying technical characteristics of abatement opportunities may be more expensive in one location compared with another. Secondly, the level of ambition will influence the (marginal) cost of abatement. A jurisdiction with low ambition will only need to use low-cost abatement opportunities domestically and hence will have a low marginal abatement cost/domestic carbon price, and plentiful opportunities to sell into an international market. The opposite is true for a country with greater ambition.
Broadly speaking, differences in marginal abatement costs arising from differences in the underlying technical characteristics of abatement opportunities are unlikely to represent a significant barrier to using an international carbon market.365 In contrast, the dynamics that arise from differences in ambition may be more problematic. On the one hand, gains from trade will still be significant. On the other hand, higher-ambition jurisdictions may be wary of being seen to endorse or benefit from the lower ambition of other countries,366 especially as the financial transfers that would flow toward low-ambition countries might be seen as a reward or an incentive for keeping ambition low.
In practice, experience suggests that a certain
comparability in ambition is often a precondition for accepting cooperative arrangements, either in the form of IET or linking ETSs. For example, emissions trading
under the Kyoto Protocol, which is the only example of an IET, was premised on an agreement on comparable, politically negotiated targets. Developing countries not part of the political agreement on effort-sharing could not engage in trading. Moreover, many countries under the Kyoto Protocol refused to buy permits from countries that were perceived to lack ambition in their efforts. Similarly, the California Air Resources Board, has cited EU carbon market prices as one factor inhibiting linkage with the California ETS.367
Comparability of effort can also create technical challenges, especially when considering linking between ETSs that have different types of target. In particular, it can be technically difficult to link jurisdictions/systems with emissions intensity targets to those with absolute targets. This can be due to concerns about liquidity shocks, competitiveness and environmental integrity.368
4.2.6Loss of regulatory
control
A significant political concern in cooperation through market linking is the potential for loss of control over domestic market design and regulation. In particular, policymakers often express concern about the reduced ability to affect the domestic carbon price given the wider economic implications that fluctuations in the price may have on, for example, energy poverty or industrial competitiveness. This barrier is less important for coordination through IET and the use of offsets. In the case of IET, countries can engage in international trading without domestic policy implications. In the case of offsets, countries can set and modify rules over the quantity of offsets that can be used and the sources of emission reductions from which they are derived. Such rules are already applied in ETSs, for example, in the Chinese pilot ETSs, California, the EU, New Zealand, Québec, the Republic of Korea and Tokyo.369
365 Although under market linking, jurisdictions with higher carbon prices may be concerned that the reduction in the domestic carbon price from linking, even if brought about by access to lower-cost abatement opportunities, could jeopardize medium-to-long-run incentives for low-carbon investment and innovation.
366 Source: Christian Flachsland, Robert Marschinski, and Ottmar Edenhofer, “To Link or Not to Link: Benefits and Disadvantages of Linking Cap-and-Trade Systems,” Climate Policy Vol 9, Issue 4 (2009): 358–372, doi:10.3763/cpol.2009.0626.
367 Although in this case, at least part of the difference in price between the two ETSs was driven by banking of units from earlier phases of the EU ETS. Source: Debra Kahn, “E.U. Market Troubles Will Prevent Emissions Trade Linkage -- Calif. Air Chief,” ClimateWire, 2013.
368 Source: Andreas Tuerk et al., “Linking Carbon Markets: Concepts, Case Studies and Pathways,” Climate Policy Vol 9, Issue 4 (2009): 341–357, doi:10.3763/cpol.2009.0621.
369 Source: The World Bank Group, Partnership for Market Readiness, and International Carbon Action Partnership, Emissions Trading in Practice: A Handbook on Design and Implementation (Washington D.C., 2016).
91
370 Source: Frank Jotzo and Regina Betz, “Australia’s Emissions Trading Scheme: Opportunities and Obstacles for Linking,” Climate Policy Vol 9, Issue 4 (2009): 402–414, doi:10.3763/cpol.2009.0624; Andreas Tuerk et al., “Linking Carbon Markets: Concepts, Case Studies and Pathways,” Climate Policy Vol 9, Issue 4 (2009): 341–357, doi:10.3763/cpol.2009.0621.
371 Source: World Bank Group, Emissions Trading in Practice (Washington, 2016).372 Source: Elizabeth M Bailey et al., “Issue Analysis: Linkage with Quebec in California’s Greenhouse Gas Emissions Cap-and-Trade Market” (2012): 1–5.Source: N.
Keohane, A. Petsonk, and A. Hanafi, “Toward a Club of Carbon Markets,” Climatic Change Issue March (2015), doi:10.1007/s10584-015-1506-z.373 Source: Clean Energy Amendment (International Emissions Trading and Other Measures) Bill 2012 (Canberra: Australian House of Representatives, 2012).374 Source: California Environmental Protection Agency: Air Resources Board, “Auction Information,” 2016; Government of Québec, Québec’s Cap-and-Trade System
for Greenhouse Gas Emission Allowances: Technical Overview, 2014.375 Source: European Commission, “Press Release - FAQ: Linking the Australian and European Union Emissions Trading Systems,” 2012. These were planned
modifications that never came into effect. The Australian Carbon Pricing Mechanism was repealed in 2014—a move which prevented the eventual linkage plans.376 This is discussed more fully in Section 3 on policy alignment.
However, when linking ETSs, the rules of one system can often have major implications for any connected system. For example, the use of cost containment measures, level of stringency and the eligibility of offsets will often need to be harmonized in order for properly functioning linking to occur. A price cap or floor in one jurisdiction will automatically apply to the entire market including the linked system.370 Similarly, if offsets are allowed in one market, they will affect the price and supply of units in other linked systems, even if they are not eligible for sale there. Given these implications, the harmonization of design features is needed to ensure proper functioning, environmental integrity and price stability.371 This requirement may be less important in the case of heterogeneous linking (see Box 11 below). The development of common rules on such politically sensitive matters has not always been easily achieved. For example, California and Québec initially adopted offsets protocols that differed, although with their Western Climate Initiative partner jurisdictions, they collectively developed a set of basic principles and common criteria for the offset protocols.372 For these programs to be linked, both partners needed to be assured that the offsets generated under the protocols meet the same environmental criteria of being real, additional, verifiable, enforceable, and permanent. They have also agreed to collaborate on the development of new protocols, for example mine methane protocols.
Australia is an example of how changes in regulatory measures are often needed for linking. The Australian Carbon Pricing Mechanism was introduced through the 2011 Clean Energy Act. The system was designed to operate as a fixed-price system for the first three years, before moving to a floating price with a price floor and ceiling. This arrangement met political imperatives and provided price stability and certainty. Allowing
international linking to the EU ETS required a suite of amendments to the original Act, including abolishing the price floor, restricting the number of international units that could be surrendered by liable entities and modifications to national registries.373
While loss of domestic control could be a substantial barrier to cooperation, this has not yet proven to be the case for linking systems. Existing linkages, such as between Québec and California, have seen the development of common cost containment measures and compliance periods, joint auctions and the development of harmonized offset protocols.374 Similarly, as noted above, Australia passed legislative amendments to remove the existing price floor and put in place measures to enable linking with the EU ETS in 2015.375 This suggests that other challenges, such as those discussed around comparability and environmental integrity, may be more pressing barriers to cooperation through an international carbon market.
4.2.7Undesirable distributional
implications
Cooperation through the linking of ETSs may have undesirable distributional implications. While linking may be desirable at an aggregate level, it will cause the carbon price to rise in the jurisdiction(s) with the lower price(s). This can exacerbate the common challenge that, in particular in developed countries, carbon pricing can have regressive impacts: it tends to lead to proportionally larger economic losses for lower-income households and disadvantaged groups.376 Similarly, firms in the jurisdiction(s) which experience(s) higher prices may face increased competitiveness concerns, especially if they are net buyers of emissions.
4 Building an international carbon market after Paris
92
However, carbon market design can alleviate inequities at both a household and industrial level. Indeed, the increase in prices experienced in the affected jurisdiction increases the potential revenues available from auctioning allowances, which can be used to provide such support. The options for supporting affected households are discussed briefly in Section 3.1.1 of the report, while the State and Trends of Carbon Pricing 2015 discusses competitiveness in more detail.
4.3BEYOND BARRIERS:
POTENTIAL WAYS FORWARD
There are numerous ways to overcome the barriers to cooperation. These range from less intrusive approaches such as informal collaboration, through to more politically engaged solutions such as the establishment of sectoral agreements and/or the setting of international standards. Many of these proposed solutions already exist or are being trialed. This section considers these practical ways forward, connecting them to the particular barriers they address, as well as the international carbon market approaches they best enable.
4.3.1Collaboration and
market design
Cooperation often involves a trade-off between political feasibility and efficiency. An incremental approach beginning with informal collaboration can help build the necessary political foundations for more concrete cooperative practices.377 Such collaborative measures include MoUs, the sharing of best-practice models and information, advice on market design
and informal agreements on design measures.378 This allows for trust and consensus on market design to be built gradually. Harmonization can then occur over time without a sudden loss of regulatory control and can help ensure best practice that addresses concerns over environmental integrity. This can provide the political basis for future market linkages, offsets or the establishment of IET.
New and existing networks can be used to facilitate collaboration. Some of the existing political and technical platforms that encourage collaboration are discussed in Annex II. Bilateral collaboration can also offer a basis for more formal cooperation. For example, Mexico and California have signed a MoU on cooperation on climate change and the environment in 2014,379 and more recently with Ontario and Québec.380 This established coordination across a range of areas including intellectual property and the development of domestic carbon markets. Bilateral assistance can also play an important role. For example, the EU is providing technical assistance to China in the development of its future ETS,381 as well as technical assistance to the Republic of Korea on issues necessary for the implementation and operation of the Korean ETS in the first phase and the development of its second phase.
4.3.2Finance
Finance is a key pillar of international cooperation besides an international carbon market. It provides developing countries with financial resources that can be invested in low-carbon technologies and that can support a broad range of domestic climate policies. The interaction of international climate finance and carbon market mechanisms is an important topic to look at to unlock synergies and to take advantage of the potential
377 Source: Jessica F. Green, Thomas Sterner, and Gernot Wagner, “A Balance of Bottom-up and Top-down in Linking Climate Policies,” Nature Climate Change Vol 4, Issue 12 (2014): 1064–1067, doi:10.1038/nclimate2429.
378 Source: Andreas Tuerk et al., “Linking Carbon Markets: Concepts, Case Studies and Pathways,” Climate Policy Vol 9, Issue 4 (2009): 341–357, doi:10.3763/cpol.2009.0621; Jessica F. Green, Thomas Sterner, and Gernot Wagner, “A Balance of Bottom-up and Top-down in Linking Climate Policies,” Nature Climate Change Vol 4, Issue 12 (2014): 1064–1067, doi:10.1038/nclimate2429.
379 Source: The State of California, SEMARNAT and CONAFOR, Memorandum of Understanding to Enhance Cooperation on Climate Change and the Environment Between the State of California of the United States of America and the Ministry of Environment and Natural Resources and the National Forestry Commission of the United Mexican States, 2014.
380 Source: Government of Ontario, Joint Declaration Between the Ministry of Environment and Natural Resources of the United Mexican States, the Government of Ontario, and the Gouvernement Du Québec, August 31, 2016, https://news.ontario.ca/opo/en/2016/08/joint-declaration-between-the-ministry-of- environment-and-natural-resources-of-the-united-mexican-st.html.
381 Source: European Commission, “International Carbon Market,” n.d. Source: The European Council; and Peoples Republic of China., EU-China Joint Statement on Climate Change, 2015.
93
382 Source: Carsten Warnecke et al., “Connecting the Dots - Results-Based Financing in Climate Policy” (2015): 34.383 In a similar way, the CDM has been attributed as playing a key role in increasing confidence in the use of carbon pricing in China and hence the development of
the Chinese pilot ETS and the impending national ETS. Source: CDM Policy Dialogue, Climate change, carbon markets and the CDM: A Call to Action. Report of the High Level Panel of the CDM Policy Dialogue, 2011.
384 Source: Vivid Economics, The Implicit Price of Carbon in the Electricity Sector of Six Major Economies, 2010; OECD, Effective Carbon Rates on Energy: OECD and Selected Partner Economies, 2015.
385 Source: Peter Wooders et al., Supporting Energy Pricing Reform and Carbon Pricing Policies Through Crediting, 2016.
of climate finance, in particular RBCF, to build markets. Although this topic is not yet well explored in the literature, the discussion below provides a broad overview.
Finance can help to build the capacities and experience necessary for market-based cooperation and is often a valuable complement to technical assistance and information exchange. The PMR, as an example, provides grant funding to support country-identified initiatives related to carbon pricing. Many of the activities it funds, such as support for the development and strengthening of MRV or support for the development and use of offset protocols, help build capacity and trust and hence facilitate the greater use of international carbon market solutions.
RBCF is particularly adept at helping to build an international carbon market. It is an approach where funding is conditional upon the verified achievement of predefined goals.382 Payment is based on outputs, such as emission reductions, not inputs. This provides assurance to the funder and a continued financing flow for the recipient.
One of the main ways in which RBCF can help support the development of an international carbon market is through supporting the development of a robust MRV infrastructure. Historically, RBCF used existing MRV schemes set up for international cooperation. For instance, Ci-Dev made use of MRV systems already in place from the CDM. However, there is also the opportunity for this process to work in reverse: RBCF projects can help to create the necessary transparency and MRV infrastructure that will facilitate an international carbon market.
Beyond this, RBCF can be a way of building familiarity
and confidence in policy instruments that put a price on carbon. In particular, it shares with domestic carbon pricing instruments the principle that the precise way in
which emission reductions are delivered is unspecified—in theory, it is only important that the emission reduction is delivered. If RBCF is successful in unlocking emission reductions from multiple, potentially unexpected sources, it may build domestic confidence in the ability of a country to deliver emission reductions at scale using carbon pricing instruments.383 Overall, RBCF offers an important option that is available in the short term that could help to build a new international carbon market.
4.3.3Comparing mitigation effort
As explored in Section 4.2.5, one of the key barriers to international carbon market activity, especially through IET and/or linking, are differences in marginal abatement costs between jurisdictions driven by differences in the level of ambition (as opposed to differences in the technical costs of the underlying abatement opportunities).
One way to overcome this barrier could be analytical work to assess the degree of effort being made by countries. A range of studies have assessed the extent of mitigation efforts in different countries and examined these efforts on a range of metrics, including the strength of the incentive they provide per ton of emission reduction achieved.384
Policy crediting—calculating and crediting emission reductions due to increasing policy ambition and implementation of policies with enhanced mitigation impacts—is another way of helping compare the emission reduction effort of different jurisdictions. These can form the basis of agreements for convergence over time, while allowing jurisdictions flexibility over which domestic policies to use. While there are no real world examples, it does hold potential for a range of practices, including domestic carbon pricing.385
4 Building an international carbon market after Paris
94
Heterogeneous linkageBox 11
The growing heterogeneity in scheme design, size and maturity of mitigation efforts has made full linking, which requires a degree of regulatory harmonization, increasingly complex, costly and time-consuming. Given these issues, heterogeneous linkage is being explored as an alternative concept. The objective of a heterogeneous linkage is not to harmonize climate actions so that they could be traded on a 1:1 basis, but rather to develop trading rules for international cooperation, such as quotas or discount rates, that may be informed by a shared understanding of the relative mitigation impacts or “mitigation value” of different actions. By doing so, heterogeneous linkages could enable more jurisdictions to participate in a liquid, inclusive and scalable international carbon market, while still preserving the environmental integrity of trading.
While these approaches allow for international comparisons, they do not address political reluctance to link in cases where this reveals significant differences in effort. One option to address this would translate differences in mitigation ambition into a specific ratio or rate of exchange.386 This could then act as a basis for the international transfer of mitigation outcomes. This could provide a politically acceptable cooperative measure for countries with significant differences in ambition and could provide the basis for future IET or market linkages. Box 11 explores the concept of heterogeneous linking currently under development by the World Bank’s Networked Carbon Market initiative.
4.3.4Sectoral approaches
A sectoral approach is one that involves any form of mitigation commitment, for example, pricing systems and standards, by a particular economic sector between multiple jurisdictions. Sectoral approaches can fall under any of the outlined carbon market options. For instance, sectoral approaches can be part of an offset program, or market-based approaches in one sector such as electricity could provide the basis for partial linkage. The international trade regime has adopted similar sectoral approaches for the textiles and agriculture sectors.387
Sectoral approaches can generate a number of potential benefits including increased participation, alleviation of competitiveness concerns and greater targeting of key areas.388 They allow for countries without economy-wide climate policies to focus on sectors where action is the most urgent, cooperation is easiest and costs are lowest.389 In turn, this facilitates the inclusion of more countries, including those without economy-wide regulations. Sectoral cooperation ensures that industry competitors all undertake comparable mitigation efforts and are on a level playing field. This is likely to be particularly important for energy-intensive, trade-exposed industries such as aluminum and steel. In these ways, sectoral approaches could address barriers such as distributional concerns related to competitiveness, because competitors across multiple jurisdictions would be covered, as well as loss of co-benefits and regulatory control, as any loss of regulatory control or co-benefits will be restricted to the affected sector.
While sectoral approaches have some attractions, they are an incomplete approach to international cooperation. As fewer GHG emissions and sources of economic activity are covered, the cost savings and resource flows they can generate are smaller than in
386 Source: Justin Macinante, “Key Elements of the Mitigation Value Assessment Process,” World Bank Group - Networked Carbon Markets Issue October (2015): 1–65, doi:10.1017/CBO9781107415324.004.
387 Source: Daniel M. Bodansky, International Sectoral Agreements in a Post-2012 Climate Framework, 2007.388 Source: Jake Schmidt et al., “Sector-Based Approach to the Post-2012 Climate Change Policy Architecture,” Climate Policy Vol 8, Issue 5 (2008): 494–515,
doi:10.3763/cpol.2007.0321.389 Source: Rob Bradley et al., Slicing the Pie: Sector-Based Approaches: Issues and Options, 2007.
95
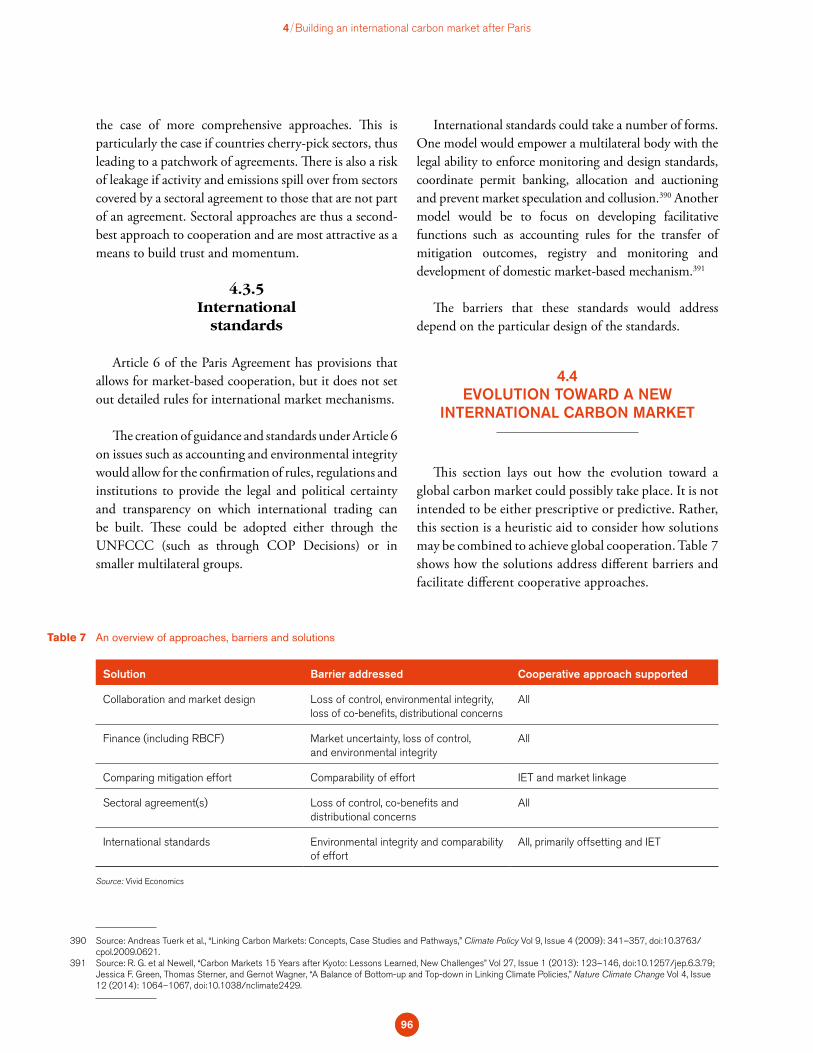
390 Source: Andreas Tuerk et al., “Linking Carbon Markets: Concepts, Case Studies and Pathways,” Climate Policy Vol 9, Issue 4 (2009): 341–357, doi:10.3763/cpol.2009.0621.
391 Source: R. G. et al Newell, “Carbon Markets 15 Years after Kyoto: Lessons Learned, New Challenges” Vol 27, Issue 1 (2013): 123–146, doi:10.1257/jep.6.3.79; Jessica F. Green, Thomas Sterner, and Gernot Wagner, “A Balance of Bottom-up and Top-down in Linking Climate Policies,” Nature Climate Change Vol 4, Issue 12 (2014): 1064–1067, doi:10.1038/nclimate2429.
the case of more comprehensive approaches. This is particularly the case if countries cherry-pick sectors, thus leading to a patchwork of agreements. There is also a risk of leakage if activity and emissions spill over from sectors covered by a sectoral agreement to those that are not part of an agreement. Sectoral approaches are thus a second-best approach to cooperation and are most attractive as a means to build trust and momentum.
4.3.5International
standards
Article 6 of the Paris Agreement has provisions that allows for market-based cooperation, but it does not set out detailed rules for international market mechanisms.
The creation of guidance and standards under Article 6 on issues such as accounting and environmental integrity would allow for the confirmation of rules, regulations and institutions to provide the legal and political certainty and transparency on which international trading can be built. These could be adopted either through the UNFCCC (such as through COP Decisions) or in smaller multilateral groups.
International standards could take a number of forms. One model would empower a multilateral body with the legal ability to enforce monitoring and design standards, coordinate permit banking, allocation and auctioning and prevent market speculation and collusion.390 Another model would be to focus on developing facilitative functions such as accounting rules for the transfer of mitigation outcomes, registry and monitoring and development of domestic market-based mechanism.391
The barriers that these standards would address depend on the particular design of the standards.
4.4EVOLUTION TOWARD A NEW
INTERNATIONAL CARBON MARKET
This section lays out how the evolution toward a global carbon market could possibly take place. It is not intended to be either prescriptive or predictive. Rather, this section is a heuristic aid to consider how solutions may be combined to achieve global cooperation. Table 7 shows how the solutions address different barriers and facilitate different cooperative approaches.
4 Building an international carbon market after Paris
An overview of approaches, barriers and solutionsTable 7
Solution Barrier addressed Cooperative approach supported
Collaboration and market design Loss of control, environmental integrity, loss of co-benefits, distributional concerns
All
Finance (including RBCF) Market uncertainty, loss of control, and environmental integrity
All
Comparing mitigation effort Comparability of effort IET and market linkage
Sectoral agreement(s) Loss of control, co-benefits and distributional concerns
All
International standards Environmental integrity and comparability of effort
All, primarily offsetting and IET
Source: Vivid Economics
96
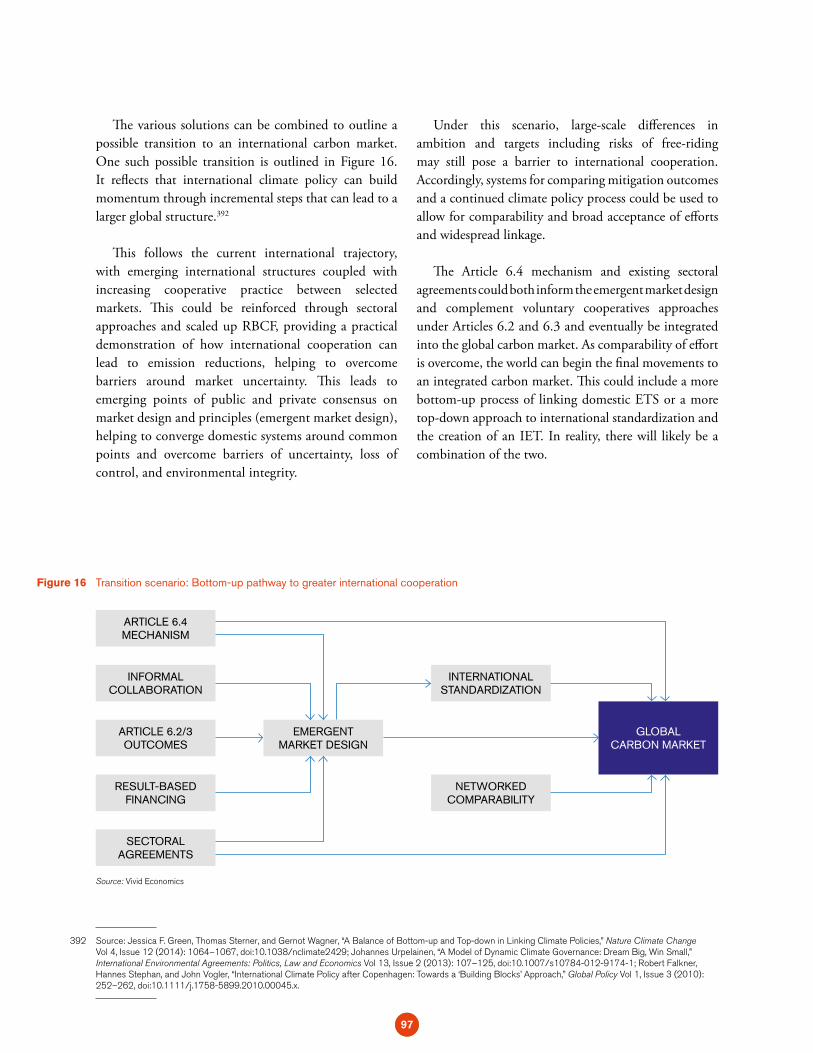
The various solutions can be combined to outline a possible transition to an international carbon market. One such possible transition is outlined in Figure 16. It reflects that international climate policy can build momentum through incremental steps that can lead to a larger global structure.392
This follows the current international trajectory, with emerging international structures coupled with increasing cooperative practice between selected markets. This could be reinforced through sectoral approaches and scaled up RBCF, providing a practical demonstration of how international cooperation can lead to emission reductions, helping to overcome barriers around market uncertainty. This leads to emerging points of public and private consensus on market design and principles (emergent market design), helping to converge domestic systems around common points and overcome barriers of uncertainty, loss of control, and environmental integrity.
Under this scenario, large-scale differences in ambition and targets including risks of free-riding may still pose a barrier to international cooperation. Accordingly, systems for comparing mitigation outcomes and a continued climate policy process could be used to allow for comparability and broad acceptance of efforts and widespread linkage.
The Article 6.4 mechanism and existing sectoral agreements could both inform the emergent market design and complement voluntary cooperatives approaches under Articles 6.2 and 6.3 and eventually be integrated into the global carbon market. As comparability of effort is overcome, the world can begin the final movements to an integrated carbon market. This could include a more bottom-up process of linking domestic ETS or a more top-down approach to international standardization and the creation of an IET. In reality, there will likely be a combination of the two.
392 Source: Jessica F. Green, Thomas Sterner, and Gernot Wagner, “A Balance of Bottom-up and Top-down in Linking Climate Policies,” Nature Climate Change Vol 4, Issue 12 (2014): 1064–1067, doi:10.1038/nclimate2429; Johannes Urpelainen, “A Model of Dynamic Climate Governance: Dream Big, Win Small,” International Environmental Agreements: Politics, Law and Economics Vol 13, Issue 2 (2013): 107–125, doi:10.1007/s10784-012-9174-1; Robert Falkner, Hannes Stephan, and John Vogler, “International Climate Policy after Copenhagen: Towards a ‘Building Blocks’ Approach,” Global Policy Vol 1, Issue 3 (2010): 252–262, doi:10.1111/j.1758-5899.2010.00045.x.
Transition scenario: Bottom-up pathway to greater international cooperation Figure 16
ARTICLE 6.4MECHANISM
EMERGENTMARKET DESIGN
INTERNATIONALSTANDARDIZATION
NETWORKEDCOMPARABILITY
GLOBAL CARBON MARKET
INFORMALCOLLABORATION
ARTICLE 6.2/3OUTCOMES
RESULT-BASEDFINANCING
SECTORALAGREEMENTS
Source: Vivid Economics
97
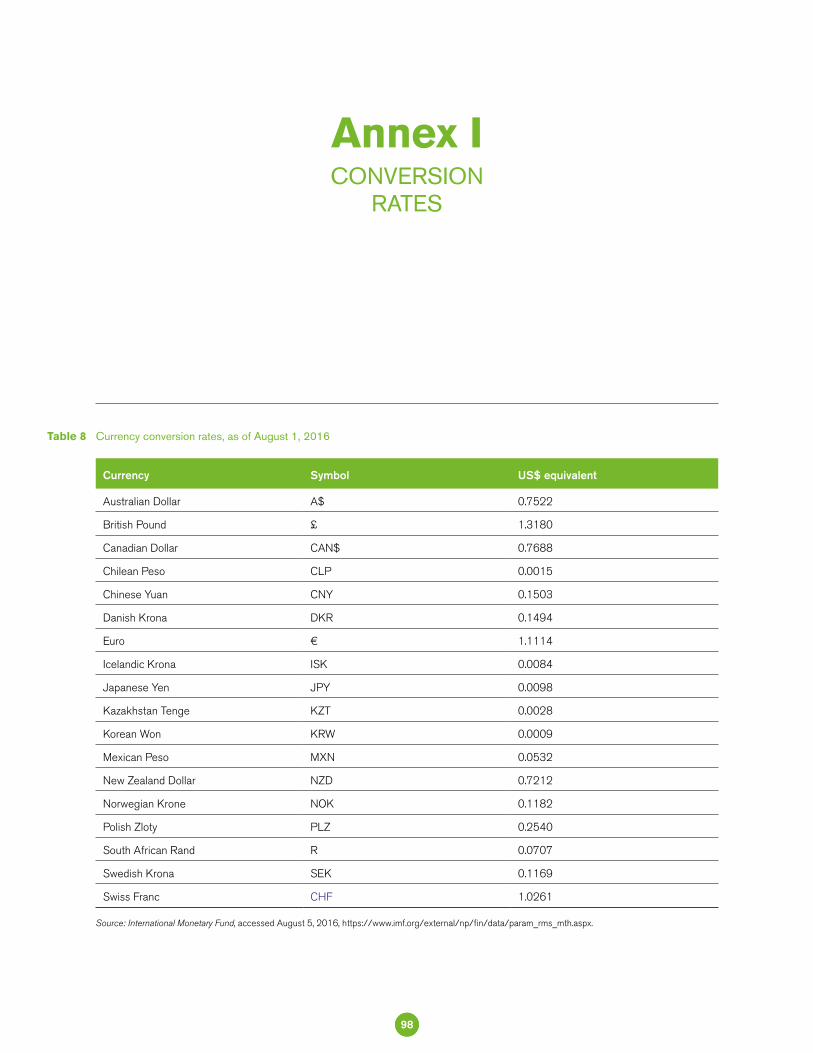
Currency conversion rates, as of August 1, 2016 Table 8
Currency Symbol US$ equivalent
Australian Dollar A$ 0.7522
British Pound £ 1.3180
Canadian Dollar CAN$ 0.7688
Chilean Peso CLP 0.0015
Chinese Yuan CNY 0.1503
Danish Krona DKR 0.1494
Euro € 1.1114
Icelandic Krona ISK 0.0084
Japanese Yen JPY 0.0098
Kazakhstan Tenge KZT 0.0028
Korean Won KRW 0.0009
Mexican Peso MXN 0.0532
New Zealand Dollar NZD 0.7212
Norwegian Krone NOK 0.1182
Polish Zloty PLZ 0.2540
South African Rand R 0.0707
Swedish Krona SEK 0.1169
Swiss Franc CHF 1.0261
Source: International Monetary Fund, accessed August 5, 2016, https://www.imf.org/external/np/fin/data/param_rms_mth.aspx.
Annex ICONVERSION
RATES
98
393 Source: Carbon Pricing Leadership Coalition, “Leadership Coaliton,” accessed May 20, 2016, http://www.carbonpricingleadership.org/leadership-coalition.394 Source: Building and Nuclear Safety Federal Ministry for the Environment, Nature Conservation, “G7 Carbon Market Platform,” 2015, http://www.bmub.bund.de/
en/topics/climate-energy/climate/international-climate-policy/carbon-market-platform/.395 Source: International Carbon Action Partnership, “About ICAP,” accessed May 20, 2016, https://icapcarbonaction.com/en/partnership/about.
Some of the existing political and technical platforms that encourage collaboration on international carbon pricing include:
– Carbon Pricing Leadership Coalition (CPLC) The CPLC brings together governments, business and non-government organizations (NGOs) that seek to take action to accelerate the global uptake of carbon pricing. It aims to build the evidence base for successful carbon pricing and mobilize business support via national, regional and global leadership dialogues. The CPLC also enables members to “share information, expertise and lessons learned on developing and implementing carbon pricing through various ‘readiness’ platforms”.393
– Carbon Market Platform The Carbon Market Platform is a political dialogue under the G7 which seeks to develop reliable and consistent rules for creating and using carbon markets internationally.394 These policy dialogues focus on topics such as market mechanisms, linking ETSs, energy taxes and the removal of fossil fuel subsidies to encourage carbon pricing. The platform is not exclusively for G7 members, but also brings in major emitters and carbon market pioneers.
– International Carbon Action Partnership (ICAP) ICAP is a forum for governments and public authorities which aims to facilitate market linkages.395 It does so by allowing for the sharing of best-practice models and ETS experiences, as well as providing advice on ETS design compatibility.
Annex IIEXISTING PLATFORMS FOR
INTERNATIONAL COOPERATION
99
396 Source: International Partnership on Mitigation and MRV, “About the Partnership,” 2016, http://mitigationpartnership.net/about-partnership.397 The countries that have signed the declaration are Australia, Canada, Chile, Colombia, Germany, Iceland, Indonesia, Italy, Japan, Mexico, the Netherlands, New
Zealand, Panama, Papua New Guinea, the Republic of Korea, Senegal, Ukraine and the US; Source: Ministry for the Environment, Ministerial Declaration on Carbon Markets, December 12, 2015.
398 Source: International Partnership on Mitigation and MRV, “Partnership for Market Readiness (PMR),” 2016, http://mitigationpartnership.net/partnership-mar-ket-readiness-pmr-0.
399 Source: World Bank, Networked Carbon Markets, November 11, 2015.
– International Partnership on Mitigation and MRV This partnership was established in 2010 under the framework of the Petersburg Climate Dialogue by Germany, the Republic of Korea and South Africa. It is made up of more than 90, mainly developing, countries. The partnership aims to facilitate the transfer of practical knowledge on mitigation between developed and developing countries in order to increase global ambition.396
– New Zealand-led Ministerial Declaration on Carbon Pricing The declaration supports the role of markets in the Agreement and commits the signatories to jointly develop standards and guidelines that ensure the environmental integrity of the international market mechanisms that will be used to meet NDCs.397
– The Partnership for Market Readiness (PMR) The PMR is a grant-based international partnership which includes both developing and developed countries. It undertakes a number of activities that help support the development of
an international carbon market. This includes grants for building market readiness leading to the piloting and testing of market mechanisms (as explored in Section 4.4.2), and providing a platform for knowledge-building and technical dialogue.398 In 2015 the PMR welcomed two new participants, Sri Lanka and Alberta, taking the total number of participating parties to 35.
– World Bank’s Networked Carbon Markets (NCM) initiative The NCM initative is exploring how a future international carbon market could accommodate a “patchwork” of different, domestic climate actions. The end-goal is a connected international carbon market that has liquidity, scale and the foundation for a long term, stable price on carbon.399
This list is not exhaustive and there are other various international and regional networks. New networks could be created to complement these existing ones and focus on sub-topics, such as encouraging best-practice MRV.
Annex II Existing platforms for international cooperation
100
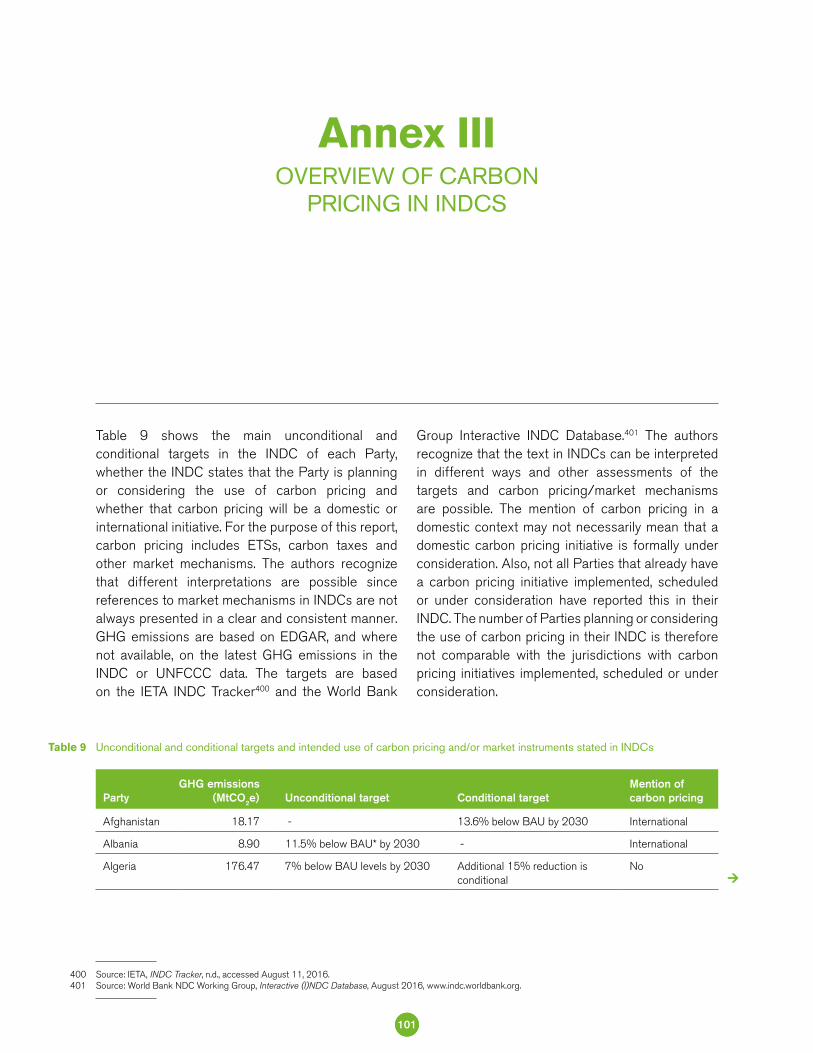
400 Source: IETA, INDC Tracker, n.d., accessed August 11, 2016.401 Source: World Bank NDC Working Group, Interactive (I)NDC Database, August 2016, www.indc.worldbank.org.
Table 9 shows the main unconditional and conditional targets in the INDC of each Party, whether the INDC states that the Party is planning or considering the use of carbon pricing and whether that carbon pricing will be a domestic or international initiative. For the purpose of this report, carbon pricing includes ETSs, carbon taxes and other market mechanisms. The authors recognize that different interpretations are possible since references to market mechanisms in INDCs are not always presented in a clear and consistent manner. GHG emissions are based on EDGAR, and where not available, on the latest GHG emissions in the INDC or UNFCCC data. The targets are based on the IETA INDC Tracker400 and the World Bank
Group Interactive INDC Database.401 The authors recognize that the text in INDCs can be interpreted in different ways and other assessments of the targets and carbon pricing/market mechanisms are possible. The mention of carbon pricing in a domestic context may not necessarily mean that a domestic carbon pricing initiative is formally under consideration. Also, not all Parties that already have a carbon pricing initiative implemented, scheduled or under consideration have reported this in their INDC. The number of Parties planning or considering the use of carbon pricing in their INDC is therefore not comparable with the jurisdictions with carbon pricing initiatives implemented, scheduled or under consideration.
Unconditional and conditional targets and intended use of carbon pricing and/or market instruments stated in INDCsTable 9
PartyGHG emissions
(MtCO2e) Unconditional target Conditional targetMention of carbon pricing
Afghanistan 18.17 - 13.6% below BAU by 2030 International
Albania 8.90 11.5% below BAU* by 2030 - International
Algeria 176.47 7% below BAU levels by 2030 Additional 15% reduction is conditional
No
Annex IIIOVERVIEW OF CARBON
PRICING IN INDCS
101
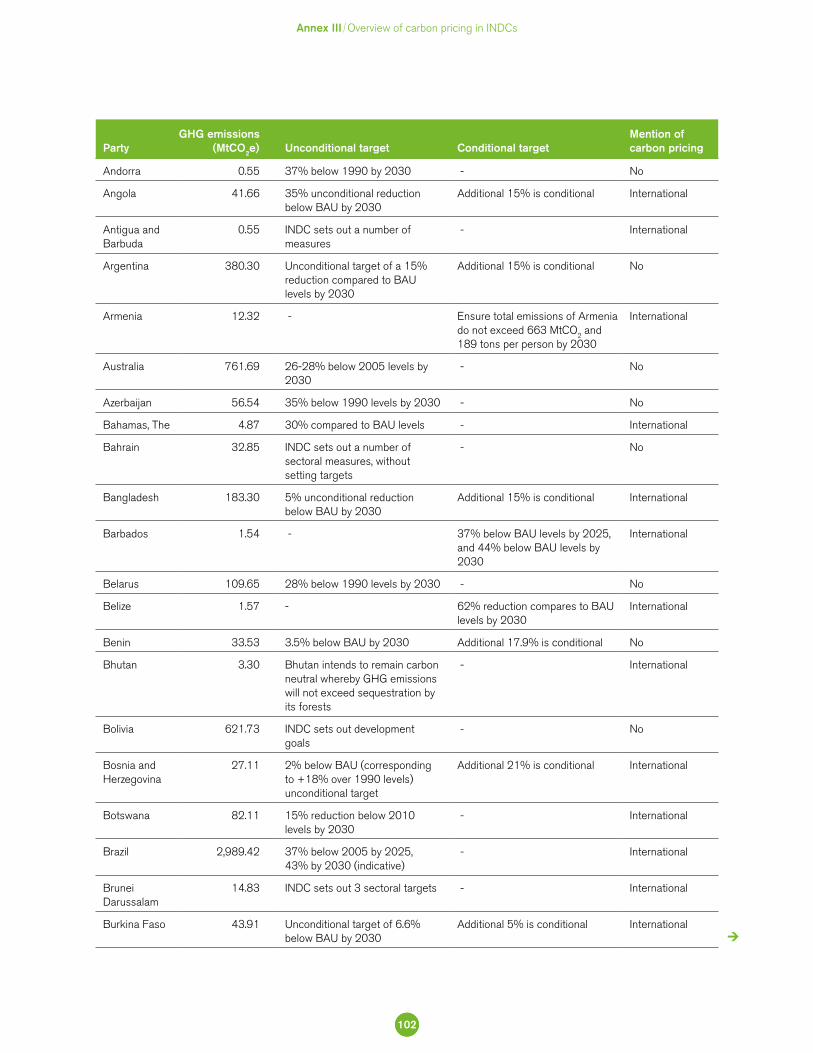
Annex III Overview of carbon pricing in INDCs
Andorra 0.55 37% below 1990 by 2030 - No
Angola 41.66 35% unconditional reduction below BAU by 2030
Additional 15% is conditional International
Antigua and Barbuda
0.55 INDC sets out a number of measures
- International
Argentina 380.30 Unconditional target of a 15% reduction compared to BAU levels by 2030
Additional 15% is conditional No
Armenia 12.32 - Ensure total emissions of Armenia do not exceed 663 MtCO2 and 189 tons per person by 2030
International
Australia 761.69 26-28% below 2005 levels by 2030
- No
Azerbaijan 56.54 35% below 1990 levels by 2030 - No
Bahamas, The 4.87 30% compared to BAU levels - International
Bahrain 32.85 INDC sets out a number of sectoral measures, without setting targets
- No
Bangladesh 183.30 5% unconditional reduction below BAU by 2030
Additional 15% is conditional International
Barbados 1.54 - 37% below BAU levels by 2025, and 44% below BAU levels by 2030
International
Belarus 109.65 28% below 1990 levels by 2030 - No
Belize 1.57 - 62% reduction compares to BAU levels by 2030
International
Benin 33.53 3.5% below BAU by 2030 Additional 17.9% is conditional No
Bhutan 3.30 Bhutan intends to remain carbon neutral whereby GHG emissions will not exceed sequestration by its forests
- International
Bolivia 621.73 INDC sets out development goals
- No
Bosnia and Herzegovina
27.11 2% below BAU (corresponding to +18% over 1990 levels) unconditional target
Additional 21% is conditional International
Botswana 82.11 15% reduction below 2010 levels by 2030
- International
Brazil 2,989.42 37% below 2005 by 2025, 43% by 2030 (indicative)
- International
Brunei Darussalam
14.83 INDC sets out 3 sectoral targets - International
Burkina Faso 43.91 Unconditional target of 6.6% below BAU by 2030
Additional 5% is conditional International
PartyGHG emissions
(MtCO2e) Unconditional target Conditional targetMention of carbon pricing
102
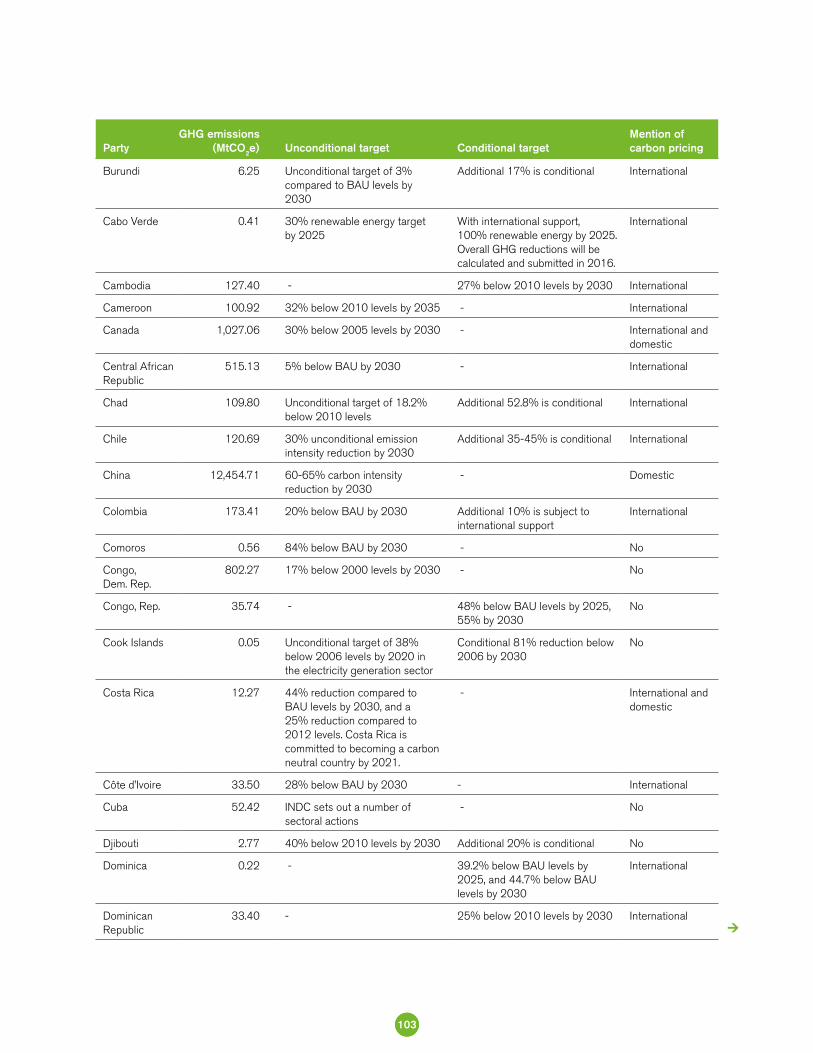
Burundi 6.25 Unconditional target of 3% compared to BAU levels by 2030
Additional 17% is conditional International
Cabo Verde 0.41 30% renewable energy target by 2025
With international support, 100% renewable energy by 2025. Overall GHG reductions will be calculated and submitted in 2016.
International
Cambodia 127.40 - 27% below 2010 levels by 2030 International
Cameroon 100.92 32% below 2010 levels by 2035 - International
Canada 1,027.06 30% below 2005 levels by 2030 - International and domestic
Central African Republic
515.13 5% below BAU by 2030 - International
Chad 109.80 Unconditional target of 18.2% below 2010 levels
Additional 52.8% is conditional International
Chile 120.69 30% unconditional emission intensity reduction by 2030
Additional 35-45% is conditional International
China 12,454.71 60-65% carbon intensity reduction by 2030
- Domestic
Colombia 173.41 20% below BAU by 2030 Additional 10% is subject to international support
International
Comoros 0.56 84% below BAU by 2030 - No
Congo, Dem. Rep.
802.27 17% below 2000 levels by 2030 - No
Congo, Rep. 35.74 - 48% below BAU levels by 2025, 55% by 2030
No
Cook Islands 0.05 Unconditional target of 38% below 2006 levels by 2020 in the electricity generation sector
Conditional 81% reduction below 2006 by 2030
No
Costa Rica 12.27 44% reduction compared to BAU levels by 2030, and a 25% reduction compared to 2012 levels. Costa Rica is committed to becoming a carbon neutral country by 2021.
- International and domestic
Côte d’Ivoire 33.50 28% below BAU by 2030 - International
Cuba 52.42 INDC sets out a number of sectoral actions
- No
Djibouti 2.77 40% below 2010 levels by 2030 Additional 20% is conditional No
Dominica 0.22 - 39.2% below BAU levels by 2025, and 44.7% below BAU levels by 2030
International
Dominican Republic
33.40 - 25% below 2010 levels by 2030 International
PartyGHG emissions
(MtCO2e) Unconditional target Conditional targetMention of carbon pricing
103
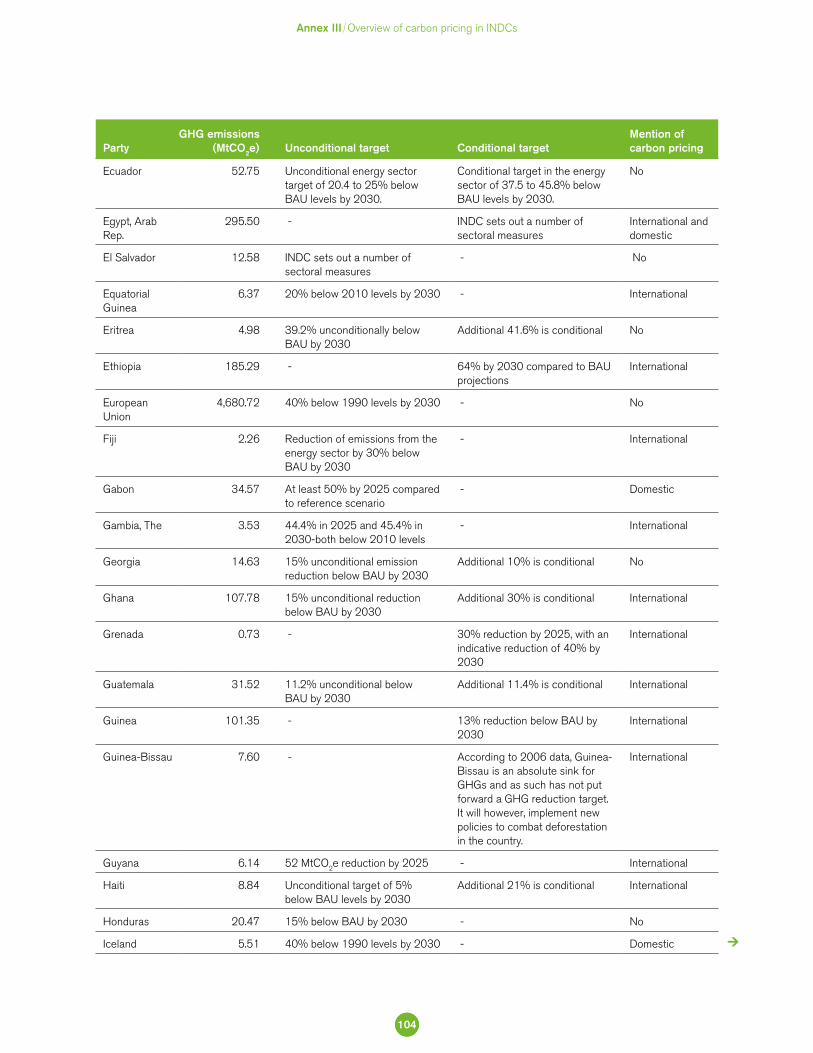
Ecuador 52.75 Unconditional energy sector target of 20.4 to 25% below BAU levels by 2030.
Conditional target in the energy sector of 37.5 to 45.8% below BAU levels by 2030.
No
Egypt, Arab Rep.
295.50 - INDC sets out a number of sectoral measures
International and domestic
El Salvador 12.58 INDC sets out a number of sectoral measures
- No
Equatorial Guinea
6.37 20% below 2010 levels by 2030 - International
Eritrea 4.98 39.2% unconditionally below BAU by 2030
Additional 41.6% is conditional No
Ethiopia 185.29 - 64% by 2030 compared to BAU projections
International
European Union
4,680.72 40% below 1990 levels by 2030 - No
Fiji 2.26 Reduction of emissions from the energy sector by 30% below BAU by 2030
- International
Gabon 34.57 At least 50% by 2025 compared to reference scenario
- Domestic
Gambia, The 3.53 44.4% in 2025 and 45.4% in 2030-both below 2010 levels
- International
Georgia 14.63 15% unconditional emission reduction below BAU by 2030
Additional 10% is conditional No
Ghana 107.78 15% unconditional reduction below BAU by 2030
Additional 30% is conditional International
Grenada 0.73 - 30% reduction by 2025, with an indicative reduction of 40% by 2030
International
Guatemala 31.52 11.2% unconditional below BAU by 2030
Additional 11.4% is conditional International
Guinea 101.35 - 13% reduction below BAU by 2030
International
Guinea-Bissau 7.60 - According to 2006 data, Guinea-Bissau is an absolute sink for GHGs and as such has not put forward a GHG reduction target. It will however, implement new policies to combat deforestation in the country.
International
Guyana 6.14 52 MtCO2e reduction by 2025 - International
Haiti 8.84 Unconditional target of 5% below BAU levels by 2030
Additional 21% is conditional International
Honduras 20.47 15% below BAU by 2030 - No
Iceland 5.51 40% below 1990 levels by 2030 - Domestic
PartyGHG emissions
(MtCO2e) Unconditional target Conditional targetMention of carbon pricing
Annex III Overview of carbon pricing in INDCs
104
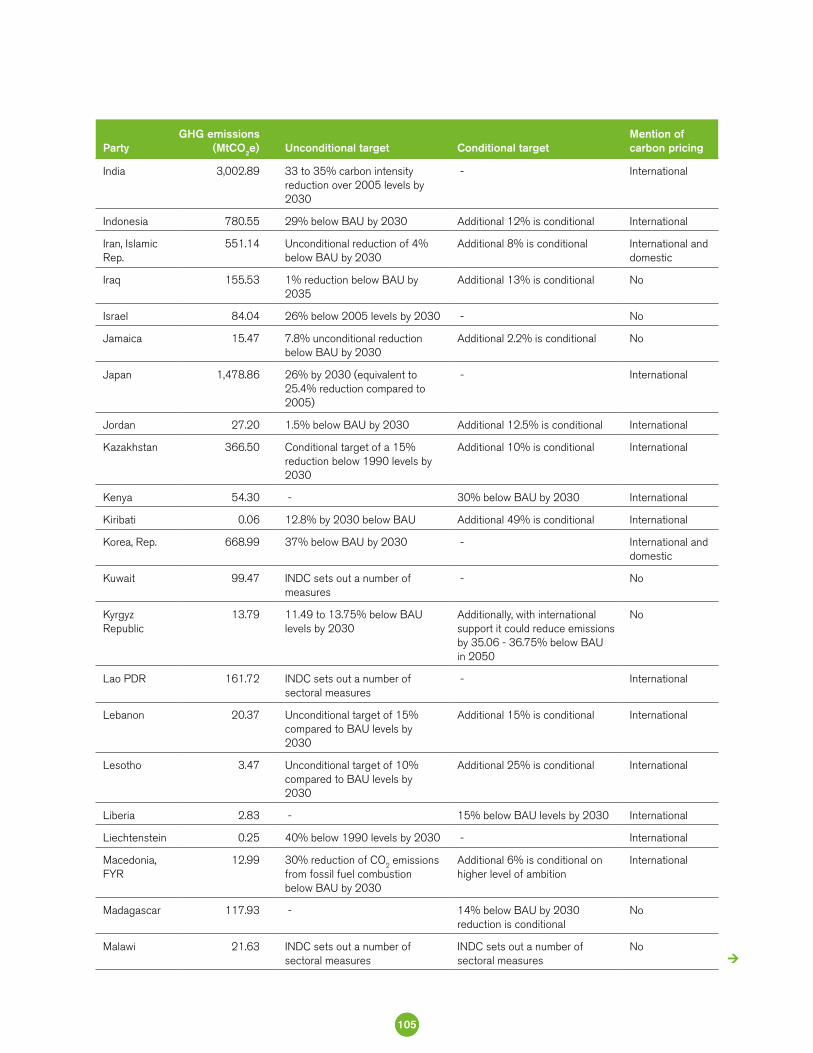
India 3,002.89 33 to 35% carbon intensity reduction over 2005 levels by 2030
- International
Indonesia 780.55 29% below BAU by 2030 Additional 12% is conditional International
Iran, Islamic Rep.
551.14 Unconditional reduction of 4% below BAU by 2030
Additional 8% is conditional International and domestic
Iraq 155.53 1% reduction below BAU by 2035
Additional 13% is conditional No
Israel 84.04 26% below 2005 levels by 2030 - No
Jamaica 15.47 7.8% unconditional reduction below BAU by 2030
Additional 2.2% is conditional No
Japan 1,478.86 26% by 2030 (equivalent to 25.4% reduction compared to 2005)
- International
Jordan 27.20 1.5% below BAU by 2030 Additional 12.5% is conditional International
Kazakhstan 366.50 Conditional target of a 15% reduction below 1990 levels by 2030
Additional 10% is conditional International
Kenya 54.30 - 30% below BAU by 2030 International
Kiribati 0.06 12.8% by 2030 below BAU Additional 49% is conditional International
Korea, Rep. 668.99 37% below BAU by 2030 - International and domestic
Kuwait 99.47 INDC sets out a number of measures
- No
Kyrgyz Republic
13.79 11.49 to 13.75% below BAU levels by 2030
Additionally, with international support it could reduce emissions by 35.06 - 36.75% below BAU in 2050
No
Lao PDR 161.72 INDC sets out a number of sectoral measures
- International
Lebanon 20.37 Unconditional target of 15% compared to BAU levels by 2030
Additional 15% is conditional International
Lesotho 3.47 Unconditional target of 10% compared to BAU levels by 2030
Additional 25% is conditional International
Liberia 2.83 - 15% below BAU levels by 2030 International
Liechtenstein 0.25 40% below 1990 levels by 2030 - International
Macedonia, FYR
12.99 30% reduction of CO2 emissions
from fossil fuel combustion below BAU by 2030
Additional 6% is conditional on higher level of ambition
International
Madagascar 117.93 - 14% below BAU by 2030 reduction is conditional
No
Malawi 21.63 INDC sets out a number of sectoral measures
INDC sets out a number of sectoral measures
No
PartyGHG emissions
(MtCO2e) Unconditional target Conditional targetMention of carbon pricing
105
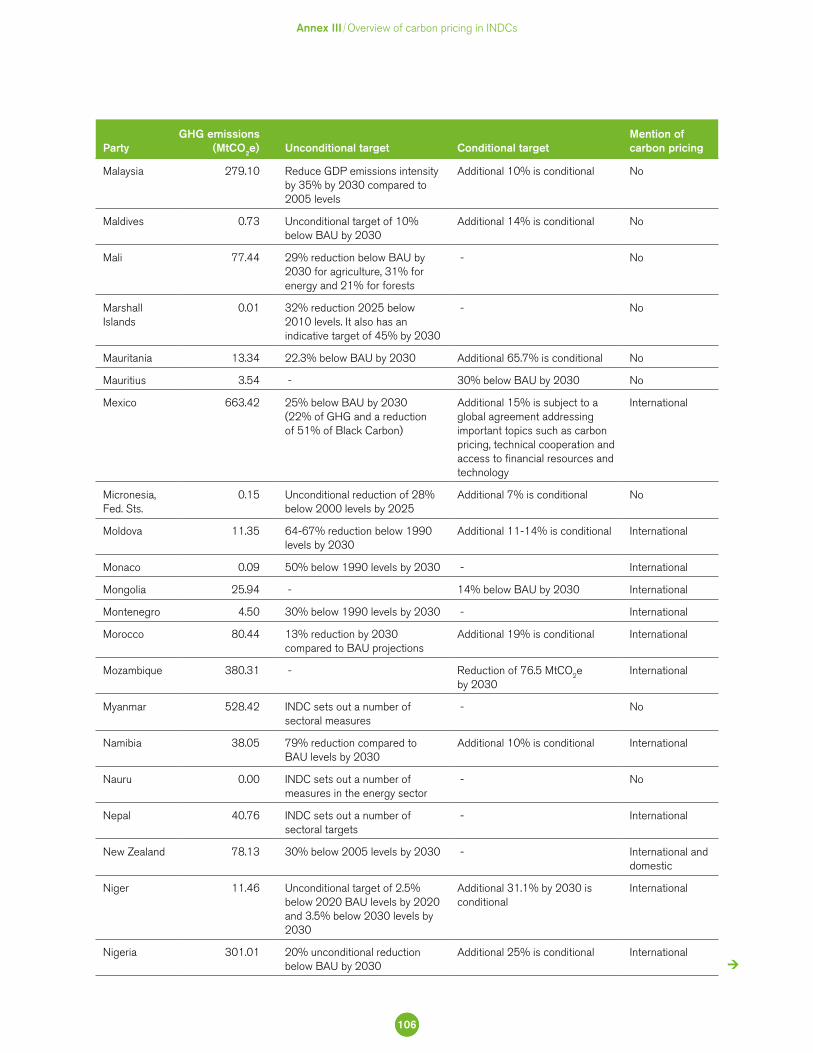
Malaysia 279.10 Reduce GDP emissions intensity by 35% by 2030 compared to 2005 levels
Additional 10% is conditional No
Maldives 0.73 Unconditional target of 10% below BAU by 2030
Additional 14% is conditional No
Mali 77.44 29% reduction below BAU by 2030 for agriculture, 31% for energy and 21% for forests
- No
Marshall Islands
0.01 32% reduction 2025 below 2010 levels. It also has an indicative target of 45% by 2030
- No
Mauritania 13.34 22.3% below BAU by 2030 Additional 65.7% is conditional No
Mauritius 3.54 - 30% below BAU by 2030 No
Mexico 663.42 25% below BAU by 2030 (22% of GHG and a reduction of 51% of Black Carbon)
Additional 15% is subject to a global agreement addressing important topics such as carbon pricing, technical cooperation and access to financial resources and technology
International
Micronesia, Fed. Sts.
0.15 Unconditional reduction of 28% below 2000 levels by 2025
Additional 7% is conditional No
Moldova 11.35 64-67% reduction below 1990 levels by 2030
Additional 11-14% is conditional International
Monaco 0.09 50% below 1990 levels by 2030 - International
Mongolia 25.94 - 14% below BAU by 2030 International
Montenegro 4.50 30% below 1990 levels by 2030 - International
Morocco 80.44 13% reduction by 2030 compared to BAU projections
Additional 19% is conditional International
Mozambique 380.31 - Reduction of 76.5 MtCO2e by 2030
International
Myanmar 528.42 INDC sets out a number of sectoral measures
- No
Namibia 38.05 79% reduction compared to BAU levels by 2030
Additional 10% is conditional International
Nauru 0.00 INDC sets out a number of measures in the energy sector
- No
Nepal 40.76 INDC sets out a number of sectoral targets
- International
New Zealand 78.13 30% below 2005 levels by 2030 - International and domestic
Niger 11.46 Unconditional target of 2.5% below 2020 BAU levels by 2020 and 3.5% below 2030 levels by 2030
Additional 31.1% by 2030 is conditional
International
Nigeria 301.01 20% unconditional reduction below BAU by 2030
Additional 25% is conditional International
PartyGHG emissions
(MtCO2e) Unconditional target Conditional targetMention of carbon pricing
Annex III Overview of carbon pricing in INDCs
106
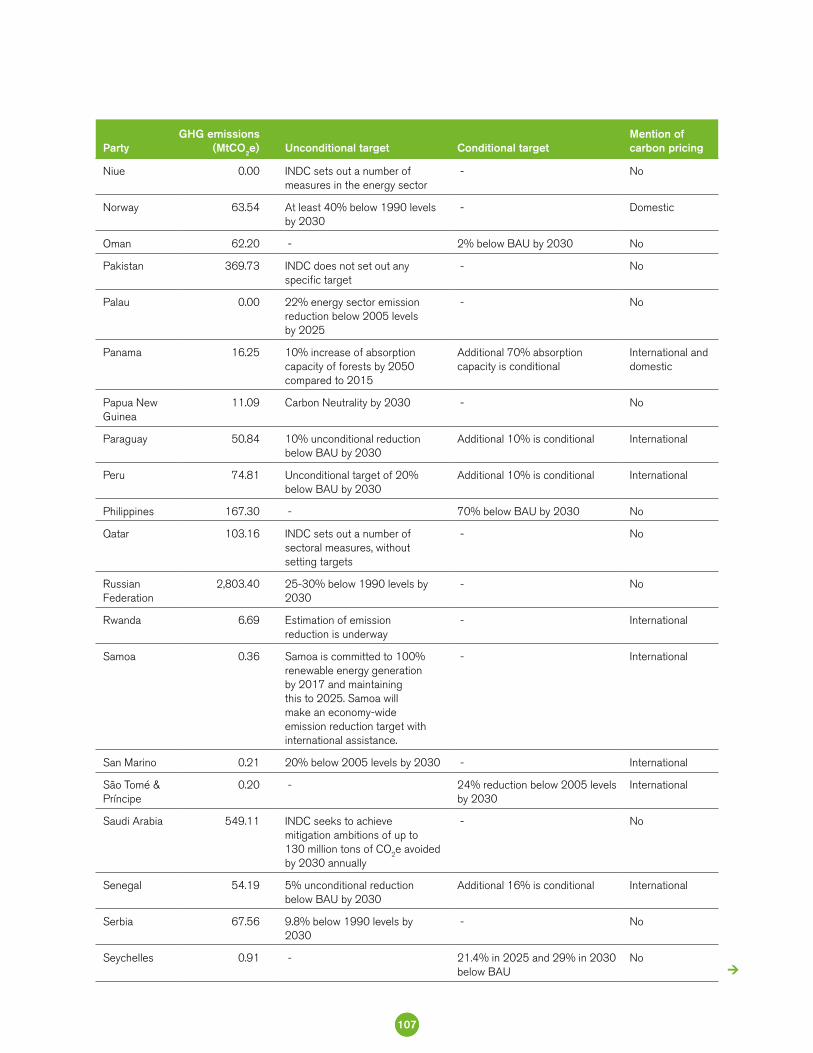
Niue 0.00 INDC sets out a number of measures in the energy sector
- No
Norway 63.54 At least 40% below 1990 levels by 2030
- Domestic
Oman 62.20 - 2% below BAU by 2030 No
Pakistan 369.73 INDC does not set out any specific target
- No
Palau 0.00 22% energy sector emission reduction below 2005 levels by 2025
- No
Panama 16.25 10% increase of absorption capacity of forests by 2050 compared to 2015
Additional 70% absorption capacity is conditional
International and domestic
Papua New Guinea
11.09 Carbon Neutrality by 2030 - No
Paraguay 50.84 10% unconditional reduction below BAU by 2030
Additional 10% is conditional International
Peru 74.81 Unconditional target of 20% below BAU by 2030
Additional 10% is conditional International
Philippines 167.30 - 70% below BAU by 2030 No
Qatar 103.16 INDC sets out a number of sectoral measures, without setting targets
- No
Russian Federation
2,803.40 25-30% below 1990 levels by 2030
- No
Rwanda 6.69 Estimation of emission reduction is underway
- International
Samoa 0.36 Samoa is committed to 100% renewable energy generation by 2017 and maintaining this to 2025. Samoa will make an economy-wide emission reduction target with international assistance.
- International
San Marino 0.21 20% below 2005 levels by 2030 - International
São Tomé & Príncipe
0.20 - 24% reduction below 2005 levels by 2030
International
Saudi Arabia 549.11 INDC seeks to achieve mitigation ambitions of up to 130 million tons of CO2e avoided by 2030 annually
- No
Senegal 54.19 5% unconditional reduction below BAU by 2030
Additional 16% is conditional International
Serbia 67.56 9.8% below 1990 levels by 2030
- No
Seychelles 0.91 - 21.4% in 2025 and 29% in 2030 below BAU
No
PartyGHG emissions
(MtCO2e) Unconditional target Conditional targetMention of carbon pricing
107
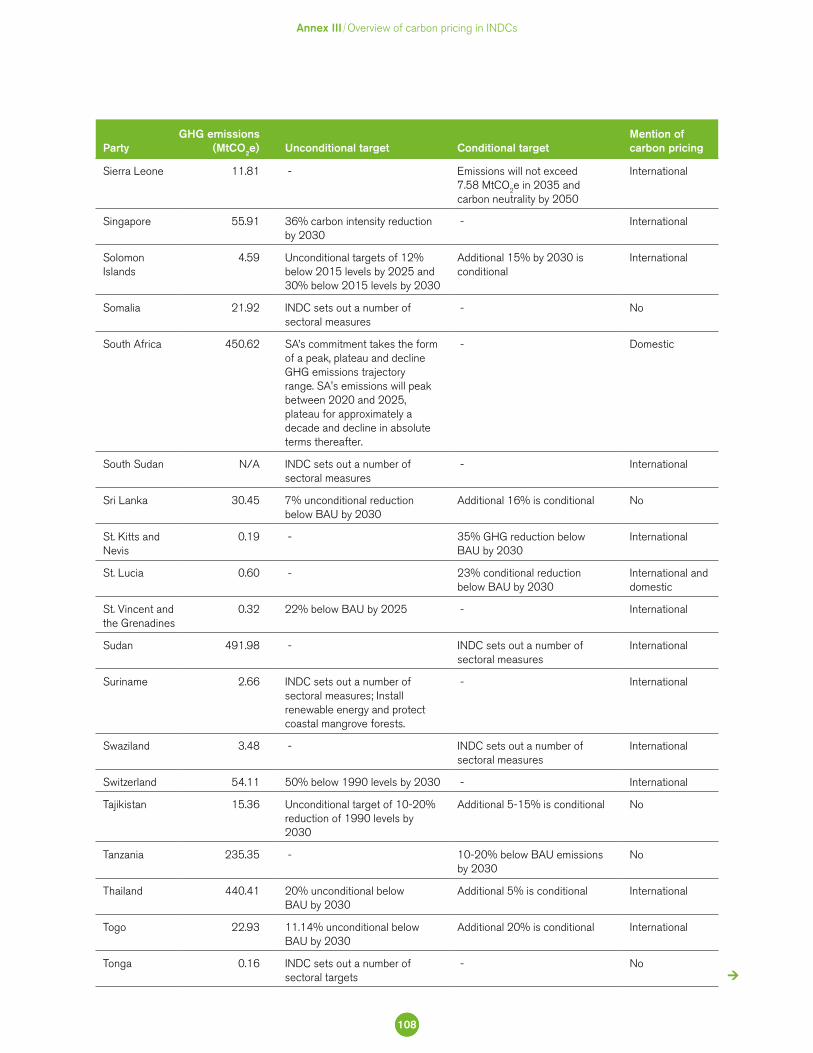
Sierra Leone 11.81 - Emissions will not exceed 7.58 MtCO2e in 2035 and carbon neutrality by 2050
International
Singapore 55.91 36% carbon intensity reduction by 2030
- International
Solomon Islands
4.59 Unconditional targets of 12% below 2015 levels by 2025 and 30% below 2015 levels by 2030
Additional 15% by 2030 is conditional
International
Somalia 21.92 INDC sets out a number of sectoral measures
- No
South Africa 450.62 SA’s commitment takes the form of a peak, plateau and decline GHG emissions trajectory range. SA's emissions will peak between 2020 and 2025, plateau for approximately a decade and decline in absolute terms thereafter.
- Domestic
South Sudan N/A INDC sets out a number of sectoral measures
- International
Sri Lanka 30.45 7% unconditional reduction below BAU by 2030
Additional 16% is conditional No
St. Kitts and Nevis
0.19 - 35% GHG reduction below BAU by 2030
International
St. Lucia 0.60 - 23% conditional reduction below BAU by 2030
International and domestic
St. Vincent and the Grenadines
0.32 22% below BAU by 2025 - International
Sudan 491.98 - INDC sets out a number of sectoral measures
International
Suriname 2.66 INDC sets out a number of sectoral measures; Install renewable energy and protect coastal mangrove forests.
- International
Swaziland 3.48 - INDC sets out a number of sectoral measures
International
Switzerland 54.11 50% below 1990 levels by 2030 - International
Tajikistan 15.36 Unconditional target of 10-20% reduction of 1990 levels by 2030
Additional 5-15% is conditional No
Tanzania 235.35 - 10-20% below BAU emissions by 2030
No
Thailand 440.41 20% unconditional below BAU by 2030
Additional 5% is conditional International
Togo 22.93 11.14% unconditional below BAU by 2030
Additional 20% is conditional International
Tonga 0.16 INDC sets out a number of sectoral targets
- No
PartyGHG emissions
(MtCO2e) Unconditional target Conditional targetMention of carbon pricing
Annex III Overview of carbon pricing in INDCs
108
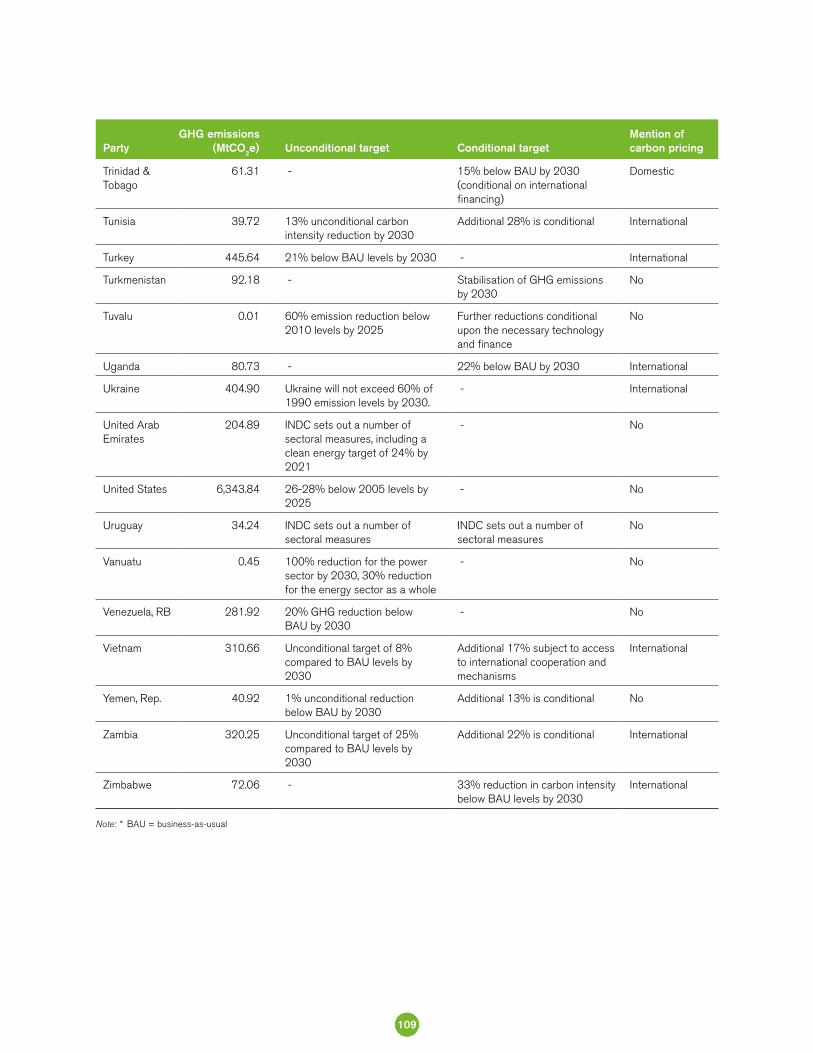
Trinidad & Tobago
61.31 - 15% below BAU by 2030 (conditional on international financing)
Domestic
Tunisia 39.72 13% unconditional carbon intensity reduction by 2030
Additional 28% is conditional International
Turkey 445.64 21% below BAU levels by 2030 - International
Turkmenistan 92.18 - Stabilisation of GHG emissions by 2030
No
Tuvalu 0.01 60% emission reduction below 2010 levels by 2025
Further reductions conditional upon the necessary technology and finance
No
Uganda 80.73 - 22% below BAU by 2030 International
Ukraine 404.90 Ukraine will not exceed 60% of 1990 emission levels by 2030.
- International
United Arab Emirates
204.89 INDC sets out a number of sectoral measures, including a clean energy target of 24% by 2021
- No
United States 6,343.84 26-28% below 2005 levels by 2025
- No
Uruguay 34.24 INDC sets out a number of sectoral measures
INDC sets out a number of sectoral measures
No
Vanuatu 0.45 100% reduction for the power sector by 2030, 30% reduction for the energy sector as a whole
- No
Venezuela, RB 281.92 20% GHG reduction below BAU by 2030
- No
Vietnam 310.66 Unconditional target of 8% compared to BAU levels by 2030
Additional 17% subject to access to international cooperation and mechanisms
International
Yemen, Rep. 40.92 1% unconditional reduction below BAU by 2030
Additional 13% is conditional No
Zambia 320.25 Unconditional target of 25% compared to BAU levels by 2030
Additional 22% is conditional International
Zimbabwe 72.06 - 33% reduction in carbon intensity below BAU levels by 2030
International
PartyGHG emissions
(MtCO2e) Unconditional target Conditional targetMention of carbon pricing
Note: * BAU = business-as-usual
109
402 Source: European Bank for Reconstruction and Development, “Special Report on Climate Change: The Low Carbon Transition” (2011): 56–72.; Source: NERA Economic Consulting, Bloomberg New Energy Finance, and Global Carbon, The Demand for Greenhouse Gas Emissions Reduction Investments: An Investors’ Marginal Abatement Cost Curve for Ukraine (London, January 2012), http://www.ebrd.com/downloads/research/economics/publications/specials/Ukraine_MACC_report_ENG.pdf.; Source: NERA Economic Consulting and Bloomberg New Energy Finance, The Demand for Greenhouse Gas Emissions Reduction Investments: An Investors’ Marginal Abatement Cost Curve for Kazakhstan (London, October 2012), http://www.ebrd.com/downloads/research/economics/pub-lications/specials/Kazakhstan_MACC_report_ENG.pdf.; Source: NERA Economic Consulting, Bloomberg New Energy Finance, and IBS Research & Consultancy, The Demand for Greenhouse Gas Emissions Reductions: An Investors’ Marginal Abatement Cost Curve for Turkey (London, October 2011), http://www.ebrd.com/downloads/research/economics/publications/specials/Turkey_MACC_report_ENG.pdf.
403 SEAI, Unlocking the Energy Efficiency Opportunity, June 2015.
Agent-based models are increasingly recognized as emerging tools to help design policies in a way that increases their effectiveness. Representing the perspective of economic agents in the formal model is important, because they are the ones who build wind farms instead of coal plants or ride trains instead of private cars. The government role is to create the policy and incentive framework that influences the choices of firms, people, organizations and communities and align them with the government targets (such as NDCs). Multiple policy instruments, including carbon prices together with a suite of complementary, overlapping and countervailing policies will “nudge” billions of individual firms and households to choose either low carbon options, or their traditional alternatives.
One approach to developing such agent-based models became known as policy-induced marginal abatement cost curve (POL-MAC), applied in a number of country studies by the EBRD, the World Bank402, and others.403 Not the model itself, POL-MAC is a systematic method of converting
standard bottom-up technoeconomic models, that advise policy-makers on what is best for society, to financial models, that advise policy-makers on how investors and consumers see the policy instruments. They are based on relatively simple cost-minimizing decision rules, but simulate decision making consistently from the point of view of economic agents rather than from the point of view of welfare-maximizing central planners. POL-MAC approaches put explicit financial values on decision variables such as subsidies, taxes, transaction costs, barriers and risks that different economic agents face in reality. Other drivers of behavior, such as improvement of convenience or social status are often also quantified. This is why they allow for quantification of the impact of policies and incentives on the choices made by economic actors. This contrasts with the traditional techno-economic models that are used for target setting, where policy analysis is usually crude (as discussed above), applied as sensitivity analysis or qualitative and conducted outside of the formal model (Figure 17).
Annex IVMODELING TOOLS
TO SUPPORT POLICY ALIGNMENT AND EFFECTIVENESS
110
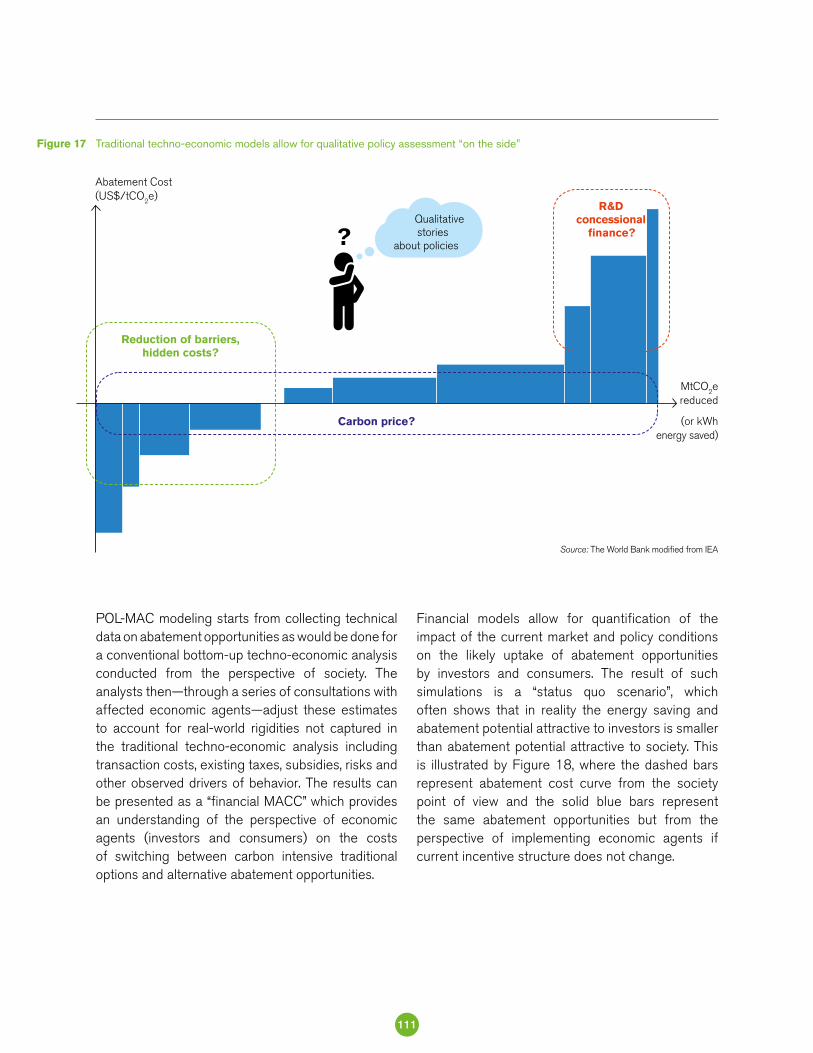
POL-MAC modeling starts from collecting technical data on abatement opportunities as would be done for a conventional bottom-up techno-economic analysis conducted from the perspective of society. The analysts then—through a series of consultations with affected economic agents—adjust these estimates to account for real-world rigidities not captured in the traditional techno-economic analysis including transaction costs, existing taxes, subsidies, risks and other observed drivers of behavior. The results can be presented as a “financial MACC” which provides an understanding of the perspective of economic agents (investors and consumers) on the costs of switching between carbon intensive traditional options and alternative abatement opportunities.
Financial models allow for quantification of the impact of the current market and policy conditions on the likely uptake of abatement opportunities by investors and consumers. The result of such simulations is a “status quo scenario”, which often shows that in reality the energy saving and abatement potential attractive to investors is smaller than abatement potential attractive to society. This is illustrated by Figure 18, where the dashed bars represent abatement cost curve from the society point of view and the solid blue bars represent the same abatement opportunities but from the perspective of implementing economic agents if current incentive structure does not change.
Traditional techno-economic models allow for qualitative policy assessment “on the side” Figure 17
Source: The World Bank modified from IEA
Abatement Cost (US$/tCO2e)
MtCO2e reduced
(or kWh
energy saved)
Reduction of barriers, hidden costs?
Carbon price?
R&D concessional
finance??Qualitative stories
about policies
111
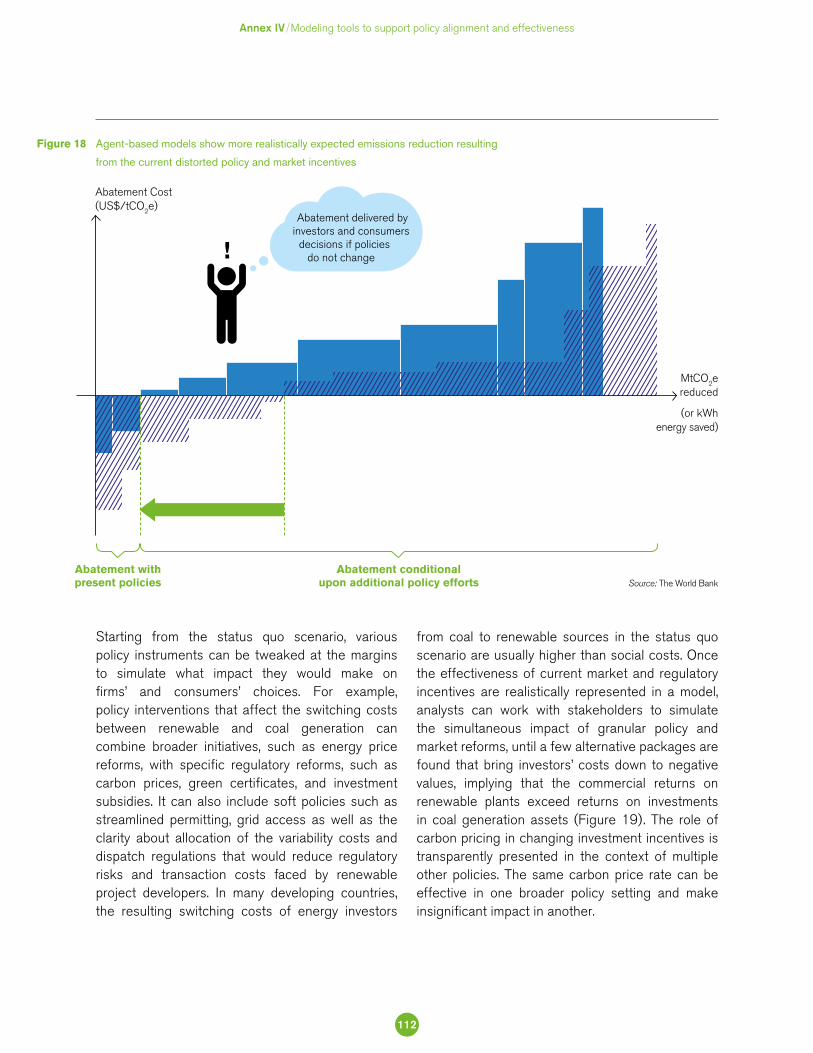
Annex IV Modeling tools to support policy alignment and effectiveness
Starting from the status quo scenario, various policy instruments can be tweaked at the margins to simulate what impact they would make on firms’ and consumers’ choices. For example, policy interventions that affect the switching costs between renewable and coal generation can combine broader initiatives, such as energy price reforms, with specific regulatory reforms, such as carbon prices, green certificates, and investment subsidies. It can also include soft policies such as streamlined permitting, grid access as well as the clarity about allocation of the variability costs and dispatch regulations that would reduce regulatory risks and transaction costs faced by renewable project developers. In many developing countries, the resulting switching costs of energy investors
from coal to renewable sources in the status quo scenario are usually higher than social costs. Once the effectiveness of current market and regulatory incentives are realistically represented in a model, analysts can work with stakeholders to simulate the simultaneous impact of granular policy and market reforms, until a few alternative packages are found that bring investors’ costs down to negative values, implying that the commercial returns on renewable plants exceed returns on investments in coal generation assets (Figure 19). The role of carbon pricing in changing investment incentives is transparently presented in the context of multiple other policies. The same carbon price rate can be effective in one broader policy setting and make insignificant impact in another.
Agent-based models show more realistically expected emissions reduction resulting
from the current distorted policy and market incentives
Figure 18
Abatement with present policies
Abatement conditional upon additional policy efforts
Abatement Cost (US$/tCO2e)
MtCO2e reduced
(or kWh
energy saved)
Source: The World Bank
Abatement delivered by investors and consumers
decisions if policies do not change!
112
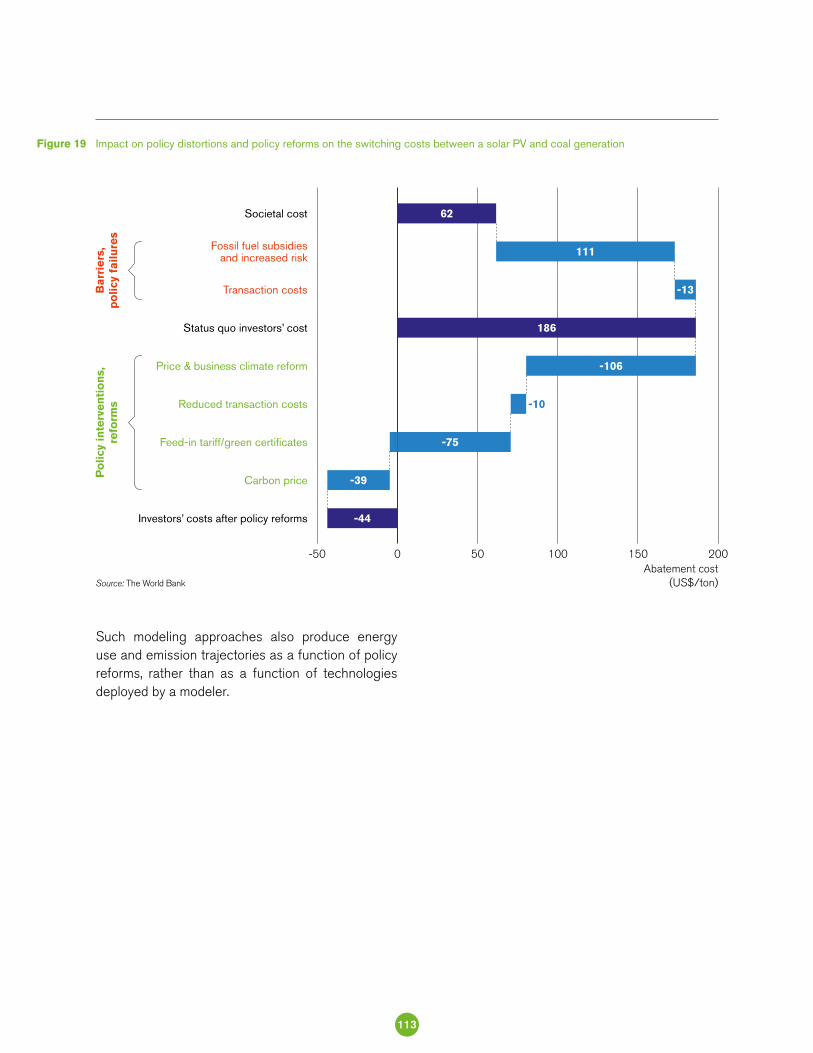
Such modeling approaches also produce energy use and emission trajectories as a function of policy reforms, rather than as a function of technologies deployed by a modeler.
Impact on policy distortions and policy reforms on the switching costs between a solar PV and coal generationFigure 19
Barr
iers
,p
olicy
failu
res
Po
licy
in
terv
en
tio
ns,
refo
rms
Fossil fuel subsidies and increased risk
Transaction costs
Societal cost
Status quo investors’ cost
Investors’ costs after policy reforms
Price & business climate reform
Reduced transaction costs
Feed-in tariff/green certificates
Carbon price
Source: The World Bank
Abatement cost(US$/ton)
-50 0 20015010050
62
111
-13
186
-106
-75
-39
-44
-10
113
404 Kober et al (2014) looking at equal per capita burden sharing, and Böhringer and Welsch (2004) both find that both Africa and Other developing Asia/Pacific Asia are net sellers between 2020 and 2050 (Kober et al, 2014) or in 2050 (Böhringer and Welsch, 2004). The Australian Government Treasury (2011) also finds that Other South and East Asia and Rest of the World will be net sellers in 2050 under ambitious global action. Sources: Kober, B. C. C. Van Der Zwaan and H. Rösler, Emission Certificate Trade and Costs Under Regional Burden-Sharing Regimes for a 2°C Climate Change Control Target, Climate Change Economics, Vol. 5, No. 1 (2014) 1440001; Heinz Welsch and Christoph Böhringer, “Contraction and Convergence of Carbon Emissions: An Intertemporal Multi-Region CGE Analysis,” Journal of Policy Modeling Vol 26, Issue 1 (2004): 21–39; Australian Government Treasury, “Strong Growth, Low Pollution – Modelling a Carbon Price”, July 2011.
405 Kober et al (2014) looking at equal per capita burden sharing, and Böhringer and Welsch (2004) both find India to be a net seller in the period 2020-2050 or 2050 (respectively) although Australian Government Treasury (2011) suggests it may be a net purchaser by 2050 in an ambitious climate scenario. Sources: Ibid.
406 Kober et al (2014) and the Australian Government Treasury (2011) both find that China will be net buyers, although Böhringer and Welsch (2004) suggest it may sell emission rights, although this latter analysis dates from 2004 and so may not accurately capture China’s recent emissions growth. Sources: Ibid.
407 Böhringer and Welsch (2004) and Kober et al.(2014) both find that the US will be a net buyer, although the Australian Government Treasury (2011) suggests that the US may be a net supplier by 2050. Sources: Ibid.
408 Kober et al (2014) find that the Middle East is a net purchaser in the period 2020-2050, while the Australian Government Treasury (2011) found the same for OPEC under ambitious global action in 2050, although Böhringer and Welsch (2004) find that the Middle East and North Africa may be a net supplier in 2050 with ambitious climate action. Sources: Ibid.
409 Böhringer and Welsch (2004) find that Western Europe and Reforming Economic Countries will be net purchasers in 2050, while the Australian government finds that the EU25 would also be net purchasers in 2050. However, Kober et al (2014) find that both Eastern and Western Europe would be net sellers in the period 2020-2050 under equal per capita burden sharing.
Table 10 provides more detail about the international resource transfers and costs and revenues associated with the 2030 results. Table 11 provides the same detail for the 2050 results.
The 2050 regional transfers can be compared with those from other modeling exercises which also consider resource flows from trading, although the comparison is somewhat imperfect due to differences in regional aggregations and, on some occasions, differences in burden sharing assumptions. In addition, this analysis moves toward equal per capita energy CO2 emissions from the 2030 INDC starting point, which is later than the other studies considered. This approach will affect the global and regional mitigation pathways, potentially quite significantly. Nonetheless, there is a reasonable degree of consistency in a number of the findings.
For instance, most studies that separately model either Africa and South and South East Asia concur with the results above that these regions will be net suppliers.404 Moreover, many, but not all, studies also identify India is likely to be a net supplier.405 Similarly, most, but not all, studies suggest that China406, the US407, the Middle East408 and Europe409 will be net buyers. Yet for all of these regions, or the closest correspondence in each analysis, there are at least some studies suggesting they could be net suppliers by 2050. There is considerable variation across different studies in the relative trade positions of both Central and South America and Russia and Central Asia, although it is noteworthy in these results that the latter region moves from being a net supplier of emission reductions to a significant net purchaser as its mitigation ambition increases substantially over time.
Annex VDETAILED MODELING RESULTS
AND COMPARISONS
114
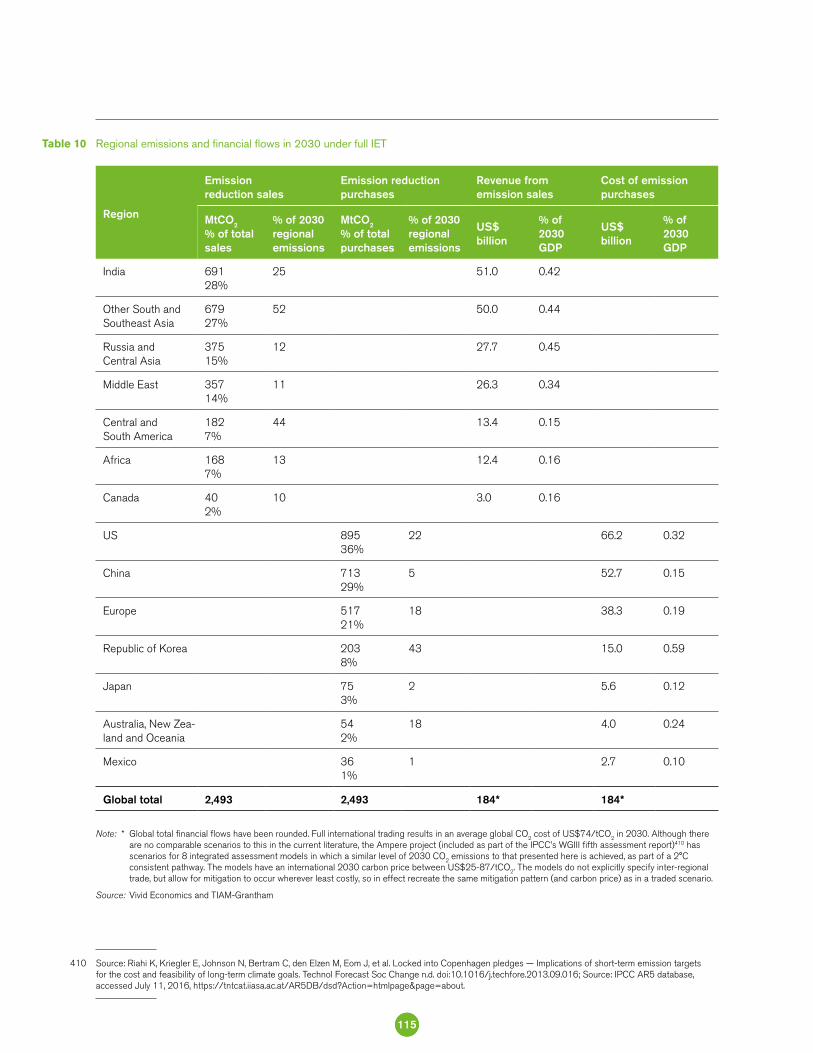
410 Source: Riahi K, Kriegler E, Johnson N, Bertram C, den Elzen M, Eom J, et al. Locked into Copenhagen pledges — Implications of short-term emission targets for the cost and feasibility of long-term climate goals. Technol Forecast Soc Change n.d. doi:10.1016/j.techfore.2013.09.016; Source: IPCC AR5 database, accessed July 11, 2016, https://tntcat.iiasa.ac.at/AR5DB/dsd?Action=htmlpage&page=about.
Regional emissions and financial flows in 2030 under full IET Table 10
Region
Emission reduction sales
Emission reduction purchases
Revenue from emission sales
Cost of emission purchases
MtCO2
% of total sales
% of 2030 regional emissions
MtCO2
% of total purchases
% of 2030 regional emissions
US$ billion
% of 2030 GDP
US$ billion
% of 2030 GDP
India 69128%
25 51.0 0.42
Other South and Southeast Asia
67927%
52 50.0 0.44
Russia and Central Asia
37515%
12 27.7 0.45
Middle East 35714%
11 26.3 0.34
Central and South America
1827%
44 13.4 0.15
Africa 1687%
13 12.4 0.16
Canada 402%
10 3.0 0.16
US 89536%
22 66.2 0.32
China 71329%
5 52.7 0.15
Europe 51721%
18 38.3 0.19
Republic of Korea 2038%
43 15.0 0.59
Japan 753%
2 5.6 0.12
Australia, New Zea-land and Oceania
542%
18 4.0 0.24
Mexico 361%
1 2.7 0.10
Global total 2,493 2,493 184* 184*
Note: * Global total financial flows have been rounded. Full international trading results in an average global CO2 cost of US$74/tCO2 in 2030. Although there are no comparable scenarios to this in the current literature, the Ampere project (included as part of the IPCC’s WGIII fifth assessment report)410 has scenarios for 8 integrated assessment models in which a similar level of 2030 CO2 emissions to that presented here is achieved, as part of a 2°C consistent pathway. The models have an international 2030 carbon price between US$25-87/tCO2. The models do not explicitly specify inter-regional trade, but allow for mitigation to occur wherever least costly, so in effect recreate the same mitigation pattern (and carbon price) as in a traded scenario.
Source: Vivid Economics and TIAM-Grantham
115
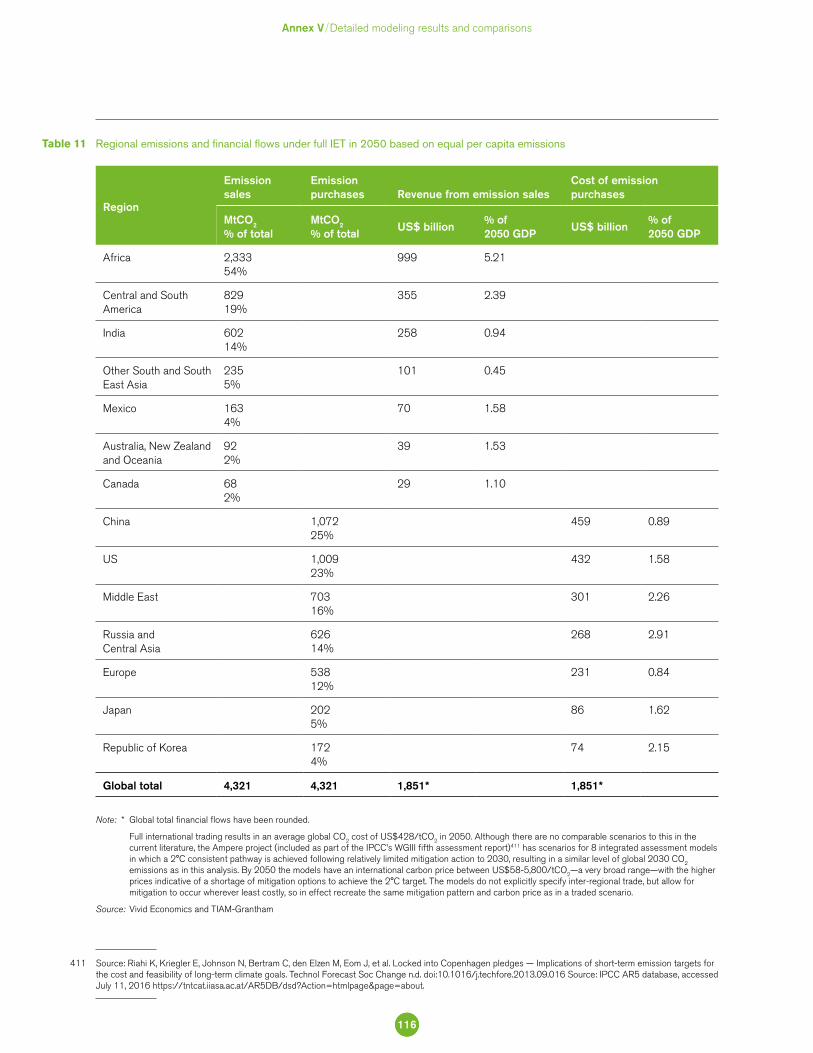
411 Source: Riahi K, Kriegler E, Johnson N, Bertram C, den Elzen M, Eom J, et al. Locked into Copenhagen pledges — Implications of short-term emission targets for the cost and feasibility of long-term climate goals. Technol Forecast Soc Change n.d. doi:10.1016/j.techfore.2013.09.016 Source: IPCC AR5 database, accessed July 11, 2016 https://tntcat.iiasa.ac.at/AR5DB/dsd?Action=htmlpage&page=about.
Annex V Detailed modeling results and comparisons
Note: * Global total financial flows have been rounded.
Full international trading results in an average global CO2 cost of US$428/tCO2 in 2050. Although there are no comparable scenarios to this in the current literature, the Ampere project (included as part of the IPCC’s WGIII fifth assessment report)411 has scenarios for 8 integrated assessment models in which a 2°C consistent pathway is achieved following relatively limited mitigation action to 2030, resulting in a similar level of global 2030 CO2 emissions as in this analysis. By 2050 the models have an international carbon price between US$58-5,800/tCO2—a very broad range—with the higher prices indicative of a shortage of mitigation options to achieve the 2°C target. The models do not explicitly specify inter-regional trade, but allow for mitigation to occur wherever least costly, so in effect recreate the same mitigation pattern and carbon price as in a traded scenario.
Source: Vivid Economics and TIAM-Grantham
Region
Emission sales
Emission purchases Revenue from emission sales
Cost of emission purchases
MtCO2
% of totalMtCO2
% of totalUS$ billion
% of 2050 GDP
US$ billion% of 2050 GDP
Africa 2,333 54%
999 5.21
Central and South America
82919%
355 2.39
India 60214%
258 0.94
Other South and South East Asia
2355%
101 0.45
Mexico 1634%
70 1.58
Australia, New Zealand and Oceania
922%
39 1.53
Canada 682%
29 1.10
China 1,07225%
459 0.89
US 1,00923%
432 1.58
Middle East 70316%
301 2.26
Russia and Central Asia
62614%
268 2.91
Europe 53812%
231 0.84
Japan 2025%
86 1.62
Republic of Korea 1724%
74 2.15
Global total 4,321 4,321 1,851* 1,851*
Regional emissions and financial flows under full IET in 2050 based on equal per capita emissionsTable 11
116
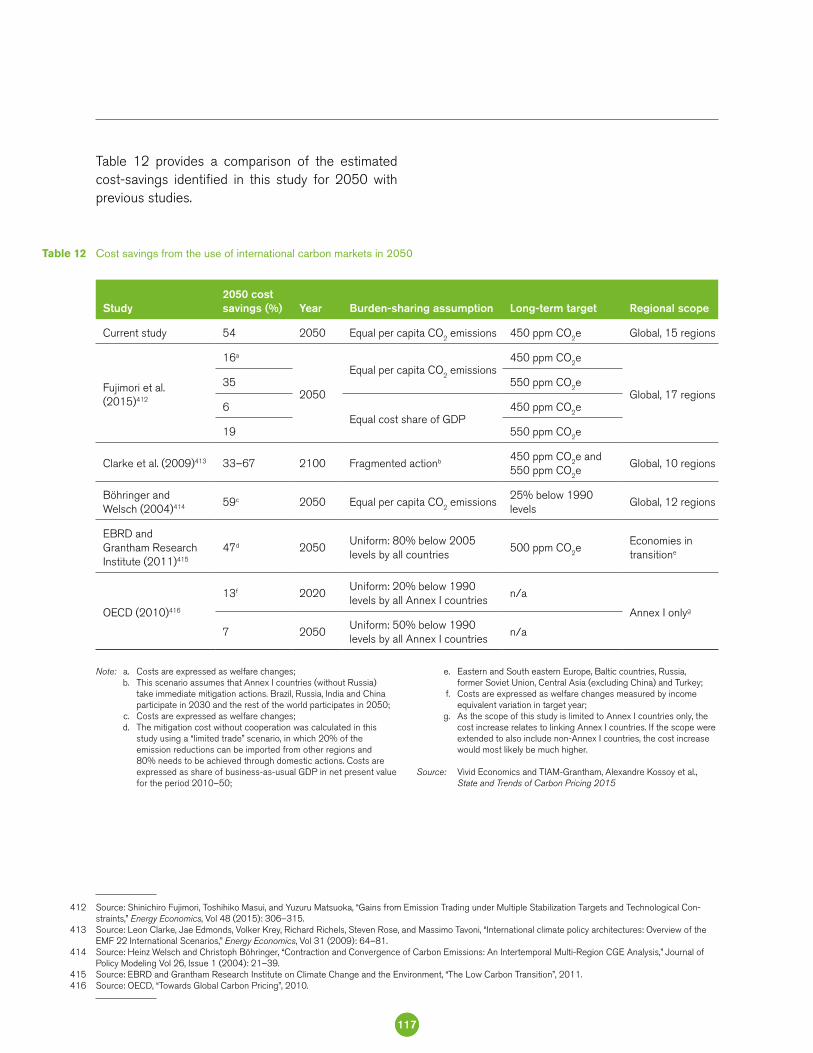
412 Source: Shinichiro Fujimori, Toshihiko Masui, and Yuzuru Matsuoka, “Gains from Emission Trading under Multiple Stabilization Targets and Technological Con-straints,” Energy Economics, Vol 48 (2015): 306–315.
413 Source: Leon Clarke, Jae Edmonds, Volker Krey, Richard Richels, Steven Rose, and Massimo Tavoni, “International climate policy architectures: Overview of the EMF 22 International Scenarios,” Energy Economics, Vol 31 (2009): 64–81.
414 Source: Heinz Welsch and Christoph Böhringer, “Contraction and Convergence of Carbon Emissions: An Intertemporal Multi-Region CGE Analysis,” Journal of Policy Modeling Vol 26, Issue 1 (2004): 21–39.
415 Source: EBRD and Grantham Research Institute on Climate Change and the Environment, “The Low Carbon Transition”, 2011.416 Source: OECD, “Towards Global Carbon Pricing”, 2010.
Study2050 cost savings (%) Year Burden-sharing assumption Long-term target Regional scope
Current study 54 2050 Equal per capita CO2 emissions 450 ppm CO2e Global, 15 regions
Fujimori et al. (2015)412
16a
2050
Equal per capita CO2 emissions450 ppm CO2e
Global, 17 regions35 550 ppm CO2e
6Equal cost share of GDP
450 ppm CO2e
19 550 ppm CO2e
Clarke et al. (2009)413 33–67 2100 Fragmented actionb 450 ppm CO2e and 550 ppm CO2e
Global, 10 regions
Böhringer and Welsch (2004)414 59c 2050 Equal per capita CO2 emissions
25% below 1990 levels
Global, 12 regions
EBRD and Grantham Research Institute (2011)415
47d 2050Uniform: 80% below 2005 levels by all countries
500 ppm CO2eEconomies in transitione
OECD (2010)416
13f 2020Uniform: 20% below 1990levels by all Annex I countries
n/a
Annex I onlyg
7 2050Uniform: 50% below 1990levels by all Annex I countries
n/a
Cost savings from the use of international carbon markets in 2050Table 12
Note: a. Costs are expressed as welfare changes; b. This scenario assumes that Annex I countries (without Russia)
take immediate mitigation actions. Brazil, Russia, India and China participate in 2030 and the rest of the world participates in 2050;
c. Costs are expressed as welfare changes; d. The mitigation cost without cooperation was calculated in this
study using a “limited trade” scenario, in which 20% of the emission reductions can be imported from other regions and 80% needs to be achieved through domestic actions. Costs are expressed as share of business-as-usual GDP in net present value for the period 2010–50;
e. Eastern and South eastern Europe, Baltic countries, Russia, former Soviet Union, Central Asia (excluding China) and Turkey;
f. Costs are expressed as welfare changes measured by income equivalent variation in target year;
g. As the scope of this study is limited to Annex I countries only, the cost increase relates to linking Annex I countries. If the scope were extended to also include non-Annex I countries, the cost increase would most likely be much higher.
Source: Vivid Economics and TIAM-Grantham, Alexandre Kossoy et al., State and Trends of Carbon Pricing 2015
Table 12 provides a comparison of the estimated cost-savings identified in this study for 2050 with previous studies.
117
417 This includes the assumption that even countries not referring in their INDCs to international market mechanisms are participating in IET.418 In practices, countries or regions may revise their 2030 ambition from that included in their INDCs before submitting their NDCs and also increase the ambition
of their NDCs over time, as foreseen by the Paris Agreement review mechanism.
OVERALL OBJECTIVE
The analysis estimates global cost savings and regional emission and financial flows of a scenario with full IET compared with a scenario without any emissions trading.417 Both scenarios assume each world region meets its 2030 NDC contribution, which, on the basis of current information, is assumed to be equal to the INDCs submitted up to June 2016.418 Beyond 2030, the world reduces its CO2 emissions in line with limiting global warming to less than 2°C above pre-industrial levels (with 50 percent likelihood) in 2100, assuming equal per capita CO2 emissions from fossil fuel combustion for energy use in 2050.
DETAILS OF MODELING APPROACH
This analysis uses the Imperial College London Grantham Institute’s TIMES Integrated Assessment Model (TIAM-Grantham). The model represents all major energy extraction, conversion, supply, distribution and consumption processes in 15 world regions, as well as trade in fuels and CO2 permits.
TIAM-Grantham is an energy systems model formulated to explore technology and economics of global low carbon transitions. It is a technology-rich optimisation model that maximises combined consumer and producer surplus while achieving a specified carbon budget. It is segregated into 15 regions, where Eastern and Western Europe are grouped together for this assessment, incorporates the time horizon to 2100, and includes all sectors of the economy from primary energy supply (oil, coal, gas, renewables, etc.), through energy conversion sectors (power sector, refineries, etc.) to end-use sectors (industry, commercial, residential, transport, agriculture). TIAM includes more than 3,000 technologies individually characterised in terms of costs and performance, and the model selects from these technologies to achieve a mitigation target.
The model structure inherently produces a carbon price associated with achieving a carbon budget, and the emissions trading between all regions or specific regions can be enabled or disabled, as can the timing of the start of emissions trading. A schematic of the broad sectoral breakdown in TIAM is shown in Figure 20.
Annex VICALCULATION OF IMPLICATIONS
OF USING AN INTERNATIONAL CARBON MARKET FOR MEETING MITIGATION TARGETS
118
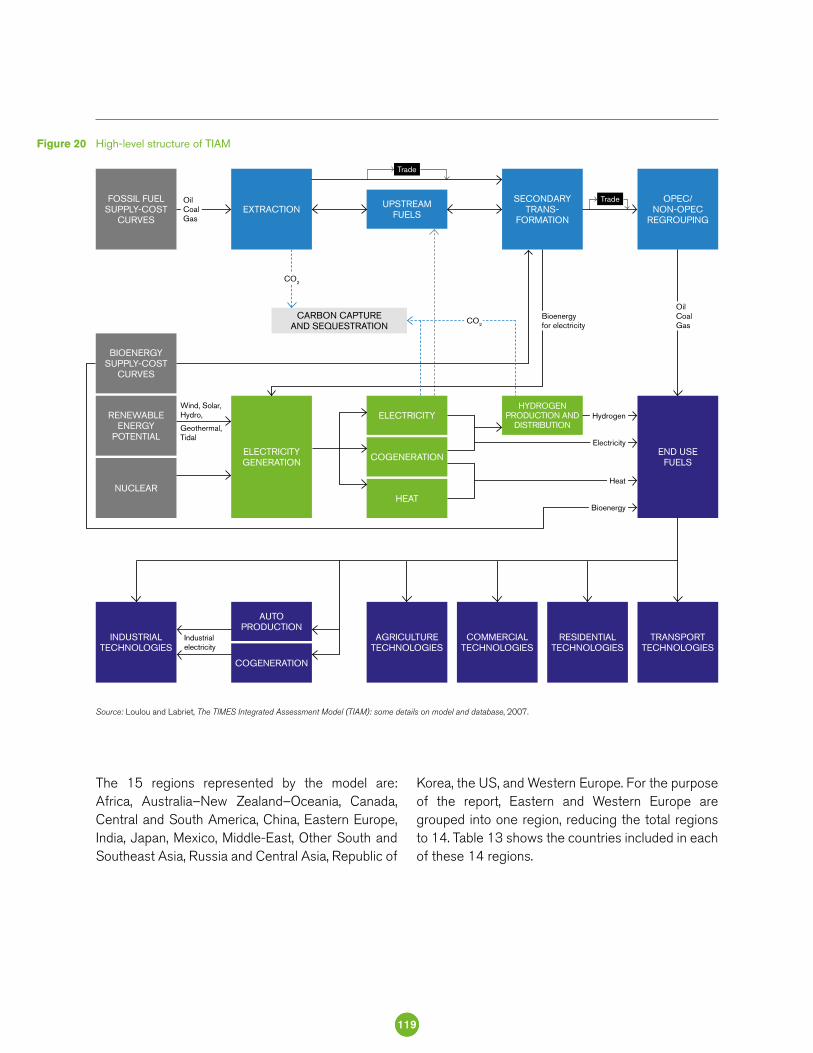
The 15 regions represented by the model are: Africa, Australia–New Zealand–Oceania, Canada, Central and South America, China, Eastern Europe, India, Japan, Mexico, Middle-East, Other South and Southeast Asia, Russia and Central Asia, Republic of
Korea, the US, and Western Europe. For the purpose of the report, Eastern and Western Europe are grouped into one region, reducing the total regions to 14. Table 13 shows the countries included in each of these 14 regions.
High-level structure of TIAM Figure 20
Source: Loulou and Labriet, The TIMES Integrated Assessment Model (TIAM): some details on model and database, 2007.
EXTRACTION UPSTREAM FUELS
SECONDARY TRANS-
FORMATION
OPEC/ NON-OPEC
REGROUPING
FOSSIL FUEL SUPPLY-COST
CURVES
BIOENERGYSUPPLY-COST
CURVES
RENEWABLE ENERGY
POTENTIAL
NUCLEAR
INDUSTRIAL TECHNOLOGIES
AUTO PRODUCTION
COGENERATION
AGRICULTURE TECHNOLOGIES
COMMERCIAL TECHNOLOGIES
RESIDENTIAL TECHNOLOGIES
TRANSPORT TECHNOLOGIES
Trade
OilCoalGas
Industrial electricity
ELECTRICITY GENERATION
HYDROGEN PRODUCTION AND
DISTRIBUTIONELECTRICITY
COGENERATION
HEAT
END USE FUELS
Wind, Solar, Hydro, Geo thermal, Tidal
CARBON CAPTURE AND SEQUESTRATION
CO2
CO2
Bioenergy for electricity
OilCoalGas
Electricity
Heat
Hydrogen
Bioenergy
Trade
119

Annex VI Calculation of implications of using an international carbon market for meeting mitigation targets
419 This is also referred to as Former Soviet Union in other ETSAP-TIAM analysis.420 This is also referred to as Other Developing Asia in other ETSAP-TIAM analysis.
The model is the Grantham Institute’s version of the ETSAP-TIAM model, developed and maintained by the IEA’s Energy Technology Systems Analysis Program (ETSAP).
The model optimizes the energy system for given climate constraints by maximizing the total
discounted energy system welfare (producer and consumer surplus) over a given time horizon. This allows an assessment of the welfare losses of meeting a climate target by substituting low-carbon energy technologies for existing technologies while meeting current and future world energy service needs. Global cost savings are global welfare gains.
Region (TIAM) Countries or economies
AFR AfricaAlgeria, Angola, Benin, Botswana, Cameroon, Congo, Rep., Congo, Dem. Rep., Côte d’Ivoire, Egypt, Arab Rep., Eritrea, Ethiopia, Gabon, Ghana, Kenya, Libya, Morocco, Mozambique, Namibia, Nigeria, Senegal, South Africa, Sudan, Tanzania, Togo, Tunisia, Zambia, Zimbabwe, and Other Africa
AUSAustralia, New Zealand, Oceania
Australia, New Zealand, Oceania
CAN Canada Canada
CHI China China
CSACentral & South America
Argentina, Bolivia, Brazil, Chile, Colombia, Costa Rica, Cuba, Dominican Republic, Ecuador, El Salvador, Guatemala, Haiti, Honduras, Jamaica, Netherlands Antilles, Nicaragua, Panama, Paraguay, Peru, Trinidad and Tobago, Uruguay, Venezuela, RB, and Other Latin America
EEUEastern and Western Europe
Albania, Austria, Belgium, Bosnia-Herzegovina, Bulgaria, Croatia, Cyprus, Czech Republic, Denmark, Finland, France, Germany, Greece, Hungary, Iceland, Ireland, Italy, Luxembourg, Macedonia, FYR, Malta, Norway, Poland, Portugal, Romania, Serbia, Slovenia, Slovak Republic, Spain, Sweden, Switzerland, Netherlands, UK
IND India India
JPN Japan Japan
MEA Middle East Bahrain, Iran, Islamic Rep., Iraq, Israel, Jordan, Kuwait, Lebanon, Oman, Qatar, Saudi Arabia, Syria, United Arab Emirates, Yemen, and Turkey, Cyprus
MEX Mexico Mexico
RCA419 Russia and Central Asia
Armenia, Azerbaijan, Belarus, Estonia, Georgia, Kazakhstan, Kyrgyz Republic, Latvia, Lithuania, Moldova, Tajikistan, Turkmenistan, Ukraine, Uzbekistan, Russian Federation
RKO Republic of Korea Korea, Rep.
SSEA420 (Other) South and Southeast Asia
Bangladesh, Brunei Darussalam, Cambodia, Indonesia, Korea, Dem. Rep., Malaysia, Mongolia, Myanmar, Nepal, Pakistan, Philippines, Singapore, Sri Lanka, Thailand, Vietnam and Other Asia
USA US US
Details of countries in each of the 14 TIAM-Grantham regionsTable 13
Note: Tables 13 and the rest of this Annex use the TIAM-Grantham country nomenclature.Source: TIAM-Grantham
120
421 Source: A. Gambhir, T. A. Napp, C. J. M. Emmott, G. Anandarajah, “India’s CO2 emissions pathways to 2050: Energy system, economic and fossil fuel impacts with and without carbon permit trading”, Energy 2014;77:791–801. doi:10.1016/j.energy.2014.09.055.
422 Source: AVOID 2, Feasibility Feasibility of meeting 2°C, accessed 31 August, 2016, http://www.avoid.uk.net/feasibility/.423 Source: B. C. O’Neill, E. Kriegler, K. Riahi, K. L. Ebi, S. Hallegatte, T. R. Carter et al., “A new scenario framework for climate change research: the concept of shared
socioeconomic pathways”, Climatic Change, 2014;122:387–400. doi:10.1007/s10584-013-0905-2.424 Source: A. Gambhir, T. A. Napp, A. Hawkes, D. L. McCollum, O. Fricko, P. Havlik, et al., Assessing the challenges of global long-term mitigation scenarios - AVOID
2 WPC2a 2015.
The model allows for rapid assessment of future climate and associated policy regimes, including a range of emissions constraints on either particular years or cumulatively over the 21st century. In addition, the TIAM modeling framework can represent energy resource and emissions trading across the 14 world regions, and can analyze the costs of mitigation with and without emissions trading.421
The model has been used as part of the UK Government-funded AVOIDing dangerous climate change research program (AVOID 2: February 2014 to March 2016) to produce a number of outputs for the run up to, and dissemination at, COP 21 in Paris.422 The most recent AVOID 2 analysis specified a range of regional emissions constraints to represent the INDCs in order to understand the costs and feasibility of meeting the goal of keeping the average global temperature increase below 2°C by 2100.
The model, as used in this analysis, has some important features and limitations:
– The model represents only CO2 emissions from the energy system, as well as from industrial processes (mainly cement manufacture). It does not represent non-CO2 GHGs or CO2 from agriculture, forestry and other land use (AFOLU). This implies that the model covers 69.7 percent of 2012 global GHG emissions.
– The model assumes that cement process emissions cannot be mitigated. A corollary of this is that the model assumes that only energy CO2 emissions can be traded.
– The model start year is 2012 and the end year is 2100.
– The model incorporates energy demand growth assumptions based on exogenous socioeconomic drivers. These drivers are population and regional GDP growth, illustrated in Table 14 below, as derived from the new Shared Socioeconomic Pathways (SSP) storylines, specifically the OECD variant of the second of the five different pathways (SSP2)SSP. This is a “middle of the road” scenario that broadly extrapolates past trends of country growth and development.423
– The model incorporates price-elastic demand for energy services.
– The model maximizes welfare at a global level (considering the welfare of energy producers and consumers). This is essentially the combination of minimizing costs of the entire energy system (including amortized capital, annual operating and fuel costs) while accounting for welfare changes resulting from changes to energy demand driven by energy cost changes.
– The model projects energy service demand and the evolution of the energy system in ten-year time intervals—results are reported for 2020, 2030, 2040 and so on, to 2100.
– The model set-up includes a 2020 CO2 target for each of the 14 regions which is estimated to be in line with the lower ambition/unilateral end of the Cancún pledges. Since regions do not represent countries and since countries’ Cancún targets are stated as a mix of CO2, GHGs and absolute and intensity targets, estimates were required to specify targets for each region. Details are given in Gambhir et al. (2015)424 and the resulting targets are presented in Table 15.
121
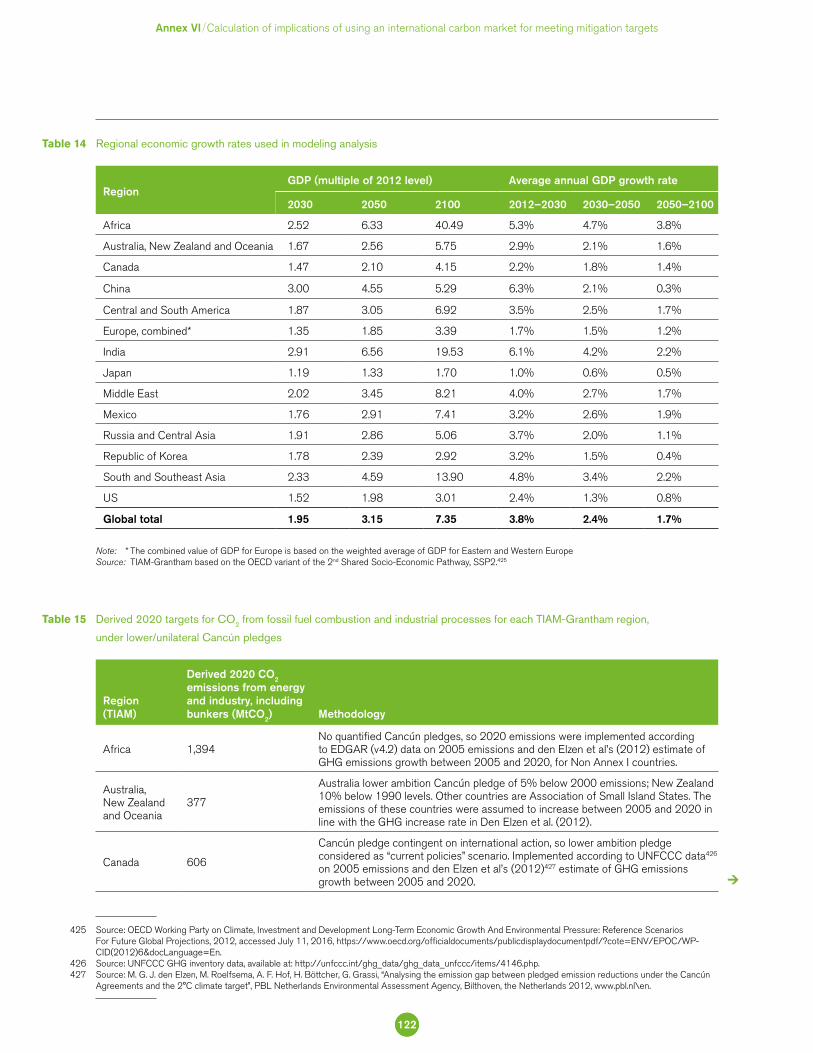
425 Source: OECD Working Party on Climate, Investment and Development Long-Term Economic Growth And Environmental Pressure: Reference Scenarios For Future Global Projections, 2012, accessed July 11, 2016, https://www.oecd.org/officialdocuments/publicdisplaydocumentpdf/?cote=ENV/EPOC/WP-CID(2012)6&docLanguage=En.
426 Source: UNFCCC GHG inventory data, available at: http://unfccc.int/ghg_data/ghg_data_unfccc/items/4146.php. 427 Source: M. G. J. den Elzen, M. Roelfsema, A. F. Hof, H. Böttcher, G. Grassi, “Analysing the emission gap between pledged emission reductions under the Cancún
Agreements and the 2°C climate target”, PBL Netherlands Environmental Assessment Agency, Bilthoven, the Netherlands 2012, www.pbl.nl\en.
Annex VI Calculation of implications of using an international carbon market for meeting mitigation targets
Region (TIAM)
Derived 2020 CO2 emissions from energy and industry, including bunkers (MtCO2) Methodology
Africa 1,394No quantified Cancún pledges, so 2020 emissions were implemented according to EDGAR (v4.2) data on 2005 emissions and den Elzen et al’s (2012) estimate of GHG emissions growth between 2005 and 2020, for Non Annex I countries.
Australia, New Zealand and Oceania
377
Australia lower ambition Cancún pledge of 5% below 2000 emissions; New Zealand 10% below 1990 levels. Other countries are Association of Small Island States. The emissions of these countries were assumed to increase between 2005 and 2020 in line with the GHG increase rate in Den Elzen et al. (2012).
Canada 606
Cancún pledge contingent on international action, so lower ambition pledge considered as “current policies” scenario. Implemented according to UNFCCC data426 on 2005 emissions and den Elzen et al’s (2012)427 estimate of GHG emissions growth between 2005 and 2020.
Derived 2020 targets for CO2 from fossil fuel combustion and industrial processes for each TIAM-Grantham region,
under lower/unilateral Cancún pledges
Table 15
RegionGDP (multiple of 2012 level) Average annual GDP growth rate
2030 2050 2100 2012–2030 2030–2050 2050–2100
Africa 2.52 6.33 40.49 5.3% 4.7% 3.8%
Australia, New Zealand and Oceania 1.67 2.56 5.75 2.9% 2.1% 1.6%
Canada 1.47 2.10 4.15 2.2% 1.8% 1.4%
China 3.00 4.55 5.29 6.3% 2.1% 0.3%
Central and South America 1.87 3.05 6.92 3.5% 2.5% 1.7%
Europe, combined* 1.35 1.85 3.39 1.7% 1.5% 1.2%
India 2.91 6.56 19.53 6.1% 4.2% 2.2%
Japan 1.19 1.33 1.70 1.0% 0.6% 0.5%
Middle East 2.02 3.45 8.21 4.0% 2.7% 1.7%
Mexico 1.76 2.91 7.41 3.2% 2.6% 1.9%
Russia and Central Asia 1.91 2.86 5.06 3.7% 2.0% 1.1%
Republic of Korea 1.78 2.39 2.92 3.2% 1.5% 0.4%
South and Southeast Asia 2.33 4.59 13.90 4.8% 3.4% 2.2%
US 1.52 1.98 3.01 2.4% 1.3% 0.8%
Global total 1.95 3.15 7.35 3.8% 2.4% 1.7%
Regional economic growth rates used in modeling analysisTable 14
Note: * The combined value of GDP for Europe is based on the weighted average of GDP for Eastern and Western EuropeSource: TIAM-Grantham based on the OECD variant of the 2nd Shared Socio-Economic Pathway, SSP2.425
122
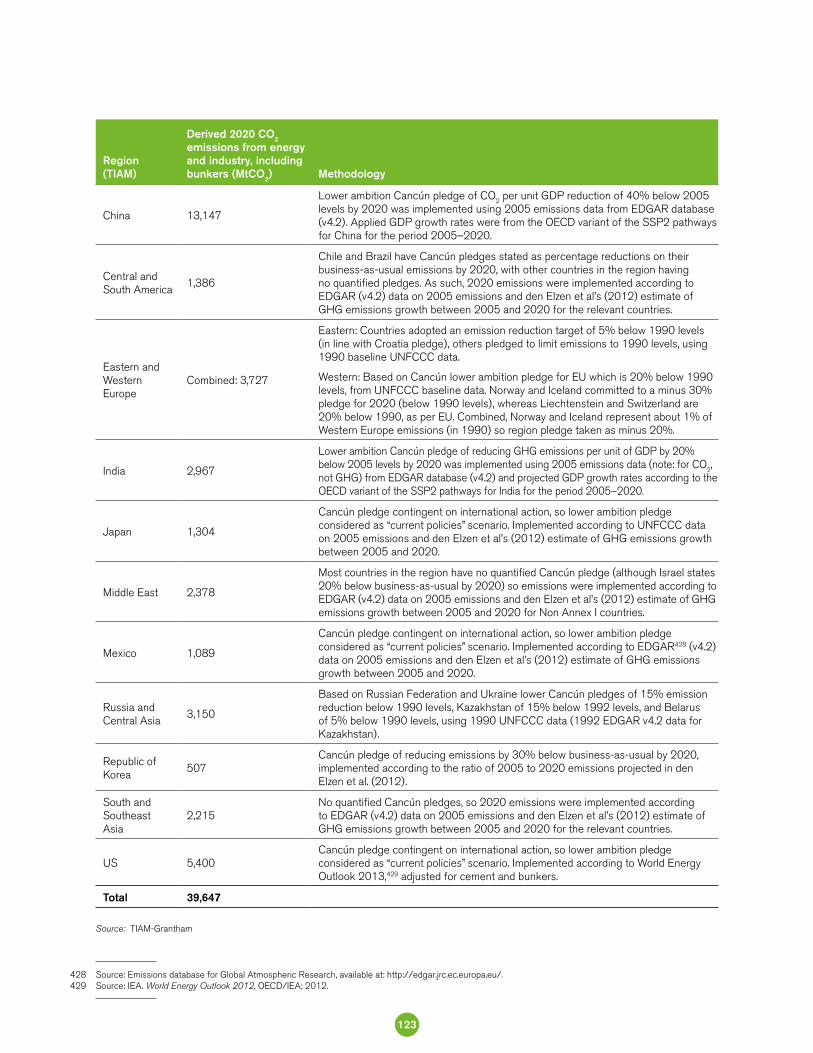
428 Source: Emissions database for Global Atmospheric Research, available at: http://edgar.jrc.ec.europa.eu/. 429 Source: IEA. World Energy Outlook 2012, OECD/IEA; 2012.
China 13,147
Lower ambition Cancún pledge of CO2 per unit GDP reduction of 40% below 2005 levels by 2020 was implemented using 2005 emissions data from EDGAR database (v4.2). Applied GDP growth rates were from the OECD variant of the SSP2 pathways for China for the period 2005–2020.
Central and South America
1,386
Chile and Brazil have Cancún pledges stated as percentage reductions on their business-as-usual emissions by 2020, with other countries in the region having no quantified pledges. As such, 2020 emissions were implemented according to EDGAR (v4.2) data on 2005 emissions and den Elzen et al’s (2012) estimate of GHG emissions growth between 2005 and 2020 for the relevant countries.
Eastern and Western Europe
Combined: 3,727
Eastern: Countries adopted an emission reduction target of 5% below 1990 levels (in line with Croatia pledge), others pledged to limit emissions to 1990 levels, using 1990 baseline UNFCCC data.
Western: Based on Cancún lower ambition pledge for EU which is 20% below 1990 levels, from UNFCCC baseline data. Norway and Iceland committed to a minus 30% pledge for 2020 (below 1990 levels), whereas Liechtenstein and Switzerland are 20% below 1990, as per EU. Combined, Norway and Iceland represent about 1% of Western Europe emissions (in 1990) so region pledge taken as minus 20%.
India 2,967
Lower ambition Cancún pledge of reducing GHG emissions per unit of GDP by 20% below 2005 levels by 2020 was implemented using 2005 emissions data (note: for CO2, not GHG) from EDGAR database (v4.2) and projected GDP growth rates according to the OECD variant of the SSP2 pathways for India for the period 2005–2020.
Japan 1,304
Cancún pledge contingent on international action, so lower ambition pledge considered as “current policies” scenario. Implemented according to UNFCCC data on 2005 emissions and den Elzen et al’s (2012) estimate of GHG emissions growth between 2005 and 2020.
Middle East 2,378
Most countries in the region have no quantified Cancún pledge (although Israel states 20% below business-as-usual by 2020) so emissions were implemented according to EDGAR (v4.2) data on 2005 emissions and den Elzen et al’s (2012) estimate of GHG emissions growth between 2005 and 2020 for Non Annex I countries.
Mexico 1,089
Cancún pledge contingent on international action, so lower ambition pledge considered as “current policies” scenario. Implemented according to EDGAR428 (v4.2) data on 2005 emissions and den Elzen et al’s (2012) estimate of GHG emissions growth between 2005 and 2020.
Russia and Central Asia
3,150
Based on Russian Federation and Ukraine lower Cancún pledges of 15% emission reduction below 1990 levels, Kazakhstan of 15% below 1992 levels, and Belarus of 5% below 1990 levels, using 1990 UNFCCC data (1992 EDGAR v4.2 data for Kazakhstan).
Republic of Korea
507Cancún pledge of reducing emissions by 30% below business-as-usual by 2020, implemented according to the ratio of 2005 to 2020 emissions projected in den Elzen et al. (2012).
South and Southeast Asia
2,215No quantified Cancún pledges, so 2020 emissions were implemented according to EDGAR (v4.2) data on 2005 emissions and den Elzen et al’s (2012) estimate of GHG emissions growth between 2005 and 2020 for the relevant countries.
US 5,400Cancún pledge contingent on international action, so lower ambition pledge considered as “current policies” scenario. Implemented according to World Energy Outlook 2013,429 adjusted for cement and bunkers.
Total 39,647
Source: TIAM-Grantham
Region (TIAM)
Derived 2020 CO2 emissions from energy and industry, including bunkers (MtCO2) Methodology
123
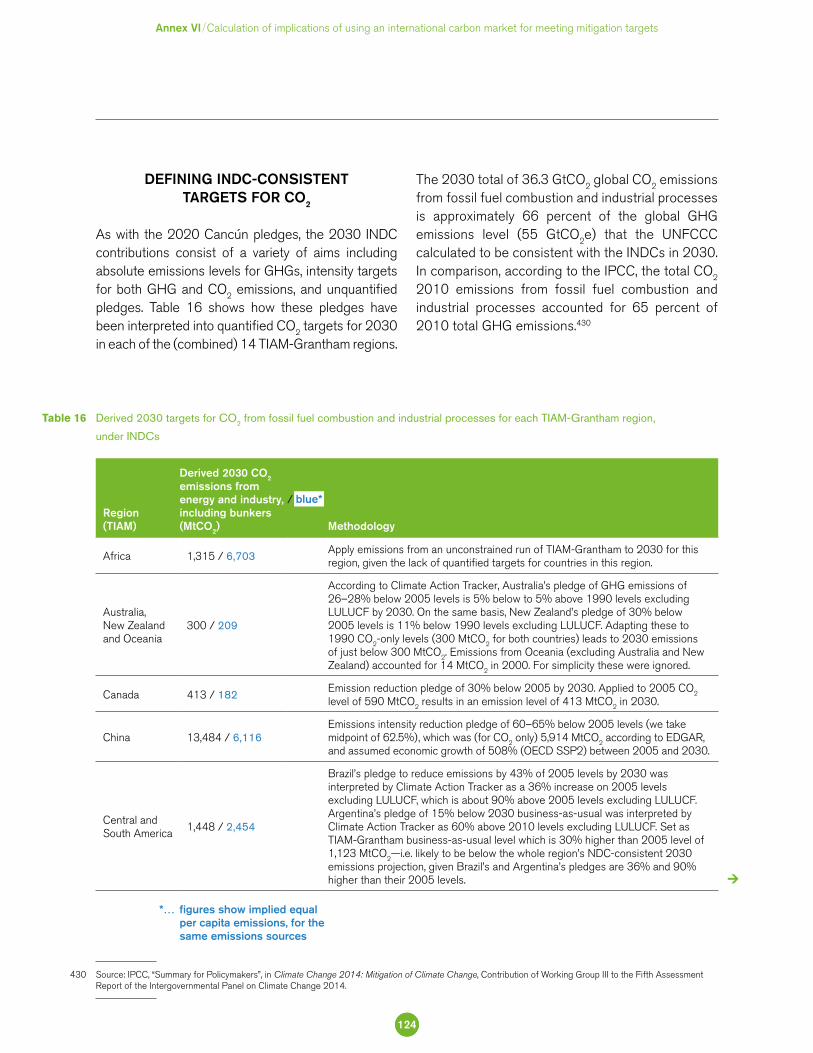
Annex VI Calculation of implications of using an international carbon market for meeting mitigation targets
The 2030 total of 36.3 GtCO2 global CO2 emissions from fossil fuel combustion and industrial processes is approximately 66 percent of the global GHG emissions level (55 GtCO2e) that the UNFCCC calculated to be consistent with the INDCs in 2030. In comparison, according to the IPCC, the total CO2 2010 emissions from fossil fuel combustion and industrial processes accounted for 65 percent of 2010 total GHG emissions.430
DEFINING INDC-CONSISTENT TARGETS FOR CO2
As with the 2020 Cancún pledges, the 2030 INDC contributions consist of a variety of aims including absolute emissions levels for GHGs, intensity targets for both GHG and CO2 emissions, and unquantified pledges. Table 16 shows how these pledges have been interpreted into quantified CO2 targets for 2030 in each of the (combined) 14 TIAM-Grantham regions.
430 Source: IPCC, “Summary for Policymakers”, in Climate Change 2014: Mitigation of Climate Change, Contribution of Working Group III to the Fifth Assessment Report of the Intergovernmental Panel on Climate Change 2014.
Region (TIAM)
Derived 2030 CO2 emissions from energy and industry, including bunkers (MtCO2)
/ blue*
Methodology
Africa 1,315 / 6,703Apply emissions from an unconstrained run of TIAM-Grantham to 2030 for this region, given the lack of quantified targets for countries in this region.
Australia, New Zealand and Oceania
300 / 209
According to Climate Action Tracker, Australia’s pledge of GHG emissions of 26–28% below 2005 levels is 5% below to 5% above 1990 levels excluding LULUCF by 2030. On the same basis, New Zealand’s pledge of 30% below 2005 levels is 11% below 1990 levels excluding LULUCF. Adapting these to 1990 CO2-only levels (300 MtCO2 for both countries) leads to 2030 emissions of just below 300 MtCO2. Emissions from Oceania (excluding Australia and New Zealand) accounted for 14 MtCO2 in 2000. For simplicity these were ignored.
Canada 413 / 182Emission reduction pledge of 30% below 2005 by 2030. Applied to 2005 CO2 level of 590 MtCO2 results in an emission level of 413 MtCO2 in 2030.
China 13,484 / 6,116Emissions intensity reduction pledge of 60–65% below 2005 levels (we take midpoint of 62.5%), which was (for CO2 only) 5,914 MtCO2 according to EDGAR, and assumed economic growth of 508% (OECD SSP2) between 2005 and 2030.
Central and South America 1,448 / 2,454
Brazil’s pledge to reduce emissions by 43% of 2005 levels by 2030 was interpreted by Climate Action Tracker as a 36% increase on 2005 levels excluding LULUCF, which is about 90% above 2005 levels excluding LULUCF. Argentina’s pledge of 15% below 2030 business-as-usual was interpreted by Climate Action Tracker as 60% above 2010 levels excluding LULUCF. Set as TIAM-Grantham business-as-usual level which is 30% higher than 2005 level of 1,123 MtCO2—i.e. likely to be below the whole region’s NDC-consistent 2030 emissions projection, given Brazil’s and Argentina’s pledges are 36% and 90% higher than their 2005 levels.
Derived 2030 targets for CO2 from fossil fuel combustion and industrial processes for each TIAM-Grantham region,
under INDCs
Table 16
*… figures show implied equal per capita emissions, for the same emissions sources
124
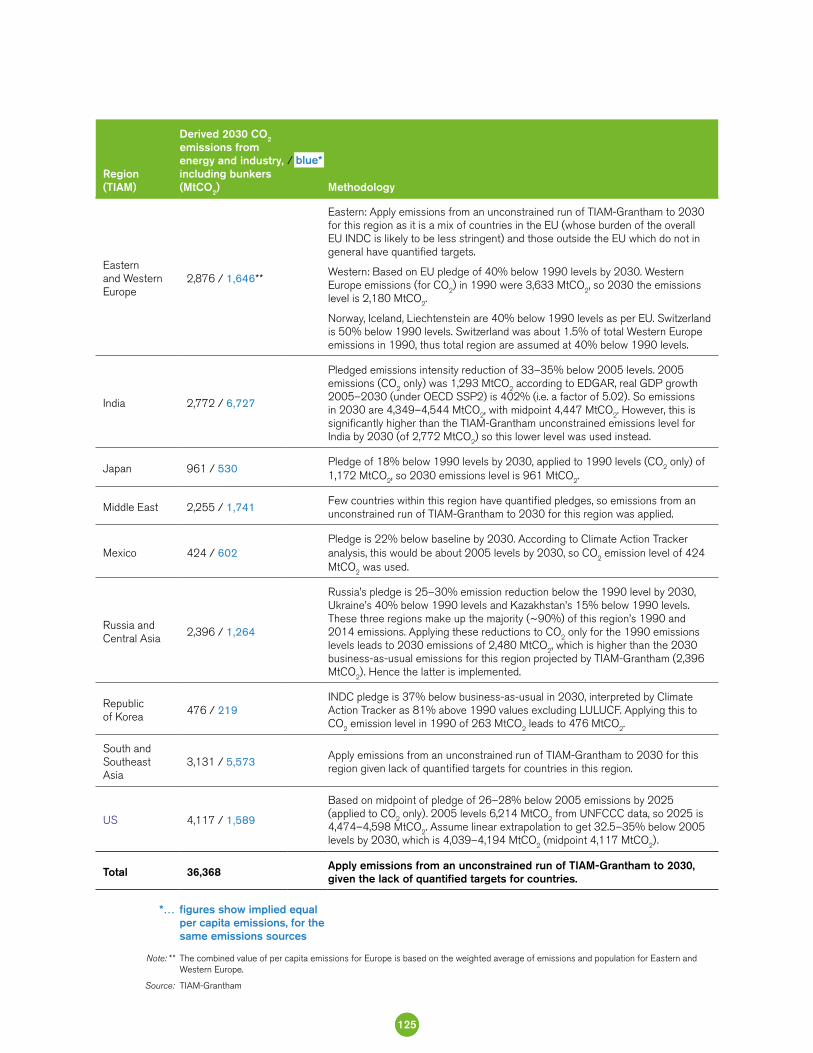
Eastern and Western Europe
2,876 / 1,646**
Eastern: Apply emissions from an unconstrained run of TIAM-Grantham to 2030 for this region as it is a mix of countries in the EU (whose burden of the overall EU INDC is likely to be less stringent) and those outside the EU which do not in general have quantified targets.
Western: Based on EU pledge of 40% below 1990 levels by 2030. Western Europe emissions (for CO2) in 1990 were 3,633 MtCO2, so 2030 the emissions level is 2,180 MtCO2.
Norway, Iceland, Liechtenstein are 40% below 1990 levels as per EU. Switzerland is 50% below 1990 levels. Switzerland was about 1.5% of total Western Europe emissions in 1990, thus total region are assumed at 40% below 1990 levels.
India 2,772 / 6,727
Pledged emissions intensity reduction of 33–35% below 2005 levels. 2005 emissions (CO2 only) was 1,293 MtCO2 according to EDGAR, real GDP growth 2005–2030 (under OECD SSP2) is 402% (i.e. a factor of 5.02). So emissions in 2030 are 4,349–4,544 MtCO2, with midpoint 4,447 MtCO2. However, this is significantly higher than the TIAM-Grantham unconstrained emissions level for India by 2030 (of 2,772 MtCO2) so this lower level was used instead.
Japan 961 / 530Pledge of 18% below 1990 levels by 2030, applied to 1990 levels (CO2 only) of 1,172 MtCO2, so 2030 emissions level is 961 MtCO2.
Middle East 2,255 / 1,741Few countries within this region have quantified pledges, so emissions from an unconstrained run of TIAM-Grantham to 2030 for this region was applied.
Mexico 424 / 602Pledge is 22% below baseline by 2030. According to Climate Action Tracker analysis, this would be about 2005 levels by 2030, so CO2 emission level of 424 MtCO2 was used.
Russia and Central Asia 2,396 / 1,264
Russia’s pledge is 25–30% emission reduction below the 1990 level by 2030, Ukraine’s 40% below 1990 levels and Kazakhstan’s 15% below 1990 levels. These three regions make up the majority (~90%) of this region’s 1990 and 2014 emissions. Applying these reductions to CO2 only for the 1990 emissions levels leads to 2030 emissions of 2,480 MtCO2, which is higher than the 2030 business-as-usual emissions for this region projected by TIAM-Grantham (2,396 MtCO2). Hence the latter is implemented.
Republic of Korea 476 / 219
INDC pledge is 37% below business-as-usual in 2030, interpreted by Climate Action Tracker as 81% above 1990 values excluding LULUCF. Applying this to CO2 emission level in 1990 of 263 MtCO2 leads to 476 MtCO2.
South and Southeast Asia
3,131 / 5,573Apply emissions from an unconstrained run of TIAM-Grantham to 2030 for this region given lack of quantified targets for countries in this region.
US 4,117 / 1,589
Based on midpoint of pledge of 26–28% below 2005 emissions by 2025 (applied to CO2 only). 2005 levels 6,214 MtCO2 from UNFCCC data, so 2025 is 4,474–4,598 MtCO2. Assume linear extrapolation to get 32.5–35% below 2005 levels by 2030, which is 4,039–4,194 MtCO2 (midpoint 4,117 MtCO2).
Total 36,368 Apply emissions from an unconstrained run of TIAM-Grantham to 2030, given the lack of quantified targets for countries.
Region (TIAM)
Derived 2030 CO2 emissions from energy and industry, including bunkers (MtCO2)
/ blue*
Methodology
*… figures show implied equal per capita emissions, for the same emissions sources
Note: ** The combined value of per capita emissions for Europe is based on the weighted average of emissions and population for Eastern and Western Europe.
Source: TIAM-Grantham
125
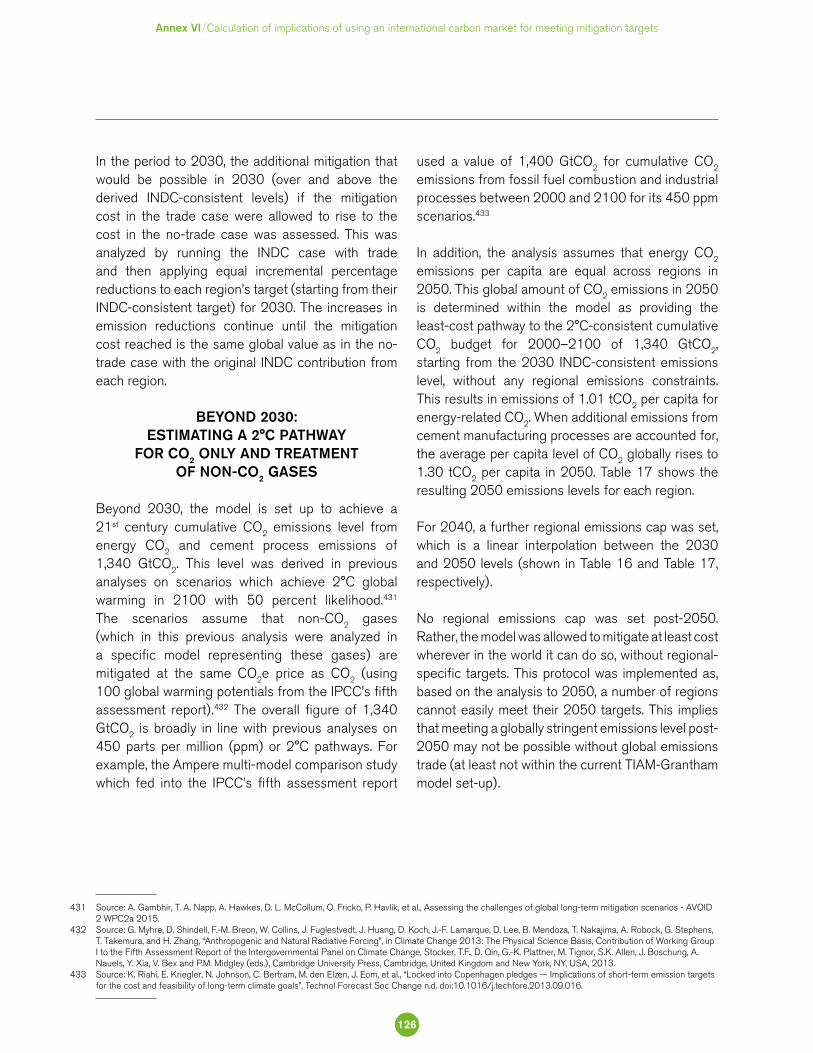
Annex VI Calculation of implications of using an international carbon market for meeting mitigation targets
In the period to 2030, the additional mitigation that would be possible in 2030 (over and above the derived INDC-consistent levels) if the mitigation cost in the trade case were allowed to rise to the cost in the no-trade case was assessed. This was analyzed by running the INDC case with trade and then applying equal incremental percentage reductions to each region’s target (starting from their INDC-consistent target) for 2030. The increases in emission reductions continue until the mitigation cost reached is the same global value as in the no-trade case with the original INDC contribution from each region.
BEYOND 2030: ESTIMATING A 2°C PATHWAY
FOR CO2 ONLY AND TREATMENT OF NON-CO2 GASES
Beyond 2030, the model is set up to achieve a 21st century cumulative CO2 emissions level from energy CO2 and cement process emissions of 1,340 GtCO2. This level was derived in previous analyses on scenarios which achieve 2°C global warming in 2100 with 50 percent likelihood.431 The scenarios assume that non-CO2 gases (which in this previous analysis were analyzed in a specific model representing these gases) are mitigated at the same CO2e price as CO2 (using 100 global warming potentials from the IPCC’s fifth assessment report).432 The overall figure of 1,340 GtCO2 is broadly in line with previous analyses on 450 parts per million (ppm) or 2°C pathways. For example, the Ampere multi-model comparison study which fed into the IPCC’s fifth assessment report
used a value of 1,400 GtCO2 for cumulative CO2 emissions from fossil fuel combustion and industrial processes between 2000 and 2100 for its 450 ppm scenarios.433
In addition, the analysis assumes that energy CO2 emissions per capita are equal across regions in 2050. This global amount of CO2 emissions in 2050 is determined within the model as providing the least-cost pathway to the 2°C-consistent cumulative CO2 budget for 2000–2100 of 1,340 GtCO2, starting from the 2030 INDC-consistent emissions level, without any regional emissions constraints. This results in emissions of 1.01 tCO2 per capita for energy-related CO2. When additional emissions from cement manufacturing processes are accounted for, the average per capita level of CO2 globally rises to 1.30 tCO2 per capita in 2050. Table 17 shows the resulting 2050 emissions levels for each region.
For 2040, a further regional emissions cap was set, which is a linear interpolation between the 2030 and 2050 levels (shown in Table 16 and Table 17, respectively).
No regional emissions cap was set post-2050. Rather, the model was allowed to mitigate at least cost wherever in the world it can do so, without regional-specific targets. This protocol was implemented as, based on the analysis to 2050, a number of regions cannot easily meet their 2050 targets. This implies that meeting a globally stringent emissions level post-2050 may not be possible without global emissions trade (at least not within the current TIAM-Grantham model set-up).
431 Source: A. Gambhir, T. A. Napp, A. Hawkes, D. L. McCollum, O. Fricko, P. Havlik, et al., Assessing the challenges of global long-term mitigation scenarios - AVOID 2 WPC2a 2015.
432 Source: G. Myhre, D. Shindell, F.-M. Breon, W. Collins, J. Fuglestvedt, J. Huang, D. Koch, J.-F. Lamarque, D. Lee, B. Mendoza, T. Nakajima, A. Robock, G. Stephens, T. Takemura, and H. Zhang, “Anthropogenic and Natural Radiative Forcing”, in Climate Change 2013: The Physical Science Basis, Contribution of Working Group I to the Fifth Assessment Report of the Intergovernmental Panel on Climate Change, Stocker, T.F., D. Qin, G.-K. Plattner, M. Tignor, S.K. Allen, J. Boschung, A. Nauels, Y. Xia, V. Bex and P.M. Midgley (eds.), Cambridge University Press, Cambridge, United Kingdom and New York, NY, USA, 2013.
433 Source: K. Riahi, E. Kriegler, N. Johnson, C. Bertram, M. den Elzen, J. Eom, et al., “Locked into Copenhagen pledges — Implications of short-term emission targets for the cost and feasibility of long-term climate goals”, Technol Forecast Soc Change n.d. doi:10.1016/j.techfore.2013.09.016.
126
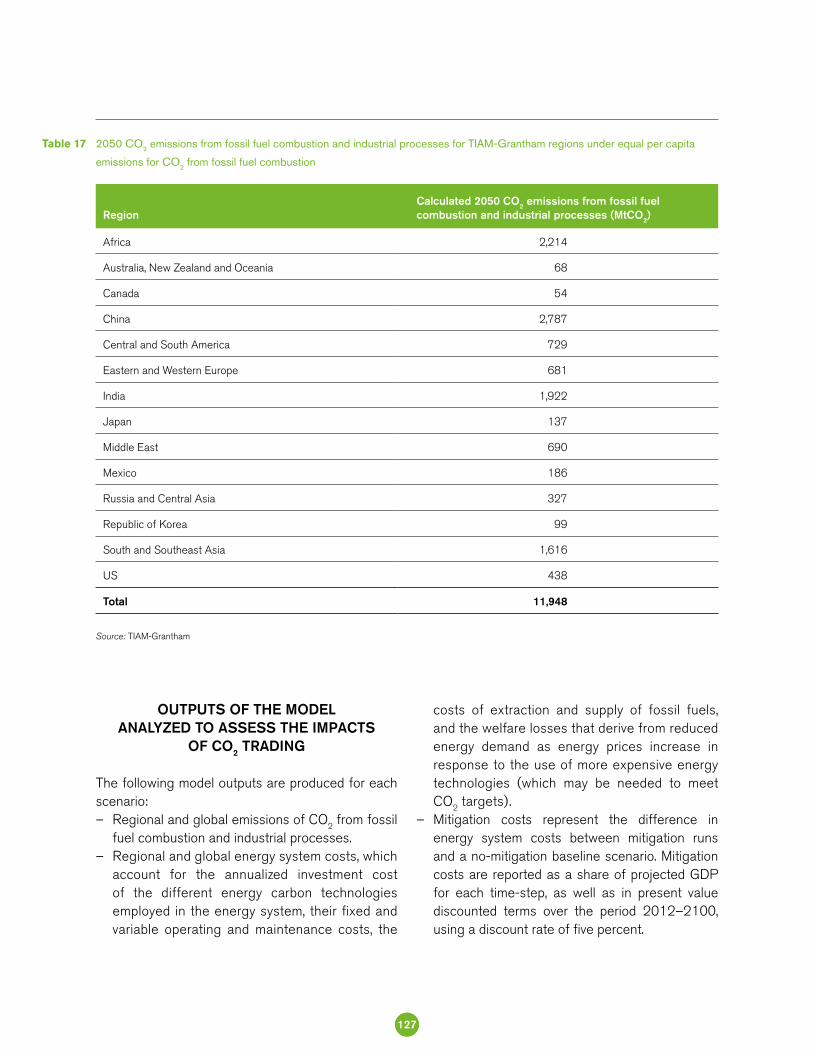
OUTPUTS OF THE MODEL ANALYZED TO ASSESS THE IMPACTS
OF CO2 TRADING
The following model outputs are produced for each scenario:
– Regional and global emissions of CO2 from fossil fuel combustion and industrial processes.
– Regional and global energy system costs, which account for the annualized investment cost of the different energy carbon technologies employed in the energy system, their fixed and variable operating and maintenance costs, the
costs of extraction and supply of fossil fuels, and the welfare losses that derive from reduced energy demand as energy prices increase in response to the use of more expensive energy technologies (which may be needed to meet CO2 targets).
– Mitigation costs represent the difference in energy system costs between mitigation runs and a no-mitigation baseline scenario. Mitigation costs are reported as a share of projected GDP for each time-step, as well as in present value discounted terms over the period 2012–2100, using a discount rate of five percent.
2050 CO2 emissions from fossil fuel combustion and industrial processes for TIAM-Grantham regions under equal per capita
emissions for CO2 from fossil fuel combustion
Table 17
RegionCalculated 2050 CO2 emissions from fossil fuel combustion and industrial processes (MtCO2)
Africa 2,214
Australia, New Zealand and Oceania 68
Canada 54
China 2,787
Central and South America 729
Eastern and Western Europe 681
India 1,922
Japan 137
Middle East 690
Mexico 186
Russia and Central Asia 327
Republic of Korea 99
South and Southeast Asia 1,616
US 438
Total 11,948
Source: TIAM-Grantham
127
Annex VI Calculation of implications of using an international carbon market for meeting mitigation targets
– Regional net sales or purchases of CO2 permits for each region (both in terms of MtCO2 and US$ millions), for those time periods when trading occurs in order to meet specified regional targets (in the model set-up used in this analysis, this means 2030, 2040 and 2050).
KEY CAVEATS OF THE ANALYSIS
It is important to note that the analysis undertaken in this report is based on only one energy systems model. Multi-model comparisons of mitigation frequently yield a wide range for each output metric. This is a result of different model structures, technology availability, cost and performance inputs, as well as input assumptions on fossil and non-fossil fuel resource availability. Such wide ranges of assumptions reflect the significant uncertainty surrounding future developments in the global energy system over the course of the 21st century. Results can therefore be taken as indicative only.
In particular, sensitivity analysis in TIAM-Grantham suggests that the magnitude (and even direction) of carbon market flows between regions by mid-century is heavily influenced by assumptions on
availability of biocrops for energy usage in each region. This is because by mid-century, equal per capita emission levels in line with a 2°C goal are sufficiently stringent that most regions require negative emissions from bioenergy with carbon capture and storage to offset emissions from sources such as shipping, aviation and industrial manufacturing, all of which are challenging to mitigate. Estimates of energy from biocrops used here are based on those presented in the IIASA Global Energy Assessment,434 with a total 2050 potential of around 130 EJ per year. Some estimates are more than double this amount and with notably different regional distributions.435
In addition, the modeling presented here is for trade of CO2 permits only, with no inclusion of trade for non-CO2 gases. A number of studies have demonstrated the benefits, in terms of reduced mitigation costs, of including non-CO2 gases in the portfolio of mitigation options—with modeling analysis suggesting that this could reduce global emission costs by between 3 to 65 percent.436 It therefore stands to reason that including non-CO2 gases in trade regimes would also lead to additional benefits (in terms of reduced mitigation costs compared with no-trade cases) which are not reflected here.
434 Source: IIASA Global Energy Assessment Chapter 7: Energy Resources and Potentials, available at: http://www.iiasa.ac.at/web/home/research/Flagship- Projects/Global-Energy-Assessment/Chapter7.en.html.
435 Source: M. Hoogwijk, A. Faaij, B. de Vries, W. Turkenburg,“Exploration of regional and global cost–supply curves of biomass energy from short-rotation crops at abandoned cropland and rest land under four IPCC SRES land-use scenarios”, Biomass Bioenergy 2009;33:26–43. doi:10.1016/j.biombioe.2008.04.005.
436 Source: A. Gambhir, T. A. Napp, A. Hawkes, L. Hoglund-Isaksson, W. Winiwarter, P. Purohit, et al, The contribution of non-CO2 greenhouse gas mitigation to achieving long-term temperature goals - AVOID 2 report WPC2b 2015.
128
GLOSSARY
A project activity is additional if anthropogenic GHG emissions are lower than those that would have occurred in the absence of the project activity.
Countries listed in Annex B to the Kyoto Protocol for the first commitment period that had emission reduction targets for 2012. They include Australia, Austria, Belgium, Bulgaria, Canada, Croatia, Cyprus, Czech Republic, Denmark, Estonia, Finland, France, Germany, Greece, Hungary, Iceland, Ireland, Italy, Japan, Latvia, Liechtenstein, Lithuania, Luxembourg, Malta, Monaco, the Netherlands, New Zealand, Norway, Poland, Portugal, Romania, Russian Federation, Slovakia, Slovenia, Spain, Sweden, Switzerland, Ukraine, the United Kingdom, and the United States, as well as the European Union.
The industrialized countries listed in Annex I to the UNFCCC committed to return their GHG emissions to 1990 levels by 2000. They currently include Australia, Austria, Belarus, Belgium, Bulgaria, Canada, Croatia, Cyprus, Czech Republic, Denmark, Estonia, Finland, France, Germany, Greece, Hungary, Iceland, Ireland, Italy, Japan, Latvia, Liechtenstein, Lithuania, Luxembourg, Malta, Monaco, the Netherlands, New Zealand, Norway, Poland, Portugal, Romania, Russian Federation, Slovakia, Slovenia, Spain, Sweden, Switzerland, Turkey, Ukraine, the United Kingdom, and the United States, as well as the European Union.
Annex I Parties were issued AAUs up to the level of their assigned amount, corresponding to the quantity of GHG they could release in accordance with the Kyoto Protocol (Article 3), during the first commitment period of that protocol (2008–2012). One AAU represents the right to emit one metric ton of carbon dioxide equivalent.
Additionality
Annex B (Parties)
Annex I (Parties)
Assigned Amount Unit (AAU)
129

The carry-over of compliance units under the various schemes to manage GHG emissions from one commitment or compliance period to the next. Banking may encourage early action by mandated entities depending on their current situation and their anticipations of future carbon constraints. In addition, banking brings market continuity.
The emission of GHG that would occur without the policy intervention or project activity under consideration.
A mechanism where emission reductions achieved relative to a baseline can be credited and used for compliance purpose.
A system where targets or baseline emission levels are defined for individual emitters or groups of emitters and in which emitters that exceed their baseline emissions could purchase offsets to meet their compliance obligations.
Benchmarking is used to compare operations of a company with those of others, to industry average, or to best practice, to determine whether they have opportunities to improve energy efficiency or reduce GHG emissions. In the EU ETS, for example, free allocation is carried out on the basis of ambitious benchmarks of GHG emissions performance. These benchmarks reward best practice in low-emission production.
Cap-and-trade schemes set a desired maximum ceiling for emissions (or cap) and let the market determine the price for keeping emissions within that cap. To comply with their emission targets at least cost, regulated entities can either opt for internal abatement measures or acquire allowances or emission reductions in the carbon market, depending on the relative costs of these options.
The universal unit of measurement used to indicate the global warming potential of each of the six GHG regulated under the Kyoto Protocol. Carbon dioxide—a naturally occurring gas that is a by-product of burning fossil fuels and biomass, land-use changes, and other industrial processes—is the reference gas against which the other GHG are measured, using their global warming potential.
Shift in CO2 emissions due to GHG mitigation policies from countries taking stringent actions to countries taking less stringent mitigation actions.
The global offsetting scheme for the aviation sector which is set to start in 2021 with a voluntary period, becoming mandatory in 2027 as per negotiations as of September 2016.
An initiative that explicitly puts a price on a unit of CO2e, including ETSs—both cap-and-trade and baseline-and-credit systems, carbon taxes, offset mechanisms and RBCF.
Banking or Carry-over
Baseline
Baseline-and-credit
Baseline-and-offset
Benchmarking
Cap-and-trade
Carbon Dioxide Equivalent (CO2e)
Carbon Leakage
Carbon Offset and Reduction Scheme for International Aviation (CORSIA)
Carbon Pricing Initiative
Glossary
130
The revenue governments raise from carbon pricing initiatives, through the auctioning of allowances and taxation. The carbon pricing revenues are determined from auction revenue reports of the different ETSs and the annual budget of governments with carbon taxes in place.
The value of emission units in an ETS and emissions that are subject to a carbon tax. The total carbon pricing value of ETS markets is estimated by multiplying each ETS’s annual allowance volume for 2016, or the most recent yearly volume data, with the allowance price. The total value for carbon taxes is derived from official government budgets. Where the emission unit volume (for an ETS) or budget information (for a carbon tax) was unavailable, the value of the carbon pricing initiative was calculated by multiplying the GHG emissions covered with the nominal carbon price.
A tax that explicitly states a price on carbon or that uses a metric directly based on carbon (that is, price per tCO2e).
A unit of GHG emission reductions issued pursuant to the Clean Development Mechanism of the Kyoto Protocol and measured in metric tons of carbon dioxide equivalent. One CER represents a reduction in GHG emissions of one metric ton of carbon dioxide equivalent.
Voluntary emission reduction credits from projects based in China. The NDRC issued rules to regulate the CCER market in China in June 2012. CCER are issued in unit of tCO2e, and include CO2, CH4, N2O, HFCs, PFCs, and SF6.
The mechanism provided by Article 12 of the Kyoto Protocol, designed to assist developing countries in achieving sustainable development by allowing entities from Annex I Parties to participate in low-carbon projects and obtain CERs in return.
A set of standards set out by the US Environmental Protection Agency (EPA) aimed at reducing carbon emissions from the power sector.
The supreme body of the UNFCCC. It currently meets once a year to review the UNFCCC’s progress. The word “conference” is not used here in the sense of “meeting” but rather of “association”.
The COP serves as the meeting of the Parties to the Kyoto Protocol. The CMP meets during the same period as the COP. Parties to the Convention that are not Parties to the Protocol are able to participate in the CMP as observers, but without the right to take decisions. The sessions of the COP and the CMP are held during the same period to reduce costs and improve coordination between the UNFCCC and the Kyoto Protocol.
Carbon Pricing Revenue
Carbon Pricing Value
Carbon Tax
Certified Emission Reduction (CER)
Chinese Certified Emission Reduction (CCER)
Clean Development Mechanism (CDM)
Clean Power Plan (CPP)
Conference of the Parties (COP)
Conference of the Parties Serving as the Meeting of the Parties (CMP)
131
Glossary
The COP serves as the meeting of the Parties to the Paris Agreement. Parties to the Convention that are not Parties to the Paris Agreement are able to participate in the CMA as observers, but without the right to take decisions.
The difference between the amount consumers pay and the price that they would be willing to pay for goods and services.
The amount of a change in costs that are passed through to changes in the price of these goods or services, usually expressed as a percentage.
Policies that provide incentives for consumers of electricity to reduce or shift their electricity consumption at certain times, e.g. during peak periods or when there is a shortage of supply.
The measurable reduction of release of GHG into the atmosphere from a specified activity, and a specified period.
A unit of emission reductions issued pursuant to Joint Implementation. One ERU represents the right to emit one metric ton of carbon dioxide equivalent.
A system where emitters can trade their emission units to meet their compliance obligations. The two main types of ETSs are cap-and-trade and baseline-and-credit.
The allowances in use under the EU ETS. An EUA unit is equal to one metric ton of carbon dioxide equivalent.
A policy mechanism designed to incentivize renewable electricity by providing long-term, typically fixed price payments to producers per unit of renewable electricity supplied to the grid.
The five-year period, from 2008 to 2012, during which industrialized countries committed to collectively reduce their GHG emissions by an average of 5.2% compared with 1990 emissions under the Kyoto Protocol.
Changes in the energy sources used, typically used to describe a greater proportion of less emissions intensive energy sources being used to generate electricity.
The Group of 7 is a group of seven countries representing roughly 46% of global GDP. They are Canada, France, Germany, Italy, Japan, the United Kingdom and the United States. The European Union is also represented.
Conference of the Parties Serving as the Meeting of the Parties to the Paris Agreement (CMA)
Consumer surplus
Cost pass-through
Demand Side Response (DSR) policies
Emission Reduction
Emission Reduction Unit (ERU)
Emissions Trading Scheme (ETS)
European Union Allowance (EUA)
Feed-in tariffs
First Commitment Period under the Kyoto Protocol (CP1)
Fuel switching (electricity)
G7
132
Both natural and anthropogenic, GHGs trap heat in the Earth’s atmosphere, causing the greenhouse effect. Water vapor (H2O), carbon dioxide (CO2), nitrous oxide (N2O), methane (CH4), and ozone (O3) are the primary GHGs. The emission of GHG through human activities (such as fossil fuel combustion or deforestation) and their accumulation in the atmosphere are responsible for reinforcing the greenhouse effect, contributing to climate change.
The legislation from the British Columbia government that enables performance standards to be set for industrial facilities or sectors, including GHG benchmarks for LNG facilities. Facilities that do not meet the performance standards have to purchase compliance units.
A measure of the value of subsidies or the additional costs imposed by policies indirectly putting a price on carbon, expressed per ton of CO2e.
The COP, by its decisions 1/CP.19 and 1/CP.20, invited all Parties to communicate to the UNFCCC secretariat their INDCs in advance of COP 21 as part of the groundwork for the adoption of the Paris Agreement. An INDC set the climate actions (mitigation and/or adaptation) that a country intended to take under the international agreement under the UNFCCC that was to be agreed in Paris in December 2015. For Parties ratifying the Agreement that have already submitted an INDC, their INDC will be considered their first NDC, unless the Party decides to revise it.
A price on GHG emissions that an organisation uses internally to guide its decision making process.
One of the flexibility mechanisms of the Kyoto Protocol, it allows countries with emission reduction limitations under the Protocol (Annex B countries) to trade AAUs.
Parties to the Paris Agreement can use ITMOs, established by Article 6.2 of the Paris Agreement, to achieve NDCs. ITMOs aim to provide a basis for facilitating international recognition of cross-border applications of subnational, national, regional and international carbon pricing initiatives. However, the precise nature of ITMOs has not yet been defined. ITMOs might cover outcomes from various existing and future approaches.
Mechanism provided by Article 6 of the Kyoto Protocol whereby entities from Annex I Parties may participate in low-carbon projects hosted in Annex I countries and obtain Emission Reduction Units (ERUs) in return.
The Kyoto Protocol regulates six GHGs: carbon dioxide (CO2), methane (CH4), and nitrous oxide (N2O), hydrofluorocarbons (HFCs), perfluorocarbons (PFCs), and sulphur hexafluoride (SF6).
Greenhouse Gas (GHG)
Greenhouse Gas Industrial Reporting and Control Act (GGIRCA)
Implied (implicit) carbon price
Intended Nationally Determined Contribution (INDC)
Internal carbon price
International Emissions Trading (IET)
Internationally Transferred Mitigation Outcomes (ITMOs)
Joint Implementation (JI)
Kyoto GHGs
133
Glossary
The three flexibility mechanisms that may be used by Annex I Parties to the Kyoto Protocol to fulfil their commitments. These are the Joint Implementation (JI, Article 6), Clean Development Mechanism (CDM, Article 12), and International Emissions Trading (Article 17).
Adopted at the third Conference of the Parties to the UNFCCC held in Kyoto, Japan, in December 1997, the Kyoto Protocol commits industrialized country signatories to collectively reduce their GHG emissions by at least 5.2% below 1990 levels on average over 2008–2012 while developing countries can take no-regret actions and participate voluntarily in emission reductions and removal activities through the CDM. The Kyoto Protocol entered into force in February 2005.
The additional costs incurred in reducing a defined increment of emission reduction from a particular source.
The contribution that a Party intends to achieve under the Paris Agreement, covering mitigation and adaptation. Each Party shall communicate an NDC every five years. For Parties ratifying the Agreement that have already submitted an INDC, their INDC will be considered their first NDC, unless the Party decides to revise it. NDCs are legally distinct from INDCs and will be under the Agreement as and when it enters into force. They will be governed by Article 4 of the Agreement. Each Party to the UNFCCC that wishes to become a Party to the Agreement will have an obligation to communicate an NDC. The level of prescription attached to these will be determined by the negotiations on the operative elements of Article 4, which mainly take place under the Ad Hoc Working Group on the Paris Agreement (APA).
An offset designates the emission reductions from project-based activities that can be used to meet compliance or corporate citizenship objectives vis-à-vis GHG mitigation.
The Paris Agreement was adopted at the 21st Conference of the Parties to the UNFCCC held in Paris, France, in December 2015. The Paris Agreement brings, for the first time, all nations together to undertake ambitious efforts to combat climate change and adapt to its effects. Its central aim is to “strengthen the global response to the threat of climate change by keeping a global temperature rise this century well below 2 degrees Celsius above pre-industrial levels and to pursue efforts to limit the temperature increase even further to 1.5 degrees Celsius. Additionally, the agreement aims to strengthen the ability of countries to deal with the impacts of climate change. The Paris Agreement requires all Parties to put forward their best efforts through NDCs and to strengthen these efforts in the years ahead. This includes requirements that all Parties report regularly on their emissions and on their implementation efforts.”
Kyoto Mechanisms
Kyoto Protocol
Marginal abatement cost
Nationally Determined Contribution (NDC)
Offset
Paris Agreement
134
An economic measure of the difference between the price a producer of goods and services receives and the minimum amount they would be willing to accept for that good or service (i.e. the cost of producing goods and services).
A market that lets participants buy and sell wholesale electricity during the course of the operating day.
All activities that reduce emissions from deforestation and forest degradation and contribute to conservation, sustainable management of forests, and enhancement of forest carbon stocks.
The formal acceptance by the CDM Executive Board of a validated project as a CDM project activity.
Funding approach where payments are made after pre-defined outputs or outcomes related to managing climate change, such as emission reductions, are delivered and verified.
The eight-year period, from 2013 to 2020, in which Annex I Parties to the Kyoto Protocol committed to reduce GHG emissions by at least 18% percent below 1990 levels. The composition of Parties in the second commitment period is different from that in the first.
A market where the seller of the asset is not the original owner (or issuer).
The true-up period refers to the additional period given for fulfilling commitments under the Kyoto Protocol. During this period, Parties can continue to acquire and transfer ERUs, CERs, AAUs and RMUs from the preceding commitment period. The true-up period for CP1 finished on November 18, 2015.
The international legal framework adopted in June 1992 at the Rio Earth Summit to address climate change. It commits the Parties to the UNFCCC to stabilize human-induced GHG emissions at levels that would prevent dangerous manmade interference with the climate system, following “common but differentiated responsibilities” based on “respective capabilities”.
The process of independent evaluation of a project activity by a Designated Operational Entity (DOE) against the requirements of the CDM. The CDM requirements include the CDM modalities and procedures, subsequent decisions by the CMP and documents released by the CDM Executive Board.
Verification is the review and ex-post determination by an independent third party of the monitored results, typically referring to reductions in emissions generated by a registered CDM project or a determined JI project (or a project approved under another standard) during the verification period in this report.
Producer surplus
Real-time market (electricity)
REDD Plus (REDD+)
Registration
Results-Based Climate Finance (RBCF)
Second Commitment Period under the Kyoto Protocol (CP2)
Secondary Market
True-up period
United Nations Framework Convention on Climate Change (UNFCCC)
Validation
Verification
135
Glossary
A unit of GHG emission reductions that has been verified by an independent auditor. Most often, this designates emission reduction units that are traded on the voluntary market.
The process by which different activities within a value chain previously undertaken by the same company are disaggregated so that different firms are responsible for different activities. In the electricity sector, this typically refers to the separation of generation and/or retail activities from transmission and/or distribution.
The voluntary carbon market caters to the needs of those entities that voluntarily decide to reduce their carbon footprint using offsets.
Verified Emission Reduction (VER)
Vertical separation (electricity)
Voluntary Carbon Market
136

1 Introduction
www.carbonfinance.org
1818 H Street, NWWashington, DC 20433 USA