starting the day right - uah · starting the day right: ubet 2016 breakfast report 2 students would...
TRANSCRIPT

Starting the Day RightBest Practices for Increasing School
Breakfast Participation in Utah Schools
2014–2015 School Year

ContentsIntroduction . . . . . . . . . . . . . . . . . . . . . . . . . . . . . . . . . . . . . . . . . . . . . . . . . . . . . . . . . . . . . . . . . . . . . .Benefits of School Breakfast . . . . . . . . . . . . . . . . . . . . . . . . . . . . . . . . . . . . . . . . . . . . . . . . . . . .School Breakfast Program Basics . . . . . . . . . . . . . . . . . . . . . . . . . . . . . . . . . . . . . . . . . . . . . . .Strategies to Increase Participation in the School Breakfast Program . . . . . . . .
Alternative Service Methods . . . . . . . . . . . . . . . . . . . . . . . . . . . . . . . . . . . . . . . . . . . . . . . . . .Breakfast in the Classroom (BIC) . . . . . . . . . . . . . . . . . . . . . . . . . . . . . . . . . . . . . . . .“Grab and Go” . . . . . . . . . . . . . . . . . . . . . . . . . . . . . . . . . . . . . . . . . . . . . . . . . . . . . . . . . . . .Second Chance Breakfast . . . . . . . . . . . . . . . . . . . . . . . . . . . . . . . . . . . . . . . . . . . . . . . .Breakfast on the Bus . . . . . . . . . . . . . . . . . . . . . . . . . . . . . . . . . . . . . . . . . . . . . . . . . . . . .Breakfast Vending . . . . . . . . . . . . . . . . . . . . . . . . . . . . . . . . . . . . . . . . . . . . . . . . . . . . . . . .
Offer Breakfast at No Charge to All Students . . . . . . . . . . . . . . . . . . . . . . . . . . . . . . . . . . .Universal Free Breakfast . . . . . . . . . . . . . . . . . . . . . . . . . . . . . . . . . . . . . . . . . . . . . . . . . . . . . .Provisions 2 & 3 . . . . . . . . . . . . . . . . . . . . . . . . . . . . . . . . . . . . . . . . . . . . . . . . . . . . . . . . . . . . . .Community Eligibility Provision . . . . . . . . . . . . . . . . . . . . . . . . . . . . . . . . . . . . . . . . . . . . . .
Marketing . . . . . . . . . . . . . . . . . . . . . . . . . . . . . . . . . . . . . . . . . . . . . . . . . . . . . . . . . . . . . . . . . . . . . . . .Outreach . . . . . . . . . . . . . . . . . . . . . . . . . . . . . . . . . . . . . . . . . . . . . . . . . . . . . . . . . . . . . . . . . . . . . .Nudge . . . . . . . . . . . . . . . . . . . . . . . . . . . . . . . . . . . . . . . . . . . . . . . . . . . . . . . . . . . . . . . . . . . . . . . . .
Steps to Increase Participation in the School Breakfast Program . . . . . . . . . . . . .Recommendations for Utah’s School District Leaders . . . . . . . . . . . . . . . . . . . . . . .Recommendations for State of Utah Education Leaders . . . . . . . . . . . . . . . . . . . . .Recommendations for Utah State Legislators . . . . . . . . . . . . . . . . . . . . . . . . . . . . . . .
Conclusion . . . . . . . . . . . . . . . . . . . . . . . . . . . . . . . . . . . . . . . . . . . . . . . . . . . . . . . . . . . . . . . . . . . . . . .Resources . . . . . . . . . . . . . . . . . . . . . . . . . . . . . . . . . . . . . . . . . . . . . . . . . . . . . . . . . . . . . . . . . . . . . . . .References . . . . . . . . . . . . . . . . . . . . . . . . . . . . . . . . . . . . . . . . . . . . . . . . . . . . . . . . . . . . . . . . . . . . . . .School Breakfast Participation Tables . . . . . . . . . . . . . . . . . . . . . . . . . . . . . . . . . . . . . . . . . .
134777991010111111121313141515161617181921

AcknowledgmentsT his report was prepared by Marti Woolford, with assistance from Jessica Church, Lori Andersen Spruance,
Nathan Stokes, and Patrice Isabella. This report was designed by Olivia Yeip and edited by Wendy Forbes and Donna Falkenborg.
The Utah Breakfast Expansion Team (UBET) was formed in 2014 in response to Utah’s consistently low participation in the School Breakfast Program (SBP). UBET works to increase participation in SBP among low-income students. UBET is a collaboration of Utahns Against Hunger, Utah State Board of Education, Utah State University Extension–Food $ense, Utah State University Extension–Salt Lake County and Wayne County, Dairy Council of Utah Nevada, Utah Department of Health-Healthy Living Through Environment, Policy & Improved Clinic Care Program, Brigham Young University–Nutrition, Dietetics, and Food Science and Health Sciences, and Granite Education Association–NEA Healthy Futures.
Utahns Against Hunger and UBET gratefully acknowledge major support for this report to Partners for Breakfast in the Classroom, an initiative funded by the Walmart Foundation.
Starting the Day Right: UBET 2016 Breakfast Report 1
INTRODUCTIONN umerous studies show that eating school breakfast is essential to children’s
ability to learn, stay healthy, and perform well in school. Unfortunately, the School Breakfast Program (SBP) is vastly underutilized in Utah, meaning thousands of students may be starting the day underfed and undernourished. In recent years, there has been an increase in the number of Utah schools utilizing alternative breakfast models, resulting in an increase in school breakfast participation. These schools serve as important models for other schools and districts who want to increase their low school breakfast participation rates. This report describes alternative breakfast delivery models that can help increase school breakfast participation. In addition, it provides valuable school breakfast participation data that can help in assessing the success of current SBPs.
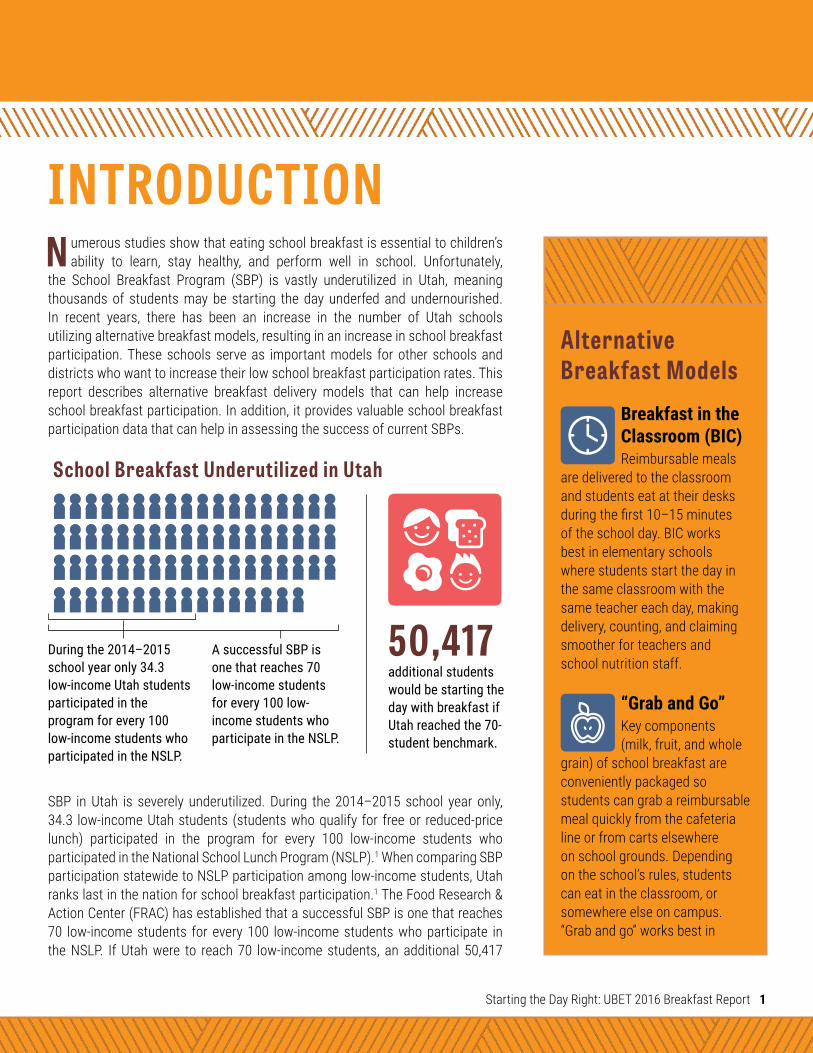
SBP in Utah is severely underutilized. During the 2014–2015 school year only, 34.3 low-income Utah students (students who qualify for free or reduced-price lunch) participated in the program for every 100 low-income students who participated in the National School Lunch Program (NSLP).1 When comparing SBP participation statewide to NSLP participation among low-income students, Utah ranks last in the nation for school breakfast participation.1 The Food Research & Action Center (FRAC) has established that a successful SBP is one that reaches 70 low-income students for every 100 low-income students who participate in the NSLP. If Utah were to reach 70 low-income students, an additional 50,417
Alternative Breakfast Models
Breakfast in the Classroom (BIC)Reimbursable meals
are delivered to the classroom and students eat at their desks during the first 10–15 minutes of the school day. BIC works best in elementary schools where students start the day in the same classroom with the same teacher each day, making delivery, counting, and claiming smoother for teachers and school nutrition staff.
“Grab and Go”Key components (milk, fruit, and whole
grain) of school breakfast are conveniently packaged so students can grab a reimbursable meal quickly from the cafeteria line or from carts elsewhere on school grounds. Depending on the school’s rules, students can eat in the classroom, or somewhere else on campus. “Grab and go” works best in
During the 2014–2015 school year only 34.3 low-income Utah students participated in the program for every 100 low-income students who participated in the NSLP.
A successful SBP is one that reaches 70 low-income students for every 100 low-income students who participate in the NSLP.
School Breakfast Underutilized in Utah
additional students would be starting the day with breakfast if Utah reached the 70- student benchmark.
50,417

Starting the Day Right: UBET 2016 Breakfast Report 2
students would be starting the day with school breakfast and Utah would receive an additional $14,094,176 in annual federal reimbursement funding.2 (See School Breakfast Participation Tables for individual school and district data.)
While Utah has a strong economy and low unemployment rate, many households with children still struggle with poverty and food insecurity. In 2013, 15 percent of the state’s children were living in poverty and 20.4 percent of households with children were experiencing food insecurity.3,4 Food insecurity occurs when people do not have access to enough food at all times for an active, healthy life.5 Poverty and food insecurity lead to the potential for numerous negative consequences, especially for children.
Low-income households tend to purchase unhealthy foods that are higher in calories because they typically cost less.6 This can negatively impact dietary intake even before hunger is present. Adverse impacts of food insecurity on dietary patterns (increased processed food, sugar-sweetened beverages, and fast food consumption, and decreased fruit and vegetable intake) among households with children are demonstrated in several studies.7,8,9 An unhealthy diet, including inadequate consumption of fruits and vegetables, is a key determinant of weight status. In addition, childhood poverty can lead to an increased risk for a wide range of physical health problems. The American Psychological Association reports that children living in poverty are at greater risk for chronic conditions such as asthma, anemia, and pneumonia.10 Lastly, behavioral and emotional problems are more prevalent among children living in families where hunger is an issue.10
The National Center for Education Statistics reports that in 2008, the dropout rate of students living in low-income families was about four and one-half times greater than the rate of children from higher-income families (8.7 percent versus 2.0 percent).11 SBP combats negative consequences of food insecurity and child poverty by providing access to nutritious food for low-income students.
schools that may not be able to deliver food to each classroom due to multiple stairs or with other infrastructure obstacles. This model works well with all age groups, but for best results it is important to think through where the students will be eating. For example, with younger students, eating breakfast at their desks is the best method; whereas older students can eat while on their way to class.
Second Chance BreakfastUsually implemented
in middle and high schools, this method allows students time after their first period to obtain reimbursable breakfast from the cafeteria or from carts in the hallway, which they can eat in the classroom or cafeteria. Computerized systems ensure that children receive only one breakfast each day. Second chance breakfast works best with older students, middle school or high school aged, who may not be hungry in the morning.
Percentage of households with children experiencing food insecurity in 2013.
Percentage of the state’s children living in poverty in 2013.
15% 20.4%
Dropout rate of students living in low-income families
Dropout rate of students living in higher-income families8.7% 2%
Starting the Day Right: UBET 2016 Breakfast Report 3
BENEFITS OF SCHOOL BREAKFASTS chool breakfast is a minor investment with a major pay-off — providing all students the opportunity to make the most of
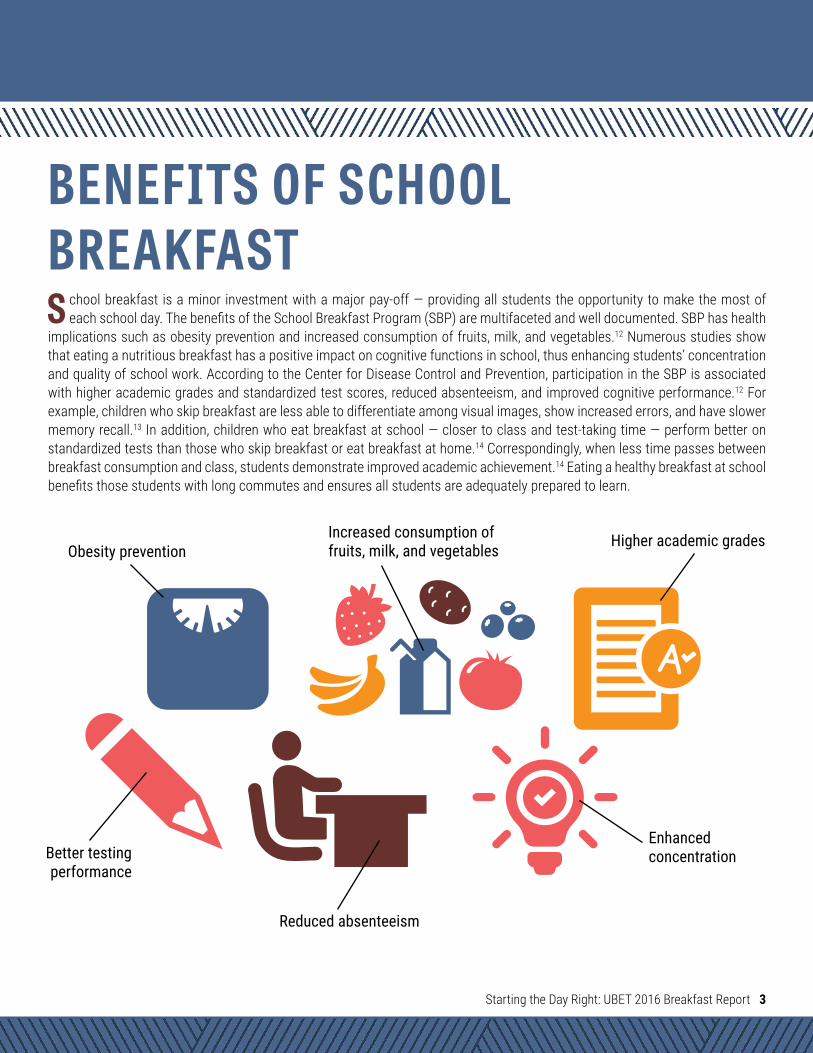
each school day. The benefits of the School Breakfast Program (SBP) are multifaceted and well documented. SBP has health implications such as obesity prevention and increased consumption of fruits, milk, and vegetables.12 Numerous studies show that eating a nutritious breakfast has a positive impact on cognitive functions in school, thus enhancing students’ concentration and quality of school work. According to the Center for Disease Control and Prevention, participation in the SBP is associated with higher academic grades and standardized test scores, reduced absenteeism, and improved cognitive performance.12 For example, children who skip breakfast are less able to differentiate among visual images, show increased errors, and have slower memory recall.13 In addition, children who eat breakfast at school — closer to class and test-taking time — perform better on standardized tests than those who skip breakfast or eat breakfast at home.14 Correspondingly, when less time passes between breakfast consumption and class, students demonstrate improved academic achievement.14 Eating a healthy breakfast at school benefits those students with long commutes and ensures all students are adequately prepared to learn.
Increased consumption of fruits, milk, and vegetables Higher academic grades
Obesity prevention
Reduced absenteeism
Enhanced concentrationBetter testing
performance
Starting the Day Right: UBET 2016 Breakfast Report 4
SCHOOL BREAKFASTPROGRAM BASICS
T he School Breakfast Program (SBP) is administered at the federal level by the United States Department of Agriculture (USDA) Food and Nutrition
Service, and at the state level by the Utah State Board of Education. The federal government provides reimbursements to local school food authorities for each breakfast served.
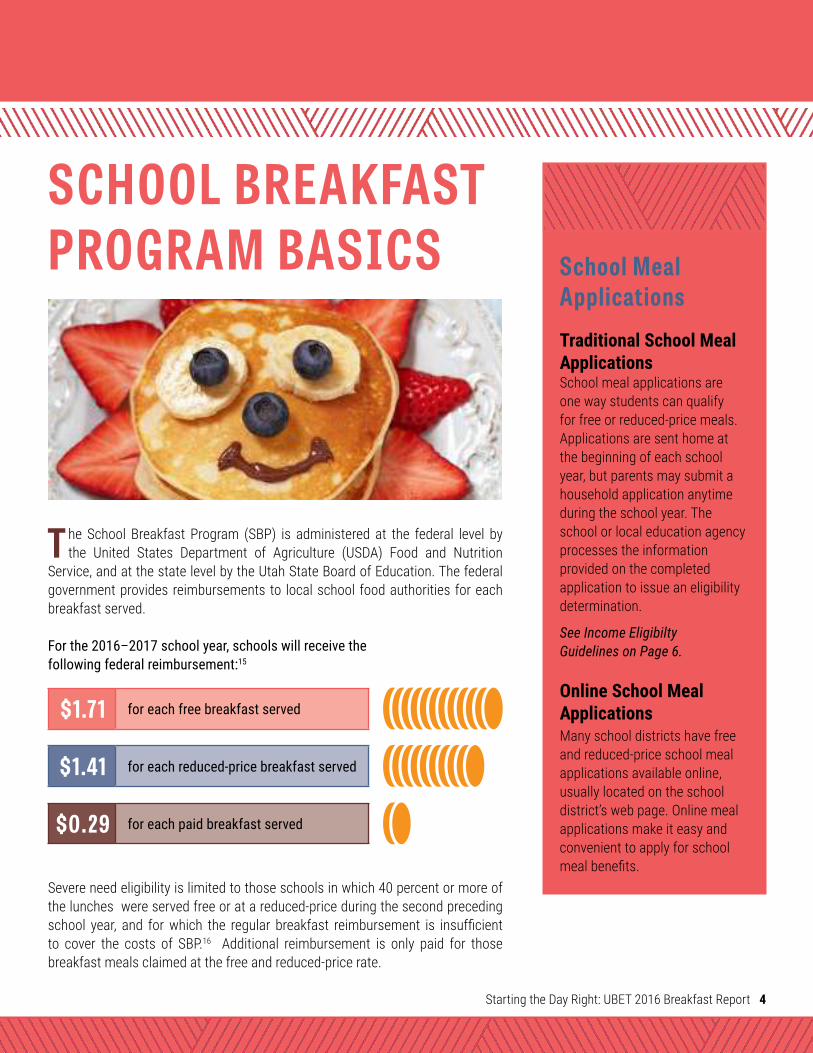
For the 2016–2017 school year, schools will receive the following federal reimbursement:15
Severe need eligibility is limited to those schools in which 40 percent or more of the lunches were served free or at a reduced-price during the second preceding school year, and for which the regular breakfast reimbursement is insufficient to cover the costs of SBP.16 Additional reimbursement is only paid for those breakfast meals claimed at the free and reduced-price rate.
School Meal ApplicationsTraditional School Meal ApplicationsSchool meal applications are one way students can qualify for free or reduced-price meals. Applications are sent home at the beginning of each school year, but parents may submit a household application anytime during the school year. The school or local education agency processes the information provided on the completed application to issue an eligibility determination.
See Income Eligibilty Guidelines on Page 6.
Online School Meal ApplicationsMany school districts have free and reduced-price school meal applications available online, usually located on the school district’s web page. Online meal applications make it easy and convenient to apply for school meal benefits.
$1.71 for each free breakfast served
$1.41 for each reduced-price breakfast served
$0.29 for each paid breakfast served

Starting the Day Right: UBET 2016 Breakfast Report 5
Direct CertificationAll children living in households receiving Supplemental Nutrition Assistance Program (SNAP) or Food Distribution Program on Indian Reservations (FDPIR) benefits, or Temporary Assistance for Needy Families (TANF) cash assistance — known as the Family Employment Program or FEP in Utah — can be “directly certified” for free school meals.17 With direct certification, families no longer have to fill out a paper application to be processed by the school for determination of eligibility. Instead, agencies share information with schools, through data matching that must occur at least three times per year, to identify eligible children and automatically enroll them for free school meals. All school districts are required to directly certify children that receive SNAP.17
Certain homeless, migrant, and foster children are also eligible for meal program benefits and may be certified by one of the methods described above.17 The eligibility of these students, however, does not extend to the rest of the household.
School breakfasts must meet the meal pattern and nutrition standards based on the latest Dietary Guidelines for Americans. Currently, the following guidelines are required as part of the School Breakfast Program:18
Offer fruit daily
Offer meals that meet specific
calorie ranges for each age/grade
group (ranges are narrower than in past guidelines)
Offer grain items which are at least
50 percent whole grain
Offer fluid milk that is fat-free (unflavored and
flavored) and low-fat (unflavored only)
Limit sodium based on age/grade
group and limit saturated fat to
less than 10 percent of total calories weekly
Require students to select a fruit or a
vegetable as part of the reimbursable meal;
and use a single food-based menu planning
approach
Prepare meals using food products or
ingredients that contain zero grams of trans fat
per serving
0gramsof transfat
Starting the Day Right: UBET 2016 Breakfast Report 6
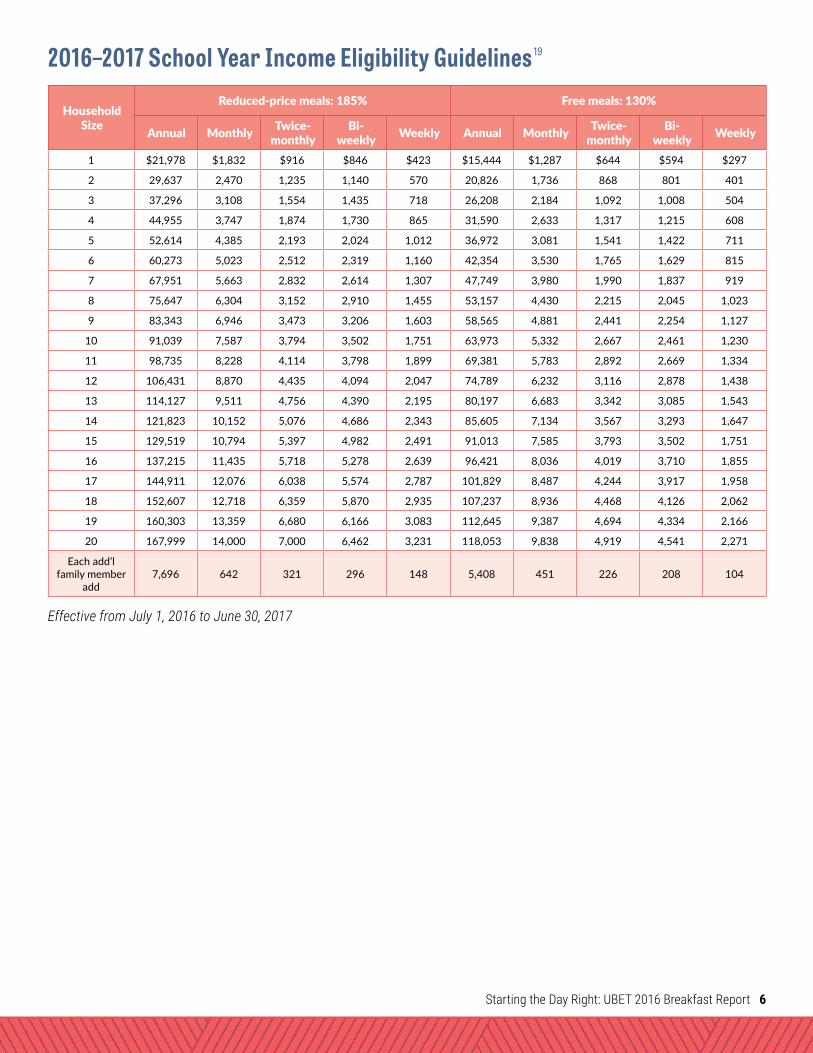
2016–2017 School Year Income Eligibility Guidelines 19
Effective from July 1, 2016 to June 30, 2017
Household
Size
Reduced-price meals: 185% Free meals: 130%
Annual MonthlyTwice-
monthly
Bi-
weeklyWeekly Annual Monthly
Twice-
monthly
Bi-
weeklyWeekly
1 $21,978 $1,832 $916 $846 $423 $15,444 $1,287 $644 $594 $297
2 29,637 2,470 1,235 1,140 570 20,826 1,736 868 801 401
3 37,296 3,108 1,554 1,435 718 26,208 2,184 1,092 1,008 504
4 44,955 3,747 1,874 1,730 865 31,590 2,633 1,317 1,215 608
5 52,614 4,385 2,193 2,024 1,012 36,972 3,081 1,541 1,422 711
6 60,273 5,023 2,512 2,319 1,160 42,354 3,530 1,765 1,629 815
7 67,951 5,663 2,832 2,614 1,307 47,749 3,980 1,990 1,837 919
8 75,647 6,304 3,152 2,910 1,455 53,157 4,430 2,215 2,045 1,023
9 83,343 6,946 3,473 3,206 1,603 58,565 4,881 2,441 2,254 1,127
10 91,039 7,587 3,794 3,502 1,751 63,973 5,332 2,667 2,461 1,230
11 98,735 8,228 4,114 3,798 1,899 69,381 5,783 2,892 2,669 1,334
12 106,431 8,870 4,435 4,094 2,047 74,789 6,232 3,116 2,878 1,438
13 114,127 9,511 4,756 4,390 2,195 80,197 6,683 3,342 3,085 1,543
14 121,823 10,152 5,076 4,686 2,343 85,605 7,134 3,567 3,293 1,647
15 129,519 10,794 5,397 4,982 2,491 91,013 7,585 3,793 3,502 1,751
16 137,215 11,435 5,718 5,278 2,639 96,421 8,036 4,019 3,710 1,855
17 144,911 12,076 6,038 5,574 2,787 101,829 8,487 4,244 3,917 1,958
18 152,607 12,718 6,359 5,870 2,935 107,237 8,936 4,468 4,126 2,062
19 160,303 13,359 6,680 6,166 3,083 112,645 9,387 4,694 4,334 2,166
20 167,999 14,000 7,000 6,462 3,231 118,053 9,838 4,919 4,541 2,271
Each add’l
family member
add
7,696 642 321 296 148 5,408 451 226 208 104

Starting the Day Right: UBET 2016 Breakfast Report 7
STRATEGIES TO INCREASE PARTICIPATION IN THE SCHOOL BREAKFAST PROGRAM
Alternative Breakfast Delivery Models to Increase Participation in the School Breakfast Program
M aking breakfast a part of the school day, known as breakfast after the bell, dramatically increases participation by making it convenient and accessible to all,
no matter how or when students arrive at school. Breakfast after the bell service options include, but are not limited to, breakfast in the classroom, “grab and go” breakfast, and second chance breakfast. Whether breakfast is served in the classroom, the hallways, second period or on the school bus, the flexibility to eat during the morning in school is instrumental to ensure optimum participation. In Utah, the majority of schools offer breakfast, but serve it in the school cafeteria before the school day starts. This creates
several barriers that can result in low participation. For example, kids are required to arrive to school early in order to participate, but busy morning schedules at home and school bus schedules may prevent them from arriving in time to eat. When children are able to arrive to school in time to eat they may still face additional barriers; like the choice between playing and socializing with their friends or eating; or eating breakfast in the cafeteria where they face the stigma of “only the poor kids” eat breakfast20. Another strategy for increasing school breakfast participation is to eliminate the reduced-price category and offer these students breakfast for free. This may help to remove the financial barrier some students face. Additionally, offering breakfast for free to all students can increase participation; this strategy works especially well in schools with high free and reduced-price approval rates. Also, some families are unaware that their children’s school offers breakfast,21 strategic outreach can help resolve this problem. Below are various strategies that, when implemented, can help increase school breakfast participation.
Breakfast in the Classroom (BIC)With this model, breakfast is delivered to the classroom either by school nutrition staff or designated students, and is served by the
teacher or each student can pick up a meal before taking a seat at the start of the school day. BIC works best in elementary schools where students start the day in the same
classroom with the same teacher each day, making delivery, counting, and claiming smoother for teachers and school nutrition staff.
• BIC has emerged as an effective strategy to provide school breakfast to the large number of students who need it.
Alternative Service Models

Starting the Day Right: UBET 2016 Breakfast Report 8
• BIC improves student achievement, diets, and behavior. For example, schools that offer breakfast in the classroom report decreases in discipline and psychological problems, fewer visits to school nurses and tardiness; increased student attentiveness and attendance; and generally improved learning environments.14
• BIC is the best option for schools with high rates of free and reduced-price meals and low school breakfast participation rates.
• After implementing BIC, survey principals, kitchen managers, teachers, students, and custodians to learn what is working well and what isn’t. It is important to make changes quickly to ensure the success of BIC.
• After implementing, consider evaluating the program to learn the effects of BIC. Track changes in tardiness, chronic absenteeism, behavior referrals, and nurse visits. Track changes in average daily participation in SBP after implementation of BIC.
In school year 2014–2015, the following districts utilized BIC in some of their schools:
Breakfast in the Classroom Success StoryCanyons School DistrictCanyons School District received a USDA grant (passed through the Utah State Board of Education) to expand school breakfast participation. When looking at different school breakfast service models they considered switching to a universal breakfast model where all students eat breakfast for free. However, students were already not participating in breakfast in the cafeteria so Sebasthian Varas, Director of Nutrition Services at Canyons School District, decided that breakfast in the classroom was the best service model to increase participation. Canyons tested the model at Copperview Elementary School because of the high rates of free and reduced-priced qualified students and where the
nutrition services department had a good relationship with the principal. During the planning process, Varas knew they had to make breakfast in the classroom easy for principals, teachers, and custodians or it would not be successful. Their priorities were to have BIC service last no longer than 10-15 minutes; to make the experience as spill-free as
possible; and to have a good understanding of the logistics of preparation and trash pick-up. After these priorities were set, the nutrition services department from the district trained the teachers on the process and informed parents of the change, which they did by mailing a post card to parents. “It is very important to make people confident that it will work,” said Sebasthian Varas.
“A part of making this change work was to make tweaks along the way,” said Varas. For example, in the beginning of the test they had planned on changing the menu every month but when less food was being consumed and was starting to come back to the kitchen. The kitchen manager from Copperview Elementary went to every class and polled students to ask if they wanted certain food or not and they changed the menu accordingly.
When asked what advice he would give, Varas stated, “Be creative! We weren’t afraid to tailor [our School Breakfast Program] to what would work for us. Keep your promise that it will work.”
“Be creative! We weren’t afraid to tailor (our School Breakfast Program) to what would work for us. Keep your promise that it will work.”
- Sebasthian VarasDirector of Nutrition Services at
Canyons School District
CANYONS SCHOOL DISTRICT
NEBO SCHOOL DISTRICT
EMERY SCHOOL DISTRICT
GRANITE SCHOOL DISTRICT
OGDEN SCHOOL DISTRICT

Starting the Day Right: UBET 2016 Breakfast Report 9
In school year 2014–2015, the following districts utilized the “grab and go” model in some of their schools:
Second Chance BreakfastThis model allows students time after their first period to obtain breakfast from the cafeteria or carts in the hallway, which they then eat in the
classroom or cafeteria. Computerized systems ensure that children receive only one breakfast each day.
• Second chance breakfast works best with older students, middle school or high school-aged, who often report not being hungry in the morning.
• A recent study found that students who regularly consumed breakfast at school, including a second chance breakfast, were more likely to have a healthy weight when compared to students who regularly skipped breakfast.22
ALPINE SCHOOL DISTRICT
GRANITE SCHOOL DISTRICT
OGDEN SCHOOL DISTRICT
DAVIS SCHOOL DISTRICT
KANE SCHOOL DISTRICT
BEAVER SCHOOL DISTRICT
TOOELE SCHOOL DISTRICT
PROVO SCHOOL DISTRICT
UINTAH SCHOOL DISTRICT
WEBER SCHOOL DISTRICT
GARFIELD SCHOOL DISTRICT
NORTH SANPETE SCHOOL DISTRICT
BIC increased SBP participation in the Canyons School District. Copperview Elementary School implemented breakfast in the classroom at the beginning of the 2014–2015 school year. At the time of implementation, over 85 percent of students were qualified for free or reduced-price lunch but only 20 percent were participating in SBP. Copperview Elementary ended the same school year with 98.9 percent of free and reduced-price qualified students eating school breakfast.
“Grab and Go”This model uses key components of school breakfast, conveniently packaged so students can grab a reimbursable meal quickly from the
cafeteria line or from carts elsewhere on school grounds. Depending on the school’s rules, students can eat in the classroom, or somewhere else on campus.
• “Grab and go” works best in schools that may not be able to deliver food to each classroom due to multiple stairs or because of other infrastructure obstacles.
• Students participating in breakfast are counted by school nutrition staff when the meal is picked up either through the point of sale (POS) system, or from manual lists at each cart.
• After implementing “grab and go,” survey principals, kitchen managers, teachers, students, and custodians to learn what is working well and what isn’t. It is important to make changes quickly to ensure the success of “grab and go.”
• After implementing, consider evaluating the program to learn the effects of “grab and go.” Track changes in tardiness, chronic absenteeism, behavior referrals, and nurse visits. Track changes in average daily participation in SBP after implementation of “grab and go.”

Starting the Day Right: UBET 2016 Breakfast Report 10
Breakfast VendingBreakfast vending allows students to access a nutritious breakfast from a vending machine. Vending machines can be set up to offer free
and reduced-priced options by linking them to the school’s point of sale (POS) system; students can then use their student identification or personal identification number to pay without cash.
• Breakfast vending is a good fit in high schools where students may be arriving at different times throughout the morning. For example, staff can load machines at the end of the day to allow students arriving to school for early morning activities an opportunity to get breakfast before the cafeteria opens.
• Schools using breakfast vending machines report that their students enjoy having an option to by-pass the cafeteria environment.
• Vending machines can be used for other meal services like lunch, after school snack, or supper, too, with staff reloading options between meal services.
In school year 2014–2015, the following districts utilized vending machines for SBP:
These districts reported their high school vending machines’ most popular breakfast item is breakfast parfaits with yogurt, granola, and fruit.
• After implementing this model, survey principals, kitchen managers, teachers, students, and custodians to learn what is working well and what isn’t. It is important to make changes quickly to ensure the success of second chance breakfast.
• After implementing, consider evaluating the program to learn the effects of second chance breakfast. Track changes in tardiness, chronic absenteeism, behavior referrals, and nurse visits. Track changes in average daily participation in SBP after implementation of second chance breakfast.
In school year 2014–2015, the following districts utilized the second chance breakfast model in some of their schools:
Breakfast on the BusBus schedules can make it hard for students to participate in SBP when it is served in the cafeteria before the school day starts. Breakfast
on the bus makes the most of students’ morning bus ride, especially on longer bus rides that might be up to an hour or more. In this method, food is stored in containers and served to students as they get on the bus.
• Breakfast on the bus may be a good fit if students spend more than 15 minutes on the bus, bus schedules do not leave enough time for students to eat in the cafeteria, and breakfast in the classroom has not been implemented.
OGDEN SCHOOL DISTRICT
NEBO SCHOOL DISTRICT
WASHINGTON SCHOOL DISTRICT
BOX ELDER SCHOOL DISTRICT
DAVIS SCHOOL DISTRICT
UINTAH SCHOOL DISTRICT
WEBER SCHOOL DISTRICT

Starting the Day Right: UBET 2016 Breakfast Report 11
OFFER BREAKFAST AT NO CHARGE TO ALL STUDENTSUniversal Free BreakfastFor schools with high free and reduced-price meal eligibility, offering breakfast for free to all children may be a financially viable way to ensure more children access a healthy breakfast. Any service model can be used with universal breakfast. Students attending schools that offer breakfast free to all students are more likely to consume a nutritionally substantive breakfast and to consume significantly more calcium, magnesium, phosphorus, fruit, and dairy products at breakfast, when compared to students from schools with a traditional school breakfast program.13
• Nonpricing: No fees are collected from students, while schools continue to receive reimbursements for the meals served under the three-tier federal fee categories (free, reduced-price, and paid).1
In school year 2014–2015, the following districts utilized universial free breakfast in either some of their schools or districtwide:
Universal Free Breakfast Success StoryIn 2014, the Logan School District began offering school breakfast free of charge to all of its students. This change resulted in school breakfast participation nearly doubling at
several Logan schools. “We went from around 2 percent paid students eating breakfast to around 15–20 percent. This helped reduce the stigma that school breakfast was only for the poor. Many students enjoy eating breakfast at school now.” said Paul Guymon, Child Nutrition Coordinator at Logan School District.
Provisions 2 & 3Provisions 2 and 3 are federal School Breakfast Program (SBP) and National School Lunch Program (NSLP) options
BOX ELDER SCHOOL DISTRICT
LOGAN SCHOOL DISTRICT
CARBON SCHOOL DISTRICT
NEBO SCHOOL DISTRICT
EMERY SCHOOL DISTRICT
“We went from around 2 percent paid students eating breakfast to around 15-20 percent. This helped reduce the stigma that school breakfast was only for the poor. Many students enjoy eating breakfast at school now.”
- Paul GuymonChild Nutrition Coordinator at
Logan School District

Starting the Day Right: UBET 2016 Breakfast Report 12
for schools to reduce the paperwork burden and simplify the logistics of operating school meal programs. Under both provisions, institutions may provide free meals claimed by free, reduced-price, and full-pay percentages established in a base year. This minimizes the burden of collecting applications and tracking and verifying school meal data every year. Any school that participates in NSLP or SBP may qualify for Provision 2 or 3. These provisions may be a good strategy if a school has a high percentage of low-income students (75 percent or higher) or if substantial alternative funding is available to help cover food and labor costs. Under Provisions 2 & 3(Adapted from the Food Research & Action Center’s. Provision 2 of the National School Lunch Act.” 23)
• All students receive free meals, regardless of family income level.
• Schools collect applications, record and track meal categories and conduct meal verifications once every four years, at most, leading to a reduction in administrative tasks for food service staff. Lunch tickets, personal identification numbers and identification cards for breakfast are no longer necessary since all students eat for free.
• The school pays the difference between the cost of providing the meals at no charge to all students and the amount of federal and state reimbursement for those meals. In most cases, the administrative savings and increased meal participation offset the added cost of providing universal free breakfast.
• Provisions 2 & 3 can be done with breakfast or lunch, by an individual school or districtwide. Experience has shown that schools save more in administrative and time costs if a provision is used for both breakfast and lunch.
Community Eligibility Provision (CEP)Community eligibility allows high-poverty schools to offer breakfast and lunch at no charge to all students, while eliminating the traditional school meal application process. Thousands of schools across the country have successfully implemented this new option and are seeing the many benefits of ensuring that all of their students have access to healthy school meals. Any district, group of schools in a district, or
individual school with 40 percent or more “identified students” — children eligible for free school meals who are already identified by other means than an individual household application — can choose to participate in CEP.
Benefits of the CEP(Adapted from the Food Research & Action Center’s “FACTS: Community Eligibility Provision” 24)
• Lessens administrative work — schools no longer have to collect and verify school meal applications, allowing them to focus on feeding children.
• Increases participation — participating schools in the initial pilot states increased breakfast participation by 9.4 percent and lunch participation by 5.2 percent, a USDA study showed.
• Facilitates implementation of alternative breakfast service models — when schools don’t have to collect fees or count each meal served by fee category, it simplifies implementation of breakfast in the classroom and “grab and go” service models that can boost participation further.
• Improves the financial viability of school nutrition programs — when participation increases, school districts can take advantage of economies of scale, and reinvest additional revenue to improve nutrition quality and provide staff training.
• Eliminates unpaid meal fees — when all children eat at no charge, the school district does not have to collect unpaid fees from families.
In school year 2014–2015, the following districts utilized CEP in either some of their schools or districtwide: 25
OGDEN SCHOOL DISTRICT
SALT LAKE CITY SCHOOL DISTRICT
SAN JUAN SCHOOL DISTRICT

Starting the Day Right: UBET 2016 Breakfast Report 13
MARKETINGOutreach(Adapted from the Food Research & Action Center’s “School Breakfast Outreach” website.” 26)
Another way to increase breakfast participation is to make sure parents are aware that their child’s school participates in the School Breakfast Program (SBP). There are many ways to promote SBP but strategic and effective outreach efforts will have the biggest impact on awareness and participation:
• Use bright colored paper when including information about school breakfast in the packet of materials that goes to parents at the beginning of the school year.
• Feature easy-to-access and easy-to-find information about school breakfast on the school website that highlights the fact that qualifying for free or reduced-price meals includes breakfast, not just lunch.
• Promote breakfast frequently in emails, robo-calls (automated voicemails), on school district radio/TV stations when available, social media outlets, such as Facebook and Twitter, and other communications with parents and students.
• Mail postcards to families to encourage participation.
• Conduct promotional activities (e.g., contests, celebrity appearances, special themes) that encourage students to participate.
• National School Breakfast Week is held in March and National School Lunch Week is held in October; these are great times to conduct a promotional activity and create special menu options.
• Enlist teachers and principals to encourage students to participate by providing information about SBP and effective strategies (see Nudge section on page 14) to encourage students to participate (e.g., modeling good eating behaviors, scheduling before-school activities in the cafeteria during breakfast).
• Provide school breakfast participation rates to principals, as they are often unaware of how few students participate in school breakfast (see School Breakfast Participation Tables for participation rates).
• Inform teachers by providing SBP in-services to make sure they know about the academic benefits to participation, barriers to participation, and ways that teachers can help encourage students to participate in breakfast.
• Write a press release announcing the implementation of a new school breakfast service model.
• Notify the Utah State Board of Education if your school or district implements an alternative school breakfast.
• Form student nutrition committees to taste new items and promote the program among peers (see Resources section on page 20 for more information).
Starting the Day Right: UBET 2016 Breakfast Report 14
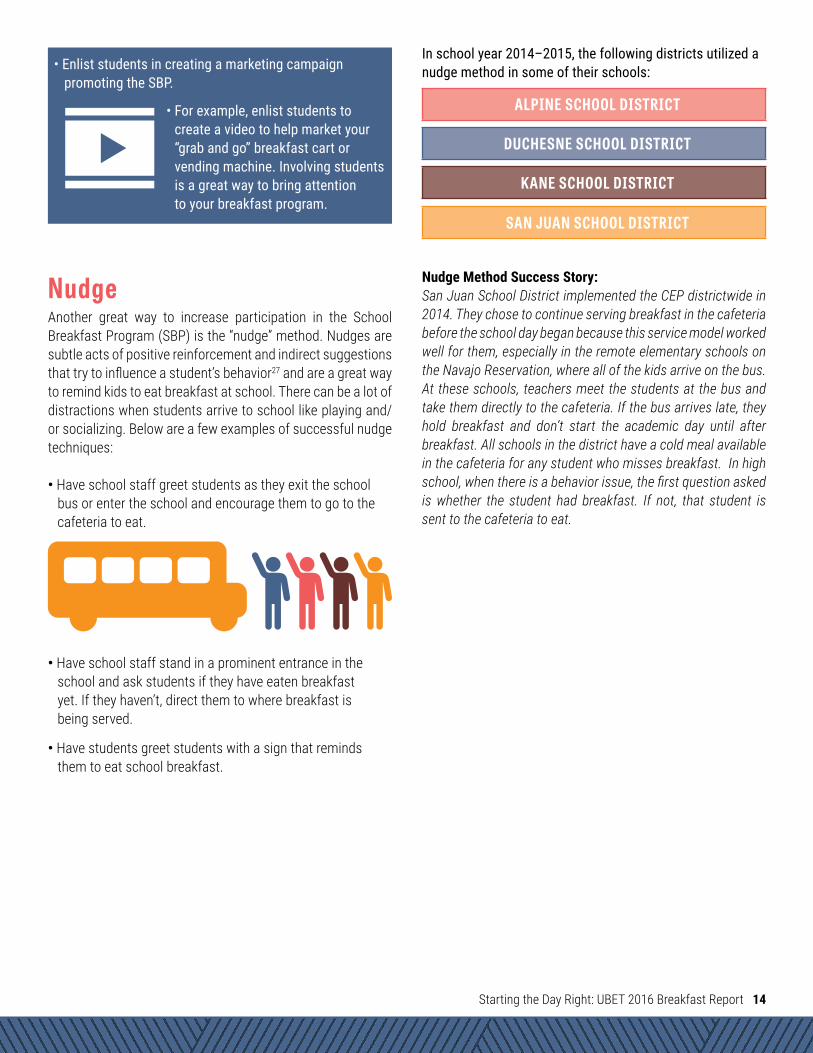
• Enlist students in creating a marketing campaign promoting the SBP.
• For example, enlist students to create a video to help market your “grab and go” breakfast cart or vending machine. Involving students is a great way to bring attention to your breakfast program.
NudgeAnother great way to increase participation in the School Breakfast Program (SBP) is the “nudge” method. Nudges are subtle acts of positive reinforcement and indirect suggestions that try to influence a student’s behavior27 and are a great way to remind kids to eat breakfast at school. There can be a lot of distractions when students arrive to school like playing and/or socializing. Below are a few examples of successful nudge techniques:
• Have school staff greet students as they exit the school bus or enter the school and encourage them to go to the cafeteria to eat.
• Have school staff stand in a prominent entrance in the school and ask students if they have eaten breakfast yet. If they haven’t, direct them to where breakfast is being served.
• Have students greet students with a sign that reminds them to eat school breakfast.
ALPINE SCHOOL DISTRICT
DUCHESNE SCHOOL DISTRICT
KANE SCHOOL DISTRICT
SAN JUAN SCHOOL DISTRICT
In school year 2014–2015, the following districts utilized anudge method in some of their schools:
Nudge Method Success Story: San Juan School District implemented the CEP districtwide in 2014. They chose to continue serving breakfast in the cafeteria before the school day began because this service model worked well for them, especially in the remote elementary schools on the Navajo Reservation, where all of the kids arrive on the bus. At these schools, teachers meet the students at the bus and take them directly to the cafeteria. If the bus arrives late, they hold breakfast and don’t start the academic day until after breakfast. All schools in the district have a cold meal available in the cafeteria for any student who misses breakfast. In high school, when there is a behavior issue, the first question asked is whether the student had breakfast. If not, that student is sent to the cafeteria to eat.

Starting the Day Right: UBET 2016 Breakfast Report 15
STEPS TO INCREASE PARTICIPATION IN THE SCHOOL BREAKFAST PROGRAMRecommendations for Utah’s School District Leaders• Make breakfast part of the school day. Increase access
to the School Breakfast Program by requiring schools with 70 percent or more students qualifying for free or reduced-price meals to offer breakfast after the school day’s official start through alternative service models.
Apply for a Partners for Breakfast in the Classroom Grant and/or the Dairy Council of Utah/Nevada Grant
Apply for a Partners for Breakfast in the Classroom GrantThe Partners for Breakfast in the Classroom, a consortium of nutrition and education groups, are working in 10 states, including Utah, to boost breakfast participation through grant funds, technical assistance, and building stakeholder support.
The grant is available to help high-need schools and districts cover the upfront costs often associated with the startup and implementation of breakfast in the classroom and “grab and go” programs, such as
purchasing equipment, outreach efforts to parents, program promotion, and other related expenses.
For more information about the grant, go to: www.breakfastintheclassroom.org or contact Marti Woolford at [email protected].
Apply for a Dairy Council of Utah/Nevada Grant The Dairy Council grants money to help schools expand their School Breakfast Program.
For more information about grant availability, contact Becky Low at [email protected] or (801) 694-3536.

Starting the Day Right: UBET 2016 Breakfast Report 16
• Offer universal free breakfast. To help reach more children, provide breakfast at no charge to all students in schools with a free or reduced-price school meal eligibility rate of 70 percent or higher. High-poverty schools should utilize options like community eligibility and Provision 2 to support school breakfast expansion.
• Be a school breakfast advocate/champion. Educate all stakeholders — students, teachers, staff and parents — about the benefits of school breakfast. Utilize newsletters, online platforms, and social media to reach your target audience.
Recommendations for State of Utah Education Leaders• Allow time spent during breakfast in the classroom (BIC)
to count as instructional time. Teachers and principals are often concerned that implementing BIC will interfere with instructional time. Clear guidance is needed to allow meal time to be considered as a part of instruction time. Other states, such as California, Indiana, Michigan, New Jersey, and Pennsylvania, have accomplished this through a memorandum from the state agency clarifying that breakfast must complement, not compete with, instructional time.28
• Require State Agency database user entry forms (CNPweb) to include questions specific to alternative service models used in the School Breakfast Program. This is needed to accurately capture all of the methods Utah schools are using to serve breakfast.
• Track data. Mandate that breakfast participation at the school level, as well as the manner in which breakfast is served, is tracked.
• Increase the number of eligible schools implementing the Community Eligibility Provision (CEP) in order to expand school breakfast participation. Employ new ways to encourage school districts with eligible schools to participate in CEP.
Recommendations for Utah State Legislators • Require schools with 70 percent
or more students qualifying for free or reduced-price meals to offer a universal, nutritious after-the-bell breakfast program with all-student access. Colorado, the District of Colombia, New Mexico, Texas, Washington, and West Virginia have passed similar school breakfast legislation.28
• Remove the reduced-price payment. Relieve the school district from having to collect unpaid fees from families as well as the financial barrier students may face.

CONCLUSION
I n order to reduce hunger and support the health and educational potential of Utah students, particularly for low-income children and adolescents, it is important for schools to make increased availability and participation in the School Breakfast
Program one of their highest priorities.
The School Breakfast Program makes critical nutritional contributions to children’s health and education; but in order for this program to meet the needs of students, it needs to be served when students are most likely to participate. Research shows that serving school breakfast during the school day is the best way to ensure all kids start the day with a full stomach, ready to learn.
The majority of Utah schools offer school breakfast but participation in the program remains low. Adequate nutrition and freedom from hunger are absolutely essential for good health and academic achievement, and yet these goals are not always achievable for families struggling to make ends meet.
Starting the Day Right: UBET 2016 Breakfast Report 17
Starting the Day Right: UBET 2016 Breakfast Report 18
RESOURCES• Utah State Board of Education Child Nutrition Programs http://www.schools.utah.gov/cnp/• Utah Breakfast Expansion Team http://www.uah.org/projects-initiatives/utah-breakfast-expansion-team-ubet/ • Utahns Against Hunger – https://www.uah.org• Granite School District – Breakfast in the Classroom video https://www.youtube.com/watch?v=O-L33DJuoYU• Ogden School District – Breakfast in the Classroom video https://www.youtube.com/watch?v=qPRtn1Ibwqo
&feature=youtu.be
• Food Research & Action Center “Breakfast for Health” Spring 2014 http://frac.org/wp-content/uploads/2011/08/breakfastforhealth.pdf
• Food Research & Action Center “Breakfast for Learning” Spring 2014 http://frac.org/wp-content/uploads/2009/09/breakfastforlearning.pdf
• Food Research & Action Center “School Breakfast Outreach” Website http://frac.org/federal-foodnutrition-programs/school-breakfast-program/outreach/
• Food Research & Action Center “School Breakfast Score Card 2014-2015 School Year. February 2016” http://frac.org/pdf/School_Breakfast_Scorecard_SY_2014_2015.pdf
• NEA Health Information Network “Breakfast in the Classroom: NEA Health Information Network School Breakfast Toolkit”http://neahealthyfutures.org/wpcproduct/breakfast-in-the-classroom-toolkit/
• USDA Food and Nutrition Service “School Breakfast Program (SBP) - Discover School Breakfast Resource Materials” http://www.fns.usda.gov/sbp/discover-school-breakfast-resource-materials
• Partners for Breakfast in the Classroom http://breakfastintheclassroom.org/• Dairy Council of Utah Nevada http://www.dairycouncilutnv.com/schools/• Action for Healthy Kids http://www.actionforhealthykids.org/tools-for-schools/apply-for-grants
In Utah
National
Breakfast Expansion Grants
Starting the Day Right: UBET 2016 Breakfast Report 19
Food Research & Action Center. (2016). School Breakfast Scorecard 2014-2015 School Year. Available: http://frac.org/pdf/School_Breakfast_Scorecard_SY_2014_2015.pdf.Food Research & Action Center. (2015). Nutrition Program State Participation Calculators. http://frac.org/reports-and-resources/nutrition-program-state-participation-calculators/.Kids Count Data Center. Children Living in Poverty. Available: http://datacenter.kidscount.org/data/tables/3215-children-living-in-poverty?loc=46&loct=2#detailed/2/any/false/36,868,867,133,38/any/9207,9206. Feeding America. (2015). Map the Meal Gap 2015: Child Food Insecurity in Utah by County in 2013. Available: http://www.feedingamerica.org/hunger-in-america/our-research/map-the-meal-gap/2013/UT_AllCounties_CDs_CFI_2013.pdf. Coleman-Jensen A, Rabbitt M P., Gregory Ch, and Singh A. (2015). Household Food Security in the United States in 2014. Available: http://www.ers.usda.gov/publications/err-economic-research-report/err194.aspx. Darmon N, and Drewnowski A. (2015). Contribution of food prices and diet cost to socioeconomic disparities in diet quality and health: a systematic review and analysis. Available: http://www.ncbi.nlm.nih.gov/pubmed/26307238. Widome R, Neumark-Sztainer D, Hannan PJ, Haines J, Story M. (2009). Eating when there is not enough to eat: eating behaviors and perceptions of food among food-insecure youths. Available: https://www.ncbi.nlm.nih.gov/pubmed/19299675. Bruening M, MacLehose R, Loth K, et al. (2012). Feeding a family in a recession: food insecurity among Minnesota parents. Available: https://www.ncbi.nlm.nih.gov/pmc/articles/PMC3349989/.Pilgrim A, Barker M, Jackson A, et al. (2012). Does living in a food insecure household impact on the diets and body composition of young children? Findings from the Southampton Women’s Survey. Available: https://www.ncbi.nlm.nih.gov/pubmed/21652519.The American Psychological Association. (ND). Effects of Poverty, Hunger, and Homelessness on Children and Youth. Available: http://www.apa.org/pi/families/poverty.aspx. American Psychological Association. (ND). Effect of Poverty, Hunger, and Homelessness on Children and Youth. Available: http://www.apa.org/pi/families/poverty.aspx.National Center for Educational Statistics. (2010). Trends in High School Dropout and Completion Rates in the United States: 1972–2008. Available: https://nces.ed.gov/pubs2011/dropout08/findings1.asp. Centers for Disease Control and Prevention. (2014). Health and Academic Achievement. Available: http://www.cdc.gov/healthyyouth/health_and_academics/pdf/health-academic-achievement.pdf. Food Research & Action Center. (2014). Breakfast for Health. Available: http://frac.org/wp-content/uploads/2011/08/breakfastforhealth.pdf. Food Research & Action Center. (2014). Breakfast for Learning. Available: http://frac.org/wp-content/uploads/2009/09/breakfastforlearning.pdf.
1.
2.
3.
4.
5.
6.
7.
8.
9.
10.
11.
12.
13.
14.
15.
REFERENCES
Starting the Day Right: UBET 2016 Breakfast Report 20
Department of Agriculture Food and Nutrition Services. (2016). School Meals: Rates of Reimbursement. School Year 2016-2017. Available: http://www.fns.usda.gov/school-meals/rates-reimbursement.Department of Agriculture Food and Nutrition Services. (2005). Eligibility for Severe Needs Rates for the School Breakfast Program. Available: http://www.fns.usda.gov/sites/default/files/SP23-2005.pdf.Department of Agriculture Food and Nutrition Services. (2001). 7 CFR Part 245.13 State Agencies and Direct Certification Requirements. Available: https://www.gpo.gov/fdsys/pkg/CFR-2016-title7-vol4/xml/CFR-2016-title7-vol4-sec245-13.xml.Department of Agriculture Food and Nutrition Services. (2012). 7 CFR Parts 210 and 220 Nutrition Standards in the National School Lunch and School Breakfast Programs; Final Rule. Available: https://www.gpo.gov/fdsys/pkg/FR-2012-01-26/pdf/2012-1010.pdf. Department of Agriculture Food and Nutrition Services. Child Nutrition Programs-Income Eligibility Guidelines. Available: http://www.fns.usda.gov/fr-032316.Bailey-Davis L, Virus A, McCoy TA, Wojtanowski A, Vander Veur SS, Foster GD. (2013). Middle school student and parent perceptions of government-sponsored free school breakfast and consumption: a qualitative inquiry in an urban setting. Available: https://www.ncbi.nlm.nih.gov/pubmed/23351628.Utah State Board of Education. (2015). Data & Statistics. Available: http://schools.utah.gov/data/Reports/Child-Nutrition.aspx.Andersen L, Harrison C, Woolford M, Coombs C, LeBlanc H. Parent Perceptions of School Breakfast. (Unpublished data).Wang S, Schwartz M.B., Shebl F.M., Read M, Henderson K.E., Ickovics J.R. (2016). School breakfast and body mass index: a longitudinal observational study of middle school students. Available: http://onlinelibrary.wiley.com/doi/10.1111/ijpo.12127/full. Food Research & Action Center. (ND). Provision 2 of the National School Lunch Act. Available: http://frac.org/newsite/wp-content/uploads/2009/05/provision2.pdf.Food Research & Action Center. (ND). FACTS: Community Eligibility Provision. Available: http://frac.org/pdf/community_eligibility_amazing_new_option_schools.pdf. Food Research & Action Center. (ND). School Breakfast Outreach. Available: http://frac.org/federal-foodnutrition-programs/school-breakfast-program/outreach/. No Kid Hungry Share Our Strength. (ND). Breakfast Nudges. Available: https://bestpractices.nokidhungry.org/sites/default/files/resources/breakfast_nudges.pdf. No Kid Hungry Share Our Strength, Center for Best Practices. (ND). School Breakfast: Passed State Legislation. Available: https://bestpractices.nokidhungry.org/school-breakfast/school-breakfast-policy-0.
16.
17.
18.
19.
20.
21.
22.
23.24.
25.
26.
27.
28.
29.

Starting the Day Right: UBET 2016 Breakfast Report 21
About the DataThe Utah State Board of Education provided the free and reduced-price meal raw data and meal counts used in the report. All data are from school year 2014–2015. School breakfast participation rates were analyzed using the Food Research & Action Center’s School Breakfast Calculator.2 The data has several limitations. All data collected is self-reported from school districts. Qualitative data is collected annually at the beginning of each school year and may not be updated when districts make changes after the beginning of the school year. Eligibility data is based on the last operating day of October for all schools, which may not be representative of the whole school year for some schools. Enrollment data used in calculations of average daily participation may include some students who may not have access to SBP and/or NSLP (for example, split kindergarten sessions that are only in session after lunch). Data collection on alternative service models began during school year 2014–2015 and may not be representative of actual service models during that school year. Where the data were unavailable in the examined school year, data from 2015–2016 were used. Several school districts also participated in a school breakfast expansion grant provided by Utah State Board of Education in 2014–2015. These districts are: Alpine, Beaver, Canyons, Carbon, Emery, Granite, Jordan, Kane, Nebo, North Sanpete, Ogden, Provo, Tooele, Washington, and Weber. It is also important to note that districts followed different implementation timelines under this grant, i.e., some districts may not have implemented the breakfast expansion project funded through this grant as of the last operating day in October of that school year, and others may be capturing increased participation in SBP as a result of earlier implementation. Charter schools, alternative schools residential child care centers, and schools for students with severe disabilities were not included in the analysis.
www.uah.org/projects-initiatives/utah-breakfast-expansion-team-ubet
SCHOOL BREAKFAST PARTICIPATION TABLES
Wayne School District 1
Emery School District 2
Rich School District 3
Juab School District 4
Carbon School District 5
Ogden School District 6
Piute School District 7
San Juan School District 8
Beaver School District 9
Duchesne School District 10
Logan School District 11
Tooele School District 12
Salt Lake School District 13
Tintic School District 14
School District Rank School District Rank School District Rank
Box Elder School District 15
Iron School District 16
Granite School District 17
No Sanpete School Dist 18
Provo School District 19
So Sanpete School Dist 20
Wasatch School District 21
Millard School District 22
Kane School District 23
No Summit School District 24
Daggett School District 25
Nebo School District 26
Sevier School District 27
Garfield School District 28
Weber School District 29
Grand School District 30
Washington School Dist 31
Davis School District 32
Alpine School District 33
Canyons School District 34
Uintah School District 35
Park City School District 36
Murray School District 37
Jordan District Nutrition Services 38
Cache School District 39
Morgan School District 40
So Summit School District 41
Table 1. Rank of School Breakfast Participation by School District

Starting the Day Right: UBET 2016 Breakfast Report 22
8,000
6,0005,500
7,0006,500
2,0001,500
4,0003,5003,0002,500
5,0004,500
1,000500
-500
8,500
7,500
0
Way
ne S
choo
l Dist
rict
Emer
y Sch
ool D
istric
tRi
ch S
choo
l Dist
rict
Juab
Sch
ool D
istric
tCa
rbon
Sch
ool D
istric
tOg
den
Scho
ol D
istric
tPi
ute
Scho
ol D
istric
tSa
n Ju
an S
choo
l Dist
rict
Beav
er S
choo
l Dist
rict
Duch
esne
Sch
ool D
istric
tLo
gan
Scho
ol D
istric
tTo
oele
Sch
ool D
istric
tSa
lt La
ke S
choo
l Dist
rict
Tint
ic S
choo
l Dist
rict
Box E
lder
Sch
ool D
istric
tIro
n Sc
hool
Dist
rict
Gran
ite S
choo
l Dist
rict
No S
anpe
te S
choo
l Dist
Prov
o Sc
hool
Dist
rict
So S
anpe
te S
choo
l Dist
Was
atch
Sch
ool D
istric
tM
illard
Sch
ool D
istric
tKa
ne S
choo
l Dist
rict
No S
umm
it Sc
hool
Dist
rict
Dagg
ett S
choo
l Dist
rict
Nebo
Sch
ool D
istric
tSe
vier S
choo
l Dist
rict
Garfi
eld
Scho
ol D
istric
tW
eber
Sch
ool D
istric
tGr
and
Scho
ol D
istric
tW
ashi
ngto
n Sc
hool
Dist
Davis
Sch
ool D
istric
tAl
pine
Sch
ool D
istric
tCa
nyon
s Sc
hool
Dist
rict
Uint
ah S
choo
l Dist
rict
Park
City
Sch
ool D
istric
tM
urra
y Sch
ool D
istric
tJo
rdan
Dist
rict N
utrit
ion
Serv
ices
Cach
e Sc
hool
Dist
rict
Mor
gan
Scho
ol D
istric
tSo
Sum
mit
Scho
ol D
istric
t
$2,500,000
$2,000,000
$1,000,000
$500,000$250,000
-$250,000
$1,250,000
$2,250,000
$750,000
$1,750,000
0
$1,500,000
Table 3. Additional Federal Funding if 70 Low-Income Students Were Served School Breakfast Per 100 Served School Lunch — School Year 2014–2015
Table 2. Additional Participation if 70 Low-Income Students Were Served School Breakfast Per 100 Served School Lunch — School Year 2014–2015
Starting the Day Right: UBET 2016 Breakfast Report 23
BOX ELDER
TOOELE
NEBO
PROVO
WASATCHALPINE
DAVIS
WEBER
CACHE
LOGAN
OGDENRICH
MORGAN
SOUTH SUMMIT DAGGETT
UINTAH
DUCHESNE
CARBON
GRANDEMERY
SAN JUAN
WAYNE
GARFIELD
KANEWASHGINTON
IRON
PIUTE
SEVIER
SOUTHSANPETE
NORTHSANPETE
JUAB
TINTIC
MILLARD
BEAVER
NORTHSUMMIT
GRANITE
MURRAY
JORDAN
CANYONS
SALT LAKE
PARK CITY
0-30% 0-30%30-40% 30-40%40-50% 40-50%50-100% 50-100%
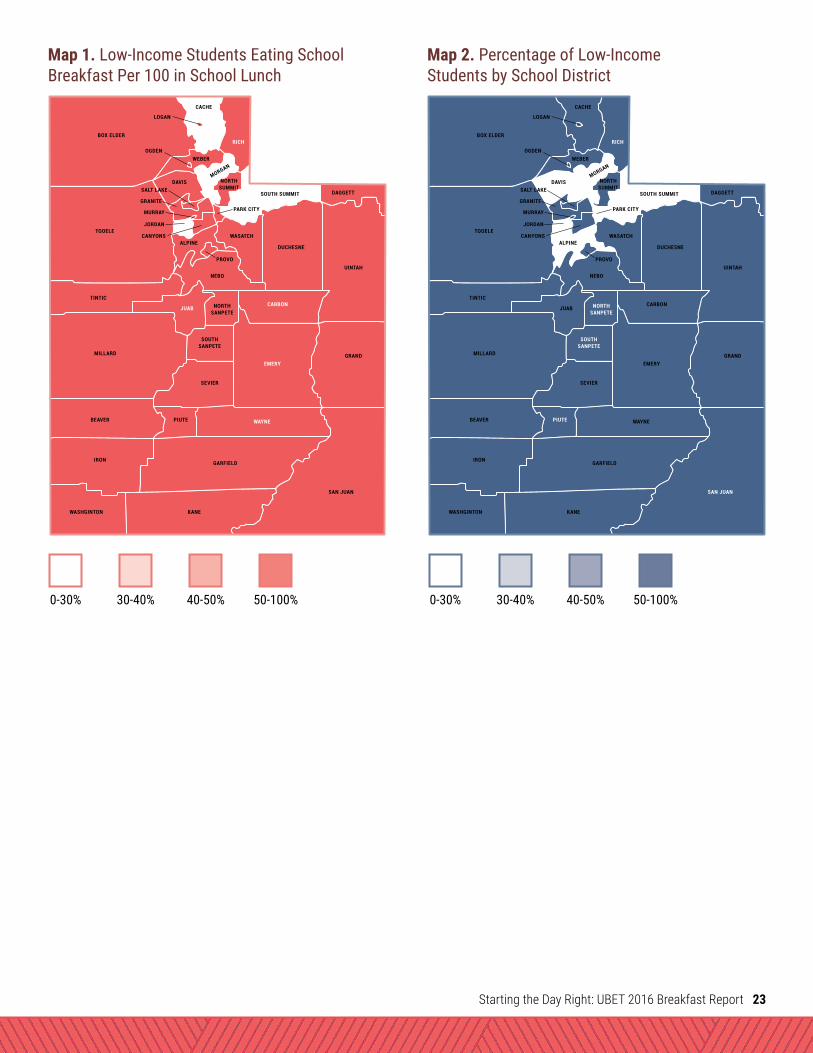
Map 1. Low-Income Students Eating School Breakfast Per 100 in School Lunch
Map 2. Percentage of Low-Income Students by School District