standardisation of putranjiva roxburghii wall. and...
TRANSCRIPT

1
Annual Report
Minor Research Project
From
22.02.2012 to 22.02.2014
Standardisation of Putranjiva roxburghii Wall. and
Dioscorea bulbiferra Linn. and evaluation of its
immunomodulatory activity.
Principal Investigator
Madhavi BadoleAssistant ProfessorDept. of ChemistryRamnarain Ruia College,Matunga, Mumbai.

2
General profile of plant
Putranjiva roxburghii Wall. is a moderate sized evergreen tree. The height is upto 12m with a
pendent branches and dark grey bark having horizontal lenticels. Leaves are simple, alternate,
dark green, shiny, elliptic-oblong. Putranjiva roxburghii Wall. is found wild or cultivated in
almost all parts of India, widely grown in Thailand, Nepal, Bangladesh, Indochina, Myanmar and
Srilanka.
Uses and pharmacology of plant
Leaves of Putranjiva roxburghii Wall. are bitter, astringent, refrigerant and procreant. The leaves
are useful in the treatment of catarrh, skin disease, fever and sterility. The leaves are given in
decoction for cold and fever, and are also used in rheumatism. The leaves of Putranjiva
roxburghii Wall. posses analgesic, antipyretic and anti-inflammatory activity. Putranjiva
roxburghii Wall. is one of the constituents of “Y-Spur” an ayurvedic formulation, prepared by
Vilco Laboratories, which is found to be very effective in male infertility. Seeds are sweet, acrid,
procreant, refrigent, conceptive, ophthalmic, laxative, anti-inflammatory and diuretic. It is useful
in vatta and pita, syphilis, cold, fever, burning sensation, hyperdipsia, opthalmopathy,
constipation, inflammations strangury, azospermia, sterility, swelling, rheumatism, and habitual
abortion.
Authentication
A herbarium of Putranjiva roxburghii Wall. was prepared and authenticated from botanical
Survey of India, Pune.
Dioscorea bulbifera Linn. is common throughout India, ascending upto 1800 m. It is found
mainly in Himalayas, Chota Nagpur, Bihar, Orissa, Konkan and found wild on W.coast.
Dioscorea bulbifera Linn. is a perennial, slender, bulb bearing twinner with a tuberous root.
Leaves are broadly ovate, cordate, alternate and simple. It propagates by seeds, bulbils and
tubers.
Uses and pharmacology of plant
The bulbils of Dioscorea bulbifera Linn. are anorexiant, Diuretic, hunger suppressant. It is
anthelmintic, amphrodiasic, diuretic, antiseptic, it is also used in the treatment of thyroid and
cancer, bitter tubers are used in treatment of leprosy and tumers. It has diuretic and anti-

3
inflammatory activity. It is used for sore throat and struma. Bulbs are used to treat piles,
dysentery, syphilis, ulcer.
A herbarium of Dioscorea bulbifera Linn. was prepared and authenticated from Balasaheb
Sawant Kokan Vidyapeeth, Dapoli.
Need for selection of Putranjiva roxburghii Wall and Dioscorea bulbifera Linn.
Ayurvedic system of medicine describes a concept called “rasayana plants”, which are used in
delaying the ageing process, improvement of mental health and removal of diseased condition. It
is found that these rasayana plants have immunomodulatory activity.
Ayurvedic concept of preventive health is attributed to immunostimulant activity of rasayanas.
Immuonosupressors are widely used in transplantation surgery. As these plants modulate the
immune response through stimulation or suppression, they are widely used in treatment of
diseases like cancer or in grafting.
An immunomodulator is a substance that helps to regulate the immune system and maintain a
disease free state. In many diseases, the immune system is impaired and these drugs modulate
the immune response, by either its stimulation or suppression.
It has been found that the plants described in Ayurveda as “rasayana” plants have
immunomodulatory activity.
Immunomodulation can thus be used as an alternative to conventional therapy for variety of
diseased conditions like Acquired Immuno Deficiency Syndrome (AIDS), when host defense
mechanism has to be activated in under the conditions of impaired immuno response when
selective immuno suppression has to be induced in disease like auto immune disorder and organ
transplantation. Due to importance of immunomodulators in treatment of diseases like Acquired
Immuno Deficiency Syndrome (AIDS), Cancer etc. A rasayana plant which may be a potential
immunomodulator was selected for the present research work.
Putranjiva roxburghii Wall. and Dioscorea bulbifera Linn. is described in Charak Samhita as a
“rasayana” plant and is thus expected to show immunomodulatory activity.

4
Method in brief
HPTLC method for simultaneous determination of β-amyrin and stigmasterol
HPTLC method for simultaneous determination of β-amyrin and stigmasterol in Putranjiva
roxburghii wall. has been developed and validated. The analytes were separated on silica gel
60F254 HPTLC plates with n - hexane: chloroform: methanol (3: 6.5:0.5 v/v/v) as mobile phase
after chamber saturation for 10 min. The development distance was 80 mm. The derivatization
was done by using anisaldehyde – sulphuric acid reagent. Detection and quantification were
performed by densitometry, with a tungsten lamp, at 580 nm. The response of β-amyrin and
stigmasterol was linear in the concentration range 0.045 to 0.360 μg per band and 0.041 to 0.328
μg per band respectively. The validated method was used for quantitative analysis of β-amyrin
and Stigmasterol in Putranjiva roxburghii wall. and can be used for routine quality-control
analysis of leaf powder of Putranjiva roxburghii wall.

5
Optimised chromatographic conditions used for quantification of β-amyrin andstigmasterol from leaf powder of Putranjiva roxburghii Wall.
Parameters Description
Stationary phase
Mobile phaseSample applicator
Speed of applicationBand lengthDistance from edges ofplate(X-position)Distance from bottomof plate(Y-position)Development chamber
Chamber saturationDevelopment distanceDensitometer Scanner
Derivatizing reagentWavelengthof detection(λ)
Aluminium backed HPTLC Silica gel 60 F254 (Cat No. 1.0.5554)(E. Merck, Germany), 200µm thickness.n-hexane: chloroform: methanol (3: 6.5:0.5 v/v/v).CAMAG Automatic TLC Sampler 4(ATS4), equipped with 25μL–Hamilton syringe.Methanol-150nL/second.8 mm.15 mm.
8 mm.
CAMAG glass twin trough chamber (20 x 10 cm and 10 x 10 cm).
10 minutes with filter paper.60 mm from lower edge of plate.CAMAG TLC Scanner 3 with win CATS software, version 1.4.4.Anisaldehyde sulphuric acid.
580 nm.
High performance thin layer chromatographic determination of β-amyrin and stigmasterolfrom leaf powder of Putranjiva roxburghii Wall.
Graph of Linear dynamic range of β-amyrin
0
1000
2000
3000
4000
0.045 0.09 0.135 0.18 0.225 0.27 0.315 0.36 0.405 0.45Peak
are
a of
β-am
yrin
conc. of β-amyrin (µg per band)

6
The graph shows that the response of β-amyrin is linear in the concentration range of 0.045µgper band to 0.360 µg per band.
A graph of response factor of β-amyrin (Y-axis) against the corresponding concentration of β-amyrin (X-axis) was plotted and is shown in Figure.
High performance thin layer chromatographic determination of β-amyrin and stigmasterolfrom leaf powder of Putranjiva roxburghii Wall.
Graph of response factor of β-amyrin against corresponding applied concentration of β-amyrin
From the above graph, it is observed that the response factor of β-amyrin was found to be
constant in the concentration range of 0.045µg per band to 0.360 µg per band.
High performance thin layer chromatographic determination of β-amyrin from leafpowder of Putranjiva roxburghii Wall.
Graph of Linear dynamic range of stigmasterol
0
2000
4000
6000
8000
10000
0.045 0.09 0.135 0.18 0.225 0.27 0.315 0.36 0.405 0.45
Resp
once
fact
or o
fβ-a
myr
in
conc. of β-amyrin (µg per band)
0
1000
2000
3000
4000
0.0410.0820.1230.1640.2050.2460.2870.3280.369 0.41
Peak
are
a of
stig
mas
tero
l
conc. of stigmasterol

7
High performance thin layer chromatographic determination of β-amyrin and stigmasterolfrom leaf powder of Putranjiva roxburghii Wall.
Graph of response factor of stigmasterol against corresponding applied concentration ofstigmasterol
From the above graph, it is observed that the response factor of stigmasterol was found to be
constant in the concentration range of 0.082µg per band to 0.328 µg per band.
Liner Working Range for β-amyrin and stigmasterol
Working standard solutions of β-amyrin and stigmasterol in the concentration range of 0.045 to
0.360 μg per band and 0.082 to 0.328 μg per band respectively were applied, in triplicate, to
three different plates and developed and scanned using the optimized conditions described
above. The densitograms were then acquired and the peak areas were recorded for each
concentration of β-amyrin and stigmasterol.
The values of mean peak areas, standard deviation (S.D.) and percent relative standard deviation
(% R.S.D.) for each of its applied concentration were calculated.
020004000600080001000012000
0.041 0.082 0.123 0.164 0.205 0.246 0.287 0.328 0.369 0.41
Resp
once
fact
or o
fst
igm
aste
rol
conc. of stigmasterol

8
High performance thin layer chromatographic determination of β-amyrin and stigmasterolfrom leaf powder of Putranjiva roxburghii Wall.
Results of Linear working range of β-amyrin
Obs.No. Concentration
of β-amyrin
(µg per band)
Peak areas of β-amyrinMean S.D. %R.S.D.
I II III
12345678
0.0450.090.1350.1800.2250.2700.3150.360
380780114815401960237326853040
385790115215501975238026903045
390795116015551980237726823050
385.0788.31153.31548.31971.62376.62685.63045.0
5.007.635.777.6310.402.884.045.00
1.2980.9680.5000.4930.5270.1210.1500.160
High performance thin layer chromatographic determination of β-amyrin and stigmasterolfrom leaf powder of Putranjiva roxburghii Wall.
Results of Linear working range of stigmasterolObs.No. Concentration
of stigmasterol
(µg per band)
Peak areas of stigmasterolMean S.D. %R.S.D.
I II III
12345678
0.0410.0820.1230.1640.2050.2460.2870.328
4158251225161520352450
28403245
425835123516272042245528563252
410815122816322048244528353258
416.6825.01229.31624.62041.62450.02843.6
3251.6
7.63710.005.1318.7366.5065.00010.9696.506
1.8331.2120.4170.5370.3180.2040.3850.200

9
Regression analysis
The regression analysis of the calibration data was carried out to determine the relationshipbetween the dependent variable (peak area of β-amyrin and stigmasterol) and independentvariable (concentration of β-amyrin and stigmasterol).The regression equation is:
y = mx + c
where,y = Mean peak area of β-amyrin and stigmasterol.m = slope of the regression line.x= Concentration of β-amyrin and stigmasterol (μg per band)
c = Intercept on y – axis.The values of correlation co-efficient, intercept and slope were determined from the graph ofmean peak area of β-amyrin and stigmasterol (Y–axis) against corresponding appliedconcentration of β-amyrin and stigmasterol (X–axis).
The regression equation for β-amyrin was found to be,y = 8518.5 x + 19.25This indicates that 99.94% (correlation coefficient (r) × 100) of the variation in the response isexplained by the variation in concentration of β-amyrin. The results of the regression analysis aregiven in Table.
The regression equation for stigmasterol was found to be,y = 9864.9 x + 11.25This indicates that 99.99% (correlation coefficient (r) × 100) of the variation in the response isexplained by the variation in concentration of stigmasterol.Limit of detection (LOD) and limit of Quantification (LOQ)The values of LOD and LOQ were determined at a signal to noise ratio of 3:1 and 10:1respectively. The values of Limit of detection (LOD) and Limit of Quantification (LOQ)obtained for β-amyrin were 0.045 and 0.09 μg per band and stigmasterol were 0.041 and 0.082μg per band respectively

10
High performance thin layer chromatographic determination of β-amyrin and stigmasterolfrom leaf powder of Putranjiva roxburghii Wall.
A typical HPTLC chromatogram of methanol extract of leaf powder of Putranjivaroxburghii Wall. at λ = 580 nm
High performance thin layer chromatographic determination of β-amyrin and stigmasterolfrom leaf powder of Putranjiva roxburghii Wall.
A typical HPTLC chromatogram of reference standard β-amyrin and stigmasterol. at λ =580 nm

11
High performance thin layer chromatographic determination of β-amyrin and stigmasterol
from leaf powder of Putranjiva roxburghii Wall.
TLC plate showing separation of standard β-amyrin and stigmasterol and β-amyrin and
stigmasterol present in methanol extract of leaf powder of Putranjiva roxburghii Wall.
Photograph of developed TLC plate showing chromatography of stigmasterol (1), β-amyrin (2)
and methanol extract of leaf powder of Putranjiva roxburghii Wall. (3, 4)

12
High performance thin layer chromatographic determination of β-amyrin and stigmasterol
from leaf powder of Putranjiva roxburghii Wall.
Results of assay experiment β-amyrin and stigmasterol from leaf powder of Putranjiva
roxburghii Wall.
Obsno Mass of plant
powder ( mg)
β-amyrinpeakarea
Amount ofβ-amyrin found
StigmasterolPeak area(mg)
Amount ofstigmasterolfound (mg)
1234567MeanS.D.% R.S.D.
10071005100410071005100910061006.11.6760.166
12451268126412601258126312681260.87.9250.628
0.0720.0730.0730.0720.0720.0730.0730.06230.00040.721
13451325134813501342135513351342.810.0900.751
0.0680.0670.0680.0680.0670.0680.0670.06750.00050.791
The amount of β-amyrin and stigmasterol present in each sample solution and the values of
standard deviation (S.D.), percent relative standard deviation (% R.S.D.) were calculated. The
results of assay experiment of β-amyrin and stigmasterol present in leaf powder solutions are
given in Table.
Calculations of assay of average content of β-amyrin and stigmasterol in 1000.0 mg of leaf
powder of Putranjiva roxburghii Wall.
The linear regression analysis data used for the quantitation of β-amyrin and stigmasterol in leaf
powder of Putranjiva roxburghii Wall. is as follows:
y = mx +c
Where, y = mean peak area of β-amyrin and stigmasterol
m = slope of the regression line.

13
c= Intercept on Y-axis.
x = concentration of β-amyrin and stigmasterol (µg per band).
From the sample solution, mean peak area of β-amyrin in leaf powder of Putranjiva roxburghii
Wall. , y = 1260.8
From the sample solution, mean peak area of stigmasterol in leaf powder of Putranjiva
roxburghii Wall. , y = 1342.8
Mean weight of the sample = 1006.1 mg
From the plot of concentration of β-amyrin (X-axis) against peak area of β-amyrin (Y-axis), the
linear regression equation obtained for β-amyrin was,
y = 8518.5x + 19.25
From the plot of concentration of stigmasterol (X-axis) against peak area of stigmasterol (Y-
axis), the linear regression equation obtained for stigmasterol was,
y = 9864.9x + 11.25
Where,
Unknown concentration of β-amyrin in 10 μl sample solution
β-amyrin stigmasterol
Slope(m) 8518.5 9864.9
Intercept(c) 19.25 11.25
Correlationcoefficient(r)
0.9994 0.9999

14
= (y - c) / m
= (1260.8 -19.25) / 8518.5
= 0.145µg.
Since, 10 μl of sample on plate contains 0.145 µg of β-amyrin, 5000 μl contains 72.5µg of β-
amyrin.
Therefore, amount of β-amyrin in 1006.1 mg of leaf powder of Putranjiva roxburghii Wall. =
0.072mg/g.
Unknown concentration of stigmasterol in 10 μl sample solution
= (y - c) / m
= (1342.8 -11.25) / 9864.9
= 0.133µg.
Since, 10 μl of sample on plate contains 0.133 µg of stigmasterol, 5000 μl contains 66.5µg of
stigmasterol.
Therefore, amount of β-amyrin in 1006.1 mg of leaf powder of Putranjiva roxburghii Wall. =
0.066 mg/g
Recovery Experiment
Accuracy of the experiment was determined by recovery experiment at three different levels,
using standard addition method. The recovery experiment was carried out to determine if there is
any interference of other constituents present in methanol extract of leaf powder of Putranjiva
roxburghii Wall. with respect to the separation, detection and quantification of β-amyrin and
stigmasterol.
To the accurately weighed about 1000mg each of leaf powder of Putranjiva roxburghii Wall.,
known amounts of β-amyrin and stigmasterol were added in solution form, at three different

15
levels. Each sample solution was then analysed by the developed HPTLC method under
optimised chromatographic conditions. The recovery experiment for leaf powder of Putranjiva
roxburghii Wall. was carried out in seven replicates at every level. The amounts of β-amyrin and
stigmasterol recovered from leaf powder solution for each level were determined. From the
amounts of β-amyrin and stigmasterol obtained, values of percent recovery were determined for
leaf powder of Putranjiva roxburghii Wall
High performance thin layer chromatographic determination of β-amyrin and stigmasterolfrom leaf powder of Putranjiva roxburghii wall.
Results of recovery experiment for β-amyrin after addition of standard β-amyrin to leafpowder of Putranjiva roxburghii Wall.
Level Wt. ofsample*
Wt. ofstandardadded(mg)
Amount of β-amyrin found(mg)S. D. %R.
S.D.1 2 3 4 5 6 7
Mean**(mg)
0
1
2
3
1005
1007
1004
1003
0
0.073
0.091
0.109
0.073
0.140
0.160
0.180
0.072
0.135
0.162
0.175
0.071
0.138
0.159
0.178
0.073
0.142
0.163
0.179
0.073
0.137
0.158
0.180
0.071
0.137
0.166
0.172
0.072
0.141
0.161
0.175
0.072
0.138
0.161
0.177
0.00089
0.0025071
0.0026904
0.0030551
1.24
1.80
1.66
1.72
16
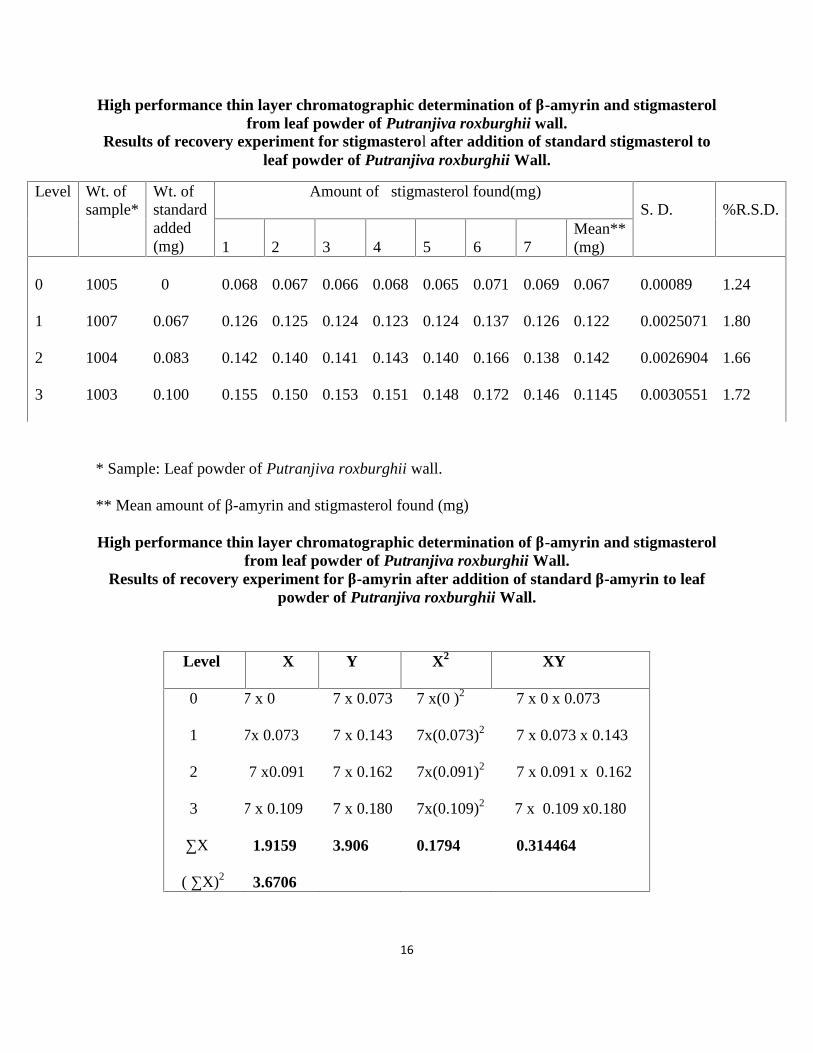
High performance thin layer chromatographic determination of β-amyrin and stigmasterolfrom leaf powder of Putranjiva roxburghii wall.
Results of recovery experiment for stigmasterol after addition of standard stigmasterol toleaf powder of Putranjiva roxburghii Wall.
* Sample: Leaf powder of Putranjiva roxburghii wall.
** Mean amount of β-amyrin and stigmasterol found (mg)
High performance thin layer chromatographic determination of β-amyrin and stigmasterolfrom leaf powder of Putranjiva roxburghii Wall.
Results of recovery experiment for β-amyrin after addition of standard β-amyrin to leafpowder of Putranjiva roxburghii Wall.
Level Wt. ofsample*
Wt. ofstandardadded(mg)
Amount of stigmasterol found(mg)S. D. %R.S.D.
1 2 3 4 5 6 7Mean**(mg)
0
1
2
3
1005
1007
1004
1003
0
0.067
0.083
0.100
0.068
0.126
0.142
0.155
0.067
0.125
0.140
0.150
0.066
0.124
0.141
0.153
0.068
0.123
0.143
0.151
0.065
0.124
0.140
0.148
0.071
0.137
0.166
0.172
0.069
0.126
0.138
0.146
0.067
0.122
0.142
0.1145
0.00089
0.0025071
0.0026904
0.0030551
1.24
1.80
1.66
1.72
Level X Y X2 XY
0
1
2
3
∑X
( ∑X)2
7 x 0
7x 0.073
7 x0.091
7 x 0.109
1.9159
3.6706
7 x 0.073
7 x 0.143
7 x 0.162
7 x 0.180
3.906
7 x(0 )2
7x(0.073)2
7x(0.091)2
7x(0.109)2
0.1794
7 x 0 x 0.073
7 x 0.073 x 0.143
7 x 0.091 x 0.162
7 x 0.109 x0.180
0.314464

17
No. of observations = 28.
Therefore, Percent recovery = (28 x 0.3144) - (1.9159 x 3.906)
28 x (0.1795) – (3.671)
= 97.59 %
High performance thin layer chromatographic determination of β-amyrin and stigmasterolfrom leaf powder of Putranjiva roxburghii Wall.
Results of recovery experiment for stigmasterol after addition of standard stigmasterol toleaf powder of Putranjiva roxburghii Wall.
No. of observations = 28.
Therefore, Percent recovery = (28 x 0.2639) - (1.75 x 3.591)
28 x (0.1496) – (3.0625)
= 98.0%
Level X Y X2 XY
0
1
2
3
∑X
( ∑X)2
7 x 0
7x 0.47
7 x 0.71
7 x 0.95
14.91
222.308
7 x 0.951
7 x 1.414
7 x 1.641
7 x 1.896
41.314
7 x(0 )2
7x(0.47)2
7x(0.71)2
7x(0.95)2
11.3925
7 x 0 x 0.951
7 x 0.47 x 1.414
7 x 0.71 x 1.641
7 x 0.95 x 1.896
25.4161

18
Results:High performance thin layer chromatographic determination of β-amyrin and stigmasterol
from leaf powder of Putranjiva roxburghii Wall.Results of validation parameters for β-amyrin and stigmasterol
Parameters β-amyrin stigmasterol
Linear working range(µg per band)Correlation coefficient(r)Limit of Detection(LOD)(µg per band)Limit of Quantification(LOQ)(µg per band)Instrument precision (% R.S.D, n=10)Repeatability (% R.S.D, n =6)Leaf powder of Putranjiva roxburghii wall.Intermediate precision (% R.S.D, n= 18)Leaf powder of Putranjiva roxburghii Wall.Stability of standard solution
System suitabilityRF (% R.S.D. , n =6)Peak area (% R.S.D., n=6)Assay (mg/g)Leaf powder of Putranjiva roxburghii Wall.Percent recovery (%)Leaf powder of Putranjiva roxburghii Wall.
0.045-0.3600.99940.0450.090.5740.81
0.693
Stable for minimum24 hours
0.818
0.2999
0.072
97.59
0.082 - 0.3280.99980.0410.0820.4960.80
0.734
Stable forminimum 24 hours
0.918
0.465
0.066
98.0
Discussion
In the present research work, a HPTLC method has been developed for the quantitative
determination of β-amyrin and stigmasterol from leaf powder of Putranjiva roxburghii Wall.
To achieve quantitative extraction of β-amyrin and stigmasterol from leaf powder of Putranjiva
roxburghii Wall., the influence of extracting solvents like methanol, chloroform and diethyl ether
was determined. The maximum percent extractive value for leaf powder of Putranjiva
roxburghii Wall. was obtained using methanol. Therefore, methanol was selected as the solvent
for the quantitative determination of β-amyrin and stigmasterol from leaf powder of Putranjiva
roxburghii Wall. Further, parameters like volume of solvent and time needed for extraction of β-

19
amyrin and stigmasterol from leaf powder of Putranjiva roxburghii Wall. was optimized, using
methanol as the extracting solvent. It was found that 10.0 cm3 of methanol and extraction time of
15 minutes was sufficient for complete extraction of β-amyrin and stigmasterol from leaf powder
of Putranjiva roxburghii Wall.
In the reported method C18 RP HPTLC plate has been used whereas in the present research work
normal mode of separation has been used for quantitation of β-amyrin and stigmasterol.
An overlay of UV spectra of standard β-amyrin and stigmasterol with β-amyrin and stigmasterol
present in leaf powder of Putranjiva roxburghii Wall. shows that the peak of β-amyrin and
stigmasterol is not masked by the peak of any other component present in the sample. The peak
area of β-amyrin and stigmasterol in leaf powder solution increased after addition of standard β-
amyrin and stigmasterol standard to the leaf powder solution without interference from other
peaks. The percent recovery values for leaf powder solutions obtained were high indicating good
accuracy of the method.
Conclusion
An HPTLC method developed for the quantitation of β-amyrin and stigmasterol from the leaf
powder of Putranjiva roxburghii Wall. is simple, precise and accurate and can be used for
routine quality control analysis of leaf powder of Putranjiva roxburghii Wall.
20
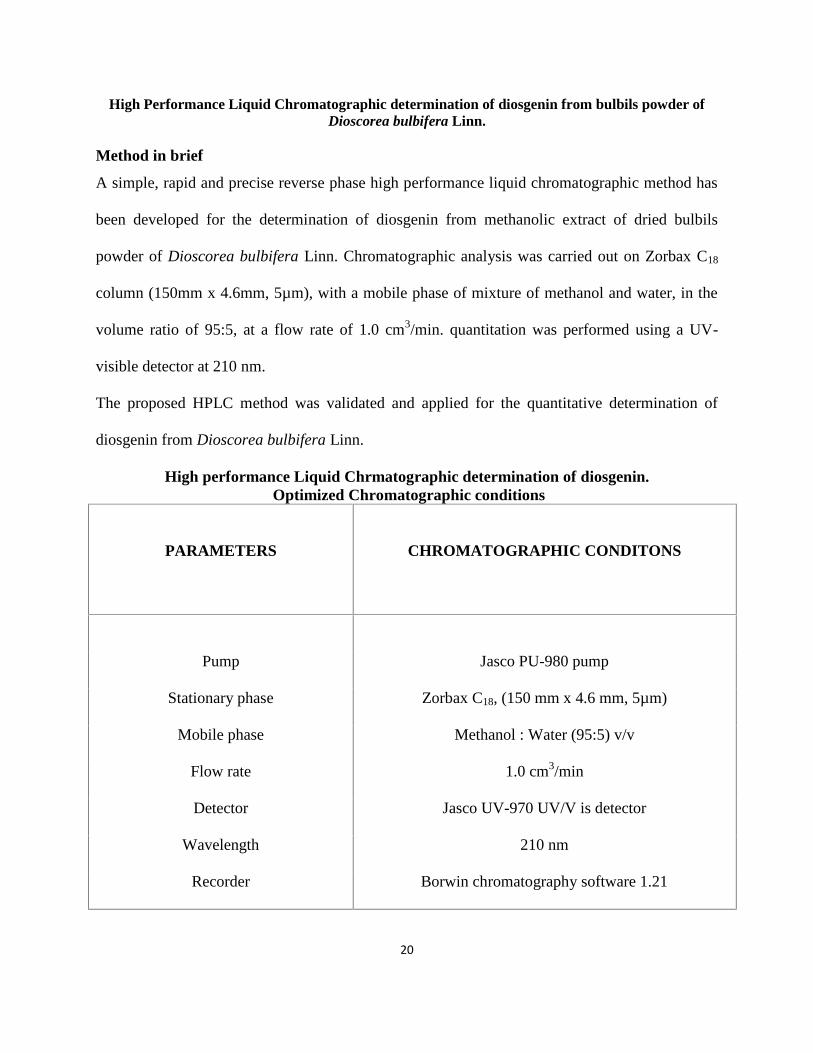
High Performance Liquid Chromatographic determination of diosgenin from bulbils powder ofDioscorea bulbifera Linn.
Method in brief
A simple, rapid and precise reverse phase high performance liquid chromatographic method has
been developed for the determination of diosgenin from methanolic extract of dried bulbils
powder of Dioscorea bulbifera Linn. Chromatographic analysis was carried out on Zorbax C18
column (150mm x 4.6mm, 5µm), with a mobile phase of mixture of methanol and water, in the
volume ratio of 95:5, at a flow rate of 1.0 cm3/min. quantitation was performed using a UV-
visible detector at 210 nm.
The proposed HPLC method was validated and applied for the quantitative determination of
diosgenin from Dioscorea bulbifera Linn.
High performance Liquid Chrmatographic determination of diosgenin.Optimized Chromatographic conditions
PARAMETERS CHROMATOGRAPHIC CONDITONS
Pump Jasco PU-980 pump
Stationary phase Zorbax C18, (150 mm x 4.6 mm, 5µm)
Mobile phase Methanol : Water (95:5) v/v
Flow rate 1.0 cm3/min
Detector Jasco UV-970 UV/V is detector
Wavelength 210 nm
Recorder Borwin chromatography software 1.21

21
Method Validation:
Linear dynamic range of diosgenin:
This experiment was carried out to demonstrate the range over which the response of the detector
is linear with respect to concentration of diosgenin.
Aliquots of (10.0 µL, 20.0 µL, 30.0 µL, 50.0 µL, 100.0 µL, 200.0 µL, 400.0 µL, 600.0 µL, 800.0
µL, 1000.0 µL and 1200.0 µL) were drawn from diosgenin standard solution of concentration
(100.0 µg/cm3) and transferred to separate 10.0 cm3 volumetric standard flask. The volume of
each standard flask was adjusted to 10.0 cm3 with the mobile phase used, to obtain standard
solutions of diosgenin with concentrations of 0.10 µg/cm3, 0.20 µg/cm3, 0.30 µg/cm3, 0.50
µg/cm3, 1.00 µg/cm3, 2.00 µg/cm3, 4.00 µg/cm3, 6.00 µg/cm3, 8.00 µg/cm3, 10.00 µg/cm3, and
12.00 µg/cm3 respectively.
Twenty microlitres of each of the standard solutions of diosgenin in the concentration range of 0.
10 µg/cm3 to 14.00 µg/cm3 were injected into the chromatographic system under the optimized
chromatographic conditions. The chromatograms were recorded and the peak areas of diosgenin
for each injected concentration of diosgenin, were noted. The response factors were calculated
for each concentration of diosgenin by dividing each peak area by concentration of diosgenin at
that level. The values of peak areas and response factors of diosgenin for each injected
concentration are tabulated in Table.

22
High Performance Liquid Chromatographic determination of diosgenin.Results of the linear Dynamic Range of diosgenin
Obs. No
Concentrationof diosgenin(µg/cm3)
Peak area ofdiosgenin Response factor
1 0.1 4250 42500
2 0.2 8721 43605
3 0.3 12952 43173.3
4 0.5 22480 44960
5 1 49560 49560
6 2 96520 48260
7 4 195078 48769.5
8 6 299405 49900.8
9 8 390580 48822.5
10 10 487521 48752.1
11 12 585450 48787.5
A graph of peak area values of diosgenin (Y-axis), against the corresponding concentrations of
diosgenin (X-axis), was plotted and is shown in Figure.
High Performance Liquid Chromatographic determination of diosgenin
Linear Dynamic Range of diosgenin
0100000200000300000400000500000600000700000
0.1 0.2 0.3 0.5 1 2 4 6 8 10 12
peak
are
a of
dio
sgen
in
conc. of diosgenin (µg/cm3 )

23
The graph shows that the response of diosgenin is linear in the concentration range of 1.00
µg/cm3 to 12.00 µg/cm3.
A graph of response factor of diosgenin (Y-axis), against corresponding concentration of
diosgenin (X-axis), was plotted as shown in Figure.
High Performance Liquid Chromatographic determination of diosgenin
Graph of response factor for diosgenin against the corresponding concentration of
diosgenin
From the above graph, it is observed that the response factor was found to be constant in the
concentration range of 1.0 µg/cm3 to 12.00 µg/cm3 of diosgenin.
Linear Working Range of diosgenin :
The concentration range of diosgenin solution selected for linearity was 1.00 µg/cm3 to 12.00
µg/cm3 respectively.
Into a series of 10.0 cm3 standard volumetric flask, aliquots of (100.0 µL, 200.0 µL, 400.0 µL,
600.0 µL, 800.0 µL, 1000.0 µL and 1200 µL) were drawn from diosgenin stock solution of
0100002000030000400005000060000
0.1 0.2 0.3 0.5 1 2 4 6 8 10 12
Resp
onse
fact
or o
f dio
sgen
in
conc. of diosgenin (µg/cm3 )

24
concentration (100.0 µg/cm3) and the contents of each flask were diluted up to the mark with the
mobile phase used, to obtain a concentration range of 1.00 µg/cm3 to 12.00 µg/cm3 respectively.
Twenty microlitres, of each of these solutions, were injected into the chromatographic system
under the optimized chromatographic conditions, in triplicate. The chromatograms were recorded
and the peak areas of diosgenin were noted for each concentration of the working standard
solutions of diosgenin, applied in triplicate. The values of mean peak areas, standard deviation
and the percent relative standard deviation of a diosgenin for each injected concentration were
calculated. The results are tabulated in Table.
High Performance Liquid Chromatographic determination of diosgeninResults of the Linear Working Range of diosgenin
Obs.No
Concentrationof diosgenin(µg/cm3)
Peak area of diosgeninMeanpeak area S.D %R.S.D
1 1.0 49850 49652 49923 49808.3 140.2 0.28
2 2.0 96786 96574 96445 96601.6 172.1 0.17
3 4.0 195120 194832 196252 195401.3 750.6 0.38
4 6.0 299457 299206 299560 299407.6 182.0 0.06
5 8.0 390596 390289 390496 390460.3 156.5 0.04
6 10.0 487557 487239 487953 487583.0 357.7 0.07
7 12.0 585473 585460 585840 585591.0 215.7 0.03
A graph of mean peak area values of diosgenin (Y-axis) against the corresponding concentration
of diosgenin (X-axis) was plotted, which showed a linear response in concentration range of 1.00
µg/cm3 to 12.00 µg/cm3.
25
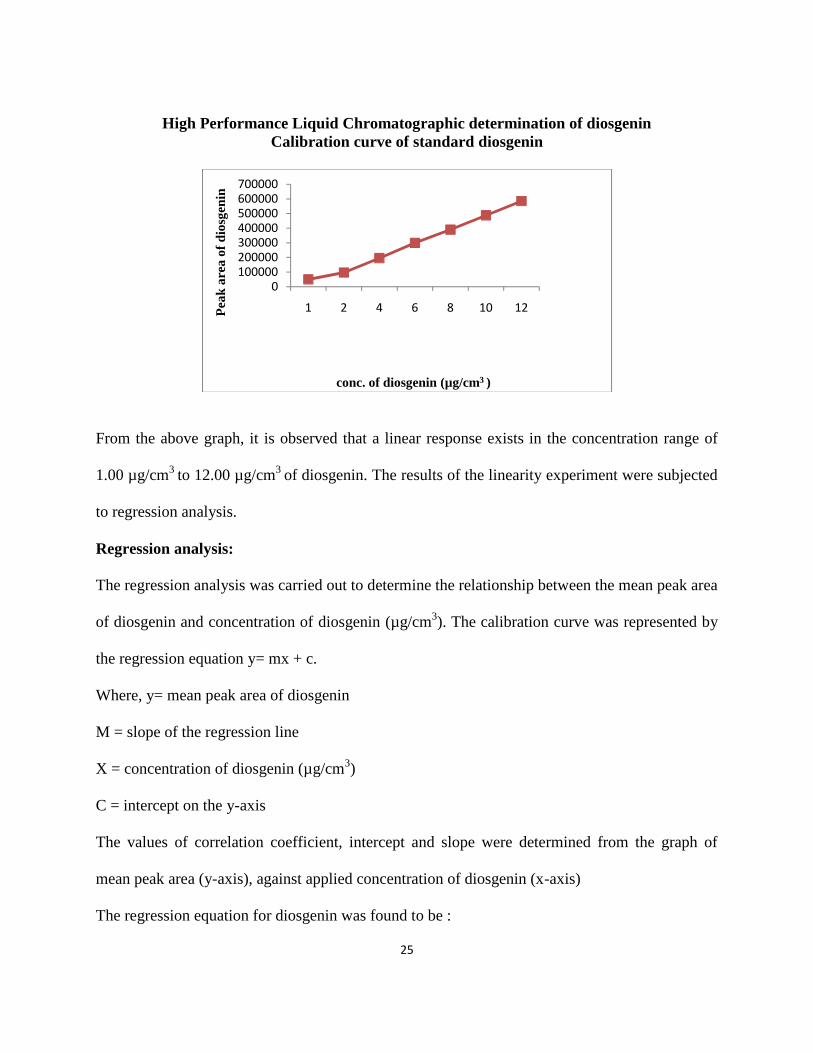
High Performance Liquid Chromatographic determination of diosgeninCalibration curve of standard diosgenin
From the above graph, it is observed that a linear response exists in the concentration range of
1.00 µg/cm3 to 12.00 µg/cm3 of diosgenin. The results of the linearity experiment were subjected
to regression analysis.
Regression analysis:
The regression analysis was carried out to determine the relationship between the mean peak area
of diosgenin and concentration of diosgenin (µg/cm3). The calibration curve was represented by
the regression equation y= mx + c.
Where, y= mean peak area of diosgenin
M = slope of the regression line
X = concentration of diosgenin (µg/cm3)
C = intercept on the y-axis
The values of correlation coefficient, intercept and slope were determined from the graph of
mean peak area (y-axis), against applied concentration of diosgenin (x-axis)
The regression equation for diosgenin was found to be :
0100000200000300000400000500000600000700000
1 2 4 6 8 10 12Pea
k ar
ea o
f di
osge
nin
conc. of diosgenin (µg/cm3 )

26
Y = 48760.6 x + 1163.9
This indicates that 99.99 % (correlation coefficient r x 100) of the variation in the response is
explained by the variation in concentration of diosgenin. The results of the regression analysis
are given in Table.
High Performance Liquid Chromatographic determination of diosgeninRegression analysis data of diosgenin
Slope (m) 48760.6
Intercept (c) 1163.9
Correlation coefficient (r) 0.9999
High Performance Liquid Chromatographic determination of diosgenin
A typical HPLC chromatogram of standard diosgenin.
High Performance Liquid Chromatographic determination of diosgenin.
A typical chromatogram of methanolic extract of dried bulbils powder of Dioscorea
bulbifera Linn.

27
Limit of Detection (LOD) & Limit of Quantitation (LOQ) for diosgenin:
The limit of detection (LOD) can be defined as the peak, whose signal to noise ratio is atleast
3:1. The limit of detection for diosgenin was 0.01µg/cm3. The limit of quantitation (LOQ) can be
defined as the peak whose signal to noise ratio is at least 10:1. The limit of quantitaion for
diosgenin was 0.30 µg/cm3.
Application of the proposed method for the determination of Diosgenin from Dioscorea
bulbifera Linn.
Sample preparation:
About100.0 mg of bulbils powder was accurately weighed and transferred to a stoppered test
tube and 10.0 cm of methanol was then added to it. It was then sonicated for 20 min. The extract
was then filtered through whatman filter paper no 41 and the filtrate were further used as a
sample solution for the assay experiment.
Assay procedure
The quantitation of diosgenin was done using above validated HPLC method. The optimized
chromatographic conditions were set on the HPLC system and the system was monitored to27
Limit of Detection (LOD) & Limit of Quantitation (LOQ) for diosgenin:
The limit of detection (LOD) can be defined as the peak, whose signal to noise ratio is atleast
3:1. The limit of detection for diosgenin was 0.01µg/cm3. The limit of quantitation (LOQ) can be
defined as the peak whose signal to noise ratio is at least 10:1. The limit of quantitaion for
diosgenin was 0.30 µg/cm3.
Application of the proposed method for the determination of Diosgenin from Dioscorea
bulbifera Linn.
Sample preparation:
About100.0 mg of bulbils powder was accurately weighed and transferred to a stoppered test
tube and 10.0 cm of methanol was then added to it. It was then sonicated for 20 min. The extract
was then filtered through whatman filter paper no 41 and the filtrate were further used as a
sample solution for the assay experiment.
Assay procedure
The quantitation of diosgenin was done using above validated HPLC method. The optimized
chromatographic conditions were set on the HPLC system and the system was monitored to

28
attain a stable base line. Twenty microlitres of solution was injected into the chromatographic
system under the optimized chromatographic conditions.
The identity of peak of diosgenin in the sample solution was confirmed by comparing the
chromatogram of the sample with that of the diosgenin standard solution having retention time as
8.51minutes. Amount of diosgenin present in the sample solution was determined from the
calibration curve by using the peak area of diosgenin in the sample solution.
To ascertain the repeatability of the method, the assay experiment was repeated seven times. The
values of amount of diosgenin present in Dioscorea bulbifera Linn., standard deviation and the
percent relative standard deviation were calcultated. The results of assay are given in Table.
High performance Liquid Chromatographic determination of diosgeninResults of assay Experiment
Obs.No. weight of bulbilspowder
Peak area ofdiosgenin
Amount of diosgeninpresent mg/g
1 100.5 303789 0.620
2 100.8 304198 0.621
3 100.3 303952 0.620
4 100.7 304315 0.621
5 100.6 304489 0.622
6 100.5 304096 0.621
7 100.4 303948 0.620
Mean 100.5 304112.4 0.621S,D 0.171 240.76 0.004%RSD 0.170 0.079 0.079
Calculation of assay of mean content of diosgenin in 100.5mg dried bulbils powder of
Dioscorea bulbiferra Linn. :
According to the calibration curve, y = mx + c

29
Where, y = peak area of Diosgenin.
M = slope of the regression line.
X = concentration of diosgenin in µg/cm3.
C = Intercept on Y-axis.
For the sample solution, mean peak area of diosgenin, y = 304112.4
Average weight of the sample = 100.5mg
From results of regression analysis of calibration data
M = 48760.6, c = 1163.9Unknown concentration of diosgrnin in 1.0 cm3 of sample solution
= (y-c) / m
= (304112.4 - 1163.9) / 48760.6Unknown concentration of diosgenin in 10.0 cm3of sample solution =
62.0 µg or 0.0620 mg
Concentration of diosgenin in 100.5 mg of bulbils powder on Dioscorea bulbifera Linn. =
0.062mg
Concentration of diosgenin in 1.0 g of bulbils powder of Dioscorea bulbifera Linn. = 0.62mg
Recovery :
The recovery experiment was carried out by standard addition method. A fixed amount of
sample was weighed three times. Three different levels of standards were added to each weighed
amount of sample which were 100%, 125% and 150% of the standard in the plant powder. Each
set of analysis was repeated to check if there is any interference of other constituents present in
Dioscorea bulbifera Linn. by HPLC under optimized chromatographic conditions. The value of
percentage recovery was calculated.

30
High performance Liquid Chromatographic determination of diosgeninResults of recovery experiment.
LevelWt. ofsample(mg)*
Wt. ofstd.added(mg)
Amount of diosgenin found (mg)Mean**(mg)
S.D%R.S.D
1 2 3 4 5 6 70 100.5 0 0.062 0.061 0.063 0.062 0.063 0.061 0.060 0.061 0.001 1.802
1 100.7 0.06 0.120 0.121 0.122 0.119 0.117 0.118 0.124 0.120 0.002 2.006
2 100.4 0.08 0.142 0.140 0.138 0.141 0.137 0.139 0.138 0.139 0.002 1.291
3 100.6 0.09 0.152 0.151 0.149 0.148 0.150 0.147 0.149 0.149 0.001 1.149
* Sample: Dried bulbils of Dioscorea bulbiferra Linn.**Mean amount of Diosgenin found.
High Performance Liquid Chromatographic determination of diosgeninResults of Recovery Experiment
Level X Y X2 XY0 7x 0 7x 0.061 7 x (0.00)2 7 x 0x 0.061
1 7x 0.06 7x 0.120 7 x (0.06)2 7 x 0.06 x 0.120
2 7x 0.08 7x 0.139 7 x (0.08)2 7 x 0.08 x 0.139
3 7x 0.09 7x 0.149 7 x (0.09)2 7 x 0.09 x 0.149
Σ 1.61 3.283 0.126 0.222
Number of observations = 28
Therefore,
% Recovery = (28 x 0.222) – (1.61 x 3.283) x 100
(28 x 0.126)-( 2.592)
= 97.69

31
Results:High Performance Liquid Chromatographic determination of diosgenin
Results of validation parameters for diosgenin.Parameters Diosgenin
Linear working range (µg/cm3) 1µg/cm3 to 12.00 µg/cm3
Correlation coefficient(r) 0.9999
Limit of Detection(LOD)(µg/cm3) 0.01 µg/cm3
Limit of Quantification (LOQ) (µg/cm3) 0.30 µg/cm3
Instrument precision (% R.S.D, n=10) 0.086
Repeatability (% R.S.D, n =6) 0.067
Bulbils powder of Dioscorea bulbifera Linn.
Intermediate precision (% R.S.D, n= 18) 0.077
Bulbils powder of Dioscorea bulbifera Linn.
Stability of standard solution Stable for minimum 48
hours
System suitability
Retention time of diosgenin
(% R.S.D. , n =6) 0.369
Peak area (% R.S.D., n=6) 0.195
Assay (mg/g)
bulbils powder of Dioscorea bulbifera Linn. 0.62
Percent recovery (%) 97.69

32
DiscussionThe mobile phase used in the present research work for quantitaion of diosgenin from
methanolic, dried bulbils powder extract of Dioscorea bulbiferra Linn. is methanol and water in
the volume ratio of 95:5 (v/v) which is relatively simpler as compared to the mobile phase used
in the reported methods.
The retention time for diosgenin was found to be 8.54 minutes which is relatively less than the
retention time reported in the literature (18.06 min., 11.08 min., and 15.05 min. respectively.).
The method used in the present research work was also found to be sensitive to measure the
concentration as low as 0.01 µg/cm3, whereas in the reported method 1-3, the detection limit was
0.037 µg/cm3, 0.04 µg/cm3 and 10.0 µg/cm3 respectively.
The column used in the present research work, comprised of octadecyl bonded to silica phase.
Due to the length of the column, (250.0 mm) and small particle size of silica (5.0 µm), a good
resolution of diosgenin from different components of bulbils powder of Dioscorea bulbiferra
Linn. was obtained.
Hence the HPLC method used in the present research work was found to be simpler, sensitive
and accurate than other reported methods.
Conclusion
An HPLC method developed for the quantitation of diosgenin from the bulbils powder of
Dioscorea bulbifera Linn. is simple, precise and accurate and can be used for routine quality
control analysis of bulbils powder of Dioscorea bulbiferra Linn.

33
Study of Immunomodulatory activity of Putranjiva roxburghii Wall.Using cyclophosphamide
induced immune suppressed mice
Study Protocol
Study titleImmunomodulatory effect of Putranjivaroxburghii Wall. on Cyclophosphamide InducedImmune Suppressed Swiss Albino Mice
Testing facilityAnimal Testing Unit (CPCSEA/315)
Ramnarain Ruia College,Matunga, Mumbai- 400 019
Drugs tested in the studyLeaf powder of Putranjiva roxburghii Wall.Stem powder of Tinospora cordifolia Miers.Lithium carbonate powder
Storage container for Drugs Polycarbonate Container
Storage conditions of Drugs Room Temperature (30 ± 2o C)
Test system
Species Swiss Albino mice
Sex Male
Animal Source Haffkine Bio- Pharma. Corpn. Ltd., Mumbai
Number of Groups Four
Number of animals Six per group
Age of animals at start of study 3- 4 weeks
Body weight at start of study 20- 23 g
Identification of animals By cage tag and marking on the innersurface of the ear
Acclimatization period One week in the experimental room
34
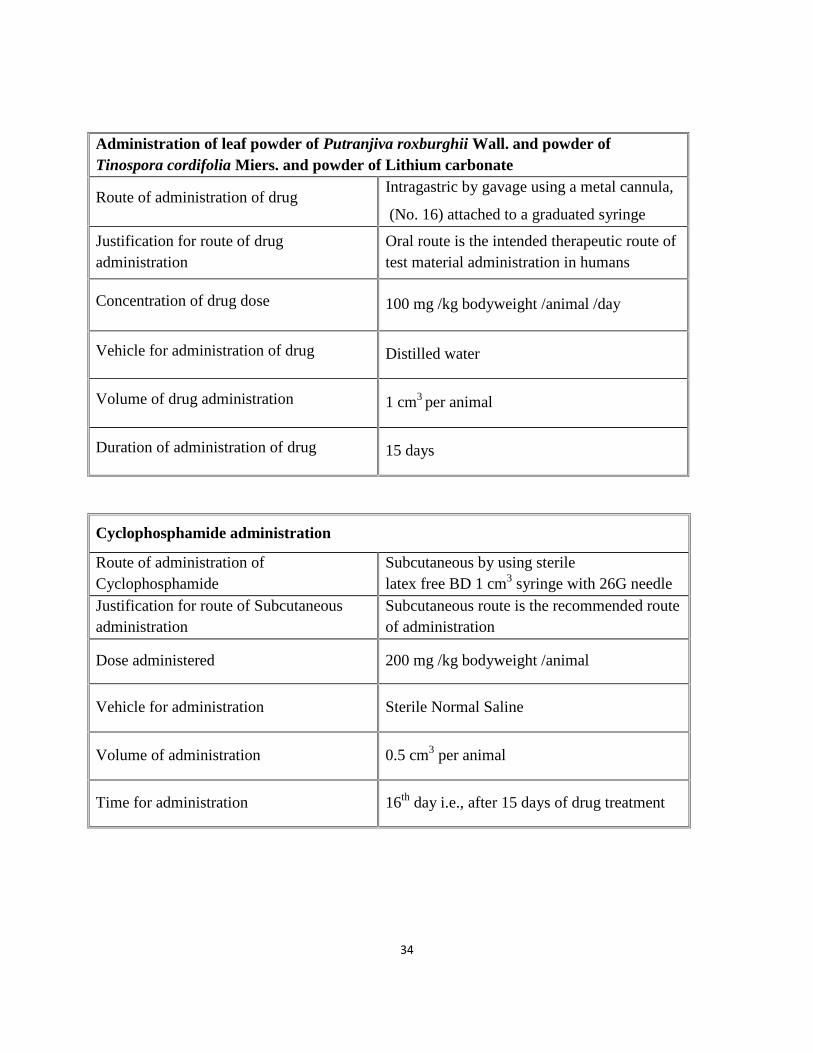
Administration of leaf powder of Putranjiva roxburghii Wall. and powder ofTinospora cordifolia Miers. and powder of Lithium carbonate
Route of administration of drugIntragastric by gavage using a metal cannula,
(No. 16) attached to a graduated syringe
Justification for route of drugadministration
Oral route is the intended therapeutic route oftest material administration in humans
Concentration of drug dose 100 mg /kg bodyweight /animal /day
Vehicle for administration of drug Distilled water
Volume of drug administration 1 cm3 per animal
Duration of administration of drug 15 days
Cyclophosphamide administration
Route of administration ofCyclophosphamide
Subcutaneous by using sterilelatex free BD 1 cm3 syringe with 26G needle
Justification for route of Subcutaneousadministration
Subcutaneous route is the recommended routeof administration
Dose administered 200 mg /kg bodyweight /animal
Vehicle for administration Sterile Normal Saline
Volume of administration 0.5 cm3 per animal
Time for administration 16th day i.e., after 15 days of drug treatment

35
Blood sample withdrawals
1. On 1st day of study before drugadministration
2. On 16th day before cyclophosphamideadministration
3. On 3rd day after cyclophosphamideadministration
4. On 7th day after cyclophosphamideadministration
Animal Husbandry
Environmental conditions
The animal room was maintained at atemperature of 28- 30o C and kept at relativehumidity of 65- 70 %.
The rate of air exchange was continuoususing exhausts.
The lighting was controlled by a timer to givea cycle of 12 hours continuous light and 12hours continuous darkness.
AccommodationAnimals were housed in groups of six in solidfloor polypropylene cages with rice huskbedding and facilities for food and water.
FoodRat feed pellets supplied by Amrut AnimalFeed Laboratory, Chakan Oil Mills Ltd.,Maharashtra
WaterPotable water was provided ad libitum inglass bottles with stainless steel sipper caps.
Parameters used for evaluation ofImmunomodulatory effect
Total leukocyte count and neutrophil counts
Approval for animal studyThe study was approved by the Institutional Animal Ethics Review Committee, Ramnarain Ruia
College, Matunga, Mumbai- 400 019. Experimental animals were handled according to the
University and Legalization, regulated by the Committee for the Purpose of Control and

36
Supervision of Experiments on Animals (CPCSEA), Ministry of Social Justice and
Empowerment, Government of India.
Animal grouping for the present animal study
The animals were randomly divided into five groups of six male mice each.
Group (I): Control Group (1.0 cm3 distilled water administered during the entire study)
Group (II): Lithium carbonate 100 mg/kg + Cyclophosphamide 200 mg/kg administeredsubcutaneously after first fifteen days of treatment with lithium carbonate.
Group (III): Tinospora cordifolia Miers. 100 mg/kg, total aqueous extract of stem powder +Cyclophosphamide 200 mg/kg administered subcutaneously after first fifteen days treatmentwith stem powder of Tinospora cordifolia Miers.
Group (IV): Putranjiva roxburghii Wall. 100 mg/kg, total aqueous extract of leaf powder +
Cyclophosphamide 200 mg/kg administered subcutaneously after first fifteen days treatment
with leaf powder of Putranjiva roxburghii Wall.
Drug treatment administered to various groups
Group
n = 6/ groupDrug Treatment
Concentration of Dose
and Duration
I(Control Group)
Distilled water1.0 cm3 of distilled water/animal,for 15 days
II(Positive Control)
Lithium Carbonate100 mg/ kg bodyweight/ animal,
in 1.0 cm3 of distilled water,
for 15 days
III(Positive Control)
Stem powder of
Tinospora cordifolia Miers.
IVLeaf powder ofPutranjiva roxburghii Wall.
n- Number of animals
Note- Drug treatment was given prior to single dose of cyclophosphamide administration (200
mg/kg bodyweight) subcutaneously.
37
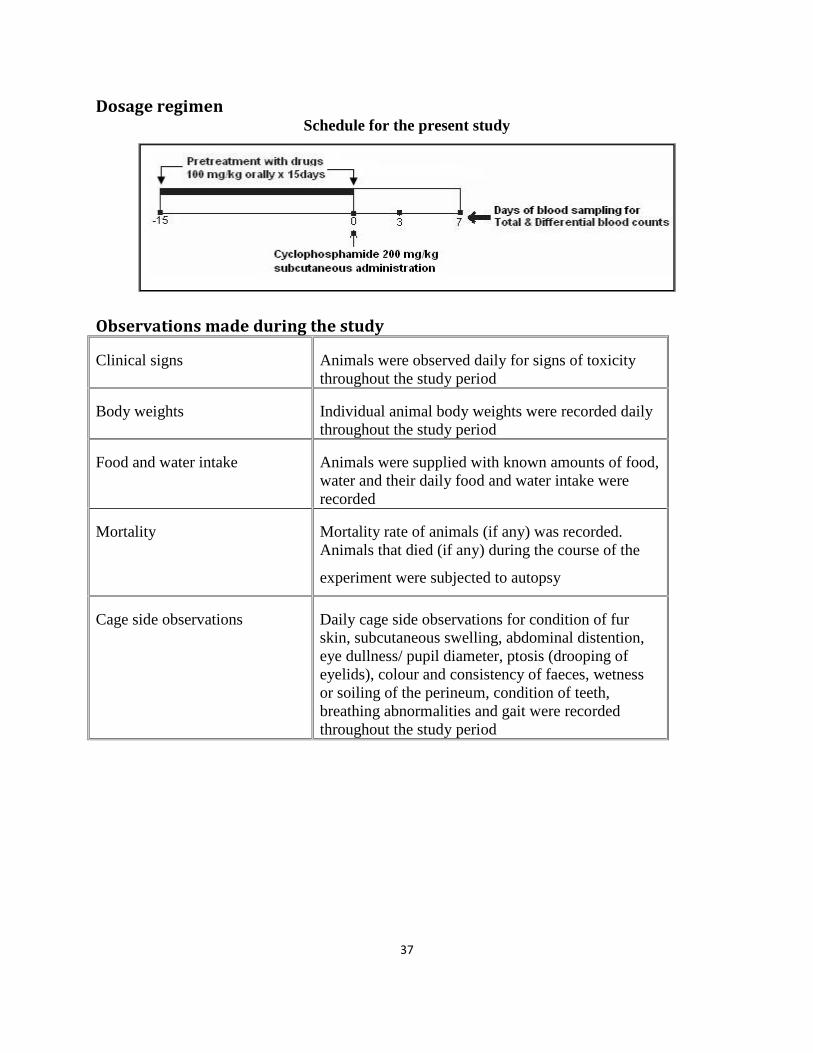
Dosage regimenSchedule for the present study
Observations made during the study
Clinical signs Animals were observed daily for signs of toxicitythroughout the study period
Body weights Individual animal body weights were recorded dailythroughout the study period
Food and water intake Animals were supplied with known amounts of food,water and their daily food and water intake wererecorded
Mortality Mortality rate of animals (if any) was recorded.Animals that died (if any) during the course of the
experiment were subjected to autopsy
Cage side observations Daily cage side observations for condition of furskin, subcutaneous swelling, abdominal distention,eye dullness/ pupil diameter, ptosis (drooping ofeyelids), colour and consistency of faeces, wetnessor soiling of the perineum, condition of teeth,breathing abnormalities and gait were recordedthroughout the study period

38
Results
The results of blood counts viz. total leukocyte counts and absolute neutrophil counts for six
animals belonging to respective groups are tabulated in Table. The total leukocyte counts and the
absolute neutrophil counts in the drug treated group were compared with the values of the
control group.
Results of leukocyte counts and absolute neutrophil counts for mice
belonging to Group I (Control Group)
Days forblood counts
-15th dayCounts (cells/mm3)
0 dayCounts (cells/mm3)
3rd dayCounts (cells/mm3)
7th dayCounts (cells/mm3)
Animal no. LeukocyteAbsoluteNeutrophil
LeukocyteAbsoluteNeutrophil
LeukocyteAbsoluteNeutrophil
LeukocyteAbsoluteNeutrophil
1 5200 2496 5500 2970 3200 1344 19800 122762 6500 3315 6200 2852 2900 1160 12900 76113 5900 3127 5800 3306 3300 1518 10100 76764 4950 3317 6500 3900 3100 1612 19900 113435 5200 3120 6020 3371 2700 1242 18200 94646 7050 3243 6300 2646 2600 1014 12500 7875Mean 5800.0 3102.9 6053.3 3174.2 2966.7 1310.3 15566.7 9573.5S.D. 837.26 309.66 361.48 448.88 280.48 223.70 4243.43 2027.07
The animals belonging to Control Group (Group I) administered with distilled water for first
fifteen days showed similar blood counts on both days of blood count measurements, -15th Day
and on 0 Day prior to cyclophosphamide administration. However the values of blood counts
post cyclophosphamide administration on 3rd Day dropped to almost half the initial values due to
immunosuppressive effects of cyclophosphamide. Thereafter a rebound increase occurred in
blood counts on Day 7.

39
Results of leukocyte counts and absolute neutrophil counts for micebelonging to Group II (Treated with Lithium carbonate)
Days forblood counts
-15th dayCounts (cells/mm3)
0 dayCounts (cells/mm3)
3rd dayCounts (cells/mm3)
7th dayCounts (cells/mm3)
Animal no. LeukocyteAbsoluteNeutrophil
LeukocyteAbsoluteNeutrophil
LeukocyteAbsoluteNeutrophil
LeukocyteAbsoluteNeutrophil
1 7900 3318 9500 4750 6300 2709 14800 84362 6300 3024 10200 5202 7900 3634 18900 111513 5500 2585 8700 3654 6500 2600 15000 96004 5700 3420 9100 4368 6100 2806 16400 100045 7000 3710 9800 5586 5900 2773 12050 81946 6500 2795 8600 3698 5700 2850 13500 8505Mean 6483.3 3166.0 9316.7 4518.6 6400.0 2901.3 15108.3 9367.2S.D. 881.85 418.44 630.61 787.39 787.40 372.18 2370.32 1149.98
Results of leukocyte counts and absolute neutrophil counts for micebelonging to Group III (Treated with Tinospora cordifolia Miers.)
Days forblood counts
-15th dayCounts (cells/mm3)
0 dayCounts (cells/mm3)
3rd dayCounts (cells/mm3)
7th dayCounts (cells/mm3)
Animal no. LeukocyteAbsoluteNeutrophil
LeukocyteAbsoluteNeutrophil
LeukocyteAbsoluteNeutrophil
LeukocyteAbsoluteNeutrophil
1 4600 2392 9700 5238 6200 2976 13300 82462 6500 3120 9200 5888 5900 3186 16200 106923 7100 2911 8400 4200 6400 3328 15000 87004 6700 3015 9300 5394 7700 4928 17400 118325 5500 2640 8420 4294 7500 4200 18500 111006 6400 3328 10200 6426 7200 3600 16000 9120Mean 6133.3 2923.6 9203.3 5215.2 6816.7 3681.0 16066.7 9934.6S.D. 917.97 337.81 708.28 874.80 746.77 734.12 1817.32 1453.96

40
Results of leukocyte counts and absolute neutrophil counts for micebelonging to Group IV (Treated with Putranjiva roxburghii Wall.)
Days forblood counts
-15th dayCounts (cells/mm3)
0 dayCounts (cells/mm3)
3rd dayCounts (cells/mm3)
7th dayCounts (cells/mm3)
Animal no. LeukocyteAbsoluteNeutrophil
LeukocyteAbsoluteNeutrophil
LeukocyteAbsoluteNeutrophil
LeukocyteAbsoluteNeutrophil
1 4500 1665 10100 5564 5124 2306 18500 96202 5300 2067 9400 4982 5831 2332 17100 94053 6500 2665 10500 5670 6124 2633 14800 88804 7200 2880 10200 5490 5675 2384 16600 107905 4600 2024 9600 6726 5894 2240 15500 99206 4500 1890 10300 5940 5546 2163 16200 9720Mean 5433.3 2198.5 10016.7 5728.6 5699.0 2342.9 16450.0 9722.5
S.D. 1158.73 471.08 426.22 580.40 343.71 161.56 1291.12 632.40
The animals of Group II to IV were treated with the respective drugs at concentration 100 mg/kg
bodyweight, lithium carbonate powder, stem powder of Tinospora cordifolia Miers., leaf powder
of Putranjiva roxburghii Wall., for fifteen days prior to the administration of cyclophosphamide.
After fifteen days of drug treatment to the animals belonging to Group II to Group IV, on “Day
0” it was observed that there was a rise in the total leukocyte count and the absolute neutrophil
count, as compared to the blood counts measured on -15th Day. Thus all four drug treated groups
showed a significant leukocytosis (increase in total leukocyte count) with predominant
neutrophilia (increase in absolute neutrophil count). The drug treated mice, belonging to Group
II to Group IV thus showed an increased number of cell counts revealing the immune stimulated
condition.
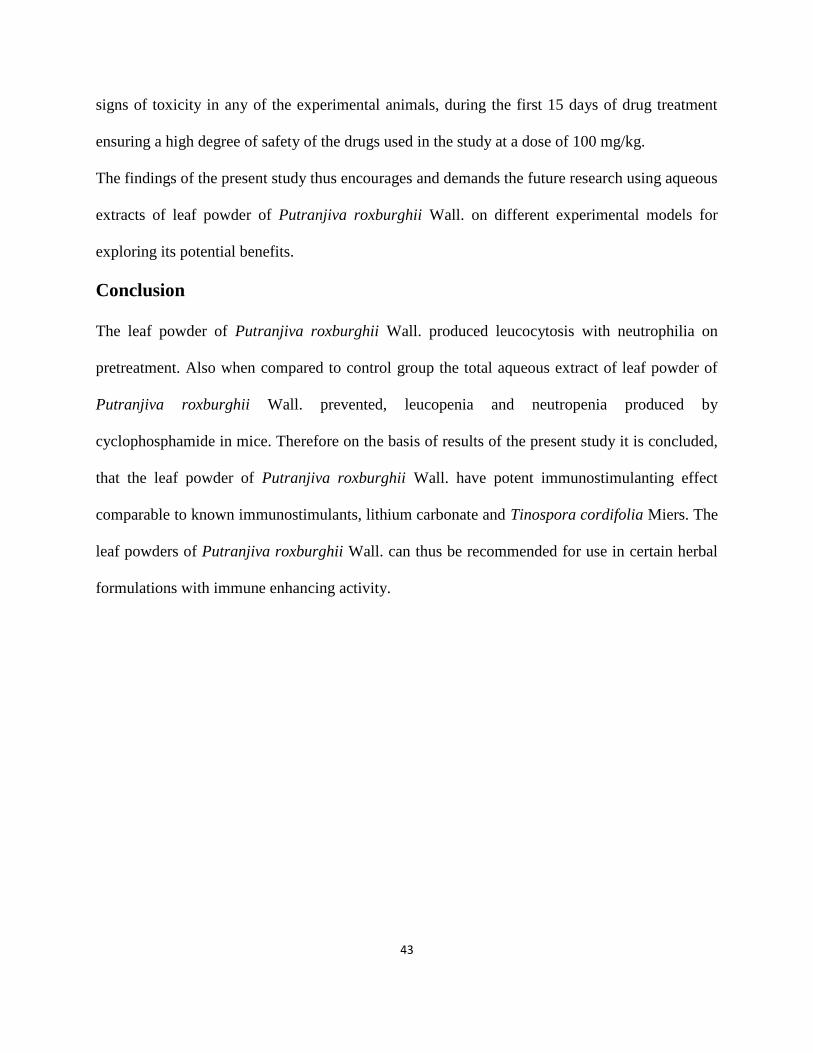
The administration of single subcutaneous dose of cyclophosphamide, at concentration of 200
mg/kg bodyweight of animals to the drug treated groups produced a fall in total

41
leukocyte count and absolute neutrophil count on “3rd Day” of blood count measurement as
shown in Figure.
However, it was observed that the total leukocyte counts and the absolute neutrophil counts of
the drug treated animals belonging to Group II to Group IV were not as low as that of Control
animals (Group I). This effect occurred due to the counteractivity of the respective drugs
administered for the first fifteen days to mice belonging to Group II to Group IV, against the
immunosuppressive action of cyclophosphamide.
Thereafter an increase in the total leukocyte count and absolute neutrophil count was observed
on Day 7, in all the animals of drug treated groups, similar to that of the control group. This
increase in blood counts is attributed to the irreversible toxic effects produced by
cyclophosphamide.
Mean graph of Total leukocyte counts against the day of blood count measurement
0
3000
6000
9000
12000
15000
18000
-15
Tota
l Leu
kocy
te C
ount
s
41
leukocyte count and absolute neutrophil count on “3rd Day” of blood count measurement as
shown in Figure.
However, it was observed that the total leukocyte counts and the absolute neutrophil counts of
the drug treated animals belonging to Group II to Group IV were not as low as that of Control
animals (Group I). This effect occurred due to the counteractivity of the respective drugs
administered for the first fifteen days to mice belonging to Group II to Group IV, against the
immunosuppressive action of cyclophosphamide.
Thereafter an increase in the total leukocyte count and absolute neutrophil count was observed
on Day 7, in all the animals of drug treated groups, similar to that of the control group. This
increase in blood counts is attributed to the irreversible toxic effects produced by
cyclophosphamide.
Mean graph of Total leukocyte counts against the day of blood count measurement
0 3 7
Control Group
LithiumcarbonateTinospora
Putranjivaroxburghii
41
leukocyte count and absolute neutrophil count on “3rd Day” of blood count measurement as
shown in Figure.
However, it was observed that the total leukocyte counts and the absolute neutrophil counts of
the drug treated animals belonging to Group II to Group IV were not as low as that of Control
animals (Group I). This effect occurred due to the counteractivity of the respective drugs
administered for the first fifteen days to mice belonging to Group II to Group IV, against the
immunosuppressive action of cyclophosphamide.
Thereafter an increase in the total leukocyte count and absolute neutrophil count was observed
on Day 7, in all the animals of drug treated groups, similar to that of the control group. This
increase in blood counts is attributed to the irreversible toxic effects produced by
cyclophosphamide.
Mean graph of Total leukocyte counts against the day of blood count measurement
Control Group
LithiumcarbonateTinospora
Putranjivaroxburghii
42
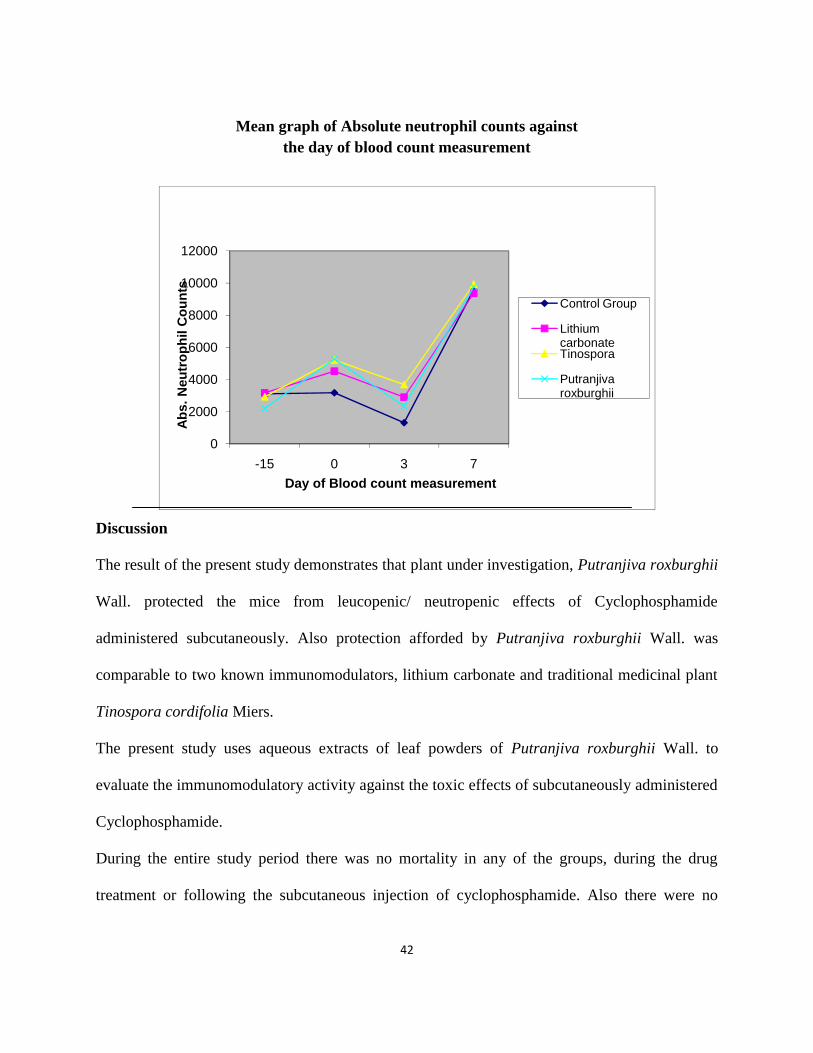
Mean graph of Absolute neutrophil counts againstthe day of blood count measurement
Discussion
The result of the present study demonstrates that plant under investigation, Putranjiva roxburghii
Wall. protected the mice from leucopenic/ neutropenic effects of Cyclophosphamide
administered subcutaneously. Also protection afforded by Putranjiva roxburghii Wall. was
comparable to two known immunomodulators, lithium carbonate and traditional medicinal plant
Tinospora cordifolia Miers.
The present study uses aqueous extracts of leaf powders of Putranjiva roxburghii Wall. to
evaluate the immunomodulatory activity against the toxic effects of subcutaneously administered
Cyclophosphamide.
During the entire study period there was no mortality in any of the groups, during the drug
treatment or following the subcutaneous injection of cyclophosphamide. Also there were no
0
2000
4000
6000
8000
10000
12000
-15 0 3 7
Abs.
Neu
trop
hil C
ount
s
Day of Blood count measurement
Control Group
LithiumcarbonateTinospora
Putranjivaroxburghii
43
signs of toxicity in any of the experimental animals, during the first 15 days of drug treatment
ensuring a high degree of safety of the drugs used in the study at a dose of 100 mg/kg.
The findings of the present study thus encourages and demands the future research using aqueous
extracts of leaf powder of Putranjiva roxburghii Wall. on different experimental models for
exploring its potential benefits.
Conclusion
The leaf powder of Putranjiva roxburghii Wall. produced leucocytosis with neutrophilia on
pretreatment. Also when compared to control group the total aqueous extract of leaf powder of
Putranjiva roxburghii Wall. prevented, leucopenia and neutropenia produced by
cyclophosphamide in mice. Therefore on the basis of results of the present study it is concluded,
that the leaf powder of Putranjiva roxburghii Wall. have potent immunostimulanting effect
comparable to known immunostimulants, lithium carbonate and Tinospora cordifolia Miers. The
leaf powders of Putranjiva roxburghii Wall. can thus be recommended for use in certain herbal
formulations with immune enhancing activity.

44
References
1. Dobriyal R.M. and Narayana D.B. Ayurvedic herbal raw material, The Eastern Pharmacist,
Delhi, India, 1998.
2. Ibanez E, Kubatova A, Senorans F.J., Cavero S., Reglero G., Hawthorne S.B., Journal of
Agricultural Food Chemistry, 51, 375-382, 2003.
3. Bartram T. Encyclopedia of Herbal Medicine, Robinson, Grace: Dorset, 1995.
4. Swartz M. E., Krull I. S., Analytical Method Development and Validation,
Dekker Inc., Marcel, 1997.
5. Snyder L. R., Kirkland J. J., Glajch J. L., Practical HPLC Method Development,
2nd Ed., John Wiley and Sons, New York, 1997.
6. Skoog D.A,Holler F.J., Crouch S.R., Principles of Instrument Analysis, Thomson
Brooks/Cole 6th Ed. 196-197, 2007.
7. J. Goldstein, D. Newbury, D. Joy, C. Lyman, P. Echlin, E. Lifshin, L. Sawyer, and
J. Michael, Scanning Electron Microscopy and X-ray Microanalysis, 3rd Ed.
Plenum Publishers, New York, 2002.
8. Dahanukar SA, Thatte UM, Rege NN. Immunostimulants in Ayurveda medicine.
Immunomodulatory Agents from plants., Birkhauser Verlag Basel, Switzerland,
1999.