srdjan nikezic 1 leadership network blake, dobrica...
TRANSCRIPT
International Journal for Quality Research 7(3) 3–14
ISSN 1800-6450
393
Srdjan Nikezic 1
Dobrica Stojkovic
Boban Djurovic
Aleksandar Djordjevic
Article info:
Received 7 March 2013
Accepted 20 July 2013
UDC – 638.124.8
LEADERSHIP NETWORK BLAKE,
MOUTON AND MCCANSE:
CASE STUDY - LEADERSHIP STYLES
AND DIMENSIONS IN ONE OF THE
LOCAL SELF-GOVERNMENTS IN SERBIA
Abstract: Leadership style represents the way in which a
leader succeedes to direct and coordinate the behavior and
actions of employees in order to achieve their goals.
Leadership is a process of motivating of employees to work on
achieving of goals promoted by the leader. It is a way of
establishing the appropriate relationship between the leader
and his associates and other employees.
Using the model of Leadership Network Blake, Mouton and
McCanse aspect of the application one of the five leadership
styles is accompanied by two dimensions of local government.
In two dimensions the respondents were orientating towards
one of two choices: employee care and concern for the task. In
this paper, on the basis of concrete research, based on the
established hypotheses leadership style was determined that
maches to the actual situation in local government. The
investigation was taken in municipality located in central
Serbia, which represents dominant sample for the research in
this territorial socio-economic community.
Keywords: leadership, leadership styles, leadership network,
the two dimensions of leadership, local government.
1. Introduction1
Researches of leadership behavior ware not
complete in studies at the universities of
Michigan and Ohio. Blake and Moutoun
from the University of Texas developed a
managerial grid and published their work in
1964 year. They have modified this network
more than once, in 1978, 1985 and in 1991
year is was replaced with the Leadership
Network of Blake and Aune Adams
McCanse, because one of the creators of the
1 Corresponding author: Srdjan Nikezic
email: [email protected]
network Mouton died in 1987 years (Blake
and Mouton, 1964; Blake and Mouton, 1978;
Blake and Mouton, 1985; Blake and
McCanse, 1991).
Blake and Mouton have published more than
forty articles and books that describe their
theory (Blake and Mouton, 2002).
Leadership behavior is still investigating.
Leadership Network is applied to project
management in a variety of research.
Leadership Network is based on Ohio State
and Michigan studies, on the two dimensions
of leadership that Blake and Mouton called
“concern for production” and “concern for
people”. Also, in the literature are mentioned
expressions like “care for production” and
394
“care for people” (Mulins, 1996). Concern
for people and production is measured by
questionnaire on a scale of 1 – 9.
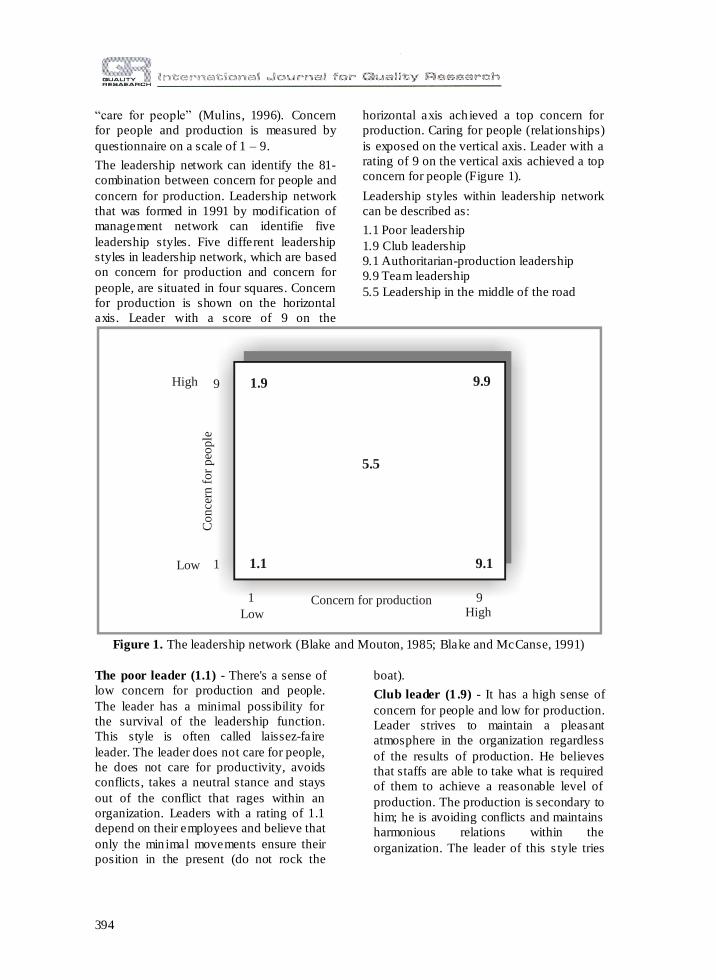
The leadership network can identify the 81-
combination between concern for people and
concern for production. Leadership network
that was formed in 1991 by modification of
management network can identifie five
leadership styles. Five different leadership
styles in leadership network, which are based
on concern for production and concern for
people, are situated in four squares. Concern
for production is shown on the horizontal
axis. Leader with a score of 9 on the
horizontal axis ach ieved a top concern for
production. Caring for people (relat ionships)
is exposed on the vertical axis. Leader with a
rating of 9 on the vertical axis achieved a top
concern for people (Figure 1).
Leadership styles within leadership network
can be described as:
1.1 Poor leadership
1.9 Club leadership
9.1 Authoritarian-production leadership
9.9 Team leadership
5.5 Leadership in the middle of the road
1Low
High
Co
nce
rn f
or
peo
ple
5.5
Concern for productionLow High
1.9
1.1
9.9
9.1
9
91
Figure 1. The leadership network (Blake and Mouton, 1985; Blake and McCanse, 1991)
The poor leader (1.1) - There's a sense of
low concern for production and people.
The leader has a minimal possibility for
the survival of the leadership function.
This style is often called laissez-faire
leader. The leader does not care for people,
he does not care for productivity, avoids
conflicts, takes a neutral stance and stays
out of the conflict that rages within an
organization. Leaders with a rating of 1.1
depend on their employees and believe that
only the min imal movements ensure their
position in the present (do not rock the
boat).
Club leader (1 .9) - It has a high sense of
concern for people and low for production.
Leader strives to maintain a pleasant
atmosphere in the organization regardless
of the results of production. He believes
that staffs are able to take what is required
of them to achieve a reasonable level of
production. The production is secondary to
him; he is avoiding conflicts and maintains
harmonious relations within the
organization. The leader of this s tyle tries
395
to find a compromise between employees
so that solutions are acceptable to all. He is
encouraging innovations, but also tends to
reject a good idea, if it can cause problems
among employees.
Autocratic (production) Leader (9.1) - is
highly concerned for the production, and
has a low sense of concern for people. He
focuses on the task assignment, and sees
people as a mean for carrying out the
tasks. This style is known as “authority-
respect” leaders. They want tight control in
order to do assignments efficiently. They
find that they are creative, and that
fostering of interpersonal relationships is
unnecessary. They rely on a centralized
system and usage of the power of the
position. . Employees are treated as a
means of production, and the motivation is
based on an unhealthy competition
between employees for carry ing out
business tasks seted by the leaders. If an
employee denies instructions and
standards, leader marks them as useless
and takes appropriate measures of
punishment (Mulins, 1996; Lussier, 2010).
Team leader (9.9 ) - has a high sensitivity
for people in the organizat ion and for the
accomplishment of organizational
objectives. This style of leadership is by
Blake, Mouton and McCanse generally
most suitable for use in all situations. They
believe that only the integration of concern
for production and people can give
positive results and achieve their
leadership vision. As we said, this style of
leadership is considered ideal. Leaders
take care of the production and employees
(employee relations). They motivate their
employees to achieve their highest
possible goals and achievements. Creating
a situation in which employees can meet
their needs and at the same time achieve
commitment to the objectives of the
organization. Leaders communicate with
employees, share ideas and give them their
freedom of action. Problems are solved in
a direct confrontation of different groups
and immediately provide acceptable rights
solutions, agreements and negotiations for
all (Khan, 2010).
Leader in the middle of the road (5.5) -
has a balanced stance towards production
and people. It strives to maintain a balance
between production and employee morale.
His approach is “live and let live”, and the
tendency is to avoid the real issues and to
give adequate response on thouse issues.
This style of leadership is called a “wet
pendulum”, with leaders who are swinging
between concern for production and
concern for people. Leaders balance their
concern for both people and production,
but not fully committed to either
production or people. Because this causes
resentment of employees, pressure is
reduced and leader adopts a compromise
approach. “Wet pendulum” can swing to
the side of club leader (1.9), so leader has
to tighten up pendulum and take a firmer
approach.
Blake-Mounton-McCanse Leadership
Grid, in addition to the five basic
leadership styles, has two dimensions,
namely:
a) Concern for p roduction is characteristic
of leaders who are oriented to
achieving high levels of production and
achieving good results and big profits.
b) Concern for people is characteristic of
leaders who in addition to high
demands in the production give a
meaning to the needs of subordinates,
their expectations and desires.
Way to connect these two “concerns”
shows leadership style and management. A
hierarchical approach is of crucial
importance. Will the leader accomplish
planned production through employees or
with employees is crucial issue. If the
planned production is realized through
employees in the production process it is
necessary to use the mechanisms of power
and coercion. The character and strength
of the leader, if he has one, gives him
better chanse to achieve better results
while providing the full satisfaction of
396
employees.
Paul Hersey, Kenneth Blanchard and
Dewey Johnson criticized various
approaches of leadership and management
that are not based on practice (Hersey et
al., 2001). They claim that Ohio State,
Michigan and Rensis Likert leadership
studies that focus on two theoretical
concepts - one focused on the task and the
other on the development of interpersonal
relationshipsn, are difficult to apply in
practice.
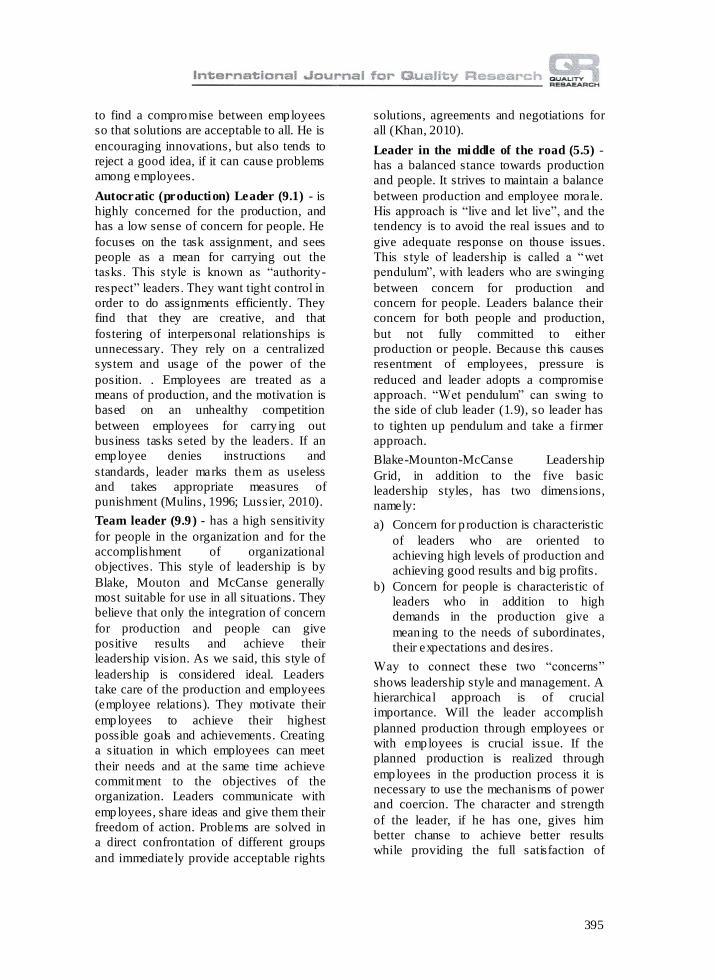
2. Researches and contributions Matrix of your leadership style (initial
instructions given to participants in the
research)
Draw your final results on the graph by
using a vertical line that shows the
relationship with the people, employees,
and the horizontal line that shows the
relation to the task. On the vertical axis
enter your score that relates to people, and
on horizontal line enter your score related
to the task. Then draw two lines until they
intersect. In the intersection of the lines are
the dimensions of your leadership and
leadership style that you use in your work.
2. RESEARCHES AND
CONTRIBUTIONS
Matrix of your leadership style (initial
instructions given to participants in the
research)
Draw your final results on the graph by
using a vertical line that shows the
relationship with the people, employees,
and the horizontal line that shows the
relation to the task. On the vertical axis
enter your score that relates to people, and
on horizontal line enter your score related
to the task. Then draw two lines until they
intersect. In the intersection of the lines are
the dimensions of your leadership and
leadership style that you use in your work.
5.5
Socialleadership
Teamleadership
Poor
leadershipAuthoritarian
leadership
1
2
3
4
5
6
7
8
9
1 3 4 5 6 7 8 9
9.9
1.1 9.1
1.9
Concern for the productionLow
High
High
Low
Co
ncer
n f
or
the
peo
ple
Figure 2. Leadership Network (research samples)
397
Example
5.5
Socialleadership
Teamleadership
Poor
leadershipAuthoritarian
leadership
1
2
3
4
5
6
7
8
9
1 3 4 5 6 7 8 9
9.9
1.1 9.1
1.9
Concern for the production organization( )Low
High
High
Low
Co
ncer
n f
or
the
peo
ple
Intersection point
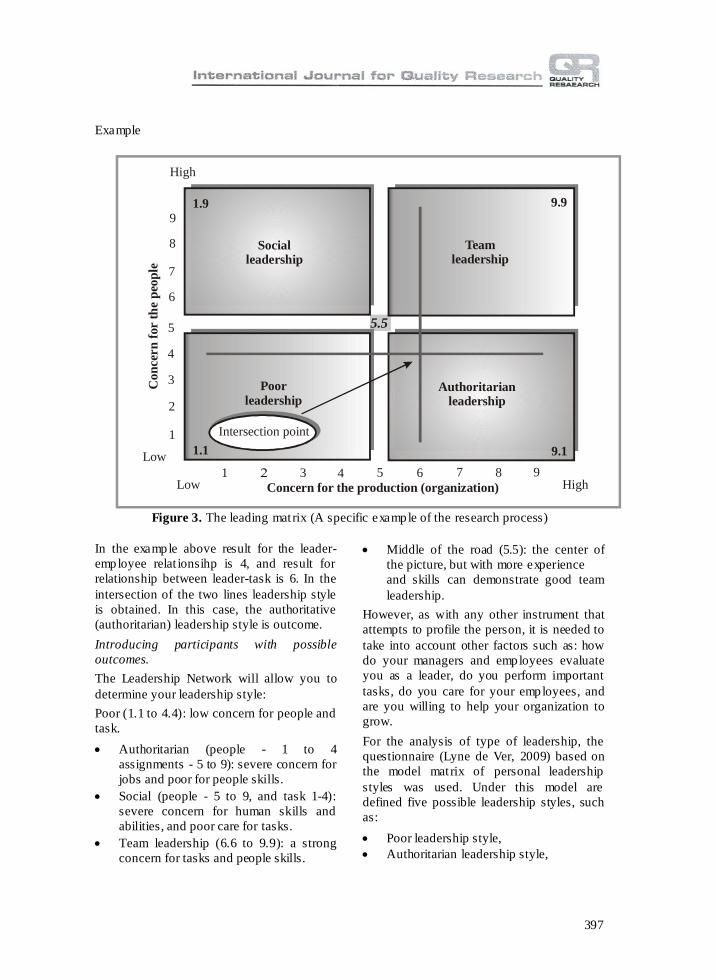
Figure 3. The leading matrix (A specific example of the research process)
In the example above result for the leader-
employee relat ionsihp is 4, and result for
relationship between leader-task is 6. In the
intersection of the two lines leadership style
is obtained. In this case, the authoritative
(authoritarian) leadership style is outcome.
Introducing participants with possible
outcomes.
The Leadership Network will allow you to
determine your leadership style:
Poor (1.1 to 4.4): low concern for people and
task.
Authoritarian (people - 1 to 4
assignments - 5 to 9): severe concern for
jobs and poor for people skills.
Social (people - 5 to 9, and task 1-4):
severe concern for human skills and
abilities, and poor care for tasks.
Team leadership (6.6 to 9.9): a strong
concern for tasks and people skills.
Middle of the road (5.5): the center of
the picture, but with more experience
and skills can demonstrate good team
leadership.
However, as with any other instrument that
attempts to profile the person, it is needed to
take into account other factors such as: how
do your managers and employees evaluate
you as a leader, do you perform important
tasks, do you care for your employees, and
are you willing to help your organization to
grow.
For the analysis of type of leadership, the
questionnaire (Lyne de Ver, 2009) based on
the model matrix of personal leadership
styles was used. Under this model are
defined five possible leadership styles, such
as:
Poor leadership style,
Authoritarian leadership style,
398
Social leadership style,
Team leadership style, and
Style in "the middle of the road."
The questionnaire was used to determine the
type of leader on a sample of 50 participants
of leadership course. The questionnaire
contained a list with statements about
leadership behavior, with 18 questions that
the participants should honestly answer
within 5 possible outcomes and a note:
never, sometimes, and always. When filling
the questionnaire was fin ished, participants
have chosen, in their statements, positive
affirmat ion toward relations with employees
or focus on the task. Each of the sums was
multip lied with 0.2 and, finally, received the
vertical line on the chart that showed the
relationship with the employees and the
horizontal line that shows the commitment to
the task. At the intersection of these two
lines drawn there was a leadership style and
leadership dimensions of participant.
Before the test six hypotheses were seted,
whose credibility can be determined after the
analysis of the responses by the respondents.
The hypotheses are as follows:
H1: Employees (leaders) are focused on
team leadership.
H2: Employees (leaders) are directed
towards social leadership.
H3: Employees (leaders) are directed toward
authoritarian leadership.
H4: Employees (leaders) are targeted to poor
leadership.
H5: Employees (leaders) are focused on the
style of "the middle way".
H6: There is no dominant style of leadership
among employees (leaders).
Note: The authors of the survey equalized
participants (leader-employed), because the
study participants were in responsible
positions and at the same time they were at
the position of leaders in a particular field of
work, or co leader at the level of the local
government. Also, the lower limit of
maintaining the validity of the hypothesis
is if 50% of the participants belong to the
specific leadership style.
Of p roven (unproven) hypothesis objective
of the research was to determine the
dominant leadership dimensions: orientation
towards employees or orientation to the task
in a particu lar local government and the
dominant leadership style.
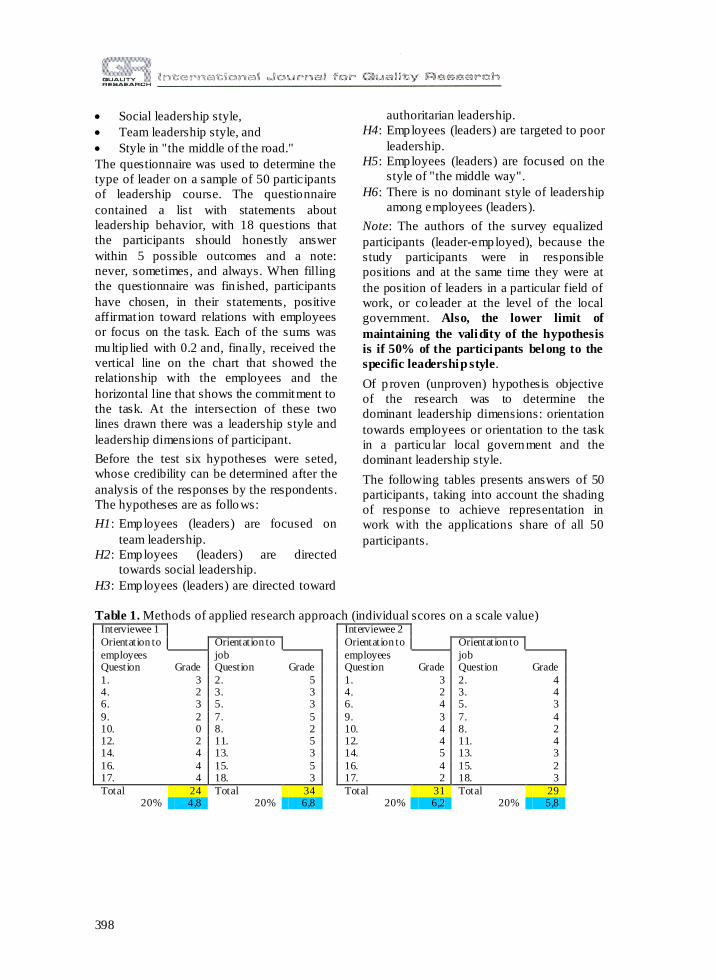
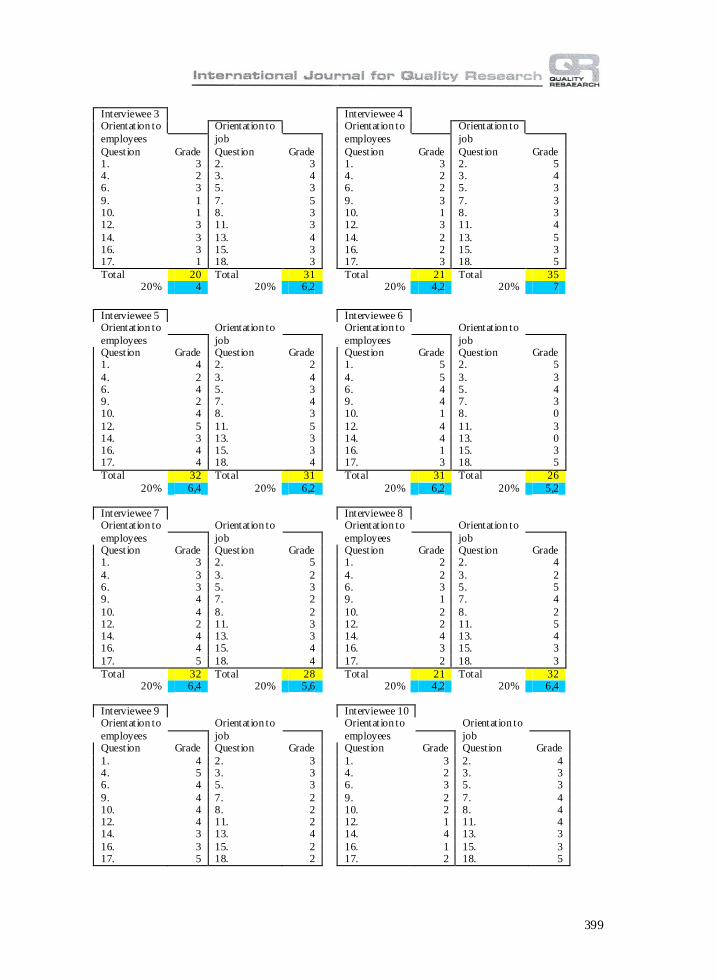
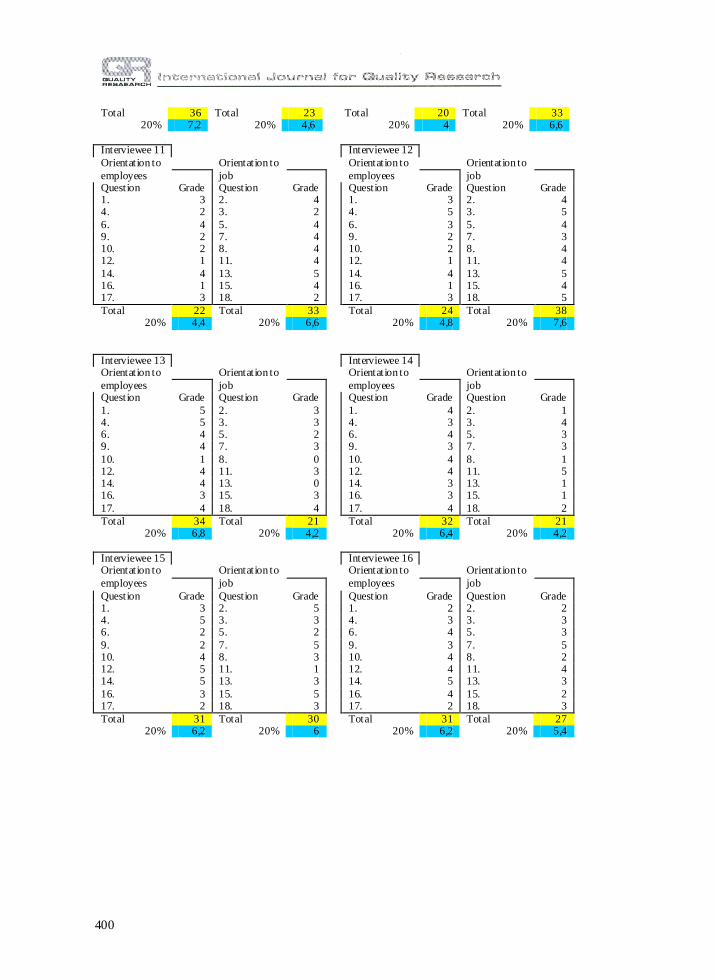
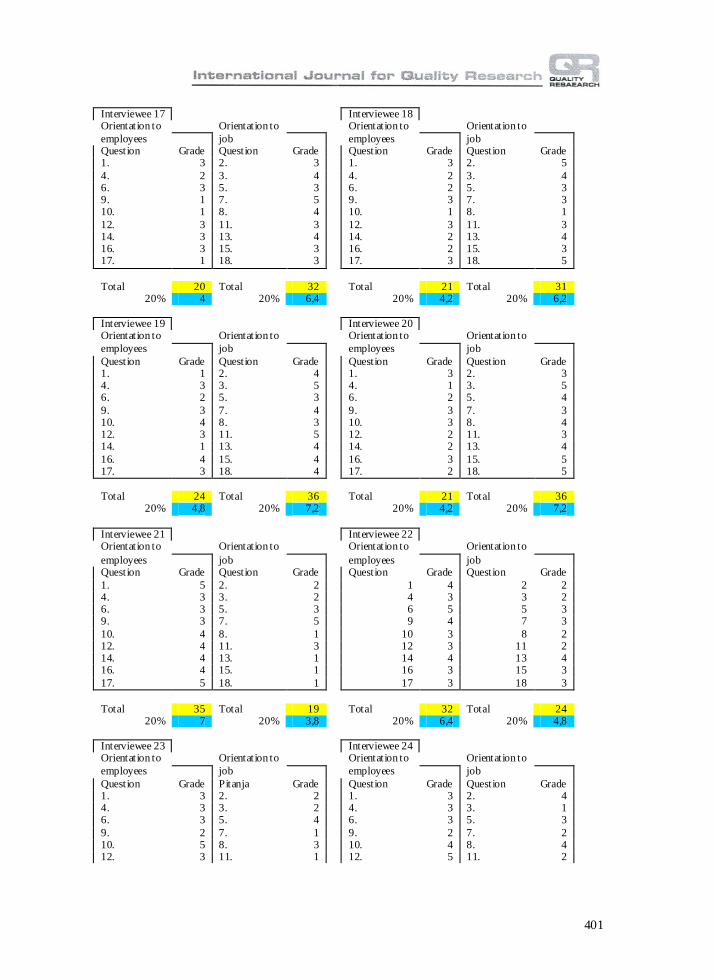
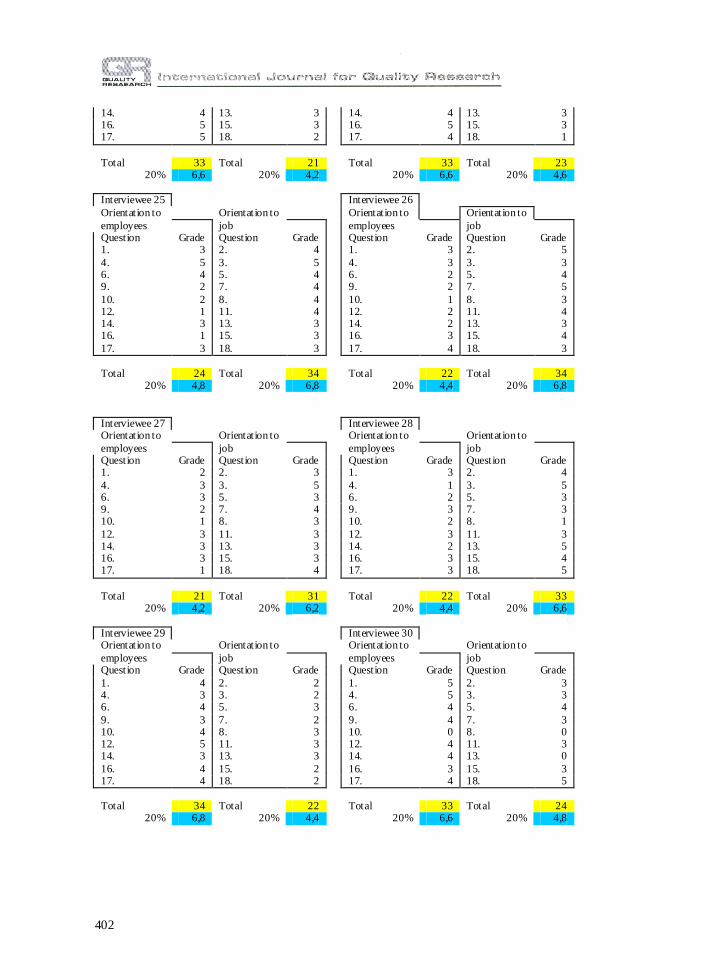
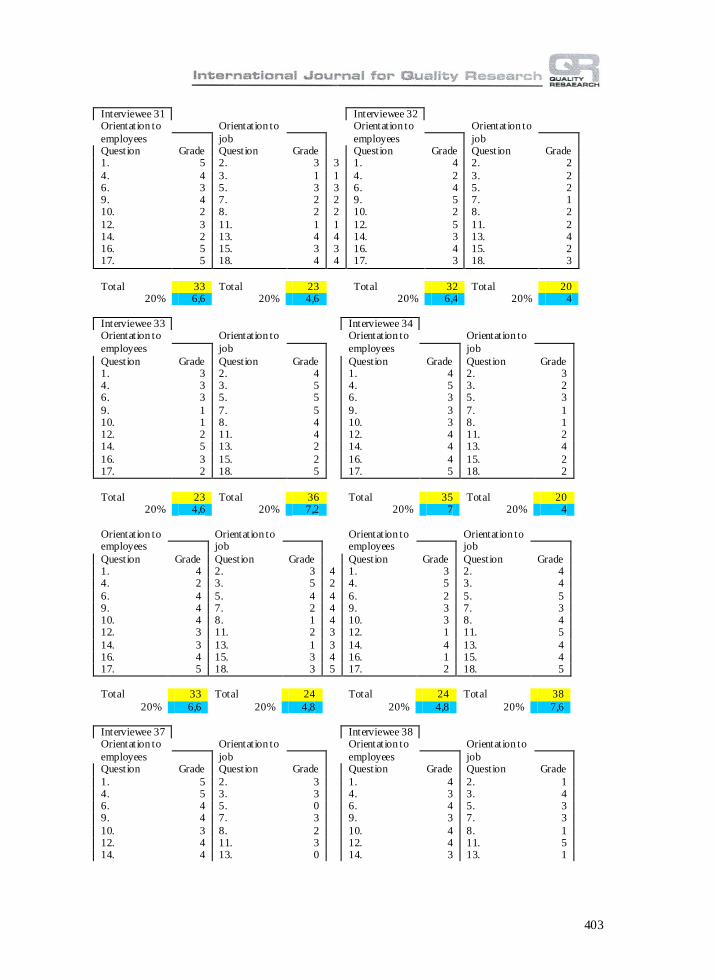
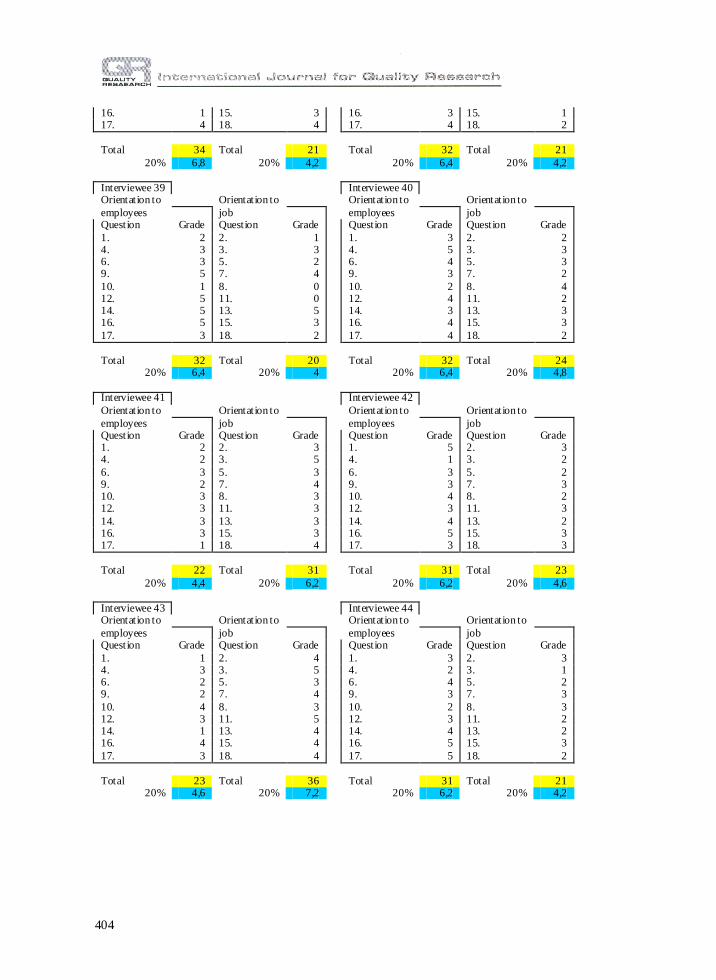
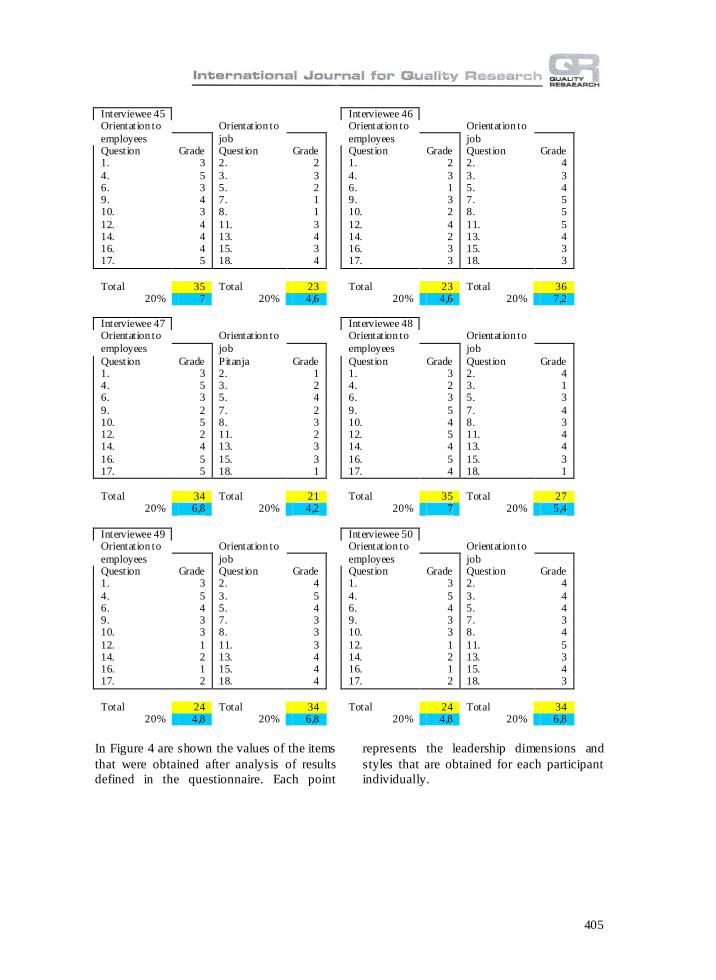
The following tables presents answers of 50
participants, taking into account the shading
of response to achieve representation in
work with the applications share of all 50
participants.
Table 1. Methods of applied research approach (individual scores on a scale value) Interviewee 1 Interviewee 2
Orientation to Orientation to Orientation to Orientation to
employees job employees job Question Grade Question Grade Question Grade Question Grade
1. 3 2. 5 1. 3 2. 4 4. 2 3. 3 4. 2 3. 4 6. 3 5. 3 6. 4 5. 3
9. 2 7. 5 9. 3 7. 4 10. 0 8. 2 10. 4 8. 2 12. 2 11. 5 12. 4 11. 4 14. 4 13. 3 14. 5 13. 3
16. 4 15. 5 16. 4 15. 2 17. 4 18. 3 17. 2 18. 3
Total 24 Total 34 Total 31 Total 29 20% 4,8 20% 6,8 20% 6,2 20% 5,8
399
Interviewee 3 Interviewee 4 Orientation to Orientation to Orientation to Orientation to
employees job employees job
Question Grade Question Grade Question Grade Question Grade 1. 3 2. 3 1. 3 2. 5 4. 2 3. 4 4. 2 3. 4 6. 3 5. 3 6. 2 5. 3
9. 1 7. 5 9. 3 7. 3 10. 1 8. 3 10. 1 8. 3 12. 3 11. 3 12. 3 11. 4
14. 3 13. 4 14. 2 13. 5 16. 3 15. 3 16. 2 15. 3 17. 1 18. 3 17. 3 18. 5
Total 20 Total 31 Total 21 Total 35 20% 4 20% 6,2 20% 4,2 20% 7
Interviewee 5 Interviewee 6 Orientation to Orientation to Orientation to Orientation to
employees job employees job Question Grade Question Grade Question Grade Question Grade 1. 4 2. 2 1. 5 2. 5
4. 2 3. 4 4. 5 3. 3 6. 4 5. 3 6. 4 5. 4 9. 2 7. 4 9. 4 7. 3 10. 4 8. 3 10. 1 8. 0
12. 5 11. 5 12. 4 11. 3 14. 3 13. 3 14. 4 13. 0 16. 4 15. 3 16. 1 15. 3 17. 4 18. 4 17. 3 18. 5
Total 32 Total 31 Total 31 Total 26
20% 6,4 20% 6,2 20% 6,2 20% 5,2
Interviewee 7 Interviewee 8 Orientation to Orientation to Orientation to Orientation to
employees job employees job Question Grade Question Grade Question Grade Question Grade 1. 3 2. 5 1. 2 2. 4
4. 3 3. 2 4. 2 3. 2 6. 3 5. 3 6. 3 5. 5 9. 4 7. 2 9. 1 7. 4
10. 4 8. 2 10. 2 8. 2 12. 2 11. 3 12. 2 11. 5 14. 4 13. 3 14. 4 13. 4 16. 4 15. 4 16. 3 15. 3
17. 5 18. 4 17. 2 18. 3
Total 32 Total 28 Total 21 Total 32 20% 6,4 20% 5,6 20% 4,2 20% 6,4
Interviewee 9 Interviewee 10 Orientation to Orientation to Orientation to Orientation to
employees job employees job Question Grade Question Grade Question Grade Question Grade
1. 4 2. 3 1. 3 2. 4 4. 5 3. 3 4. 2 3. 3 6. 4 5. 3 6. 3 5. 3
9. 4 7. 2 9. 2 7. 4 10. 4 8. 2 10. 2 8. 4 12. 4 11. 2 12. 1 11. 4 14. 3 13. 4 14. 4 13. 3
16. 3 15. 2 16. 1 15. 3 17. 5 18. 2 17. 2 18. 5
400
Total 36 Total 23 Total 20 Total 33 20% 7,2 20% 4,6 20% 4 20% 6,6
Interviewee 11 Interviewee 12
Orientation to Orientation to Orientation to Orientation to
employees job employees job Question Grade Question Grade Question Grade Question Grade 1. 3 2. 4 1. 3 2. 4 4. 2 3. 2 4. 5 3. 5
6. 4 5. 4 6. 3 5. 4 9. 2 7. 4 9. 2 7. 3 10. 2 8. 4 10. 2 8. 4 12. 1 11. 4 12. 1 11. 4
14. 4 13. 5 14. 4 13. 5 16. 1 15. 4 16. 1 15. 4 17. 3 18. 2 17. 3 18. 5
Total 22 Total 33 Total 24 Total 38 20% 4,4 20% 6,6 20% 4,8 20% 7,6
Interviewee 13 Interviewee 14 Orientation to Orientation to Orientation to Orientation to
employees job employees job Question Grade Question Grade Question Grade Question Grade
1. 5 2. 3 1. 4 2. 1 4. 5 3. 3 4. 3 3. 4 6. 4 5. 2 6. 4 5. 3 9. 4 7. 3 9. 3 7. 3
10. 1 8. 0 10. 4 8. 1 12. 4 11. 3 12. 4 11. 5 14. 4 13. 0 14. 3 13. 1 16. 3 15. 3 16. 3 15. 1
17. 4 18. 4 17. 4 18. 2
Total 34 Total 21 Total 32 Total 21 20% 6,8 20% 4,2 20% 6,4 20% 4,2
Interviewee 15 Interviewee 16 Orientation to Orientation to Orientation to Orientation to
employees job employees job
Question Grade Question Grade Question Grade Question Grade 1. 3 2. 5 1. 2 2. 2 4. 5 3. 3 4. 3 3. 3 6. 2 5. 2 6. 4 5. 3
9. 2 7. 5 9. 3 7. 5 10. 4 8. 3 10. 4 8. 2 12. 5 11. 1 12. 4 11. 4 14. 5 13. 3 14. 5 13. 3
16. 3 15. 5 16. 4 15. 2 17. 2 18. 3 17. 2 18. 3
Total 31 Total 30 Total 31 Total 27 20% 6,2 20% 6 20% 6,2 20% 5,4
401
Interviewee 17 Interviewee 18 Orientation to Orientation to Orientation to Orientation to
employees job employees job Question Grade Question Grade Question Grade Question Grade 1. 3 2. 3 1. 3 2. 5
4. 2 3. 4 4. 2 3. 4 6. 3 5. 3 6. 2 5. 3 9. 1 7. 5 9. 3 7. 3 10. 1 8. 4 10. 1 8. 1
12. 3 11. 3 12. 3 11. 3 14. 3 13. 4 14. 2 13. 4 16. 3 15. 3 16. 2 15. 3 17. 1 18. 3 17. 3 18. 5
Total 20 Total 32 Total 21 Total 31 20% 4 20% 6,4 20% 4,2 20% 6,2
Interviewee 19 Interviewee 20 Orientation to Orientation to Orientation to Orientation to
employees job employees job
Question Grade Question Grade Question Grade Question Grade 1. 1 2. 4 1. 3 2. 3 4. 3 3. 5 4. 1 3. 5 6. 2 5. 3 6. 2 5. 4
9. 3 7. 4 9. 3 7. 3 10. 4 8. 3 10. 3 8. 4 12. 3 11. 5 12. 2 11. 3 14. 1 13. 4 14. 2 13. 4
16. 4 15. 4 16. 3 15. 5 17. 3 18. 4 17. 2 18. 5
Total 24 Total 36 Total 21 Total 36
20% 4,8 20% 7,2 20% 4,2 20% 7,2
Interviewee 21 Interviewee 22 Orientation to Orientation to Orientation to Orientation to
employees job employees job Question Grade Question Grade Question Grade Question Grade
1. 5 2. 2 1 4 2 2 4. 3 3. 2 4 3 3 2 6. 3 5. 3 6 5 5 3 9. 3 7. 5 9 4 7 3
10. 4 8. 1 10 3 8 2 12. 4 11. 3 12 3 11 2 14. 4 13. 1 14 4 13 4 16. 4 15. 1 16 3 15 3
17. 5 18. 1 17 3 18 3
Total 35 Total 19 Total 32 Total 24 20% 7 20% 3,8 20% 6,4 20% 4,8
Interviewee 23 Interviewee 24 Orientation to Orientation to Orientation to Orientation to
employees job employees job
Question Grade Pitanja Grade Question Grade Question Grade 1. 3 2. 2 1. 3 2. 4 4. 3 3. 2 4. 3 3. 1 6. 3 5. 4 6. 3 5. 3
9. 2 7. 1 9. 2 7. 2 10. 5 8. 3 10. 4 8. 4 12. 3 11. 1 12. 5 11. 2
402
14. 4 13. 3 14. 4 13. 3 16. 5 15. 3 16. 5 15. 3 17. 5 18. 2 17. 4 18. 1
Total 33 Total 21 Total 33 Total 23 20% 6,6 20% 4,2 20% 6,6 20% 4,6
Interviewee 25 Interviewee 26
Orientation to Orientation to Orientation to Orientation to
employees job employees job Question Grade Question Grade Question Grade Question Grade 1. 3 2. 4 1. 3 2. 5
4. 5 3. 5 4. 3 3. 3 6. 4 5. 4 6. 2 5. 4 9. 2 7. 4 9. 2 7. 5
10. 2 8. 4 10. 1 8. 3 12. 1 11. 4 12. 2 11. 4 14. 3 13. 3 14. 2 13. 3 16. 1 15. 3 16. 3 15. 4
17. 3 18. 3 17. 4 18. 3
Total 24 Total 34 Total 22 Total 34
20% 4,8 20% 6,8 20% 4,4 20% 6,8
Interviewee 27 Interviewee 28 Orientation to Orientation to Orientation to Orientation to
employees job employees job Question Grade Question Grade Question Grade Question Grade 1. 2 2. 3 1. 3 2. 4
4. 3 3. 5 4. 1 3. 5 6. 3 5. 3 6. 2 5. 3 9. 2 7. 4 9. 3 7. 3 10. 1 8. 3 10. 2 8. 1
12. 3 11. 3 12. 3 11. 3 14. 3 13. 3 14. 2 13. 5 16. 3 15. 3 16. 3 15. 4 17. 1 18. 4 17. 3 18. 5
Total 21 Total 31 Total 22 Total 33 20% 4,2 20% 6,2 20% 4,4 20% 6,6
Interviewee 29 Interviewee 30 Orientation to Orientation to Orientation to Orientation to
employees job employees job Question Grade Question Grade Question Grade Question Grade
1. 4 2. 2 1. 5 2. 3 4. 3 3. 2 4. 5 3. 3 6. 4 5. 3 6. 4 5. 4
9. 3 7. 2 9. 4 7. 3 10. 4 8. 3 10. 0 8. 0 12. 5 11. 3 12. 4 11. 3 14. 3 13. 3 14. 4 13. 0
16. 4 15. 2 16. 3 15. 3 17. 4 18. 2 17. 4 18. 5
Total 34 Total 22 Total 33 Total 24
20% 6,8 20% 4,4 20% 6,6 20% 4,8
403
Interviewee 31 Interviewee 32 Orientation to Orientation to Orientation to Orientation to
employees job employees job Question Grade Question Grade Question Grade Question Grade 1. 5 2. 3 3 1. 4 2. 2
4. 4 3. 1 1 4. 2 3. 2 6. 3 5. 3 3 6. 4 5. 2 9. 4 7. 2 2 9. 5 7. 1 10. 2 8. 2 2 10. 2 8. 2
12. 3 11. 1 1 12. 5 11. 2 14. 2 13. 4 4 14. 3 13. 4 16. 5 15. 3 3 16. 4 15. 2 17. 5 18. 4 4 17. 3 18. 3
Total 33 Total 23 Total 32 Total 20 20% 6,6 20% 4,6 20% 6,4 20% 4
Interviewee 33 Interviewee 34 Orientation to Orientation to Orientation to Orientation to
employees job employees job
Question Grade Question Grade Question Grade Question Grade 1. 3 2. 4 1. 4 2. 3 4. 3 3. 5 4. 5 3. 2 6. 3 5. 5 6. 3 5. 3
9. 1 7. 5 9. 3 7. 1 10. 1 8. 4 10. 3 8. 1 12. 2 11. 4 12. 4 11. 2 14. 5 13. 2 14. 4 13. 4
16. 3 15. 2 16. 4 15. 2 17. 2 18. 5 17. 5 18. 2
Total 23 Total 36 Total 35 Total 20
20% 4,6 20% 7,2 20% 7 20% 4
Orientation to Orientation to Orientation to Orientation to employees job employees job
Question Grade Question Grade Question Grade Question Grade 1. 4 2. 3 4 1. 3 2. 4 4. 2 3. 5 2 4. 5 3. 4
6. 4 5. 4 4 6. 2 5. 5 9. 4 7. 2 4 9. 3 7. 3 10. 4 8. 1 4 10. 3 8. 4 12. 3 11. 2 3 12. 1 11. 5
14. 3 13. 1 3 14. 4 13. 4 16. 4 15. 3 4 16. 1 15. 4 17. 5 18. 3 5 17. 2 18. 5
Total 33 Total 24 Total 24 Total 38
20% 6,6 20% 4,8 20% 4,8 20% 7,6
Interviewee 37 Interviewee 38 Orientation to Orientation to Orientation to Orientation to
employees job employees job Question Grade Question Grade Question Grade Question Grade
1. 5 2. 3 1. 4 2. 1 4. 5 3. 3 4. 3 3. 4 6. 4 5. 0 6. 4 5. 3 9. 4 7. 3 9. 3 7. 3
10. 3 8. 2 10. 4 8. 1 12. 4 11. 3 12. 4 11. 5 14. 4 13. 0 14. 3 13. 1
404
16. 1 15. 3 16. 3 15. 1 17. 4 18. 4 17. 4 18. 2
Total 34 Total 21 Total 32 Total 21
20% 6,8 20% 4,2 20% 6,4 20% 4,2
Interviewee 39 Interviewee 40 Orientation to Orientation to Orientation to Orientation to
employees job employees job Question Grade Question Grade Question Grade Question Grade
1. 2 2. 1 1. 3 2. 2 4. 3 3. 3 4. 5 3. 3 6. 3 5. 2 6. 4 5. 3 9. 5 7. 4 9. 3 7. 2
10. 1 8. 0 10. 2 8. 4 12. 5 11. 0 12. 4 11. 2 14. 5 13. 5 14. 3 13. 3 16. 5 15. 3 16. 4 15. 3
17. 3 18. 2 17. 4 18. 2
Total 32 Total 20 Total 32 Total 24
20% 6,4 20% 4 20% 6,4 20% 4,8
Interviewee 41 Interviewee 42
Orientation to Orientation to Orientation to Orientation to
employees job employees job Question Grade Question Grade Question Grade Question Grade 1. 2 2. 3 1. 5 2. 3 4. 2 3. 5 4. 1 3. 2
6. 3 5. 3 6. 3 5. 2 9. 2 7. 4 9. 3 7. 3 10. 3 8. 3 10. 4 8. 2 12. 3 11. 3 12. 3 11. 3
14. 3 13. 3 14. 4 13. 2 16. 3 15. 3 16. 5 15. 3 17. 1 18. 4 17. 3 18. 3
Total 22 Total 31 Total 31 Total 23
20% 4,4 20% 6,2 20% 6,2 20% 4,6
Interviewee 43 Interviewee 44 Orientation to Orientation to Orientation to Orientation to
employees job employees job Question Grade Question Grade Question Grade Question Grade
1. 1 2. 4 1. 3 2. 3 4. 3 3. 5 4. 2 3. 1 6. 2 5. 3 6. 4 5. 2 9. 2 7. 4 9. 3 7. 3
10. 4 8. 3 10. 2 8. 3 12. 3 11. 5 12. 3 11. 2 14. 1 13. 4 14. 4 13. 2 16. 4 15. 4 16. 5 15. 3
17. 3 18. 4 17. 5 18. 2
Total 23 Total 36 Total 31 Total 21
20% 4,6 20% 7,2 20% 6,2 20% 4,2
405
Interviewee 45 Interviewee 46 Orientation to Orientation to Orientation to Orientation to
employees job employees job Question Grade Question Grade Question Grade Question Grade 1. 3 2. 2 1. 2 2. 4
4. 5 3. 3 4. 3 3. 3 6. 3 5. 2 6. 1 5. 4 9. 4 7. 1 9. 3 7. 5 10. 3 8. 1 10. 2 8. 5
12. 4 11. 3 12. 4 11. 5 14. 4 13. 4 14. 2 13. 4 16. 4 15. 3 16. 3 15. 3 17. 5 18. 4 17. 3 18. 3
Total 35 Total 23 Total 23 Total 36 20% 7 20% 4,6 20% 4,6 20% 7,2
Interviewee 47 Interviewee 48 Orientation to Orientation to Orientation to Orientation to
employees job employees job
Question Grade Pitanja Grade Question Grade Question Grade 1. 3 2. 1 1. 3 2. 4 4. 5 3. 2 4. 2 3. 1 6. 3 5. 4 6. 3 5. 3
9. 2 7. 2 9. 5 7. 4 10. 5 8. 3 10. 4 8. 3 12. 2 11. 2 12. 5 11. 4 14. 4 13. 3 14. 4 13. 4
16. 5 15. 3 16. 5 15. 3 17. 5 18. 1 17. 4 18. 1
Total 34 Total 21 Total 35 Total 27
20% 6,8 20% 4,2 20% 7 20% 5,4
Interviewee 49 Interviewee 50 Orientation to Orientation to Orientation to Orientation to
employees job employees job Question Grade Question Grade Question Grade Question Grade 1. 3 2. 4 1. 3 2. 4
4. 5 3. 5 4. 5 3. 4 6. 4 5. 4 6. 4 5. 4 9. 3 7. 3 9. 3 7. 3 10. 3 8. 3 10. 3 8. 4
12. 1 11. 3 12. 1 11. 5 14. 2 13. 4 14. 2 13. 3 16. 1 15. 4 16. 1 15. 4 17. 2 18. 4 17. 2 18. 3
Total 24 Total 34 Total 24 Total 34 20% 4,8 20% 6,8 20% 4,8 20% 6,8
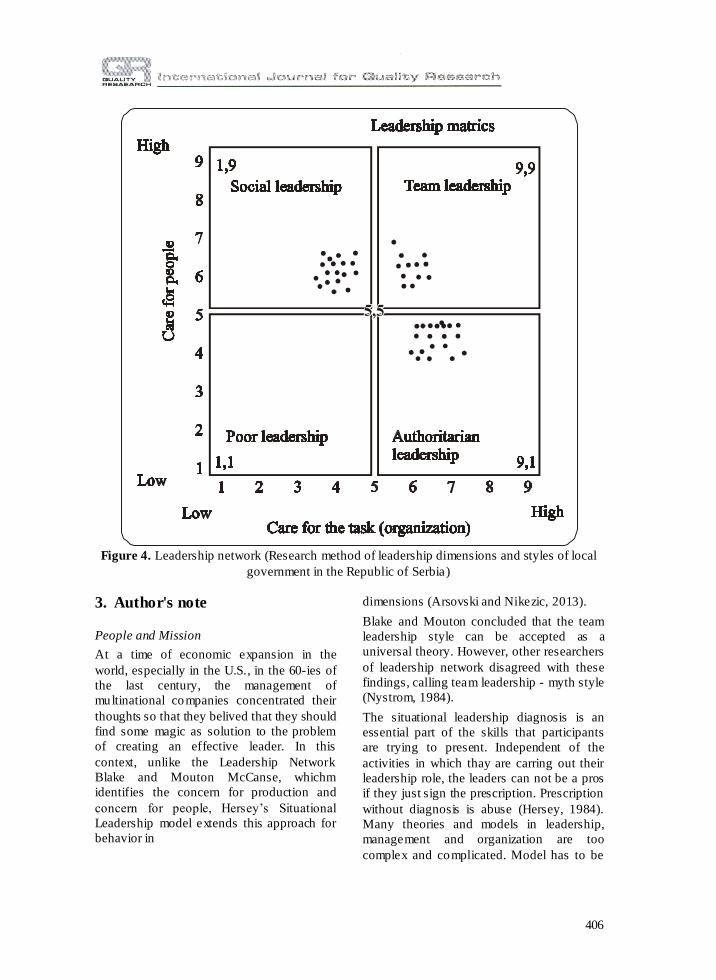
In Figure 4 are shown the values of the items
that were obtained after analysis of results
defined in the questionnaire. Each point
represents the leadership dimensions and
styles that are obtained for each participant
individually.
406
Figure 4. Leadership network (Research method of leadership dimensions and styles of local
government in the Republic of Serbia)
3. Author's note
People and Mission
At a time of economic expansion in the
world, especially in the U.S., in the 60-ies of
the last century, the management of
multinational companies concentrated their
thoughts so that they belived that they should
find some magic as solution to the problem
of creating an effective leader. In this
context, unlike the Leadership Network
Blake and Mouton McCanse, whichm
identifies the concern for production and
concern for people, Hersey’s Situational
Leadership model extends this approach for
behavior in
dimensions (Arsovski and Nikezic, 2013).
Blake and Mouton concluded that the team
leadership style can be accepted as a
universal theory. However, other researchers
of leadership network disagreed with these
findings, calling team leadership - myth style
(Nystrom, 1984).
The situational leadership diagnosis is an
essential part of the skills that participants
are trying to present. Independent of the
activities in which thay are carring out their
leadership role, the leaders can not be a pros
if they just sign the prescription. Prescription
without diagnosis is abuse (Hersey, 1984).
Many theories and models in leadership,
management and organization are too
complex and complicated. Model has to be
407
remembered and used. Is something worth if
it is not used for more effect ive work and
used for management of companies
(Schermerhorn, 2001). Social Ethics is the
leadership paradigm that connects concern
for people and task. Modern organizations
give more attention to social roles and
responsibilit ies that a leader has to its
employees and to the task to be achieved
(Nikezic and Matic, 2011).
Leadership model has to be applicable in
organizations and governments, except that
it is necessary that quality, as a basic
condition for the survival and realizat ion of
competitive advantage, gives a very
important significance, through connection
of quality of service in local government and
satisfaction of service users, because it
became imperative in the 21st century
(Nikezic and Jakupovic, 2011).
Backbone and Validity
Studies were conducted in order to achieve
further development and active learning.
Although there is support for a universal
theory, team leadership style of Blake and
Mouton is not accepted as one the best in all
situations, it is proposed the use of existing
styles of leadership behavior in different
situations, or use of one leadership style for
the specific situation (Nikezic et al., 2012).
Advantage of Leadership Network is
recognition of the need for local government
and people for the task (goal). Generic set of
target-oriented and human-oriented
leadership functions must be implemented in
order to ensure effective organizational
performance. The advantage is also that the
leaders of the local governments do not
necessarily have to favore realization of the
tasks or the satisfaction of people. Strong
goal-oriented leaders can be successful if
their coleaders provide people who are
oriented to their own function in the process
of work, and vice versa (reverse).
4. Conclusion
Based on the application of the proposed
model to determine dimensions and
leadership styles in one of the local
government of the Republic of Serbia, as a
representative sample of the central Serbia,
the following was determined (Figure 4):
H1: not confirmed, since it is less than 50%
of the participants used a team
leadership as well as his personal style
(25% of participants),
H2: not confirmed, because less than 50% of
participants use social leadership as
their personal leadership style,
dimensionally usemre to care for
employees (35% of part icipants),
H3: not confirmed, because less than 50% of
the participants used the authoritarian
leadership style as his own way of
leadership, dimensionally directed
toward achieving the tasks (40% of
participants),
H4: not confirmed, because no participant
of leadership course not used "poor
leadership" as a model of conduct in
local government;
H5: not confirmed, because no participant of
leadership course does not use the style
"middle way" in local government,
H6: not confirmed, because there is no
dominant leadership style,
dimensionally conceptualized by
concern for employees and concern for
duties that is of leadership course
participants are not committed (50% of
participants) for a single leadership style
as dominant.
Recommendations by research: The majority
of participants identified results of leadership
course should increase their social skills,
education, training, to teamwork (team
leadership) became dominant in local
government (employee care and achieve the
set of tasks).
408
References:
Arsovski, S., & Nikezić, S. (2013). Liderstvo: ključ za efektivno upravljanje promena .
Skupština opština Ražanj.
Blake, R., & McCanse, A. (1991). Leadership Dilemmas - Grid Solutions. Houston: Gulf
Publishing.
Blake, R., & Mouton, J. (1964). The Managerial Grid. Houston: Gulf Publishing.
Blake, R., & Mouton, J. (1978). The New Managerial Grid. Houston: Gulf Publishing.
Blake, R., & Mouton, J. (1985). The Managerial Grid III: The Key to Leadership Excellence .
Houston: Gulf Publishing.
Blake, R., & Mouton, J. (2002). The Managerial Grid, Thikers.
Hersey, P. (1984). The Situational Leader. Escondido, CA: Center for Leadership Studies .
Hersey, P., Blanchard, K., & Dewey, J. (2001). Management of Organizational Behavior,
Leading Human Resources. Prentic - Hall of India Private Limited.
Khan, A. (2010). The Dillema of Leadership Styles and Performance Apprasial: Cou nter
Strategies. Journal of Managerial Sciences, 5 , 12-13.
Lussier, R., & Achua, C. (2010). Leadership: Theory, Application, & Skill Development . Ohio:
South-Western Cengage Learning.
Lyne de Ver, H. (2009). Conceptions of Leadership. Developmental Leadership Program.
Mullins, L. (1996). Management and Orgazational Behavior. London: Pitman Publishin.
Nikezić S., Purić S., & Purić J. (2012). Transactional and Transformational Leadership:
Development through Change. International Journal for Quality Research, 6(3), 285-296.
Nikezić, S., & Jakupović, S. (2011). Leadership and Quality, as a business paradigm success
in the organization - assumptions joining the EU. I International Scientific Conference on
economic development and standard of living, “Economic Development and Standard of
Living”, Panevropski Univerzitet Apeiron, Banja Luka, BiH.
Nikezić, S., & Matić, M. (2011). Leadership, management ethical and social responsibility.
4th International Conference, “Science and Higher Education in Function of Sustainable
Development”, High Business-Technical School Uzice, Užice, Serbia.
Nystrom, P. (1978). Managers and the Hi-Hi Leader Myth. Academy of Management Journal,
21, 325-331.
Schermerhorn, J. (2001). Situational Leadership: Conversations with Paul Hersey . USA: Ohio
Universty.
409
Srdjan Nikezic University of Kragujevac
Faculty of Engineering,
Serbia
Dobrica Stojkovic President of the
municipality Ražanj
Serbia
Boban Djurovic President of the municipality
Vrnjačka Banja,
Serbia
Aleksandar Djordjevic University of Kragujevac Faculty of Engineering,
Serbia

410