spring business update - content.schwab.com...1q 2015 1q 2016 1q 2017 1q 2018 1q 2019 darts (k)...
TRANSCRIPT
SpringBusiness Update
April 26, 2019
Charles Schwab Corporation
Introduction
RichFowler
2
Senior Vice PresidentInvestor Relations
Charles Schwab Corporation
Walt Bettinger, President and Chief Executive Officer
Peter Crawford, EVP and Chief Financial Officer
Agenda
3
Charles Schwab Corporation
Forward-Looking Statements
4
This presentation contains “forward-looking statements” within the meaning of Section 27A of the Securities Act of 1933 and Section 21E of the
Securities Exchange Act of 1934. Forward-looking statements include statements that refer to expectations, projections or other characterizations of
future events or circumstances and are identified by words such as “believe,” “expect,” “will,” “may,” “should,” “could,” “continue,” “growth,”
“deliver,” “remain,” “drive,” “lead,” “record,” “investment,” “expand,” “build,” “sustain,” “enhance,” “improve,” “increase,” “outlook,” “likely,”
“moderate,” “estimate,” “anticipate,” “sensitivities,” and other similar expressions. These forward-looking statements relate to: growth in the client
base, client accounts and assets; investments to fuel and support growth, serve clients, and drive scale and efficiency; disruptive actions; growth in
revenues, earnings, and profits; stockholder value; innovative product offerings; capital returns; assumptions and sensitivities for 2019 key macro
drivers of revenue; expense growth; capital expenditures; target dividend payout ratio; and priorities for excess capital.
These forward-looking statements, which reflect management’s beliefs, objectives, and expectations as of today, are estimates based on the best
judgment of the company’s senior management. Achievement of the expressed beliefs, expectations, and objectives is subject to risks and
uncertainties that could cause actual results to differ materially from those beliefs, expectations, or objectives. Important factors that may cause
such differences are discussed in the company’s filings with the Securities and Exchange Commission, including our Annual Report on Form 10-K
and Quarterly Reports on Form 10-Q. Other important factors include general market conditions, including the level of interest rates, equity
valuations, and trading activity; the company’s ability to attract and retain clients and registered investment advisors and grow those relationships
and client assets; competitive pressures on pricing, including deposit rates; the company’s ability to develop and launch new products, services, and
capabilities, as well as enhance its infrastructure, in a timely and successful manner; client use of the company’s advisory solutions and other
products and services; the level of client assets, including cash balances; the company’s ability to monetize client assets; capital and liquidity needs
and management; the impact of changes in market conditions on revenues, expenses, and pre-tax profit margin; the company’s ability to manage
expenses; regulatory guidance; client sensitivity to rates; the timing and amount of spending on buildings, land, equipment and software; the effect
of adverse developments in litigation or regulatory matters and the extent of any charges associated with legal matters; and any adverse impact of
financial reform legislation and related regulations.
The information in this presentation speaks only as of April 26, 2019 (or such earlier date as may be specified herein). The company makes no
commitment to update any of this information.

Charles Schwab Corporation
WaltBettinger
5
President andChief Executive Officer

Charles Schwab Corporation
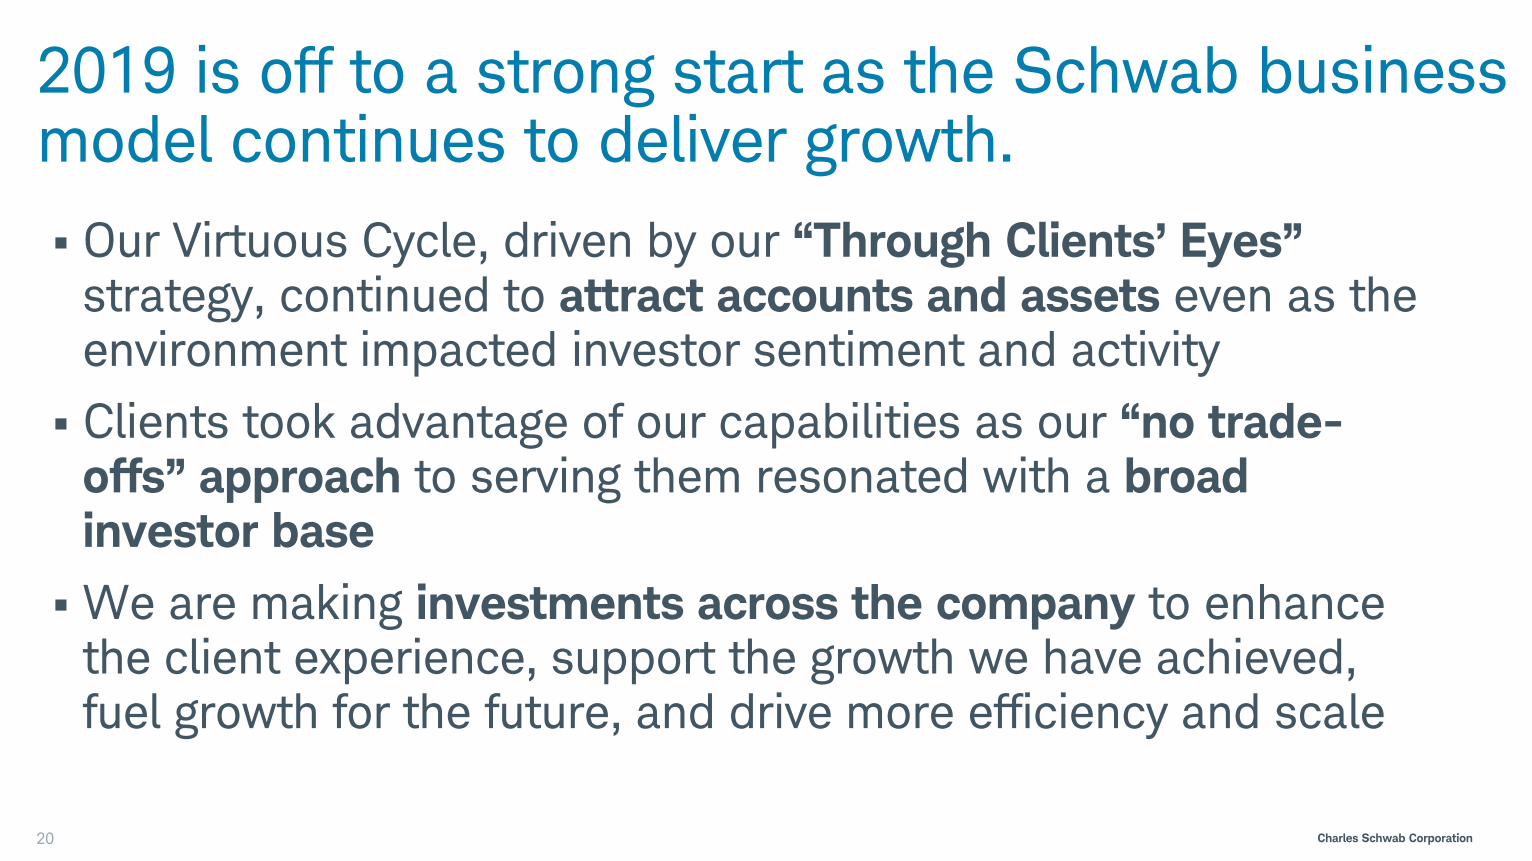
2019 is off to a strong start as the Schwab business model continues to deliver growth.
6
Our Virtuous Cycle, driven by our “Through Clients’ Eyes” strategy, continued to attract accounts and assets even as the environment impacted investor sentiment and activity
Clients took advantage of our capabilities as our “no trade-offs” approach to serving them resonated with a broadinvestor base
We are making investments across the company to enhance the client experience, support the growth we have achieved, fuel growth for the future, and drive more efficiency and scale

Charles Schwab Corporation
Challenge the Status Quo to
Benefit Investors
Investors Reward Us
With More of Their
Assets
Outstanding
Stockholder Value,
and…
Greater Investments,
Which Fund
Actions to…
7
Our “Virtuous Cycle” carried on…
Leading to Record
Financial Results,…

Charles Schwab Corporation
…while investors faced a dynamic first quarter environment.
8
2507
2834
25
14
10
15
20
25
30
2400
2500
2600
2700
2800
2900
29-Dec-18 28-Jan-19 27-Feb-19 29-Mar-19
Cb
oe V
ola
tility
In
dex
®
S&
P 5
00
®
S&P 500
Cboe Volatility Index
The market was up 13% with relatively low volatility……yet there was much
uncertainty across the globe
U.S. / China Trade
Negotiation
Brexit Debate
ECB Policy
Fed Policy
U.S. Government
Shutdown

Charles Schwab Corporation9
New Brokerage Accounts (K)
$14.7 $14.5 $15.3
$19.4 $18.8
1Q 2015 1Q 2016 1Q 2017 1Q 2018 1Q 2019
Margin Balances ($B) FC Planning Conversations1
313 328 317
462418
1Q 20161Q 2015 1Q 2017 1Q 2018 1Q 2019
DARTs (K)
Notes: DARTs = daily average revenue trades and include all client trades that generate either commission revenue or revenue from principal markups (i.e., fixed income). FC = Financial Consultant. 1.
Beginning with 2018, conversation counts include plans delivered by Wealth Strategy Group and other internal partners where the FC has a relationship with the client.
We believe the environment impacted investor engagement; 1Q was still high by historic standards.
274 265
362443
386
1Q 20161Q 2015 1Q 2017 1Q 2018 1Q 2019
25,00034,000 38,000
55,00050,000
1Q 20181Q 2015 1Q 2016 1Q 2017 1Q 2019
Charles Schwab Corporation
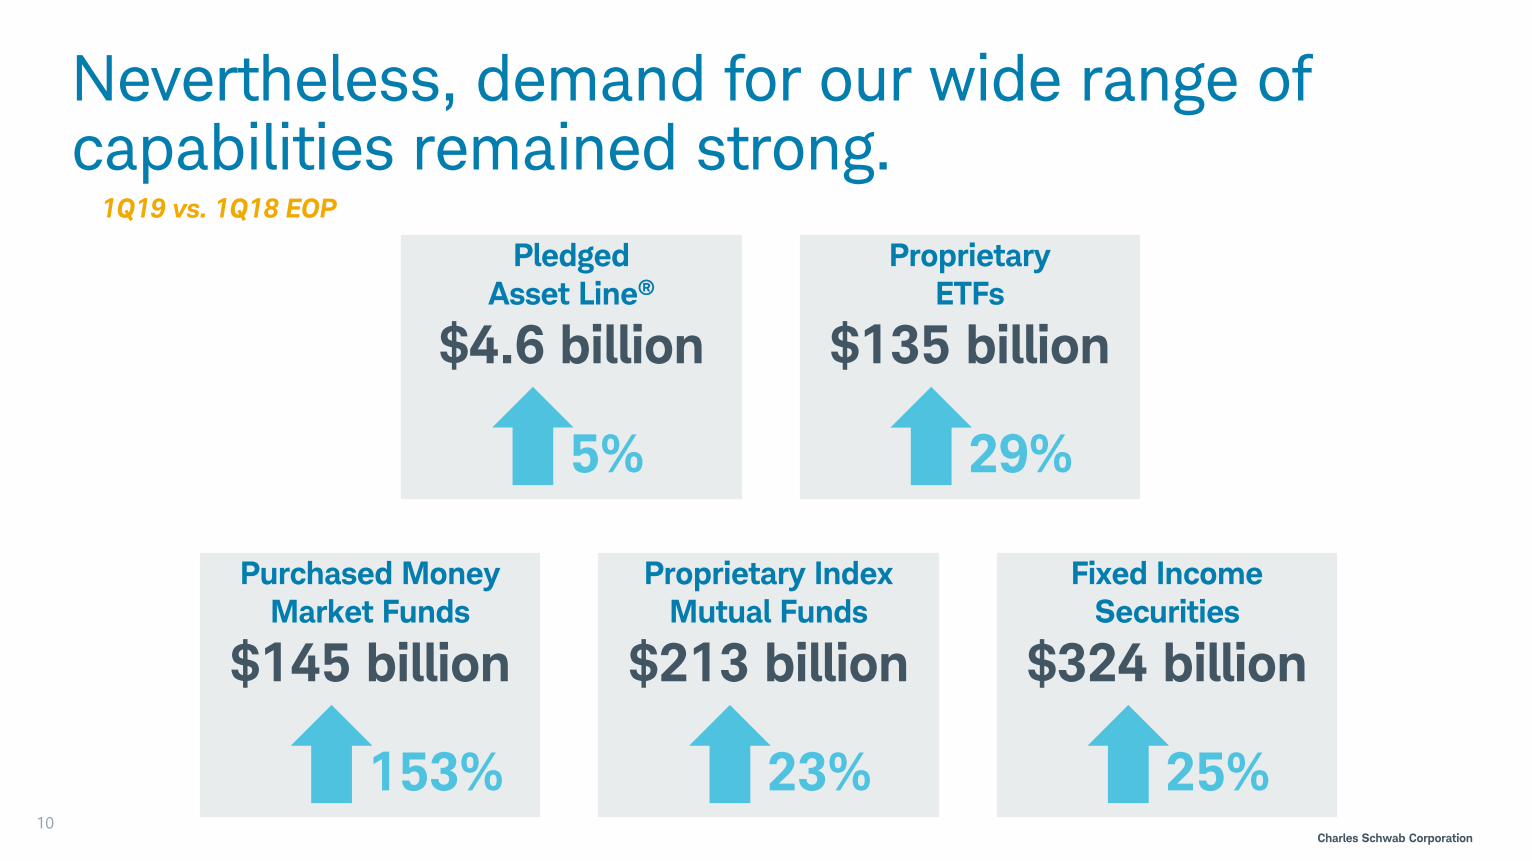
Nevertheless, demand for our wide range of capabilities remained strong.
10
Pledged
Asset Line®
$4.6 billion
5%
Proprietary
ETFs
$135 billion
29%
1Q19 vs. 1Q18 EOP
Purchased Money
Market Funds
$145 billion
153%
Proprietary Index
Mutual Funds
$213 billion
23%
Fixed Income
Securities
$324 billion
25%
Charles Schwab Corporation
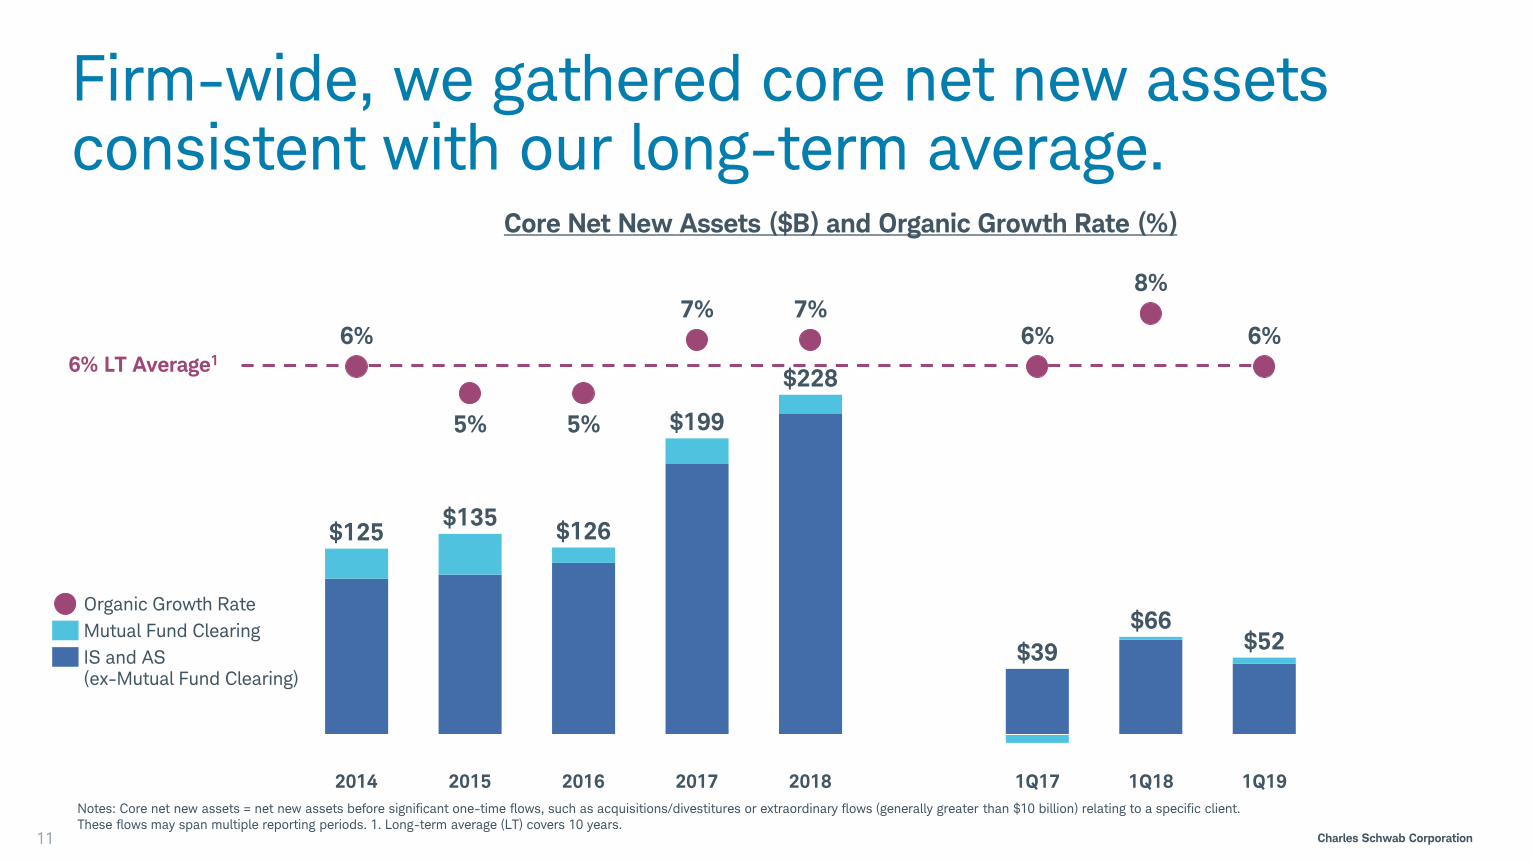
Notes: Core net new assets = net new assets before significant one-time flows, such as acquisitions/divestitures or extraordinary flows (generally greater than $10 billion) relating to a specific client.
These flows may span multiple reporting periods. 1. Long-term average (LT) covers 10 years.
Firm-wide, we gathered core net new assets consistent with our long-term average.
11
Core Net New Assets ($B) and Organic Growth Rate (%)
6%
5% 5%
7% 7%6%
8%
6%
2014 1Q182015 2016 20182017 1Q191Q17
$125$135
$126
$228
$199
$39
$66$52
Organic Growth Rate
Mutual Fund Clearing
IS and AS (ex-Mutual Fund Clearing)
6% LT Average1
Charles Schwab Corporation
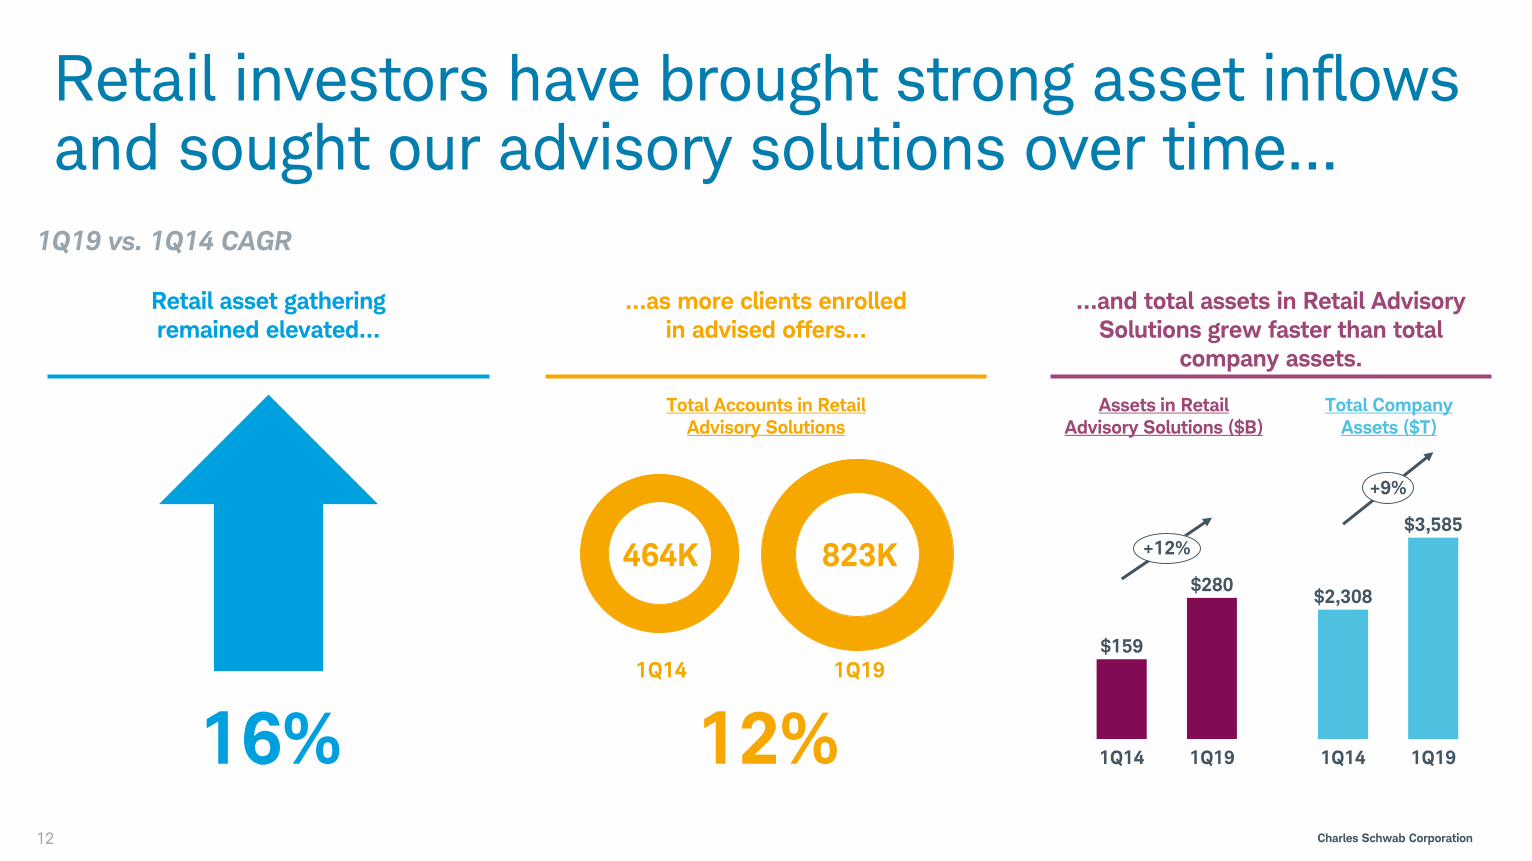
Total Accounts in Retail
Advisory Solutions
…as more clients enrolled
in advised offers…
12%
Retail investors have brought strong asset inflows and sought our advisory solutions over time…
Retail asset gathering
remained elevated…
…and total assets in Retail Advisory
Solutions grew faster than total
company assets.
1Q19 vs. 1Q14 CAGR
464K 823K
16%
1Q14 1Q19
12
$159
$280
1Q14 1Q19
+12%
$2,308
$3,585
1Q14 1Q19
+9%
Assets in Retail
Advisory Solutions ($B)
Total Company
Assets ($T)
Charles Schwab Corporation
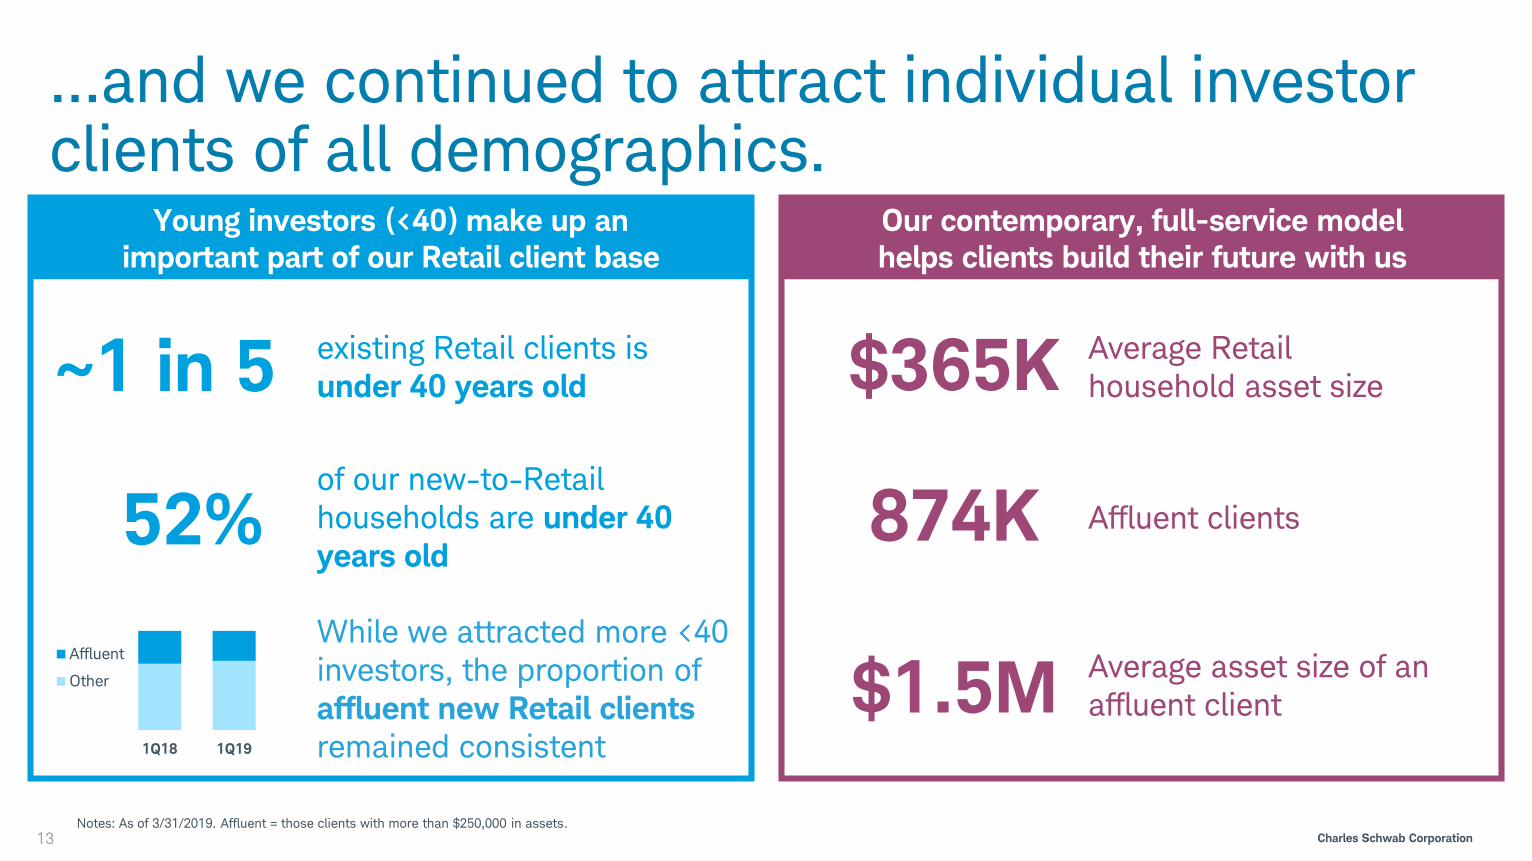
Notes: As of 3/31/2019. Affluent = those clients with more than $250,000 in assets.
13
…and we continued to attract individual investor clients of all demographics.
Young investors (<40) make up an
important part of our Retail client base
52%of our new-to-Retail
households are under 40
years old
~1 in 5 existing Retail clients is
under 40 years old $365K Average Retail
household asset size
While we attracted more <40
investors, the proportion of
affluent new Retail clients
remained consistent
874K Affluent clients
$1.5MAverage asset size of an
affluent client
1Q18 1Q19
Affluent
Other
Our contemporary, full-service model
helps clients build their future with us
Charles Schwab Corporation14
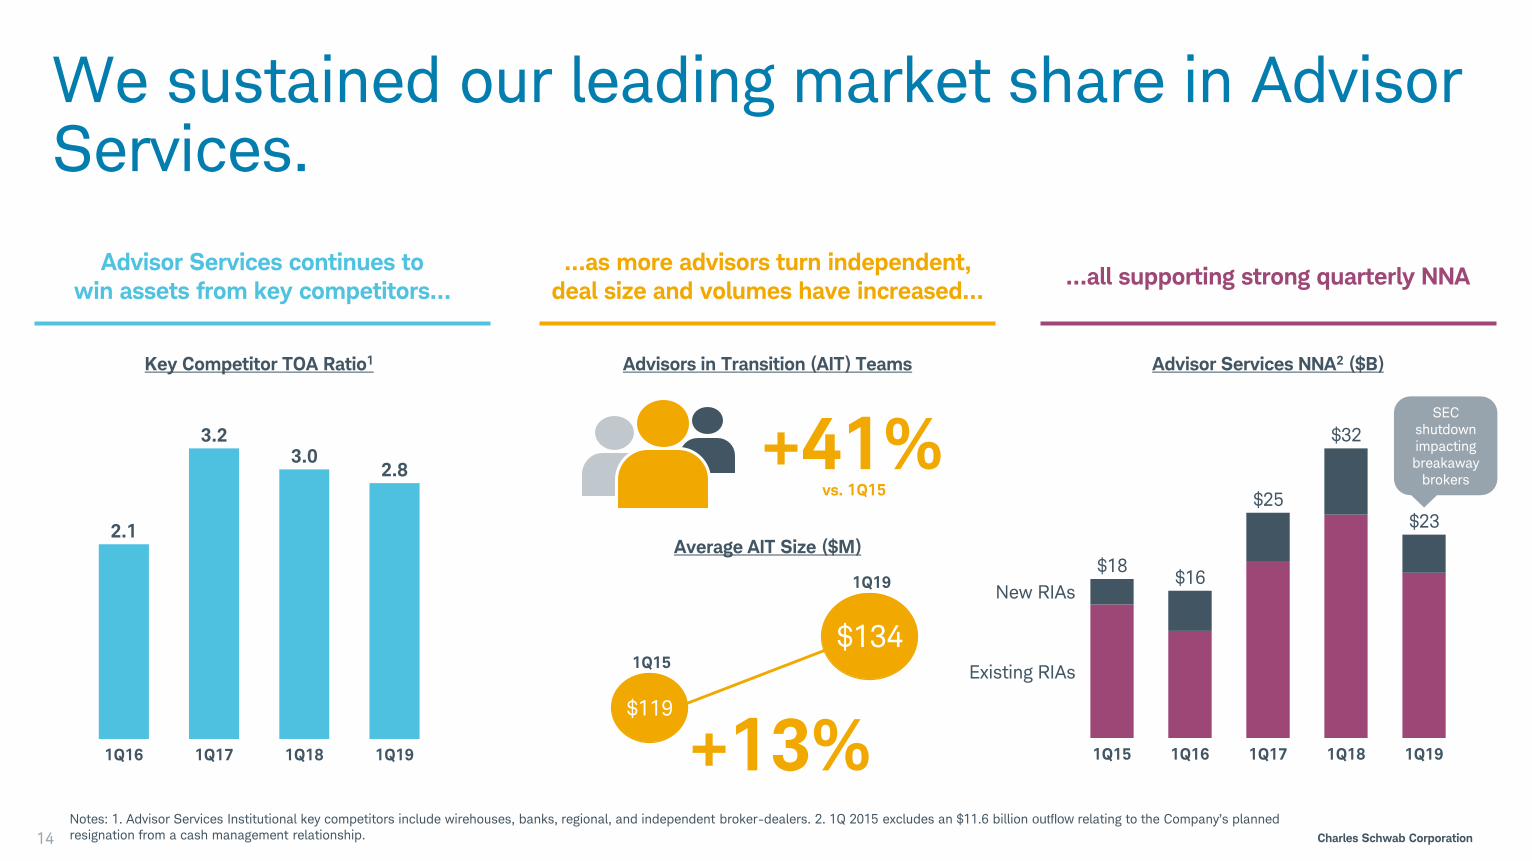
We sustained our leading market share in Advisor Services.
Advisor Services continues to
win assets from key competitors…
…as more advisors turn independent,
deal size and volumes have increased……all supporting strong quarterly NNA
+13%$119
$134
Average AIT Size ($M)
Advisors in Transition (AIT) Teams
1Q15
1Q19
+41%vs. 1Q15
New RIAs
1Q181Q15 1Q16
Existing RIAs
$32
1Q191Q17
$18$16
$25$23
Advisor Services NNA2 ($B)
2.1
3.23.0
2.8
1Q18 1Q191Q16 1Q17
Key Competitor TOA Ratio1
Notes: 1. Advisor Services Institutional key competitors include wirehouses, banks, regional, and independent broker-dealers. 2. 1Q 2015 excludes an $11.6 billion outflow relating to the Company’s planned
resignation from a cash management relationship.
SEC
shutdown impacting
breakaway
brokers

Charles Schwab Corporation15
We are investing to both fuel and support growth.
Continue progress on multiple fronts:
– Application Modernization: untethering
from the legacy mainframe environment
– Business Process Transformation:
streamlining the way we do business
– Digital Accelerator: leading disruption
on behalf of our clients
– Cybersecurity
– Regulatory
Investor
Services and
Advisor Services
Technology,
Infrastructure,
and Regulation
Continue to offer innovative products
at a great value
Simplify and scale the overall client
experience, including planning and
service
Expand retail distribution channels
Enhance the custody experience to help
the RIA industry grow
Advocate on behalf of the RIA industry
Attract and develop RIA talent
Charles Schwab Corporation
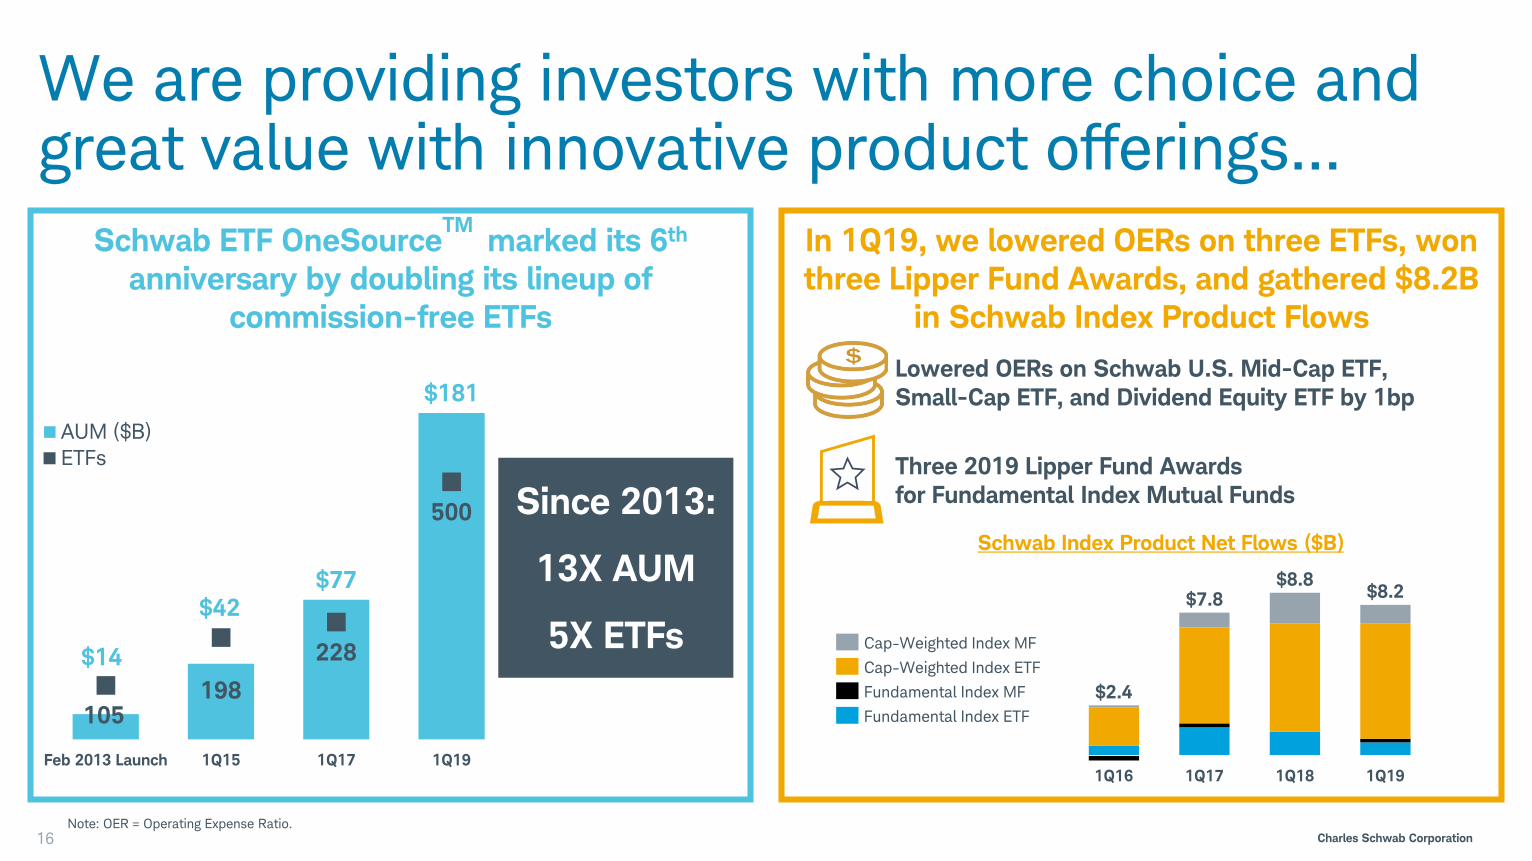
We are providing investors with more choice and great value with innovative product offerings…
16
Schwab ETF OneSourceTM
marked its 6th
anniversary by doubling its lineup of
commission-free ETFs
In 1Q19, we lowered OERs on three ETFs, won
three Lipper Fund Awards, and gathered $8.2B
in Schwab Index Product Flows
Three 2019 Lipper Fund Awards
for Fundamental Index Mutual Funds
Lowered OERs on Schwab U.S. Mid-Cap ETF,
Small-Cap ETF, and Dividend Equity ETF by 1bp
1Q16
$8.8
1Q17
$2.4
1Q18 1Q19
$8.2$7.8
Fundamental Index ETF
Cap-Weighted Index MF
Fundamental Index MF
Cap-Weighted Index ETF
Schwab Index Product Net Flows ($B)
$14
$42$77
$181
105198
228
500
Feb 2013 Launch 1Q15 1Q17 1Q19
AUM ($B)
ETFs
Since 2013:
13X AUM
5X ETFs
Note: OER = Operating Expense Ratio.
Charles Schwab Corporation
$16
$38
149
315
1Q15 1Q17 1Q19
AUM ($B)
Accounts (K)
Launched
SIP
3/2015,
IIP 6/2015
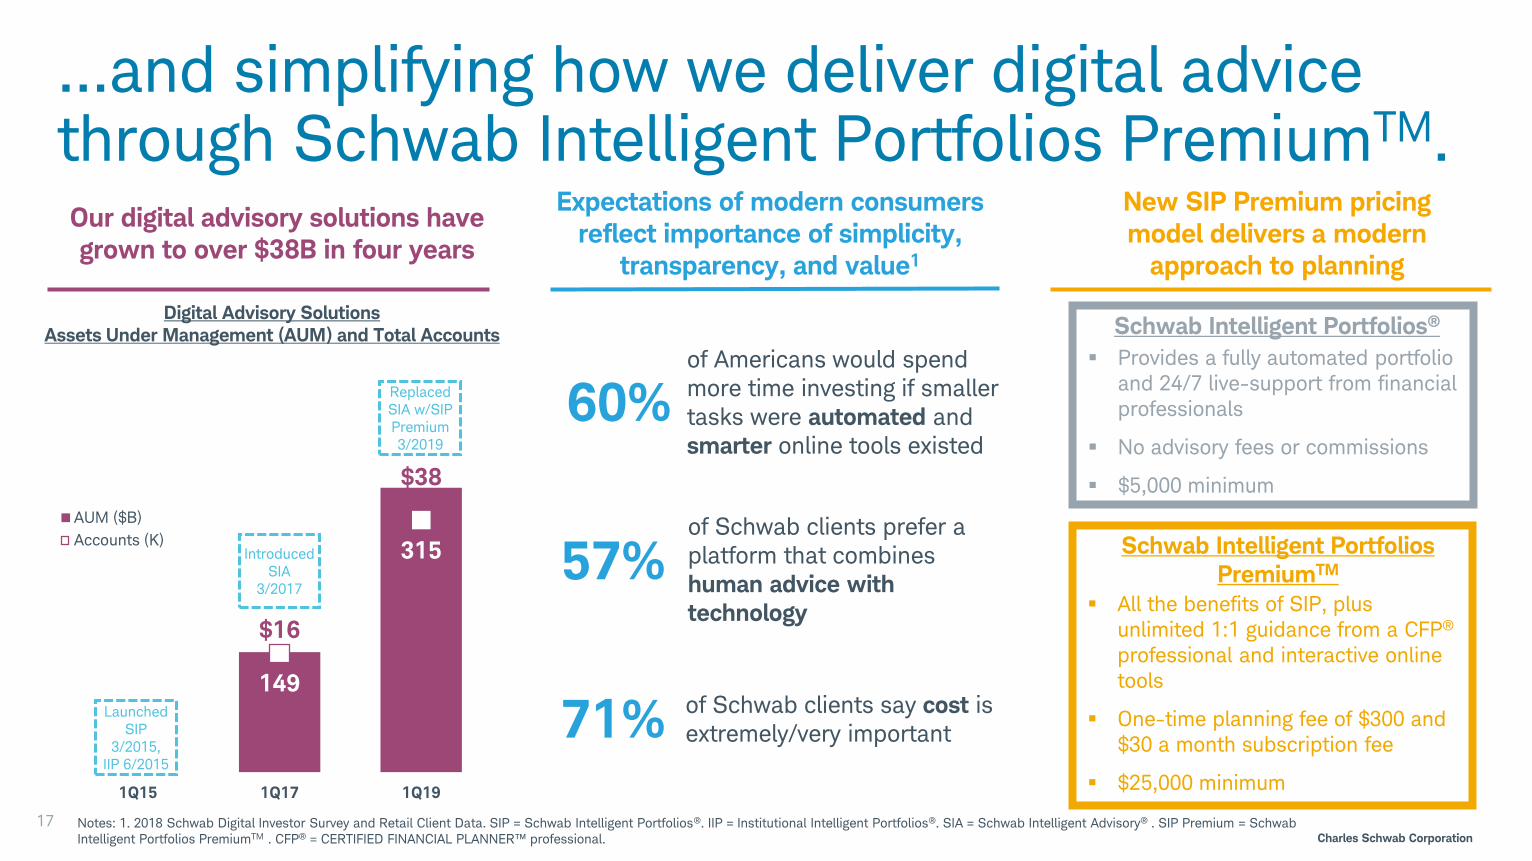
Expectations of modern consumers
reflect importance of simplicity,
transparency, and value1
17
…and simplifying how we deliver digital advice through Schwab Intelligent Portfolios PremiumTM.Our digital advisory solutions have
grown to over $38B in four years
New SIP Premium pricing
model delivers a modern
approach to planning
of Schwab clients say cost is
extremely/very important
of Schwab clients prefer a
platform that combines
human advice with
technology
71%
57%
of Americans would spend
more time investing if smaller
tasks were automated and
smarter online tools existed
60%
Digital Advisory Solutions
Assets Under Management (AUM) and Total Accounts
Introduced
SIA
3/2017
Provides a fully automated portfolio
and 24/7 live-support from financial
professionals
No advisory fees or commissions
$5,000 minimum
Schwab Intelligent Portfolios®
Schwab Intelligent Portfolios
PremiumTM
All the benefits of SIP, plus
unlimited 1:1 guidance from a CFP®
professional and interactive online
tools
One-time planning fee of $300 and
$30 a month subscription fee
$25,000 minimum
Replaced
SIA w/SIP
Premium
3/2019
Notes: 1. 2018 Schwab Digital Investor Survey and Retail Client Data. SIP = Schwab Intelligent Portfolios®. IIP = Institutional Intelligent Portfolios®. SIA = Schwab Intelligent Advisory® . SIP Premium = Schwab
Intelligent Portfolios PremiumTM . CFP® = CERTIFIED FINANCIAL PLANNER™ professional.

Charles Schwab Corporation18
Our key efficiency investments are already realizing benefits and improving the client experience.
Self-Service
Capabilities 2.1MMinutes Saved across
measured initiatives
since launch1
Account
Servicing
Mobile
Usage ~20%Increase in mobile
users over the past year
to 1 million monthly
~50%Reduction in password
reset calls to service
teams during 1Q
Client Experience Efficiency Gain
Simplified experience
to reduce manual
touch-points
Launched self-service
password reset in the
IVR
Continuously updating
App to meet clients’
needs
Notes: 1. Numbers are preliminary and do not capture all minutes potentially saved from Digital initiatives. Measured initiatives include Advisor Services Requirement Minimum Distribution launched July 2018, Advisor Services Status launched December 2018, Investor Services Password Reset launched November 2018. IVR = Automated Voice Response
Charles Schwab Corporation
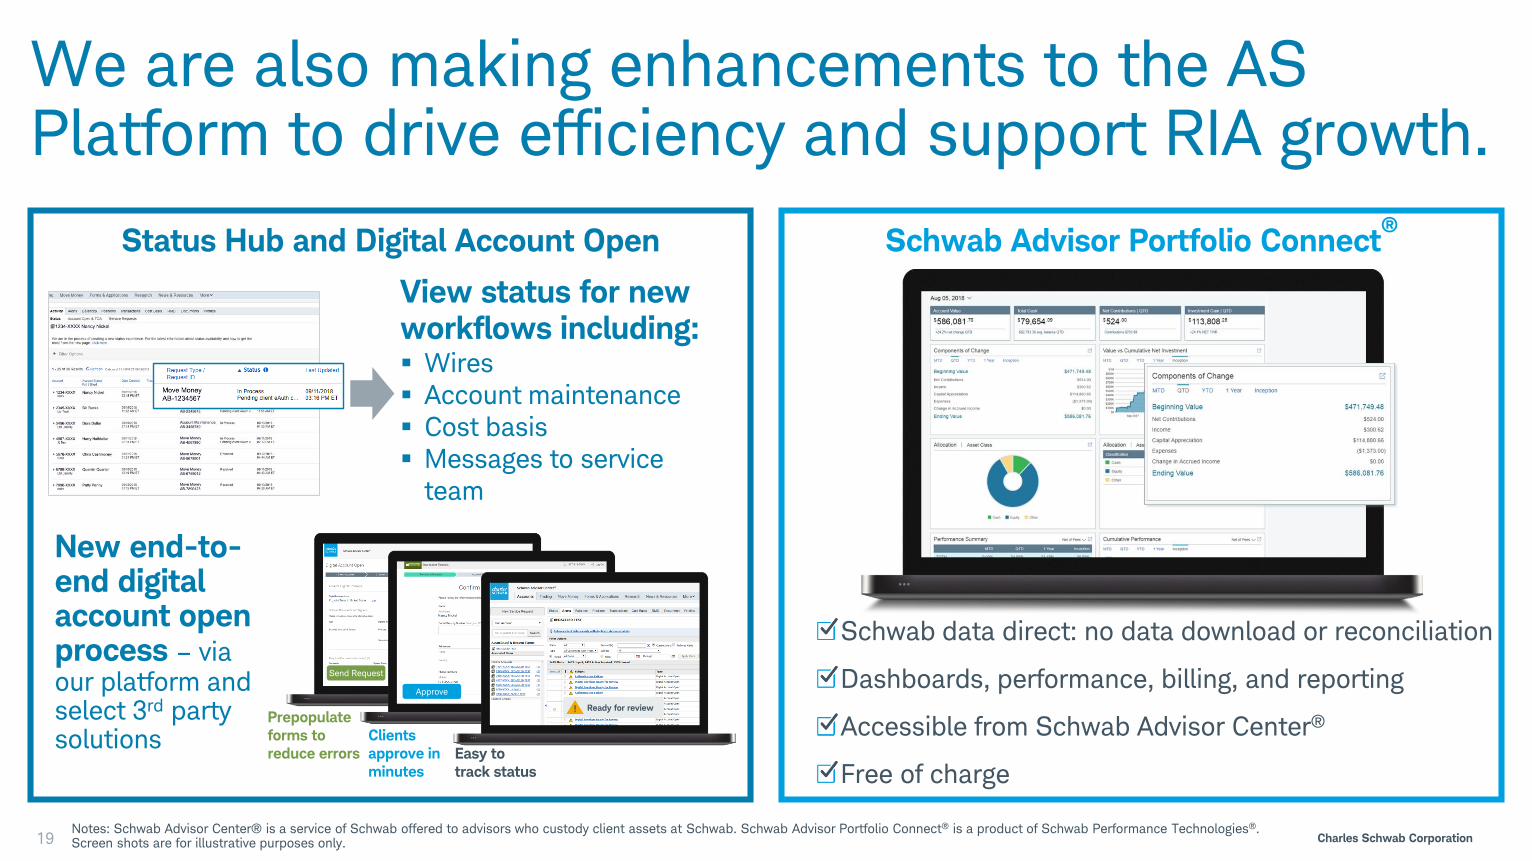
We are also making enhancements to the AS Platform to drive efficiency and support RIA growth.
19
Schwab data direct: no data download or reconciliation
Dashboards, performance, billing, and reporting
Accessible from Schwab Advisor Center®
Free of charge
Status Hub and Digital Account Open Schwab Advisor Portfolio Connect®
Notes: Schwab Advisor Center® is a service of Schwab offered to advisors who custody client assets at Schwab. Schwab Advisor Portfolio Connect® is a product of Schwab Performance Technologies®.Screen shots are for illustrative purposes only.
New end-to-end digital account open process – via our platform and select 3rd party solutions
View status for new workflows including: Wires
Account maintenance
Cost basis
Messages to service
team
Send Request
Clients
approve in
minutes
Prepopulate
forms to
reduce errors Easy to
track status
Approve
Ready for review!
Charles Schwab Corporation
2019 is off to a strong start as the Schwab business model continues to deliver growth.
20
Our Virtuous Cycle, driven by our “Through Clients’ Eyes” strategy, continued to attract accounts and assets even as the environment impacted investor sentiment and activity
Clients took advantage of our capabilities as our “no trade-offs” approach to serving them resonated with a broadinvestor base
We are making investments across the company to enhance the client experience, support the growth we have achieved, fuel growth for the future, and drive more efficiency and scale
Charles Schwab Corporation
Peter Crawford
21
Executive Vice President andChief Financial Officer

Charles Schwab Corporation22
In 1Q19, we achieved both strong business growth and financial performance.
Today we’ll
discuss:
Q1 2019 results
2019 financial
outlook
Capital picture
Healthy asset gathering and client engagement helped drive our first quarter results
We continue to monitor the key macro drivers of our revenue outlook
We have completed our cash transfer strategy and anticipate more meaningful capital return in 2019

Charles Schwab Corporation23
Our success with clients persisted…
8%
Total
Advised Assets
1Q19 vs. 1Q18 EOP
Total Active
Brokerage Accounts
7%
11.8 million
Total
Client Assets
$3.6 trillion
9%
$1.9 trillion

Charles Schwab Corporation
…at the same time key macro drivers were mixed.
24
Market
S&P appreciates
6.5% from mid
January
Short-term Rates
One rate hike in
June 2019 to
2.50%-2.75%
Trading
DARTs up ~5%
year-over-year
Long-term Rates
Average 10-year
Treasury at 2.80%
S&P up 8.6%
from 1/15/19
No rate hike
likely
DARTs down 10%
from 1Q18
Average 10-year
Treasury at 2.65%
FY
20
19
Key D
rivers
:
1Q
19
Actu
als
:
Charles Schwab Corporation
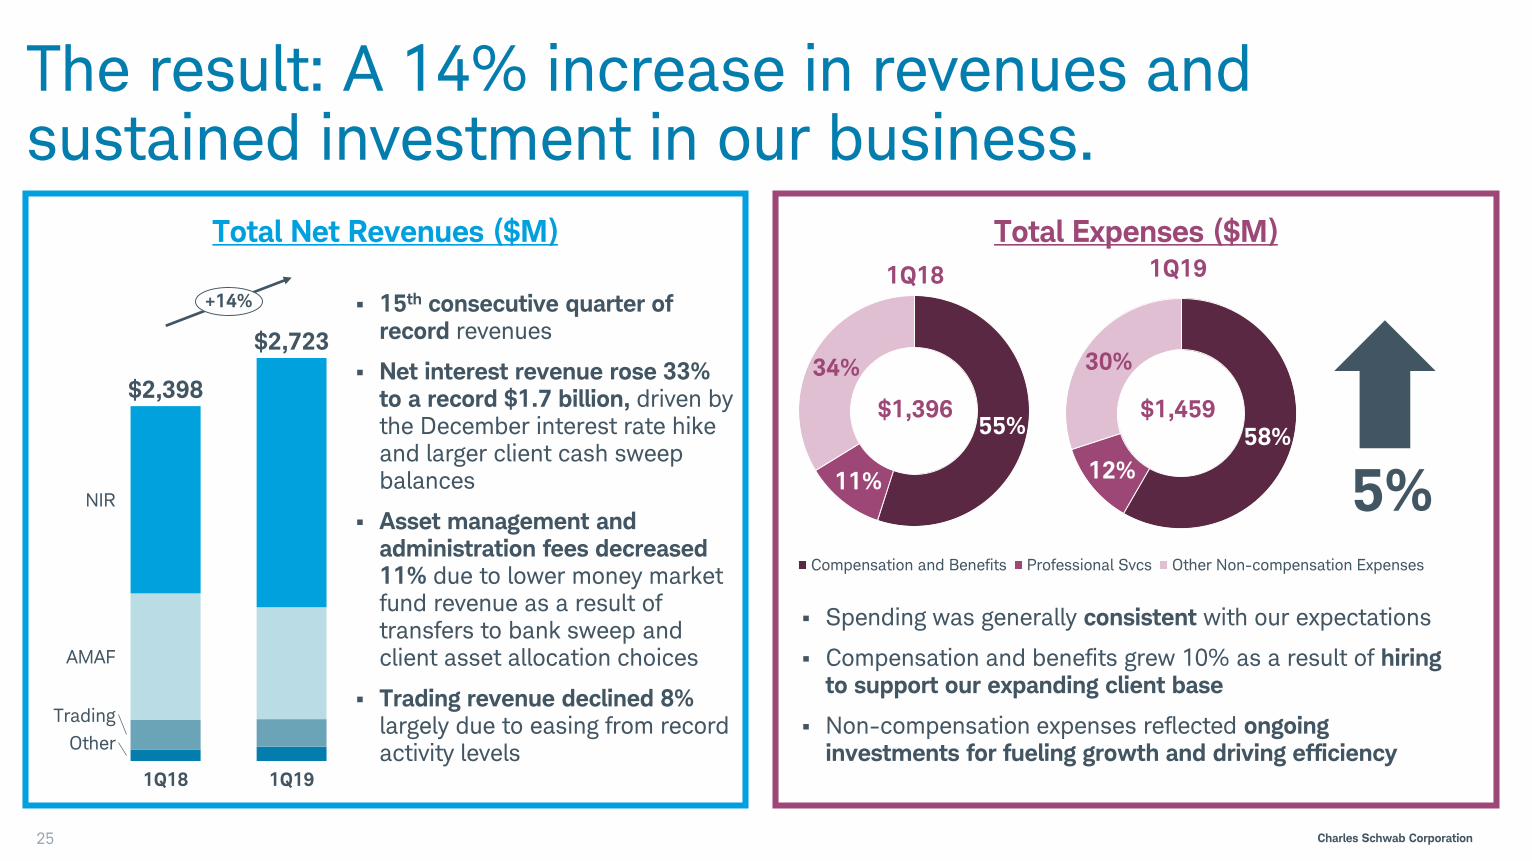
58%
12%
30%
55%
11%
34%
Compensation and Benefits Professional Svcs Other Non-compensation Expenses
The result: A 14% increase in revenues and sustained investment in our business.
15th consecutive quarter of record revenues
Net interest revenue rose 33% to a record $1.7 billion, driven by the December interest rate hike and larger client cash sweep balances
Asset management and administration fees decreased11% due to lower money market fund revenue as a result of transfers to bank sweep and client asset allocation choices
Trading revenue declined 8% largely due to easing from record activity levels
Spending was generally consistent with our expectations
Compensation and benefits grew 10% as a result of hiring to support our expanding client base
Non-compensation expenses reflected ongoing investments for fueling growth and driving efficiency
Total Net Revenues ($M)
NIR
1Q18 1Q19
AMAF
Trading
Other
$2,398
$2,723
+14%
25
Total Expenses ($M)
$1,396
5%
1Q18 1Q19
$1,459
Charles Schwab Corporation
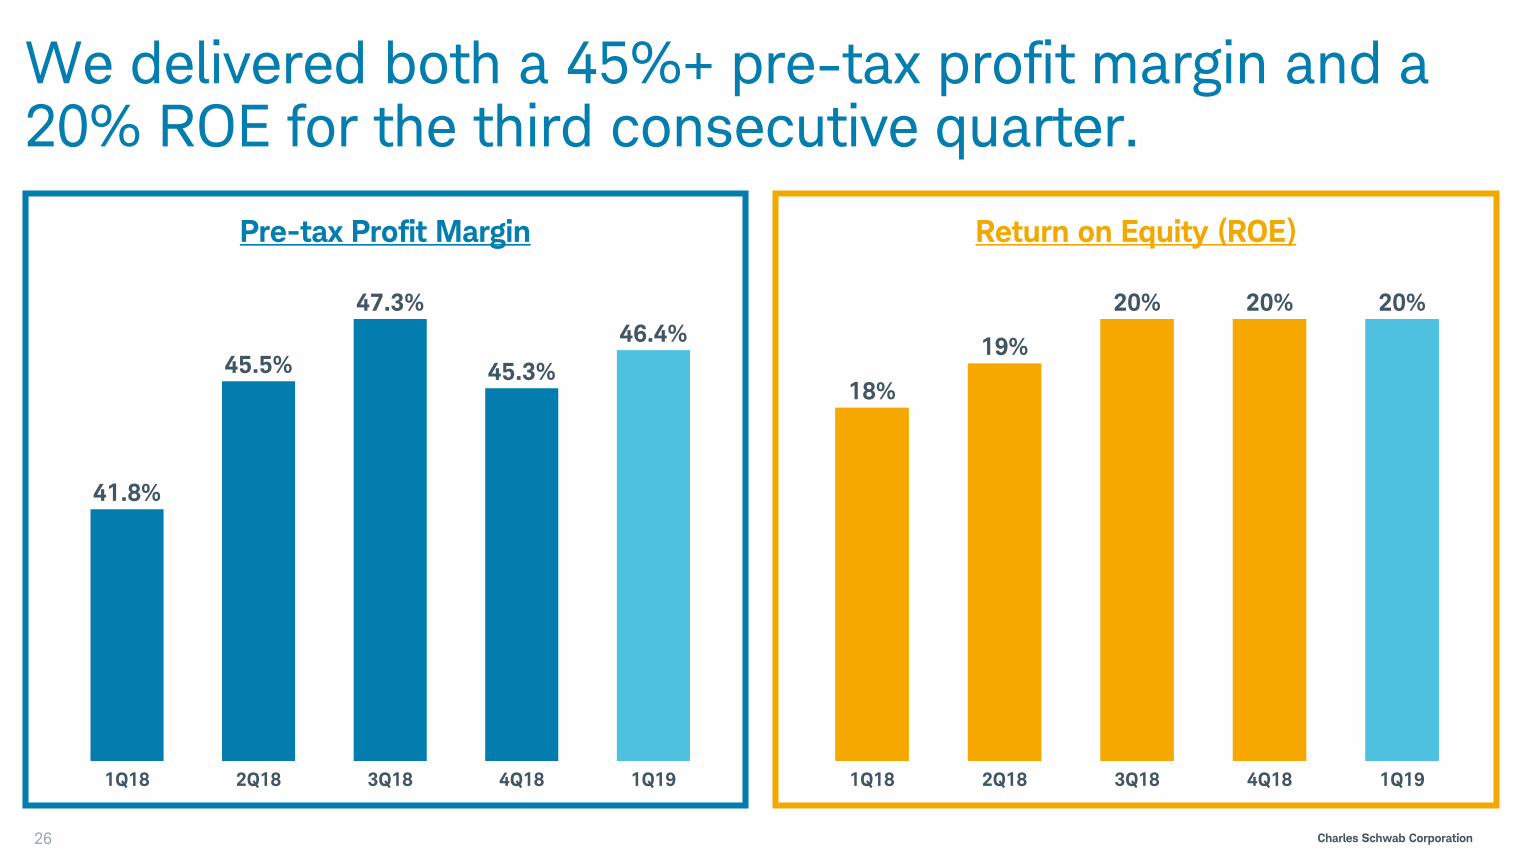
We delivered both a 45%+ pre-tax profit margin and a 20% ROE for the third consecutive quarter.
26
41.8%
1Q18 3Q18
45.5%
4Q182Q18
47.3%
1Q19
45.3%
46.4%19%
1Q18 2Q18
18%
4Q183Q18 1Q19
20% 20% 20%
Pre-tax Profit Margin Return on Equity (ROE)
Charles Schwab Corporation
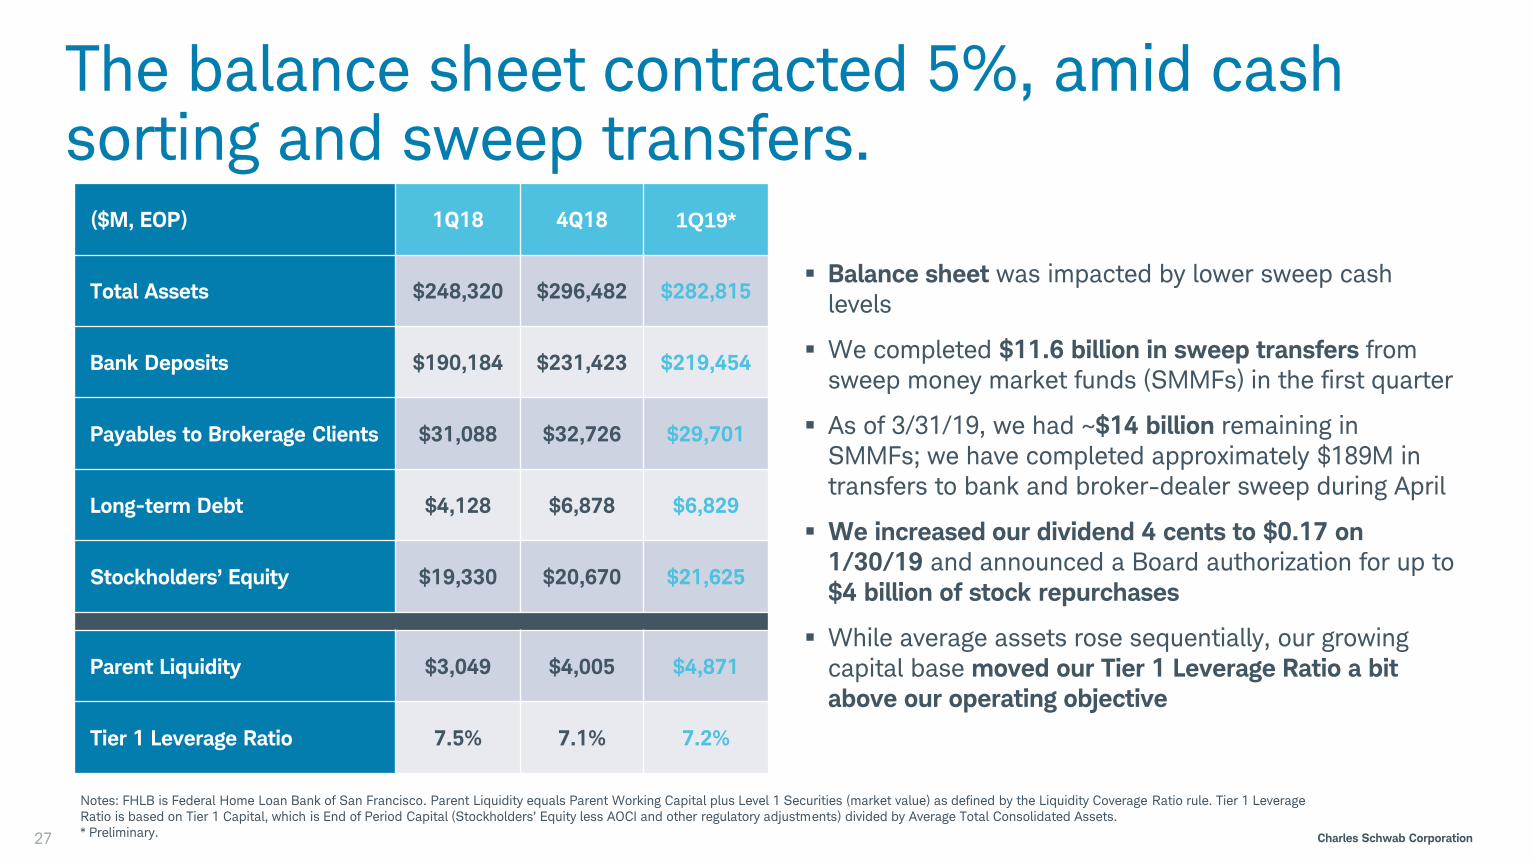
The balance sheet contracted 5%, amid cash sorting and sweep transfers.
27
($M, EOP) 1Q18 4Q18 1Q19*
Total Assets $248,320 $296,482 $282,815
Bank Deposits $190,184 $231,423 $219,454
Payables to Brokerage Clients $31,088 $32,726 $29,701
Long-term Debt $4,128 $6,878 $6,829
Stockholders’ Equity $19,330 $20,670 $21,625
Parent Liquidity $3,049 $4,005 $4,871
Tier 1 Leverage Ratio 7.5% 7.1% 7.2%
Notes: FHLB is Federal Home Loan Bank of San Francisco. Parent Liquidity equals Parent Working Capital plus Level 1 Securities (market value) as defined by the Liquidity Coverage Ratio rule. Tier 1 Leverage
Ratio is based on Tier 1 Capital, which is End of Period Capital (Stockholders’ Equity less AOCI and other regulatory adjustments) divided by Average Total Consolidated Assets.
* Preliminary.
Balance sheet was impacted by lower sweep cash
levels
We completed $11.6 billion in sweep transfers from
sweep money market funds (SMMFs) in the first quarter
As of 3/31/19, we had ~$14 billion remaining in
SMMFs; we have completed approximately $189M in
transfers to bank and broker-dealer sweep during April
We increased our dividend 4 cents to $0.17 on
1/30/19 and announced a Board authorization for up to
$4 billion of stock repurchases
While average assets rose sequentially, our growing
capital base moved our Tier 1 Leverage Ratio a bit
above our operating objective
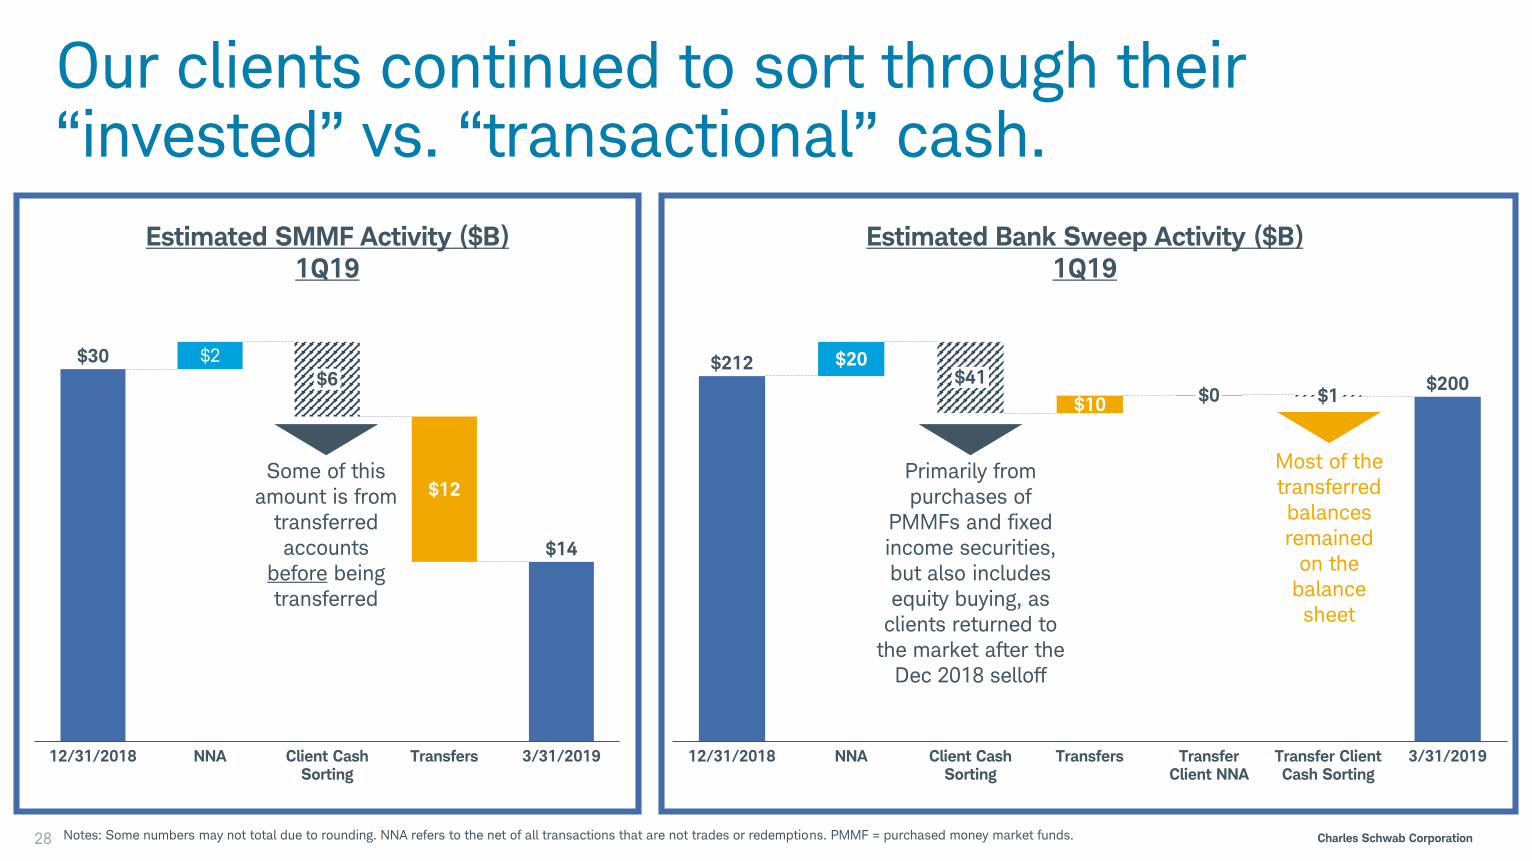
Charles Schwab CorporationNotes: Some numbers may not total due to rounding. NNA refers to the net of all transactions that are not trades or redemptions. PMMF = purchased money market funds.
Our clients continued to sort through their “invested” vs. “transactional” cash.
28
$212$200
$20
$10
Transfers
$0
12/31/2018 3/31/2019NNA Transfer Client NNA
Client Cash Sorting
$41$1
Transfer Client Cash Sorting
Estimated Bank Sweep Activity ($B)
1Q19
Most of the
transferred
balances
remained
on the
balance
sheet
Primarily from
purchases of
PMMFs and fixed
income securities,
but also includes
equity buying, as
clients returned to
the market after the
Dec 2018 selloff
Estimated SMMF Activity ($B)
1Q19
$30
$14
$2
$12
3/31/2019NNA12/31/2018 Client Cash Sorting
$6
Transfers
Some of this
amount is from
transferred
accounts
before being
transferred
Charles Schwab Corporation
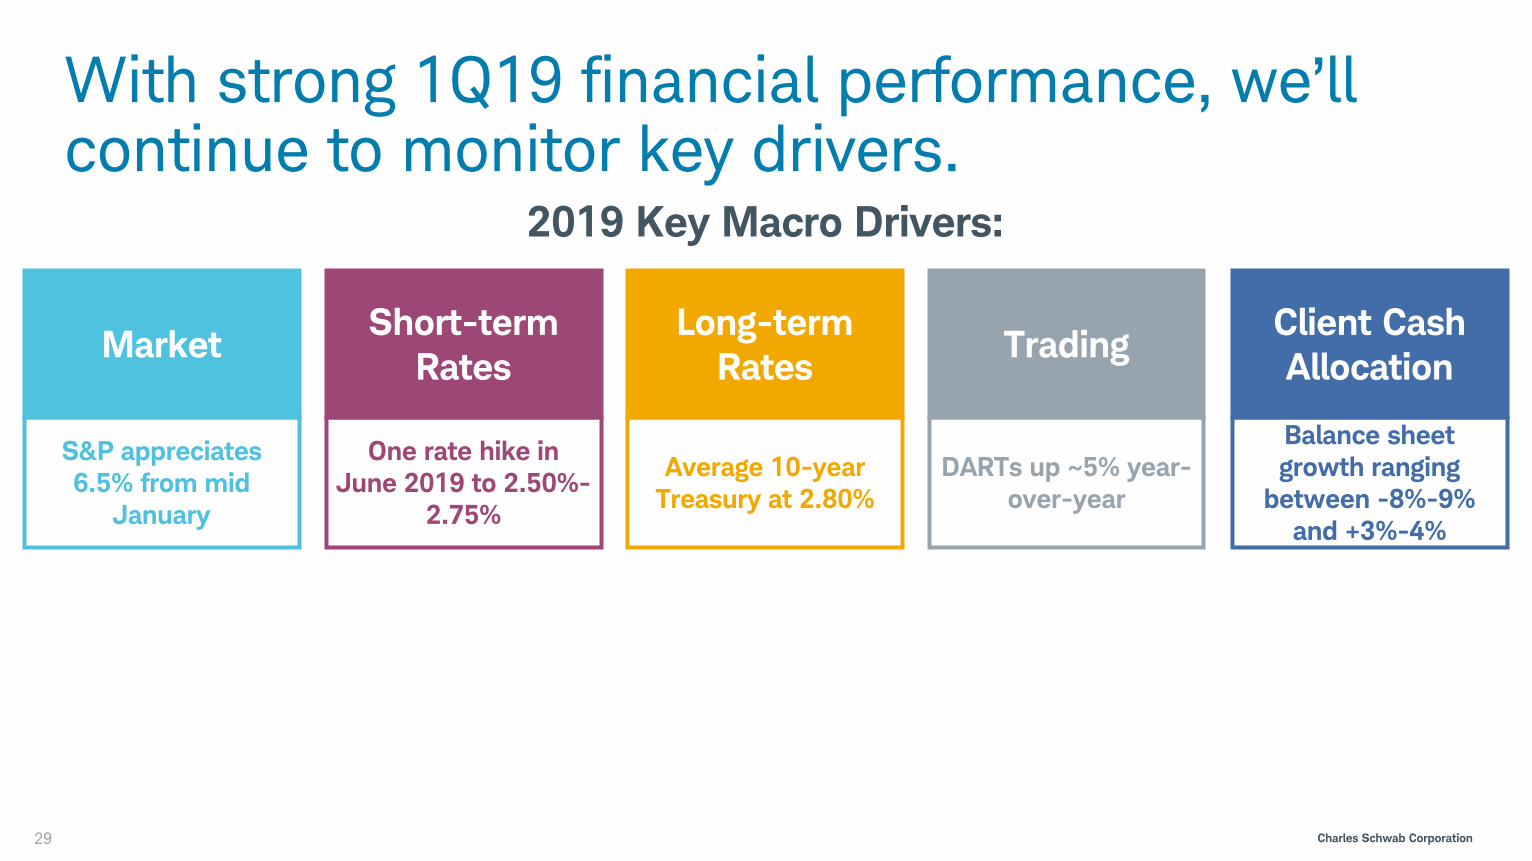
With strong 1Q19 financial performance, we’ll continue to monitor key drivers.
Client Cash
AllocationTrading
Long-term
Rates
Short-term
RatesMarket
29
S&P appreciates
6.5% from mid
January
One rate hike in
June 2019 to 2.50%-
2.75%
DARTs up ~5% year-
over-year
Average 10-year
Treasury at 2.80%
Balance sheet
growth ranging
between -8%-9%
and +3%-4%
2019 Key Macro Drivers:

Charles Schwab Corporation
With strong 1Q19 financial performance, we’ll continue to monitor key drivers.
Client Cash
AllocationTrading
Long-term
Rates
Short-term
RatesMarket
30
S&P appreciates
6.5% from mid
January
One rate hike in
June 2019 to 2.50%-
2.75%
DARTs up ~5% year-
over-year
Average 10-year
Treasury at 2.80%
Balance sheet
growth ranging
between -8%-9%
and +3%-4%
2019 Key Macro Drivers and 1Q Results:
S&P up 8.6%
from 1/15/19
No rate hike
likely
DARTs down 10%
from 1Q18
Average 10-year
Treasury at 2.65%
Balance sheet
down 5% from
12/31/18
Charles Schwab Corporation
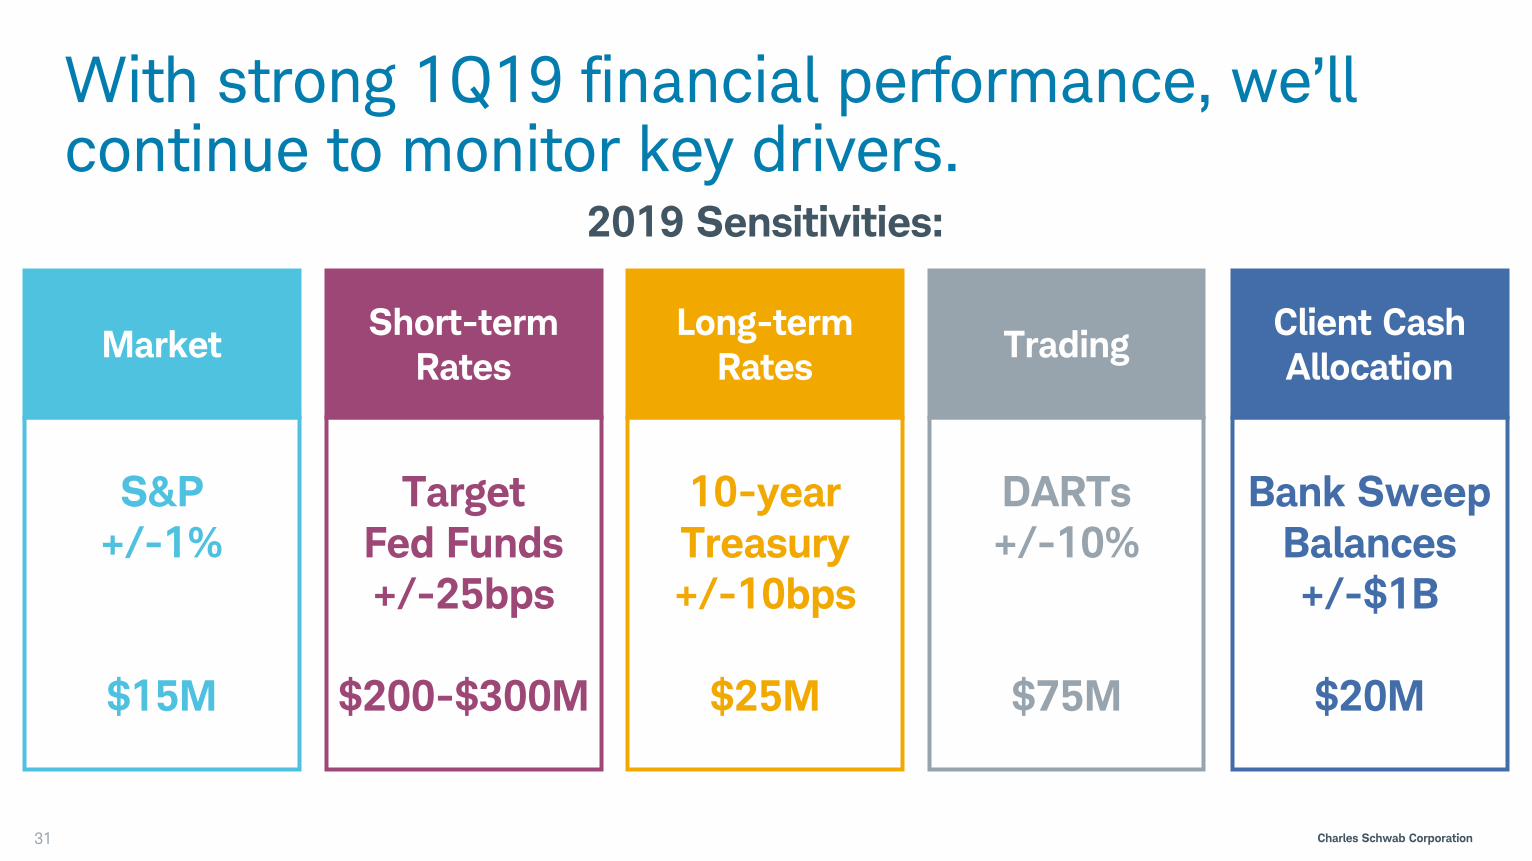
With strong 1Q19 financial performance, we’ll continue to monitor key drivers.
Client Cash
AllocationTrading
Long-term
Rates
Short-term
RatesMarket
31
S&P
+/-1%
$15M
Target
Fed Funds
+/-25bps
$200-$300M
DARTs
+/-10%
$75M
10-year
Treasury
+/-10bps
$25M
Bank Sweep
Balances
+/-$1B
$20M
2019 Sensitivities:
Charles Schwab Corporation
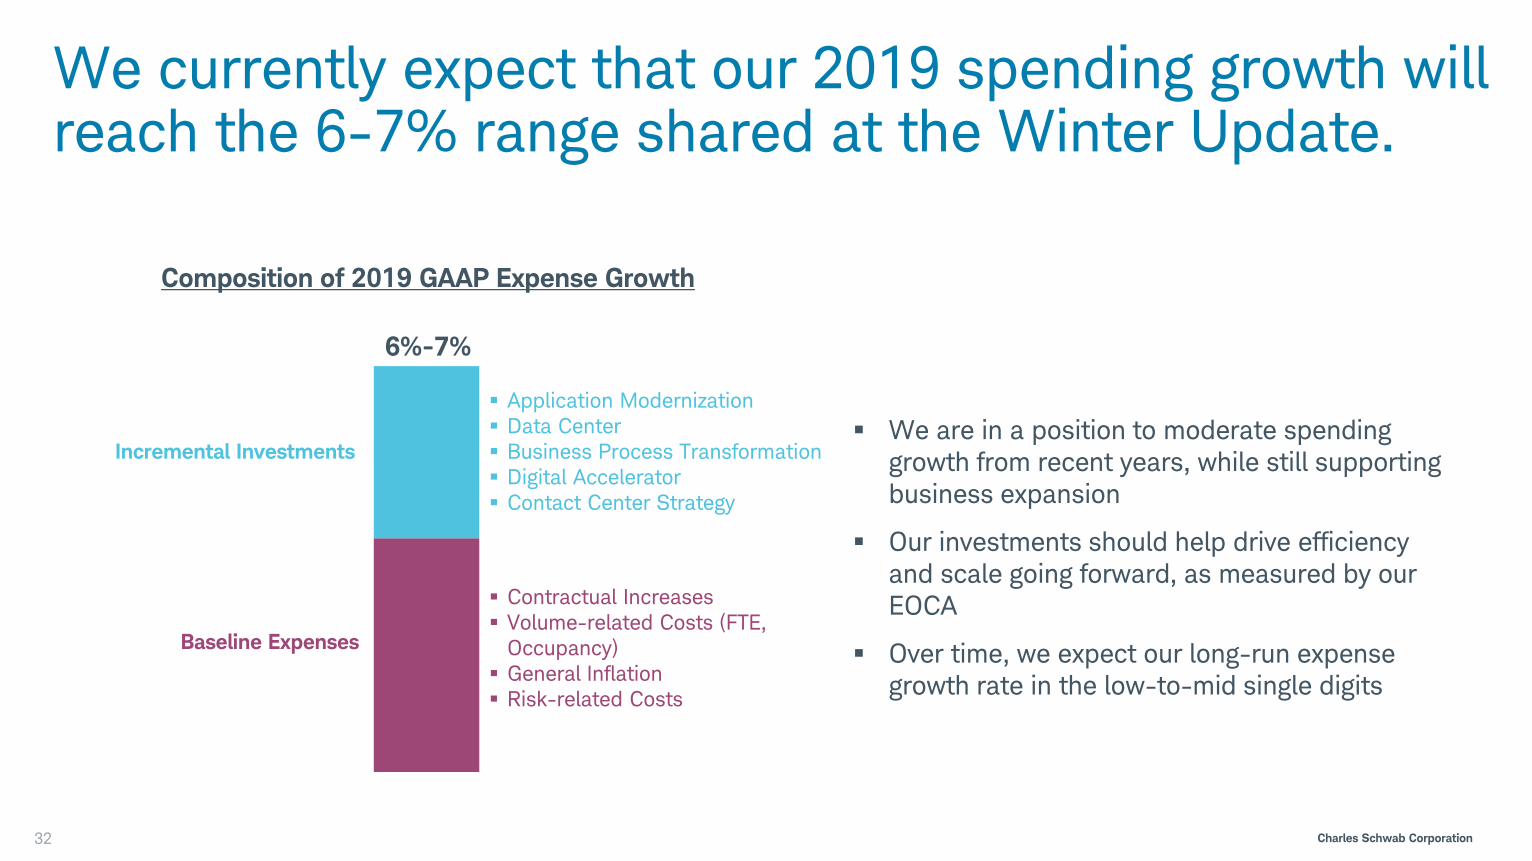
We currently expect that our 2019 spending growth will reach the 6-7% range shared at the Winter Update.
Application Modernization
Data Center
Business Process Transformation
Digital Accelerator
Contact Center Strategy
Contractual Increases
Volume-related Costs (FTE,
Occupancy)
General Inflation
Risk-related Costs
Composition of 2019 GAAP Expense Growth
Incremental Investments
Baseline Expenses
We are in a position to moderate spending
growth from recent years, while still supporting
business expansion
Our investments should help drive efficiency
and scale going forward, as measured by our
EOCA
Over time, we expect our long-run expense
growth rate in the low-to-mid single digits
6%-7%
32
Charles Schwab Corporation
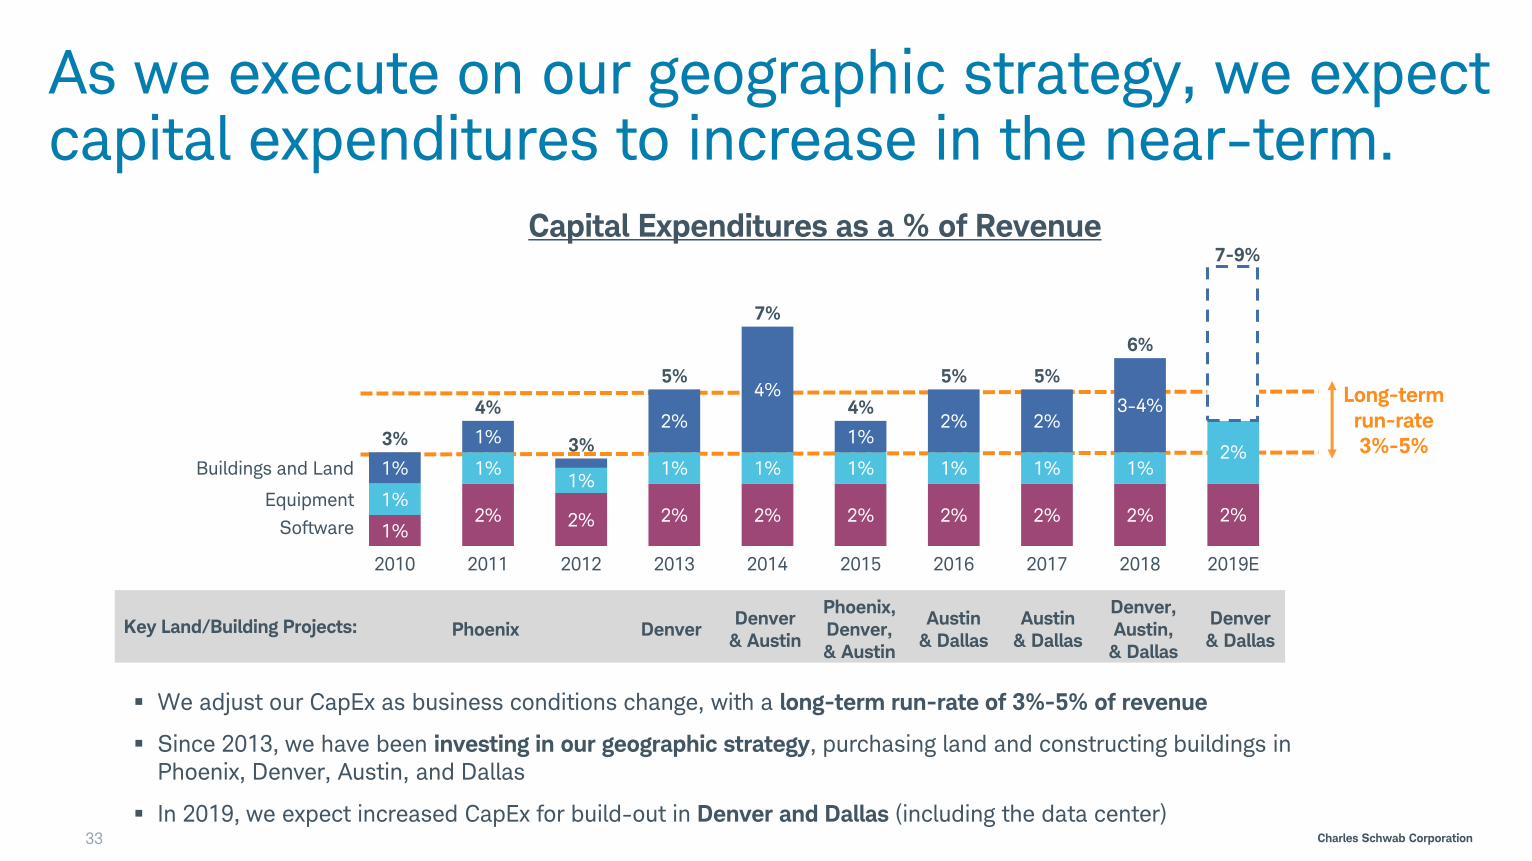
As we execute on our geographic strategy, we expect capital expenditures to increase in the near-term.
33
1%2% 2% 2% 2% 2% 2% 2% 2% 2%
1%
1%1%
1% 1% 1% 1% 1% 1%2%
1%
1%2%
4%
1%2% 2%
201520142010 2011 2012 2013 2016 2017
4% 3-4%
2018
3%
2019E
6%
Buildings and Land
Equipment
Software
5%
4%
3%
5%
7%
5%
Capital Expenditures as a % of Revenue
We adjust our CapEx as business conditions change, with a long-term run-rate of 3%-5% of revenue
Since 2013, we have been investing in our geographic strategy, purchasing land and constructing buildings in
Phoenix, Denver, Austin, and Dallas
In 2019, we expect increased CapEx for build-out in Denver and Dallas (including the data center)
Key Land/Building Projects: Phoenix DenverDenver
& Austin
Phoenix,
Denver,
& Austin
Austin
& Dallas
Austin
& Dallas
Denver,
Austin,
& Dallas
Denver
& Dallas
7-9%
Long-term
run-rate
3%-5%
Charles Schwab Corporation
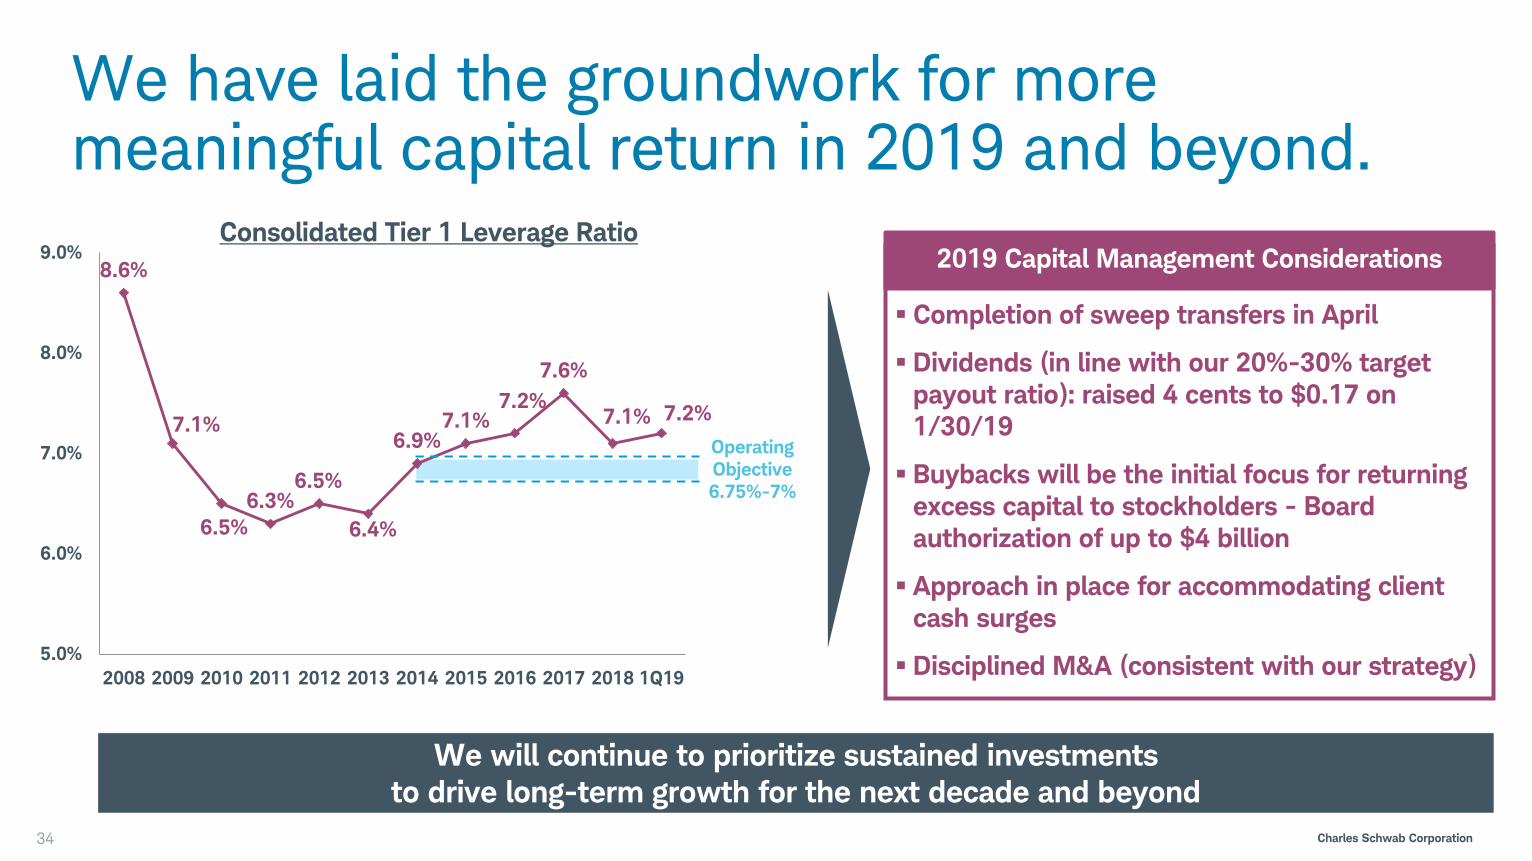
We have laid the groundwork for more meaningful capital return in 2019 and beyond.
34
We will continue to prioritize sustained investments
to drive long-term growth for the next decade and beyond
8.6%
7.1%
6.5%
6.3%6.5%
6.4%
6.9%7.1%
7.2%
7.6%
7.1%
5.0%
6.0%
7.0%
8.0%
9.0%
2008 2009 2010 2011 2012 2013 2014 2015 2016 2017 2018 1Q19
Operating
Objective
6.75%-7%
Consolidated Tier 1 Leverage Ratio
Completion of sweep transfers in April
Dividends (in line with our 20%-30% target
payout ratio): raised 4 cents to $0.17 on
1/30/19
Buybacks will be the initial focus for returning
excess capital to stockholders - Board
authorization of up to $4 billion
Approach in place for accommodating client
cash surges
Disciplined M&A (consistent with our strategy)
2019 Capital Management Considerations
7.2%
Charles Schwab Corporation35
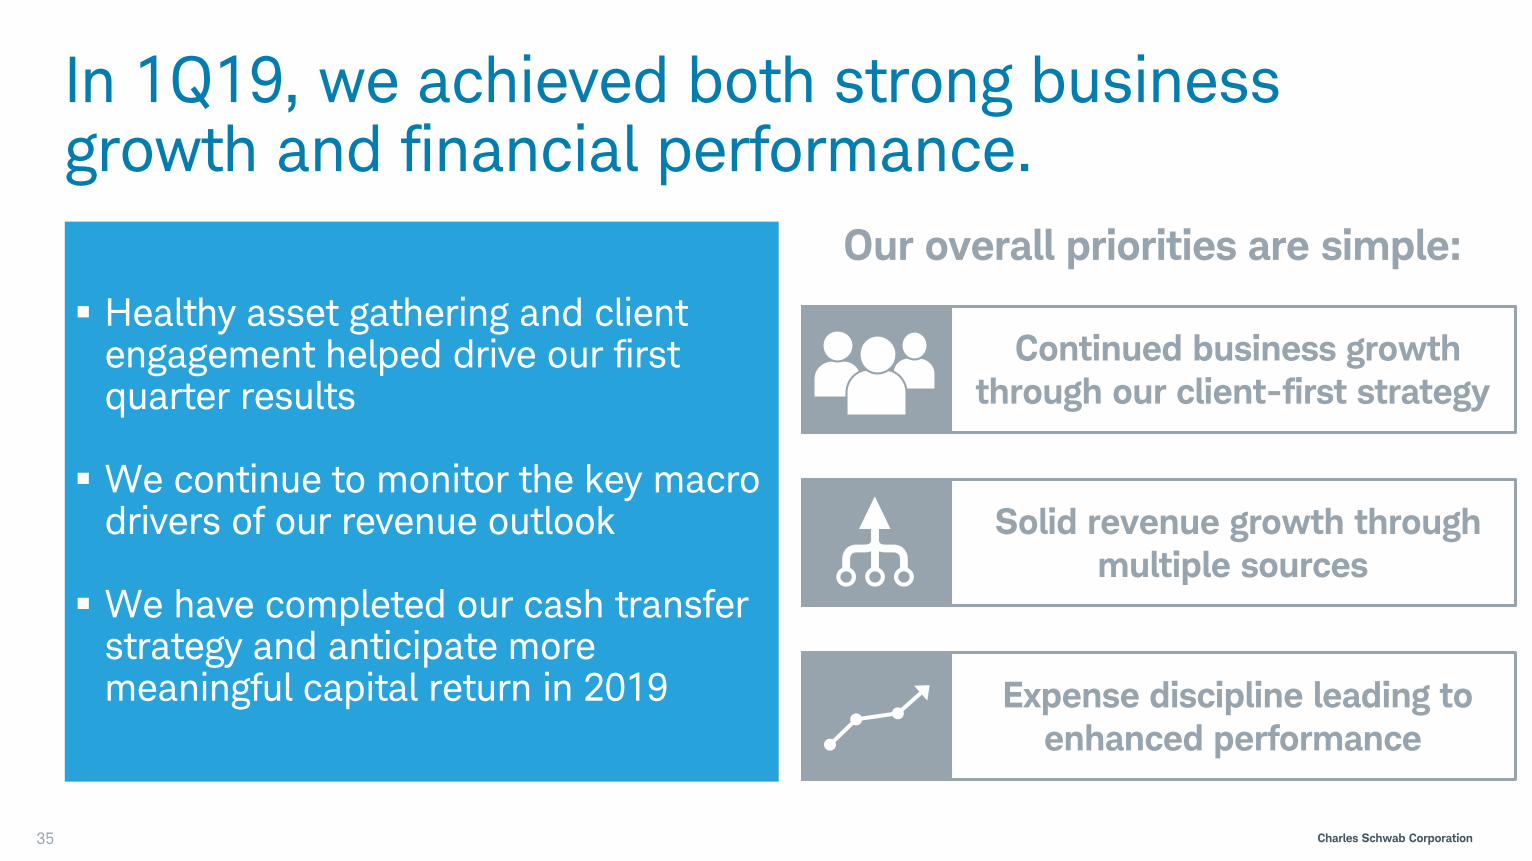
In 1Q19, we achieved both strong business growth and financial performance.
Healthy asset gathering and client engagement helped drive our first quarter results
We continue to monitor the key macro drivers of our revenue outlook
We have completed our cash transfer strategy and anticipate more meaningful capital return in 2019
Solid revenue growth through
multiple sources
Continued business growth
through our client-first strategy
Our overall priorities are simple:
Expense discipline leading to
enhanced performance
Charles Schwab Corporation
Q&A
36
SpringBusiness Update
April 26, 2019