spider patent search - new tool for mining intelligence from patent information
TRANSCRIPT

Phone: + 91-9711546163
Email: [email protected]
Ruchica Kumar
Ruchica Kumar
Intellectual Asset Management
Ideas are fruits of human endeavor that are cultivated through an innately
human process called innovation. Granting legal protection to these fruits of
innovation is jurisprudence of Intellectual Property System. While, we have
systems in place for providing these protections, we have constant need of
robust systems that can effectively and efficiently sieve through an infinite
innovation forest and pick best ideas for providing protection. Discussed
herein is a well-researched method for innovation inspection and screening.
This document presents an example from your organization as we feel that
inventors and investors are most close to their technology and can understand
new concepts with respect their technology better. We hope it is worth your
time to go through this document. We would welcome any queries in this re-
gard.
ASML—Technology Spill-over
and Citation Analysis Report
In the highly competitive world of knowledge driven economization, innovation is the key to success.
In order to supply state of the art solutions on a systems level, new technologies must be continually
mastered, even before they are required in final products. The components that result from this drive
are also products in their own right and can be used as building blocks by other system suppliers. This
concept of technology stacking often disturbs the precarious balance between innovation, development,
and commercial advantages. Often, building blocks required for product development may not be end
products for any industry but nevertheless important for overall development and success of certain
products. Often, a technology can involve more than a few of such building blocks thereby leading to
questions like commercial viability and cost benefit ratios. Often, a technology can have cross industry
applications and developers might be so focused on current need of the invention, that rest of the po-
tential can go largely ignored. All these scenarios lead to less than optimal commercialization.
Hence, there is a need for a holistic innovation map and spillover analysis before pursuing patent pro-
tection for any technology or product/process idea. This concept would also be equally applicable for
early stage technologies and cases where commercialization needs to be done based on prototypes.
The innovation index is designed to provide up-to-date information about progress in a specific tech-
nical field.
For a client who is contemplating entry into a particular field, the results of an innovation map and spill-
over analysis results may approve or disapprove the advisability of such a decision. For a client current-
ly active in a particular field, the innovation map and spill-over analysis results can lay out the path that
must be followed for optimal commercialization.
When faced with a technical problem, there is no better way of determining what solutions already exist
than by looking at patents. A State of the Art Search allows a client to learn what technology already
exists, how such a technology came about and then to build on it. An innovation map and spill-over
analysis will also allow a company to spot new competitors and to identify new technological
trends.
Also, the innovation map and spill-over analysis can go a long way in identifying potential out-licensing
opportunities for a given patent portfolio.
A theoretical example from radar electronics detailing need and importance of spill-over analysis and cross industry innovation analysis
A modern radar system utilizes an extraordinarily wide range of technologies. Robust mechanical struc-
tures are needed to house and protect the system and sophisticated management of shock, vibration
and other environmental factors is required. High precision electro-mechanical systems requiring a mar-
riage of mechanical, electrical and power electronic subsystems point and stabilize the antenna. The
antenna itself and the microwave and RF electronics that form the heart of the system require sophisti-
cated design techniques. The signal processors that extract information from the received signals are
reliant on the latest digital technologies to attain the high processing speeds required to meet ever-
increasing client requirements. Therefore, it is very much apparent that radar technology is an amal-
gamation of various technologies and heavily relies upon electromechanical systems and micro-
electromechanical systems. This observation makes any innovation study related to this technical do-
main not only an amalgamation of different technical domains like electrical, electronics, and mechani-
cal sciences, but also an amalgamation of many interdisciplinary fields like material sciences, nanotech-
nology, micro technology and bioelectronics.
Significance of Innovation Screening
Report Methodology and Index
The report presented herein, would be focused on nanotechnology portfolio of ASML. Data col-
lected for this research and analysis is obtained from public domain and analytical tools and
techniques employed by author have been developed by author through years of learning and
experimentation.
Purpose of this report is to present to you a glimpse of what a detailed innovation mapping
study can do for your organization’s licensing opportunities.
This reports includes following sections:
Search Strings used and search strategy used
Bibliographic analysis of patent portfolio under consideration
Technical field
Application year
3. Backward citation analysis of patent portfolio under consideration
Technical field
Application year
Assignee
Forward Citation analysis of patent portfolio under consideration
Technical field
Application year
Assignee
Code shift analysis in form of multiple generation forward citation analysis of patent portfo-
lio under consideration
Technical field
Assignee
Since, this is a study undertaken out of academic interest of author, therefore, technical taxon-
omies and problems every invention aims at solving are not taken as parameters for mapping.
A reader such as yourself, who has spent many years working with technologies would be able
to appreciate importance of such an exercise in licensing studies.
Forward Citation and code shift analysis provide a flow to the technology and when they are
restricted by number of years, they are converted into a potential gold mine of information as
to were a technology can be headed in a couple of years and one can consider planning ahead.
Such studies also lend credibility to a technology, in front of potential licensees. If you are
planning to buy or sell a portfolio, then a spill over study would go a long way in providing new
insights to your perspective.
If you are involved in planning research directions for your organization or are planning to raise
or invest funds in technology, then detailed spill over maps including taxonomy and problem
indexing provide assistance in terms of opportunities in a plethora of applications and also at
the same time, warm us about threats. In other words, both carrot licensing and stick licensing
approaches benefit from such studies.
Following pages of this report will now include a glimpse of knowledge spillover analysis and
innovation mapping.
Search Strings used
1. Assignee=("ALMS" OR "CYMER") AND Claim, title, Abstract =(nano*).
2. Backward citations of string 1
3. Forward Citations of string 2 restricted by application year = (2004-2014)
4. Forward Citations of string 1
5. Forward Citations of string 4
6. Backward Citations of string 4 restricted by application year = (2004-2014)
Some analytical visualizations are presented herein for your reference regarding results.
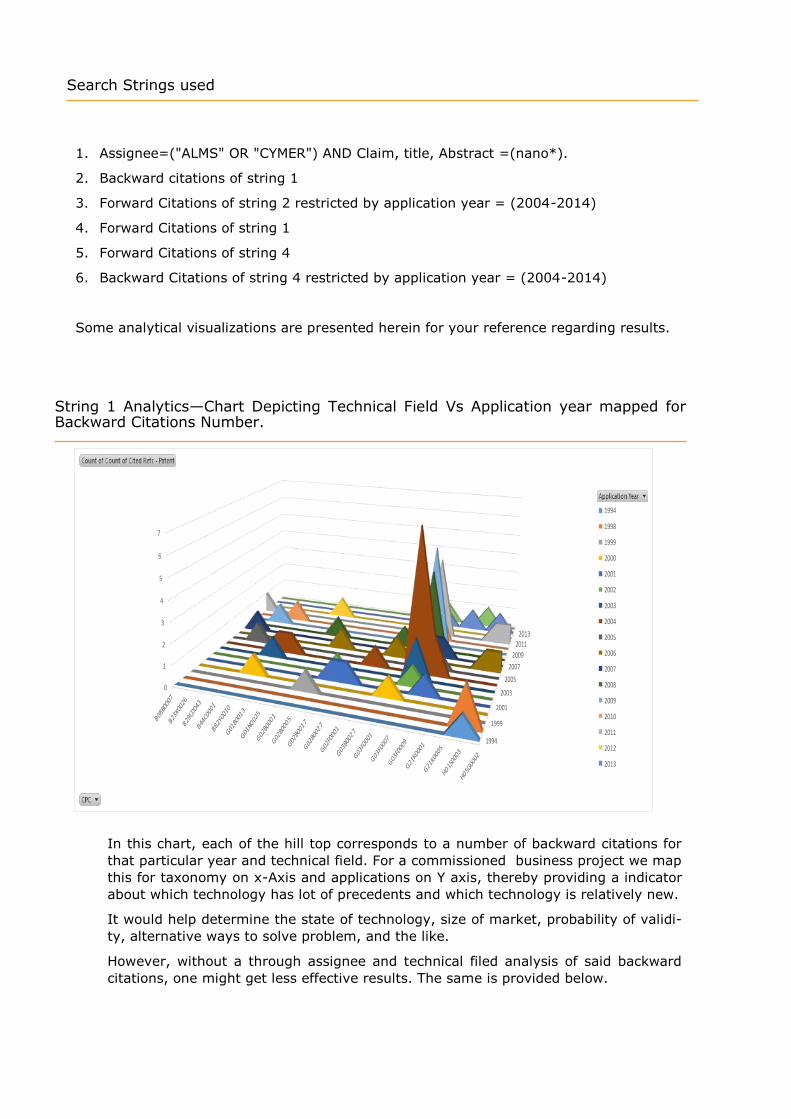
String 1 Analytics—Chart Depicting Technical Field Vs Application year mapped for Backward Citations Number.
1994
1999
2001
2003
2005
2007
2009
20112013
0
1
2
3
4
5
6
7
1994
1998
1999
2000
2001
2002
2003
2004
2005
2006
2007
2008
2009
2010
2011
2012
2013
In this chart, each of the hill top corresponds to a number of backward citations for
that particular year and technical field. For a commissioned business project we map
this for taxonomy on x-Axis and applications on Y axis, thereby providing a indicator
about which technology has lot of precedents and which technology is relatively new.
It would help determine the state of technology, size of market, probability of validi-
ty, alternative ways to solve problem, and the like.
However, without a through assignee and technical filed analysis of said backward
citations, one might get less effective results. The same is provided below.
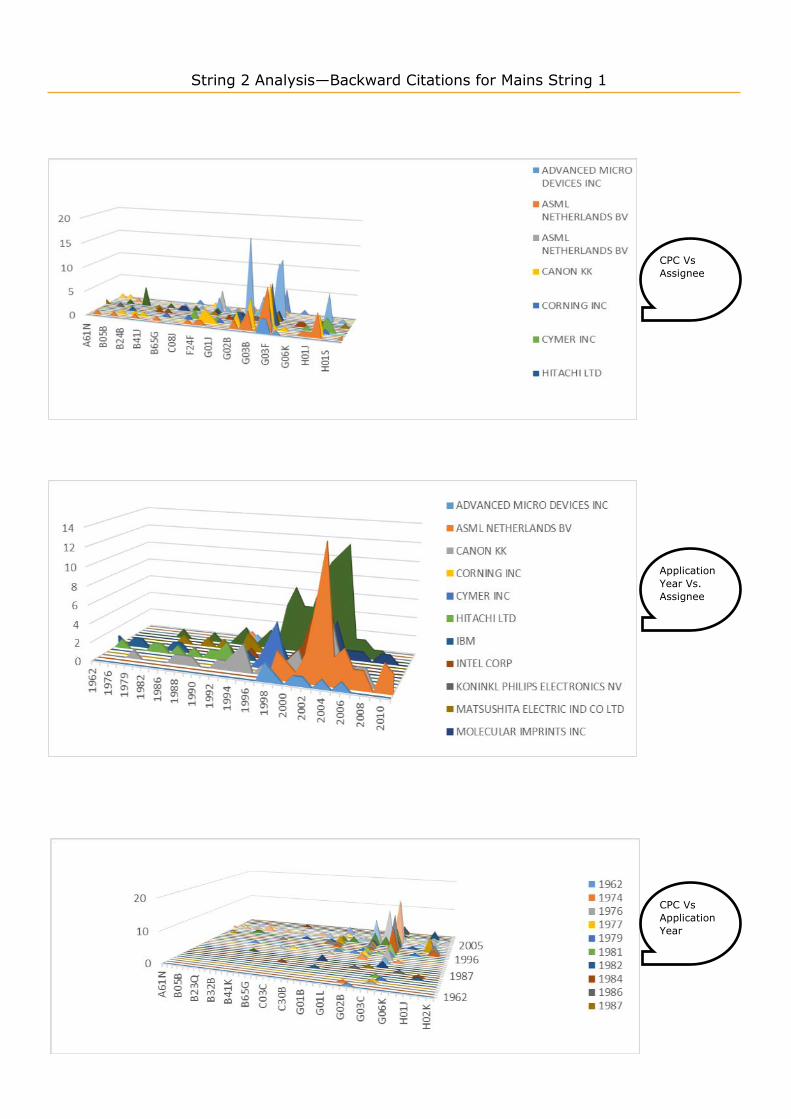
String 2 Analysis—Backward Citations for Mains String 1
CPC Vs
Assignee
CPC Vs
Application
Year
Application
Year Vs.
Assignee

This chart presents summarises backward Citation activity for patent port-
folio under consideration. Author choose to study citation activity till 1995
for maintain credibility of the technology flow.
This diagram presents an easily comprehensible view of what a particular competitor or corporation had been doing
in which technical domain in which year.
In this case also, value derived can be increased many fold if instead of patent classification codes, one uses , ones
own technology breakdown structure.
String 3 Analysis—Forward Citations of Backward Citations for Mains String 1
0 5 10 15 20 25
Active Optical Networks Inc.,Fremont,CA,US
ASML Masktools B.V.,Veldhoven,NL
CAMPUS CREATE CO LTD
FUJITSU LIMITED
IDC LLC,San Francisco,CA,US
LEICA MICROSYSTEMS SEMICONDUCTOR GMBH,Wetzlar,DE
NEC ELECTRONICS CORP
PRIME VIEW INTERNATIONAL CO. LTD.
Synopsys Inc.,Mountain View,CA,US
TOKYO ELECTRON LIMITED,JP
Varian Medical Systems Technologies Inc.,Palo Alto,CA,US
CANNON KABUSHIKI KAISHA,Tokyo,JP
FUJI PHOTO FILM CO LTD
JSR CORP
MATSUSHITA ELECTRIC IND CO LTD
SAMSUNG ELECTRONICS CO. LTD.
AGELLIS GROUP AB,LUND,SE
Carl Zeiss SMT AG,73447 Oberkochen,DE,07600450
Lam Research Corp.,Fremont,CA,US
NIKON CORPORATION,TOKYO,JP
UNIDYM INC.,Pasadena,CA,US
Carl Zeiss SMT AG,Oberkochen,DE
MOLECULAR IMPRINTS INC.,Austin,TX,US
ASML NETHERLANDS B.V.,Veldhoven,NL
FREESCALE SEMICONDUCTOR INC.,US
TOSHIBA MACH CO LTD
ASML NETHERLANDS B.V.,NL
GIGAPHOTON INC.,Tokyo,JP2
00
42
00
52
00
62
00
72
00
82
00
92
01
0
2 0 1 1
H05G0002
H04J0014
H03K0019
H03K0017
H02H0009
H01S0005
H01S0003
H01P0001
H01L0029
H01L0027
H01L0023
H01L0021
H01J0049
H01J0037
H01H0059
H01B0001
G21K0005
G21K0001
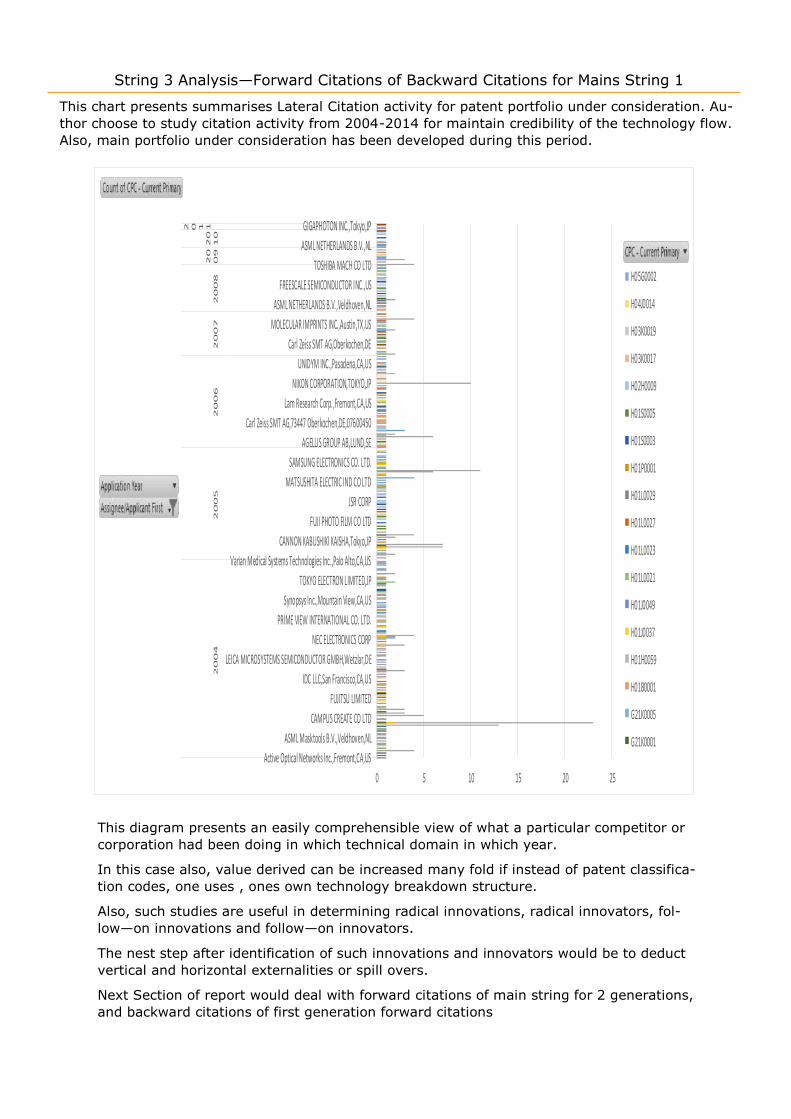
This chart presents summarises Lateral Citation activity for patent portfolio under consideration. Au-
thor choose to study citation activity from 2004-2014 for maintain credibility of the technology flow.
Also, main portfolio under consideration has been developed during this period.
This diagram presents an easily comprehensible view of what a particular competitor or
corporation had been doing in which technical domain in which year.
In this case also, value derived can be increased many fold if instead of patent classifica-
tion codes, one uses , ones own technology breakdown structure.
Also, such studies are useful in determining radical innovations, radical innovators, fol-
low—on innovations and follow—on innovators.
The nest step after identification of such innovations and innovators would be to deduct
vertical and horizontal externalities or spill overs.
Next Section of report would deal with forward citations of main string for 2 generations,
and backward citations of first generation forward citations
String 4 Analysis—Forward Citations Mains String 1
0
5
10
15
20
25
H05G0002
H01S0003
H01L0021
H01J0037
G11B0007
G11B0005
G06F0017
G05B0019
G03F0009
G03F0007
G03F0001
G03B0027
G02F0001
G02B0027
G02B0019
G02B0017
G02B0013
0
1
2
3
4
5
6
7
8
9
10
2000
2001
2002
2003
2004
2005
2006
2007
2008
2009
2010
2011
2012
2013
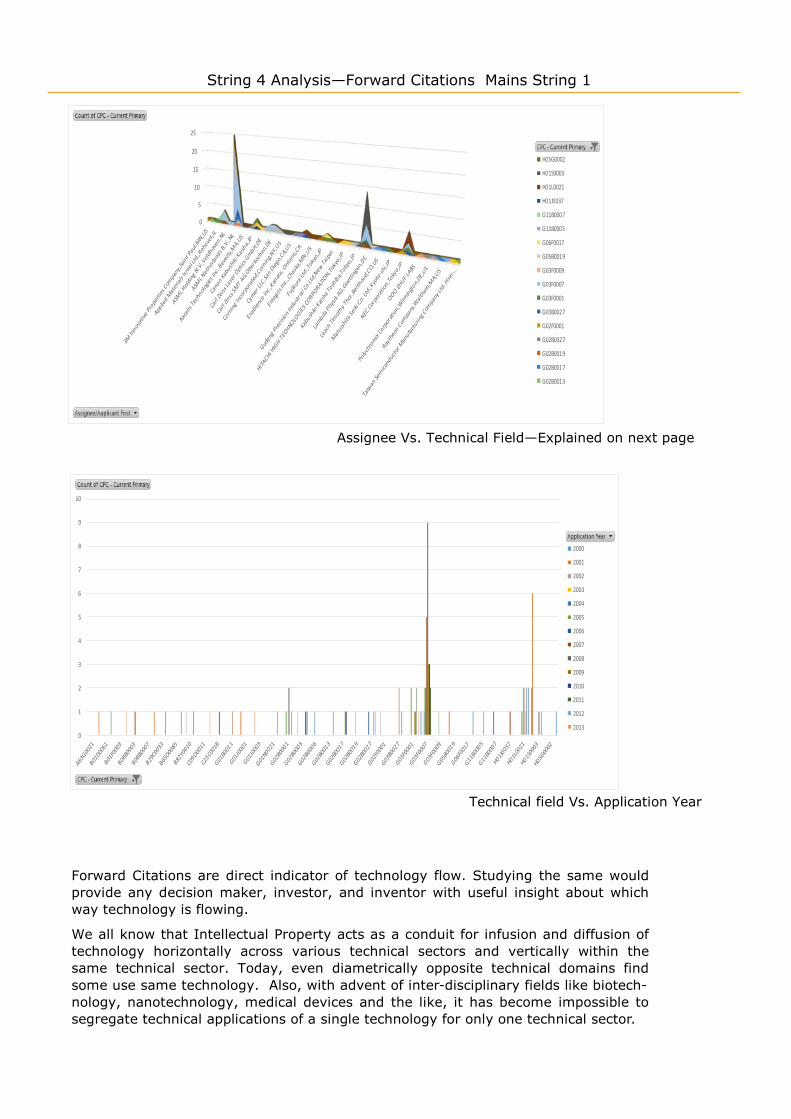
Forward Citations are direct indicator of technology flow. Studying the same would
provide any decision maker, investor, and inventor with useful insight about which
way technology is flowing.
We all know that Intellectual Property acts as a conduit for infusion and diffusion of
technology horizontally across various technical sectors and vertically within the
same technical sector. Today, even diametrically opposite technical domains find
some use same technology. Also, with advent of inter-disciplinary fields like biotech-
nology, nanotechnology, medical devices and the like, it has become impossible to
segregate technical applications of a single technology for only one technical sector.
Assignee Vs. Technical Field—Explained on next page
Technical field Vs. Application Year
2000
2003
2006
20092012
0123456789
3M
In
no
va
tive
Pro
pe
rtie
s C
om
pa
ny
,Sa
int…
3M
In
no
va
tive
Pro
pe
rtie
s C
om
pa
ny
,St.
…A
pp
lie
d M
ate
ria
ls I
sra
el Ltd
.,R
eh
ovo
t,IL
Asah
i G
lass C
om
pa
ny L
imit
ed
,To
ky
o,J
PA
SM
L H
old
ing
N.V
.,V
eld
ho
ve
n,N
LA
SM
L M
eth
erl
an
ds B
.V.,
Ve
ldh
ove
n,N
LA
SM
L N
eth
erl
an
ds
B.V
.,N
LA
SM
L N
eth
erl
an
ds
B.V
.,V
eld
ho
ve
n,N
LA
xce
lis
Te
ch
no
log
ies I
nc.,
Be
ve
rly,M
A,U
SB
roo
ks A
uto
ma
tio
n In
c.,
Ch
elm
sfo
rd
,MA
,US
Ca
no
n K
ab
ush
iki K
ais
ha
,JP
Ca
no
n K
ab
ush
iki K
ais
ha
,To
ky
o,J
PC
arl
Ze
iss L
ase
r O
pti
cs
Gm
bH
,DE
CA
RL Z
EIS
S S
MT A
G,D
EC
arl
Ze
iss S
MT
AG
,Ob
erko
ch
en
,DE
Ca
rl Z
eis
s S
MT
Gm
bH
,Ob
erk
och
en
,DE
Co
rnin
g I
nco
rp
ora
ted
,Co
rnin
g,N
Y,U
SC
ym
er In
c.,
Sa
n D
ieg
o,C
A,U
SC
ym
er L
LC
,Sa
n D
ieg
o,C
A,U
SE
ast
ma
n K
od
ak
Co
mp
an
y,R
och
est
er,N
Y,U
SE
na
ble
nce
In
c.,
Kan
ata
, O
nta
rio
,CA
En
teg
ris
Inc
.,B
ille
ric
a,M
A,U
S
En
teg
ris
Inc
.,C
ha
ska
,MN
,US
FU
JIF
ILM
CO
RP
OR
AT
ION
,JP
Fu
jik
ura
Ltd
.,T
ok
yo
,JP
GLO
BA
LF
OU
ND
RIE
S I
nc.,
Gra
nd
Cay
ma
n,K
Y
Gu
de
ng
Pre
cis
ion
In
du
stria
l C
o L
td,N
ew
…
Gu
de
ng
Pre
cis
ion
In
du
stria
l C
o L
td,T
aip
ei…
HIT
AC
HI
HIG
H-T
EC
HN
OLO
GIE
S…
Ho
rib
a J
ob
in Y
vo
n S
AS,L
on
gju
me
au
,FR
Ka
bu
shik
i K
ais
ha
To
shib
a,T
okyo
,JP
KO
NIN
KLIJ
KE
PH
ILIP
S N
.V.,
NL
La
mb
da
Ph
ysik
AG
,Go
ett
ing
en
,DE
La
md
a P
hysik
AG
,Go
ett
ing
en
,DE
Le
ach
Tim
oth
y T
ho
r,B
ert
ho
ud
,CO
,US
MA
TH
ES
ON
TR
I-G
AS I
NC
.,U
S
Ma
tsu
sh
ita
Se
iki C
o.
Ltd
.,K
yo
to-s
hi,
JP
Mir
aia
l C
o. Ltd
.,JP
NE
C C
orp
ora
tio
n,T
oky
o,J
P
Nik
on
Co
rpo
rati
on
,To
kyo
,JP
OO
O E
HU
F L
AB
S
Op
toTrace
(Su
Zh
ou
) Te
ch
no
log
ies…
Po
lych
rom
ix C
orp
orati
on
,Wil
min
gto
n,D
E,U
S
RA
SIR
C,U
S
Ray
the
on
Co
mp
an
y,W
alt
ha
m,M
A,U
S
Sea
ga
te T
ech
no
log
y L
LC
,Cu
pe
rtin
o,C
A,U
S
Ta
iwa
n S
em
ico
nd
ucto
r M
an
ufa
ctu
rin
g…
To
ray
In
du
str
ies In
c,T
oky
o,J
P
2000
2001
2002
2003
2004
2005
2006
2007
2008
2009
2010
2011
2012
2013
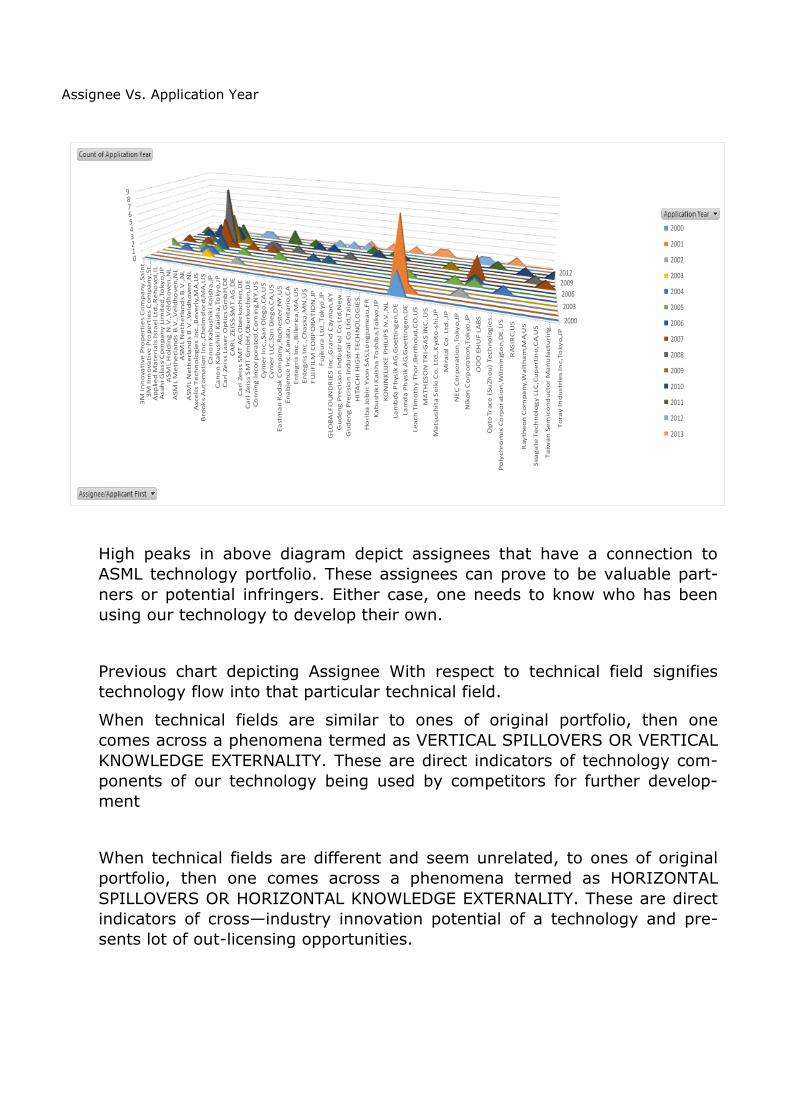
Assignee Vs. Application Year
High peaks in above diagram depict assignees that have a connection to
ASML technology portfolio. These assignees can prove to be valuable part-
ners or potential infringers. Either case, one needs to know who has been
using our technology to develop their own.
Previous chart depicting Assignee With respect to technical field signifies
technology flow into that particular technical field.
When technical fields are similar to ones of original portfolio, then one
comes across a phenomena termed as VERTICAL SPILLOVERS OR VERTICAL
KNOWLEDGE EXTERNALITY. These are direct indicators of technology com-
ponents of our technology being used by competitors for further develop-
ment
When technical fields are different and seem unrelated, to ones of original
portfolio, then one comes across a phenomena termed as HORIZONTAL
SPILLOVERS OR HORIZONTAL KNOWLEDGE EXTERNALITY. These are direct
indicators of cross—industry innovation potential of a technology and pre-
sents lot of out-licensing opportunities.
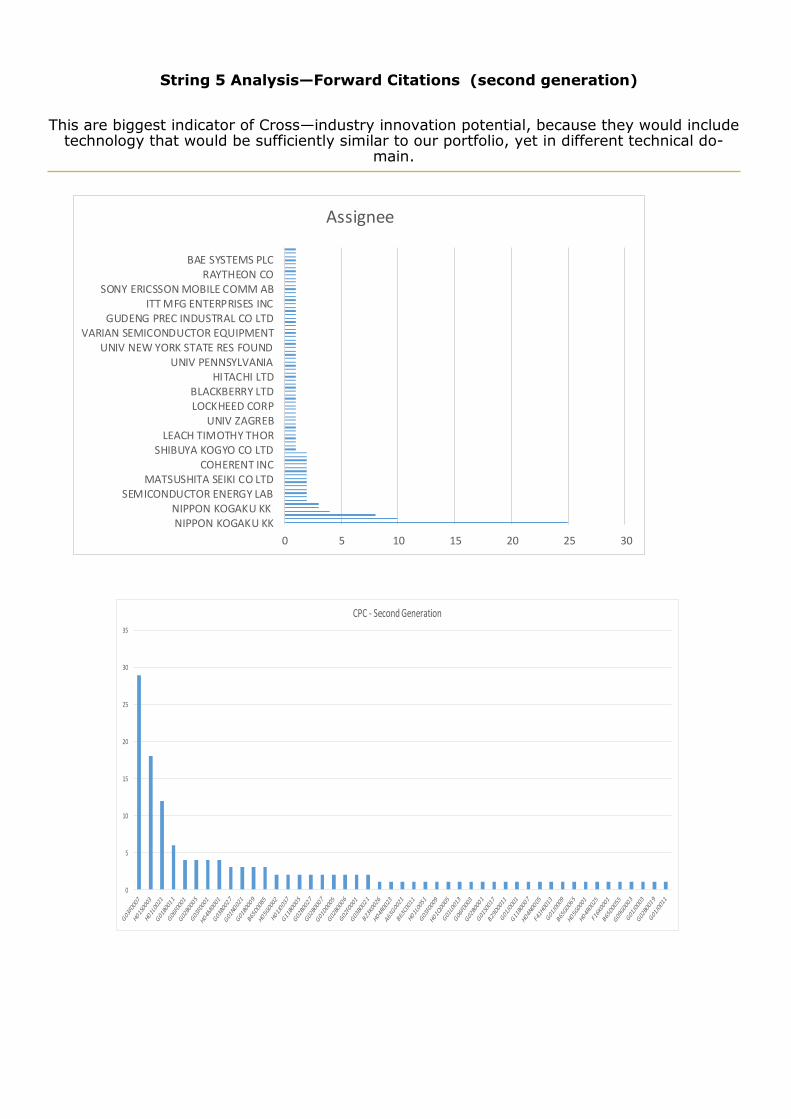
String 5 Analysis—Forward Citations (second generation)
This are biggest indicator of Cross—industry innovation potential, because they would include technology that would be sufficiently similar to our portfolio, yet in different technical do-
main.
0 5 10 15 20 25 30
NIPPON KOGAKU KKNIPPON KOGAKU KK
SEMICONDUCTOR ENERGY LABMATSUSHITA SEIKI CO LTD
COHERENT INCSHIBUYA KOGYO CO LTD
LEACH TIMOTHY THORUNIV ZAGREB
LOCKHEED CORPBLACKBERRY LTD
HITACHI LTDUNIV PENNSYLVANIA
UNIV NEW YORK STATE RES FOUNDVARIAN SEMICONDUCTOR EQUIPMENT
GUDENG PREC INDUSTRAL CO LTDITT MFG ENTERPRISES INC
SONY ERICSSON MOBILE COMM ABRAYTHEON CO
BAE SYSTEMS PLC
Assignee
0
5
10
15
20
25
30
35
CPC - Second Generation
0 1 2 3 4 5 6 7 8
COHERENT INC
BOEING CO
CASIO COMPUTER CO LTD
SEMICONDUCTOR ENERGY LAB
MATSUSHITA ELECTRIC IND CO LTD
METROSOL INC
BLACKBERRY LTD
NIPPON KOGAKU KK
ASML NETHERLANDS BV
NEWPORT CORP
VARIAN SEMICONDUCTOR EQUIPMENT
ASML NETHERLANDS BV
NIPPON KOGAKU KK
MIRAIAL CO LTD
3M INNOVATIVE PROPERTIES CO
SEMICONDUCTOR ENERGY LAB
GUDENG PREC IND CO LTD
LG DISPLAY CO LTD
COHERENT GMBH
SAMSUNG ELECTRONICS CO LTD
EASTMAN KODAK CO
IPG MICROSYSTEMS LLC
ELECTION ADMINISTRATORS LLC
ENTEGRIS INC
3M INNOVATIVE PROPERTIES CO
HITACHI HIGH TECH CORP
SHIBUYA KOGYO CO LTD
SEAGATE TECHNOLOGY LLC
2 0 0 1
2 0 0 22
00
32
00
42
00
52
00
62
00
72
00
82
00
92
01
02
01
12
01
22
01
32
01
4
H05G0002
H05G0001
H04R0025
H04R0023
H04N0005
H04M0001
H01S0003
H01Q0005
H01L0051
H01L0021
H01J0037
G11B0007
G11B0005
G09G0003
G06F0003
G06F0001
G03F0009
G03F0007
G03F0001
G03B0027
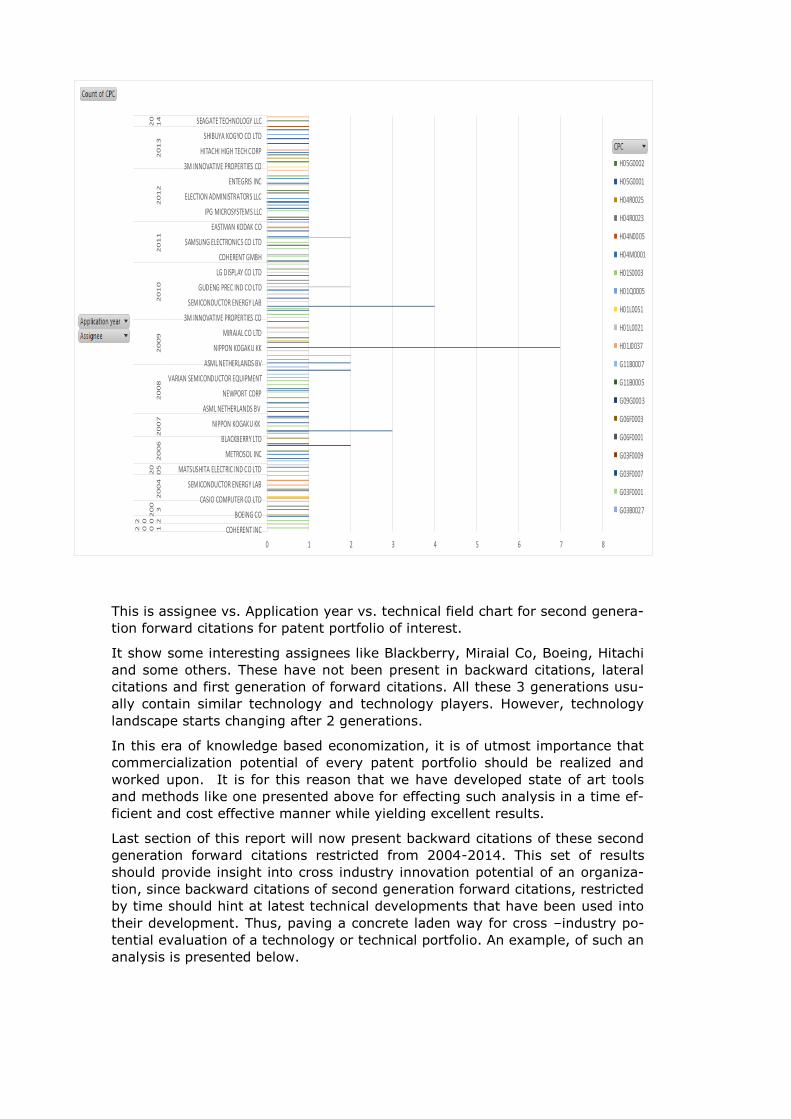
This is assignee vs. Application year vs. technical field chart for second genera-
tion forward citations for patent portfolio of interest.
It show some interesting assignees like Blackberry, Miraial Co, Boeing, Hitachi
and some others. These have not been present in backward citations, lateral
citations and first generation of forward citations. All these 3 generations usu-
ally contain similar technology and technology players. However, technology
landscape starts changing after 2 generations.
In this era of knowledge based economization, it is of utmost importance that
commercialization potential of every patent portfolio should be realized and
worked upon. It is for this reason that we have developed state of art tools
and methods like one presented above for effecting such analysis in a time ef-
ficient and cost effective manner while yielding excellent results.
Last section of this report will now present backward citations of these second
generation forward citations restricted from 2004-2014. This set of results
should provide insight into cross industry innovation potential of an organiza-
tion, since backward citations of second generation forward citations, restricted
by time should hint at latest technical developments that have been used into
their development. Thus, paving a concrete laden way for cross –industry po-
tential evaluation of a technology or technical portfolio. An example, of such an
analysis is presented below.

String 6 Analysis—Backward citations of Second Generation Forward Citations (second generation)
This chart would provide basis for both vertical and horizontal spill-overs. Just by varying assign-
ees and selecting competitors, we would be able to study technology development vertically. By
selecting technical areas, different from our own, we can find out horizontal or cross –industry
prospects.
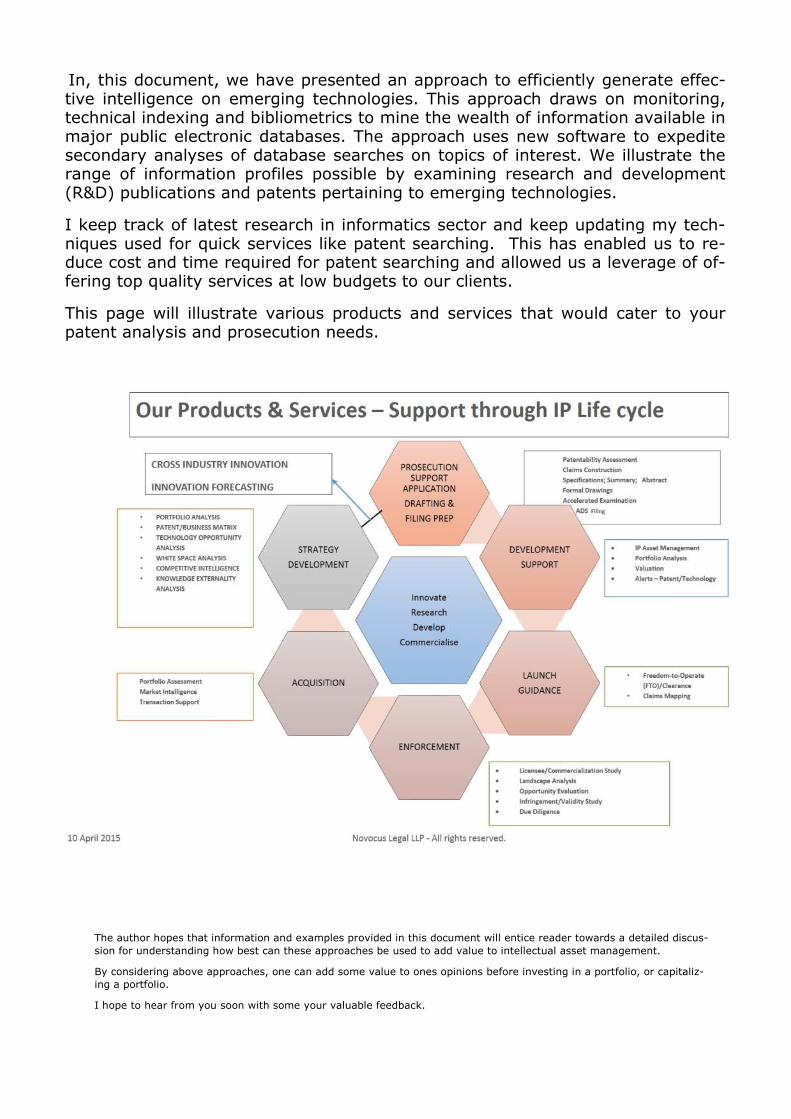
In, this document, we have presented an approach to efficiently generate effec-tive intelligence on emerging technologies. This approach draws on monitoring, technical indexing and bibliometrics to mine the wealth of information available in major public electronic databases. The approach uses new software to expedite secondary analyses of database searches on topics of interest. We illustrate the range of information profiles possible by examining research and development (R&D) publications and patents pertaining to emerging technologies.
I keep track of latest research in informatics sector and keep updating my tech-niques used for quick services like patent searching. This has enabled us to re-duce cost and time required for patent searching and allowed us a leverage of of-fering top quality services at low budgets to our clients.
This page will illustrate various products and services that would cater to your patent analysis and prosecution needs.
The author hopes that information and examples provided in this document will entice reader towards a detailed discus-
sion for understanding how best can these approaches be used to add value to intellectual asset management.
By considering above approaches, one can add some value to ones opinions before investing in a portfolio, or capitaliz-
ing a portfolio.
I hope to hear from you soon with some your valuable feedback.

Disclaimer:
This report was not prepared as an account of work sponsored by any agency. Neither the author nor any agency
thereof, nor any of their employees, nor any of their contractors, subcontractors or their employees, makes any war-
ranty, express or implied, or assumes any legal liability or responsibility for the accuracy, completeness, or any third
party's use or the results of such use of any information, apparatus, product, or process disclosed, or represents that
its use would not infringe privately owned rights. Reference herein to any specific commercial product, process, or
service by trade name, trademark, manufacturer, or otherwise, does not necessarily constitute or imply its endorse-
ment, recommendation, or favoring by the author or any agency thereof or its contractors or subcontractors. The views
and opinions of author expressed herein do not necessarily state or reflect any factual or strategic inference. This re-
port is for reference and illustration purpose only and should not be used for commercial purposes.