speed and altitude effects on wireless air pollution
TRANSCRIPT

PS-FTSM-2020-031
SPEED AND ALTITUDE EFFECTS ON WIRELESS AIR
POLLUTION MEASUREMENT USING HEXACOPTER
DRONE
Rami Noori Hasan, Dahlila Putri Dahnil
FACULTY OF INFORMATION SCIENCE AND TECHNOLOGY
UNIVERSITI KEBANGSAAN MALAYSIA
43600 UKM Bangi, Selangor Malaysia.
Email: [email protected], [email protected]
ABSTRACT
Air pollution has a significant impact on human beings, the "Global Burden of Disease" study
identified air pollution as one of the top 10 risks facing living organisms.If the percentage of any gas
crosses its normal limit in air, it could be dangerous for any life in this planet; any substance present
in air that may be dangerous to people and the environment is referred to as an air pollutant. However
the traditional air contamination monitoring systems (ACMS) although exhibits high accuracy and
long-range detection but still have drawbacks in their "low spatial-temporal resolution ". The
development of using static low-cost sensors for monitoring air pollution even with their ability to
cover the drawbacks of (ACMS) in "temporal resolution" but still have "low spatial resolution", by
exploiting their small-size and light-weight the researchers tried to deploying them by ground
mobility objects but that had effect on "temporal resolution" also with limitations in accessing many
areas, all that lead to their failure in collecting data comparing to ACMS. However, with the new
evolution of UAVs and the possibility to design low-cost and affordable UAVs, it became available to
cover the drawbacks of low spatial-temporal resolution. Despite that, there are new challenges that
emerged with using UAV, especially the effect of wind-generated from UAV propellers rotation on
the capability to sense and measure gas concentration. In this study, we present a mobility-wireless air
pollution system comprised of wireless air pollution system based on low-cost sensors and mobility
flying-objects by developing an affordable and open-source UAV, to override the drawbacks of static
and ground low-cost systems in their low spatial-temporal resolution. Also, we evaluate the effect of
changing altitude and the propellers' rotation speed on our proposed system capability to sense and
measure combustible-pollution gases and smoke. The results showed that Our system proved to be
effective in measuring combustible pollution gases and smoke in vertical deploying, in both hovering
and flying mode, without any effect from changing speed or altitude on its performance. While in
horizontal mode the system showed the impact of changing speed on its capability for measuring and
sensing gas and smoke concentration at high speeds. While at speeds less than or equal to 6 m/s the
system showed its ability to measure and sense combustible-pollution gases and smoke
Keyword: UAVs, air pollution, traditional monitoring systems, Low-cost sensors, environmental
monitoring
I. INTRODUCTION
Copyri
ght@
FTSM

PS-FTSM-2020-031
The continuous changes in ambient air that is associated with both natural and anthropogenic
emissions (such as aerosols or gaseous pollutants) has significant effect on air quality and
consequently on human health. These consequences of poor air quality on human health have been
clearly mentioned by Villa et al. (2016) . Air pollution also has significant effect on agriculture yields,
snowfall, visibility, ground level sunshine intensity, and atmospheric pressure.
The significant impact of air pollution globally has been recently evidenced in a study on the
“Global Burden of Disease”; the study identified air pollution as one of the top 10 risks facing human
beings. Many cities have consistently violated the recommended concentration ranges of air pollutants
as the reported concentrations measured in many cities far exceed the recommended ranges and the
direct implication of this violation is several air pollutant-related premature deaths (Kumar et al.
2015).
The persistent increase in the concentration of dangerous air pollutant in the environment is
directly related to the massive growth of urbanization, as well as the increasing number of polluting
factories & industrial cities; it is also attributed to the lack of standards and legislation for effective air
pollutants control. For instance, one of the most hazardous air pollutants that causes severe health
problems is carbon monoxide (CO). More than 400 CO-related deaths have been reported in the US
yearly (Evangelatos & Rolim 2015). CO, also called the “silent killer” owing to its odorless, colorless
and tasteless properties (Wijaya et al. 2017). More than 500 cases of accidents related to LPG gas
leakage was also reported in Jordan in 2007, causing 15 deaths & 398 CO-related injuries in a country
of 5 million people. The number of accidents was also reported to be increasing yearly (Fraiwan et al.
2011). Hydrogen gas is an extremely flammable gas, with a flammable range of 4–75 %. Owing to its
low molecular weight, hydrogen is the lightest element that ever exists, with a strong permeability rate
and a high tendency to leak (Li et al. 2014 ; Freddi et al. 2019) High concentrations of hydrogen in
any environment can cause an oxygen-deficient environment.
One of the most common phenomena associated to air contamination is haze which happens
almost every year within the past decades in Southeast Asia (SEA), including Malaysia. Haze happens
when a high level of suspended dust in the air disperses noticeable light and that outcomes in a
quantifiable decrease in visual range. The most contributing factors to haze is high density
combustions which can happen due to Slash and burning of agricultural farms, as well as burning of
oil palm ranches on peat zones, especially in Kalimantan & Sumatra, Indonesia which results in a
high level of trans-boundary haze in Malaysia (Latif et al. 2018).
According to Montgomery et al. (2015), Malaysian economic loss was around 4,471
USD per haze day because of loss of productive hours based on patient’s average wages
without mentioning the health-care wages, which according to the projected cost stream in
next 20 years, will be from 1 million USD to 1.6 million USD per year. However at present, air contamination concentricity is gathered by both government and
environmental experts utilizing systems of fixed observing stations, equipped with instruments
particular for estimating various pollutants (Kumar et al. 2015). The disadvantages of the traditional
air contamination monitoring systems (ACMS) are in terms of their size, weight, and cost. These
drawbacks necessitate the wide deployment of air monitoring stations to be efficient (Bolla et al.
2018). The monitoring stations may not be able to cover all the locations, hence, there are several un-
monitored locations and the information about air pollution ought to be estimated (Yi et al. 2015).
Furthermore, the analysis of the data and its deployment in conventional ACMS is too slow
(Bolla et al. 2018). So, high special-temporal resolution with a real-time system is fundamental
because of the restricted information accessibility and non-versatility of the traditional ACMS (Yi et
al. 2015). Low-cost sensors changes the traditional way of measuring air pollutants (Kumar et al.
2015); they can be used with higher special & temporal resolutions (Bolla et al. 2018). Their high
mobility can fill the hole between the traditional observing tools and the air quality measurement
models, especially in the areas without observing stations where the data about pollution is achieved
via air quality modeling or predictions (Yi et al. 2015). However, the detecting range of the low-cost
sensors is much lower than the traditional observing tools due to the direct interaction of the sensor
surface with a small volume of the chemical compounds. Hence, a stationary sensor network is not
applicable in many cases from both economical and deployment-related perspectives (Rossi&Brunelli
Copyri
ght@
FTSM
PS-FTSM-2020-031
2015).as a result, specialists have been trying to utilize mobile objects in both ground and air (Alvear
et al. 2017).
Usually, the ground access is hindered and loaded with obstacles (Dunbabin & Marques
2012); for instance, in industrial and rural areas, sensing usually fails to give enough information to
acquire sensible measurements with the required granularity level (Alvear et al. 2017); these concerns
necessitates the use of UAVs to monitor such areas (Dunbabin & Marques 2012). Furthermore, most
of the current studies on air pollution concentration are made at ground level; the air pollution
concentration should be determined at varying heights in order to determine the levels of pollutants
that are harmful to human health (Alvear et al. 2017).
Due to the limitations of UAVs in terms of payload, power consumption, and stability, along
with the limitations of low-cost sensors in terms of power consumption and detect method, it is not all
the low-cost sensors that are suitable to work with UAV (Bolla et al. 2018). Similarly, the data
acquired with low-cost sensors must be critically evaluated due to their heavy dependent on numerous
factors, such as temperature, humidity, and wind, especially the impact of wind generated by the
movement of the rotors (Bolla et al. 2018).
In this study, taking into account the limitations and suggestions of previous studies, we
present a low-cost and obtainable mobility-wireless air pollution system comprised of wireless air
pollution systems based on low-cost sensors and mobility flying-objects by developing an affordable
and open-source UAV, to override the drawbacks of static and ground low-cost systems in their low
spatial-temporal resolution. Also, we evaluate the effect of changing the propellers rotation speed and
the wind-generated from that on our proposed system capability to sense and measure combustible-
pollution gases and smoke.
This paper consists of five (6) sections. Section I discuss the background of this study
including the issues and problems of traditional ACMS. Section II reviewed the evolution of
using low-cost sensors in the air pollution monitoring system, by reviewed the previous
studies and systems proposed using low-cost sensors and the endeavor to diffuse them by
utilizing mobility objects in both ground and air. Section III describing the research design and
all the steps taken to achieve the research objectives. Section IV describes the experiments on
the proposed mobility-air pollution system. Section V presents the results of these
experiments and discussing them. Lastly, section VI concludes the paper with a summary of the
findings and recommended future work.
LITERATURE REVIEW A. Low-Cost Sensors in Monitoring Air-pollution
The modern development in the sensor field, wireless communication technology, and digital
electronics has necessitated the need for new air pollution monitoring models that will be efficient in
gathering high special & temporal resolution air pollution data using a network of low-cost sensors for
real-time monitoring of different concentrations of air pollutants for use in different air pollution
management tasks (Rai et al. 2017). Such sensors can offer real-time cost-efficient measurements,
thereby allowing better spatial monitoring compared to the existing reference air pollutant monitoring
techniques. Furthermore, air pollution monitoring with the reference methods requires experienced
operators for device calibration and maintenance. It is expected that no human intervention will be
necessary for the operation of the low-cost sensors, hence, air pollution can even be monitored by
unskilled personnel without requiring any further technical knowledge. Karagulian et al. (2019)
Currently, numerous low-cost sensors exist for air quality monitoring and each one is associated with
certain ups and downs.
Yi et al. (2015) mentioned five types of low-cost portable gas sensors, which according to
them are the most common and suitable low-cost sensors in use; these are catalytic sensors,
electrochemical sensors, solid-state sensors, photo-ionization detector (PID) sensors, and non-
dispersive infrared radiation absorption (NDIR). These are all low-cost lightweight sensors with rapid
response time. However, there is no currently existing sensor that can measure all types of hazardous
gases as each sensor is sensitive to a specific gas. For instance, CO can be well detected by metal
oxide semiconductor (MOS) sensors (a type of solid-state sensors) which are the popular and
inexpensive route to chemical sensing of various gases (Thompson 2016).
Copyri
ght@
FTSM

PS-FTSM-2020-031
Finally, no currently existing low-cost gas sensor can achieve the same level of data quality
and accuracy as the traditional monitoring instruments. however, they provide a fair level of accuracy
and detection range (Aleixandre & Gerboles 2012). B. Evolution of the Low-Cost Air Pollution Monitoring System
The previous work that used low-cost sensors in their system will be classified into three categories
according to the carriers or the way they are deployed.
i. Static Low-cost Sensors
The study by Ramya and Palaniappan (2012) proposed a microcontroller-based toxic gas detecting
and alerting system for sensing hazardous gases like LPG and propane when they exceed the safety
level. When these gases exceed their safety level, an alarm will generate and send an SMS message
through GSM modem to an authorized person. Their system consists of PIC 16F877 as a
Microcontroller and MQ-2 and MQ-6 gas sensors. The analog signal sensed from the sensors
represented the concentration of the hazardous gases and will be converted to digital signals through
ADC in their microcontroller. The advantage of this system as they claimed is a fast response with
accurate results which led to faster diffusion in emergency cases. The limitations facing this system its
convenience for indoor air quality monitoring only and the sensor nodes will be in sleep mode most of
their time since there is no point in updating data in the same location continuously.While Kadri et al.
(2013) developed a WSN for outdoor monitoring of air pollution,the designed prototype was tested on
a real-time basis. The sensors in the designed system were for the collection of O3, NO2, CO, H2S
pollution data while the sensed info is transmitted via GPRS to the server. Power limitation was
solved by providing a solar panel at the stationary sensor nodes. Customized mobile and web Apps
were provided for making the captured air pollution data available to the public.The challenges facing
this system in term of temporal-resolution when the number of deployed stations increases to override
the low spatial-resolution that will lead to congestion cause a single cellular base station serving a
large number of MG monitoring stations.
Kim et al. (2014) proposed an indoor monitoring system named "An Integrated Sensing
Systems for Real-Time Indoor Air Quality Monitoring" (ISSAQ) for the detection of seven pollution
gases (O3, CO, NO2, SO2, volatile organic compound, and CO2) and air quality alert. Their system
consists of MOS, electrochemical and optical sensors with (DHT11) for air quality sensing, and MPU
MSP430 is for local processing and CC2500 chip RF for wireless communication on Raspberry Pi for
easier connection to cloud, IoT framework, and data logger. They also proposed three algorithms to
increase their system monitoring accuracy and reduce energy exhaustion. The advantages of their
system as they claimed include ability to use indoor and outdoor air monitoring, while the use of
Raspberry Pi makes it easier to connect with IoT applications, the application of the three proposed
algorithms increased the data accuracy and reduced power consumption in the system. However, from
an economic perspective, this type of systems are not applicable in many cases. Nograles et al. (2014)
proposed a wireless sensor system to detect smoke and carbon monoxide for air pollution monitoring.
They used MOS (MQ-2) sensor for detecting smoke and CO, Xbee module for wireless
communication, and PC to receive all data and upload it to HTML-based interface developed in
MATLAB software. The advantage of this system is its commercial availability and its data is
available online to increase environmental awareness about air pollution consequences.However,this
system still facing challenges in term of spatial-resolution. ii. Low Cost Sensors in Mobility Ground Objects
As a result of drawbacks facing static systems in term of low spatial-temporal resolution, deployment
of sensors nodes, maintenance and calibration obstacles,the specialists have been trying to utilize
mobile objects in both ground and air (Alvear et al. 2017).
In ground mobility objects, Pavani and Rao (2017) presented a real-time WSN-based
pollution monitoring . The sensors sense the concentration of CO, CO2, and O2 gases deployed on
sensor nodes that have been calibrated. The project implementation was done in the industrial belt of
Hyderabad city. The study deployed a multi-hop data collection algorithm while the collected air
pollutant data from the designed testbeds are made available onto the internet through dedicated web
interface. The developed system is capable of obtaining the fine-grain pollution data on a real-time
basis.The challenges facing this type of systems in term of Uncontrolled or semi-controlled mobility
and Redundant sampling issues. While Dutta et al. (2017) developed a system named AirSense for air
quality monitoring in both outdoor and indoor. Their system was designed as 4 layers which they
Copyri
ght@
FTSM

PS-FTSM-2020-031
represented as 4 tiers. The first layer is for collecting the data through the people carrying a portable
Air Quality Monitoring Device (AQMD); the second for treating and formatting the data collected
and transmitted through the first layer; third layer is responsible for communication between the cloud
server and the smartphone and the fourth layer is responsible for analyzing and storing the data. Their
AQMD consists of Arduino Pro Mini board as a microcontroller, MOS (MQ-7, MQ-135) for
detecting CO, and monitoring air quality and Bluetooth module HC-05 for transmitting the data from
AQMD to smartphones. They claimed that this system will encourage the citizens to be part in the
crowdsensing action, which could be a backbone of any smart city.The challenges facing this type of
systems in term of Spatial-to-Temporal resolution trade-off (Higher spatial coverage at the expense of
lower temporal resolution), also low data accuracy and reliability.
Lo Re et al. (2014) presented a low-cost system for air quality monitoring using a vehicular
sensor network. This system processes the data collected by sensors located on public vehicles. The
system consists of Arduino as a microcontroller connected to MOS sensors for detecting NO2, CO2,
CO, and Ozone), as well as to measure air quality. The acquired data is transferred to a server on
Raspberry Pi board through Xbee-based Access Points installed on the road. The advantage of this
system is the economy usefulness and the simplicity of the system. Also Ahuja et al. (2016) proposed
a low-cost portable system for air pollution monitoring by using IoT to create awareness to the public
about the air quality, enabling them to make better choices regarding traveling a route or purchasing
of houses in the better area
iii. Low Cost Sensors in Mobility Flying Objects
With all the limitations of each system deployed by utilizing ground mobility objects the ground
access usually hindered and loaded with obstacles, for instance in industrial and rural areas, sensing
usually fails to give enough information to acquire sensible measurements with the required
granularity level (Dunbabin & Marques 2012), also the level of pollution should be measured at
different layer in the air to detect the effect on human health (Alvear et al. 2017).
In flying mobility objects, Bolla et al. (2018) presented an Air Pollutants Monitoring Using
UAVs (ARIA) project, with the aim of finding a toll to measure air quality vertically at different
heights. They didn't present any details about the proposed drone and their experimental result as they
only proposed an overview about their project and the low-cost air pollution measurement. For air
pollution monitoring, they proposed system consists of Raspberry Pi 3 as microcontroller, Alphasense
Gas sensors, and Particulate and Volatile Organic Compounds (VOCs) sensors. They suggested
placing the sensors inside the drone to avoid the airstream generated from the propeller rotation, with
mention of the drawbacks of this configuration which can lead to losses of signal along the wires.
They didn't use any wireless communication for real-time transferring data; they stored the data on an
On-Board storage control unit connected with the measurement system and when the drone land off,
they can download the data from the board.
Also Hernández-Vega et al. (2018) presents a data acquisition system and its coupling into a
UAV to facilitate air pollutants monitoring. The collected data is transmitted via RF to the ground
station for further processing and uploading to the Internet. The results are displayed on a web page
that can be accessed using any mobile device or computer. Their monitoring unite consists of UAV
S500 quadcopter with the pix-hawk flight computer, Arduino, Shield for XBee antenna connection,
XBee PRO S2B Antenna, and DAQ with sensors to measure air quality. The sensors used in this
system are MQ 7 Carbon monoxide, MQ 8 Hydrogen, MQ131 Ozone, and MQ135 Carbon dioxide.
The ground station consists of a PC, Arduino, and Receiver antenna 3DR used for Monitoring the
behavior of variables. They claimed that the flying was stable when the load is located in the center of
its frame, but the flight time decreased from 13 to 10 minutes. They also claimed that there was no
lose communication or interference in linear 203 meters.
While Alvear et al. (2017) proposed off-the-shelf sensor-equipped UAVs for air pollution
monitoring. The UAVs can be navigated using the suggested Pollution-driven UAV Control (PdUC)
algorithm which is based on a chemotaxis metaheuristic and a local PSO strategy. To allow automatic
monitoring using the UAVs, they used Pixhawk as a flight controller for UAV and connected to it
Raspberry Pi as a microcontroller for pollution monitoring system and Grove Pi as an extension board
that allows several analog/digital grove ports to be easily connected to a Raspberry Pi, with MOS
(MQ131) sensor for detecting ozone. This paper claimed that by using PdUC, an accurate map can be
achieved in a faster way compared to any other strategy. They also claimed to achieve better
Copyri
ght@
FTSM

PS-FTSM-2020-031
performance as it found the most polluted areas with better accuracy and offered better coverage
within the time frame prescribed by the UAV flight time.
So with all the limitations facing static and mobile ground systems the UAVs show up as a
solution to override these drawbacks and limitations, but still, by using UAVs new challenges
emerged, in terms of payload capacity, power consumption and stability (Bolla et al. 2018), also the
limitation on sensors selection which needs to be suitable and small enough to mount them on board
UAVs and that may lead to select sensors with less sensitivity and selectivity (Villa et al. 2016a),
furthermore the data acquired with low-cost sensors must be critically evaluated due to their heavy
dependence on numerous factors, especially the impact of wind generated by the UAVs propellers
rotation (Bolla et al. 2018). Also Villa et al. (2016b) claimed that using UAVs for air pollution
measurement can be only effective if the location point of the air sensor has been optimized.
Moreover, the accurate results of gas measurement rely on assessing the contribution of propellers
rotation and wind resistance caused by that.
RESEARCH METODOLOGY The objective of this study is to propose a mobility-wireless air pollution system (as shown in figure
1) to override the drawbacks of static and ground low-cost systems in their low spatial-temporal
resolution by proposing and integrating two subsystems, a wireless-air pollution detection system
based on low-cost sensors, and a mobility flying-objects by developing an affordable and open-source
UAV also to evaluate the performance of the proposed mobility-wireless air pollution system and
analyze the effect of the speeds and altitudes on the air pollution measurements in both horizontally
and vertically flying modes. Therefore this section divided as follows.
Figure 1 proposed Mobility wireless air pollution system
A. Wireless Air Pollution System (Subsystem 1)
The subsystem 1 composed of two stations as shown in figure 2, the first station is for gas and
smoke detection, processing and transferring of data. This station is composed of three MOS gas
sensors (Hanwei Electronics), MQ2 sensor to sense smoke and CO concentrations, MQ6 to sense
LPG concentration, and MQ8 to sense hydrogen concentration, the MOS gas sensor that was utilized
is a resistive sensor, having its sensing material as Tin dioxide (SnO2); the sensors were coupled to
the Arduino UNO R3 micro-controller platform using an RFM LoRa Shield to facilitate wireless
communication. The second station is the monitoring station that is composed of an Arduino UNO R3
board with an RFM LoRa Shield that was connected to the PC via a USB pot for real-time visual
monitor display.
In this proposed system Arduino UNO have been used as a microcontroller platform over the
other devices. Arduino was preferred due to its better speed of data reception and transmission, its
power consumption, as well as ease in programming and simple connectivity (Villa et al. 2016).
Copyri
ght@
FTSM

PS-FTSM-2020-031
As per Husein et al. (2019), LoRa shield is a transmission technology that offers long range
transmission compared to other wireless transmission techniques while MQ sensors are cost-efficient,
compatible with Arduino and its ability to sensing various chemical gases.
Figure 2 The components of subsystem 1
B. Mobility Flying-Object Design (Subsystem 2)
Drones are built with excellent mobility and data-gathering capability owing to their flying mode,
making it easier to reach nodes in a timely manner; it also makes it easy to hover and collect data at
specific nodes (Bolla et al. 2018). With the advancement in laser-cutting technologies and 3D
printing, the manufacturing of low-cost drones with peculiar features is possible in order to achieve
the goal of this study.
The Hexacopter drone is chosen in our design as it has a large payload capacity of more than
2 kgs payload; it also has better maneuverability and in-flight stability in comparison to quadrotors.
This made them ideal for UAV and studies on air quality where there is a need to carry various
sensors and sustain a fixed in-flight position. Our proposed subsystem 2 consist of two stations,
Hexacopter drone as shown in and UAV ground station as shown in figure 3. The purpose of the
ground station is for communicating wirelessly with the UAV via a Radio Controller (RC) or a PC
connected to a Telemetry Radio. The UAV in this project is customized based on their functionalities
and capabilities and self-assembled from scratch by studying all parts and communicating from
supplier of drone experts.
Figure 3 subsystem 2 stations
C. Integration subsystem 1 & subsystem 2
Based on previous studies, the sensor is located at UAV. The best location to place the detection
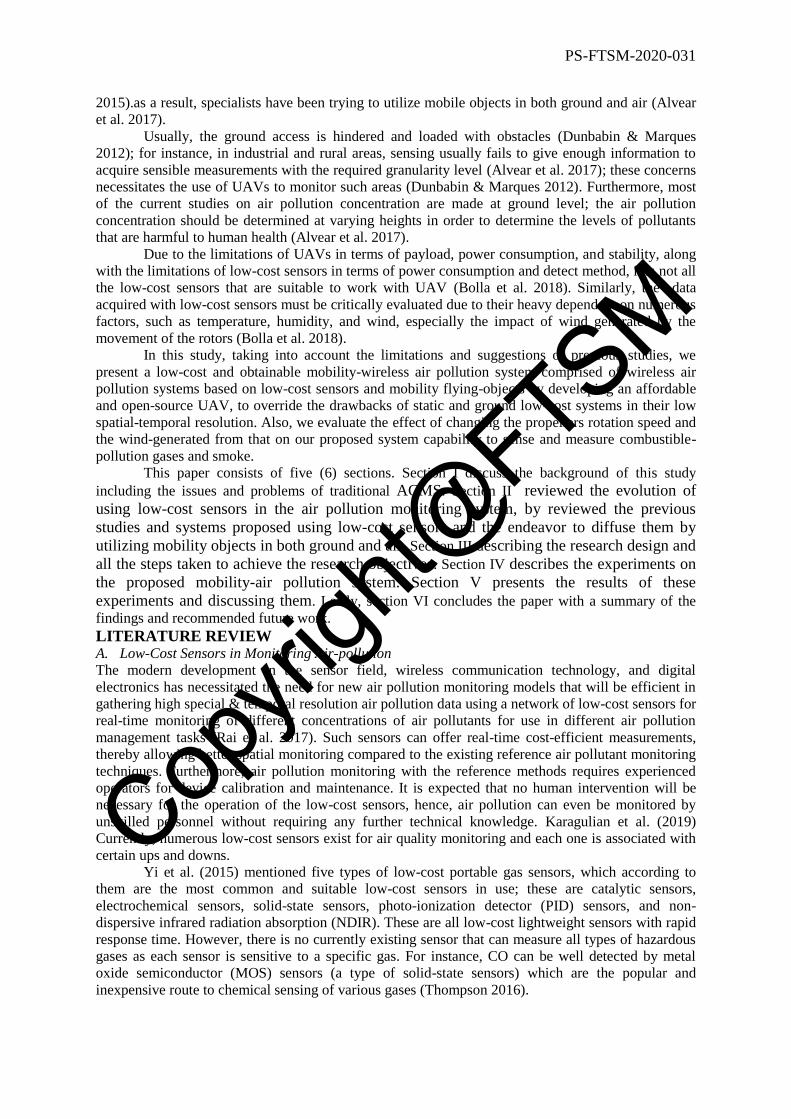
station on our proposed Hexacopter drone is at the bottom of it as shown in figure 4 in order to
achieve drone stability during flighting and hovering mode, as well as to decrease the effect of the
wind generated by the propellers. By placing it as far as possible from the propellers (around 28 cm
Copyri
ght@
FTSM
PS-FTSM-2020-031
from propellers) with an extension to 5 cm from the bottom of the Hexacopter drone. Also, to ensure
more safety for the detection station by using landing skid in case of fall-down or land-off.
Figure 4 Integration detection station and Hexacopter drone
METHODS AND EXPERIMENTAL SETUP After integrated subsystem 1 and subsystem 2 to create our proposed mobility wireless air
pollution system which composed of two stations, the detection station of subsystem 1 will be carried
by the Hexacopter drone of subsystem 2 to create the mobility station, whereas the monitoring station
of subsystem 1 will be combined with UAV ground station to create the ground station
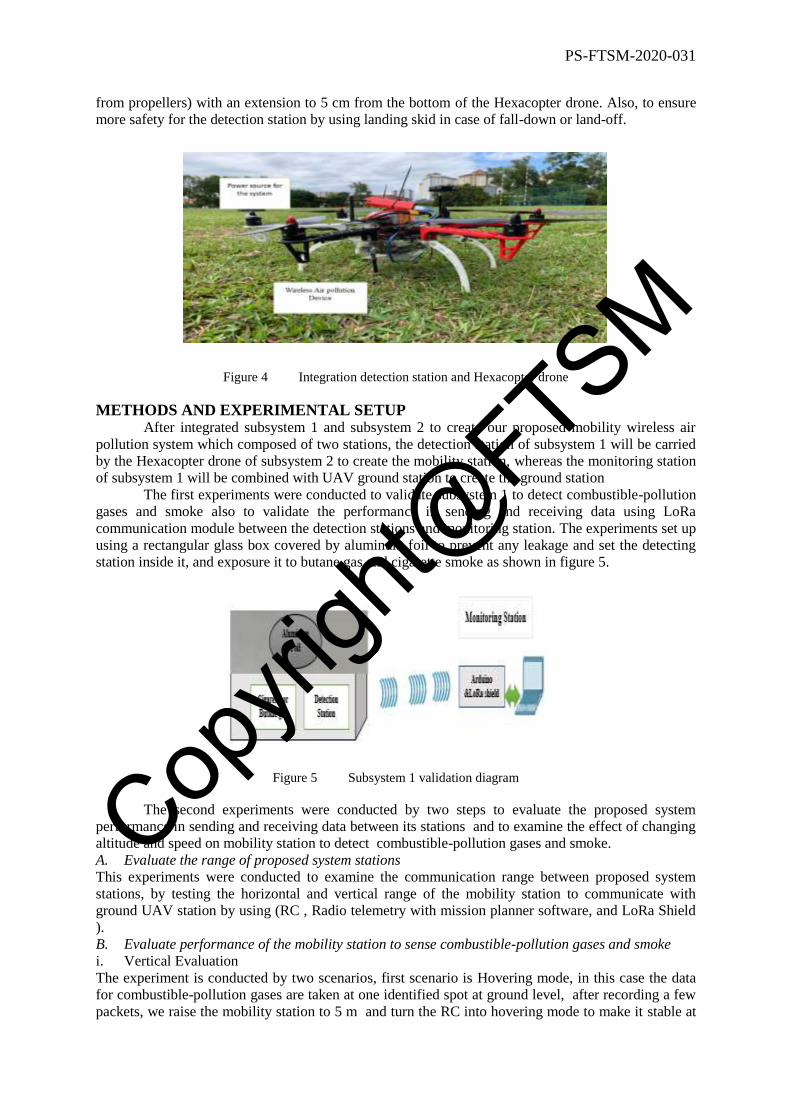
The first experiments were conducted to validate subsystem 1 to detect combustible-pollution
gases and smoke also to validate the performance in sending and receiving data using LoRa
communication module between the detection stations and monitoring station. The experiments set up
using a rectangular glass box covered by aluminum foil to prevent any leakage and set the detecting
station inside it, and exposure it to butane gas and cigarette smoke as shown in figure 5.
Figure 5 Subsystem 1 validation diagram
The second experiments were conducted by two steps to evaluate the proposed system
performance in sending and receiving data between its stations and to examine the effect of changing
altitude and speed on mobility station to detect combustible-pollution gases and smoke.
A. Evaluate the range of proposed system stations
This experiments were conducted to examine the communication range between proposed system
stations, by testing the horizontal and vertical range of the mobility station to communicate with
ground UAV station by using (RC , Radio telemetry with mission planner software, and LoRa Shield
).
B. Evaluate performance of the mobility station to sense combustible-pollution gases and smoke
i. Vertical Evaluation
The experiment is conducted by two scenarios, first scenario is Hovering mode, in this case the data
for combustible-pollution gases are taken at one identified spot at ground level, after recording a few
packets, we raise the mobility station to 5 m and turn the RC into hovering mode to make it stable at
Copyri
ght@
FTSM

PS-FTSM-2020-031
its position and its altitude. We record the reading for few packets then raise the mobility station for
another 5 m, we repeat the experiment until 20 m altitude is reached as shows in figure 6.
This experiment is limited by uncertain knowledge of the molecule interaction for gases, so
we did not raise the mobility station more than 20 m to avoid other factors that may affect the
concentrations of combustible-pollution gases in higher altitude.
Figure 6 Vertically evaluation (hovering mode test)
The second scenario Vertically deploying , using the same spot of the previous experiment. Mobility
station is flown from the ground to 20 m altitude at different speeds starting from (2 ,4 ,6 ,8 ,10) m/s
respectively as shows in figure 7. This experiment limited by mobility station speed which is
maximum reach to 10 m/s.
Figure 7 Vertically evaluation (deploying mode test)
ii. Horizontal Evaluation
To evaluate the mobility station horizontally using different speeds, the experiment is set up using the
ground station for loading a flight plan to the mobility station, the flight plane conducted into the four
steps:
Step 1 : the first point is over the ground station to raised the mobility station at 15 m
altitude.The mobility station hovering in its position for 56 second which is the time for MQ-sensors
to calibrate (calculating R0 for each sensor , in this experiment 60 seconds was used). The hovering
is 56s (to insure that Rs calculation for first packet started as same time as mobilitay station flown to
next point). The estimation time is (1 second to turn on the Hexacopter drone and 3 seconds for take-
off since its speed for take-off is set to 5 m/s). The mobility station flying at the speed set through
(WPNAV_SPEED in mission planner software in ground station) to the second point.
Step 2 : the second point far 150 m horizontally distance from the ground station, at the time
the mobility station reaches to this point it hovers for 10 seconds.
Step 3 : the third point is the do-change speed, the position is set at same position for second
point, at this point the mobility station changes its speed to 2 m/s before flying to fourth point.
Step 4 : the fourth point in same position of take-off point, through it the mobility station
flying back in same path flown in it from first point to second point .
The purpose of using this method to insure the mobility station will fly in same path at nearly
same time in two different speed:
a) First speed which we want to test it from first point to second point.
Copyri
ght@
FTSM
PS-FTSM-2020-031
b) Second speed which is fixed in all experiment from third point to fourth point.
By following this method will receive two types of data for combustible pollution gases and
smoke in same path at nearly the same time at different speeds. this data will be used to compare the
concentrations of the combustible pollution gases in each speed. The speed using in this experiment
are (2,4,6,8,10) m/s respectively, and the detection station set up to send data every 3 seconds.
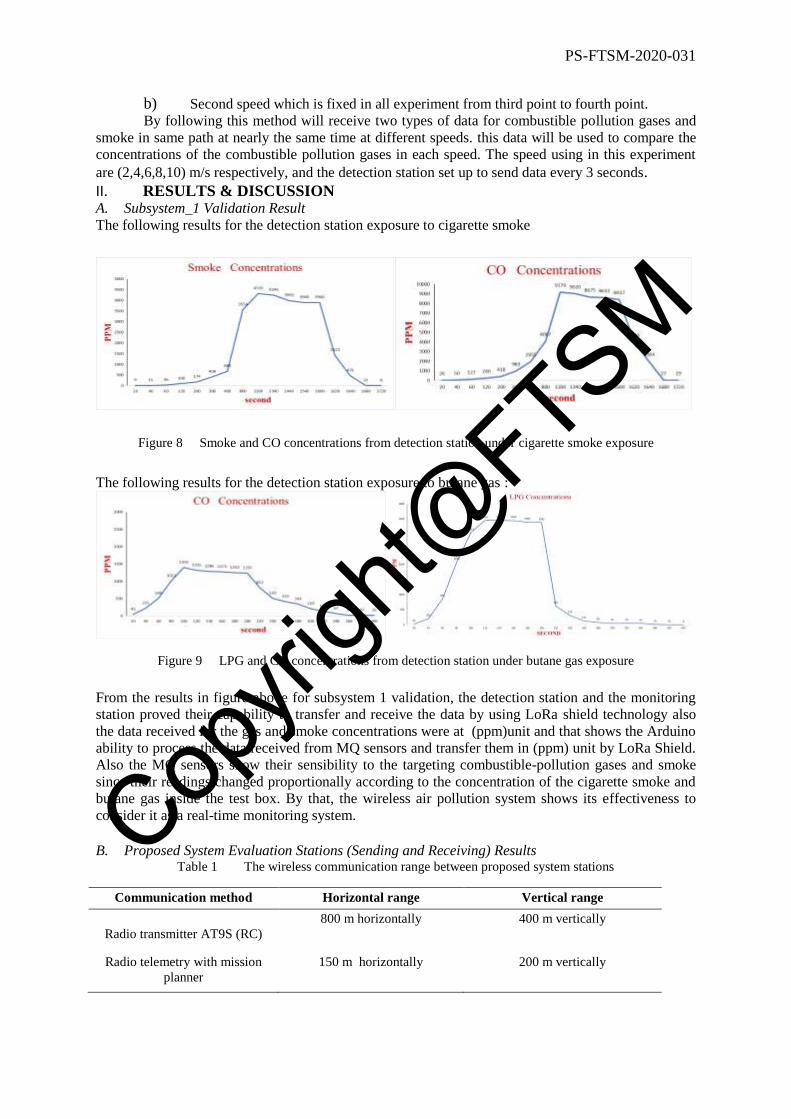
II. RESULTS & DISCUSSION A. Subsystem_1 Validation Result
The following results for the detection station exposure to cigarette smoke
Figure 8 Smoke and CO concentrations from detection station under cigarette smoke exposure
The following results for the detection station exposure to butane gas :
Figure 9 LPG and CO concentrations from detection station under butane gas exposure
From the results in figure above for subsystem 1 validation, the detection station and the monitoring
station proved their capability to transfer and receive the data by using LoRa shield technology also
the data received for the gas and smoke concentrations were at (ppm)unit and that shows the Arduino
ability to process the data received from MQ sensors and transfer them in (ppm) unit by LoRa Shield.
Also the MQ sensors show their sensibility to the targeting combustible-pollution gases and smoke
since their readings changed proportionally according to the concentration of the cigarette smoke and
butane gas inside the test box. By that, the wireless air pollution system shows its effectiveness to
consider it as a real-time monitoring system.
B. Proposed System Evaluation Stations (Sending and Receiving) Results
Table 1 The wireless communication range between proposed system stations
Communication method Horizontal range Vertical range
Radio transmitter AT9S (RC)
800 m horizontally 400 m vertically
Radio telemetry with mission
planner
150 m horizontally 200 m vertically
Copyri
ght@
FTSM

PS-FTSM-2020-031
LoRa Shield 800 m horizontally 400 m vertically
The GPS used is M8N GPS SE100 in the mobility station, the percentage of wrong for it is 0.5m for
distance accuracy and (0.1_0.5) m/s for velocity accuracy (depending on receiver quality). C. Mobility Station Performance on Detection and Sensing Results
i. Vertical Evaluation Results
The average concentrations of gases when changing the altitude in first scenario hovering mode is
shown at figure 10.
Figure 10 The average results of changing altitude in Vertical evaluation( hovering mode)
The average concentrations at each speed for the second scenario (deploying mode) is shown
in figure 11.
Figure 11 The average results of changing speed in Vertical evaluation ( deploying mode )
From the results in figures(10 and 11), the proposed system shows its effectiveness to sense and
detect combustible-pollution gases and smoke in both vertical mode(hovering and deploying), since
Copyri
ght@
FTSM

PS-FTSM-2020-031
the data received was at realistic and constant range and there wasn't any unexpected drop-off or high
increase in the gases concentrations at different altitude or at different speed.
ii. Horizontal Evaluation Results
The following results shown in Figure 12 are the average concentrations of combustible-pollution
gases received from mobility station at each different speed:
Figure 12 Horizontal evaluation results
As shown in figure 12 there was a big change in average concentration for each gas when changed the
speed especially CO gas curve. the data was as followings:
First test , the mobility station flown from first point to second point at speed of (2 m/s), second
flown, from third point to fourth point at speed of (2 m/s). The concentration in each packet received
during flying was in a small range. by comparing the first flown curve line concentrations to the
second flown observed both were almost in the same range.
Second test , the mobility station flown from first point to second point at a speed of (4 m/s), second
flown, from third point to fourth point at speed of (2 m/s). The concentration in each packet received
during flown, was in a small range. by comparing the first flown curve line concentrations to the
second flown, observed both were in the same small range.
Third test , the mobility station flown from first point to second point at a speed of (6 m/s), second
flown, from third point to fourth point at speed of ( 2 m/s). The concentration in each packet received
during flown, was in a small range. by comparing the first flown curve line concentrations to the
second flown, observed a small difference in case of CO but still in a realistic range.
Fourth test , as shown in figure 13 the mobility station flown from first point to second point at a
speed of (8 m/s), second flown, from third point to fourth point at speed of ( 2 m/s). The
concentration in each packet received during flown, was different and not constant at any level. by
comparing the first flown curve line concentrations to the second flown, observed a huge difference. Copyri
ght@
FTSM

PS-FTSM-2020-031
Figure 13 Horizontal evaluation at speed of (8m/s)
Fifth test , the mobility station flown from first point to second point at a speed of (10
m/s), second flown, from third point to fourth point at speed of ( 2 m/s). The data received was a
diverse range of concentrations during the same flown, by comparing the first flown curve line
concentrations to the second flown, observed clearly change as shown in figure 14.
Figure 14 Horizontal evaluation at speed of (10 m/s)
Finally from the results in above figures in horizontal evaluation the proposed system shows
that it was effective to sense and detect combustible pollution gases and smoke at low speeds (2, 4
and 6 m/s), while it was ineffective to sense and detect combustible pollution gases and smoke at high
speed ( 8 m/s and 10 m/s). The ineffectiveness of the mobility station at high speed may be due to the
wind-generated from the rotation of the propellers at high speed in horizontal-mode, this wind may
affect the air samples around the sensors especially with the low-rang of detection for the low-cost
sensors which need to a direct exposure to the gases in order to detect and sense them.
CONCLUSION An overview of the impact of air pollution on human beings and the drawbacks of the traditional air
contamination monitoring systems have been presented, with the evolution of using low-cost sensors
in air pollution monitoring system and the drawbacks and limitations in each level have been
explained. also, the proposed mobility-wireless air pollution system was presented and examined its
stations and the effect of changing altitude and propellers rotation speed on its efficiency and
capability to measure and sense combustible pollution gases and smoke however our system proved to
be effective in measuring combustible pollution gases and smoke in vertical deploying, in both
hovering and flying mode, without any effect from changing speed or altitude on its performance.
Copyri
ght@
FTSM
PS-FTSM-2020-031
While in horizontal mode the system showed the impact of changing speed on its capability for
measuring and sensing gas and smoke concentration, at high speeds. While at speeds less than or
equal to 6 m/s the system showed its ability to measure and sense combustible-pollution gases and
smoke.
Finally Using this system can override the drawbacks of low-cost ground air pollution
monitoring systems in their low spatial-temporal resolution. Also, this system provides the
preliminary step for specialists to predict haze, by detecting and sensing smoke which may generate
from fire as well as the combustible gases around it which can expand the range of fire especially in
forests
REFERENCE
Ahuja, T., Jain, V. & Gupta, S. 2016. Smart Pollution Monitoring for Instituting Aware Traveling.
International Journal of Computer Applications 145(9): 4-11.
Al-Ali, A., Zualkernan, I. & Aloul, F. 2010. A Mobile Gprs-Sensors Array for Air Pollution
Monitoring. IEEE Sensors Journal 10(10): 1666-1671.
Aleixandre, M. & Gerboles, M. 2012. Review of Small Commercial Sensors for Indicative
Monitoring of Ambient Gas. Chem. Eng. Trans 30(
Alvear, O., Zema, N. R., Natalizio, E. & Calafate, C. T. 2017. Using UAV-based systems to monitor
air pollution in areas with poor accessibility. Journal of Advanced Transportation.
doi:10.1155/2017/8204353
Bolla, G. M., Casagrande, M., Comazzetto, A., Dal Moro, R., Destro, M., Fantin, E., Colombatti, G.,
et al. 2018. ARIA: Air pollutants monitoring using UAVs. 5th IEEE International Workshop
on Metrology for AeroSpace, MetroAeroSpace 2018 - Proceedings.
doi:10.1109/MetroAeroSpace.2018.8453584
Brienza, S., Galli, A., Anastasi, G. & Bruschi, P. 2015. A low-cost sensing system for cooperative air
quality monitoring in urban areas. Sensors (Switzerland). doi:10.3390/s150612242
Desai, N. S. & Alex, J. S. R. 2017. Iot Based Air Pollution Monitoring and Predictor System on
Beagle Bone Black. 2017 International Conference on Nextgen Electronic Technologies:
Silicon to Software (ICNETS2), hlm. 367-370.
Devarakonda, S., Sevusu, P., Liu, H., Liu, R., Iftode, L. & Nath, B. 2013. Real-Time Air Quality
Monitoring through Mobile Sensing in Metropolitan Areas. Proceedings of the 2nd ACM
SIGKDD international workshop on urban computing, hlm. 15.
Dunbabin, M. & Marques, L. 2012. Robots for environmental monitoring: Significant advancements
and applications. IEEE Robotics and Automation Magazine. doi:10.1109/MRA.2011.2181683
Dutta, J., Chowdhury, C., Roy, S., Middya, A. I. & Gazi, F. 2017. Towards Smart City: Sensing Air
Quality in City Based on Opportunistic Crowd-Sensing. Proceedings of the 18th
international conference on distributed computing and networking, hlm. 42.
Evangelatos, O. & Rolim, J. 2015. An Airborne Wireless Sensor Network for Ambient Air
Pollution Monitoring. SENSORNETS 231-239.
Evangelatos, O. & Rolim, J. D. P. 2015. AIRWISE an airborne wireless sensor network for ambient
air pollution monitoring. SENSORNETS 2015 - 4th International Conference on Sensor
Networks, Proceedings. doi:10.5220/0005203302310239
Freddi, S., Drera, G., Pagliara, S., Goldoni, A. & Sangaletti, L. 2019. Enhanced selectivity of target
gas molecules through a minimal array of gas sensors based on nanoparticle-decorated
SWCNTs. Analyst. doi:10.1039/c9an00551j
Hernández-Vega, J.-I., Varela, E. R., Romero, N. H., Hernández-Santos, C., Cuevas, J. L. S. &
Gorham, D. G. P. 2018. Internet of Things (Iot) for Monitoring Air Pollutants with an
Unmanned Aerial Vehicle (Uav) in a Smart City. Dlm. (pnyt.). Smart Technology, hlm.
108-120. Springer.
Husein, N. a. A., Rahman, A. H. A. & Dahnil, D. P. 2019. Evaluation of Lora-Based Air Pollution
Monitoring System. Evaluation 10(7):
Copyri
ght@
FTSM

PS-FTSM-2020-031
Jaladi, A. R., Khithani, K., Pawar, P., Malvi, K. & Sahoo, G. 2017. Environmental Monitoring Using
Wireless Sensor Networks ( WSN ) based on IOT . International Research Journal of
Engineering and Technology (IRJET).
Karagulian, F., Barbiere, M., Kotsev, A., Spinelle, L., Gerboles, M., Lagler, F., Redon, N., Crunaire,
S. & Borowiak, A. 2019. Review of the Performance of Low-Cost Sensors for Air Quality
Monitoring. Atmosphere 10(9): 506.
Kasar, A. R., Khemnar, D. S. & Tembhurnikar, N. P. 2013. WSN Based Air Pollution Monitoring
System. International Journal of Science and Engineering Applications.
doi:10.7753/ijsea0204.1001
Kim, J.-Y., Chu, C.-H. & Shin, S.-M. 2014. Issaq: An Integrated Sensing Systems for Real-Time
Indoor Air Quality Monitoring. IEEE Sensors Journal 14(12): 4230-4244.
Kim. 2014. Mq-8 Hydrogen/H2 Sensor Module. https://sandboxelectronics.com/?p=196 [24th
December 2019].
Kumar, P., Morawska, L., Martani, C., Biskos, G., Neophytou, M., Di Sabatino, S., Bell, M., et al.
2015. The rise of low-cost sensing for managing air pollution in cities. Environment
International. doi:10.1016/j.envint.2014.11.019
Latif, M. T., Othman, M., Idris, N., Juneng, L., Abdullah, A. M., Hamzah, W. P., Khan, M. F., et al.
2018. Impact of regional haze towards air quality in Malaysia: A review. Atmospheric
Environment. doi:10.1016/j.atmosenv.2018.01.002
Li, J., Li, M., Xin, J., Lai, B. & Ma, Q. 2014. Wireless sensor network for indoor air quality
monitoring. Sensors and Transducers. doi:10.21608/jsrs.2015.19949
Li, Z., Chang, L., Gao, D., Liu, P. & Pistikopoulos, E. N. 2014. Hydrogen Energy Systems. Process
Systems Engineering. doi:10.1002/9783527631209.ch45
Liu, J. H., Chen, Y. F., Lin, T. S., Lai, D. W., Wen, T. H., Sun, C. H., Juang, J. Y., et al. 2011.
Developed urban air quality monitoring system based on wireless sensor networks.
Proceedings of the International Conference on Sensing Technology, ICST.
doi:10.1109/ICSensT.2011.6137040
Lo Re, G., Peri, D. & Vassallo, S. D. 2014. Urban air quality monitoring using Vehicular Sensor
Networks. Advances in Intelligent Systems and Computing. doi:10.1007/978-3-319-03992-
3_22
Mansour, S., Nasser, N., Karim, L. & Ali, A. 2014. Wireless Sensor Network-Based Air Quality
Monitoring System. 2014 International Conference on Computing, Networking and
Communications (ICNC), hlm. 545-550.
Montgomery, J. F., Reynolds, C. C. O., Rogak, S. N. & Green, S. I. 2015. Financial implications of
modifications to building filtration systems. Building and Environment.
doi:10.1016/j.buildenv.2014.11.005
Murty, R. N., Mainland, G., Rose, I., Chowdhury, A. R., Gosain, A., Bers, J. & Welsh, M. 2008.
CitySense: An urban-scale wireless sensor network and testbed. 2008 IEEE International
Conference on Technologies for Homeland Security, HST’08.
doi:10.1109/THS.2008.4534518
Nex, F. & Remondino, F. 2014. UAV for 3D mapping applications: A review. Applied Geomatics.
doi:10.1007/s12518-013-0120-x
Nograles, H. a. H., Agbay, C. P. D., Flores, I. S. L., Manuel, A. L. & Salonga, J. B. C. 2014. Low
Cost Internet Based Wireless Sensor Network for Air Pollution Monitoring Using Zigbee
Module. 2014 Fourth International Conference on Digital Information and Communication
Technology and its Applications (DICTAP), hlm. 310-314.
Pavani, M. & Rao, P. T. 2017. Monitoring Real-Time Urban Carbon Monoxide (Co) Emissions
Using Wireless Sensor Networks. International Conference on Information and
Communication Technology for Intelligent Systems, hlm. 290-297.
Rai, A. C., Kumar, P., Pilla, F., Skouloudis, A. N., Di Sabatino, S., Ratti, C., Yasar, A., et al. 2017.
End-user perspective of low-cost sensors for outdoor air pollution monitoring. Science of the
Total Environment. doi:10.1016/j.scitotenv.2017.06.266
Raipure, S. & Mehetre, D. 2015. Wireless sensor network based pollution monitoring system in
metropolitan cities. 2015 International Conference on Communication and Signal Processing,
ICCSP 2015. doi:10.1109/ICCSP.2015.7322841
Copyri
ght@
FTSM

PS-FTSM-2020-031
Ramya, V. & Palaniappan, B. 2012. Embedded System for Hazardous Gas Detection and Alerting.
International Journal of Distributed and Parallel Systems (IJDPS) 3(3): 287-300.
Riojas-Rodríguez, H., Romieu, I. & Hernández-Ávila, M. 2017. Air pollution. Occupational and
Environmental Health. doi:10.1093/oso/9780190662677.003.0018
Rossi, M. & Brunelli, D. 2015. Autonomous Gas Detection and Mapping with Unmanned Aerial
Vehicles. IEEE Transactions on Instrumentation and measurement 65(4): 765-775.
Schneider, P., Castell, N., Vogt, M., Dauge, F. R., Lahoz, W. A. & Bartonova, A. 2017. Mapping
urban air quality in near real-time using observations from low-cost sensors and model
information. Environment International. doi:10.1016/j.envint.2017.05.005
Snyder, A. 2013. Environmental protection agency. Cases on Electronic Records and Resource
Management Implementation in Diverse Environments. doi:10.4018/978-1-4666-4466-
3.ch022
Thompson, J. E. 2016. Crowd-Sourced Air Quality Studies: A Review of the Literature & Portable
Sensors. Trends in Environmental Analytical Chemistry 11(23-34.
Villa, T., Gonzalez, F., Miljevic, B., Ristovski, Z. D. & Morawska, L. 2016. An overview of small
unmanned aerial vehicles for air quality measurements: Present applications and future
prospectives. Sensors (Switzerland). doi:10.3390/s16071072
Villa, T., Salimi, F., Morton, K., Morawska, L. & Gonzalez, F. 2016. Development and Validation
of a Uav Based System for Air Pollution Measurements. Sensors 16(12): 2202.
Wijaya, D. R., Sarno, R. & Zulaika, E. 2016. Gas Concentration Analysis of Resistive Gas Sensor
Array. 2016 International Symposium on Electronics and Smart Devices (ISESD), hlm. 337-
342.
Wijaya, D. R., Sarno, R. & Zulaika, E. 2017. Gas concentration analysis of resistive gas sensor array.
2016 International Symposium on Electronics and Smart Devices, ISESD 2016.
doi:10.1109/ISESD.2016.7886744
Williams, R., Conner, T. & Clements, A. 2017. Performance Evaluation of the United Nations
Environment Programme Air Quality Monitoring Unit. U.S. Environmental Protection
Agency.
Yi, W. Y., Lo, K. M., Mak, T., Leung, K. S., Leung, Y. & Meng, M. L. 2015. A survey of wireless
sensor network based air pollution monitoring systems. Sensors (Switzerland).
doi:10.3390/s151229859
Copyri
ght@
FTSM