spe 170660 data-driven reservoir management of a … · spe 170660 data-driven reservoir management...
TRANSCRIPT
SPE 170660
Data-Driven Reservoir Management of a Giant Mature Oilfield in the Middle East Mohaghegh, S.D., West Virginia University & Intelligent Solutions, Inc., Gaskari, R. and Maysami, M., Intelligent Solutions, Inc., Khazaeni, Y. Boston University
Copyright 2014, Society of Petroleum Engineers This paper was prepared for presentation at the SPE Annual Technical Conference and Exhibition held in Amsterdam, The Netherlands. 27–29 October 2014. This paper was selected for presentation by an SPE program committee following review of information contained in an abstract submitted by the author(s). Contents of the paper have not been reviewed by the Society of Petroleum Engineers and are subject to correction by the author(s). The material does not necessarily reflect any position of the Society of Petroleum Engineers, its officers, or members. Electronic reproduction, distribution, or storage of any part of this paper without the written consent of the Society of Petroleum Engineers is prohibited. Permission to reproduce in print is restricted to an abstract of not more than 300 words; illustrations may not be copied. The abstract must contain conspicuous acknowledgment of SPE copyright.
ABSTRACT
A novel approach to reservoir management applied to a mature giant oilfield in the Middle East is presented. This is a prolific
brown field producing from multiple horizons with production data going back to mid-1970s. Periphery water injection in this
filed started in mid-1980s. The field includes more than 400 producers and injectors. The production wells are deviated (slanted)
or horizontal and have been completed in multiple formations.
An empirical, full field reservoir management technology, based on a data-driven reservoir model was used for this study. The
model was conditioned to all available types of field data (measurements) such as production and injection history, well
configurations, well-head pressure, completion details, well logs, core analysis, time-lapse saturation logs, and well tests. The
well tests were used to estimates the static reservoir pressure as a function of space and time. Time-lapse saturation (Pulse-
Neutron) logs were available for a large number of wells indicating the state of water saturation in multiple locations in the
reservoir at different times.
The data-driven, full field model was trained and history matched using machine learning technology based on data from all
wells between 1975 and 2001. The history matched model was deployed in predictive mode to generate (forecast) production
from 2002 to 2010 and the results was compared with historical production (Blind History Match). Finally future production
from the field (2011 to 2014) was forecasted. The main challenge in this study was to simultaneously history match static
reservoir pressure, water saturation and production rates (constraining well-head pressure) for all the wells in the field.
History matches on a well-by-well basis and for the entire asset is presented. The quality of the matches clearly demonstrates
the value that can be added to any given asset using pattern recognition technologies to build empirical reservoir management
tools. This model was used to identify infill locations and water injection schedule in this field.
RESERVOIR MANAGEMENT
Reservoir management has been defined as use of financial, technological, and human resources, to minimizing capital
investments and operating expenses and to maximize economic recovery of oil and gas from a reservoir. The purpose of
reservoir management is to control operations in order to obtain the maximum possible economic recovery from a reservoir on
the basis of facts, information, and knowledge (Thakur 1996). Historically, tools that have been successfully and effectively
used in reservoir management integrate geology, petrophysics, geophysics and petroleum engineering throughout the life cycle
of a hydrocarbon asset. Through the use of technologies such as remote sensors and simulation modeling, reservoir management
can improve production rates and increase the total amount of oil and gas recovered from a field (Chevron 2012).
Reservoir simulation and modeling has proven to be one of the most effective instruments that can integrate data and expertise
from a wide range of disciplines such as geology, petrophysics, geophysics, reservoir and production engineering in order to
model fluid flow in the reservoir. Reservoir simulation model is history matched using the pressure and production
measurements from the asset in order to tune the geological understandings and provide predictive capabilities. Since no two
hydrocarbon reservoirs are the same and each asset has its own unique geological characteristics and drive mechanisms, the art
and science of reservoir simulation and modeling must be adapted to unique situations in order to be able to realistically model

2 Mohaghegh, et al. SPE 170660
the past and predict the future of a hydrocarbon producing reservoir.
Although reservoir simulation and modeling remains one of the major contributors to reservoir management practices for the
foreseeable future, its realistic application to reservoir management practices continues to face challenges. These challenges
are related to exploration of a very large solution space that is a natural and required step during a reservoir management study.
During reservoir management process it is required to generate, evaluate and rank multiple potential development scenarios as
early as possible in the workflow. Furthermore, important practices such as quantification and analysis of uncertainties
associated with the geological model as well as economic analysis and planning require large number of scenarios to be
generated and evaluated in order to assist the decision making process. Performing reservoir management studies without such
capabilities reduces the informed decision making to guess work, albeit, educated guess work.
DATA DRIVEN RESERVOIR MODELING & MANAGEMENT
Also referred to as “Fact-Based Reservoir Modeling”, data-driven reservoir modeling is a novel approach to build
models representing fluid flow in hydrocarbon producing porous media that are completely based on field
measurements. Instead of starting from first principle physics that result in partial differential equations such as the
diffiusivity equation, data-driven reservoir modeling starts from field measurements such as well configurations, well
completion, well logs, core analysis, well tests, and production/injection history.
Contrary to the assessment of some critics, physics is not ignored during data-driven reservoir modeling. In data-driven
reservoir modeling role of physics is changed from the architect of the governing equations to the guiding light and the
blue-print that provides the framework for the model development process. Data-driven reservoir modeling does not
adhere to the dogma that all modeling of natural phenomena must start with physics to have credibility, nor it finds
credible the notion, by naïve statisticians, that no physics (or petroleum engineers) are needed for modeling and that
data can be the answer to all problems in the upstream E&P industry.
Data-driven reservoir modeling starts with the premise that data, especially in our discipline, carries information. Data
collected during the drilling, reservoir, and production operations in an oilfield includes footprints, in space and time,
of fluid flow in the porous media. If large enough volume of such data is assembled in a proper fashion, and appropriate
tools are used in interpreting them by well-trained petroleum engineers, then there is a realistic chance of being able to
build comprehensive and cohesive full field models that not only will not violate the known physics, but would be able
to shed light on complex and highly nonlinear behavior that might have been missed by a purely physics -based approach.
The reason is obvious. Physics-based approaches are bound to be limited to our current understanding of the natural
phenomenon which continues to improve as a function of time. Our understanding of complexity of fluid flow in a large
and diverse combinations of porous media is far more advance today than in was 40 years ago and it is bound to advance
even further in the next 40 years. But the facts that are intrinsic to (and the patterns that exist in a collection of) data
are permanent and do not change with time1. The question is; do we have the tools and the techniques and the know-
how to extract them?
The first and the most comprehensive data-driven reservoir modeling technology developed by reservoir engineers (not
mathematicians or statisticians) is Top-Down Modeling2 (TDM). TDM was introduced a few years ago and has enjoyed
continuous R&D to enhance its capabilities ever since. Several IOCs, NOCs, and independents have successfully
adopted this technology and are benefiting from its results. Data-driven reservoir management is referred to as a process
whereby the key models used to make critical decisions are data-driven models. The main advantages of data-driven
reservoir models are (a) they are fact-based and include minimal pre-modeling interpretation and human biases, (b)
time required for their development (training and validation of the predictive models) is a fraction of the time required
for a comprehensive numerical simulation model, and (c) they have small computational footprint that accommodates
large number of scenarios to be investigated in relatively short period of time.
TOP-DOWN MODELING (TDM) TECHNOLOGY
Traditional numerical reservoir simulation is the industry standard for reservoir management. It is used in all phases of field
development in the oil and gas industry. The routine of numerical simulation studies calls for integration of static and dynamic
measurements into a reservoir model that has been formulated based on our current understanding of fluid flow in porous media
and numerical solution of the formulation in the context of an interpreted geological model.
Numerical simulation is a bottom-up approach that starts with building a geological (geo-cellular or static) model of the
1 Although our skills and tools to extract the facts may change and advance with time. 2 This technology was invented and introduced to the E&P industry by Intelligent Solutions, Inc. in 2006.
SPE 170660 Data-Driven Reservoir Management of a Giant Mature Oilfield in the Middle East 3
reservoir. Using modeling and geo-statistical manipulation of the data the geo-cellular model is populated with the best
available geological and petrophysical information. Engineering fluid flow principles are added and solved numerically to
arrive at a dynamic reservoir model. The dynamic reservoir model is calibrated using the production history of multiple wells
by modification of several of the parameters involved in the geological model in a process called history matching and the final
history matched model is used in predictive mode to strategize the field development in order to improve recovery.
Characteristics of the numerical reservoir simulation and modeling include:
It takes a significant investment (time and money) to develop a geological (geo-cellular, static) model to serve as the
foundation of the reservoir simulation model.
Development and history matching of a reservoir simulation model is not a trivial process and requires reservoir
engineers and modelers and geoscientists with significant amount of experience.
It is an expensive and time consuming endeavor.
A prolific asset is required in order to justify the significant capital investment that is necessary for a reservoir
simulation model.
Top-Down Intelligent Reservoir Modeling (TDM) is an innovative integration of many disciplines such as reservoir
engineering, reservoir modeling, statistical analysis, and advanced data-driven analytics using machine learning. The aim of
TDM is to serve as an alternative or a complement to the traditional numerical reservoir simulation and modeling. When
compared to the numerical reservoir simulation and modeling, TDM takes quite a different and independent approach to full
field reservoir simulation and modeling. The most important distinguishing characteristics of TDM that recognizes it from the
numerical reservoir simulation are:
a. It does not assume that we have all the information necessary to build a fully representative geological model of the
asset, understanding all the underlying geological behavior, and
b. It does not assume that we fully understand and are able to formulate (using physics) all the complexities and
intricacies (nuances) of fluid flow through porous media for the asset being modeled.
The integration of the technologies that were named above, form the foundation of a comprehensive spatio-temporal database.
This database represents an extensive set of snap shots of fluid flow in the formation in space and time. It is expected that all
the characteristics that governs the complexity of fluid flow in the reservoir be captured in this extensive spatio-temporal
database. A limitation of TDM is that it is as valid as the degree of representation of the data that is used to develop it. The
spatio-temporal database includes but is not limited to the following data:
i. Well location (latitude, longitude, TV, MD)
ii. Well construction (Vertical/Slanted/Horizontal, Inclination, Azimuth, …)
iii. Well Completion (open hole vs. cased and perforated, etc.)
iv. Well logs (gamma ray, density, resistivity, sonic, …)
v. Formation evaluation (Formation Tops, Gross Thickness, N2G, Porosity, Saturation, …)
vi. Core analysis (Permeability, Relative Perm, Capillary Pressure, …)
vii. Well tests
viii. Well interventions (workovers, stimulations, hydraulic fractures, …)
ix. Seismic
x. Operational constraints (well head pressure, Choke Size, Shut-in durations, Artificial lift, …)
xi. Production and injection rates (oil, water, gas)
As it can be noted from the list above, TDM is far more than statistical analyses of production data in order to find simple
correlations between wells. TDM is an implementation of a comprehensive and integrated set of diverse technologies such as
reservoir engineering, reservoir modeling, traditional statistics, and advanced data-driven analytics using machine learning to
build a comprehensive and well-behaved reservoir model. It integrates all that is relevant in the production of fluids from an
asset into a comprehensive, full field reservoir model. It seeks to integrate the data gathered from all these sources into a
complete database that would understand and honor the differences that exist in the scale and the nature of the sources where
the above data are gathered (generated) from. Furthermore, the spatio-temporal database must be setup in such a manner that
can represent the intricate details that are crucial to modeling and history matching of production of hydrocarbon from an asset
such as communication between off set wells (injection and/or production wells).
Upon completing the assimilation of the spatio-temporal database, which proves to be one of the most important steps in
development of a Top-Down Model (TDM), training and history matching of the TDM is performed simultaneously. It must
be noted that a rigorous blind history matching scheme is required in this step of the process to ensure the robustness of the
Top-Down Model. The blind history match refers to a process through which certain part of the production history (usually the
4 Mohaghegh, et al. SPE 170660
tail-end) is intentionally left out of the TDM development and the history matching process and is used solely for validation
purposes. Once the training and history matching step of the TDM is completed, the TDM is deployed in prediction mode and
is asked to forecast the production from all the individual wells in the asset. The prediction from the TDM is compared with
the production history that was left out of the modeling process in order to judge the validity (predictive capability) of the
TDM3.
Using the design tool that is part of the TDM process, field development strategies are planned and then using the history
matched model (in predictive mode) the plans are tested to see if they fulfill the reservoir management objectives. This process
is repeated, iteratively (by planning new wells to be drilled and predicting their performance), until the reservoir management
objectives are met. Once the objective is accomplished, the plan is forwarded to operation for implementation.
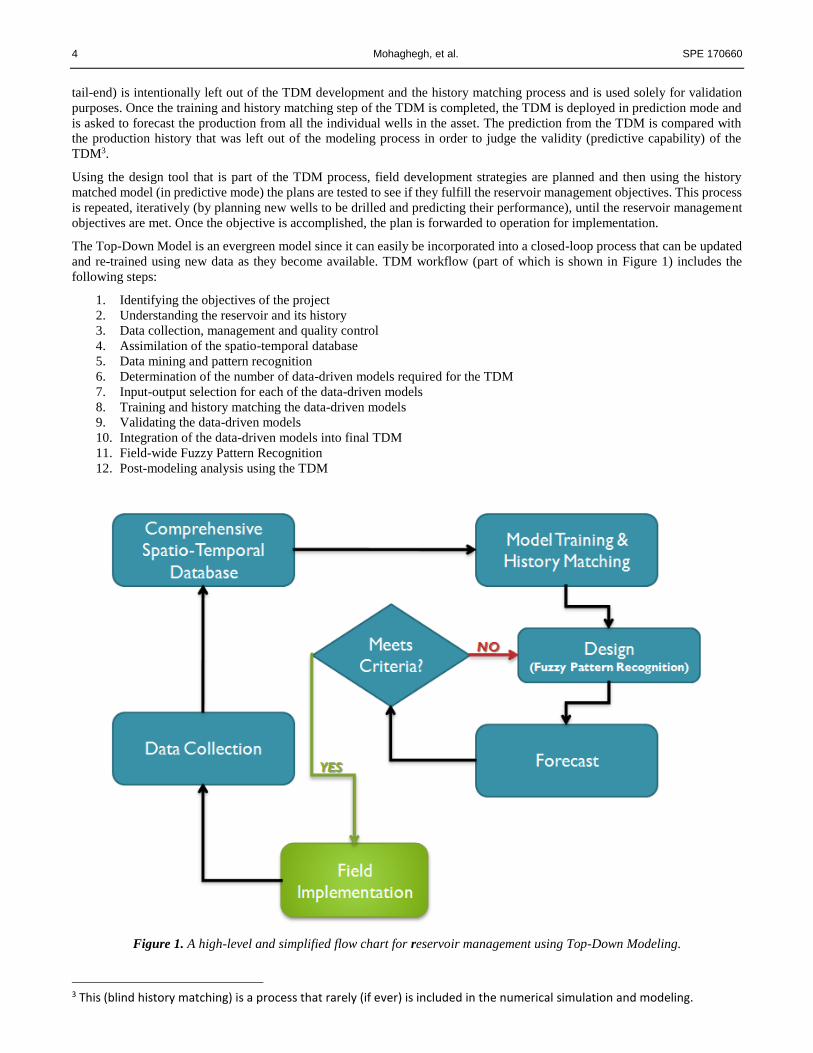
The Top-Down Model is an evergreen model since it can easily be incorporated into a closed-loop process that can be updated
and re-trained using new data as they become available. TDM workflow (part of which is shown in Figure 1) includes the
following steps:
1. Identifying the objectives of the project
2. Understanding the reservoir and its history
3. Data collection, management and quality control
4. Assimilation of the spatio-temporal database
5. Data mining and pattern recognition
6. Determination of the number of data-driven models required for the TDM
7. Input-output selection for each of the data-driven models
8. Training and history matching the data-driven models
9. Validating the data-driven models
10. Integration of the data-driven models into final TDM
11. Field-wide Fuzzy Pattern Recognition
12. Post-modeling analysis using the TDM
Figure 1. A high-level and simplified flow chart for reservoir management using Top-Down Modeling.
3 This (blind history matching) is a process that rarely (if ever) is included in the numerical simulation and modeling.
SPE 170660 Data-Driven Reservoir Management of a Giant Mature Oilfield in the Middle East 5
Once the data is collected, quality controlled and assimilated into the said spatio-temporal database, it is processed using the
state-of-the-art machine learning algorithms in order to generate a complete and cohesive model of fluid flow in the entire
reservoir. This is accomplished by using a set of discrete modeling techniques to generate predictive models of well behavior,
followed by intelligent agents that integrate the discrete models into a cohesive model of the reservoir as a whole, using a
continuous fuzzy pattern recognition algorithms.
The Top-Down, Intelligent Reservoir Model is calibrated using the most recent data from existing wells and/or a set of wells
that have recently been drilled in the field. The calibrated model is then used for field development strategies to improve and
enhance hydrocarbon recovery.
Top-Down Modeling have been validated using synthetic cases (Mata 2007, Gomez 2009). In these studies, in order to validate
the applicability of TDM in representing fluid flow in the porous media, numerical reservoir simulation models were developed
and treated as ground truth. The numerical models were used to generate the type of data that is usually available from a real
case. The generated data was used to predict the behavior of the numerical reservoir model. In other words in these studies the
objective was to see if TDM can understand and then reproduce the physics (and the geology) that was used to build the
reservoir models. Multiple applications of TDM applying to actual assets, both conventional (Gaskari 2007, Mohaghegh 2009,
Kalantari 2010, Khazaeni 2011, Mohaghegh 2011, Maysami 2013) and unconventional (Grujic 2010, Zargari 2010, Kalantari
2011, Esmaili 2012, Mohaghegh 2012, Haghighat 2014) have been published extensively. Some of these applications have
used only publicly available data while others have used more detail data provided by the operator.
6 Mohaghegh, et al. SPE 170660
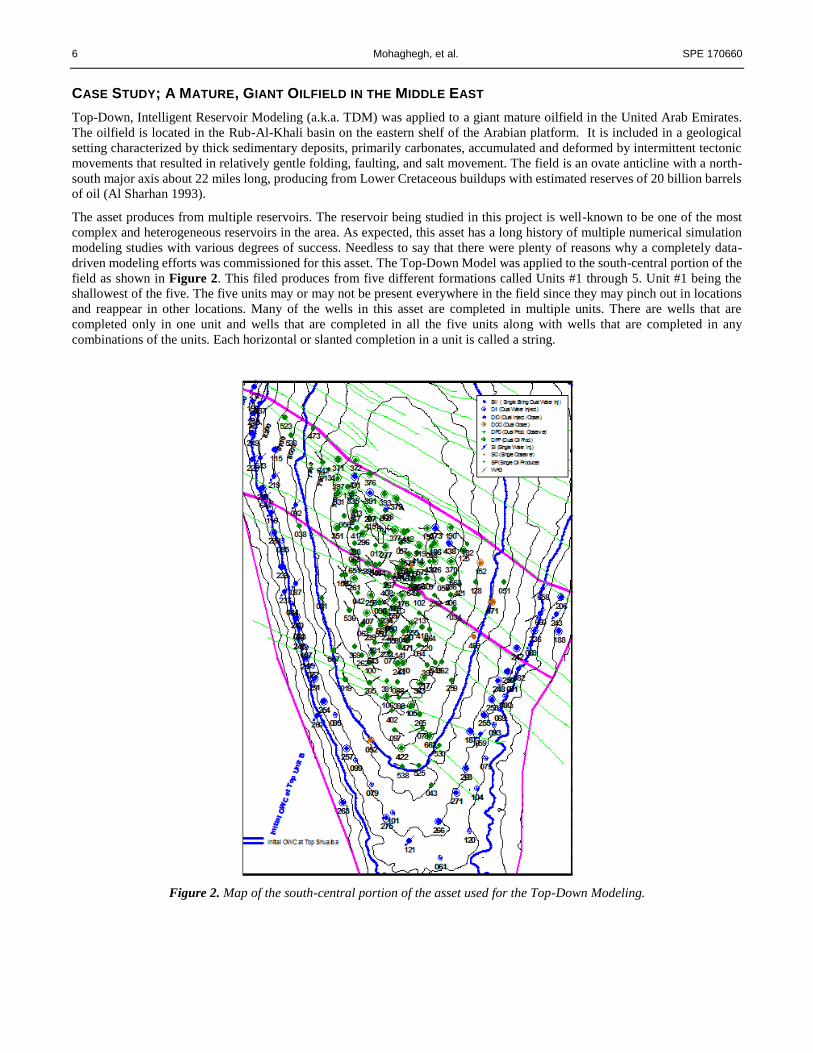
CASE STUDY; A MATURE, GIANT OILFIELD IN THE MIDDLE EAST
Top-Down, Intelligent Reservoir Modeling (a.k.a. TDM) was applied to a giant mature oilfield in the United Arab Emirates.
The oilfield is located in the Rub-Al-Khali basin on the eastern shelf of the Arabian platform. It is included in a geological
setting characterized by thick sedimentary deposits, primarily carbonates, accumulated and deformed by intermittent tectonic
movements that resulted in relatively gentle folding, faulting, and salt movement. The field is an ovate anticline with a north-
south major axis about 22 miles long, producing from Lower Cretaceous buildups with estimated reserves of 20 billion barrels
of oil (Al Sharhan 1993).
The asset produces from multiple reservoirs. The reservoir being studied in this project is well-known to be one of the most
complex and heterogeneous reservoirs in the area. As expected, this asset has a long history of multiple numerical simulation
modeling studies with various degrees of success. Needless to say that there were plenty of reasons why a completely data-
driven modeling efforts was commissioned for this asset. The Top-Down Model was applied to the south-central portion of the
field as shown in Figure 2. This filed produces from five different formations called Units #1 through 5. Unit #1 being the
shallowest of the five. The five units may or may not be present everywhere in the field since they may pinch out in locations
and reappear in other locations. Many of the wells in this asset are completed in multiple units. There are wells that are
completed only in one unit and wells that are completed in all the five units along with wells that are completed in any
combinations of the units. Each horizontal or slanted completion in a unit is called a string.
Figure 2. Map of the south-central portion of the asset used for the Top-Down Modeling.
SPE 170660 Data-Driven Reservoir Management of a Giant Mature Oilfield in the Middle East 7
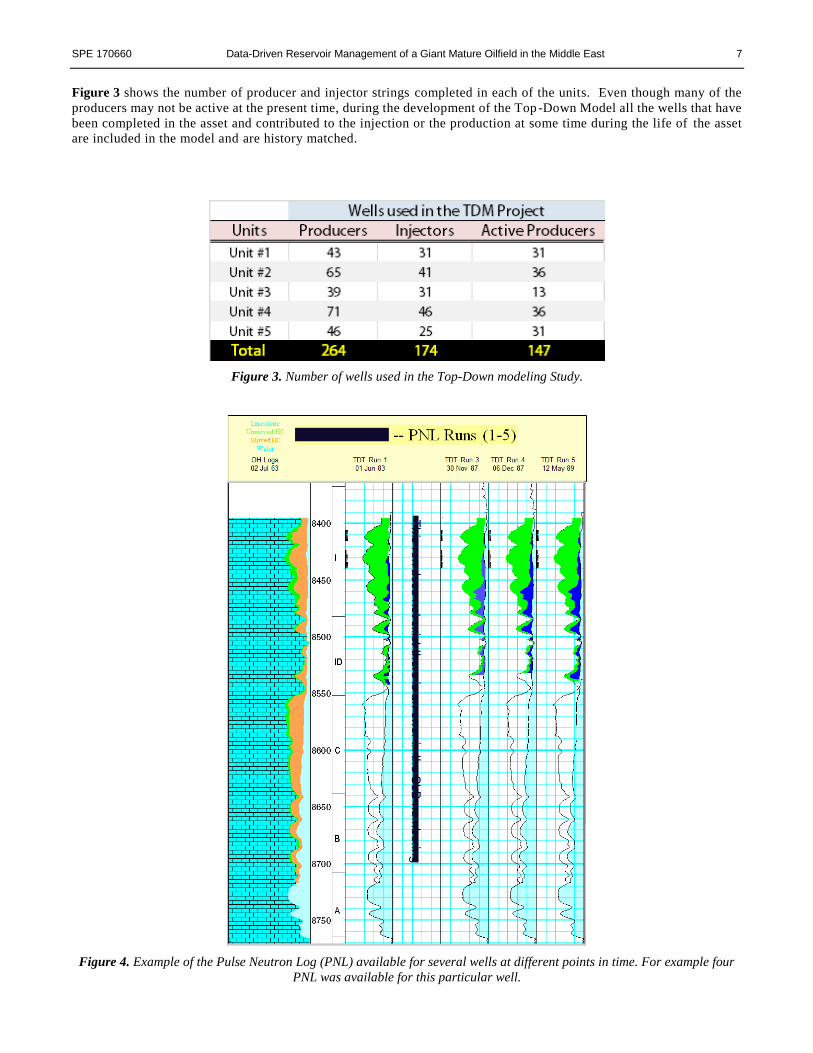
Figure 3 shows the number of producer and injector strings completed in each of the units. Even though many of the
producers may not be active at the present time, during the development of the Top-Down Model all the wells that have
been completed in the asset and contributed to the injection or the production at some time during the life of the asset
are included in the model and are history matched.
Figure 3. Number of wells used in the Top-Down modeling Study.
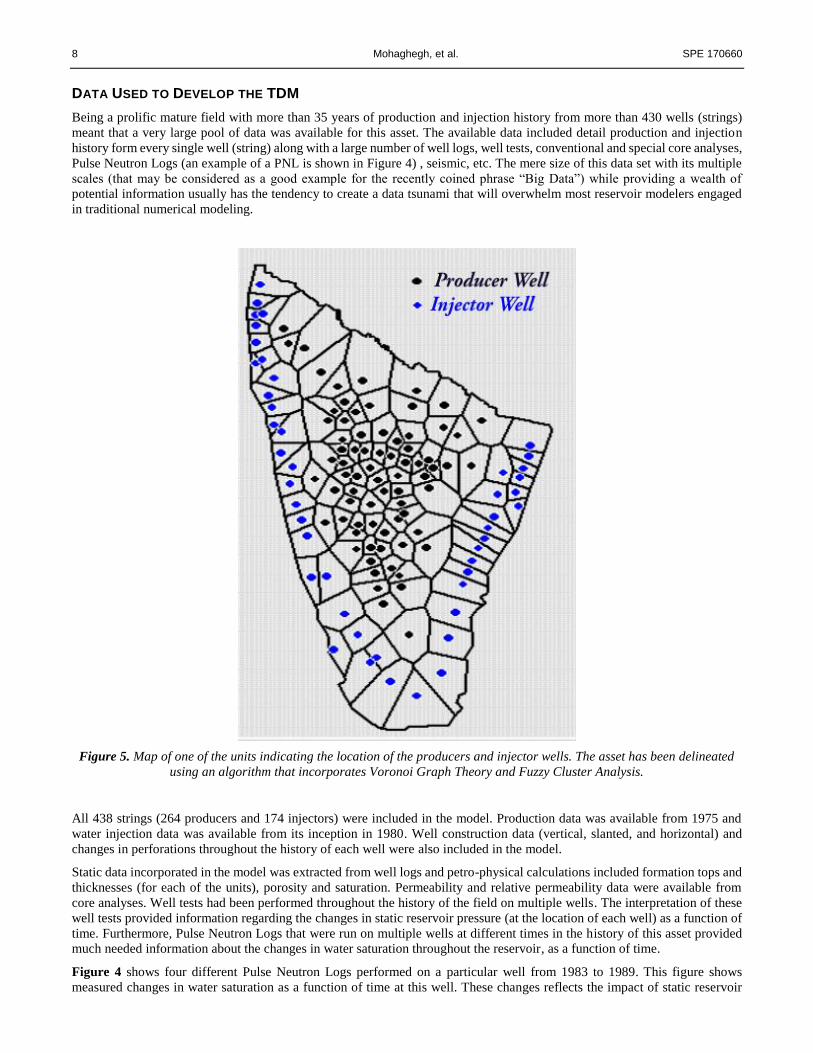
Figure 4. Example of the Pulse Neutron Log (PNL) available for several wells at different points in time. For example four
PNL was available for this particular well.
8 Mohaghegh, et al. SPE 170660
DATA USED TO DEVELOP THE TDM
Being a prolific mature field with more than 35 years of production and injection history from more than 430 wells (strings)
meant that a very large pool of data was available for this asset. The available data included detail production and injection
history form every single well (string) along with a large number of well logs, well tests, conventional and special core analyses,
Pulse Neutron Logs (an example of a PNL is shown in Figure 4) , seismic, etc. The mere size of this data set with its multiple
scales (that may be considered as a good example for the recently coined phrase “Big Data”) while providing a wealth of
potential information usually has the tendency to create a data tsunami that will overwhelm most reservoir modelers engaged
in traditional numerical modeling.
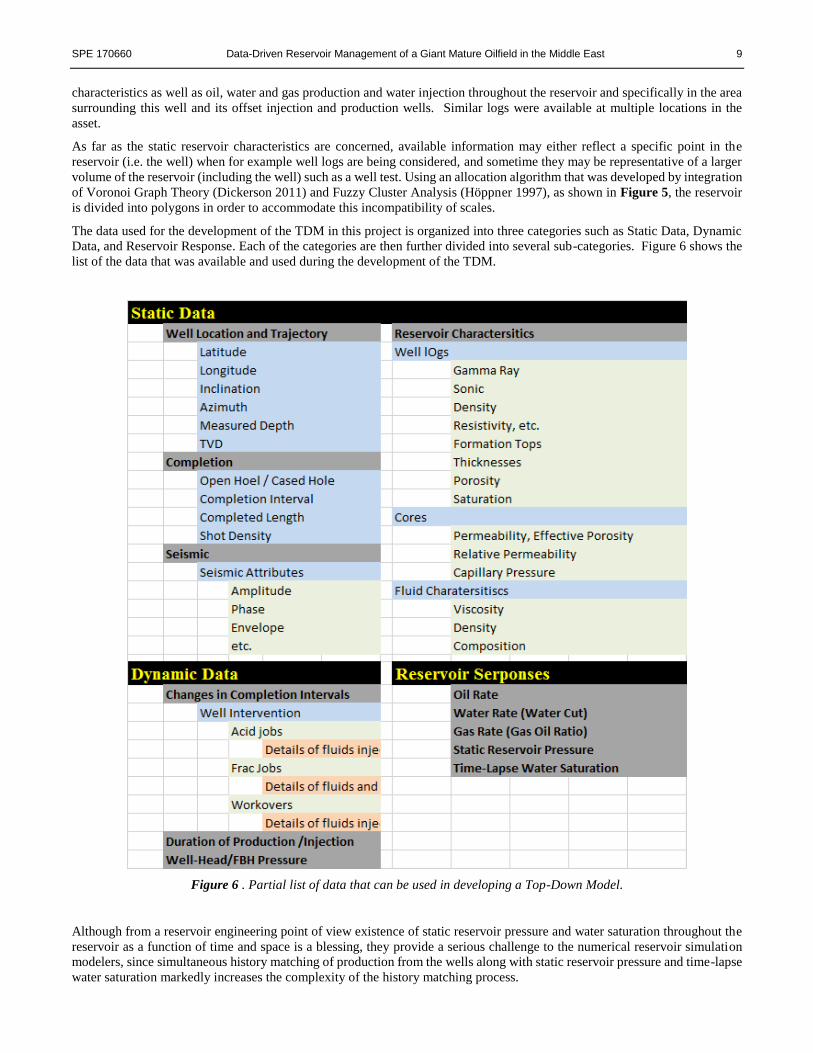
Figure 5. Map of one of the units indicating the location of the producers and injector wells. The asset has been delineated
using an algorithm that incorporates Voronoi Graph Theory and Fuzzy Cluster Analysis.
All 438 strings (264 producers and 174 injectors) were included in the model. Production data was available from 1975 and
water injection data was available from its inception in 1980. Well construction data (vertical, slanted, and horizontal) and
changes in perforations throughout the history of each well were also included in the model.
Static data incorporated in the model was extracted from well logs and petro-physical calculations included formation tops and
thicknesses (for each of the units), porosity and saturation. Permeability and relative permeability data were available from
core analyses. Well tests had been performed throughout the history of the field on multiple wells. The interpretation of these
well tests provided information regarding the changes in static reservoir pressure (at the location of each well) as a function of
time. Furthermore, Pulse Neutron Logs that were run on multiple wells at different times in the history of this asset provided
much needed information about the changes in water saturation throughout the reservoir, as a function of time.
Figure 4 shows four different Pulse Neutron Logs performed on a particular well from 1983 to 1989. This figure shows
measured changes in water saturation as a function of time at this well. These changes reflects the impact of static reservoir
SPE 170660 Data-Driven Reservoir Management of a Giant Mature Oilfield in the Middle East 9
characteristics as well as oil, water and gas production and water injection throughout the reservoir and specifically in the area
surrounding this well and its offset injection and production wells. Similar logs were available at multiple locations in the
asset.
As far as the static reservoir characteristics are concerned, available information may either reflect a specific point in the
reservoir (i.e. the well) when for example well logs are being considered, and sometime they may be representative of a larger
volume of the reservoir (including the well) such as a well test. Using an allocation algorithm that was developed by integration
of Voronoi Graph Theory (Dickerson 2011) and Fuzzy Cluster Analysis (Höppner 1997), as shown in Figure 5, the reservoir
is divided into polygons in order to accommodate this incompatibility of scales.
The data used for the development of the TDM in this project is organized into three categories such as Static Data, Dynamic
Data, and Reservoir Response. Each of the categories are then further divided into several sub-categories. Figure 6 shows the
list of the data that was available and used during the development of the TDM.
Figure 6 . Partial list of data that can be used in developing a Top-Down Model.
Although from a reservoir engineering point of view existence of static reservoir pressure and water saturation throughout the
reservoir as a function of time and space is a blessing, they provide a serious challenge to the numerical reservoir simulation
modelers, since simultaneous history matching of production from the wells along with static reservoir pressure and time-lapse
water saturation markedly increases the complexity of the history matching process.
10 Mohaghegh, et al. SPE 170660
One of the main reasons for reaching out to a new and different reservoir simulation and modeling technology such as TDM in
this particular asset, was the massive challenge associated with preforming such a complex, simultaneous and multi-objective
(production, static pressure and time-lapse saturation) history matching on more than 260 wells producing from five different
units.
A cautionary note needs to be added at this point. As technologies such as data-driven modeling, data-driven analytics,
predictive analytics, and data mining have started to enjoy certain amount of popularity among E&P professionals, misuse of
these technologies have been emerging, mostly by well-intended individuals that either do not have a solid background,
experience and understanding of the reservoir and production engineering (statisticians, mathematicians, AI and data mining
experts with background in other – mostly non-physics-based – industries …), or by E&P professionals with limited
understanding of data-driven analytics and machine learning.
Attempts to correlate production and injection in an asset without giving the required attention to the fundamentals of fluid
flow in porous media, at best, provides superficial results that cannot be trusted to generate fundamentally sound and repeatable
results. These attempts are usually made using the over-the-counter statistical packages that have not been custom-developed
to handle such challenging tasks. These tools, at the very best and when used appropriately, can provide multiple visualization
schemes that are equally useful in the oil and gas industry as they are in pharmaceutical, social networking, retail, or any other
industry, for that matter. This is due to the fact that these generic and mainly statistical tools lack the very important and vital
component of domain relevance that can be appropriately used by the domain experts.
It has been the authors’ experience that fundamental understanding of geosciences, reservoir engineering, production
engineering and reservoir modeling, as well as access to fit-for-purpose, and custom-made data-driven analytics and machine
learning workflows are an important requirement for successful development of reservoir simulation models that are solely
based on measured data.
Figure 7. General flow chart of the Top-Down Model design for this specific asset.
TOP-DOWN MODEL TRAINING & HISTORY MATCHING
Once the assimilation of the spatio-temporal database is completed a series of pattern recognition and data mining exercises
are performed. These data mining and pattern recognition exercises serve multiple purposes. They are a crucial step in
understanding and learning the reservoir that is being modeled. They reveal the influence of different parameters in the
production from the asset. They help the modeler in understanding the impact of reservoir characteristics versus the design
parameters in the particular asset. Data mining and pattern recognition exercises shed light on all these and eventually help in
identifying the best set of parameters that need to be used as input into the data-driven models that will be developed as part of
the TDM.
SPE 170660 Data-Driven Reservoir Management of a Giant Mature Oilfield in the Middle East 11
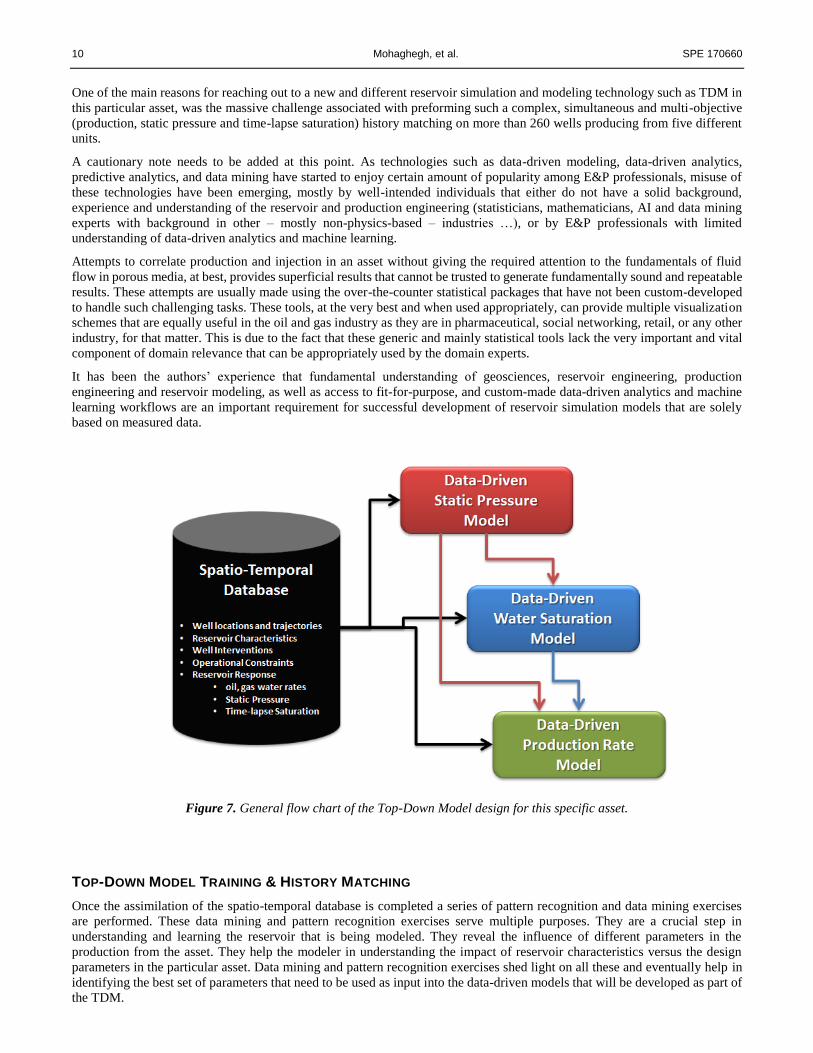
For example for this case study the project objectives determined the number of data-driven models that needed to be developed
and used in sequence, in order to form the final TDM. Figure 7 shows the flow diagram for the TDM in this study. In this flow
diagram it is shown that “Data-Driven Static Pressure” model had to be developed first and its results (with other data in the
spatio-temporal database) had to be used in order to develop the “Data-Driven Water Saturation” model. Result of “Data-
Driven Static Pressure” and the “Data-Driven Water Saturation” models along with other data in the spatio-temporal database
were used to develop the “Data-Driven Production Rate” model.
The final TDM for this asset included three data-driven models that would run in sequence (this is called the cascading scheme
as shown in Figure 7) in order to provide the required results for this asset. For example static data from the spatio-temporal
database along with dynamic data (mainly operational constraints) from the spatio-temporal database at time “t” are needed (as
well as the “Static Reservoir Pressure” at time “t-1”) to generate the “Static Reservoir Pressure” at time “t” for all the wells in
the asset.
Next, static data along with dynamic data at time “t” (mainly operational constraints), as well as recently calculated “Static
Reservoir Pressure” at time “t” are required as input to the “Data-Driven Water Saturation” model (as well as the “Water
Saturation” at time “t-1”) in order to calculate “Water Saturation” at time “t” for all the wells in the asset. Similarly, to calculate
the production rates at each well at time “t”, static data along with dynamic data from time “t” as well as recently calculated
“Static Reservoir Pressure” and “Water Saturation” at time “t” (along with Production Rate from time “t-1”) are required to be
used in the “Data-Driven Production Rate” model.
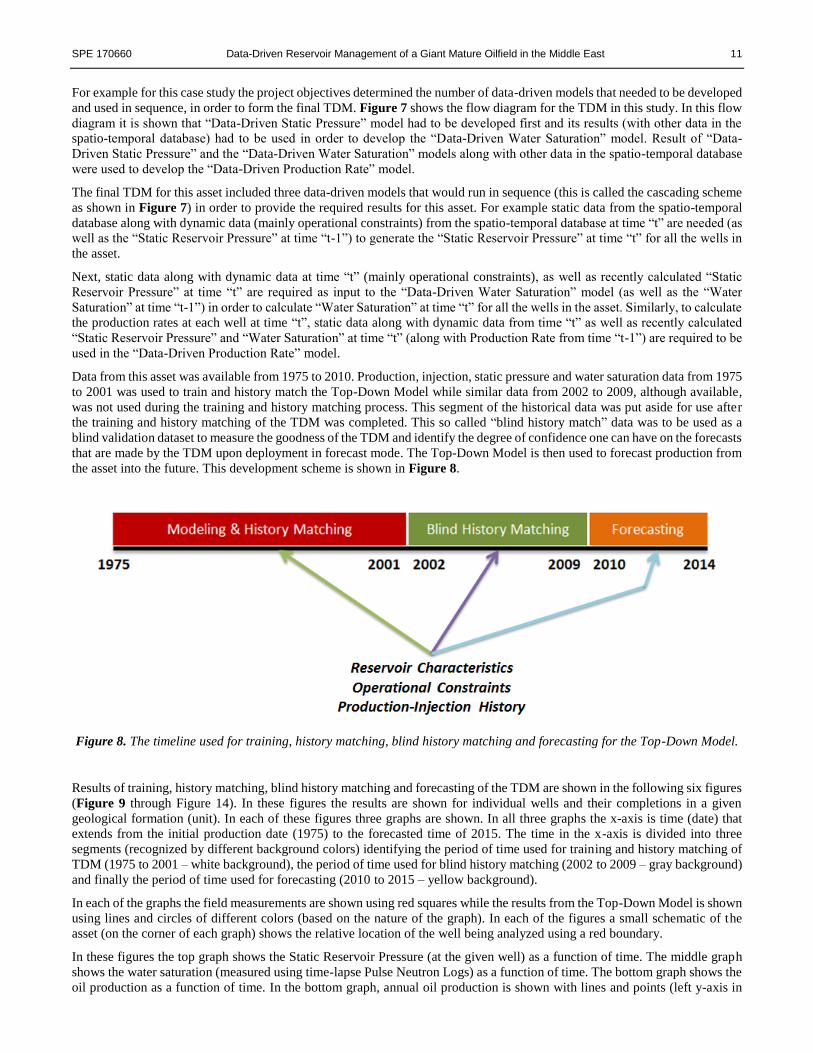
Data from this asset was available from 1975 to 2010. Production, injection, static pressure and water saturation data from 1975
to 2001 was used to train and history match the Top-Down Model while similar data from 2002 to 2009, although available,
was not used during the training and history matching process. This segment of the historical data was put aside for use after
the training and history matching of the TDM was completed. This so called “blind history match” data was to be used as a
blind validation dataset to measure the goodness of the TDM and identify the degree of confidence one can have on the forecasts
that are made by the TDM upon deployment in forecast mode. The Top-Down Model is then used to forecast production from
the asset into the future. This development scheme is shown in Figure 8.
Figure 8. The timeline used for training, history matching, blind history matching and forecasting for the Top-Down Model.
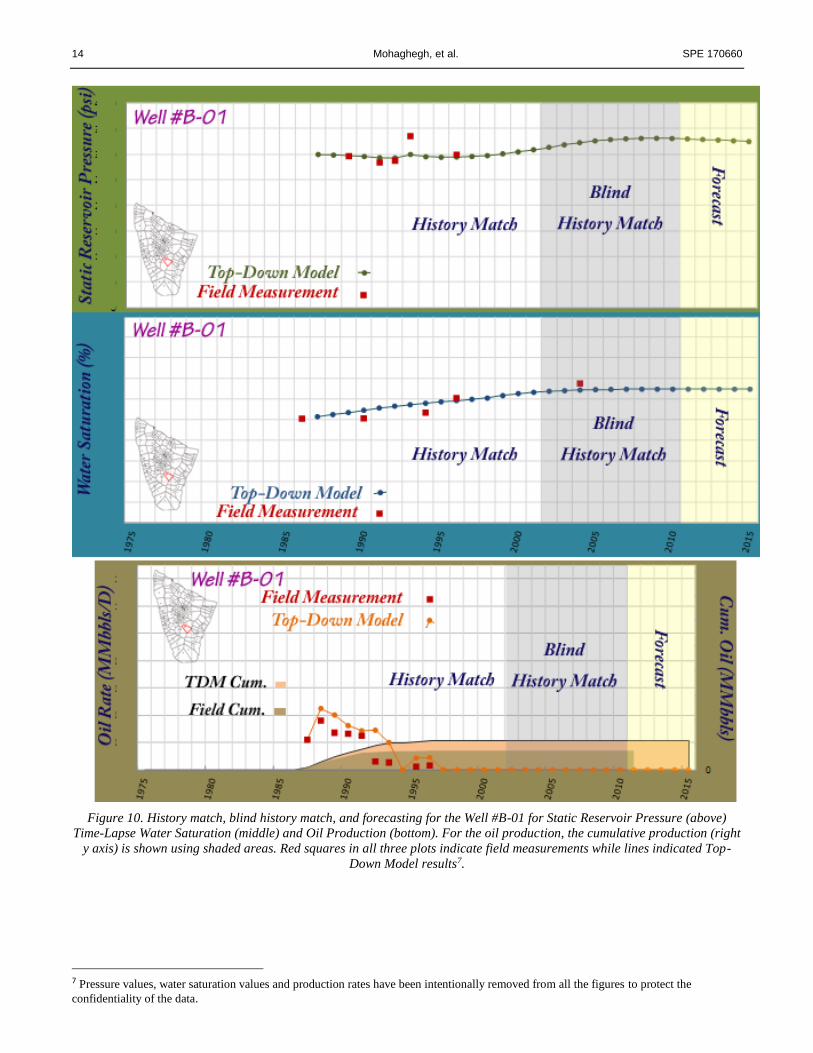
Results of training, history matching, blind history matching and forecasting of the TDM are shown in the following six figures
(Figure 9 through Figure 14). In these figures the results are shown for individual wells and their completions in a given
geological formation (unit). In each of these figures three graphs are shown. In all three graphs the x-axis is time (date) that
extends from the initial production date (1975) to the forecasted time of 2015. The time in the x-axis is divided into three
segments (recognized by different background colors) identifying the period of time used for training and history matching of
TDM (1975 to 2001 – white background), the period of time used for blind history matching (2002 to 2009 – gray background)
and finally the period of time used for forecasting (2010 to 2015 – yellow background).
In each of the graphs the field measurements are shown using red squares while the results from the Top-Down Model is shown
using lines and circles of different colors (based on the nature of the graph). In each of the figures a small schematic of the
asset (on the corner of each graph) shows the relative location of the well being analyzed using a red boundary.
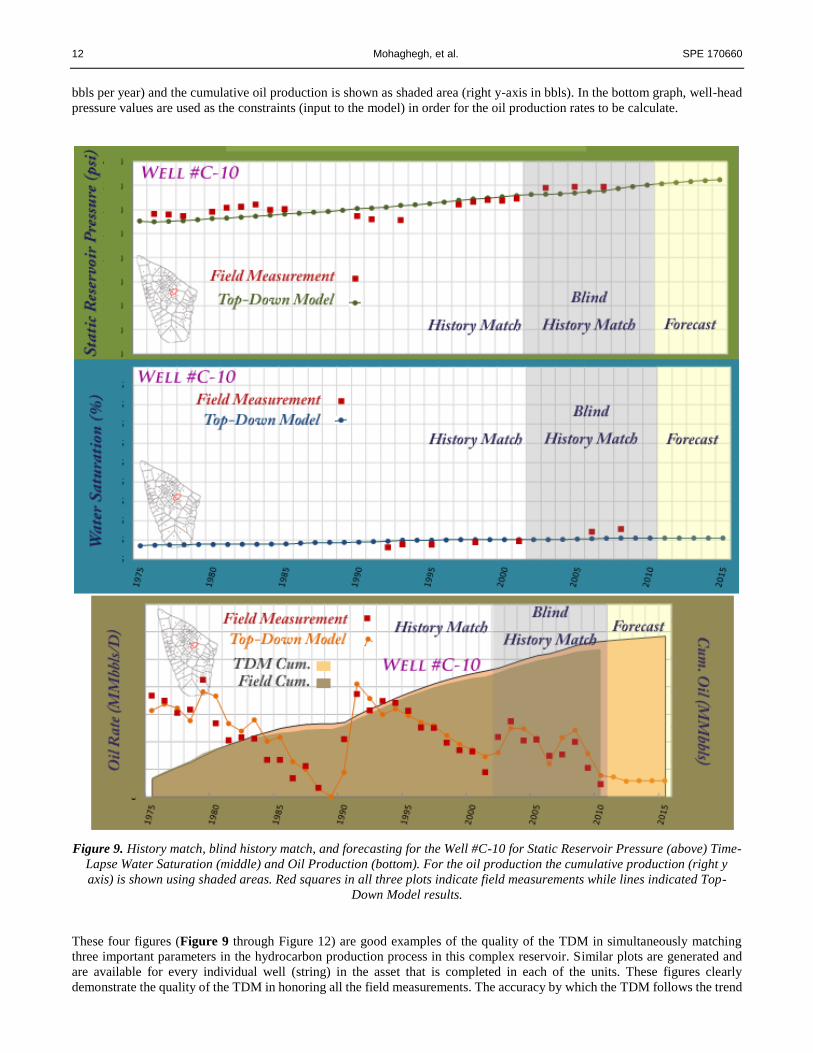
In these figures the top graph shows the Static Reservoir Pressure (at the given well) as a function of time. The middle graph
shows the water saturation (measured using time-lapse Pulse Neutron Logs) as a function of time. The bottom graph shows the
oil production as a function of time. In the bottom graph, annual oil production is shown with lines and points (left y-axis in
12 Mohaghegh, et al. SPE 170660
bbls per year) and the cumulative oil production is shown as shaded area (right y-axis in bbls). In the bottom graph, well-head
pressure values are used as the constraints (input to the model) in order for the oil production rates to be calculate.
Figure 9. History match, blind history match, and forecasting for the Well #C-10 for Static Reservoir Pressure (above) Time-
Lapse Water Saturation (middle) and Oil Production (bottom). For the oil production the cumulative production (right y
axis) is shown using shaded areas. Red squares in all three plots indicate field measurements while lines indicated Top-
Down Model results.
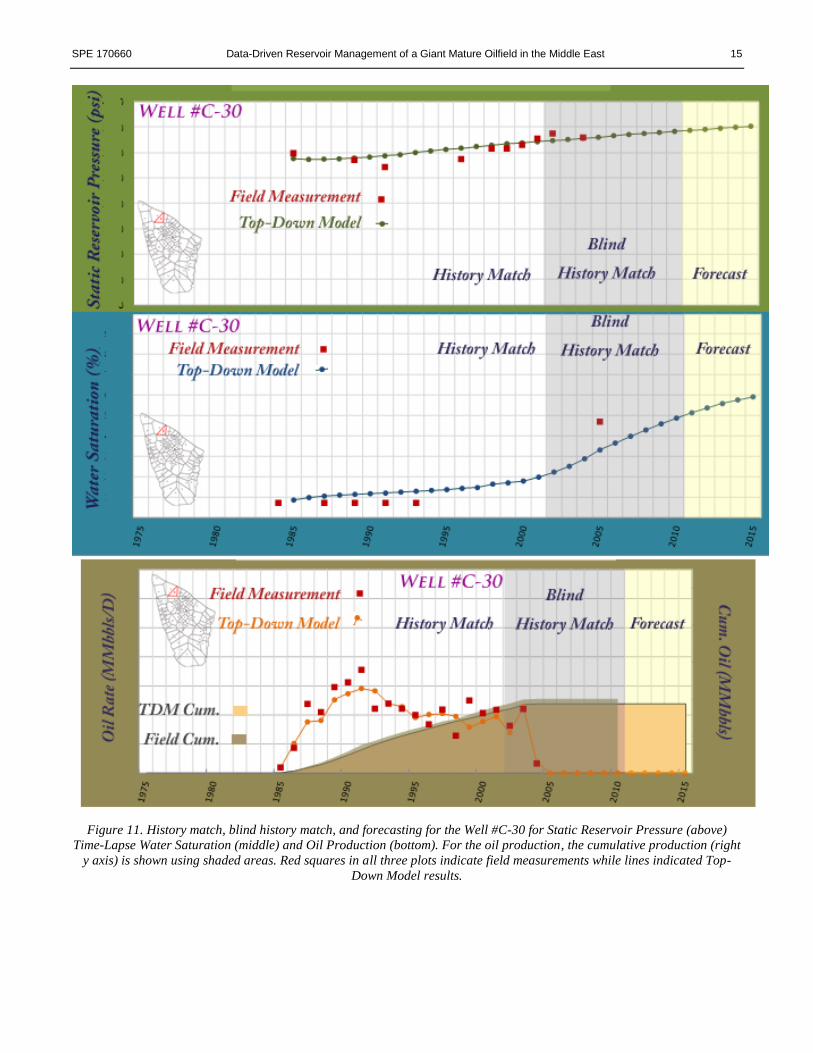
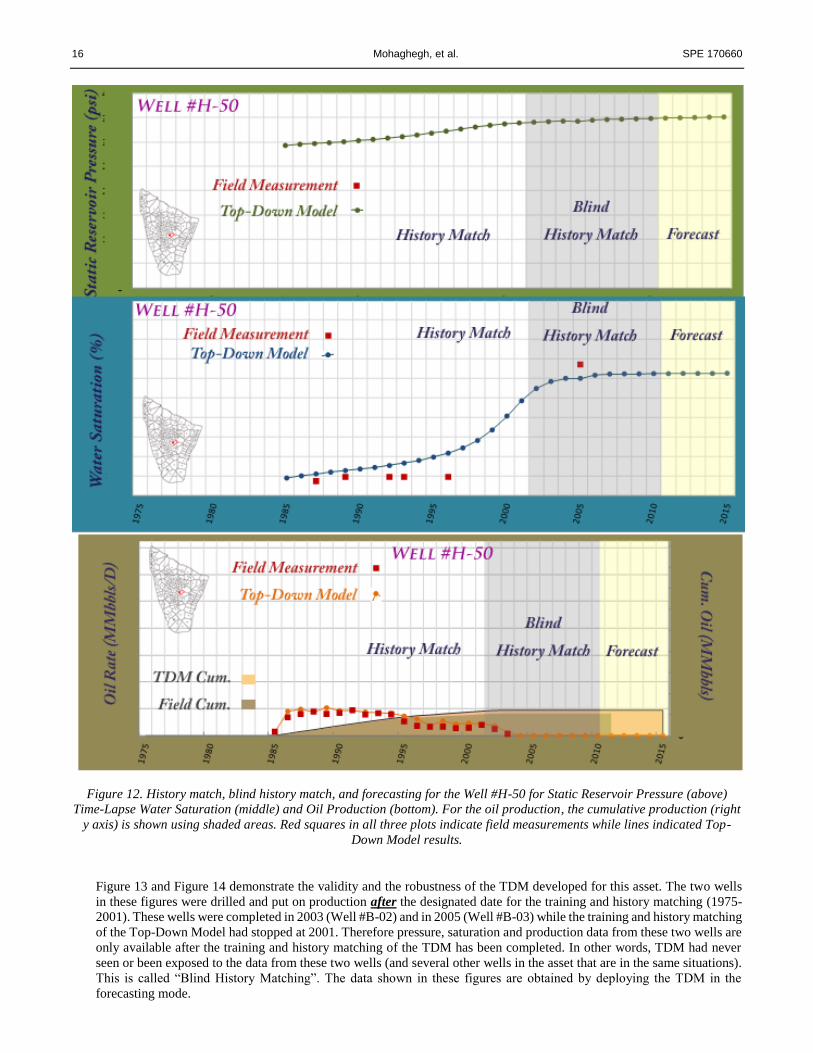
These four figures (Figure 9 through Figure 12) are good examples of the quality of the TDM in simultaneously matching
three important parameters in the hydrocarbon production process in this complex reservoir. Similar plots are generated and
are available for every individual well (string) in the asset that is completed in each of the units. These figures clearly
demonstrate the quality of the TDM in honoring all the field measurements. The accuracy by which the TDM follows the trend
SPE 170660 Data-Driven Reservoir Management of a Giant Mature Oilfield in the Middle East 13
of change in static reservoir pressure, water saturation and oil production, indicates that the data-driven models have captured
the essence (and the physics) of the fluid flow through this complex and naturally fractured carbonate reservoir. The quality of
the match specifically during the blind history match period points to the robustness of this Top-Down Model.
Unlike some recently published studies that use only production and injection pairs of data in order to build a model (e.g. for
water-flooding operations), inputs to the TDM (all three data-driven models) include and therefore are conditioned to well
location and trajectory details, reservoir characteristics, and operational constraints. In other words, in the TDM model, when
the location of the well changes, it constitutes a change in the reservoir characteristics (geology as measured by well logs, cores
and well tests) that will impact the static reservoir pressure, water saturation and production from the well (model outputs).
This resembles the type of reservoir simulation models that a reservoir engineer is used to seeing and dealing with.
In purely statistical models that are only based on production-injection pairs of data, information such as well location and
trajectory, well completion, operational conditions and reservoir characteristics plays no role in predicting responses of wells
in an asset. In such cases the model resembles purely time-series modeling (they are independent of space/geology), an
approach that does not lend itself to reservoir simulation and modeling. It is, therefore, understandable why some reservoir
engineers would have a hard time trusting the predictive capabilities of such models and the reluctance of accepting the
technology that generates such results. In such cases these critics ask the famous question; “Does the Correlation Mean
Causality?” which is the main question that is posed to any and all models generated using a strictly statistical approaches.
It is important to note that to capture the complexities of fluid flow in porous media using the Top-Down Modeling technology
one must take into account many details. Some of the details and engineering complexities that must be incorporated into a
reservoir model (and is honored by and incorporated in the TDM) include, but are not limited to:
a. Not all wells are drilled at the same time. The fact that in an oilfield wells are drilled in phases is one of the most
important issues that must be taken into account, when building a data-driven reservoir model. Although this may
sound like a trivial fact to a non-reservoir engineer4, the consequences of not taking this important issue into account
is far reaching. The fact that wells in a hydrocarbon asset are drilled in multiple phase impacts the number and the
identity of the offset wells in each time-step during the assimilation of the spatio-temporal database, making a marked
difference in how the database is constructed.
A sound and robust Top-Down Model must take into account the interference between wells as they are put on
production/injection. This means that static and dynamic information of the offset wells must be taken into account
while assembling the database for a given well. Since wells are put into production at different times, the offset wells
are constantly changing as a function of time (this would be sensitive to the time resolution that is selected for a given
TDM). A well that started as an important offset to a given well at the early time in the life of that well, may soon give
its place to another offset well that have been drilled later but is closer (from a geological as well as reservoir
characteristics point of view5) to the well of interest.
b. There is a practical limit regarding the measurements made in the field. Principles of fluid flow through porous media
indicate that pressure change at any given point in the reservoir impacts all other wells throughout the reservoir,
instantaneously6. Although this is true from a theoretical point of view, there are physical and practical limits on how
much of such impact can be measured. This is controlled by the distance (please see the footnote regarding the notion
of distance in reservoir engineering) from the source of pressure change. This practical limit must be taken into account
while assembling the spatio-temporal database.
c. Impact of reservoir behavior should be distinguished from the impact of man-made incidents. If there are no man-
made (man-caused) interferences and the production from a given well is completely and solely controlled by the
reservoir, assuming no offset well interference either, production profile of the well will display a clean and non-
noisy behavior. The fact that most of the time the actual field measurements (oil production rates for example) are
noisy and include multiple ups and downs, has to do with human interventions (surface facility issues that cause
fluctuation in back pressure, well shut-ins, etc.) These non-reservoir impacts need to be communicated with the data-
driven model during training.
4 Some operators have chosen to approach data-driven analytics in their operations by employing expertise of statisticians and machine
learning experts, or by using generic, off-the-shelf statistical or machine learning tools. Most of the time such practices results in some quick
excitements at the beginning but are usually followed by missed promises, disappointments, or at best, mediocre results. One of the main
reason for such outcomes is the lack of domain expertise or even domain sensitivity. Our experience of more than two decades of research
and development in application of advanced data-driven analytics in the E&P industry has taught us that employing E&P professionals and
training them in the art and science of artificial intelligence, data mining, machine learning, and advanced data-driven analytics is a far more
effective approach. 5 Please note that distance in the context of fluid flow in porous media is concerned with several reservoir parameters including
permeability. 6 Diffusivity equation is a parabolic partial differential equation.
14 Mohaghegh, et al. SPE 170660
Figure 10. History match, blind history match, and forecasting for the Well #B-01 for Static Reservoir Pressure (above)
Time-Lapse Water Saturation (middle) and Oil Production (bottom). For the oil production, the cumulative production (right
y axis) is shown using shaded areas. Red squares in all three plots indicate field measurements while lines indicated Top-
Down Model results7.
7 Pressure values, water saturation values and production rates have been intentionally removed from all the figures to protect the
confidentiality of the data.
SPE 170660 Data-Driven Reservoir Management of a Giant Mature Oilfield in the Middle East 15
Figure 11. History match, blind history match, and forecasting for the Well #C-30 for Static Reservoir Pressure (above)
Time-Lapse Water Saturation (middle) and Oil Production (bottom). For the oil production, the cumulative production (right
y axis) is shown using shaded areas. Red squares in all three plots indicate field measurements while lines indicated Top-
Down Model results.
16 Mohaghegh, et al. SPE 170660
Figure 12. History match, blind history match, and forecasting for the Well #H-50 for Static Reservoir Pressure (above)
Time-Lapse Water Saturation (middle) and Oil Production (bottom). For the oil production, the cumulative production (right
y axis) is shown using shaded areas. Red squares in all three plots indicate field measurements while lines indicated Top-
Down Model results.
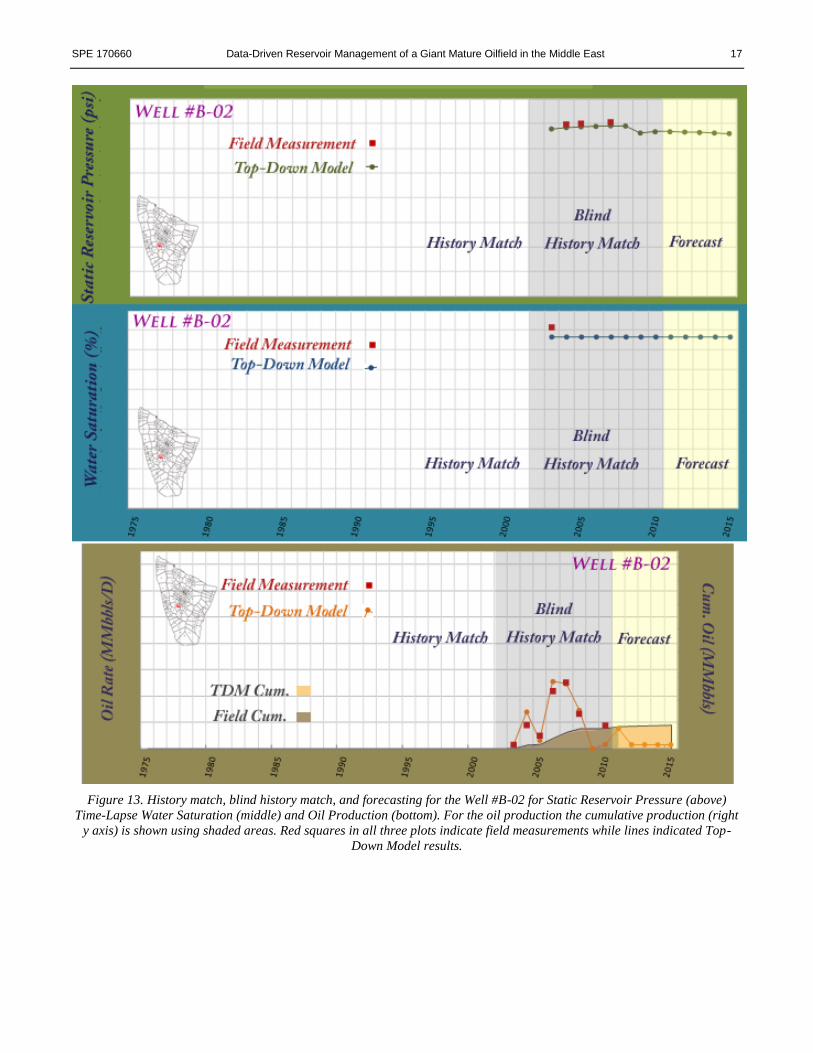
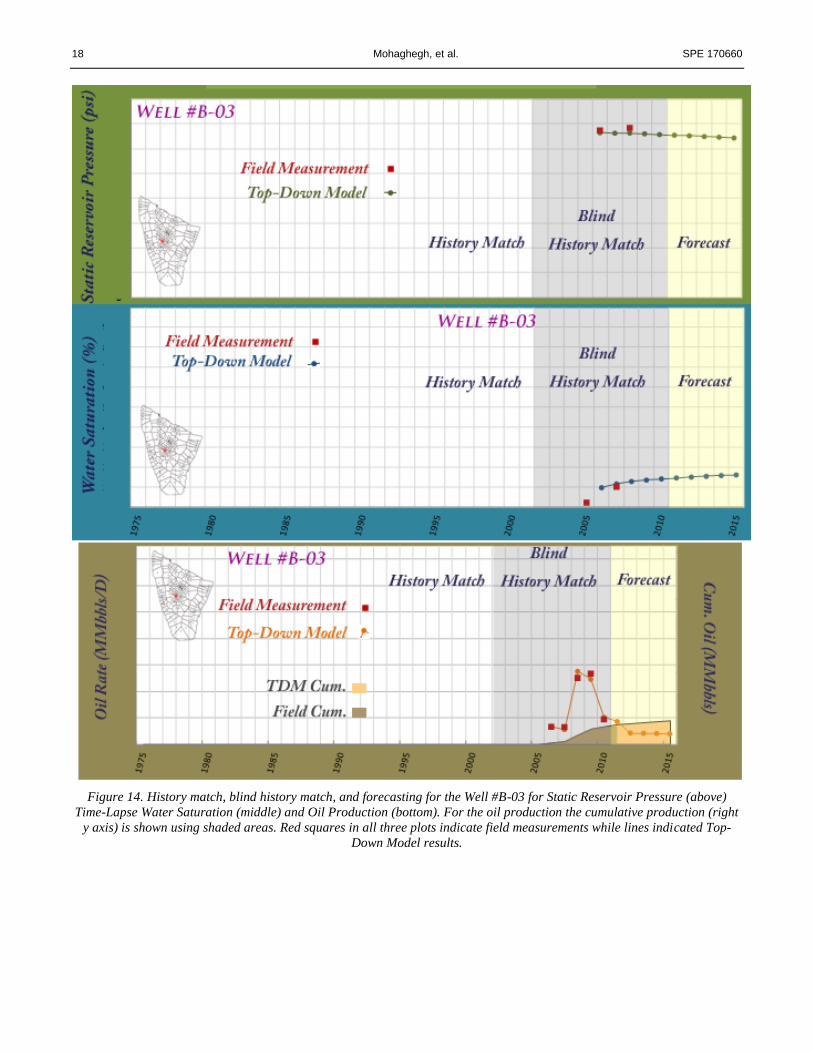
Figure 13 and Figure 14 demonstrate the validity and the robustness of the TDM developed for this asset. The two wells
in these figures were drilled and put on production after the designated date for the training and history matching (1975-
2001). These wells were completed in 2003 (Well #B-02) and in 2005 (Well #B-03) while the training and history matching
of the Top-Down Model had stopped at 2001. Therefore pressure, saturation and production data from these two wells are
only available after the training and history matching of the TDM has been completed. In other words, TDM had never
seen or been exposed to the data from these two wells (and several other wells in the asset that are in the same situations).
This is called “Blind History Matching”. The data shown in these figures are obtained by deploying the TDM in the
forecasting mode.
SPE 170660 Data-Driven Reservoir Management of a Giant Mature Oilfield in the Middle East 17
Figure 13. History match, blind history match, and forecasting for the Well #B-02 for Static Reservoir Pressure (above)
Time-Lapse Water Saturation (middle) and Oil Production (bottom). For the oil production the cumulative production (right
y axis) is shown using shaded areas. Red squares in all three plots indicate field measurements while lines indicated Top-
Down Model results.
18 Mohaghegh, et al. SPE 170660
Figure 14. History match, blind history match, and forecasting for the Well #B-03 for Static Reservoir Pressure (above)
Time-Lapse Water Saturation (middle) and Oil Production (bottom). For the oil production the cumulative production (right
y axis) is shown using shaded areas. Red squares in all three plots indicate field measurements while lines indicated Top-
Down Model results.
SPE 170660 Data-Driven Reservoir Management of a Giant Mature Oilfield in the Middle East 19
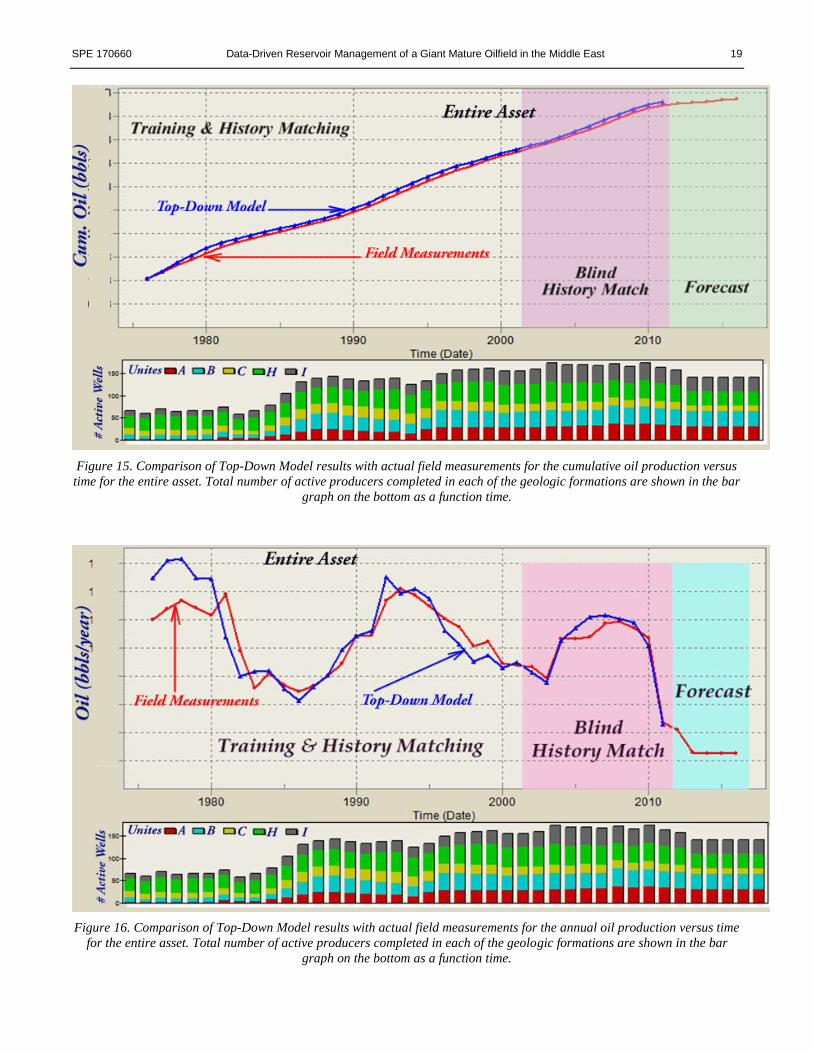
Figure 15. Comparison of Top-Down Model results with actual field measurements for the cumulative oil production versus
time for the entire asset. Total number of active producers completed in each of the geologic formations are shown in the bar
graph on the bottom as a function time.
Figure 16. Comparison of Top-Down Model results with actual field measurements for the annual oil production versus time
for the entire asset. Total number of active producers completed in each of the geologic formations are shown in the bar
graph on the bottom as a function time.
20 Mohaghegh, et al. SPE 170660
Once the history matching process is completed for all the wells in the asset, the production from both the field measurements
as well as the results from the Top-Down Model are summed in order to calculate the oil production for the entire asset. Results
of this exercise are shown in Figure 15 and Figure 16. Figure 15 shows the cumulative oil production while Figure 16 shows
the annual oil production as a function of time.
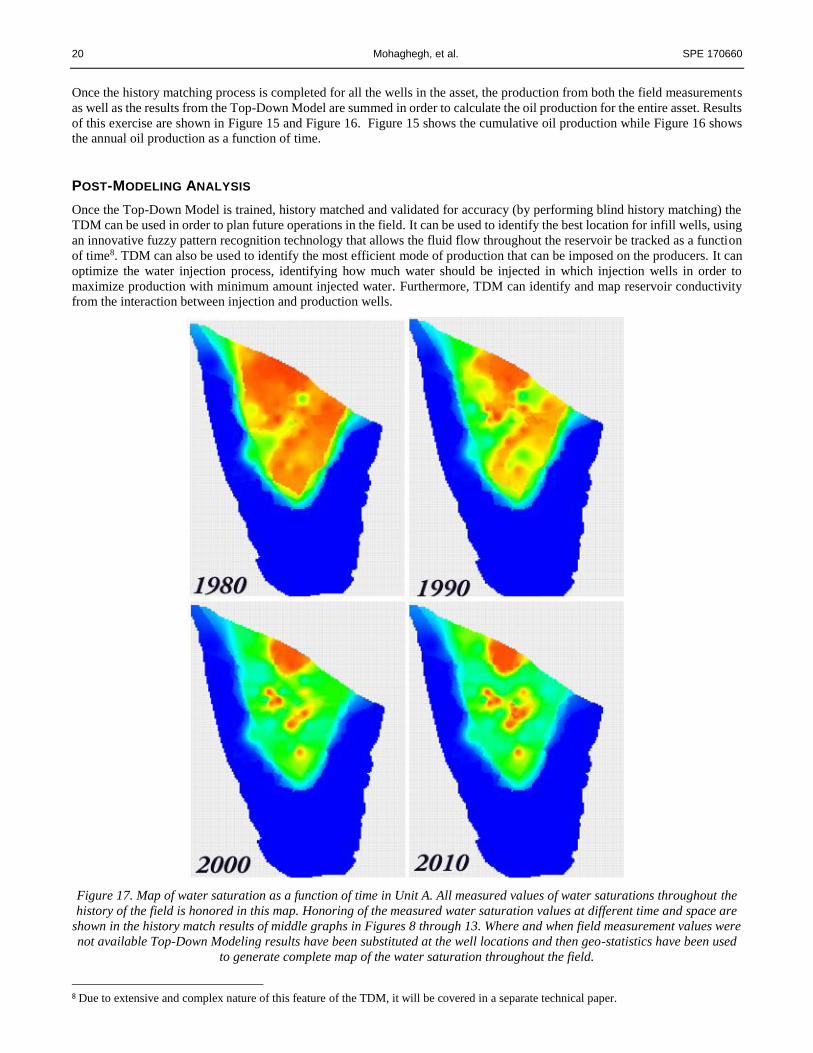
POST-MODELING ANALYSIS
Once the Top-Down Model is trained, history matched and validated for accuracy (by performing blind history matching) the
TDM can be used in order to plan future operations in the field. It can be used to identify the best location for infill wells, using
an innovative fuzzy pattern recognition technology that allows the fluid flow throughout the reservoir be tracked as a function
of time8. TDM can also be used to identify the most efficient mode of production that can be imposed on the producers. It can
optimize the water injection process, identifying how much water should be injected in which injection wells in order to
maximize production with minimum amount injected water. Furthermore, TDM can identify and map reservoir conductivity
from the interaction between injection and production wells.
Figure 17. Map of water saturation as a function of time in Unit A. All measured values of water saturations throughout the
history of the field is honored in this map. Honoring of the measured water saturation values at different time and space are
shown in the history match results of middle graphs in Figures 8 through 13. Where and when field measurement values were
not available Top-Down Modeling results have been substituted at the well locations and then geo-statistics have been used
to generate complete map of the water saturation throughout the field.
8 Due to extensive and complex nature of this feature of the TDM, it will be covered in a separate technical paper.
SPE 170660 Data-Driven Reservoir Management of a Giant Mature Oilfield in the Middle East 21
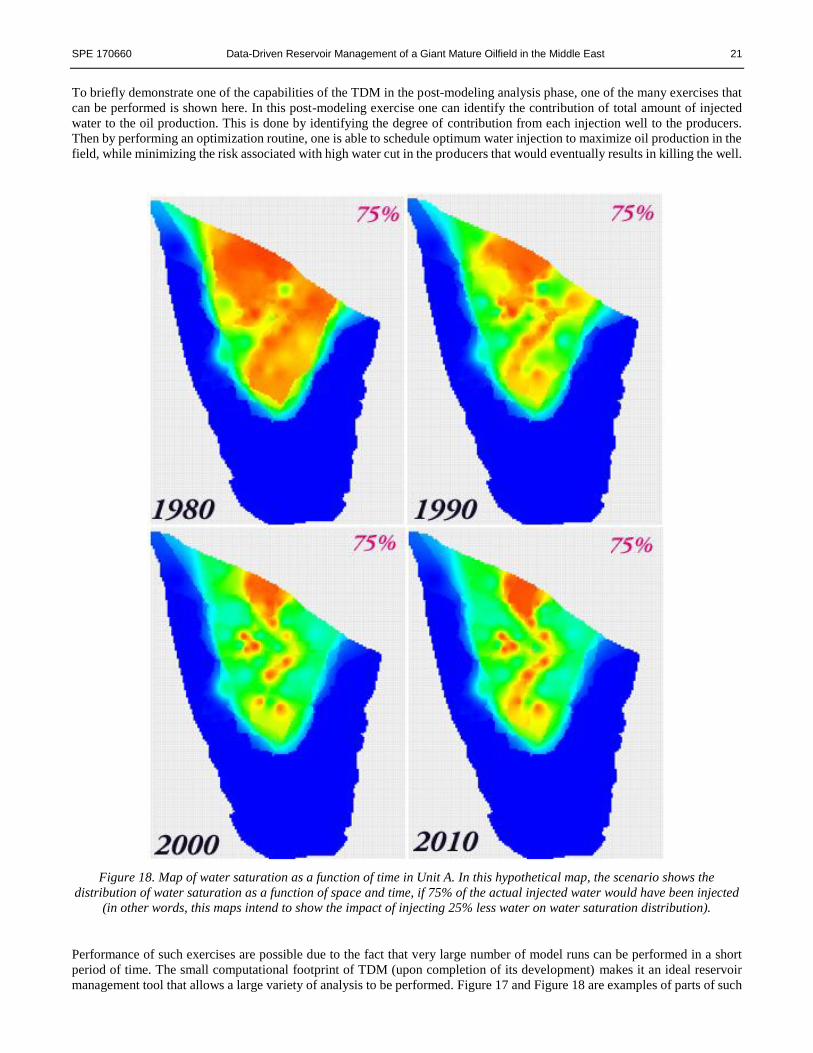
To briefly demonstrate one of the capabilities of the TDM in the post-modeling analysis phase, one of the many exercises that
can be performed is shown here. In this post-modeling exercise one can identify the contribution of total amount of injected
water to the oil production. This is done by identifying the degree of contribution from each injection well to the producers.
Then by performing an optimization routine, one is able to schedule optimum water injection to maximize oil production in the
field, while minimizing the risk associated with high water cut in the producers that would eventually results in killing the well.
Figure 18. Map of water saturation as a function of time in Unit A. In this hypothetical map, the scenario shows the
distribution of water saturation as a function of space and time, if 75% of the actual injected water would have been injected
(in other words, this maps intend to show the impact of injecting 25% less water on water saturation distribution).
Performance of such exercises are possible due to the fact that very large number of model runs can be performed in a short
period of time. The small computational footprint of TDM (upon completion of its development) makes it an ideal reservoir
management tool that allows a large variety of analysis to be performed. Figure 17 and Figure 18 are examples of parts of such
22 Mohaghegh, et al. SPE 170660
an exercise. This specific post-modeling analysis that is currently being performed for the Unit #1 in this asset9 will be
completed and presented in a future technical paper. Figure 17 shows the map of water saturation in the field as a function of
time developed based on total amount of water that was injected in Unit #1.
In Figure 18, similar maps are shown this time in a scenario that only 75% of the actual volume has been injected in each of
the injection wells. In other words, by examining multiple scenarios as such, while the TDM is deployed in its forecasting
mode, one can identify the optimum amount of water that need to be injected in this unit (in each individual well) without
sacrificing oil production. Performance of this exercise in other units have shown very promising results, where millions of
barrels of water could have been saved (when compared with already scheduled water injection) with positive impact on oil
production. In other words, TDM was able to show that oil production can be increased by selectively changing the amount of
injection in multiple injection wells where the total injection would be less than what was originally scheduled.
CONCLUSIONS
Developing reliable reservoir simulation models for mature fields is a challenging prospect. The conventional wisdom suggests
that increase in data availability must result in better understanding of the characteristics of the asset which in turn should
facilitate building better, more accurate, more reliable and more robust reservoir simulation model for the asset. This is
generally true, but the reality on the ground suggest that when it comes to mature fields, this conventional wisdom, sometimes,
does not work in our favor. In other words, in some mature fields, as the asset ages and more and more information through
data becomes available, it results in a tough challenge for the reservoir simulation and modeling efforts. This is due to the fact
that as the reservoir engineers and modeler try to build a representative numerical model of the asset, they face a large number
and variety of measured data as reservoir responses that they need to match simultaneously.
The asset that was modeled in this study is a good example. In this asset, not only the production from the wells needed to be
matched, all the matched points needed to comply with measured static reservoir pressures and time-lapse water saturations
throughout the history of the asset. Having so many anchors during numerical modeling will limit the number and the range of
the parameters that can and need to be tuned in order to achieve a history match. Furthermore, as the number of wells increase,
which is usually the case in mature fields, the match needs to achieve in a larger spectrum of space and time and therefore, the
process will become even more challenging.
In such a data-rich environment, data-driven solutions are a natural substitution, or complement to the numerical reservoir
simulation models. If the right workflow is adopted, the massive amount of available data, that may be argued to be the
manifestation of “Big Data” in our industry, can result in an accurate, robust and interactive reservoir model that can be used
effectively to drive future operations in the field. This study and its results are a solid demonstration of the use of a custom
designed, data-driven workflows for a data-rich, mature field environment.
REFERENCES
Al-Sharhan 1993; Al-Sharhan, A.S.: Bu Hasa Field – United Arab Emirates, Rub al Khali Basin, Abu Dhabi, Structural Traps
VIII, Compiled by N.H. Foster and Beaumont, Treaties of Petroleum Geology, Atlas of Oil and Gas Fields, AAPG 1993.
Chevron Corporation Website, 2012, Reservoir Management; http://www.chevron.com/deliveringenergy/oil/reservoirmanagement/ Site
visited July 2013.
Dickerson 2011; Dickerson, M.T., Goodrich, M.T., Dickerson, M.D., and Zhuo, Y.D.: Round-Trip Voronoi Diagrams and
Doubling Density in Geographic Networks. Transactions on Computational Science 14: 211-238 (2011)
Esmaili 2012; Esmaili, S., Kalantari, M., and Mohaghegh, S.: Modeling and History Matching Hydrocarbon Production from
Marcellus Shale using Data Mining and Pattern Recognition Technologies. SPE 161184 - SPE Eastern Regional Conference.
Lexington, Kentucky, USA, 3–5 October 2012.
Gaskari 2007; Gaskari, R., Mohaghegh, S.D., and Jalali, J.: An Integrated Technique for Production Data Analysis (PDA) with
Application to Mature Fields. SPE Production & Operations Journal. November 2007, Volume 22, Number 4. pp 403 - 416.
Gomez 2009; Gomez, Y., Khazaeni, Y., Mohaghegh, S.D., and Gaskari, R.: Top-Down Intelligent Reservoir Modeling
(TDIRM). SPE 124204, Proceedings, 2009 SPE Annual Conference & Exhibition. New Orleans, Louisiana.
Grujic 2010; Grujic, O., Mohaghegh, S.D., and Bromhal, G.: Fast Track Reservoir Modeling of Shale Formations in the
9 Similar exercise was performed for Unit #3 based on a request from an IOC that is a major shareholder in this asset. This IOC has decided
not to allow the publication of this exercise for Unit #3. Publication of similar exercise that is currently being performed for other units
(including Unit #1) will not require the permission from this IOC and therefore will be published upon completion. Figure 17 and Figure
18 are part of this new exercise on Unit #1.
SPE 170660 Data-Driven Reservoir Management of a Giant Mature Oilfield in the Middle East 23
Appalachian Basin. Application to Lower Huron Shale in Eastern Kentucky. SPE 139101, Proceedings, 2010 SPE Eastern
Regional Conference & Exhibition. Morgantown, West Virginia. 12-14 October 2010.
Haghighat 2014; Haghighat, A., Mohaghegh, S.D., Gholami, V. and Moreno, D.; Production Analysis of a Niobrara Field
Using Intelligent Top-Down Modeling. SPE 169573, SPE Western North American and Rocky Mountain Joint Regional
Meeting. Denver, Colorado, USA, 16-18 April 2014.
Höppner 1997; Höppner et al: Fuzzy Cluster Analysis: Methods for Classification, Data Analysis and Image Recognition,
Wiley IBM PC Series, John Wiley & Sons, England. ISBN: 0-471-98864-2.
Kalantari 2010; Kalantari, A.M., Mohaghegh, S.D. and Khazaeni, Y.: New Insight into Integrated Reservoir Management using
Top-Down, Intelligent Reservoir Modeling Technique; Application to a Giant and Complex Oil Field in the Middle East. SPE
132621, Proceedings, 2010 SPE Western Regional Conference & Exhibition. Anaheim, California. 27-29 May 2010.
Kalantari 2011; Kalantari, A.M. and Mohaghegh, S.D.: A New Practical Approach in Modeling and Simulation of Shale Gas
Reservoirs: Application to New Albany Shale. International Journal of Oil, Gas and Coal Technology. Volume 4, No. 2, 2011.
pp 104-133.
Khazaeni 2011; Khazaeni, Y., and Mohaghegh, S.D.: Intelligent Production Modeling Using Full Field Pattern Recognition.
SPE Reservoir Evaluation and Engineering Journal. Volume 14, No. 6, December 2011, pp. 735-749
http://dx.doi.org/10.2118/132643-PA.
Mata 2007; Mata, D., Gaskari, R., and Mohaghegh, S.D.: Field-Wide Reservoir Characterization Based on a New Technique
of Production Data Analysis. SPE 111205, Proceedings, 2007 SPE Eastern Regional Conference & Exhibition. Lexington,
Kentucky, 17-19 October 2007
Mohaghegh 2011; Mohaghegh, S.D.: Reservoir Simulation and Modeling Based On Artificial Intelligence and Data Mining
(AI&DM). Journal of Natural Gas Science and Engineering. Volume 3 (2011), pp. 697-705.
Mohaghegh 2009; Mohaghegh, S.D., and Gaskari, R.: An Intelligent System's Approach for Revitalization of Brown Fields
Using Only Production Rate Data. International Journal of Engineering, February 2009, Volume 22, Number 1. pp 89-106.
Mohaghegh 2012; Mohaghegh, S.D., Grujic, O., Zargari, S., Kalantari, A.M., Bromhal, G: Top-Down, Intelligent Reservoir
Modeling of Oil and Gas Producing Shale Reservoirs: Case Studies. International Journal of Oil, Gas and Coal Technology.
Vol. 5, No.1, 2012 pp. 3 - 28 - DOI: 10.1504/IJOGCT.2012.044175.
Maysami 2013; Maysami, M., Gaskari, R., and Mohaghegh, S. D.; Data Driven Analytics in Powder River Basin, WY. SPE
166111, SPE Annual Technical Conference and Exhibition. New Orleans, Louisiana, September 30 - October 2, 2013.
Thakur 1996 – Thakur, G.C.; What Is Reservoir Management? Journal of Petroleum Technology, Volume 48, Number 6, pp
520-525, June 1996.
Zargari 2010; Zargari, S. and Mohaghegh, S.D.: Development Strategies for Bakken Shale Formation. SPE 139032,
Proceedings, 2010 SPE Eastern Regional Conference & Exhibition. Morgantown, West Virginia. 12-14 October 2010.