spawning escapement of female longfin eels - niwadocs.niwa.co.nz/library/public/far2008-07.pdf ·...
TRANSCRIPT

Spawning escapement of female longfin eels
Eric Graynoth Don Jellyman Marty Bonnett
NIWA P O Box 8602
Riccarton Christchurch
New Zealand Fisheries Assessment Report 2008/7 February 2008
1

Published by Ministry of Fisheries Wellington
2008
ISSN 1175-1584
© Ministry of Fisheries
2008
Citation: Graynoth, E.; Jellyman, D.J.; Bonnett, M. (2008).
Spawning escapement of female longfin eels. New Zealand Fisheries Assessment Report 2008/7. 57 p.
This series continues the informal New Zealand Fisheries Assessment Research Document series
which ceased at the end of 1999.
2

EXECUTIVE SUMMARY
Graynoth, E.; Jellyman, D.; Bonnett, M. (2008). Spawning escapement of female longfin eels.
New Zealand Fisheries Assessment Report 2008/7. 57p. The objective of this study was to determine the adequacy of reserve areas closed to commercial fishing for the survival and escapement of female longfin eels (Anguilla dieffenbachii). All rivers and lakes throughout New Zealand were classified into reserved or commercially fished areas using GIS techniques. The tonnage of longfin eels was estimated from empirical relationships between eel biomass and habitat in rivers and lakes, and was employed as an index of the amount of habitat present for large female longfin eels. Generalised Additive Models (GAMs) were developed using data on the biomass per kilometres of longfin eels from 212 sites in rivers and streams in Southland, west coast (South Island), Canterbury, Wellington, and Wanganui districts. Eel biomass was strongly related to the mean annual low flow and gradient of the reach studied. Models were developed to predict both the current biomass of eels and the original biomass that existed before the start of commercial fishing. The effects of commercial fishing were assessed using computer simulation and field data collected from the Aparima River in Southland. It was shown that fishing systematically reduces both the mean length and mean weight of harvestable eels (over 220 g) and the total biomass of eels present. Data on the tonnage of longfins in large rivers and lakes were classified into MFish eel reporting and quota management areas. The highest biomass is found in large rivers in coastal and lowland regions such as the Waikato, Manawatu, and Southland, while the lowest biomass is found in small mountain streams. North and South Islands support equal proportions of the 12 000 tonnes of longfin eels present in New Zealand. About 7% of the present tonnage of longfin eels is in waters that are closed to commercial fishing and have safe egress for migrant females. Another 17% is in waters that are protected in their upper reaches but where migrant females could be fished downstream, and a further 25% is located in small streams that are rarely fished. Therefore about 49% of the total tonnage of eels either in reserves or in streams that are rarely fished. Hydro dams have reduced eel access to waters that could support over 6000 tonnes of longfin eels. Waters open to commercial fishing support an annual harvest rate of about 7.8%. Both computer models and field studies indicate that relatively few large female eels are left in fished areas and female escapement is derived mainly (80%) from reserves and unfished small streams. Current escapement is probably less than 20% of historical levels that existed in the 1930s before the start of hydro dam construction and commercial eel fishing. However, it is theoretically possible that glass eel recruitment in the past was well in excess of that required to maintain stocks and reductions in female escapement and glass eel recruitment may be compensated for by an increase in the survival rates of juvenile and adult eels. If there is no compensatory improvement in survival rates, persistent declines in recruitment could rapidly reduce eel stocks and escapement to low levels. Any downward trends may also be accentuated by the recent decline in the proportion of immature female eels in some southern rivers that may be related to increased fishing pressure and changes in the size structure of the stocks. Further studies are required to determine the biomass of eels in large rivers and lakes and to understand the significance of density-dependent and other processes on survival rates and sex composition. In the meantime, it is recommended that a conservative approach is taken towards the management of longfin eels. To this end, the value of several management options, including the closure of forest parks and individual catchments, is described.
3

4
1. INTRODUCTION The Ministry of Fisheries (MFish) contracted NIWA to determine the adequacy of reserve areas closed to commercial fishing for the spawning escapement of female longfin eels (Anguilla dieffenbachii). This report describes the results of two MFish projects, EEL2002/03 and EEL2006/03. The specific objectives as stated in the contract for Project EEL2002/03 were as follows: 1. To obtain, check, classify and amalgamate GIS layers of Department of Conservation (DOC) and other
reserves throughout the North and South Islands of New Zealand. 2. Using GIS techniques, classify all rivers, streams, lakes, ponds and wetlands throughout New Zealand
into four categories:
• Waters that should have not been commercially fished (e.g., National Parks) and have safe egress for migrant female longfin eels.
• Waters that are protected in their upper reaches but where migrant female longfins could be fished further downstream.
• Waters which are protected in their upper reaches but where migration either into or out of these areas is constrained by dams and other barriers.
• Waters that are fished. 3. To estimate the relative amount of aquatic habitat for large female longfin eels in these categories, based
on factors such as water area, river slope, altitude and the extent of the littoral area in lakes. The objectives of Project EEL2006/03 were as follows. 1. To update the GIS based model for estimating large female longfin eel biomass in areas closed to
commercial eel fishing. 2. To revise the biomass estimates for large female longfin eels in areas closed to commercial fishing
using eel density data obtained from the Whanganui and Ruamahanga catchments and any other additional available data.
Information was also required for eel fisheries management on the potential biomass of longfin eels in large rivers and lakes and Eel Statistical Areas (ESA). 2. BACKGROUND Longfin eels (Anguilla dieffenbachii) are endemic and widely distributed throughout New Zealand. They were present in very high numbers in most waters and supported significant Maori fisheries before European colonisation. Land use changes, dams, weirs, and commercial fishing have reduced stocks in many waters and raised concerns about the long-term sustainability of this species. In particular, large female longfin eels are highly vulnerable to the cumulative effects of commercial fishing and are now found mainly in remote, unfished locations and small streams (Beentjes & Chisnall 1998, Jellyman et al. 2000). As a consequence, MFish have included eels in the Quota Management System and undertaken other initiatives to improve the status of the stocks. Jellyman et al. (2000) suggested stocks of large female eels can be best sustained by the prohibition of commercial fishing, either in reserves or selected catchments. However, commercial eel fishers have claimed
�������������������
��� ����

5
that there is sufficient habitat in National Parks and reserves within the Department of Conservation (DOC) estate to sustain adequate stocks for reproduction, and thereby maintain the recruitment of juvenile eels. Previous estimates of the extent of areas closed to commercial eel fishing in New Zealand were based on the length of rivers and areas of the main lakes (Jellyman 1993). However, in recent years a GIS-based River Environment Classification (REC) database has been developed by NIWA for the Ministry for the Environment and regional councils (Snelder et al. 1999, 2000, Snelder & Biggs 2002). The REC contains more than 500,000 numbered and linked reaches, together with detailed information on climate, geology, land use, mean flows, gradients, and other features. This presented a new opportunity to more accurately measure the extent of waters that were open and closed to fishing. GIS-based models were initially used to estimate the potential habitat for large female longfin eels in the west coast and Southland regions of New Zealand (Graynoth & Niven 2004). The modelling exercise showed that about 7% of riverine habitat and 26% of lake habitat in these regions are totally protected in DOC reserves. The amount of longfin eel habitat that is protected within DOC reserves throughout New Zealand was estimated at less than 10% because reserves tend to be concentrated in high country and inland regions that support low densities of eels. This report extends the previous study and revises estimates of the amount of habitat protected in reserves. It describes the methods used to classify rivers and lakes and estimates the biomass of eels present using new field data and models (described in Appendices 1 and 3). This is followed by estimates of the habitat available in different classes of rivers and lakes and a discussion of the implications of these results. 3. METHODS USED TO CLASSIFY RIVERS AND LAKES 3.1 Classes used Rivers and lakes were divided into five classes as follows. (1) Waters that should not have been commercially fished (e.g., National Parks) and have safe egress for
migrating female eels. (2) Waters that are protected in their upper reaches but where migrants could be fished further
downstream. (3) Waters that are located upstream of either natural waterfalls or artificial dams that constrain the
downstream or upstream migrations of either juvenile or adult eels. This definition is a modified form of the original objective and includes waters that are both closed and open to commercial fishing. This change was made because most of these waters contain low or relict stocks of eels and support limited eel fisheries. This class also includes most of the Whangaehu River catchment because it contains low stocks of eels due to intermittent flows of toxic acidic water from Crater Lake, Mount Ruapehu (Woods 1964).
(4) Waters that are open to commercial fishing. (5) Streams that are open to commercial fishing but are generally too small (less than 0.5 m3/s mean
annual flow) to make fishing worthwhile. Details of how these waters are defined are given later in the report.

6
3.2 Department of Conservation estate The procedures used to classify waters in the DOC estate were similar to those employed in the previous study (Graynoth & Niven 2004). A single GIS shape file covering the North and South Islands and Stewart Island (Consunit_101103_nzmg.shp) was supplied by the Department of Conservation and used to determine whether land areas were closed or open to commercial eel fishing (Figure 1). Closed areas included those administrated under the Wildlife Act 1953, Reserves Act 1977, National Parks Act 1980, and Ecological, Sanctuary, Wilderness, and Wildlife Management areas administered under the Conservation Act 1987.
Figure 1: Areas in the Department of Conservation estate that are closed to commercial eel fishing (black) or open (grey). White is other land ownership.

7
Closures are not necessarily enforced by DOC for all land use categories. For example, some lakes, such as Whangape near Huntly, are within reserves but have been commercially fished both in the past, and on a more limited basis in the 1990s, when the reserve classification was being disputed by commercial eel fishers (D. Allen, MFish, pers. comm.). Also many rivers in Canterbury are bounded by extensive river protection areas that are local reserves under the Reserves Act. These areas (Code RALP) were treated as being open to fishing in this analysis. Commercial fishing is generally prohibited in national parks, with a few minor exceptions that are still permitted under local National Park Management Plans, especially where there is a history of fishing (e.g., Mt Aspiring National Park, P. Gerbeaux, formerly of DOC, pers. comm.). These minor exceptions were ignored in this analysis and all national parks were classified as closed to commercial fishing. State forests and conservation parks are open to commercial fishing provided concessions for access have been issued by DOC. Rivers and lakes were classified as either “open” or “closed” to commercial fishing by overlaying the DOC shape file on the REC database. Additional GIS layers describing boundaries to MFish Eel Statistical Areas, catchment boundaries, the degree of fishing pressure, and the locations of dams and significant waterfalls were also developed and overlaid on the REC. It was simpler to include the west coast and Southland regions in a single South Island analysis than to incorporate the results of earlier studies (Graynoth & Niven 2004). Tables were stored in a Microsoft Access database and linked queries were used to analyse and accumulate statistics. Data were exported to ESRI ArcView 3.2 for mapping and the final tables were calculated from Access queries using linked tables in a Microsoft Excel spreadsheet. Detailed flow charts were prepared to ensure data were accurately analysed in a consistent and repeatable fashion. 3.3 Ministry of Fisheries – Customary fisheries and reserves There are currently a limited number of officially designated areas where commercial fishing is prohibited to provide customary fisheries for Maori. In the North Island, these include the Taharoa lakes (Kawhia), Whakaki Lagoon (Wairoa), Lake Poukawa (Te Hauke), and the Pencarrow lakes and tributaries (Wellington) (MFish 2004a). In the South Island, these include parts of the Pelorus River (Nelson) and Lake Ellesmere (Te Waihora), Lake Forsyth (Te Wairewa), the Ahuriri Arm of Lake Benmore, the Rangitata River lagoon, and the Waihao River and Wainono Lagoon. Non-commercial harvests are variable but in some cases could be equivalent to those in commercial fisheries. For example, Lake Forsyth supports a significant non-commercial fishery for migrant eels. With the exception of the Pencarrow lakes, which are Class 1 reserves, all of these waters have been treated the same way as commercial fisheries and have been included in Class 4. Commercial eel fishing in the Te Arawa lakes near Rotorua in the central North Island has recently been prohibited under the Te Arawa Lakes Settlement Act (D. Allen, MFish, pers. comm.). Although Lake Tarawera contains a few eels that have either been stocked or have climbed the Tarawera Falls, most of these lakes are either landlocked or discharge through the impassable Okere Falls and other waterfalls on the Kaituna River draining Lake Rotoiti. Therefore all of the Te Arawa lakes have been included in Class 3. There is little or no detailed information available on the location and size of other customary or recreational fisheries in New Zealand (MFish 2004a). Although some national parks are fished extensively by Maori (e.g., Upper Rangitaiki/Whirinaki, J. Boubée, NIWA, pers. comm.) the total catch is likely to be relatively low and therefore these waters have been retained as reserves in either Class 1 or 2. Commercial fishers are prohibited from using nets to catch fish in tributaries of Lake Ellesmere (Fisheries (South-East Area Commercial Fishing) Regulations 1986), and therefore these waters were included in Class

8
2 because migrant longfin eels are caught in the lake. Areas of the lake within 1.2 km of the mouths of the five main tributaries are also closed but this was ignored because the lake mainly supports shortfin eels. The Motu and Mohaka Rivers in the North Island were included in Class 1 because they are likely to have populations of longfin eel that have not been subjected to commercial fishing in recent decades and have been closed to commercial fishing from 13 January 2005 (D. Allen, MFish, pers. comm.). The eastern part of the Whanganui River catchment and main stem above the confluence with the Kauarapaoa Stream, 30 km upstream from the sea, were included in Class 2 as these areas have been closed to commercial fishing from 13 January 2005 (D. Allen, MFish, pers. comm.). 3.4 Water supply catchments Public entry and commercial eel fishing are often prohibited in water supply catchments. No shape files delimiting these areas were available and these areas were therefore ignored in this analyses. However, they are probably of little value for the conservation of eels because most catchments are located upstream of weirs or dams that impede eel passage (e.g., Kaitoke weir in the Hutt River catchment and Wainuiomata river dam). Most water supply catchments were therefore included in Class 3. 3.5 Identification of water upstream of dams and waterfalls (Class 3) 3.5.1 Dams and weirs Dams and weirs can obstruct the upstream passage of juvenile eels and can also reduce escapement by diverting mature migrants either through power station turbines or into irrigation and water supply pipes and canals. Information on the location and heights of 480 dams was initially derived from the New Zealand Dams Inventory (Anon 1997) and used to develop a database and shape file. The database was reviewed by DOC as part of the Waters of National Importance project. Conservancy staff added or deleted dams based on their judgment as to whether a dam was likely to have significant effects on fish passage and hence biodiversity. The approximate minimum size included was either 20 000 m3 reservoir volume or 3 m in dam height. This resulted in a final database of 498 dams and weirs. Errors and omissions were corrected by reference to a water harvesting and farm dam database developed by A. McKerchar (NIWA, Christchurch). Waters above dams were then coded and compared with New Zealand Freshwater Fish Database (NZFFDB) records on the presence or absence of eels. Most of the major hydro dams have fish passes or other facilities designed to permit the upstream recruitment of juvenile eels. Also, some hydro lakes, such as Hawea, Karapiro, and Matahina, are stocked with elvers. Although attempts are being made to facilitate the downstream passage of mature (silver) eels at several dams, many migrants become trapped on screens or die in turbines during their downstream migration (Mitchell & Boubée 1992). For these reasons, all reaches upstream of significant dams and weirs were put into Class 3. The upper Mokau River (King Country), for example, was included in Class 3 because there is very limited upstream passage of elvers past the Wairere Falls Power Station. Also, although a substantial number of downstream migrants find the bypass at the weir, the remainder die in the turbines (Boubée & Williams 2006). Control gates and weirs on lowland lakes in the Waikato and Wairarapa can hinder the upstream access of eels. In some cases either fish passes have been constructed or juvenile eels are trapped and transferred upstream of these obstructions. These blockages have been ignored because downstream migrants can normally pass safely through them. Lake Waikare is an exception and was included in Class 3 because of previous fish passage problems and the lack of longfin elvers caught in the eel pass in recent years (J. Boubée, NIWA, pers. comm.).

9
3.5.2 Waterfalls and rapids Attempts to use the REC to identify waterfalls and other obstructions to the upstream migration of juvenile eels were not successful. Water velocities for individual reaches were calculated using reach gradient, a Manning’s N of 0.06, and standard depth/flow relationships (Jowett 1998). Estimated water velocities at mean annual flow were squared and weighted by the length of the reach as an index of magnitude of the likely obstruction to upstream eel passage. This index identified hundreds of steep mountain streams but failed to identify known waterfalls, such as the Maruia Falls in the Buller catchment. This is probably related to the coarse 30 m digital elevation model used in the REC and the relatively long lengths of reaches. More accurate digital elevation data and shorter reaches are needed for this method to succeed. As an alternative approach, the names and grid references for waterfalls and rapids in the LINZ NZMS 260 Topographical Map database were extracted and georeferenced to their closest reach in the REC (N = 277). Waterfalls and rapids that drained catchment areas larger than 5 km2 (N = 88) were examined in more detail to assess whether they were likely to be an obstruction to the upstream migration of eels. Waterfalls were excluded and were not considered obstructions to eel passage if significant numbers of eels were present in NZFFDB samples collected upstream of the falls. Where survey data were not available, the degree of obstruction was assessed from published information on the height, volume, and character of the falls. For example, the Raukawa Falls on the Mangawhero River (Wanganui district) were excluded because Woods (1964) stated that large numbers of eels ascended these substantial falls. Also eels are stopped by rapids and falls at Okoroire on the Waihou River (Thames district) (Hobbs 1948). Falls located upstream of dams were excluded from the list because the intention was to identify all waters where recruitment could be restricted by either natural or artificial barriers. In the North and South Islands, 13 and 23 of the falls examined were considered significant barriers to the upstream migration of juvenile eels (Appendix 4). Reaches upstream of these waterfalls were manually selected using ArcView and identified as Class 3 in the analyses. In addition, five Rotorua lakes and their tributaries that did not drain to the sea (in the REC) were included in this classification together with lakes such as Lyndon (Canterbury) where eels are known to be absent. However, some small eel-free areas may have been overlooked. This is a preliminary assessment of the significance of waterfalls and rapids. This assessment could be improved by using local knowledge to evaluate each barrier. Detailed field studies would be required to assess the exact impact of some waterfalls, such as the Maruia Falls (excluded from Class 3) and the Tarawera River Falls, Motu Falls, and Rangitata Gorge (included as obstructions). 3.6 Importance of small steams as unfished reserves for large female eels (Class 5) 3.6.1 Location and intensity of commercial eel fishing There is little information available on the intensity of commercial fishing in streams and rivers of different sizes. Present MFish Eel Catch Effort Return (ECER) data are collected at a regional scale and are too coarse to be used for this purpose. Fishing pressure probably varies between waters and over time depending upon factors such as the stocks of eels present and the accessibility and fishability of the water. Legislative and commercial factors such as TACCs, ITQs, size limits, and prices will also influence overall fishing effort and harvest. For example, there have been recent changes in fishing patterns, arising from the rationalisation of industry participants following the introduction of the Quota Management System. Preliminary information on the locations fished in Southland was obtained from Victor Thompson (Mossburn Enterprises) who prepared a map of the number of times a year rivers and streams were fished in the Wyndham area (NZMS 1, Sheet S 178) (Figure 2). The main stem Mataura River is fished several times each year, major tributaries such as the Mimihau Stream and the Mokoreta and Waipahi Rivers are fished

10
once a year, and small first and second order streams are never fished in this area. The mapped area contained 2533 reaches of which 340 (13 %) were fished at least once a year. The percentage of reaches that were fished was determined for 63 flow and slope categories and models developed to predict the likelihood that a particular reach will be fished. Small streams of less than 0.5 m3/s mean annual flow were rarely fished, but most streams and rivers over 1 or 2 m3/s were fished every year (Figure 3). Streams of higher gradient were fished slightly less frequently than low gradient streams. The percentage of reaches fished was modelled as a sigmoid function against mean annual flow using the non-linear module in SYSTAT (Wilkinson 2000). (1) P = 100 / (1+exp (- (F- (a G-b)) /c )) where P = percentage of reaches fished, F = ln mean annual flow (m3/s) G = ln mean gradient (%), a = 0.2175, b = 0.4941, c = 0.6123. The equation proved an excellent fit to the data (R2 = 0.981, N = 63).
Figure 2: Comparison of observed and predicted commercial fishing intensity in the Wyndham district of Southland. The thickness and blackness of the lines indicates the frequency of fishing (Several times a year, once a year, never). The top map is observed and the bottom map is predicted from river flow and gradient.
Mimihau Stream
Waipahi River
Mokoreta River
Mataura River

11
0.0010.010
0.1001.000
10.000
100.000
Mean annual flow (m 3/s)
0
20
40
60
80
100
Per
cent
age
of r
each
es fi
shed
3210-1-2
Ln gradient
Figure 3: Relationship between stream size (mean annual flow) and commercial eel fishing intensity (percentage of reaches fished) in the Wyndham district of Southland. Line shows fit at a gradient of 1% (ln gradient = 0) using equation 1. 3.6.2 Size composition of eels The biomass of large female longfin eels (over 700 mm) was used as an index of fishing pressure because these fish are particularly long lived and are easily caught in fyke nets used by commercial fishers. In the Aparima catchment in Southland, small streams (mean annual flow of less than 0.5 m3/s) supported a relatively high biomass of large female eels (expressed as a percentage of total biomass) than larger streams and rivers that were known to be commercially fished (Figure 4). Fishing pressure in the Whanganui and Ruamahanga catchments in the North Island appeared to be less, and medium sized streams, of up to 2 m3/s mean annual flow, often contained good numbers of large female eels (Figure 4).
5 10 15 20Mean annual flow (m 3/s)
0
20
40
60
80
100
Fem
ale
eels
(% b
iom
ass)
WanganuiRuamahangaAparima
Catchment
5 10 15 20
0
20
40
60
80
100
Figure 4: Biomass of large female longfin eels (% total biomass) in streams and rivers of different size. Distance weighted least squares smoother (DWLS) with a tension of 1.0. Dotted vertical lines at 0.5 and 2.0 m3/s mean annual flow.

12
3.6.3 Definition of Class 5 stream Although fishing effort in Southland is probably higher than in many other regions of New Zealand, reasonable numbers of large female longfins are still present in small streams. As a conservative measure, Equation 1, based on studies in Southland, was used to define small streams that are unlikely to be commercially fished throughout New Zealand. Large female eels form a high percentage of the biomass present when the probability of fishing is less than 25% (Figure 5). A P value of 25% was therefore used to define Class 5 streams. Mean annual flows in Class 5 streams ranged from a maximum of 0.19 m3/s in low gradient streams to 0.6 m3/s in steep streams (20% gradient). Mean annual flows averaged 50 l/s and mean annual low flows averaged 12 l/s.
0 10 20 30 40 50 60 70 80 90 100Percentage of reaches fished per year
0
20
40
60
80
100
Fem
ales
(% b
iom
ass)
Figure 5: Relationship between the biomass of large female longfin eels (% total biomass) in the Aparima River and the predicted intensity of fishing. Vertical line is at 25% of the reaches fished. Distance weighted least squares smoother, tension 0.75. 3.7 Classification of lakes The GIS lines (reaches in the REC) are drawn across lakes from inlet tributaries to the outlet so that a continuous connection is maintained from source to sea. Lakes were divided into different fished and unfished classes based on the classification of their inlet streams and the length of their connecting reaches across lakes. The total lengths of reaches that crossed the lake was summed and accumulated into particular classes to determine the dominant class. Lakes that contained several classes were examined and classified by overlaying the DOC shape file of landuse classifications (Section 3.2). It was assumed that if more than 50% of the lake bed was defined as a reserve then the entire lake was protected. There are 54 727 lakes and ponds (median area 1100 m2) in the New Zealand lakes database (New Zealand Vector Topographic Database, Alllake.shp, 6/12/2001, digitised and distributed by Eagle Technology (31 duplicate records were excluded). Only 10 837 lakes were intersected by river (reach) lines and classified using the method described in the previous paragraph. All these lakes were assumed to contain eels unless upstream access to these lakes was blocked by dams or waterfalls. A total of 43 890 lakes and ponds were not intersected by river lines and were not classified (South Island, N = 17 502, mean area 2255 m2, mean perimeter 171 m; North Island, N = 26 388, mean area = 1743 m2, mean perimeter = 154 m). Examination of maps showed most appeared to be isolated farm ponds as well as small dune lakes, oxbow lakes, and alpine tarns. Although many will probably contain eels, there is some uncertainty about eel access and therefore these waters were excluded from the present analyses. The

13
potential biomass of shortfin and longfin eels in these waters is about 500 tonnes, based on a mean biomass of 60 kg/ha (Section 4.3). 4. METHODS USED TO ESTIMATE LONGFIN EEL BIOMASS AND POTENTIAL HABITAT
IN RIVERS AND LAKES 4.1 Equations used to estimate eel biomass and potential habitat in rivers The estimated biomass (kg/km and kg/ha) and total tonnage of longfin eels in rivers and lakes was used as an index of the amount of aquatic habitat available for large female longfin eels (Graynoth & Niven 2004). Two new Generalised Additive Models (GAMs) were developed to predict biomass in rivers of different size using reach gradient and new minimum annual low flow statistics (Appendix 1). The first model predicts the original biomass of eels, before the development of commercial fishing, and the second predicts the current biomass in fished areas. The original biomass model is a better index of potential habitat because it is unaffected by commercial fishing. Original biomass estimates tend to be much higher than current estimates, especially in the larger rivers that are most intensively fished. Present day estimates of eel biomass combine the results of both models. The original model is used for waters that are either in reserves or are unlikely to be fished (Classes 1, 2, and 5) while the current model is used for waters that are fished (Class 4). Biomass estimates are reported in tables and in the text to the nearest tonne in order to reduce rounding errors. This gives a false impression of accuracy and estimates have usually been qualified in the text by terms such as “about” or “approximately”. 1.1 River Environment Classification errors and corrections The REC covers the two main islands and Stewart Island but excludes offshore islands such as Great and Little Barrier Islands and the Chatham Islands. The files used (Table 1) contained some errors that were corrected, such as duplicate reaches in the Hunua Ranges, west of the Firth of Thames, and catchments that were incorrectly disconnected from the sea and appeared to drain into inland lakes. All known errors were removed and while other errors may remain, they are unlikely to be serious. Table 1: REC and other files used in this analysis. File name Date Contents
NI_REC_Release SI_REC_Release
1/8/2003 Reach Ids, length, distance to sea, geology, land cover
NIMALFv1 SIMALFv1
14/9/2004 Mean annual flow and mean annual low flow
FWENZ_NI FWENZ_SI
21/6/2004 Temperature, shade, altitude, gradient,
Reach gradients in the REC can also be incorrect because of the relatively coarse digital elevation model used. Gradients for the study reaches were therefore checked and recalculated using data on the length and altitude of the reaches near the study reach. A Systat command programme (Wilkinson 2000) was used to plot the data, remove outliers, and produce a revised estimate of the actual gradient of the study reach. In some low gradient sites, reach gradients were determined by measuring the distance between 25 m contour lines using the MapToaster program (NZ Topographic Map Viewer). Reaches in the REC database were also constrained to maximum gradients of 50% and minimums of 0.1%.

14
The lengths of reaches that crossed lakes were calculated and deleted from the REC so that reach lengths reflect the true lengths of waterways. On a national basis, small errors in the estimation of reach lengths, gradients and flows in the REC are expected to cancel out each other. Mean annual low flows do not take into account hydro-electric power diversions and therefore flows and eel stocks in the Lower Waiau (Southland), Ohau (Waitaki), and Whakapapa (Whanganui) Rivers and other rivers could be overestimated. Flows in heavily abstracted rivers in Canterbury, such as the Rangitata and Opihi, could also be overestimated while flows in groundwater fed rivers, that tend to have deceptively small catchments, such as the Avon River in Christchurch, can be underestimated. The biomass of eels is likely to be overestimated in the Canterbury Plains and other regions where rivers and streams flow underground. For example, the Selwyn River in Canterbury dries up in its middle reaches in most summers, flows underground, and supports insignificant stocks of eels. The total stock of eels in the central plains region of Canterbury, between the Waimakariri and Rakaia Rivers and west of State Highway 1, was estimated at about 33 tonnes and similar tonnages of eels were calculated to be present in other regions with ephemeral flow in South Canterbury and Hawke’s Bay. At present there is no simple way of estimating the extent to which stocks are overestimated in rivers that flow underground. The overestimate of eel biomass in the central plains region of Canterbury might be in the region of 10 to 15 tonnes and is insignificant compared with national stock estimates of thousands of tonnes. 4.3 Lakes The current tonnage of shortfin and longfin eels in lakes was estimated from the length of shoreline by assuming each lake supported 900 kg of eels per km of shoreline. This was derived from a biomass of 60 kg/ha in the littoral zone and a littoral width of 150 m (Graynoth & Niven 2004). For lakes with an area/shoreline ratio (km2/km) of less than 0.15, the littoral zone was assumed to include the entire lakebed. The species composition of eels in lakes within each Eel Statistical Area (ESA) was then determined by reference to the NZFFDB (Figure 6) as well as to catch sampling data, catch statistics, and relevant published and unpublished reports. Historical changes in species composition were not taken into account. For example, large longfin eels used to be more abundant in lowland lakes such as Ellesmere and Waikare before the development of commercial fishing. Class 3 lakes were also excluded from these species composition statistics. For example, all of the central South Island hydro-lakes (Class 3), dominated by residual stocks of longfin eels, were excluded. Biomass estimates in lakes are very approximate and further studies are needed to estimate actual tonnages present. No estimates were made of the biomass of longfins in coastal inlets or large estuaries because of the lack of data and because longfins are rarely netted in saline estuaries or at sea. 4.4 Estimation of the tonnage of longfin eels by Eel Statistical Areas (ESA) and
catchments A North Island shape file that defined ESA boundaries was prepared by Critchlow Business Mapping Solutions in conjunction with D. Allen (MFish). The South Island file was prepared by J. Sykes (NIWA) using detailed maps supplied by P. Todd (MFish) and shape files on catchment boundaries. River reaches in the REC were then classified by ESA using ArcView geoprocessing tools. Slight errors in the position of ESA boundaries resulted in the misclassification of several hundred REC reaches and these errors were corrected manually. Summaries of eel biomass by larger MFish Quota Management Areas were also prepared (North Island longfin eel stock codes LFE 20-23 and South Island eel stock codes ANG 11-16).

15
� �
�
� � � �
�
�
� � � �
�
�
� �
�
� � �
�
� � �
�
� � � � � � � �
�
�
� � �
� � �
�
� � � � � � � � � � � � � �
� �
� �
�
�
� � � �
� �
� � � � � � � � � �
� � �
� �
�
� � � � � � � � � � � �
�
�
� � �
�
� � � �
� �
�
�
� � � �
� �
�
� � � � � � � � �
� � � �
� � � �
� � � � � � � � � � � �
� � � �
� �
� � �
� �
� �
� � � � � � � � � �
� �
� � � �
�
� � � � � � � �
� �
� �
� � � �
� �
� �
� � � � � �
� �
� � � �
� � � � � � � � � �
� �
� � � � � � � � � � � � � � � � � �
� � � � � � � � � � � � � � � � � � � � � �
� �
� �
� � �
P e r c e n t a g e l o n g f i n s � 0 - 1 0 � 1 0 - 4 0 � 4 0 - 6 0 � 6 0 - 9 0 � 9 0 - 1 0 0
Figure 6: Percentage composition of longfin eels in lakes where New Zealand Freshwater Fisheries Database data are available. River reaches were also classified into catchments using a classification system developed from the REC and from catchment identification codes (Anon. 1956). Although results are available for over 400 catchments, data from only 31 North Island and 24 South Island catchments, with total biomass estimates in excess of about 30 tonnes, were included in the final tables (Appendix 2). However, more detailed information is available on request. The actual current tonnage of eels present in a water depends upon the intensity of commercial fishing, access from the sea, and several other factors including elver stocking rates. It is therefore impossible to determine the exact tonnages of longfin eels present in either ESAs or specific catchments without field surveys. The original biomass model was used to estimate biomass in reserves and lightly fished areas (Classes 1, 2, and 5) while the current biomass model was used to estimate eel biomass in fished areas (Class 4). The estimated current tonnage of eels and commercial harvests were also tabulated by Quota Management Areas (MFish 2004a). Annual harvests in the North Island were adjusted averages derived from

16
fishing years 1991–92 to 2001-02 (MFish 2004b) while estimates of longfin catches in the South Island are derived from commercial landings for both species (Annala et al. 2003, Statistics_New_Zealand. 2005) and species composition statistics derived from catch sampling (Beentjes & Chisnall 1997, Beentjes 1999). 4.5 Biomass and spawning escapement of female longfin eels The biomass of large female longfins was determined by multiplying total biomass estimates by the proportion by weight of large females that were likely to be present in particular classes of water. Approximate estimates of the relative biomass of large female eels were derived from the numeric percentage of medium sized (450–700 mm) and large female (over 700 mm) eels present in traps and fyke nets in unfished waters (appendix 7 in Jellyman et al. (2000)). Mean weights of 346 g and 1500 g were used for these two size classes. Field data from small unfished streams in the Aparima catchment were used to estimate the relative biomass of smaller eels (under 450 mm, 18%). These studies (Table 2) indicated that large female longfin eels average about 74% of the total weight of longfin eels present in unfished rivers and lakes (Classes 1 and 2). The biomass of large females is less in fished rivers (Class 4), averaging 18% (Table 2), with estimates ranging from a low of 3% in the Aparima River in 1995–96 to a high of 54% in the Heathcote River in 1989. Field data collected from the Aparima River in 2001 and 2002 also confirmed that large female eels were scarce in fished areas; they comprised less than 1% of the total biomass of eels present in the main stem and larger tributaries (see Figure 4). Large female eels average about 20% of the biomass in small Class 5 streams (see Figure 4). This is a lower percentage than in larger waters listed in Table 2. The reasons for this are unknown – there may be insufficient cover for large eels and stocks could be affected by either periodic droughts or sporadic commercial fishing in these small streams. Only a small fraction of female longfins mature and migrate to sea each year. The proportion migrating was estimated using the De Leo & Gatto (1995) maturity function of eel length (Francis & Jellyman 1999) with gamma of 0.24, lambda of 108 cm, and eta of 5.1 cm. Other assumptions in modelling escapement included an annual survival rate of 0.956 and a mean growth rate of 25 mm per year (Jellyman 1997). The proportion of female longfins migrating ranged from 8.3% of the biomass of large females in unfished waters to 4.3% in fished waters (7.0% harvest rate with a maximum legal weight of 4 kg). 5. RESULTS 5.1 Longfin eel biomass estimates in major rivers and lakes Appendix 2 contains four tables that detail the predicted biomass of longfin eels in major rivers and lakes throughout New Zealand, and a summary of these results is presented in Table 3. Specific information on the biomass of longfin eels in other waters is available upon request. The North and South Islands support an equal tonnage of longfin eels at present (Present model, Total column in Table 3). Although the highest biomass (kg/km) of longfins is found in large rivers in coastal and lowland regions such as the Waikato, Manawatu, and Southland (Figure 7) there is a much greater tonnage overall in streams and small rivers. Approximately 88% of the present tonnage of longfin eels in flowing waters in New Zealand is supported in streams and small rivers (mean annual seven day low flow, MALF, below 8 m3/s) compared with 70% before the start of commercial fishing (Original model). The estimated tonnage of longfin eels in lakes (622 tonnes) is also only a small proportion (5%) of the total tonnage of longfin eels (12 202 tonnes).

17
Table 2: Biomass of large female (>700 mm) eels expressed as a percentage of the total biomass of longfin eels present. (Unless otherwise shown this is derived from Appendix 7 in (Jellyman et al. 2000); *; NIWA unpublished data.
Water Year Fished Large Female longfins
% N caught % Total biomass
Traps
Various waters (Cairns 1942) 1938 No 23.0 46
Lake Wanaka 1947 No 90.1 80
Kakapo Stream 1947 No 82.8 78
Lillburn River 1947 No 59.4 71
Whitestone River 1947 No 54.7 69
Wanuiomata River 1948 No 67.8 74
Waipa River 1948 No 44.6 64
Fyke nets – scientific
Lake Pounui 74–78 No 23.0 46
Rakaia Lagoon 80–81 No 58.0 70
Lake Roxburgh 1983 No 76.0 76
Waimakariri estuary 83–84 Yes 12.0 30
Heathcote River 1989 Yes 31.0 54
Lake Rotoiti 1991 No 61.5 72
Lake Wanaka 1995 Yes 40.8 61
Company Creek* 2003 No 62.0 91
Fyke nets – commercial
Mossburn Enterprise samples 1970s No 31.0 54
Mossburn Enterprise samples 1980s Yes 10.0 27
Mossburn Enterprise samples 1990s Yes 9.0 25
Aparima River 95–96 Yes 0.8 3
Oreti River 95–96 Yes 2.0 7
Clutha River 95–96 Yes 1.1 4
Taieri River 95–96 Yes 5.0 15
Waitaki River 95–96 Yes 5.4 16
Rakaia and Waimakariri Rivers 95–96 Yes 6.3 18
Grey River 95–96 Yes 4.8 15
Buller River 95–96 Yes 4.3 13
North Island (unspecified waters) 95–96 Yes 6.9 20

18
Table 3: Summary of longfin eel tonnage estimates in rivers and lakes using two different models (Original and Current). Present estimates combine the results of both models. % not fished refers to the estimated biomass of eels that is either in reserves or is unlikely to be fished. *, Overestimated because waterfalls and dams prevent eel access. The original biomass model is the best index of eel habitat.
Model Island Class 1 Class 2 Class 5 Sub total Class 4 Total % not fished Class 3*
(a) Original
Rivers NI 340 702 1759 2800 5884 8684 32 2686
SI 363 1091 1265 2719 6067 8786 31 3885
Lakes NI 0 9 0 10 65 75 13 1021
SI 167 233 0 400 147 547 73 2470
Total 870 2035 3024 5930 12 163 18 092 33 10 061
Percentage of total 5 11 17 33 67 100
(b) Current
Rivers NI 185 324 1593 2102 3279 5380 39 1722
SI 234 661 1149 2043 2782 4825 42 2046
Lakes NI 0 9 0 10 65 75 13 1021
SI 167 233 0 400 147 547 73 2470
Total 586 1227 2742 4555 6273 10 828 42 7259
Percentage of total 5 11 25 42 58 100
(c) Present estimates
Rivers NI 340 702 1759 2800 3279 6079 46
SI 363 1091 1265 2719 2782 5501 49
Lakes NI 0 9 0 10 65 75 13
SI 167 233 0 400 147 547 73
Total 870 2035 3024 5930 6273 12 202 49
Percentage of total 7 17 25 49 51 100

19
Figure 7: Estimated biomass of eels (kg/km) in New Zealand rivers. Excludes Class 3 waters above dams and waterfalls and the toxic Whangaehu River. 5.2 Biomass and habitat in different classes of water Catchments that are entirely closed to commercial fishing (Class 1) are mainly in the Fiordland, Rakiura, and Westland National Parks (Figure 1, Appendix 2). The Motu and Mohaka Rivers are the most important waters in the North Island (Appendix 2). Nationally about 7% of the present tonnage of longfin eels is protected in Class 1 waters (Table 3c). (The inclusion of DOC reserves on offshore islands such as Great and Little Barrier Islands and the Chatham Islands has no significant effect on this figure.) Class 2 waters are more evenly spread throughout the country (Figure 1, Appendix 2). The most important waters are located in west coast and Westland, and include the Buller and Hollyford Rivers and Lakes McKerrow, Rotoiti, and Rotoroa (Table 4). Other important waters include Lake Hauroko in Southland and the Whanganui and Whakatane Rivers in the North Island. Nationally about 17% of the present tonnage of longfin eels (Table 3c) is supported in Class 2 waters. Class 4 and 5 waters are distributed around New Zealand (Figure 1, Appendix 2). Most of the eel habitat and biomass is found in large catchments such as the Waikato, Whanganui, Clutha, and Mataura Rivers. Much smaller amounts of longfin habitat are present in lakes (see Table 3). Nationally about 25% of the present tonnage of longfin eels (Table 3c) is supported in Class 5 waters. In total, about 49% of the current tonnage of eels is protected in reserves and in small streams and 51% is able to be commercially fished see (Table 3). Habitat for large female longfin eels is best estimated using models of original biomass before commercial fishing (Table 3a). About 33% of the potential habitat for large female longfin eels is protected in reserves (16%) and in small streams (17%) and 67% is able to be commercially fished (see Table 3a). These figures are sensitive to the criteria used to identify small streams (Section 3.6). For example, if streams in the North Island with a MAF of less than 2 m3/s are rarely fished (Figure 4), then the total percentage in reserves and

20
small streams in New Zealand increases to 43%. Conversely if this criterion was reduced to less than 0.10 m3/s, then the total percentage in reserves and small streams drops to 30%. Table 4: Tonnage of longfins in important lakes in Classes 1 and 2 for the whole country. * based on the percentage composition of longfins in the New Zealand Freshwater Fisheries Database. Class Lake ESA name % LF* tonnes
1 Lake Poteriteri Southland 40 25
Waituna Lagoon Southland 40 15
Lake Ada Westland 55 8
Lake Hakapoua Southland 40 7
2 Lake Hauroko Southland 40 35
Lake Rotoroa Westland 100 30
Lake Rotoiti Westland 100 22
Lake Heron North Canterbury 90 19
Lake McKerrow Westland 55 18
Lake Kaniere Westland 55 12
Lake Mapourika Westland 55 9
Lake Alabaster Westland 55 8
Lake Paringa Westland 55 8
5.3 Potential biomass in waters located upstream of waterfalls and dams (Class 3) The construction of hydro dams has had relatively little effect on eel stocks in the North Island because natural waterfalls (e.g. Huka and Okere Falls) used to prevent eels from reaching Central North Island lakes and rivers (see Table 3). Hydro dams have excluded eels from a short section of the Waikato River and its tributaries upstream of Karapiro and Arapuni (Hobbs 1948); from the upper Patea River upstream of the Patea Dam; and from the Rangitaiki River upstream of the Matahina Dam. Although elver fish passes and trap and transfer schemes are located at some dams, adults migrating downstream from the hydro lakes are often killed in the turbines. It is estimated that hydro dams have reduced access to waters in the North Island that would support about 460 tonnes of eels. By contrast, dam construction in the South Island has severely restricted eel access to many inland waters. Eels used to be found in most waters with the possible exception of the Rangitata River, upstream of the Rangitata Gorge, and several small and unproductive catchments upstream of waterfalls in South Westland and the Fiordland National Park. About 3900 tonnes of longfin eels could be supported in the upper reaches of the Waitaki, Clutha, Waiau, and other Class 3 rivers in the South Island (see Table 3a) and another 2500 tonnes in natural lakes and hydro reservoirs. If the major reservoirs are excluded (536 tonnes), then the total tonnage in rivers and lakes reduces to 5800 tonnes. Most of the habitat upstream of dams in both islands would have been dominated by longfin eels, so dams have reduced eel access to waters that could support about 6260 tonnes of longfin eels. This is equivalent to about 36% of the original tonnage (habitat) of longfin eels in other waters in New Zealand (17 384 tonnes, see Table 3a). 5.4 Biomass estimates and commercial harvests in Eel Statistical and Quota
Management Areas

21
Appendix 2 (Tables A2.3 and A2.4) contains detailed estimates of eel biomass by Eel Statistical Area (ESA). Commercial harvest rates, expressed as a percentage of the total biomass of longfins in each QMA, range from 0.7% to 7.1% and appear to be slightly higher in the North Island than the South Island (Table 5). Table 5: Estimates of the present stock of longfin eels and commercial harvests (tonnes) by quota management areas (see Section 4.4 regarding harvest calculation methods).
Code Name Class
1Class
2Class
5Sub total
Class 4 Total
% not fished Harvest
Harvest rate
all classes
Harvest rate
Class 4
QMA 20 Northland Auckland 6 12 391 409 453 862 47 62 7.1 13.6
QMA 21 Waikato Poverty Bay 118 84 658 860 1219 2079 41 108 5.2 8.9
QMA 22 Hawke Bay Wellington 216 26 417 659 967 1626 41 54 3.3 5.6
QMA 23 Taranaki Rangitikei 0 589 293 883 705 1587 56 64 4.0 9.1
ANG 11 Nelson Marlborough 2 112 72 186 241 427 44 18 4.1 7.2
ANG 12 North Canterbury 1 80 291 371 601 972 38 17 1.7 2.8
ANG 13 Lake Ellesmere 0 136 0 136 1 137 99 1 0.7 79.4
ANG 14 Sth Canterbury Waitaki 0 7 134 141 211 352 40 15 4.3 7.1
ANG 15 Southland Otago 445 257 527 1229 896 2125 58 72 3.4 8.0
ANG 16 West Coast 82 731 242 1055 979 2034 52 32 1.6 3.3
North Island Total 340 711 1759 2810 3344 6154 46 288 4.7 8.6
South Island Total 530 1324 1265 3119 2929 6049 52 203 3.4 6.9
New Zealand 870 2035 3024 5930 6273 12 202 49 491 4.0 7.8
Percentage of total 7 17 25 49 51 100
Commercial harvest rates in fished areas (Class 4) average 7.8 % for New Zealand. Harvest rates in the districts surveyed (QMA 22 and ANG 15 and 16) ranged from 3.3% to 8.0% and were representative of other districts that were not sampled. 5.5 Spawning escapement of female longfin eels Current escapement of mature female longfins is estimated at about 277 tonnes per year and is probably less than 20% of the escapement that existed in the 1920s before the start of hydro dam construction and commercial eel fishing (Table 6). In the past, most migrant eels were derived from large rivers and lakes (Classes 3 and 4), while nowadays over 80% of migrant female eels are sustained in reserves and small streams.

22
Table 6: Longfin eels spawning escapement estimates. *, reduced from Table 3a because waterfalls prevented eels from reaching Central North Island lakes and rivers. See section 4.5 for calculations of % large female and migrant biomass.
Class 1 Class 2 Class 5 Class 4 Class 3 Total
Historical estimates
Original biomass (tonnes) 870 2035 3024 12163 6260* 24 352
Large females (% biomass) 74 74 20 74 74
Harvest rate 0 0 0 0 0
Migrants (% large female biomass) 8.3 8.3 8.3 8.3 8.3
Migrants (tonnes) 53 125 50 747 384 1 360
% 4 9 4 55 28 100
Current estimates
Present biomass (tonnes) 870 2035 3024 6273 0 12 202
Large females (% biomass) 74 74 20 18 0
Harvest rate 0 0 0 7 0
Migrants (% large female biomass) 8.3 8.3 8.3 4.3 0
Migrants (tonnes) 53 125 50 49 0 277
% 19 45 18 17 0 100 6. DISCUSSION 6.1 Effects of hydro development, wetland drainage, and other environmental changes
on eel habitat The construction of hydro dams has reduced the amount of accessible eel habitat in many upland areas. It was estimated that over 6000 tonnes of longfin eels could be supported in waters that are now largely inaccessible to eels because of hydro development. Although several of these waters are currently stocked with elvers and support productive fisheries, most fish are unlikely to survive to maturity and breed successfully. The overall contribution of mature adults from these areas is likely to be small despite efforts to either bypass or trap and transfer mature migrants around some of these power schemes. The amount of eel habitat in lowland areas of New Zealand has also declined drastically since human occupation with forest clearance, drainage of wetlands and the control of rivers (McDowall 1990). However, the size of these losses and the effects on eel stocks cannot be quantified and it is unrealistic to expect this habitat to be restored to its unmodified state. It can also be argued that the lowest hydro dams, such as Waitaki and Roxburgh, have been in existence for many years and that sufficient eel recruitment is needed to repopulate areas only downstream of these dams. For these reasons, the baseline figure for habitat and stock estimates was taken as the amount of eel habitat that is currently situated downstream of dams, waterfalls, and other obstructions to eel passage.
23
6.2 Adequacy of reserve areas and implications for eel stocks and the fishery This report shows that about 33% of the remaining longfin eel habitat downstream of hydro dams and waterfalls is protected in reserves and in small unfished streams (see Table 3, Original model). Fished rivers and lakes experience an average commercial harvest rate of about 7.8% which is sufficient to deplete stocks of large female longfins (Hoyle & Jellyman 2002), and as a consequence over 80% of migrant female eels are currently derived from reserves and small streams. The total escapement of female eels is probably less than 20% of historical values (Table 6), especially when additional losses due to wetland drainage and other environmental modifications are taken into account. No stock recruitment relationships have been developed for New Zealand eels and there is some uncertainty about the degree to which conventional marine fisheries models and management techniques can be applied to eel fisheries. For marine fish stocks, spawning per recruit (SPR) analysis indicates that 30% of the original virgin biomass should be sufficient to maintain recruitment (Mace & Sissenwine 1993), but it is not known whether this applies to longfin eels. Large female eels are highly fecund and it is theoretically possible that glass eel recruitment in the past was well in excess of that required to maintain stocks. There is also some evidence that the survival of eels is density dependent (Vollestad & Jonsson 1988) and therefore reductions in glass eel recruitment, due to reduced escapement of mature eels, may be compensated for by an increase in survival rates. The outlook would be grim if recruitment declines and if there was no compensatory improvement in survival rates. Simulation modelling shows that persistent declines in recruitment could rapidly reduce escapement to low levels. Any downward trends may also be accentuated by the recent decline in the proportion of immature female eels in southern rivers that may be related to increased fishing pressure and changes in the size structure of the stocks (Jellyman & Graynoth 2002, McCleave & Jellyman 2004). 6.3 Management options to conserve and sustain stocks The slow growth and substantial age at maturity of female longfins makes them particularly vulnerable to commercial fishing, and therefore reductions in TACC have little effect on spawning escapement from commercially fished areas (Hoyle & Jellyman 2002). Details of the benefits of different minimum and maximum size limits were also described by (Hoyle & Jellyman 2002). The creation of new reserves is seen as one of the best methods for conserving longfin eels (MFish 2004a). Some of the potential benefits of different reserve options and restocking policies are described below. 6.3.1 Closure of entire catchments Following the recommendations of MFish, the Minister of Fisheries decided to prohibit commercial fishing in the Mohaka, Motu, and parts of the Whanganui River catchments in the North Island (MFish 2004a, 2004b). The Mohaka River has a stock of about 100 to 200 tonnes of longfin eels (Appendix 2) that has not been fished in recent times. Although most of the river was open to commercial fishing in the past, deep gorges and the lack of roads makes access difficult for fishers. A small area upstream of the Waipunga Falls appears to lack eels and reduced numbers of eels are found upstream of gorges and other falls, such as the Te Rere and Pungahuru Falls (Strickland 1985). Prohibition of commercial eel fishing (MFish 2004a) will now protect about 1% of the national stock of longfin eels. The Motu River is very similar to the Mohaka and is dominated by longfins (Rowe 1981), with a stock of about 60 to 100 tonnes of longfin eels. It has been assumed that few eels are able to surmount the Motu Falls to access the upper reaches. Large areas are remote and inaccessible by road to eel fishers, and the entire catchment is now closed to commercial fishing (MFish 2004a).

24
The Whanganui River is one of the largest rivers in the North Island and the closure of a large part of this catchment to commercial fishing will help conserve stocks. Parts of the middle and upper reaches are also located in the Wanganui and Tongaririo National Parks, respectively, and there are several Conservation Areas where a DOC access concession is required for commercial fishing. Road access is also limited in the middle reaches. However, the lower 25 km of the mainstem and the western tributaries (e.g., Tangarakau, Ohura, and Ongarue Rivers) and isolated ponds and dams are excluded from the closure because they are largely a shortfin fishery and remain open to commercial fishing (MFish 2004a). The stocks also support a significant Maori customary fishery (MFish 2004b) and any increase in this fishery would further reduce the value of these reserves. The most productive areas for eels are lowland lakes and streams and rivers of low gradient. However, there are few reserves in these areas at present and most have been heavily fished. Nevertheless, the biggest gains to Class 1 reserves would be obtained by closing the most productive areas to commercial fishing. Appendix 2 lists tonnages in different catchments and could be used to select appropriate catchments for reserves. Table A2.3b shows that the percentage of the present stock of eels found in reserves and small streams is evenly distributed throughout the country. All eel statistical and quota management areas have more than 20% of their current stock protected in reserves and small streams. The areas with the largest stocks, Westland and Southland, also have a high proportion in reserves and small streams. 6.3.2 Closure of the entire DOC estate to fishing The area of reserves could be increased by closing forest parks and the remainder of the DOC estate, to commercial and non-commercial eel fishing. Such closures would increase the amount of riverine habitat in reserves and slightly increase harvest rates in fished areas. The closure of lakes might be difficult to enforce because there is often public road access, and although DOC often controls the riparian or marginal strip it does not necessarily own the lake bed. 6.3.3 Stocking waters above waterfalls and dams Stocking closed areas upstream of low waterfalls or rapids may be worthwhile in a few locations, such as in the upper Mohaka River. This should increase eel stocks and the number of migrants because mature silver eels are unlikely to be damaged or killed during their downstream passage through low falls and rapids. However, dead eels have been found below high waterfalls (J. Boubée, NIWA, pers. comm.), and closed areas upstream of waterfalls appear to be limited in size. Also, anglers and others may object to the stocking of eels in some eel-free waters above waterfalls, such as Lakes Rotoiti and Rotorua in the North Island. Although some hydro lakes are regularly stocked this does not necessarily increase the numbers of migrants. Large eels can be commercially harvested and migrants may die in the turbines during their downstream migration. The area with the greatest potential is Lakes Te Anau and Manapouri. These lakes are currently being stocked with elvers transferred from below the Mararoa Control Structure and commercial fishing is prohibited here as they are within the Fiordland National Park. These lakes and associated tributaries could produce about 13 tonnes of female migrants per annum. However, techniques need to be developed to prevent migrants from entering the turbines at Deep Cove and to transfer them to the Waiau River downstream of the Mararoa Control Structure; this is currently being investigated in a joint research project by Meridian Energy and NIWA.

25
6.4 Further studies The adequacy of current and proposed reserve areas is difficult to assess without more information on the factors controlling the population dynamics of longfin eels. More information is needed on density dependent survival and growth rates, the factors controlling sex composition, and the incidence of male-dominated populations. This report indicates that perhaps 17% of the current tonnage of longfin eels resides in large rivers and lakes. It is difficult and expensive to determine the biomass of eels in these waters and improved stock estimates are unlikely to change the conclusions of this report. Depletion fyke netting techniques may be useful in small to moderate sized rivers (Jellyman & Graynoth 2005) and mark recapture methods could be tested in large rivers and lakes, although there are problems with non-random dispersal and recapture of tagged fish. It may be possible to determine biomass in a few large rivers and lakes, using a combination of traps and tagging techniques (Secor et al. 2002), and then estimate stocks generally using commercial catch rate statistics, although proposals to carry out such trials have not been funded to date. 7. ACKNOWLEDGEMENTS We thank Julian Sykes and Greg Kelly for assistance in the field surveys and Julian Sykes, Helen Hurren, and Michelle Wild for assistance with GIS analyses. Jody Richardson and Julian Sykes supplied information linking the REC to the NZFFDB. Roddy Henderson supplied data on mean annual low flows and Phillipe Gerbeaux and Hans Eikass supplied data on eel biomass in west coast streams. We also thank Dave Allen, Jacques Boubée, Andy McKenzie, Richard O’Driscoll, and Peter Todd, for reviewing draft manuscripts and Mike Beardsell for editorial assistance. This research was carried out by NIWA under contract to the Ministry of Fisheries (Project Codes EEL2002/03, EEL2006/03) and also used data collected under FRST programmes (C01X308, C01X0511, C01X0006, CO1X0305). 8. REFERENCES Annala, J.H.; Sullivan, K.J.; O'Brien, C.J.; Smith, N.W.; Grayling, S.M. (2003). Report from the Fishery
Assessment Plenary. (Unpublished report held in NIWA library, Wellington) 616 p. Anon. (1956). Catchments of New Zealand. Soils Conservation and Rivers Control Council, Government
Printer, Wellington, 131 p. Anon. (1997). New Zealand dam inventory. Ministry of Commerce Report. 36 p. Beentjes, M.P. (1999). Size, age, and species composition of commercial eel catches from South Island
market sampling, 1997–98. NIWA Technical Report 51. 17 p. Beentjes, M.P.; Chisnall, B.L. (1997). Trends in size and species composition and distribution of commercial
eel catches. New Zealand Fisheries Data Report 89. 16 p. Beentjes, M.P.; Chisnall, B.L. (1998). Size, age, and species composition of commercial eel catches from
market sampling, 1996–97. NIWA Technical Report 29. 23 p. Boubée, J.A.T.; Williams, E.K. (2006). Downstream passage of silver eels at a small hydroelectric facility.
Fisheries Management and Ecology 13: 165–176.

26
Broad, T.L.; Townsend, C.R.; Arbuckle, C.J.; Jellyman, D.J. (2001). A model to predict the presence of longfin eels in some New Zealand streams, with reference to riparian vegetation and elevation. Journal of Fish Biology 58: 1098–1112.
Burnet, A.M.R. (1952a). Studies on the ecology of the New Zealand freshwater eels 1. The design and use of
an electric fishing machine. Australian Journal of Marine and Freshwater Research 3: 111–125.
Burnet, A.M.R. (1952b). Studies on the ecology of the New Zealand longfinned eel, Anguilla dieffenbachii
Gray. Australian Journal of Marine and Freshwater Research 3: 32–63. Burnham, K.P.; Anderson, D.R. (2002). Model selection and multimodel inference. A practical information-
theorectic approach. Second edition. Springer, New York. Cairns, D. (1942). Life history of the two species of freshwater eel in New Zealand. III. Development of sex.
Campaign of eel destruction. New Zealand Journal of Science and Technology 23: 173B–178B.
De Leo, G.A.; Gatto, M. (1995). A size and age-structured model of the European eel (Anguilla anguilla L.).
Canadian Journal of Fisheries and Aquatic Sciences 52: 1351–1367. Francis, R.I.C.C.; Jellyman, D.J. (1999). Are mean size data adequate to monitor freshwater eel fisheries?
Marine and Freshwater Research 50: 355–366. Glova, G.J.; Jellyman, D.J.; Bonnett, M.L. (1998). Factors associated with the distribution and habitat of eels
(Anguilla spp.) in three New Zealand lowland streams. New Zealand Journal of Marine and Freshwater Research 32: 255–269.
Graynoth, E. (2006). The long and the short of it: looking after the needs of native eels. Water and
Atmosphere 14(2): 10–11. Graynoth, E.; Niven, K. (2004). Habitat for female longfinned eels in the West Coast and Southland, New
Zealand. Science for Conservation 5–32. Graynoth, E.; Taylor, M. (2004). Growth of juvenile eels (Anguilla spp.) in lowland streams in New Zealand.
Fisheries Research 66: 95–106. Green, R.H. (1979). Sampling design and statistical methods for environmental biologists. John Wiley and
Sons, New York. Hobbs, D.F. (1948). Trout fisheries in New Zealand. Fisheries Bulletin 9. 175 p. Hobbs, D.F.; Cairns, D. (1938). Fisheries research 1937-38. Southland Acclimatisation Society Annual
Report. 6–9. Hoyle, S.D.; Jellyman, D.J. (2002). Longfin eels need reserves: modelling the effects of commercial harvest
on stocks of New Zealand eels. Marine and Freshwater Research 53: 887–896. Insightful (2001). S-Plus 6.0 Professional Release 1. Jellyman, D.J. (1993). A review of the fishery for freshwater eels. New Zealand Freshwater Research Report
10. 51 p.

27
Jellyman, D.J. (1997). Variability in growth rates of freshwater eels (Anguilla spp.) in New Zealand. Ecology of Freshwater Fish 6: 108–115.
Jellyman, D.J.; Bonnett, M.L.; Sykes, J.R.E.; Johnstone, P. (2003). Contrasting use of daytime habitat by two
species of freshwater eel (Anguilla spp) in New Zealand rivers. In: Dixon, D.A. (ed.). Biology, management and protection of catadromous eels, American Fisheries Society, Bethesda, Maryland, USA., pp. 63–78.
Jellyman, D.J.; Graynoth, E. (2002). Longfinned eel female spawning escapement. Unpublished report held
by MFish, Wellington. EEL2001/02. 23 p. Jellyman, D.J.; Graynoth, E. (2005). The use of fyke nets as a quantitative capture technique for freshwater
eels (Anguilla spp.). Fisheries Management and Ecology. 12: 237–247. Jellyman, D.J.; Graynoth, E.; Francis, R.I.C.C.; Chisnall, B.L.; Beentjes, M.P. (2000). A review of evidence
for a decline in the abundance of longfinned eels (Anguilla dieffenbachii) in New Zealand. Unpublished report held by MFish, Wellington, EEL9802. 59 p.
Jowett, I.G. (1998). Hydraulic geometry of New Zealand rivers and its use as a preliminary method of habitat
assessment. Regulated Rivers: Research and Management 14: 451–466. Krebs, C.J. (1989). Ecological methodology. Harper Collins, New York. 654 p. Lamouroux, N.; Jowett, I.G. (2005). Generalized instream habitat models. Canadian Journal of Fisheries
and Aquatic Sciences 62: 7–14. Leathwick, J.R.; Rowe, D.; Richardson, J.; Elith, J.; Hastie, T. (2005). Using multivariate adaptive regression
splines to predict the distributions of New Zealand's freshwater diadromous fish. Freshwater Biology 50: 2034–2052.
Mace, P.M.; Sissenwine, M.P. (1993). How much spawning per recruit is enough? Canadian Special
Publication of Fisheries and Aquatic Sciences 120: 101–117. McCleave, J.D.; Jellyman, D.J. (2004). Male dominance in the New Zealand longfin eel population of a New
Zealand river: Probable causes and implications for management. North American Journal of Fisheries Management 24: 490–505.
McDowall, R.M. (1990). New Zealand freshwater fishes. A natural history and guide. Heinemann Read,
Auckland. 553 p. MFish. (2004a). Setting of sustainability and other management controls for stocks to be introduced into the
QMS on 1 October 2004. North Island Shortfin and Longfin Eels (SFE, LFE). Final Advice Paper. 232 p.
MFish. (2004b). Setting of sustainability and other management controls for stocks to be introduced into the
QMS on 1 October 2004. North Island Shortfin and Longfin Eels (SFE, LFE). Initial Position Paper. 117 p.
Mitchell, C.P.; Boubée, J.A.T. (1992). Impacts of turbine passage on downstream migrating eels. New
Zealand Freshwater Fisheries Miscellaneous Report 112: 47. Rowe, D.K. (1981). Fisheries investigations in the Motu River. New Zealand Ministry of Agriculture and
Fisheries, Fisheries Environmental Report 11. 46 p.

28
Secor, D.H.; Baker, J.; Morrison, W.; Steinbacher, J. (2002). Ecology and contamination of the Hudson
River American eel. Final report to the Hudson River Foundation available at http://cbl.umces.edu/~secor/eels.html 1. 167 p.
Snelder, T.H.; Biggs, B.J.F. (2002). Multi-Scale River Environment Classification for water resources
management. Journal of the American Water Resources Association 38: 1225–1239. Statistics New Zealand. (2005). New Zealand's freshwater eel resource. http://www.stats.govt.nz/ 9 p. Strickland, R.R. (1985). Distribution and habitats of fishes in the Mohaka River. New Zealand Ministry of
Agriculture and Fisheries, Fisheries Environmental Report 55. 86 p. Vollestad, L.A.; Jonsson, B. (1988). A 13-year study of the population dynamics and growth of the European
eel (Anguilla anguilla) in a Norwegian River: evidence for density-dependant mortality, and development of a model for predicting yield. Journal of Animal Ecology 88: 983–997.
Wilkinson, L. (2000). Systat10. SPSS, Chicago. Woods, C.S. (1964). Fisheries aspects of the Tongariro Power Development Project. Fisheries Technical
Report 10. 214 p. Wyatt, R.J. (2003). Mapping the abundance of riverine fish populations: integrating hierarchical Bayesian
models with a geographic information system (GIS). Canadian Journal of Fisheries and Aquatic Sciences 60: 997–1006.
29
APPENDIX 1: UPDATED MODELS OF THE BIOMASS OF LONGFIN EELS IN NEW ZEALAND RIVERS AND STREAMS A1 Introduction An initial model of the biomass (kg/km) and tonnage of longfin eels in rivers and streams (Graynoth & Niven 2004) used data collected from 120 sites electric fished and fyke netted in the west coast and Southland regions of the South Island in January and February 2001 and 2002. The model also used historical data on the biomass of eels in Southland (Hobbs & Cairns 1938, Cairns 1942, Burnet 1952b) Wellington (Burnet 1952a) and three small coastal streams (Glova et al. 1998). Additional information for the present study was collected by a team of five who electric-fished 75 sites in the Ruamahanga and Whanganui catchments in the North Island in February 2005 (Figure A1.1). Another 5 sites in drains and tributaries of Lake Ellesmere were electric fished in April 2006, making a grand total of 212 sites (Appendix 3). A2 Methods A2.1 Field surveys Similar techniques were used in 2005 and 2006 to those employed in previous surveys (Graynoth & Niven 2004). The sites were selected for electric fishing using a stratified random sampling and included a wide variety of wadeable streams and rivers of different size and gradient distributed throughout each catchment. In order to reduce travel time and associated costs, sites tended to be grouped within particular catchments and were usually located near a road bridge or were accessed over farmland using four wheel drive vehicles. Only sites that could be electric fished were selected for study and no attempts were made to estimate eel stocks in large rivers using depletion fyke netting (Jellyman & Graynoth 2005) or mark recapture techniques. The largest river electric fished was the Waingawa which has a mean annual seven day low flow (MALF) of 2.81 m3/s. In single channel streams and rivers, the entire width of a representative 50 m (range 17–67 m) long reach was thoroughly electric fished. Different habitats were sub–sampled to estimate stocks in braided reaches of the Ruamahanga River and a tributary, the Waipoua River. On average, 160 m2 of stream bed was electric fished per site – these sites are considerably larger in area than those usually included in the New Zealand Freshwater Fish Database (NZFFDB). The average width of the reach (mean of four measurements), depths (n = 12), discharge and substrate features was recorded and a NZFFDB form was completed with other details such as riparian vegetation. Flows were low during the North Island survey and averaged 86% of MALF. The samples taken from Lake Ellesmere drains and tributaries were collected during an extreme drought. The upper and middle reaches of some of these waters were almost dry, and it is likely that some eels had migrated downstream to deep pools in the lower reaches. Therefore the results from the upper, middle, and lower reaches of each stream were combined into a single sample to provide the best estimate of eel biomass in these waters. The database (Appendix 3) contains 21 records from small streams that were randomly selected but were dry during the summer surveys and contained no eels. Based on GIS measurements these streams had a mean annual flow (MAF) of 206 l/s and a mean MALF of 28 l/s. It was important to include these streams in the database to ensure it was representative of the REC and that biomass estimates decline to nil or very low levels in small intermittent streams.

30
Tramway Drain, Lake Ellesmere. Upper tributary of Whanganui River.
Upper tributary of Ruamahanga River.
Figure A1.1: Examples of the range of rivers and streams surveyed in 2005 and 2006. A2.2 Electric fishing procedures and efficiency Electric fishers worked upstream stunning eels and catching them in hand nets and hand-held seines. The efficiency of electric fishing was assessed by repeat fishing (twice) five randomly selected sites and by subjectively estimating the likely efficiency of electric fishing in all sites. Although small eels can be difficult to catch, large eels that make up the bulk of the biomass are generally easier to see and capture. Efficiency was calculated from the reduction in catches in the second run and it was assumed this efficiency would have remained constant if three or more runs were used to estimate total eel numbers. The average efficiency for all sizes of eels ranged from 67% to 90% for the five sites repeat fished. Efficiency was size

31
dependent (Figure A1.2). It was assumed that all eels over 600 mm in length were caught in the first run. For eels less than 600 mm in length electric fishing efficiency was calculated as 0.586+0.00068*Length (mm). This is a slightly higher efficiency than measured in previous studies (Graynoth & Taylor 2004). Electric fishers’ visual estimates of total fishing efficiency were within 20% of calculated values in all but four sites. These sites were particularly difficult to fish and efficiencies were adjusted to the lower visual estimates (40% to 55% efficiency). Weight for both species of eel was calculated using standard length weight equations (Francis & Jellyman 1999)
0 200 400 600 800Length (mm)
50
60
70
80
90
100
Per
cent
age
caug
ht in
firs
t run
0 200 400 600 800Length (mm)
50
60
70
80
90
100
Per
cent
age
caug
ht in
firs
t run
Figure A1.2: Electric fishing efficiency (percentage of total estimated population in 50 mm size classes of eels). Based on 263 eels caught in the first run and 53 eels in the second run at 5 sites in the Ruamahanga and Whanganui catchments. Linear equation fitted to eels < 600 mm in length. A2.3 Effects of commercial fishing on eel biomass estimates The effects of commercial fishing on biomass estimates were assessed using a computer simulation model of the population dynamics of longfin eels in the Aparima River, Southland (Jellyman et al. 2000, Hoyle & Jellyman 2002). Harvest rates were assumed to be constant from 1975 to 2000 and the biomass of eels and other statistics were recorded at the end of this period. This is the most detailed model available on the population dynamics of longfin eels. The latest version of the model includes variable recruitment, density dependent growth and survival rates, and an increase in the proportion of males in recent years (McCleave & Jellyman 2004). A2.4 Data analysis In the earlier study, eel biomass per km of river was modelled using River Environment Classification (REC) estimates of gradient G (Ln % slope) and mean annual flow F (Ln m
3/s).
kg/km = exp(2.44 - 0.805*G) * (F + 4.721)
The sites fished were not a random sample of the population of reaches in the REC and contained a higher than expected proportion of large low gradient streams and rivers. Also the variability in biomass was not constant and increased in reaches where eels were more abundant. It was therefore necessary to negatively weight data points according to mean flow and hence eel biomass (Graynoth & Niven 2004).

32
For the present study it was decided to model eel biomass using generalised linear and additive models with a logarithmic transformation (link) using Splus (Insightful 2001). The data were over-dispersed with a high dispersion parameter and standard errors were calculated assuming a quasi-likelihood family with “mu” variance. There were several advantages to this approach:
• it seems quite likely that factors act in a multiplicative fashion; • the models are fitted using maximum likelihood; • the data did not require weighting; • negative estimates of eel biomass cannot occur; • the significance of different models can be tested using F tests on the deviance residuals.
A forward stepwise procedure was used to select factors because a backward stepwise procedure resulted in inconsistent and complex models due to the strong correlation between related parameters, such as MALF with MAF and distance inland with altitude. Interactions between selected parameters such as Gradients*MALF and Altitude*Distance inland were initially included but were later deleted because they had little or no significant influence on the deviance explained in models. The final models used to predict biomass were selected using knowledge of the biology of eels, the plausibility in trends shown in preference factors (terms), and the value of key statistics such as the percentage of deviance explained and Akaike’s Information Criterion (AIC) (Burnham & Anderson 2002). It was assumed that the log transformed models had normally distributed errors with a constant variance (see Figure A1.10) and therefore AIC was calculated as:
n log (Residual Deviance/n) + 2K
where n = number of samples and K is the degrees of freedom used in the model. AIC differences from the minimum value (AICmin) are listed in the tables. A series of alternative models was also developed based on eel biomass measured in the conventional fashion as g/m2. Regression trees were considered but were not used because they have limited ability to predict outside the sampled area. This was an important issue because estimates of eel biomass were needed in large rivers that were too deep and fast to electric fish or net. A2.5 REC statistics used River flow and gradient control the morphology of rivers and were used as the key variables in this study (Tables A2.1 and A2.2). River flows (MAF and MALF) were expressed as ln l/s because this avoids negative numbers and simplifies equations. Gradient was expressed as ln 100*% gradient with a fixed minimum of 0.1% for REC reaches with nil or false negative gradients. The derivation of stream shade, an index ranging from 0 to 1, and mean summer water temperatures was described by Leathwick et al. (2005). The median substrate size for surveyed reaches was determined by applying the mean diameter of different size classes, such as mud (0.06 mm) and cobbles (164 mm), to visual estimates of the substrate composition. Geological classes listed in the REC were reduced to seven categories, land cover to five categories and region to seven districts. Other environmental predictors listed by Leathwick et al. (2005) were excluded from this analysis because there was little a priori evidence to suggest they were likely to influence longfin eel biomass. Because only 212 sites were surveyed, there was also a risk that models would become too complex, overfitted, biased and less accurate for prediction purposes if an excessive number of environmental variables were used (Burnham & Anderson 2002). Analyses were complicated by the interrelationships between environmental variables. Stream shade and river bed substrates were strongly correlated with river flow and gradient. Larger streams and rivers were generally of lower gradient and had less shade with higher summer temperatures than smaller streams.

33
Reaches with high gradient were mainly found in the west coast region: they tended to be present at high altitudes, drained forest or scrub catchments and had coarse substrates with a high proportion of boulders. A3 Results A3.1 Effects of fishing pressure on biomass estimates The effects of commercial fishing on the biomass of longfin eels was assessed using a computer simulation model based on field data collected from the Aparima River. This showed that increases in harvest rate are likely to reduce the total biomass of all sizes of longfin eels present (Figure A1.3), the mean length and mean weight of harvestable eels (over 220 g), and the relative biomass of large female eels (Figure A1.4).
0 10 20 30 40 50 60Harvest rate (% per year)
0
10
20
30
40
50
60
70
80
Tota
l bio
mas
s (t
) in
Apa
rim
a ca
tchm
ent
0 10 20 30 40 50 60Harvest rate (% per year)
200
300
400
500
600
Mea
n le
ngth
(mm
) or
wei
ght (
g) Mean length
Mean weight
Figure A1.3: Simulated changes of the effects of different harvest rates (% per year of eels > 220 gms ie. 460 mm) on the total biomass (t) of all sizes of eels and the mean length (mm) and weight (g) of harvestable longfin eels in the Aparima River.
0 10 20 30 40 50 60Harvest rate (% per year)
0
10
20
30
40
Per
cent
age
of b
iom
ass
in fe
mal
e ee
ls (>
=700
mm
)
Figure A1.4: Simulation of the proportion of total biomass in large female longfin eels (based on Aparima data but with constant recruitment and 50:50 sex ratios).
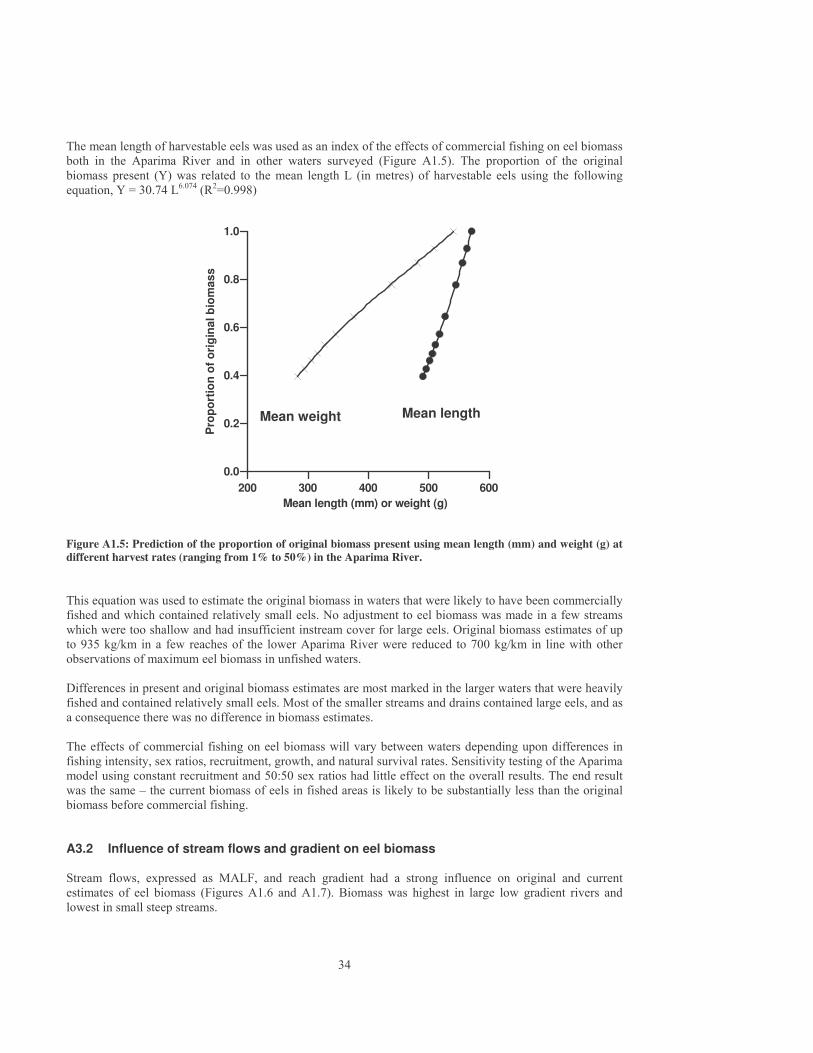
34
The mean length of harvestable eels was used as an index of the effects of commercial fishing on eel biomass both in the Aparima River and in other waters surveyed (Figure A1.5). The proportion of the original biomass present (Y) was related to the mean length L (in metres) of harvestable eels using the following equation, Y = 30.74 L6.074 (R2=0.998)
200 300 400 500 600Mean length (mm) or weight (g)
0.0
0.2
0.4
0.6
0.8
1.0
Pro
port
ion
of o
rigi
nal b
iom
ass
Mean lengthMean weight
Figure A1.5: Prediction of the proportion of original biomass present using mean length (mm) and weight (g) at different harvest rates (ranging from 1% to 50%) in the Aparima River. This equation was used to estimate the original biomass in waters that were likely to have been commercially fished and which contained relatively small eels. No adjustment to eel biomass was made in a few streams which were too shallow and had insufficient instream cover for large eels. Original biomass estimates of up to 935 kg/km in a few reaches of the lower Aparima River were reduced to 700 kg/km in line with other observations of maximum eel biomass in unfished waters. Differences in present and original biomass estimates are most marked in the larger waters that were heavily fished and contained relatively small eels. Most of the smaller streams and drains contained large eels, and as a consequence there was no difference in biomass estimates. The effects of commercial fishing on eel biomass will vary between waters depending upon differences in fishing intensity, sex ratios, recruitment, growth, and natural survival rates. Sensitivity testing of the Aparima model using constant recruitment and 50:50 sex ratios had little effect on the overall results. The end result was the same – the current biomass of eels in fished areas is likely to be substantially less than the original biomass before commercial fishing. A3.2 Influence of stream flows and gradient on eel biomass Stream flows, expressed as MALF, and reach gradient had a strong influence on original and current estimates of eel biomass (Figures A1.6 and A1.7). Biomass was highest in large low gradient rivers and lowest in small steep streams.

35
0.0001 0.0010 0.0100 0.1000 1.0000MALF (m 3/s)
0
100
200
300
400
500
600
700
Bio
mas
s (k
g/km
)
CurrentOriginal
0.101.00
10.00
Gradient (%)
0
100
200
300
400
500
600
700
Bio
mas
s (k
g/km
)
CurrentOriginal
Figure A1.6: Relationship between the estimated original biomass (kg/km) of longfin eels before commercial fishing (-) and current biomass (----) with mean annual low flows (MALF) and river gradient (%). X axis plotted on a log scale and curves plotted with a distance weighted least squares (DWLS) smoother with a tension of 1.0.
0.00010.0010
0.01000.1000
1.0000
10.0000
100.0000
MALF (m3/s)
0.1
1.0
10.0
Gra
dien
t (%
)
100
200
300
400
500
600
700
Original biomass
0.00010.0010
0.01000.1000
1.0000
10.0000
100.0000
MALF (m 3/s)
0.1
1.0
10.0
Gra
dien
t (%
)
100
100
200
300 400
500
Current biomass
Figure A1.7: Combined influence of MALF and gradient on the estimated original and current biomass of eels (kg/km). Systat contour plots with a tension of 1. Crosses show sites at which gradient and flow were measured. X axis extended to 300 m3/s to show lack of field data and predicted values in large rivers. A3.3 Prediction of biomass using generalised additive models Tables A1.1 and A1.2 contain the summary results of GAMs used to predict original and current eel biomass (kg/km) in rivers and streams throughout New Zealand.

36
Table A1.1 Deviance explained in GAM models that predict the current biomass of longfin eels (kg/km) in rivers and streams. MALF, Mean annual low flow. MAF, Mean annual flow. s(X), spline smoothers. AIC min, Minimum Akaike’s information criterion.
No
Model Deviance explained dof
% explained
Models compared F P value AIC min
Null 26042 211.0
1 MALF 16479 210.0 36.7 45.6
2 s(MALF) 16155 207.2 38.0 2 cf 1 1.32 0.269 47.0
3 MALF+Gradient 14208 209.0 45.4 3 cf 2 12.42 <0.001 16.3
4 s(MALF)+s(Gradient) 13153 203.0 49.5 4 cf 3 2.47 0.025 12.1
5 s(MALF)+s(Gradient)+s(MAF) 12786 199.0 50.9 5 cf 4 1.31 0.267 14.1
6 s(MALF)+s(Gradient)+s(Summer temp.) 12496 199.5 52.0 6 cf 4 2.77 0.034 8.3
7 s(MALF)+s(Gradient)+s(Shade index) 12648 199.1 51.4 7 cf 4 1.81 0.129 11.6
8 s(MALF)+s(Gradient)+s(Distance inland) 12297 199.5 52.8 8 cf 4 3.88 0.006 4.9
9 s(MALF)+s(Gradient)+s(Altitude) 12332 199.5 52.6 9 cf 4 3.68 0.009 5.5
10 s(MALF)+s(Gradient)+Geology 11927 197.4 54.2 10 cf 4 3.38 0.004 2.6
11 s(MALF)+s(Gradient)+Landcover 11960 199.0 54.1 11 cf 4 4.83 0.001 0.0
12 s(MALF)+s(Gradient)+Region 11886 197.0 54.4 12 cf 4 3.21 0.005 2.7
13 s(MALF)+s(Gradient)+s(Biomass Shortfins) 12223 199.1 53.1 13 cf 4 3.46 0.010 4.4
Table A1.2 Deviance explained in GAM models that predict the original biomass of longfin eels (kg/km) in rivers and streams prior to the start of commercial fishing. MALF, Mean annual low flow. MAF, Mean annual flow. s(X), spline smoothers. AIC min, Minimum Akaike’s information criterion.
No Model Deviance explained dof
% explained
Models compared F P value
AIC min
Null 44132 211.0
1 MALF 21756 210.0 50.7 63.8
2 s(MALF) 21111 207.2 52.2 2 cf 1 2.03 0.115 63.0
3 MALF+Gradient 16837 209.0 61.8 3 cf 2 21.04 <0.001 11.7
4 s(MALF)+s(Gradient) 15960 203.4 63.8 4 cf 3 1.92 0.084 11.6
5 s(MALF)+s(Gradient)+s(MAF) 15266 199.0 65.4 5 cf 4 1.98 0.092 11.0
6 s(MALF)+s(Gradient)+s(Summer temp.) 14600 199.4 66.9 6 cf 4 4.62 0.001 0.8
7 s(MALF)+s(Gradient)+s(Shade index) 14922 199.4 66.2 7 cf 4 3.33 0.012 5.4
8 s(MALF)+s(Gradient)+s(Distance inland) 14936 199.5 66.2 8 cf 4 3.52 0.009 5.4
9 s(MALF)+s(Gradient)+s(Altitude) 14991 199.4 66.0 9 cf 4 3.33 0.012 6.4
10 s(MALF)+s(Gradient)+Geology 14855 197.3 66.3 10 cf 4 2.31 0.036 8.7
11 s(MALF)+s(Gradient)+Landcover 14557 199.5 67.0 11 cf 4 5.03 <.001 0.0
12 s(MALF)+s(Gradient)+Region 14560 197.4 67.0 12 cf 4 3.03 0.007 4.2
13 s(MALF)+s(Gradient)+s(Biomass Shortfins) 15235 199.5 65.5 13 cf 4 2.31 0.060 9.6

37
Model number 4 was selected as the most suitable, primarily because MALF and reach gradient are the most important factors and explain most of the variation in eel biomass (49% to 64%). There is also a strong biological justification for the use of these factors – minimum flows are likely to control eel densities, by reducing instream habitat and food supplies and increasing competition for space and food, while gradient and flow have major influence on stream widths, depths, water velocities, substrates, and other features. The addition of extra variables, some of which were strongly correlated, increased the complexity of the model and led to small (less than 5%) improvements in deviance explained. Models that used categorical classes (Models 10 to 12) were also difficult to apply nationwide because some classes were inadequately sampled. The equation corresponding to model 4 takes the form of:
Eel biomass (kg/km) = Constant*exp(s(x1)+s(x2)) The constant for original biomass is 61.16 and for current biomass is 52.10. The terms are shown in Figures A1.8 and A1.9. Deviance residuals for model 4 (Table A1.2) were symmetrical with a few minor outliers (Figure A1.10). These GAMs were used to predict biomass in large rivers that could not be surveyed. This issue is discussed in Section 8.3.6 and indications of the likely biomass are shown in Figures A1.7 and A1.12.
0.0001 0.0010 0.0100 0.1000 1.0000MALF (m 3/s)
-4
-3
-2
-1
0
1
2
s(M
ALF
) and
1 S
E
0.101.00
10.00
Gradient(%)
-3
-2
-1
0
1
2
s(G
radi
ent)
and
1 S
E
Figure A1.8: Smoothed values (preference values or terms) and one SE for original biomass (kg/km) prior to commercial fishing.
0.0001 0.0010 0.0100 0.1000 1.0000MALF (m 3/s)
-4
-3
-2
-1
0
1
s(M
AL F
) and
1 S
E
0.101.00
10.00
Gradient(%)
-3
-2
-1
0
1
s(G
radi
ent)
and
1 S
E
Figure A1.9: Smoothed values (preference values or terms) and one SE for current biomass (kg/km).

38
0 100 200 300 400 500 600
Fitted
-20
-10
010
2030
Dev
ianc
e R
esid
uals
168
187
155
Quantiles of Standard Normal
Pea
rson
Res
idua
ls
-3 -2 -1 0 1 2 3
-20
-10
010
2030
40
Figure A1.10: Deviance residuals plotted against fitted estimates and Pearson residuals plotted as quartiles of standard normal plots for Model 4 in Table A1.2. The estimated original biomass of longfin eels (kg/km) was modelled using spline smoothers and a log link against gradient (ln %) and MALF (ln l/s). A3.4 Prediction of biomass using a generalised linear model An alternative generalised linear model is shown in Table A1.3. Although simpler to apply than GAMs, this is not recommended primarily because it appeared to overestimate eel biomass in large rivers and at low gradients. There is no biological reason why a linear relationship should exist over the entire range of river and stream sizes. Table A1.3: Generalised linear models of original and current biomass of longfin eels (kg/km) predicted using MALF (ln l/s) and reach gradient (ln 100*% gradient) and log link
Data Coefficients: Value Std. Error t value Original Intercept 5.5382 0.4275 12.9 MALF 0.3135 0.03219 9.7 Gradient -0.6050 0.0806 -7.5 Current Intercept 5.0497 0.4786 10.5 MALF 0.2472 0.03564 6.9 Gradient -0.4760 0.09067 -5.2
A3.5 Prediction of biomass measured as g/m2 Biomass (g/m2) was determined using stream widths measured during the summer low flow field surveys. Biomass was nil in ephemeral streams and increased rapidly to a peak of 160 g/m2 in some small streams (1–5 m in width) and then declined slowly in rivers of greater width (Figure A1.11). Although GAMs were developed, they were not used for several reasons. The models were complex and usually required three or more parameters (e.g., gradient, MALF and width). Also river width is quite variable and is difficult to estimate at MALF, both in the field and in the REC. Models to predict width at MALF were developed using field data from 206 sites studied plus data on widths at MALF in 73 rivers (Jowett 1998). The best generalised linear model used both MAF and MALF and had a R2 of 0.87. Finally the use of a ratio such as g/m2 complicates statistical analyses because of asymmetrical distributions and potential errors in both the denominator and numerator (Green 1979). It was simpler to calculate biomass as kg/km and determine tonnages using river lengths which are accurately measured in the REC.

39
10 20 30 40 50Width during surveys (m)
0
50
100
150
Est
imat
ed o
rigi
nal b
iom
ass
(g/m
2 )
10 20 30 40 50Width during surveys (m)
0
50
100
150
Cur
rent
bio
mas
s (g
/m2 )
Figure A1.11: Trends in estimated original and current biomass (g/m2) with stream width (m). Distance weighted least squares smoother with a tension of 1.0. A3.6 Eel biomass in large rivers A3.6.1 Rivers surveyed The largest river surveyed was the lower reaches of the Aparima River which has a MAF of 26 m3/s, a MALF of 3.6 m3/s, and currently supports a mean biomass of about 300 kg/km of longfin eels. There were no field data available on the biomass of eels in larger rivers, such as the Waitaki, Buller, and Waikato. These rivers are very difficult to survey and large–scale mark recapture programmes would be required to estimate the current biomass of eels. Moreover, most of these large rivers are fished and this makes it difficult to validate estimates of the original biomass of eels present before the start of commercial fishing. A3.6.2 Trends with flow Estimates of biomass in the current biomass model peak at about 800 kg/km in the lower reaches of large rivers of gentle gradient and are much less than estimates of 3500 kg/km in the original biomass model (Figure A1.12). The preference values or terms (Figures A1.8 and A1.9) have moderate standard errors at the highest flows surveyed and hence there is some uncertainty about extrapolated values in larger rivers. Nevertheless, the most important eel fisheries are found in large rivers, such as the Waikato and Mataura (Beentjes & Chisnall 1997), and therefore it seems likely that eels are most abundant here. A3.6.3 Instream eel habitat The Instream Flow Incremental Methodology (IFIM) can be used to estimate the amount of eel habitat present in large rivers at different flows. The amount of habitat present at median or low flows could act as an index of potential eel biomass, assuming that fishing pressure and other factors that affect biomass, such as recruitment and food supplies, are either less important or have a relatively consistent effect. Large eels generally hide during the day under marginal or instream cover and move into more open areas, including shallow riffles, to feed at night (Graynoth 2006). They are most abundant in slow flowing water (under 0.15 m/s) and are very rarely found in fast flowing water (over 1 m/s) either during the day or night. Water depth and substrate preferences are weaker, varying between the day and night, and it is difficult to

40
measure and predict the amount of marginal and instream cover present. Therefore the amount of habitat present is best measured using water velocity preference curves.
1 10 100MALF (m 3/s)
0
1000
2000
3000
4000
Bio
mas
s (k
g/km
)
DOC modelCurrent biomassOriginal biomass
Figure A1.12: Predicted biomass (kg/km) in large streams and rivers of gentle gradient (0.1%). Using GAMs (Tables A1.1 and A1.2, Model 4) and the DOC model (Section 8.2.4). Vertical dotted line at 4 m3/s shows the largest river surveyed (Aparima River). IFIM modelling, using a River Hydraulics and Habitat Simulation programme (RHYHABSIM) and adult longfin (>300 mm) water velocity preferences (Jellyman et al. 2003), showed that the amount of daytime resting habitat increased with discharge in wide, shallow, braided sections of the lower Waitaki River (Figure A1.13). By contrast, the amount of habitat decreased with flow in the U–shaped, single channel section upstream of Kurow. Slow flowing water, suitable for large eels, was located only along channel margins and this is the reason why the total amount of habitat was substantially higher in the multi-channelled braided reach than the single channel reach. These results indicate the amount of habitat and presumably biomass of eels in large rivers will vary depending on channel shape. Further studies, perhaps similar to those undertaken by Jowett (1998) and Lamouroux & Jowett (2005), are needed to clarify the relationship between eel biomass and instream habitats before instream habitat measurements can be used to predict eel biomass.
50 100 150 200 250 300 350 400
Flow (m 3/s)
0
50
100
150
Eel
hab
itat (
m2 /m
)
SingleBraided
Channel type
Figure A1.13: Trends in eel habitat (weighted useable area, m2) based on water velocities, with flow in braided and single channel reaches of the lower Waitaki River.

41
A3.6.4 Conclusions The use of a cut off value at either 20 m3/s MALF or 1 tonne per km was considered but rejected on the basis that there is no evidence to support the use of an arbitrary limit and because the GAM’s are the best estimates available at present and should be used until they are shown to be invalid. Therefore both models have been used to estimate biomass in large rivers. The GAM for original biomass may overestimate that present in large rivers while the GAM for current biomass may under estimate biomass. A3.7 Regional effects Deviance residuals from the standard model of original biomass (Model 4, Table A1.2) were slightly lower than average in the west coast streams surveyed in 2002 (Figure A1.14). An analysis of variance of these deviance residuals showed that none of the differences between mean values were statistically significant at the 5% level (after Bonferroni adjustment). Therefore it seems likely that variations between different regions will have a relatively small effect on these models and that it is valid to apply these models nationally.
Canterbury
Southland
Wairarapa
Wanganui
Wellington
West coast
Region
-30
-20
-10
0
10
20
30
40
Res
idua
l dev
ianc
e
Figure A1.14: Box plot (with medians, quartiles, ranges and outliers) showing the influence of different regions on residual deviance (Table A1.2, Model 4) A3.8 Influence of altitude and inland penetration on biomass estimates Altitude and distance inland were closely related in this study (Figure A1.15). Models that used either altitude or inland penetration (Tables A1.1, A1.2, Numbers 8 and 9) explained more of the deviance and had lower AIC values than the model used to predict eel biomass in this study (Number 4). However, altitude and distance inland were not used in this study because these factors had no major influence on deviance residuals derived from the models used to predict eel biomass (Figure A1.16). In addition, the form of the smoothed relationships (preference values) in models 8 and 9 was irregular and illogical, possibly because samples collected over 200 km inland, in the upper Wanganui River catchment, had an undue influence over these relationships. Therefore no adjustments were made to account for possible reductions in eel densities with altitude and distance inland (Broad et al. 2001).

42
0 100 200 300Distance inland (km)
0
100
200
300
400
500A
ltitu
de (m
)
West coastWellingtonWanganuiWairarapaSouthlandCanterbury
REGION
Figure A1.15: Altitude (m) and distance inland (km) of survey sites.
0 100 200 300 400 500Altitude (m)
-30
-20
-10
0
10
20
30
40
Res
idua
l dev
ianc
e
0 100 200 300Distance inland (km)
-30
-20
-10
0
10
20
30
40
Res
idua
l dev
ianc
e
Figure A1.16: Influence of altitude (m) and distance inland (km) on deviance residuals for current biomass (Model 4 Table A1.1). DWLS smoother with a tension of 1.0. A3.9 Influence of stream substrate on eel biomass Two sites supported exceptionally high numbers of eels and are labelled as outliers in Figure A1.10 (Numbers 155 and 168). Both sites were in the Orautoha Stream, a tributary of the Whanganui River, and it was suspected that the high biomass was related to the large amount of instream cover provided by the boulder substrate (e.g., Figure A1.17). Therefore the influence of substrate composition on eel biomass was assessed in a subset of the data that contained 159 sites (Table A1.4) (Substrate composition was not measured in intermittent streams.) Examination of the graphs (terms) showed that the biomass of eels increased markedly in reaches with a high proportion of boulders. Unfortunately, the relationships found cannot be used to predict eel biomass because there is no information on substrate composition in the REC. Also geology could not be used as a substitute because substrates in this particular geological type (Acidic volcanic) ranged in size and were not especially coarse.

43
Figure A1.17 Boulder– strewn reach in the Orautoha Stream, a tributary of the Whanganui River which supported exceptional numbers of eels. Table A1.4: Prediction of original and current biomass using a reduced data set with field data on the % of boulders present in the substrate
Number Model Deviance
explained dof %
explained F P value
Original Null 32006 159.0
1 s(MALF)+s(Gradient) 12598 151.2 60.6
2 s(MALF)+s(Gradient)+s(% Boulders) 11036 147.3 65.5 5.36 0.0005
Current Null 18030 159.0
3 s(MALF)+s(Gradient) 10180 151.3 68.2
4 s(MALF)+s(Gradient)+s(% Boulders) 8615 147.3 73.1 6.79 0.0001
A3.10 Other factors The best predictive model, in terms of AIC, included Landcover (Model 11 in Tables A1.1 and A1.2). Most of the sites surveyed were classed as either pastoral (148) or indigenous forest (50) and there were insufficient observations at other sites (scrub (7), exotic forestry (5), tussock (2), bare ground (0) and urban (0)) to develop a useable national model. Three sites in the Hangaroa River, a tributary of the Ruamahanga River in the Wairarapa, supported substantially lower than expected numbers of longfin eels, and the outlier labelled 187 in Figure A1.10 was particularly low. The reasons for this are uncertain. The sites in this river tended to have fine substrates, lacked bank cover and deep pools, and had been affected by massive flooding earlier in the year. Also shortfin eels tended to be more abundant in this river than longfins. Nevertheless, these outliers were retained because they were valid measurements and have relatively little effect on the overall model and predictions.

44
A3.11 Interactions between shortfin and longfin eels There was no support for the hypothesis that the numbers and biomass of longfin eels are reduced due to competition in areas where shortfin eels are abundant (Figure A1.18)
50 100 150 200 250Biomass of shortfins (kg/km)
-30
-20
-10
0
10
20
30
40
Res
idua
l dev
ianc
e
Figure A1.18: Influence of the biomass of shortfin eels on residual deviance (Current biomass of longfin eels, Model 4, Table A1.1). DWLS smoother with a tension of 1.0. A3.12 Comparison with a previous model of eel biomass The previous equation (Section 8.2.4) (Graynoth & Niven 2004) overestimated the total biomass of longfin eels present in the 212 study sites by about 6%. The equation predicted sites would support about 16.9 tonnes (assuming each site was 1 km in length) compared with the total of 15.9 tonnes predicted by the new GAM model for current longfin biomass. The overestimate is primarily due to differences in biomass estimates for large rivers, and original and current model estimates are very similar to DOC model estimates for waters that contain a lower biomass of eels (Figure A1.19).
100 200 300 400 500DOC model
100
200
300
400
500
600700
Ori
gina
l bio
mas
s G
AM
100 200 300 400 500DOC model
100
200
300
400
500
Cur
rent
bio
mas
s G
AM
Figure A1.19: Comparison of original and current biomass estimates (GAM) with DOC model (Graynoth & Niven 2004) for the study sites. Dotted line is the DOC model, Crosses are the GAM.
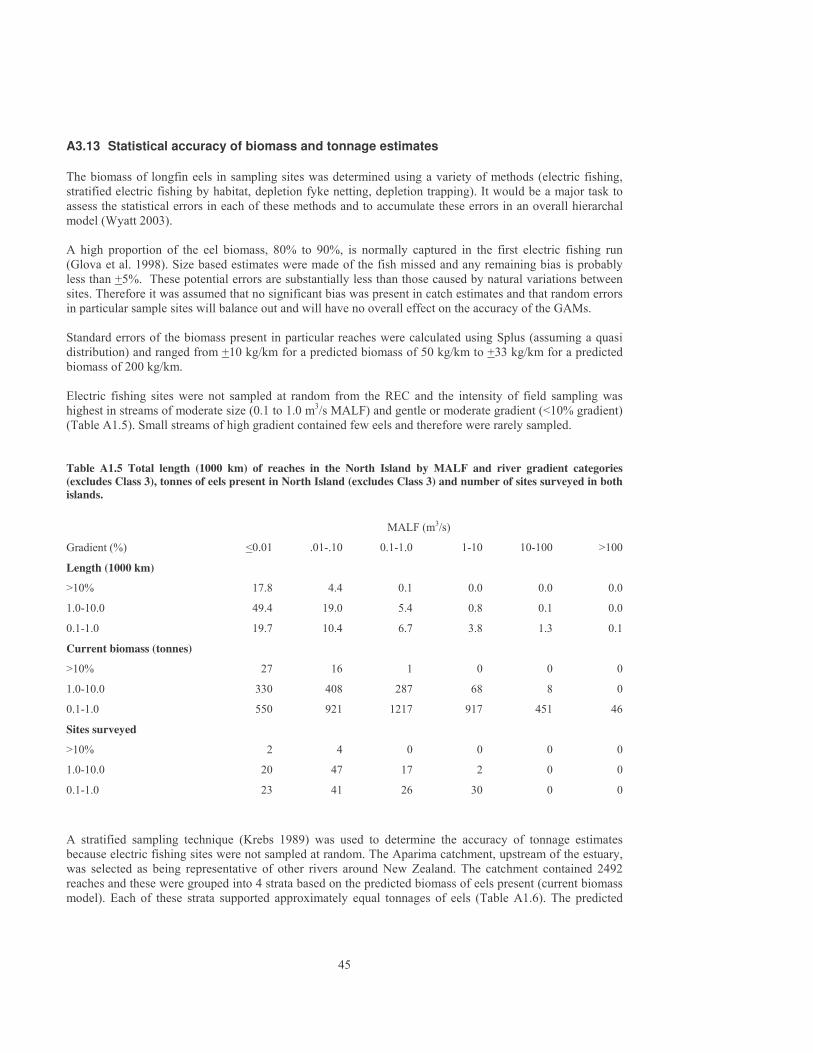
45
A3.13 Statistical accuracy of biomass and tonnage estimates The biomass of longfin eels in sampling sites was determined using a variety of methods (electric fishing, stratified electric fishing by habitat, depletion fyke netting, depletion trapping). It would be a major task to assess the statistical errors in each of these methods and to accumulate these errors in an overall hierarchal model (Wyatt 2003). A high proportion of the eel biomass, 80% to 90%, is normally captured in the first electric fishing run (Glova et al. 1998). Size based estimates were made of the fish missed and any remaining bias is probably less than +5%. These potential errors are substantially less than those caused by natural variations between sites. Therefore it was assumed that no significant bias was present in catch estimates and that random errors in particular sample sites will balance out and will have no overall effect on the accuracy of the GAMs. Standard errors of the biomass present in particular reaches were calculated using Splus (assuming a quasi distribution) and ranged from +10 kg/km for a predicted biomass of 50 kg/km to +33 kg/km for a predicted biomass of 200 kg/km. Electric fishing sites were not sampled at random from the REC and the intensity of field sampling was highest in streams of moderate size (0.1 to 1.0 m3/s MALF) and gentle or moderate gradient (<10% gradient) (Table A1.5). Small streams of high gradient contained few eels and therefore were rarely sampled. Table A1.5 Total length (1000 km) of reaches in the North Island by MALF and river gradient categories (excludes Class 3), tonnes of eels present in North Island (excludes Class 3) and number of sites surveyed in both islands.
MALF (m3/s)
Gradient (%) <0.01 .01-.10 0.1-1.0 1-10 10-100 >100
Length (1000 km)
>10% 17.8 4.4 0.1 0.0 0.0 0.0
1.0-10.0 49.4 19.0 5.4 0.8 0.1 0.0
0.1-1.0 19.7 10.4 6.7 3.8 1.3 0.1
Current biomass (tonnes)
>10% 27 16 1 0 0 0
1.0-10.0 330 408 287 68 8 0
0.1-1.0 550 921 1217 917 451 46
Sites surveyed
>10% 2 4 0 0 0 0
1.0-10.0 20 47 17 2 0 0
0.1-1.0 23 41 26 30 0 0
A stratified sampling technique (Krebs 1989) was used to determine the accuracy of tonnage estimates because electric fishing sites were not sampled at random. The Aparima catchment, upstream of the estuary, was selected as being representative of other rivers around New Zealand. The catchment contained 2492 reaches and these were grouped into 4 strata based on the predicted biomass of eels present (current biomass model). Each of these strata supported approximately equal tonnages of eels (Table A1.6). The predicted

46
biomass of strata 1 ranged from 1.8 to 34 kg/km, while strata 4 ranged from 227 to 288 kg/km. Sites surveyed throughout New Zealand were also classified using the same criteria to determine the actual variance in measured biomass estimates for each strata. Confidence limits for the mean biomass in each strata ranged from +26 to +38% while the total tonnage of eels was estimated to within +18% using this stratified sampling technique. Therefore tonnage estimates for rivers similar in character to the Aparima should have potential errors of about + 18%. The margin of error for national and regional tonnage estimates will be greater because of the difficulty of estimating eel stocks in large rivers and lakes. For example, harvest estimates in the mainstem of three large South Island rivers bear little relationship to estimated stocks (Table A1.7). This confirms that stock estimates listed for particular rivers and lakes in Appendix 2 should be regarded as preliminary and treated with caution until more research is done. Although tonnage estimates could be incorrect, especially in large rivers and lakes, they are still useful indices of the potential habitat available. They are more accurate than simple measurements of the physical length or width of river channels. They also enable the accumulation of habitat estimates from different environments, such as lakes and rivers. They can also be used to determine harvest rates and the likely effects of fishing on the stocks. Table A1.6: Stratification of reaches in the Aparima River catchment into 4 classes based on predicted biomass estimates and calculation of 95% confidence limits of the mean biomass in each strata derived from field surveys. Strata 1 2 3 4 Aparima (population) Estimated mean (kg/km) 19 59 149 256 Reaches (N) 1875 366 169 82 Reaches (km) 1579 346 131 77 Tonnes total 18.8 18.5 17.9 20.1 Samples (NZ wide) Reaches sampled 74 85 37 16 Min. (kg/km) 0 0 1 2 Max. (kg/km) 81 484 413 608 Mean (kg/km) 13 70 122 282 SEM (kg/km) 3 9 17 42 Sdev. (kg/km) 22 84 105 167 C.V. 1.62 1.21 0.86 0.59 95% Min (kg/km) 8 52 87 193 95% Max (kg/km) 19 88 157 371 95%CL (%) 38 26 29 31
Table A1.7: Predicted total biomass (tonnes) and harvest estimates (tonnes per year) (Beentjes & Chisnall 1997) in the mainstem of three large South Island rivers River Original Current DOC model Harvest Mataura 83 32 58 34.0 Buller 192 51 78 5.6 Waitaki 141 27 32 12.8

47
Appendix 2: Detailed tables of eel tonnages in rivers, lakes, and eel statistical areas Table A2.1: Tonnage of longfin eels in selected North Island rivers (excludes lakes in these catchments). See text
for details of classes and Table A2.3 for Eel Statistical Area (ESA) code names. (A2.1a) Original biomass model ESA code Catchment River Class 1 Class2 Class 5 Sub total Class 4 Total
% not fished Class 3
AC 91 Piako 0 11 45 56 82 138 41 6 AC 92 Waihou 0 0 62 62 246 309 20 5 AE 146 Kaituna 0 1 25 25 73 98 26 104 AE 155 Whakatane 0 28 21 49 95 144 34 0 AG 165 Motu 116 0 0 116 0 116 100 25 AF 183 Waiapu 0 0 14 14 111 125 11 0 AF 189 Hikuwai 0 0 4 4 24 29 15 0 AF 197 Waipaoa 0 0 16 16 105 121 13 0 AG 214 Wairoa 0 15 21 36 213 249 14 54 AG 218 Mohaka 214 0 0 214 0 214 100 11 AG 230 Tutaekuri 0 0 9 9 46 55 17 0 AG 231 Ngaruroro 0 0 37 37 146 184 20 5 AG 232 Tuki Tuki 0 1 42 43 143 186 23 0 AG 243 Porangahau 0 0 5 5 21 26 20 0 AL 259 Whareama 0 0 6 6 27 32 17 0 AL 292 Ruamahanga 0 1 80 81 268 349 23 2 AK 325 Manawatu 0 3 115 118 420 538 22 6 AH 327 Rangitikei 0 3 40 43 255 298 14 21 AH 330 Turakina 0 0 10 10 56 66 16 0 AH 331 Whangaehu 0 2 13 15 64 79 19 147 AH 333 Whanganui 0 570 72 642 345 986 65 21 AJ 339 Waitotara 0 3 10 12 65 77 16 0 AJ 395 Waitara 0 2 35 38 149 186 20 0 AD 403 Tongaporutu 0 0 5 5 24 28 17 0 AD 407 Mokau 0 7 13 20 95 115 17 115 AD 408 Awakino 0 1 6 7 44 51 14 0 AD 420 Raglan area 0 0 33 34 53 86 39 0 AD 434 Waikato 0 21 207 228 800 1027 22 1618 AA 466 Wairua 0 3 113 116 303 419 28 3 (A2.1b) Current biomass model ESA code Catchment River Class 1 Class2 Class 5 Sub Total Class 4 Total
% not fished Class 3
AC 91 Piako 0 8 38 46 54 100 46 5 AC 92 Waihou 0 0 54 54 119 173 31 4 AE 146 Kaituna 0 0 21 21 35 57 38 72 AE 155 Whakatane 0 21 18 39 53 92 42 0 AG 165 Motu 63 0 0 63 0 63 100 17 AF 183 Waiapu 0 0 14 14 66 80 17 0 AF 189 Hikuwai 0 0 4 4 17 21 19 0 AF 197 Waipaoa 0 0 15 16 68 84 19 0 AG 214 Wairoa 0 11 21 32 109 141 23 38 AG 218 Mohaka 114 0 0 114 0 114 100 8 AG 230 Tutaekuri 0 0 9 9 30 39 23 0

48
ESA code Catchment River Class 1 Class2 Class 5 Sub Total Class 4 Total
% not fished Class 3
AG 231 Ngaruroro 0 0 34 34 78 112 31 4 AG 232 Tuki Tuki 0 1 40 40 84 125 32 0 AG 243 Porangahau 0 0 5 5 15 21 25 0 AL 259 Whareama 0 0 5 5 18 24 23 0 AL 292 Ruamahanga 0 1 69 70 144 213 33 1 AK 325 Manawatu 0 2 107 109 233 342 32 4 AH 327 Rangitikei 0 2 38 40 123 163 25 16 AH 330 Turakina 0 0 10 10 36 46 22 0 AH 331 Whangaehu 0 2 12 14 36 51 28 80 AH 333 Whanganui 0 229 64 293 185 478 61 17 AJ 339 Waitotara 0 2 10 12 42 54 22 0 AJ 395 Waitara 0 2 33 35 86 121 29 0 AD 403 Tongaporutu 0 0 4 4 16 20 21 0 AD 407 Mokau 0 3 12 15 42 57 26 78 AD 408 Awakino 0 1 5 6 26 32 19 0 AD 420 Raglan area 0 0 30 30 36 65 46 0 AD 434 Waikato 0 14 180 194 330 524 37 1010 AA 466 Wairua 0 2 97 100 177 276 36 3 Table A2.2: Tonnage of longfin eels in selected South Island rivers (excludes lakes in these catchments). See text for details of classes and Table A2.3 for Eel Statistical Area (ESA) code names. (A2.2a) Original biomass model ESA code Catchment River Class 1 Class2 Class 5 Sub total Class 4 Total
% not fished Class 3
AN 570 Motueka 0 8 10 18 86 104 17 0AP 601 Wairau 0 1 33 33 175 208 16 34AQ 621 Clarence 0 2 25 27 202 229 12 0AR 646 Waiau 0 5 44 50 222 272 18 0AR 651 Hurunui 0 0 48 48 170 218 22 0AR 664 Waimakariri 0 42 37 80 199 279 29 1AR 685 Rakaia 0 11 35 46 250 296 16 16AT 688 Ashburton 0 2 18 20 76 97 21 0AT 696 Opihi 0 1 18 19 52 71 26 10AU 711 Waitaki 0 0 18 18 152 170 11 1062AV 743 Taieri 0 2 79 81 199 280 29 30AV 752 Clutha 0 1 76 77 490 567 14 1489AW 775 Mataura 0 1 84 85 284 370 23 0AW 786 Oreti 0 1 90 91 189 280 33 0AW 789 Aparima 0 0 39 40 77 117 34 0AW 797 Waiau 0 13 39 52 345 397 13 1000AW 816 Fiordland area 229 0 0 229 0 229 100 9AX 851 Hollyford 0 96 1 97 10 106 91 7AX 863 Arawata 0 24 8 31 101 133 24 0AX 868 Haast 0 24 8 32 149 181 17 0AX 906 Hokitika 0 14 18 32 140 172 18 3AX 911 Taramakau 0 8 9 17 109 126 14 0AX 914 Grey 0 24 42 65 276 341 19 72AX 932 Buller 0 101 30 132 403 534 25 0

49
(A2.2b) Current biomass model ESA code Catchment River Class 1 Class2 Class 5 Sub total Class 4 Total
% not fished Class 3
AN 570 Motueka 0 7 10 16 48 64 26 0AP 601 Wairau 0 0 30 30 86 117 26 23AQ 621 Clarence 0 1 24 25 94 120 21 0AR 646 Waiau 0 4 40 44 96 140 31 0AR 651 Hurunui 0 0 41 41 80 122 34 0AR 664 Waimakariri 0 28 34 62 77 138 45 1AR 685 Rakaia 0 4 30 35 94 128 27 12AT 688 Ashburton 0 1 18 19 44 63 31 0AT 696 Opihi 0 0 18 18 36 54 33 9AU 711 Waitaki 0 0 17 17 41 58 29 604AV 743 Taieri 0 1 73 74 117 192 39 23AV 752 Clutha 0 1 71 72 156 228 31 716AW 775 Mataura 0 1 78 79 164 243 32 0AW 786 Oreti 0 1 80 81 115 195 41 0AW 789 Aparima 0 0 36 36 46 83 44 0AW 797 Waiau 0 9 37 46 96 142 32 514AW 816 Fiordland area 141 0 0 141 0 141 100 6AX 851 Hollyford 0 41 1 42 4 46 91 4AX 863 Arawata 0 13 6 19 38 57 33 0AX 868 Haast 0 14 6 20 47 67 30 0AX 906 Hokitika 0 9 15 24 57 81 30 2AX 911 Taramakau 0 6 8 14 42 55 25 0AX 914 Grey 0 20 39 58 140 198 29 48AX 932 Buller 0 63 29 92 174 266 34 0 TableA2.3: Tonnage of longfin eels in rivers by Eel Statistical Areas (A2.3a) Original biomass model
Code ESA Name Class 1 Class 2 Class 5 Sub Total Class 4 Total % not fished Class 3
AA Northland 6 10 303 319 596 915 35 6
AB Auckland 0 1 88 89 94 184 49 3
AC Hauraki 1 12 162 175 428 603 29 13
AD Waikato 0 32 283 315 1084 1399 23 1747
AE Bay of Plenty 1 32 135 168 379 547 31 472
AF Poverty Bay 116 5 77 198 459 657 30 25
AG Hawke Bay 213 17 133 363 645 1009 36 70
AH Rangitikei-Wanganui 0 576 146 722 749 1471 49 194
AJ Taranaki 0 13 147 160 473 634 25 138
AK Manawatu 1 3 159 162 517 680 24 7
AL Wairarapa 0 1 111 112 404 517 22 5
AM Wellington 2 0 14 16 54 70 23 6
AN Nelson 1 94 28 124 188 312 40 8
AP Marlborough 1 1 43 45 237 282 16 34
AQ South Marlborough 0 3 55 58 282 340 17 0
AR North Canterbury 0 59 236 296 944 1240 24 25

50
Code ESA Name Class 1 Class 2 Class 5 Sub Total Class 4 Total % not fished Class 3
AS Lake Ellesmere 0 136 0 136 0 136 100 0
AT South Canterbury 0 3 114 117 268 385 30 125
AU Waitaki 0 0 19 19 162 182 11 1062
AV Otago 0 6 208 214 889 1103 19 1522
AW Southland 249 187 318 753 1023 1776 42 1008
AX Westland 61 593 242 896 2070 2966 30 100
AY Stewart Island 50 8 1 59 4 64 93 0
North Island 340 702 1759 2800 5884 8684 32 2686
South Island 363 1091 1265 2719 6067 8786 31
Both Islands 702 1793 3024 5520 11951 17470 32
Percentage of total 4 10 17 32 68 100 (A2.3b) Current biomass model
Code ESA Name Class 1 Class 2 Class 5 Sub total Class 4 Total % not fished Class 3
AA Northland 5 7 269 281 373 655 43 5
AB Auckland 0 1 81 81 66 147 55 2
AC Hauraki 0 8 141 150 237 387 39 11
AD Waikato 0 20 248 269 480 749 36 1098
AE Bay of Plenty 1 24 117 141 203 344 41 318
AF Poverty Bay 63 4 75 141 290 431 33 17
AG Hawkes Bay 113 12 127 253 369 622 41 51
AH Rangitikei-Wanganui 0 234 135 369 394 763 48 115
AJ Taranaki 0 11 142 153 305 458 33 90
AK Manawatu 0 2 145 148 291 438 34 5
AL Wairarapa 0 1 99 101 235 335 30 4
AM Wellington 1 0 14 15 35 50 30 5
AN Nelson 1 61 28 91 114 205 44 6
AP Marlborough 1 1 40 42 124 166 25 23
AQ South Marlborough 0 2 53 56 147 203 28 0
AR North Canterbury 0 37 210 247 412 659 38 19
AS Lake Ellesmere 0 103 0 103 0 103 100 0
AT South Canterbury 0 2 107 109 158 266 41 67
AU Waitaki 0 0 18 18 43 62 29 604
AV Otago 0 5 192 197 377 574 34 742
AW Southland 157 105 288 550 494 1044 53 519
AX Westland 35 338 211 583 910 1493 39 67
AY Stewart Island 39 7 1 47 3 50 94 0
North Island 185 324 1593 2102 3279 5380 39 1722
South Island 234 661 1149 2043 2782 4825 42
Both Islands 418 985 2742 4145 6060 10206 41
Percentage of total 4 10 27 41 59 100
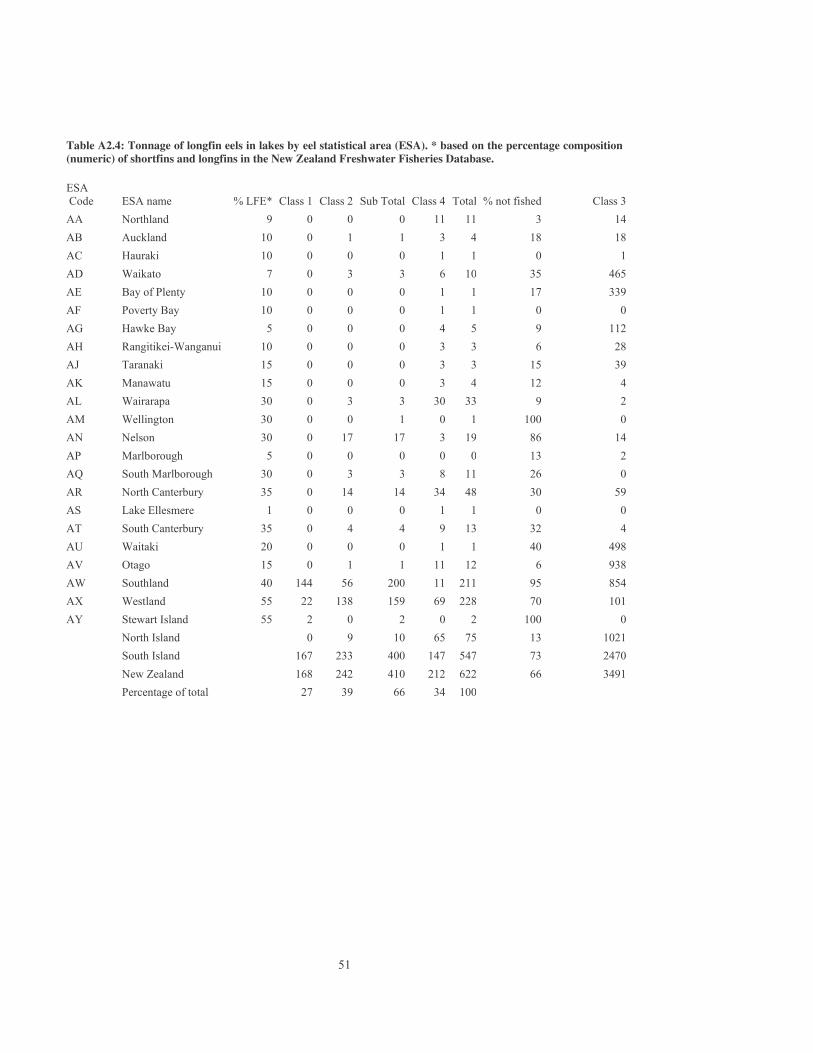
51
Table A2.4: Tonnage of longfin eels in lakes by eel statistical area (ESA). * based on the percentage composition (numeric) of shortfins and longfins in the New Zealand Freshwater Fisheries Database. ESA Code ESA name % LFE* Class 1 Class 2 Sub Total Class 4 Total % not fished Class 3
AA Northland 9 0 0 0 11 11 3 14
AB Auckland 10 0 1 1 3 4 18 18
AC Hauraki 10 0 0 0 1 1 0 1
AD Waikato 7 0 3 3 6 10 35 465
AE Bay of Plenty 10 0 0 0 1 1 17 339
AF Poverty Bay 10 0 0 0 1 1 0 0
AG Hawke Bay 5 0 0 0 4 5 9 112
AH Rangitikei-Wanganui 10 0 0 0 3 3 6 28
AJ Taranaki 15 0 0 0 3 3 15 39
AK Manawatu 15 0 0 0 3 4 12 4
AL Wairarapa 30 0 3 3 30 33 9 2
AM Wellington 30 0 0 1 0 1 100 0
AN Nelson 30 0 17 17 3 19 86 14
AP Marlborough 5 0 0 0 0 0 13 2
AQ South Marlborough 30 0 3 3 8 11 26 0
AR North Canterbury 35 0 14 14 34 48 30 59
AS Lake Ellesmere 1 0 0 0 1 1 0 0
AT South Canterbury 35 0 4 4 9 13 32 4
AU Waitaki 20 0 0 0 1 1 40 498
AV Otago 15 0 1 1 11 12 6 938
AW Southland 40 144 56 200 11 211 95 854
AX Westland 55 22 138 159 69 228 70 101
AY Stewart Island 55 2 0 2 0 2 100 0
North Island 0 9 10 65 75 13 1021
South Island 167 233 400 147 547 73 2470
New Zealand 168 242 410 212 622 66 3491
Percentage of total 27 39 66 34 100

52
APPENDIX 3: FIELD DATA River Environment Classification (REC) data and estimates of longfin (LF) and shortfin (SF) biomass (kg per km) in the sites surveyed. Gradient (%); Alt, Altitude (m); Dist. Inl., Distance inland (km); MAF, mean annual flow; MALF, mean annual low flow; Width (m) during field survey.
Catchment Year Reach Gradient Alt. Dist. Inl. MAF MALF Width
Current LF
Original LF
Current SF
Aparima 2001 15030216 1.07 382 129 0.45 73 5.0 4 4 0 Aparima 2001 15031280 1.02 370 128 0.50 91 5.5 33 33 0 Aparima 2001 15033266 0.44 314 120 1.22 199 6.0 58 89 11 Aparima 2001 15033445 0.20 296 115 3.31 506 15.0 139 227 0 Aparima 2001 15033843 0.18 277 109 1.32 115 4.0 17 17 73 Aparima 2001 15033995 1.05 293 113 0.11 9 1.5 49 49 0 Aparima 2001 15034132 0.30 278 111 4.25 620 10.0 28 47 0 Aparima 2001 15034889 0.85 312 104 7.25 1361 26.3 74 74 0 Aparima 2001 15035442 1.44 387 112 1.04 194 6.0 93 106 0 Aparima 2001 15035470 1.55 389 112 0.71 126 5.5 145 145 0 Aparima 2001 15035481 1.14 384 112 5.40 1079 22.0 154 154 0 Aparima 2001 15036396 0.67 246 95 7.55 1386 30.9 61 127 0 Aparima 2001 15036486 0.39 245 96 7.16 882 14.0 213 361 0 Aparima 2001 15036959 0.36 240 95 0.36 34 1.3 159 159 0 Aparima 2001 15037566 0.41 239 94 0.48 46 2.5 156 156 0 Aparima 2001 15039521 0.44 201 84 17.00 2500 37.1 142 354 0 Aparima 2001 15039604 1.69 208 84 0.55 64 5.0 56 56 0 Aparima 2001 15041989 0.43 176 77 19.97 2868 42.3 138 345 0 Aparima 2001 15042033 0.43 177 77 0.44 52 3.5 135 135 0 Aparima 2001 15042303 1.03 179 77 0.22 24 2.5 50 50 0 Aparima 2001 15043939 1.14 180 74 0.26 31 3.0 72 72 0 Aparima 2001 15044455 0.53 142 70 0.65 68 5.0 26 26 9 Aparima 2001 15044926 0.75 158 69 0.45 41 4.5 24 61 0 Aparima 2001 15045112 0.38 132 69 21.59 3047 43.6 191 477 0 Aparima 2001 15046456 0.62 126 62 0.18 27 2.0 34 48 0 Aparima 2001 15047179 0.34 108 62 22.49 3133 39.7 52 108 0 Aparima 2001 15048868 0.29 83 57 22.69 3142 42.0 202 506 0 Aparima 2001 15048930 0.66 81 54 0.20 10 3.0 0 0 0 Aparima 2001 15048988 0.41 73 53 0.73 64 5.1 9 9 0 Aparima 2001 15049093 0.53 71 54 0.22 40 2.5 63 63 0 Aparima 2001 15049791 0.37 77 54 0.72 55 4.1 69 81 0 Aparima 2001 15050172 0.45 64 53 0.14 23 1.5 171 225 0 Aparima 2001 15050479 0.29 67 50 22.77 3146 42.2 187 187 0 Aparima 2001 15051299 0.15 58 47 0.98 69 6.0 31 56 12 Aparima 2001 15051591 0.26 60 45 22.87 3151 42.3 247 619 0 Aparima 2001 15052483 0.15 58 42 3.47 408 14.3 592 592 210 Aparima 2001 15053778 0.22 37 34 26.67 3601 35.5 235 454 17 Aparima 2001 15053997 0.35 37 34 0.07 11 2.0 38 80 0 Aparima 2001 15055036 0.20 38 29 26.89 3629 33.6 375 678 22 Aparima 2001 15056506 0.15 17 22 27.08 3638 35.7 214 535 20 Aparima 2001 15056577 0.35 37 23 0.04 2 1.0 45 45 45 Aparima 2001 15057110 0.28 23 20 0.07 3 2.0 85 85 0 Aparima 2001 15057386 0.13 16 18 27.26 3647 36.7 438 600 100

53
Catchment Year Reach Gradient Alt. Dist. Inl. MAF MALF Width
Current LF
Original LF
Current SF
Aparima 2001 15057472 0.35 19 10 0.08 15 1.0 11 11 0 Aparima 2001 15057861 0.09 10 13 27.33 3650 33.4 211 529 0 Aparima 2001 15058143 0.36 16 7 0.01 2 2.5 9 9 0 Aparima 2002 15031892 1.13 339 125 0.07 7 1.0 0 0 0 Aparima 2002 15032059 0.53 294 114 0.03 2 0.0 0 0 0 Aparima 2002 15033121 1.98 353 125 0.34 64 2.5 5 5 0 Aparima 2002 15033297 0.48 291 113 0.06 6 1.5 0 0 0 Aparima 2002 15033443 0.72 309 118 0.55 80 4.0 0 0 16 Aparima 2002 15034258 1.65 382 125 0.09 14 0.5 7 7 0 Aparima 2002 15034448 1.77 310 110 0.09 10 0.7 29 29 0 Aparima 2002 15035014 2.99 348 106 0.14 18 1.0 14 14 0 Aparima 2002 15035167 2.60 348 107 0.10 13 1.0 0 0 0 Aparima 2002 15035315 2.64 378 110 0.35 48 4.5 1 1 0 Aparima 2002 15035470 1.51 389 112 0.71 126 6.0 18 18 0 Aparima 2002 15035946 0.24 253 98 6.68 841 17.5 608 699 1 Aparima 2002 15036299 1.44 272 103 0.06 6 1.0 59 59 0 Aparima 2002 15036574 1.25 248 94 0.13 14 0.0 0 0 0 Aparima 2002 15037638 0.41 221 90 16.38 2429 33.1 125 172 0 Aparima 2002 15038761 2.00 227 87 0.12 15 0.5 26 26 0 Aparima 2002 15040550 1.03 197 82 0.22 29 2.0 0 0 0 Aparima 2002 15041467 1.16 186 79 0.07 7 0.5 10 10 0 Aparima 2002 15043542 3.53 205 74 0.12 13 2.0 0 0 0 Aparima 2002 15043787 0.40 151 72 21.22 3008 44.3 201 469 0 Aparima 2002 15043801 1.50 202 73 0.14 15 1.8 8 8 0 Aparima 2002 15044902 0.51 145 71 0.29 31 1.5 97 224 16 Aparima 2002 15046226 0.40 123 65 0.18 13 1.5 43 83 51 Aparima 2002 15046778 0.76 127 65 0.02 1 0.5 0 0 0 Aparima 2002 15047674 0.79 107 58 0.05 3 1.0 78 78 0 Aparima 2002 15048503 1.02 85 56 0.02 1 0.0 5 5 0 Aparima 2002 15048868 0.29 83 57 22.69 3142 41.7 202 505 0 Aparima 2002 15049500 0.79 71 54 0.06 11 1.0 10 10 0 Aparima 2002 15049855 0.27 72 54 0.08 4 4.0 8 11 24 Aparima 2002 15050479 0.28 67 50 22.77 3146 42.2 266 588 0 Aparima 2002 15050479 0.28 67 50 22.77 3146 42.2 413 700 0 Aparima 2002 15051428 0.23 63 49 0.01 1 2.5 0 0 0 Aparima 2002 15051812 2.56 95 51 0.08 13 1.5 0 0 0 Aparima 2002 15053149 0.42 56 39 0.07 12 2.0 118 118 0 Aparima 2002 15053168 0.23 49 38 26.53 3581 36.8 340 700 0 Aparima 2002 15053949 0.42 42 36 0.02 3 0.0 0 0 0 Aparima 2002 15054446 0.37 42 33 0.08 12 2.5 219 219 11 Aparima 2002 15054492 0.20 37 31 26.79 3615 33.5 355 697 3 Aparima 2002 15055017 0.35 39 30 0.00 0 0.4 0 0 0 Aparima 2002 15055727 0.75 35 25 0.03 1 0.5 51 51 0 Aparima 2002 15056297 0.52 29 23 0.01 1 0.5 0 0 0 Aparima 2002 15056880 0.52 37 13 0.01 1 0.5 70 70 0 Aparima 2002 15057974 0.09 17 8 0.00 1 1.5 0 0 0 Buller/Grey 2002 12010914 11.31 130 68 0.26 38 1.6 29 29 0 Buller/Grey 2002 12011226 3.32 96 67 2.78 501 8.0 0 0 0 Buller/Grey 2002 12012488 9.14 20 16 0.51 98 6.2 0 0 0

54
Catchment Year Reach Gradient Alt. Dist. Inl. MAF MALF Width
Current LF
Original LF
Current SF
Buller/Grey 2002 12013784 1.04 79 54 2.84 324 17.3 14 14 0 Buller/Grey 2002 12016383 4.61 221 117 0.36 26 3.8 3 3 0 Buller/Grey 2002 12016724 3.41 218 78 0.40 41 5.0 1 1 0 Buller/Grey 2002 12018226 2.14 398 145 0.39 26 2.2 0 0 0 Buller/Grey 2002 12018285 4.30 217 83 0.25 24 3.9 62 62 0 Buller/Grey 2002 12019728 1.10 375 146 1.41 109 4.6 4 4 0 Buller/Grey 2002 12019953 1.12 212 84 0.36 31 3.8 45 45 0 Buller/Grey 2002 12021229 1.69 220 75 2.86 542 5.8 8 8 0 Buller/Grey 2002 12021670 1.56 199 81 1.26 65 7.5 1 1 0 Buller/Grey 2002 12021855 2.80 260 104 0.11 9 5.0 1 1 0 Buller/Grey 2002 12022151 2.11 419 156 1.14 111 4.6 0 0 0 Buller/Grey 2002 12023813 1.42 139 49 1.90 353 8.2 69 69 0 Buller/Grey 2002 12023877 1.81 243 72 0.69 45 6.6 7 7 0 Buller/Grey 2002 12024006 13.21 432 120 0.46 58 5.0 0 0 0 Buller/Grey 2002 12024157 1.37 145 45 4.40 1083 4.4 2 2 0 Buller/Grey 2002 12024458 1.73 120 43 0.18 19 2.7 32 32 0 Buller/Grey 2002 12024807 6.67 323 79 0.13 9 2.3 12 12 0 Buller/Grey 2002 12024989 5.58 353 85 0.26 32 5.2 0 0 0 Buller/Grey 2002 12025423 3.99 244 34 0.55 137 7.3 2 2 0 Buller/Grey 2002 12025430 2.03 160 63 0.34 37 3.6 8 8 0 Buller/Grey 2002 12026002 2.56 200 72 1.37 81 6.5 81 81 0 Buller/Grey 2002 12026263 2.71 219 53 0.09 9 1.1 5 5 0 Buller/Grey 2002 12026781 1.91 40 26 0.37 47 3.1 6 6 0 Buller/Grey 2002 12026991 2.72 32 25 0.25 29 4.2 14 14 0 Buller/Grey 2002 12028087 4.18 101 28 0.23 25 2.3 1 1 0 Buller/Grey 2002 12028244 0.85 139 77 0.89 77 4.8 34 34 0 Buller/Grey 2002 12028865 2.34 158 80 0.29 39 3.4 1 1 0 Buller/Grey 2002 12029152 0.85 274 58 0.30 26 3.5 4 4 0 Buller/Grey 2002 12029711 3.45 252 105 0.35 33 3.4 5 5 0 Ellesmere 2006 13051475 0.41 10 24 0.45 49 3.0 52 52 37 Ellesmere 2006 13054170 0.30 8 11 0.08 1 2.5 1 1 42 Ellesmere 2006 13054187 0.24 8 11 0.04 10 4.9 269 269 191 Ellesmere 2006 13054763 0.21 14 15 1.28 28 3.5 130 130 2 Ellesmere 2006 13054832 0.20 9 10 0.04 1 1.8 59 59 55 Horokiwi 1952 9009035 0.76 61 4 0.57 59 4.0 120 166 15 Horokiwi 1997 9009035 0.76 61 4 0.57 59 4.0 109 109 26 Oreti 1937 15053951 0.16 40 61 3.43 300 15.0 274 685 0 Pigeon Bay 1997 13051573 1.30 39 1 1.06 185 3.6 235 235 13 Ruamahanga 2005 9004224 0.61 147 118 11.88 2159 9.2 16 39 0 Ruamahanga 2005 9005373 0.44 128 112 16.63 2587 30.0 84 183 28 Ruamahanga 2005 9005530 0.49 131 112 6.07 1121 5.7 398 459 33 Ruamahanga 2005 9005712 14.59 251 102 0.03 6 0.0 0 0 0 Ruamahanga 2005 9005732 12.75 274 105 0.04 10 0.0 0 0 0 Ruamahanga 2005 9005776 3.00 200 104 0.04 11 1.4 22 22 23 Ruamahanga 2005 9005786 0.98 232 100 2.22 397 9.3 115 148 3 Ruamahanga 2005 9005815 0.30 217 106 1.57 265 9.6 139 139 2 Ruamahanga 2005 9005995 1.81 256 108 0.39 66 2.9 44 44 0 Ruamahanga 2005 9006023 2.24 243 107 0.71 119 7.5 128 128 0 Ruamahanga 2005 9006030 16.45 263 107 0.02 3 0.0 0 0 0

55
Catchment Year Reach Gradient Alt. Dist. Inl. MAF MALF Width
Current LF
Original LF
Current SF
Ruamahanga 2005 9006093 2.14 246 109 0.27 45 2.6 44 44 0 Ruamahanga 2005 9006300 0.68 148 96 2.62 477 7.2 292 518 5 Ruamahanga 2005 9006741 0.54 112 104 15.66 2811 11.8 67 127 1 Ruamahanga 2005 9007073 0.69 111 90 0.58 106 3.9 175 259 7 Ruamahanga 2005 9007292 0.90 93 89 0.69 129 5.0 89 89 6 Ruamahanga 2005 9007497 0.56 82 87 2.94 548 8.1 99 148 6 Ruamahanga 2005 9010108 1.78 61 79 0.02 0 0.0 0 0 0 Ruamahanga 2005 9010991 2.42 27 36 0.54 100 0.0 0 0 0 Ruamahanga 2005 9011177 1.60 100 68 0.01 0 0.0 0 0 0 Ruamahanga 2005 9011761 0.88 22 31 0.06 13 0.0 0 0 0 Ruamahanga 2005 9012139 2.18 60 30 0.07 14 0.0 0 0 0 Ruamahanga 2005 9012547 1.20 18 27 0.31 56 3.5 120 120 1 Ruamahanga 2005 9012622 0.14 33 58 6.02 540 7.0 2 4 20 Ruamahanga 2005 9013194 1.17 28 23 0.51 91 4.8 39 39 2 Ruamahanga 2005 9013216 0.79 22 40 0.02 0 0.0 0 0 0 Ruamahanga 2005 9013288 0.44 17 39 0.10 1 0.0 0 0 0 Ruamahanga 2005 9013348 0.53 46 62 4.12 461 6.1 18 25 41 Ruamahanga 2005 9013437 0.81 22 39 0.42 36 0.0 0 0 0 Ruamahanga 2005 9013503 1.02 26 40 0.02 0 0.0 0 0 0 Ruamahanga 2005 9013724 1.95 10 23 1.68 322 0.0 0 0 0 Ruamahanga 2005 9014131 1.00 12 31 0.00 0 0.0 0 0 0 Ruamahanga 2005 9014203 1.10 22 29 0.01 1 0.0 0 0 0 Ruamahanga 2005 9014256 1.90 16 28 0.00 0 0.0 0 0 0 Ruamahanga 2005 9014432 0.94 21 25 0.29 15 0.0 0 0 0 Ruamahanga 2005 9014500 1.00 58 28 0.05 3 0.0 0 0 0 Ruamahanga 2005 9014586 0.53 73 70 3.93 445 8.0 1 3 63 Ruamahanga 2005 9014738 1.22 21 21 0.48 77 4.3 33 33 1 Ruamahanga 2005 9015067 0.60 12 16 0.96 83 0.0 0 0 0 Ruamahanga 2005 9015690 0.87 24 17 0.94 79 3.1 69 71 1 Ruamahanga 2005 9015730 1.20 19 8 0.43 65 4.2 25 30 4 Ruamahanga 2005 9016182 0.59 27 9 2.29 313 3.9 72 129 0 Te Maari 1997 3021337 1.20 84 2 0.83 175 5.4 204 204 10 Waiau 1947 15019075 0.99 340 141 4.10 912 19.7 8 19 0 Waiau 1947 15023151 0.45 250 121 6.66 1445 19.9 62 154 0 Waiau 1947 15023613 0.12 255 120 0.16 180 7.0 264 659 0 Waiau 1947 15025401 0.37 250 115 0.33 64 11.7 92 231 0 Waiau 1947 15046845 0.22 70 49 4.28 924 20.5 84 211 0 Wanganui 2005 7003395 1.14 268 274 0.08 38 1.0 0 0 1 Wanganui 2005 7003441 0.72 259 271 0.53 246 2.8 88 88 2 Wanganui 2005 7003444 0.72 260 271 0.65 303 3.1 48 48 1 Wanganui 2005 7003602 0.58 217 268 0.16 74 2.2 13 32 1 Wanganui 2005 7003830 1.40 308 246 0.22 28 2.2 0 0 70 Wanganui 2005 7004083 0.31 217 267 3.30 1455 11.9 259 408 3 Wanganui 2005 7004187 0.19 206 261 5.49 2473 12.7 135 224 6 Wanganui 2005 7004488 0.51 203 257 0.09 41 1.3 145 145 7 Wanganui 2005 7004848 1.00 260 269 0.06 28 1.0 68 68 2 Wanganui 2005 7004849 0.84 190 238 1.08 134 6.6 13 33 9 Wanganui 2005 7004971 1.71 276 270 2.10 854 7.1 38 38 0 Wanganui 2005 7004984 1.00 279 274 0.22 96 1.5 4 4 0

56
Catchment Year Reach Gradient Alt. Dist. Inl. MAF MALF Width
Current LF
Original LF
Current SF
Wanganui 2005 7005201 0.12 258 268 0.19 89 2.0 53 53 0 Wanganui 2005 7005211 0.81 240 266 2.52 1050 8.8 62 62 1 Wanganui 2005 7005260 0.46 188 235 0.47 75 4.8 19 19 63 Wanganui 2005 7005278 4.00 336 238 0.03 2 1.0 0 0 11 Wanganui 2005 7005329 1.21 178 235 0.19 18 2.4 35 35 20 Wanganui 2005 7005359 0.43 213 261 3.15 1338 7.5 31 61 1 Wanganui 2005 7005424 4.00 221 237 0.02 3 1.5 40 40 0 Wanganui 2005 7005433 0.42 168 234 0.70 99 3.4 1 1 116 Wanganui 2005 7005476 0.93 218 263 0.40 181 1.4 27 27 9 Wanganui 2005 7005517 0.93 219 263 0.16 72 1.8 44 44 1 Wanganui 2005 7015462 1.50 416 158 0.31 100 3.5 131 131 5 Wanganui 2005 7015602 1.00 390 155 0.08 9 1.5 63 85 0 Wanganui 2005 7015663 1.50 391 155 0.09 12 1.7 18 29 12 Wanganui 2005 7015664 1.53 388 155 1.48 411 13.1 484 484 0 Wanganui 2005 7015749 1.80 418 157 1.11 301 10.4 361 361 1 Wanganui 2005 7027340 0.91 42 31 0.50 60 4.8 138 207 4 Wanganui 2005 7027871 0.62 24 26 0.61 72 3.9 91 223 13 Wanganui 2005 7028384 1.10 43 25 0.09 9 2.2 12 29 39 Wanganui 2005 7028497 0.22 59 26 0.07 8 1.6 27 27 8 Wanganui 2005 7028612 3.00 109 31 0.01 1 0.8 12 25 0 Wanganui 2005 7028639 1.12 83 29 0.05 5 1.6 0 0 17 Wanuiomata 1952 9015862 0.33 40 10 3.77 557 8.2 68 173 3

57
APPENDIX 4: WATERFALLS IDENTIFIED AS SIGNIFICANT BARRIERS TO UPSTREAM MIGRATION OF JUVENILE EELS
Name Easting Northing Nzreach North Island Motutere Falls 2738821 6482589 3001427 Te Ariki Falls 2764315 6379684 3017264 Waitanguru Falls 2673483 6310453 3033497 Paranui Falls 2632162 6610901 1017792 Waitangi Falls 2642579 6515088 2002948 Bells Falls 2599312 6215596 6006406 Te Rerepahupahu Falls 2671717 6255290 7005179 Coche Falls 2722189 6209356 7014044 Waitangi Falls 2884104 6277999 8000998 Waipunga Falls 2815477 6243880 8009085 Tangoio Falls 2844355 6203678 8020196 Tarawera Falls 2818109 6331743 4013695 Motu Falls 2912265 6318080 4018080 South Island Maclennan Falls 2233342 5408193 14073132 McLean Falls 2230017 5397918 14073852 Olivine Falls 2130169 5629716 15001278 Stirling Falls 2102771 5609544 15002865 Hidden Falls 2123197 5608279 15003059 McKenzie Falls 2093300 5607841 15003097 Bowen Falls 2107907 5603468 15003487 Camp Oven Falls 2104932 5601026 15003850 Giant Gate Falls 2102382 5598797 15004012 Sutherland Falls 2093376 5587530 15005546 Christie Falls 2121074 5587105 15005611 Twin Falls 2070382 5560902 15009618 Helena Falls 2054178 5510917 15024453 Ida Mary Waterfall 2043155 5483752 15035198 Winton Falls 2152762 5465064 15042424 Tarleton Falls 2341792 5809994 12036376 Price Falls 2345101 5784626 12039813 Strata Falls 2200336 5684715 12052909 Hindley Falls 2179151 5672545 12055016 Arch Falls 2155247 5661479 12056383 Durwards Falls 2141849 5649642 12057893 Wainui Falls 2504015 6039658 10002494 Jenkins Falls 2507882 6032700 10003689