spatial variation of the intertidal sediments and macrozoo-benthic assemblages along eighty-mile...
TRANSCRIPT

www.elsevier.com/locate/seares
Journal of Sea Research
Spatial variation of the intertidal sediments and macrozoo-benthic
assemblages along Eighty-mile Beach, North-western Australia
Pieter J.C. Honkoop a,*, Grant B. Pearson b, Marc S.S. Lavaleye a, Theunis Piersma a,c
a Department of Marine Ecology and Evolution, Royal Netherlands Institute for Sea Research (NIOZ), PO Box 59,
1790 AB Den Burg (Texel), The Netherlandsb Western Australian Department of Conservation and Land Management (CALM), WA Wildlife Research Centre, PO Box 51,
Wanneroo, WA 6065, Australiac Animal Ecology Group, Centre for Ecological and Evolutionary Studies, University of Groningen, PO Box 14, 9750 AA Haren, The Netherlands
Received 3 August 2005; accepted 15 November 2005
Available online 15 February 2006
Abstract
The extensive intertidal flats along Eighty-mile Beach in North-western Australia appear to be monotonous and homogeneous
and seem ideally suited to study tidal zonation in macrozoo-benthic communities and their possible correlates with characteristics
of the sediment. In October 1999, we sampled benthic invertebrates and sediments at a total of 895 sampling stations distributed
over six different locations, each location separated by 15 km of unsampled foreshore along Eighty-mile Beach. To test for the
presence or absence of patterns of tidal zonation (distinct height-related zones of specific sediment grain sizes or zoobenthic
taxonomic groups) or patchiness (distinct patches of specific sediment grain sizes or zoobenthic taxonomic groups not related to
tidal height) each location was divided into three along-shore sections and each section (transect) was examined at two or three
tidal heights. Zonation was observed for sediment grain sizes. Sediments were coarser at the highest intertidal level and finer
towards the low water line. Benthic assemblages also differed among tidal heights, but in terms of species-composition the
differences were not consistent among the locations. Each location supported a unique collection of benthic invertebrates.
Therefore the hypothesis of the presence of distinct zones of specific species or zoobenthic taxonomic groups was rejected; the
presence of benthic patches was confirmed. The distribution of sediments and the composition of benthic assemblages were
surprisingly poorly correlated compared to those reported in 12 previous quantitative studies around the world. One possible
explanation might be that super-cyclone Vance, which hit the study-area only six months before this study, contributed to this poor
correlation. Alternatively, the poor correlation may indicate that biotic interactions are more important than the assumed abiotic
structuring.
D 2006 Elsevier B.V. All rights reserved.
Keywords: Beach morphology; Zoobenthos; Sediment; Grain size; Spatial patterns; Zonation
1. Introduction
Animals and plants on intertidal rocky shores often
occur in patches or show vertical zonation, i.e. (pre-
1385-1101/$ - see front matter D 2006 Elsevier B.V. All rights reserved.
doi:10.1016/j.seares.2005.11.001
* Corresponding author.
E-mail address: [email protected] (P.J.C. Honkoop).
sumably) tidal-height related bands consisting of a
specific assemblage of species (Underwood, 1981,
1984; Peterson, 1991). Except for larger plants (man-
groves, seagrasses), zonation is less obvious in intertid-
al soft sediments. Most intertidal animals live buried in
the sediment and, therefore (see references in Peterson,
1991) patterns are harder to recognise. If present, those
55 (2006) 278–291

P.J.C. Honkoop et al. / Journal of Sea Research 55 (2006) 278–291 279
patterns are generally most pronounced in areas where
invertebrates are able to modify the physical environ-
ment and, in that way, contribute to spatial differences
in the composition of sediment and of benthic assem-
blages. The effects of the ability of biota to modify the
environment are most pronounced in sheltered beaches
(McLachlan, 1987). Other processes that can contribute
to zonation or patchiness are, for example, recruitment
or larval preferences (Grosberg, 1982), settlement, se-
lective mortality, and habitat-composition (Raimondi,
1988).
Causes of the existence of zonation or patches in
intertidal areas, reviewed by Peterson (1991), can be:
(1) the need of some benthic species of invertebrates to
be submerged for a relatively long period of the tidal
cycle to be able to feed and meet energetic require-
ments, (2) the inability to cope with physical stress of
exposure to air and, therefore, a preference to live at
lower tidal levels, (3) the avoidance of particular kinds
of predation (fish and crabs vs birds; e.g. Zwarts and
Wanink, 1993) (4) the outcome of interspecific interac-
tions among benthic animals themselves. For example,
food competition among filter feeders (Peterson and
Black, 1987, 1991; Kamermans, 1993; Beukema and
Flach, 1995; Thrush et al., 2001) and modification of
sediment by bioturbation (Warren and Underwood,
1986; Warwick et al., 1990; Schratzberger and War-
wick, 1999) can facilitate or prevent settlement or
survival of species (Warwick et al., 1986; Flach,
1996). Finally, there is (5) the dissipation of energy
generated by waves which may affect sediments and,
hence, the fauna (McLachlan, 1987). Closer to the
shore, the waves transfer energy to the seafloor and
affect sorting of sediments. Generally, finer sediments
are deposited at lower tidal levels where wave action is
less severe; coarser particles can only be deposited at
higher tidal levels. Some species or groups of species
appear to have preferences for a certain distribution of
grain sizes (Rhoads and Young, 1970; Levinton, 1972;
Gray, 1974; Peterson, 1991; Snelgrove and Butman,
1994).
Although apparent zonation of benthic assemblages
in sandy beaches has been reported in many studies
reviewed by McLachlan and Jaramillo (1995), testing
hypotheses about the composition of assemblages at,
for example, different tidal heights is difficult; general
processes causing zonation are hard to identify. Due to
a confusing suite of inter-and intraspecific interactions
among species and/or interactions with abiotic environ-
mental factors (Underwood, 2000), the (assumed) pres-
ence of zonation cannot always be confirmed
(Underwood, 1978, 2000; Chaloupka and Hall, 1985).
The aim of this study was to see whether there is any
evidence for across-shore (tidal zonation) and along-
shore gradients in the distribution of sediments and in
the composition of benthic assemblages of the intertidal
(littoral) zone at Eighty-mile Beach (Western Australia)
and if any of the gradients are correlated. This beach,
which starts 200 km south of Broome, West Kimberly,
is about 150 km long, an almost continuous sandy
beach with a wide intertidal area interrupted by only
a few, small, muddy bays bordered by mangrove trees.
Going seaward, the steep upper slope of the beach gives
way to intertidal mud-and sandflats. At very low tides
the maximum width of the flats is 4–5 km. So far, it has
been relatively little impacted by human activities. The
physical appearance of the beach seems homogeneous,
making it an ideal location to study subtle gradients in
benthic assemblages and characteristics of the sedi-
ments. We expected to find coarser sediment close to
the reflective upper-shore of the beach and finer sedi-
ments at the lower tidal levels, but we have no specific
predictions about the composition of the zoobenthic
community.
2. Methods
2.1. General description of the study area
Despite a tidal difference of about 6 m and an
intertidal zone up to 5 km wide, Eighty-mile Beach
can be considered a reflective beach (McLachlan, 1987,
1990). At this type of beach, conditions are generally
calm and waves are basically absent. Coarse sand is
deposited high in the intertidal, resulting in a charac-
teristic step (about 0.5 m) on the lower shore where the
incoming waves collide with the backwash and with a
platform of coarse sand above the intertidal slope. The
intertidal area is relatively flat and consists mainly of
fine sediments except at the highest levels just below
the step where sediments consist mainly of medium and
coarse sands. Thus, conditions at Eighty-mile Beach
can be summarised as a tidal-flat system with a reflec-
tive upper shore. We sampled sediments and benthos at
the tidal flats from just below the step of the beachfront
to the low-water line.
2.2. Sampling and treatment of benthos and sediment
Along Eighty-mile Beach, at six locations (A–F)
each ca 15 km apart, blocks of sampling stations were
selected (top graph of Fig. 1). Each location consisted of
10–14 transects, starting at the landward side of the
intertidal area and going towards the low water level
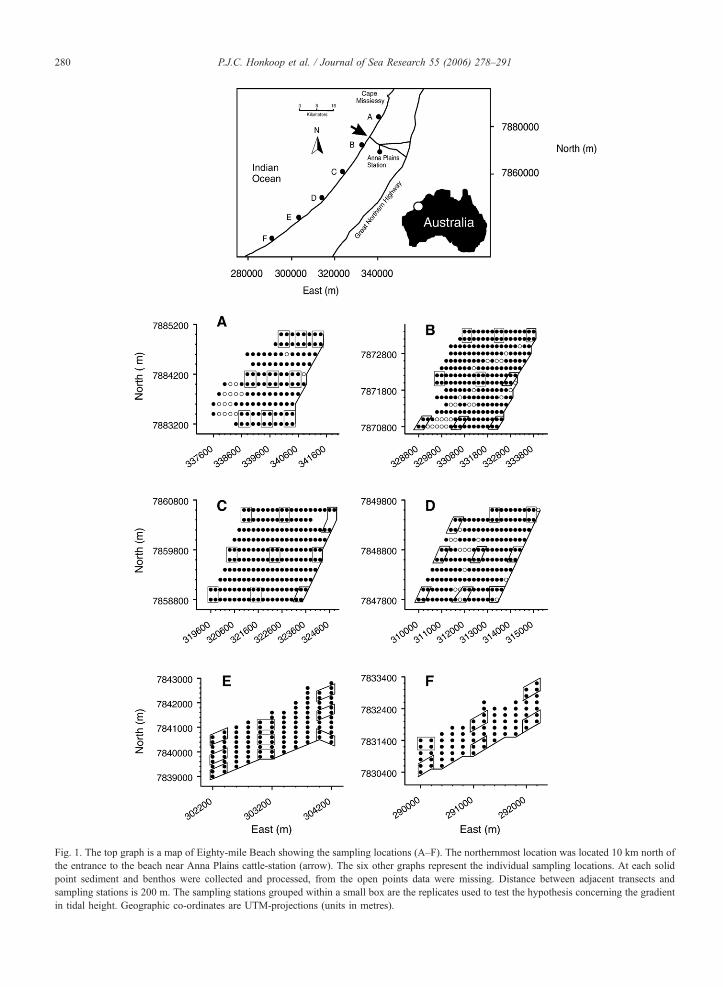
Fig. 1. The top graph is a map of Eighty-mile Beach showing the sampling locations (A–F). The northernmost location was located 10 km north of
the entrance to the beach near Anna Plains cattle-station (arrow). The six other graphs represent the individual sampling locations. At each solid
point sediment and benthos were collected and processed, from the open points data were missing. Distance between adjacent transects and
sampling stations is 200 m. The sampling stations grouped within a small box are the replicates used to test the hypothesis concerning the gradient
in tidal height. Geographic co-ordinates are UTM-projections (units in metres).
P.J.C. Honkoop et al. / Journal of Sea Research 55 (2006) 278–291280
P.J.C. Honkoop et al. / Journal of Sea Research 55 (2006) 278–291 281
(six lower graphs of Fig. 1). We located sampling sta-
tions using GPS. Sampling at the highest stations took
place at the same tidal level, just below the steep upper
shore of the beach. Samples at the lowest stations were
taken along the low-water line at about 6 m below the
highest sampling stations. Transects and sampling sta-
tions along transects were 200 m apart from each other,
thus forming grids with 200 m intersections. No man-
groves occurred near or at the locations.
To quantify the macro-zoobenthos, at each sampling
station three cores with a diameter of 10.2 cm (1/120
m2) were taken to a maximum depth of 30 cm (less if
the corer hit a shell or rock layer as no benthos was
expected below such a hard barrier). The sediment was
sieved on the spot over a sieve with a mesh-size of 1
mm. All material retained on the sieve was transferred
to a plastic bag and brought to the laboratory for sorting
and identification of benthic fauna. Anthozoans, deca-
pods, gastropods, bivalves, scaphopods, ophiuroids,
holothurians and hemichordates were classified to spe-
cies level, polychaetes and crustaceans to family level
and nemerteans, sipunculids and phoronids only to
phylum level (Table 1).
At each sampling station, a core with a diameter of
4.4 cm was taken to a depth of 10 cm to collect
sediment. Such sediment cores were transferred to a
plastic bag, labelled and stored until further treatment.
A total of 895 sediment cores were collected, 858 of
which could later be properly allocated to a sampling
station. The remaining 37 cores had an illegible label or
were lost during processing. From the 858 assignable
sediment cores, 108, 214, 196, 159, 108, and 73 cores
were analysed from locations A, B, C, D, E and F,
respectively.
In the laboratory the sediments were removed from
the bags and transferred to clean buckets. All aggre-
Table 1
Composition of the grouped taxa used in the statistical analyses
Group Taxon Number of finer taxa included
1 Anthozoa 4 species
2 Polychaeta 21 families
3 Other worms 3 phyla (Nemertea,
Sipuncula, Phoronida)
4 Decapoda 9 families
5 Other Crustacea 9 species
6 Gastropoda 8 species
7 Bivalvia 13 species
8 Scaphopoda 1 species
9 Ophiuroidea 1 species
10 Holothuroidea 4 species
11 Hemichordata 1 species
Total 11 74
gates of clay and sand were disaggregated in tap water
by swirling and kneading. After disaggregation, the
larger particles were allowed to sink. After 30–60 s,
the smaller particles were carefully decanted onto pre-
weighed Schleicher and Schuell folded filters (type 595
1/2, diameter 385 mm, retention 4–7 Am). Water was
added to the remaining sediment and the content of the
bucket was stirred thoroughly. The water was decanted
onto the same filter paper and the process repeated until
the water remained clear after stirring. After filtration,
the filters were folded and allowed to air-dry for 48 h.
They were then dried at 80 8C to constant mass. Filters
were allowed to cool in a desiccator and weighed to the
nearest 0.01 g. The mass of the sediment retained on the
filters was the difference between the two weights and
was assumed to be b63 Am.
The sediment left in the bucket (grain size N63 Am)
was transferred to a beaker and dried at 80 8C for 4 d
(constant mass). The dried sediment was then trans-
ferred to a stack of sieves with mesh sizes of 63, 125,
250, 500 and 1000 Am. Each sampling unit was sieved
for 15 min with an electrical sieve-shaker. The mate-
rial retained onto each sieve was weighed to the
nearest 0.01 g. The mass of the smallest fraction
(silt, b63 Am) was added to the mass of the material
retained by the corresponding filter paper. Percentages
of mass of each size class were used rather than
absolute mass. Rather than using the logarithmic milli-
metre scales of the sieves, a log2-transformed scale,
the phi (f)-scale (Folk, 1980) was used to calculate
median grain size.
2.3. Statistical analyses
To test hypotheses about an across-shore gradient in
distribution of sediment and benthos, data from groups
of four adjacent sampling stations were treated as rep-
licate samples (Honkoop et al., 2005). Each transect
was divided into three zones according to distance from
low water. These were the two sampling stations closest
to the sea on each transect, the two farthest from the sea
on each transect and two towards the middle of each
transect (Fig. 1). In locations A to E, data from these
three tidal heights were combined for two transects
along each of the edges of the location and for two
transects in the middle of each location. At each of the
five locations, there were thus nine groups of four
stations (i.e. a combination of distance across-shore
and distance along-shore); three replicates at each of
three tidal levels. Because transects at location F were
relatively short, only differences between the highest
and lowest tidal levels were examined (Fig. 1).
P.J.C. Honkoop et al. / Journal of Sea Research 55 (2006) 278–291282
For multivariate analyses we used software package
PRIMER (Plymouth Routines In Multivariate Ecologi-
cal Research). Across-shore differences of characteris-
tics of the sediment and of benthic fauna were evaluated
by comparing the similarity matrices of benthos (Bray-
Curtis (dis)similarities) and sediment (Euclidean dis-
tances) taken at each tidal height (Clarke, 1993; Clarke
and Ainsworth, 1993) and visualised with n-MDS plots.
To test the differences in benthos among tidal levels,
Non-Parametric Multivariate Analysis Of Variance
(NP-MANOVA) of untransformed data was used
(Anderson, 2001). This calculation not only tests for
main effects (in our case, tidal height and distance
along-shore), but also allows evaluation of the interac-
tion between the two main effects. Because a maximum
of two factors can be tested in these analyses, they were
done for each location separately. The across-shore
distance was treated as a fixed factor and transects as
a random factor. If significant effects of tidal level on
characteristics of the sediments or benthos were ob-
served, a-posteriori comparisons were done to reveal
differences between any two levels of the tidal height.
Taxa responsible for differences in assemblages at dif-
ferent tidal heights were examined with the SIMPER
routine in PRIMER (Clarke, 1993). In this analysis the
contribution of each taxon to the dissimilarity between
any two pairs of location is evaluated.
To examine differences among the along-shore parts
of Eighty-mile Beach, only data from the sampling
stations used to test the across-shore gradient (see
previous paragraph) were used. Data from each of
these four replicate sampling stations were summed
and individual species or families were grouped into
coarser taxa (Table 1) to reduce the effects of species or
families that were found in very small or very large
numbers of individuals. Each location, except location
F, thus had nine replicates each consisting of the num-
ber of species found at four sampling stations. Location
F had only six replicates. Along-shore differences
among characteristics of the distribution of sediment
(grain size) and benthos (numbers of individuals per
species or per group of species and presence/absence
data) were visualised and analysed using appropriate
routines in PRIMER. Because estimating differences
among locations did not involve evaluation of an inter-
action term, they were tested by analysis of similarities.
In this test from similarity-matrices (Euclidean dis-
tances or Bray-Curtis dissimilarities) that were also
used to construct n-MDS plots, the-rank similarities
of the within-location replicates are compared to those
of all pairs of the replicates between locations (ANO-
SIM, Clarke and Green, 1988; Clarke, 1993). In this
way it is also possible to perform pairwise comparisons
of the different locations. However, by running inde-
pendent pair-wise comparisons, the Type 1 error
increases. Any correction to reduce this risk (i.e. reduc-
ing significance levels) has the consequence that the
Type II error increases. Therefore, the best way to
interpret the results (for example those shown in
Table 6), is to compare the statistical value (R) of sets
of comparisons. If two locations are similar, R is close
to zero, if two locations are very different R is close to
unity.
The SIMPER routine was then used to identify the
relative contribution of different taxa to differences
between locations. Across-shore and along-shore differ-
ences in median grain size and total number of inverte-
brates per sampling unit were also examined using
standard ANOVA techniques.
The correlation of the patterns found in the distri-
bution of the sediment and of the benthic assemblages
in each location was examined using the BIO-ENV
routine. In this routine the similarity-matrices of the
biota and abiotic ordinations are linked. Matching of
the pattern is expressed by a weighed Spearman or
Harmonic rank correlation (Clarke and Ainsworth,
1993). Note that the resulting rank correlation does
not indicate how much of the change in the benthic
assemblages is explained by the change of the char-
acteristics of sediment. It is only a measure of how
well the observed patterns of difference among sam-
pling units correlate with each other. Possible gradual
differences in sediment and benthos from location to
location were tested with the RELATE routine (Clarke
et al., 1993). This method measures the degree to
which possible differences in assemblages or sediments
conform to a linear sequence (i.e. distance between any
two locations).
3. Results
At most sampled stations the sediments consisted of
silt and clay (median grain size b63 Am in 469 cores) or
very fine sand (63–125 Am in 228 cores). Fine sand
(125–250 Am) was found in 130 cores, medium sand
(250–500 Am) in 12 cores, coarse sand (500–1000 Am)
in 9 cores. Only one core contained very coarse sedi-
ment (N1000 Am).
3.1. Across-shore gradients in sediment characteristics
and benthic communities
Variability among replicate sampling stations in the
sediment characteristics was relatively large (Fig. 2).
Table 2
Significance levels ( P-values) of non-parametric analyses of variance
of effects of tidal height and transect on (A) characteristics of the
sediment and of (B) benthic assemblages at the different locations
Source df Location
A B C D E F
P P P P P P
A
Height 2 0.02 0.38 0.06 0.01 0.08 b0.01
Transect 2 0.01 0.11 0.30 0.74 0.23 0.50
Height *
transect
4 b0.01 0.04 0.01 b0.05 0.01 0.48
B
Height 2 0.03 b0.01 b0.01 0.01 b0.01 0.02
Transect 2 0.03 0.11 0.38 0.63 0.03 0.10
Height *
transect
4 0.12 b0.01 0.13 0.34 0.85 0.19
Significant values are in bold. Number of permutations=4999.
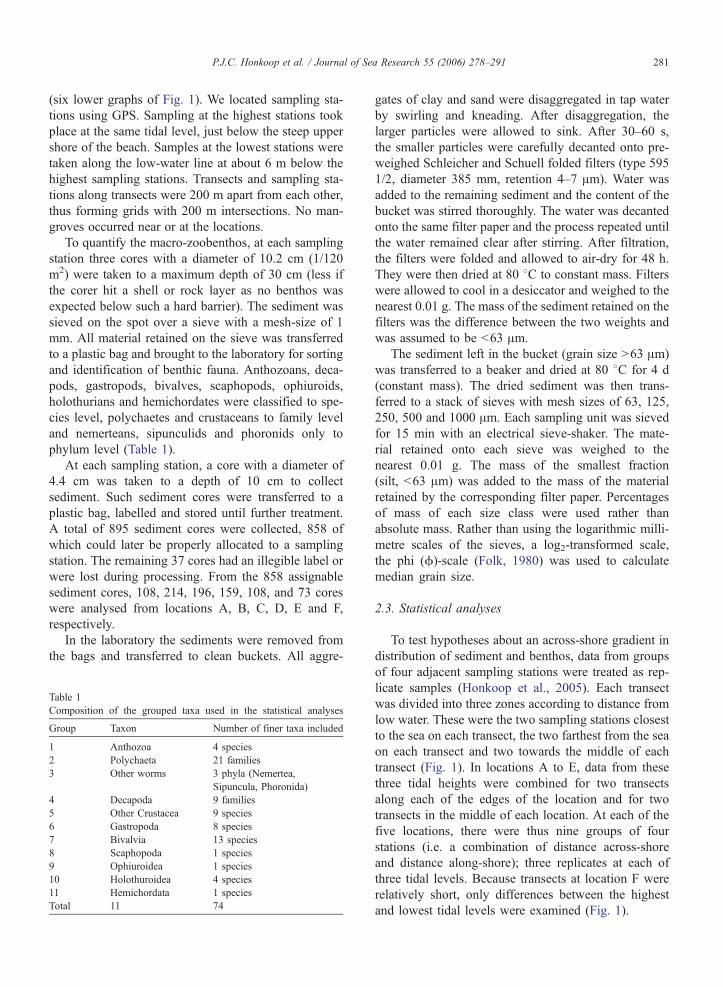
Fig. 2. n-MDS ordinations of the characteristics of sediment at three
tidal height and three parts of transects within each location. Solid
black symbols: highest tidal level; grey symbols: intermediate tidal
level; open symbols: lowest tidal level. Circles: southernmost transect;
triangles: middle transect; squares: northernmost transect.
P.J.C. Honkoop et al. / Journal of Sea Research 55 (2006) 278–291 283
Nevertheless, a separation of the highest and lowest
tidal level (solid black and open symbols in Fig. 2,
respectively) can be seen in all locations. The stations at
the intermediate tidal level (grey symbols in Fig. 2)
were generally more similar to stations at the lowest
tidal level than to those at the highest tidal level. Non-
parametric MANOVA revealed that in most cases the
interaction between tidal heights and transect was sig-
nificant, indicating different across-shore trends along
each location (Table 2A). A-posteriori tests for differ-
ences among tidal heights within transect were not
always conclusive. Generally, they occurred between
the characteristics of the sediment at the highest and
lowest tidal levels. The only location where the inter-
action between tidal height and transect was not signif-
icant was location F. Here, a consistent difference
between the two tidal heights was observed. Because
of the significant interaction between tidal height and
transect (Table 2A), it was not possible to find the size
class or classes of the sediment responsible for the
patterns within each location.
The composition of the assemblages of grouped
taxa (Table 1) showed similar patterns to those ob-
served for characteristics of the sediment (Fig. 3), but
in only one case (location B) was the interaction term
significant. In all other cases, assemblages at the dif-
ferent tidal heights were significantly different (Table
2B). Transects within locations A and E were also
significantly different, but because the locations are
essentially random along-shore locations, there is no
logic in exploring those differences any further. A-
posteriori tests revealed that the assemblages at each
tidal level were significantly different from the assem-
blages at the other tidal heights in almost all cases. At
location C, the assemblages at the higher and interme-
diate tidal level were similar, but different from those
lowest on the shore.
Polychaetes and ophiuroids contributed most to dif-
ferences between any two tidal heights and, generally,
explained more than 60% of the dissimilarity (Table 3).
In our samples one species of ophiuroid was found,
Amphiura tenuis, which was very common at the lower
tidal levels (880 individuals found in our samples).
Because of the diversity of the group of the poly-
chaetes, it was not possible to generalise the difference
among tidal level concerning the polychaetes. For ex-
ample, if found, polynoids were always associated with
Amphiura tenuis at the lowest tidal level, cirratulids
were mainly found at location E at the highest tidal
level, capitellids at F at the lowest tidal level and
owenids at location D at the highest tidal level. Occa-
sionally other groups were important. At location C
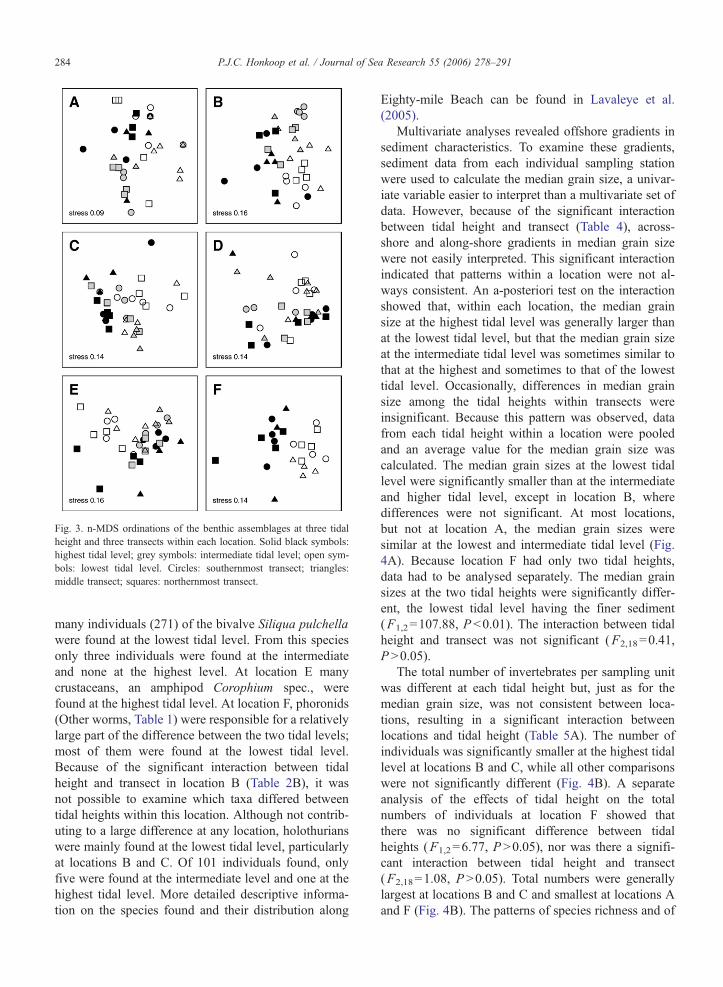
Fig. 3. n-MDS ordinations of the benthic assemblages at three tidal
height and three transects within each location. Solid black symbols:
highest tidal level; grey symbols: intermediate tidal level; open sym-
bols: lowest tidal level. Circles: southernmost transect; triangles:
middle transect; squares: northernmost transect.
P.J.C. Honkoop et al. / Journal of Sea Research 55 (2006) 278–291284
many individuals (271) of the bivalve Siliqua pulchella
were found at the lowest tidal level. From this species
only three individuals were found at the intermediate
and none at the highest level. At location E many
crustaceans, an amphipod Corophium spec., were
found at the highest tidal level. At location F, phoronids
(Other worms, Table 1) were responsible for a relatively
large part of the difference between the two tidal levels;
most of them were found at the lowest tidal level.
Because of the significant interaction between tidal
height and transect in location B (Table 2B), it was
not possible to examine which taxa differed between
tidal heights within this location. Although not contrib-
uting to a large difference at any location, holothurians
were mainly found at the lowest tidal level, particularly
at locations B and C. Of 101 individuals found, only
five were found at the intermediate level and one at the
highest tidal level. More detailed descriptive informa-
tion on the species found and their distribution along
Eighty-mile Beach can be found in Lavaleye et al.
(2005).
Multivariate analyses revealed offshore gradients in
sediment characteristics. To examine these gradients,
sediment data from each individual sampling station
were used to calculate the median grain size, a univar-
iate variable easier to interpret than a multivariate set of
data. However, because of the significant interaction
between tidal height and transect (Table 4), across-
shore and along-shore gradients in median grain size
were not easily interpreted. This significant interaction
indicated that patterns within a location were not al-
ways consistent. An a-posteriori test on the interaction
showed that, within each location, the median grain
size at the highest tidal level was generally larger than
at the lowest tidal level, but that the median grain size
at the intermediate tidal level was sometimes similar to
that at the highest and sometimes to that of the lowest
tidal level. Occasionally, differences in median grain
size among the tidal heights within transects were
insignificant. Because this pattern was observed, data
from each tidal height within a location were pooled
and an average value for the median grain size was
calculated. The median grain sizes at the lowest tidal
level were significantly smaller than at the intermediate
and higher tidal level, except in location B, where
differences were not significant. At most locations,
but not at location A, the median grain sizes were
similar at the lowest and intermediate tidal level (Fig.
4A). Because location F had only two tidal heights,
data had to be analysed separately. The median grain
sizes at the two tidal heights were significantly differ-
ent, the lowest tidal level having the finer sediment
(F1,2=107.88, P b0.01). The interaction between tidal
height and transect was not significant (F2,18=0.41,
P N0.05).
The total number of invertebrates per sampling unit
was different at each tidal height but, just as for the
median grain size, was not consistent between loca-
tions, resulting in a significant interaction between
locations and tidal height (Table 5A). The number of
individuals was significantly smaller at the highest tidal
level at locations B and C, while all other comparisons
were not significantly different (Fig. 4B). A separate
analysis of the effects of tidal height on the total
numbers of individuals at location F showed that
there was no significant difference between tidal
heights (F1,2=6.77, P N0.05), nor was there a signifi-
cant interaction between tidal height and transect
(F2,18=1.08, P N0.05). Total numbers were generally
largest at locations B and C and smallest at locations A
and F (Fig. 4B). The patterns of species richness and of
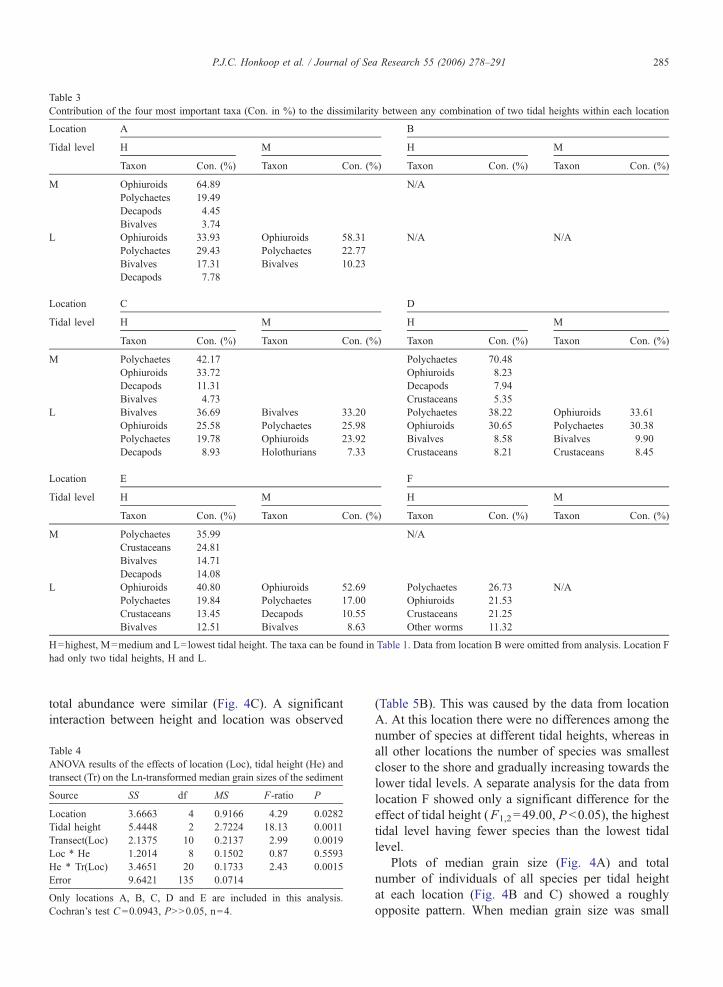
Table 3
Contribution of the four most important taxa (Con. in %) to the dissimilarity between any combination of two tidal heights within each location
Location A B
Tidal level H M H M
Taxon Con. (%) Taxon Con. (%) Taxon Con. (%) Taxon Con. (%)
M Ophiuroids 64.89 N/A
Polychaetes 19.49
Decapods 4.45
Bivalves 3.74
L Ophiuroids 33.93 Ophiuroids 58.31 N/A N/A
Polychaetes 29.43 Polychaetes 22.77
Bivalves 17.31 Bivalves 10.23
Decapods 7.78
Location C D
Tidal level H M H M
Taxon Con. (%) Taxon Con. (%) Taxon Con. (%) Taxon Con. (%)
M Polychaetes 42.17 Polychaetes 70.48
Ophiuroids 33.72 Ophiuroids 8.23
Decapods 11.31 Decapods 7.94
Bivalves 4.73 Crustaceans 5.35
L Bivalves 36.69 Bivalves 33.20 Polychaetes 38.22 Ophiuroids 33.61
Ophiuroids 25.58 Polychaetes 25.98 Ophiuroids 30.65 Polychaetes 30.38
Polychaetes 19.78 Ophiuroids 23.92 Bivalves 8.58 Bivalves 9.90
Decapods 8.93 Holothurians 7.33 Crustaceans 8.21 Crustaceans 8.45
Location E F
Tidal level H M H M
Taxon Con. (%) Taxon Con. (%) Taxon Con. (%) Taxon Con. (%)
M Polychaetes 35.99 N/A
Crustaceans 24.81
Bivalves 14.71
Decapods 14.08
L Ophiuroids 40.80 Ophiuroids 52.69 Polychaetes 26.73 N/A
Polychaetes 19.84 Polychaetes 17.00 Ophiuroids 21.53
Crustaceans 13.45 Decapods 10.55 Crustaceans 21.25
Bivalves 12.51 Bivalves 8.63 Other worms 11.32
H=highest, M=medium and L=lowest tidal height. The taxa can be found in Table 1. Data from location B were omitted from analysis. Location F
had only two tidal heights, H and L.
P.J.C. Honkoop et al. / Journal of Sea Research 55 (2006) 278–291 285
total abundance were similar (Fig. 4C). A significant
interaction between height and location was observed
Table 4
ANOVA results of the effects of location (Loc), tidal height (He) and
transect (Tr) on the Ln-transformed median grain sizes of the sediment
Source SS df MS F-ratio P
Location 3.6663 4 0.9166 4.29 0.0282
Tidal height 5.4448 2 2.7224 18.13 0.0011
Transect(Loc) 2.1375 10 0.2137 2.99 0.0019
Loc * He 1.2014 8 0.1502 0.87 0.5593
He * Tr(Loc) 3.4651 20 0.1733 2.43 0.0015
Error 9.6421 135 0.0714
Only locations A, B, C, D and E are included in this analysis.
Cochran’s test C =0.0943, PNN0.05, n=4.
(Table 5B). This was caused by the data from location
A. At this location there were no differences among the
number of species at different tidal heights, whereas in
all other locations the number of species was smallest
closer to the shore and gradually increasing towards the
lower tidal levels. A separate analysis for the data from
location F showed only a significant difference for the
effect of tidal height (F1,2=49.00, P b0.05), the highest
tidal level having fewer species than the lowest tidal
level.
Plots of median grain size (Fig. 4A) and total
number of individuals of all species per tidal height
at each location (Fig. 4B and C) showed a roughly
opposite pattern. When median grain size was small

able 5
NOVA results of the effects of location (Loc), tidal height (He) and
ansect (Tr) on (A) the total number of individuals of all species
ombined and of (B) the total number of species
ource SS df MS F-ratio P
ocation 18.66 4 4.67 5.23 0.0155
idal height 20.64 2 10.32 3.09 0.1015
ransect(Loc) 8.92 10 0.89 1.19 0.3049
oc * He 26.75 8 3.34 2.77 0.0306
e * Tr(Loc) 24.11 20 1.21 1.60 0.0599
rror 101.47 135 0.75
ocation 115.86 4 28.96 10.45 0.0014
idal height 213.38 2 106.69 10.04 0.0066
ransect(Loc) 27.72 10 2.77 0.61 0.8030
oc * He 85.01 8 10.63 4.21 0.0043
e * Tr(Loc) 613.25 20 2.52 0.56 0.9361
rror 1105.66 135 4.54
nly locations A, B, C, D and E are included in this analysis.
Fig. 4. (A) Median grain-size, (B) total number of individuals of all
species, and (C) total number of species at the different tidal heights at
the different locations. At each location data from all sampling sta-
tions per tidal height were pooled. MeanFSE. o=highest, D=in-
intermediate and 5=lowest tidal level.
P.J.C. Honkoop et al. / Journal of Sea Research 55 (2006) 278–291286
(locations B–E), the number of individuals and species
was large and when the median grain size was large
(locations A and F), the number of individuals and
species was relatively small. Plots of the relationship
between median grain sizes and the total number of
species confirmed this pattern. In both cases there
were significant negative correlations between median
grain size and numbers of individuals or species,
significantly fewer individuals (F1,15=4.82, P b0.05,
R2=0.243, Fig. 5A) and species (F1,15=8.49,
P b0.05, R2=0.362, Fig. 5B) in coarser sediments
than in finer sediments.
3.2. Along-shore gradients in sediment characteristics
and the composition of benthic assemblages
In addition to the differences among sediments at the
different tidal heights within locations, analysis of sim-
ilarity revealed that there were also significant differ-
ences (Table 6, ANOSIM, P b0.05) between many
locations. However, because location was a random
factor, those differences were not logically interpret-
able. The differences of the composition of the sedi-
ment among locations were significantly related
(P b0.05, from RELATE) to the actual distance be-
tween any two locations, the further away from each
other, the greater the difference.
Benthic assemblages were compared among loca-
tions in three different ways. First, the total number
of individuals at the finest taxonomic resolution was
examined. As a result of the large number of taxa (74,
see Table 1) compared with the small number of repli-
cates, the stress value of the 2-dimensional ordination
was relatively large (0.20). Observed patterns using
untransformed data can be mainly driven by the abun-
dance of a few species in a few sampling units. There-
fore, to reduce the impact of patchy and abundant
species, data were transformed to only presence (=1)
or absence (=0). This transformation resulted in an
even larger stress value (0.22) than using abundance,
indicating that the description of the assemblages in a 2-
dimensional space is a poor one. The smallest stress
value (0.18) was obtained by grouping the individuals
into coarser taxa (Table 1). Variability within locations
was relatively large, especially within location B. Anal-
ysis of similarity (ANOSIM) revealed differences
among locations (Table 6), but these were difficult to
interpret. Generally, location A was different from the
other locations, which were similar to each other. The
observed pattern was significantly correlated to the
spatial distances among the beaches (P b0.05, from
RELATE). This correlation is also reflected in the
general similarity of the assemblages of two adjacent
T
A
tr
c
S
A
L
T
T
L
H
E
B
L
T
T
L
H
E
O
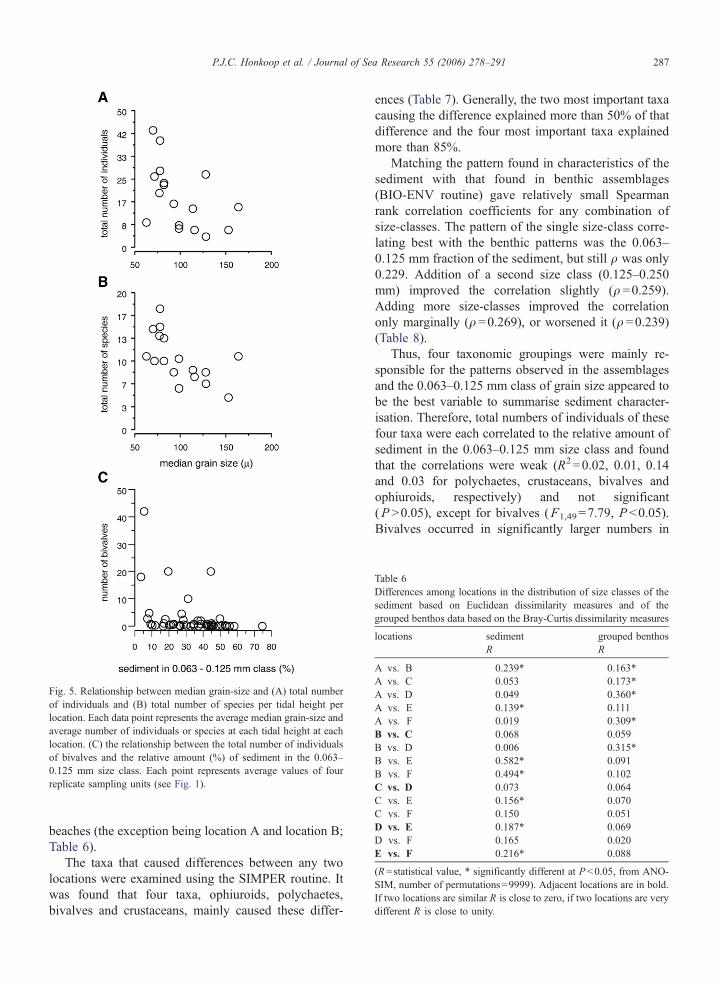
Table 6
Differences among locations in the distribution of size classes of the
sediment based on Euclidean dissimilarity measures and of the
grouped benthos data based on the Bray-Curtis dissimilarity measures
locations sediment grouped benthos
R R
A vs. B 0.239* 0.163*
A vs. C 0.053 0.173*
A vs. D 0.049 0.360*
A vs. E 0.139* 0.111
A vs. F �0.019 0.309*
B vs. C 0.068 0.059
B vs. D 0.006 0.315*
B vs. E 0.582* 0.091
B vs. F 0.494* 0.102
C vs. D �0.073 0.064
C vs. E 0.156* �0.070C vs. F 0.150 �0.051D vs. E 0.187* 0.069
D vs. F 0.165 �0.020E vs. F 0.216* �0.088(R =statistical value, * significantly different at P b0.05, from ANO
SIM, number of permutations=9999). Adjacent locations are in bold
If two locations are similar R is close to zero, if two locations are very
different R is close to unity.
Fig. 5. Relationship between median grain-size and (A) total number
of individuals and (B) total number of species per tidal height per
location. Each data point represents the average median grain-size and
average number of individuals or species at each tidal height at each
location. (C) the relationship between the total number of individuals
of bivalves and the relative amount (%) of sediment in the 0.063–
0.125 mm size class. Each point represents average values of four
replicate sampling units (see Fig. 1).
P.J.C. Honkoop et al. / Journal of Sea Research 55 (2006) 278–291 287
beaches (the exception being location A and location B;
Table 6).
The taxa that caused differences between any two
locations were examined using the SIMPER routine. It
was found that four taxa, ophiuroids, polychaetes,
bivalves and crustaceans, mainly caused these differ-
ences (Table 7). Generally, the two most important taxa
causing the difference explained more than 50% of that
difference and the four most important taxa explained
more than 85%.
Matching the pattern found in characteristics of the
sediment with that found in benthic assemblages
(BIO-ENV routine) gave relatively small Spearman
rank correlation coefficients for any combination of
size-classes. The pattern of the single size-class corre-
lating best with the benthic patterns was the 0.063–
0.125 mm fraction of the sediment, but still q was only
0.229. Addition of a second size class (0.125–0.250
mm) improved the correlation slightly (q =0.259).
Adding more size-classes improved the correlation
only marginally (q =0.269), or worsened it (q =0.239)
(Table 8).
Thus, four taxonomic groupings were mainly re-
sponsible for the patterns observed in the assemblages
and the 0.063–0.125 mm class of grain size appeared to
be the best variable to summarise sediment character-
isation. Therefore, total numbers of individuals of these
four taxa were each correlated to the relative amount of
sediment in the 0.063–0.125 mm size class and found
that the correlations were weak (R2=0.02, 0.01, 0.14
and 0.03 for polychaetes, crustaceans, bivalves and
ophiuroids, respectively) and not significant
(P N0.05), except for bivalves (F1,49=7.79, P b0.05).
Bivalves occurred in significantly larger numbers in
-
.

Table 7
Contribution of the four most important taxa (Con. in %) on the dissimilarity between any combination of two locations (Loc.)
Loc. A B C D E
Taxon Con. (%) Taxon Con. (%) Taxon Con. (%) Taxon Con. (%) Taxon Con. (%)
B Ophiuroids 31.0.0
Bivalves 26.99
Polychaetes 13.97
Crustaceans 10.27
C Ophiuroids 29.69 Polychaetes 33.26
Polychaetes 29.19 Ophiuroids 23.38
Bivalves 26.25 Bivalves 20.12
Decapods 6.17 Crustaceans 8.04
D Polychaetes 46.12 Polychaetes 32.20 Polychaetes 30.86
Ophiuroids 31.79 Bivalves 21.95 Bivalves 26.22
Bivalves 5.90 Ophiuroids 21.12 Ophiuroids 24.63
Crustaceans 5.84 Crustaceans 9.86 Crustaceans 6.27
E Ophiuroids 36.50 Bivalves 24.76 Bivalves 26.646 Polychaetes 36.63
Polychaetes 23.84 Ophiuroids 23.54 Polychaetes 24.81 Ophiuroids 27.47
Crustaceans 12.16 Polychaetes 18.70 Ophiuroids 23.66 Crustaceans 12.90
Bivalves 10.94 Crustaceans 13.75 Crustaceans 10.16 Bivalves 10.01
F Polychaetes 29.22 Polychaetes 23.41 Polychaetes 24.52 Polychaetes 28.04 Polychaetes 24.54
Ophiuroids 27.82 Bivalves 21.63 Bivalves 20.97 Ophiuroids 24.76 Crustaceans 24.42
Crustaceans 21.30 Crustaceans 18.92 Ophiuroids 19.78 Crustaceans 24.16 Ophiuroids 24.29
Decapods 6.41 Ophiuroids 17.13 Crustaceans 17.69 Bivalves 7.76 Bivalves 9.19
The taxa can be found in Table 1. Data from locations that had a significantly ( P b0.05, from SIMPER) different composition of the assemblage are
in bold.
P.J.C. Honkoop et al. / Journal of Sea Research 55 (2006) 278–291288
areas where the relative amount of the 0.063–0.125 mm
grain size class was relatively small (Fig. 5C).
4. Discussion
Sandy beaches are usually divided into three distinct
zones, the supralittoral, littoral and sublittoral zones
(McLachlan and Jaramillo, 1995). In our study we
aimed to find evidence of zonation within the littoral
zone as the supralittoral zone and beach front were not
sampled quantitatively. Based on our qualitative obser-
vations very few species were observed here, mainly
Table 8
Combination of the six size classes, taken 1–6 (all) classes at a time
resulting in the best matching of the abiotic and biotic similarity
matrices as measured by the Spearman rank correlation (q)
Number of
size-classes
Best combination of
size classes (d in /)
q
1 3.5 0.229
2 2.5; 3.5 0.259
3 0; 2.5; 3.5 0.269
4 0; 1.5, 2.5, 3.5 0.268
5 0; 0.5; 1.5; 2.5; 3.5 0.267
6 All 0.269
Only the size class resulting in the largest rank correlation within each
number of combinations is given. Size classes are given as the
midpoint (d) of the phi (/) scale (Folk, 1980). The midpoint of the
N1 mm class is arbitrarily set to 0.
crustaceans (one or more members of the ocypodids
(ghost crabs), coenobitidae (land hermits), amphipods
and isopods). These taxa appear to be a general feature
of reflective beaches (Gauld and Buchanan, 1956; Tre-
vallion et al., 1970; McLachlan and Hesp, 1984; McLa-
chlan, 1985).
In this study we aimed to find evidence for the
presence of across-shore and along-shore patterns in
characteristics of the sediments. Generally, sediment
of the studied locations along Eighty-mile Beach was
very fine, 55% of all cores containing more than 50%
mud and silt (median grain size b63 A). At reflectivebeaches it is generally observed that coarser sediments
occur close to the beach front and finer sediments closer
towards the low-water line (McLachlan, 1987). This
also appeared to be the case at the intertidal area
along Eighty-mile Beach. A multivariate analysis of
variance on sediment data confirmed this pattern (Fig.
2). The small stress values indicated that the multivar-
iate data of grain sizes fitted very well in a two-dimen-
sional space, meaning that a single grain-size class
drove the pattern and that similar results would have
been obtained if that particular size class was analysed
in a univariate sense. Sampling stations at the interme-
diate tidal level had an intermediate grain-size distribu-
tion. Thus, the hypothesis of a tidal gradient in
sediment characteristics with coarser sediments closer
to shore and finer towards the low-water line was
P.J.C. Honkoop et al. / Journal of Sea Research 55 (2006) 278–291 289
confirmed. In addition to the multivariate tests, the
sediment data were transformed to one univariate var-
iable, median grain size. In accordance with the multi-
variate tests sediments at the higher tidal levels were
found to be coarser (i.e. had a larger median grain size)
than at the lower tidal levels.
We also aimed to find evidence for the presence of
across-shore and along-shore patterns in the composi-
tion of intertidal benthic assemblages. Except at loca-
tion B, benthic assemblages were indeed different
among tidal heights, showing a gradual change from
the shore towards the lowest tidal level. The species or
groups of species causing that difference were not the
same at each location (e.g. echinoids at location B and
C and polychaetes at D and F, see below), indicating
that along the Eighty-mile Beach foreshore there are
changes in the composition of the benthic assemblages.
This means that tidal height is not the only factor
determining the composition of assemblages. Thus,
although zonation was expected (see references cited
above), a multivariate examination of the composition
of benthic assemblages did not confirm its presence
along Eighty-mile Beach. Nevertheless, there was one
species that was found in large numbers on the lower
flats, the ophiuroid Amphiura tenuis. Therefore, the
lower part of the intertidal zone can be considered to
be an ophiuroid zone.
Transforming benthos data to univariate variables,
numbers of species and individuals, revealed a few
general across-shore patterns. The number of indivi-
duals and species was larger at the lower tidal levels
than close to the shore. Therefore, within the intertidal
area a zone with few species and individuals (the higher
tidal level) and a zone with more species and a larger
number of individuals (the lower tidal levels) could be
identified.
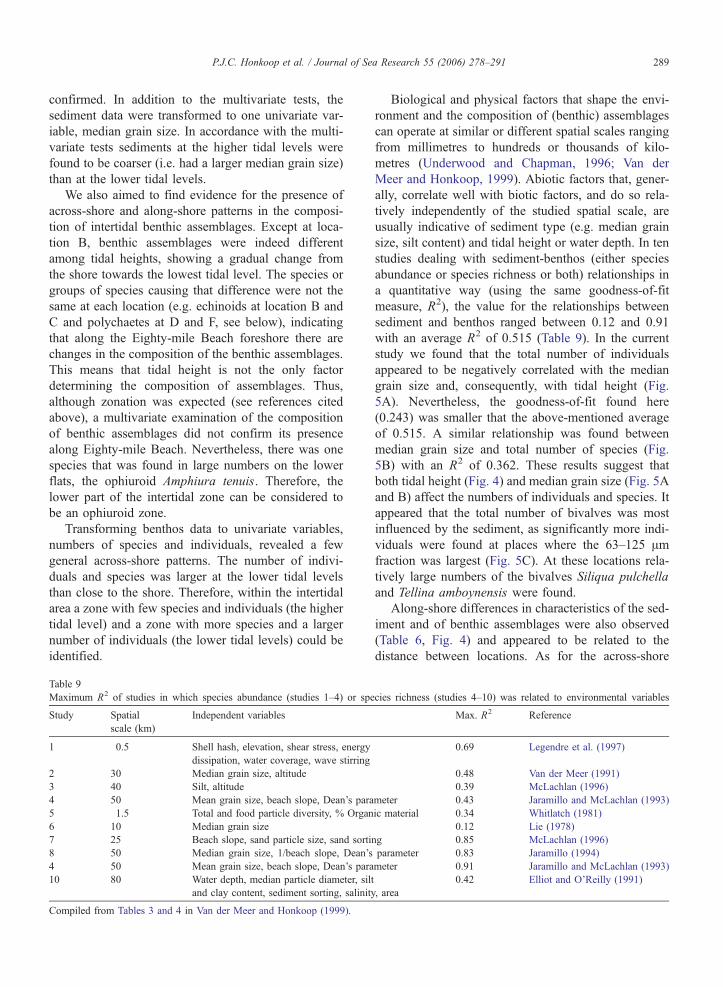
Table 9
Maximum R2 of studies in which species abundance (studies 1–4) or spe
Study Spatial
scale (km)
Independent variables
1 0.5 Shell hash, elevation, shear stress, energy
dissipation, water coverage, wave stirring
2 30 Median grain size, altitude
3 40 Silt, altitude
4 50 Mean grain size, beach slope, Dean’s para
5 1.5 Total and food particle diversity, % Organ
6 10 Median grain size
7 25 Beach slope, sand particle size, sand sorti
8 50 Median grain size, 1/beach slope, Dean’s
4 50 Mean grain size, beach slope, Dean’s para
10 80 Water depth, median particle diameter, silt
and clay content, sediment sorting, salinity
Compiled from Tables 3 and 4 in Van der Meer and Honkoop (1999).
Biological and physical factors that shape the envi-
ronment and the composition of (benthic) assemblages
can operate at similar or different spatial scales ranging
from millimetres to hundreds or thousands of kilo-
metres (Underwood and Chapman, 1996; Van der
Meer and Honkoop, 1999). Abiotic factors that, gener-
ally, correlate well with biotic factors, and do so rela-
tively independently of the studied spatial scale, are
usually indicative of sediment type (e.g. median grain
size, silt content) and tidal height or water depth. In ten
studies dealing with sediment-benthos (either species
abundance or species richness or both) relationships in
a quantitative way (using the same goodness-of-fit
measure, R2), the value for the relationships between
sediment and benthos ranged between 0.12 and 0.91
with an average R2 of 0.515 (Table 9). In the current
study we found that the total number of individuals
appeared to be negatively correlated with the median
grain size and, consequently, with tidal height (Fig.
5A). Nevertheless, the goodness-of-fit found here
(0.243) was smaller that the above-mentioned average
of 0.515. A similar relationship was found between
median grain size and total number of species (Fig.
5B) with an R2 of 0.362. These results suggest that
both tidal height (Fig. 4) and median grain size (Fig. 5A
and B) affect the numbers of individuals and species. It
appeared that the total number of bivalves was most
influenced by the sediment, as significantly more indi-
viduals were found at places where the 63–125 Amfraction was largest (Fig. 5C). At these locations rela-
tively large numbers of the bivalves Siliqua pulchella
and Tellina amboynensis were found.
Along-shore differences in characteristics of the sed-
iment and of benthic assemblages were also observed
(Table 6, Fig. 4) and appeared to be related to the
distance between locations. As for the across-shore
cies richness (studies 4–10) was related to environmental variables
Max. R2 Reference
0.69 Legendre et al. (1997)
0.48 Van der Meer (1991)
0.39 McLachlan (1996)
meter 0.43 Jaramillo and McLachlan (1993)
ic material 0.34 Whitlatch (1981)
0.12 Lie (1978)
ng 0.85 McLachlan (1996)
parameter 0.83 Jaramillo (1994)
meter 0.91 Jaramillo and McLachlan (1993)
, area
0.42 Elliot and O’Reilly (1991)

P.J.C. Honkoop et al. / Journal of Sea Research 55 (2006) 278–291290
differences in the benthic assemblages, ophiuroids and
polychaetes were important, as were crustaceans and
bivalves. Surprisingly, the pattern observed for benthic
invertebrates was only weakly correlated with the pat-
tern found in sediment characteristics. The largest cor-
relation coefficient found was q =0.269, a value much
smaller than that found in a similar study done in
Roebuck Bay two years earlier (Pepping et al., 1999).
In that study, distribution patterns of silt (sediment b63
A) and benthos were better correlated (q =0.553) than in
our study (q b0.229, see also Table 9). One explanation
is that at Eighty-mile Beach the distribution patterns of
benthos were influenced or determined by other factors
than those measured in this study, one possibility being
that biotic interactions are more important than the
assumed abiotic structuring.
Alternatively, the expected larger correlation was
obscured by the recent passage of severe tropical cy-
clone Vance, which hit the area in March 1999, only six
months before the current study. The fastest wind
speeds ever recorded above mainland Australia were
measured during this cyclone: 267 km/h (http://
www.bom.gov.au/info/cyclone/). It is likely that the
sediments were dramatically disturbed during this
storm; the intertidal sediments and biotic assemblages
might still have been in a recovery phase. Some obser-
vations are consistent with this hypothesis. We noticed
the presence in some places of a five cm deep layer of
coarse sediment on top of muddy sediment, suggesting
that some coarse sediments were recently deposited. We
also noticed that the huge ridges of shell fragments that
are so characteristic of the highest parts of Eighty-mile
Beach were not present to any large degree in October
1999. Cyclone Vance may have changed the abiotic
environment such that the benthic community was still
recovering from this event. Repeat surveys after a long
cyclone-free period are requested to test this hypothesis.
Acknowledgements
We thank the 72 volunteers and four scientific coor-
dinators (Bob Hickey, Petra de Goeij, Danny Rogers
and Loisette Marsh) who helped us to collect sediment
and benthos in the field and to take care of the samples
back at the Anna Plains Station camp; we thank man-
ager John Stoate for great hospitality there. Due to the
participants of a Landscope expedition a significant part
of this work could be financed. Benson Holland pro-
cessed many of the sediment cores. Bob Hickey (De-
partment of Geography and Land Studies, Central
Washington University) helped to design the grid pat-
tern and to create some of the figures. Tony Underwood
(Centre for Research on Ecological Impacts of Coastal
Cities, University of Sydney) enabled the first author to
allocate time and use equipment to process sediment
cores. Gee Chapman gave statistical advice and valu-
able comments on earlier drafts, Jaap van der Meer on
one of the last, and we also gratefully incorporated the
many constructive suggestions by three anonymous
referees.
References
Anderson, M.J., 2001. A new method for non-parametric multivariate
analysis of variance. Aust. Ecol. 26, 32–46.
Beukema, J.J., Flach, E.C., 1995. Factors controlling the upper
and lower limits of the intertidal distribution of two Coro-
phium species in the Wadden Sea. Mar. Ecol. Prog. Ser. 125,
117–126.
Chaloupka, M.Y., Hall, D.N., 1985. An examination of species dis-
persion patterns along the intertidal gradient on Macquarie Island
(Sub-Antarctica) using a restricted occupancy model. J. Exp. Mar.
Biol. Ecol. 84, 133–144.
Clarke, K.R., 1993. Non-parametric multivariate analyses of changes
in community structure. Aust. J. Ecol. 18, 117–143.
Clarke, K.R., Ainsworth, M., 1993. A method of linking multivariate
community structure to environmental variables. Mar. Ecol. Prog.
Ser. 92, 205–219.
Clarke, K.R., Green, R.H., 1988. Statistical design and analyses for a
dbiological effectsT study. Mar. Ecol. Prog. Ser. 46, 213–226.
Clarke, K.R., Warwick, R.M., Brown, B.E., 1993. An index showing
breakdown of seriation, related to disturbance, in a coral-reef
assemblage. Mar. Ecol. Prog. Ser. 102, 153–160.
Elliot, M., O’Reilly, M.G., 1991. The variability and prediction
of marine benthic community parameters. In: Elliot, M., Ducro-
toy, J.-P. (Eds.), Estuaries and Coasts: Spatial and Temporal
Intercomparisons: ECSA 19 Symposium. Olsen & Olsen, Fre-
densborg, pp. 231–238.
Flach, E.C., 1996. The influence of the cockle, Cerastoderma edule,
on the macrozoobenthic community of tidal flats in the Wadden
Sea. PSZN I: Mar. Ecol. 17, 87–98.
Folk, R.L., 1980. Petrology of Sedimentary Rocks. Hemphill Pub-
lishing Company, Austin, Texas.
Gauld, D.T., Buchanan, J.B., 1956. The fauna of sandy beaches in the
Gold Coast. Oikos 7, 293–301.
Gray, J.S., 1974. Animal-sediment relationships. Oceanogr. Mar. Biol.
Ann. Rev. 12, 223–261.
Grosberg, R.K., 1982. Intertidal zonation of barnacles: the influence
of planktonic zonation of larvae on vertical distribution of adults.
Ecology 63, 894–899.
Honkoop, P.J.C., Pearson, G., Lavaleye, M.S.S., Piersma, T., 2005.
Intertidal benthic community structure: role of sediment charac-
teristics. In: Piersma, T., Pearson, G.B., Hickey, R., Lavaleye,
M.S.S. (Eds.), The long mud. Benthos and shorebirds of the
foreshore of Eighty-mile Beach, Western Australia. NIOZ-report
2005–2, Texel, pp. 151–162.
Jaramillo, E., 1994. Patterns of species richness in sandy beaches of
South America. S. Afr. J. Zool. 29, 227–234.
Jaramillo, E., McLachlan, A., 1993. Community and population
responses of the macroinfauna to physical factors over a range
of exposed sandy beaches in South-central Chile. Estuar. Coast.
Shelf Sci. 37, 615–624.
P.J.C. Honkoop et al. / Journal of Sea Research 55 (2006) 278–291 291
Kamermans, P., 1993. Food limitation in cockles (Cerastoderma
edule (L.)): influences of location on tidal flat and of nearby
presence of mussel beds. Neth. J. Sea Res. 31, 71–81.
Lavaleye, M., Honkoop, P.J.C., Marsh, L., Pearson, G.B., Piersma, T.,
De Goeij, P., 2005. Atlas of the macrozoobenthic fauna. In:
Piersma, T., Pearson, G.B., Hickey, R., Lavaleye, M. (Eds.),
The long mud. Benthos and shorebirds of the foreshore of
Eighty-mile Beach, Western Australia. NIOZ-report 2005-2,
Texel, pp. 73–143.
Legendre, P., Thrush, S.F., Cummings, V.J., Dayton, P.K., Grant, J.,
Hewitt, J.E., Hines, A.H., McArdle, B.H., Pridmore, R.D.,
Schnieder, D.C., Turner, S.J., Whitlatch, R.B., Wilkinson, M.R.,
1997. Spatial structure of bivalves in a sandflat: scale and gener-
ating processes. J. Exp. Mar. Biol. Ecol. 216, 99–128.
Levinton, J.S., 1972. Stability and trophic structure in deposit-feeding
and suspension-feeding communities. Am. Nat. 106, 472–486.
Lie, U., 1978. The quantitative distribution of benthic macrofauna in
Fanafjorden, Western Norway. Sarsia 63, 305–316.
McLachlan, A., 1985. The biomass of a macro-and interstitial fauna
on clean and wrack-covered beaches in Western Australia. Estuar.
Coast. Shelf Sci. 21, 587–599.
McLachlan, A., 1987. Behavioural adaptations of sandy beach organ-
isms: an ecological perspective. In: Chelazzi, G., Vannini, M.
(Eds.), Behavioural Adaptations to Intertidal Life, NATO ASI
Series, vol. 151. Plenum Press, New York, pp. 449–475.
McLachlan, A., 1990. The physical environment. In: Brown, A.C.,
McLachlan, A. (Eds.), Ecology of Sandy Shores. Elsevier,
Amsterdam, pp. 5–39.
McLachlan, A., 1996. Physical factors in benthic ecology: effects of
changing sand particle size on beach fauna. Mar. Ecol. Prog. Ser.
131, 205–217.
McLachlan, A., Hesp, P., 1984. Faunal response to morphology and
water circulation of a sandy beach with cusps. Mar. Ecol. Prog.
Ser. 19, 133–144.
McLachlan, A., Jaramillo, E., 1995. Zonation on sandy beaches.
Oceanogr. Mar. Biol. Ann. Rev. 33, 305–335.
Pepping, M., Piersma, T., Pearson, G., Lavaleye, M., 1999. Intertidal
sediments and benthic animals of Roebuck Bay, Western Austra-
lia. NIOZ-report 1999–3, Texel.
Peterson, C.H., 1991. Intertidal zonation of marine invertebrates in
sand and mud. Am. Sci. 79, 236–249.
Peterson, C.H., Black, R., 1987. Resource depletion by active sus-
pension feeders on tidal flats: influence of local density and tidal
elevation. Limnol. Oceanogr. 32, 143–166.
Peterson, C.H., Black, R., 1991. Preliminary evidence for progressive
sestonic food depletion in incoming tide over a broad tidal sand-
flat. Estuar. Coast. Shelf Sci. 32, 405–413.
Raimondi, P.T., 1988. Rock type affects settlement, recruitment, and
zonation of the barnacle Chthamalus anisopoma Pilsbury. J. Exp.
Mar. Biol. Ecol. 123, 253–267.
Rhoads, D.C., Young, D.K., 1970. The influence of deposit-feeding
organisms on sediment stability and community trophic structure.
J. Mar. Res. 28, 150–178.
Schratzberger, M., Warwick, R.M., 1999. Impact of predation and
sediment disturbance by Carcinus maenas (L.) on free-living nem-
atode community structure. J. Exp. Mar. Biol. Ecol. 235, 255–271.
Snelgrove, P.V.R., Butman, C.A., 1994. Animal- sediment relation-
ships revisited: cause versus effect. Oceanogr. Mar. Biol. Ann.
Rev. 32, 111–177.
Thrush, S.F., Cummings, V.J., Hewitt, J.E., Funnell, G.A., Green,
M.O., 2001. The role of suspension-feeding bivalves in influenc-
ing macrofauna: variations in response. In: Aller, J.Y., Woodin,
S.A., Aller, R.C. (Eds.), Organism-Sediment Interaction, The
Belle W. Baruch Library in Marine Science, vol. 21. University
of South Carolina Press, Columbia, pp. 87–100.
Trevallion, A., Ansell, A.D., Sivadas, P., Narayanan, B., 1970. A
preliminary account of two sandy beaches in South west India.
Mar. Biol. 6, 268–279.
Underwood, A.J., 1978. A refutation of critical tidal levels as deter-
minants of the structure of intertidal communities on British
shores. J. Exp. Mar. Biol. Ecol. 33, 261–276.
Underwood, A.J., 1981. Structure of a rocky intertidal community in
New South Wales: patterns of vertical distribution and seasonal
changes. J. Exp. Mar. Biol. Ecol. 51, 57–85.
Underwood, A.J., 1984. The vertical distribution and seasonal abun-
dance of intertidal microalgae on a rocky shore in New South
Wales. J. Exp. Mar. Biol. Ecol. 78, 199–200.
Underwood, A.J., 2000. Experimental ecology of rocky intertidal
habitats: what are we learning? J. Exp. Mar. Biol. Ecol. 250,
51–76.
Underwood, A.J., Chapman, M.G., 1996. Scales of spatial patterns of
distribution of intertidal invertebrates. Oecologia 107, 212–224.
Van der Meer, J., 1991. Exploring macrobenthos-environment rela-
tionship by canonical correlation analysis. J. Exp. Mar. Biol. Ecol.
148, 105–120.
Van der Meer, J., Honkoop, P.J.C., 1999. Species-environment rela-
tionship in marine soft-bottom communities: regression modelling
and the implications of scale. NIOZ-report 1999–7, Texel.
Warren, J.H., Underwood, A.J., 1986. Effects of burrowing crabs on
the topography of mangrove swamps in New South Wales. J. Exp.
Mar. Biol. Ecol. 102, 223–235.
Warwick, R.M., Gee, J.M., Berge, J.A., Ambrose, Jr. W., 1986.
Effects of the feeding activity of the polychaete Streblosoma
bairdi (Malmgren) on meiofaunal abundance and community
structure. Sarsia 71, 11–16.
Warwick, R.M., Clarke, K.R., Gee, J.M., 1990. The effect of distur-
bance by soldier crabsMictyris platycheles Edwards (H Milne) on
meiobenthic community structure. J. Exp. Mar. Biol. Ecol. 135,
19–33.
Whitlatch, R.B., 1981. Animal-sediment relationships in intertidal
marine benthic habitats: some determinants of deposit-feeding
species diversity. J. Exp. Mar. Biol. Ecol. 53, 31–45.
Zwarts, L., Wanink, J.H., 1993. How the food supply harvestable by
waders in the Wadden Sea depends on the variation in energy
density, body weight, biomass, burying depth and behaviour of
tidal-flat invertebrates. Neth. J. Sea Res. 33, 441–476.