spatial patterns of carbon, biodiversity, deforestation ... · pdf filecontributedpaper...
TRANSCRIPT

Contributed Paper
Spatial patterns of carbon, biodiversity, deforestationthreat, and REDD+ projects in IndonesiaJosil P. Murray,∗ ¶ Richard Grenyer,† Sven Wunder,‡ Niels Raes,§ and Julia P.G. Jones∗∗School of Environment, Natural Resource and Geography (SENRGY), Bangor University, LL57 2UW, Bangor, Gwynedd, Wales,United Kingdom†School of Geography and the Environment, University of Oxford, South Parks Road, Oxford, OX1 3QY, United Kingdom‡Center for International Forestry Research, Rua do Russel, 450/601, CEP 22.210–010, Rio de Janeiro, Brazil§Naturalis Biodiversity Center, Darwinweg 2, P.O. Box 9517, NL-2300 RA Leiden, the Netherlands
Abstract: There are concerns that Reduced Emissions from Deforestation and forest Degradation (REDD+)may fail to deliver potential biodiversity cobenefits if it is focused on high carbon areas. We explored thespatial overlaps between carbon stocks, biodiversity, projected deforestation threats, and the location ofREDD+ projects in Indonesia, a tropical country at the forefront of REDD+ development. For biodiversity,we assembled data on the distribution of terrestrial vertebrates (ranges of amphibians, mammals, birds,reptiles) and plants (species distribution models for 8 families). We then investigated congruence betweendifferent measures of biodiversity richness and carbon stocks at the national and subnational scales. Finally,we mapped active REDD+ projects and investigated the carbon density and potential biodiversity richness andmodeled deforestation pressures within these forests relative to protected areas and unprotected forests. Therewas little internal overlap among the different hotspots (richest 10% of cells) of species richness. There wasalso no consistent spatial congruence between carbon stocks and the biodiversity measures: a weak negativecorrelation at the national scale masked highly variable and nonlinear relationships island by island. CurrentREDD+ projects were preferentially located in areas with higher total species richness and threatened speciesrichness but lower carbon densities than protected areas and unprotected forests. Although a quarter of thetotal area of these REDD+ projects is under relatively high deforestation pressure, the majority of the REDD+area is not. In Indonesia at least, first-generation REDD+ projects are located where they are likely to deliverbiodiversity benefits. However, if REDD+ is to deliver additional gains for climate and biodiversity, projectswill need to focus on forests with the highest threat to deforestation, which will have cost implications forfuture REDD+ implementation.
Keywords: deforestation, ecosystem services, forest degradation, hotspots, protected areas, spatialcongruence
Los Patrones Espaciales del Carbono, la Biodiversidad, la Amenaza de Deforestacion y los Proyectos REDD+ enIndonesia
Resumen: Actualmente hay preocupacion por que las Emisiones Reducidas de la Deforestacion yDegradacion del Bosque (REDD+, en ingles) puedan fallar en la entrega de co–beneficios potenciales dela biodiversidad si se enfocan en areas de alto carbono. Exploramos los traslapes espaciales entre los stocksde carbono, la biodiversidad, las amenazas proyectadas de deforestacion y la ubicacion de proyectos REDD+en Indonesia, un paıs tropical a la vanguardia del desarrollo REDD+. Para la biodiversidad, reunimosdatos sobre la distribucion de vertebrados terrestres (habitats de anfibios, mamıferos, aves y reptiles) yplantas (modelos de distribucion de especies para ocho familia). Despues investigamos la congruencia entrelas diferentes medidas de la riqueza de la biodiversidad y los stocks de carbono en la escala nacional y
¶email [email protected] submitted August 5, 2014; revised manuscript accepted January 31, 2015.
This is an open access article under the terms of the Creative Commons Attribution License, which permits use, distribution and reproductionin any medium, provided the original work is properly cited.
1Conservation Biology, Volume 00, No. 0, 1–12C© 2015 The Authors. Conservation Biology published by Wiley Periodicals, Inc., on behalf of Society for Conservation BiologyDOI: 10.1111/cobi.12500

2 The delivery of biodiversity benefits in REDD+
sub–nacional. Finalmente mapeamos proyectos REDD+ activos e investigamos la densidad de carbono yla riqueza potencial de la biodiversidad y modelamos presiones de deforestacion dentro de estos bosquesen relacion con areas protegidas y no protegidas. Hubo poco traslape interno entre los diferentes hotspots(el 10% mas rico de las celdas) de riqueza de especies. Tampoco hubo congruencia espacial consecuenteentre los stocks de carbono y las medidas de la biodiversidad: una correlacion negativa debil en la escalanacional enmascaro las relaciones altamente variables y no-lineales isla por isla. Los proyectos REDD+actuales estuvieron ubicados preferencialmente en areas con una riqueza total de especies y con una riquezade especies amenazadas mas altas pero con densidades de carbono mas bajas que en las areas protegidas ylos bosques sin proteccion. Aunque un cuarto del area total de estos proyectos REDD+ esta bajo una presionde deforestacion relativamente alta, la mayorıa del area REDD+ no lo esta. Por lo menos en Indonesia, losproyectos REDD+ de primera generacion estan ubicados en donde tengan probabilidad de entregar beneficiospara la biodiversidad. Sin embargo, si se espera que REDD+ entregue beneficios adicionales para el clima yla biodiversidad, los proyectos necesitaran enfocarse en los bosques con la mayor amenaza de deforestacion,lo que tendra implicaciones de costo para la implementacion futura de REDD+.
Palabras Clave: areas protegidas, congruencia espacial, deforestacion, degradacion del bosque, hotspots, servi-cios ambientales
Introduction
There has been a lot of interest in the potential offorest carbon sequestration projects such as those beingdiscussed under the climate mechanism to ReduceEmissions from Deforestation and forest Degradation(REDD+) to deliver benefits for biodiversity. Under theproposed mechanism, REDD+ payments are intendedto protect threatened tropical forests by providing eco-nomic incentives for continued forest integrity (Venter& Koh 2011). The plus in REDD+ expands the scope toinclude the conservation, sustainable management, andenhancement of forest carbon stocks as means to reduceemissions from deforestation and forest degradation(UNFCCC 2008). Some argue that REDD+ offers“unprecedented” opportunities for biodiversity (Gardneret al. 2012) and provides new funding for conservation(Venter et al. 2009), rehabilitation of critical habitat(Alexander et al. 2011), and the establishment of newprotected areas (PAs) (Macdonald et al. 2011). However,many have also drawn attention to potential risks forbiodiversity that are associated with preferential targetingof REDD+ projects in high carbon areas, such as displace-ment of land use pressure (leakage) into high biodiversitybut low carbon areas (Harrison & Paoli 2012) and thediversion of funds for forest conservation away fromhigh biodiversity low carbon areas (Phelps et al. 2012).
The degree to which carbon and biodiversity servicesare colocated in the landscape will influence thepotential for delivery of biodiversity benefit; moreopportunities are expected where there is congruencebetween high carbon and biodiversity stocks (Strassburget al. 2010). There are strong synergies between carbonand biodiversity at the global level (Strassburg et al.2010). National scale analyses, particularly important forplanning REDD+ as an intergovernmental mechanism(Gardner et al. 2012), have been variable in qualityand provide ambiguous results. National-level analyses(Madagascar and Bolivia) with finer scale biodiversity
data show little congruence between the two orbetween carbon and biodiversity (Wendland et al.2010; Sangermano et al. 2012). However, the additionalgains from REDD+ for carbon, biodiversity, and otherecosystem services depend on spatially specific threats ofdeforestation and forest degradation (Busch & Grantham2013), few, if any, analyses have included both spatialcongruence and deforestation threat.
Indonesia is the third largest tropical forest country,a major contributor to global greenhouse gas emissionsfrom deforestation, forest and peat degradation (Margonoet al. 2014), and a mega-biodiversity country (Sodhi et al.2004). Indonesia has made commitments to reduce emis-sions (GOI 2012) and received significant donor fundingfor REDD+ implementation (Brockhaus et al. 2012). Weassessed the distribution of biodiversity in Indonesia, us-ing species ranges of terrestrial vertebrates (mammals,birds, reptiles, and amphibians) and species distributionmodels (SDMs) covering 8 plant families which are avail-able for Sundaland only. We explored the congruencebetween carbon and biodiversity based on 3 measuresof richness. We then assessed the location of REDD+projects relative to deforestation threats and spatially de-termined potential for these to deliver positive outcomesfor carbon and biodiversity.
Methods
Data
Our biodiversity analyses were based on recently updatedglobal species range data for the distribution of mammals,reptiles, and amphibians (IUCN 2012), birds (BirdLifeInternational and NatureServe 2012), and SDMs for 8 ma-jor plant families (Dipterocarpaceae, Ericaceae, Fagaceae,Lauraceae, Moraceae, Myristicaceae, Sapindaceae, andLeguminosae) in Sundaland. Details on the biodiversitydata sets we used are in Supporting Information.
Conservation BiologyVolume 00, No. 0, 2015

Murray et al. 3
We used newly available high-resolution carbon datasets for above ground biomass (AGB) (Baccini et al.2012) and soil organic carbon (SOC) up to 100 cm depth(Hiederer & Kochy 2012).
A database of active REDD+ projects in Indonesia wasdeveloped for the purpose of this research. We contactedall known REDD+ project developers in Indonesia viaemail to identify active projects, their central coordinates,and the project size. We achieved a 72% response rateand filled in gaps with best guesses based on availablegray literature and Web-based reports. We mappedthe location of individual projects based on knownproject boundaries (n = 22), district boundaries fordistrict level projects (n = 3), and circular boundariesfor projects for which we did not have exact boundaryinformation (n = 11). For the circular boundaries, wedrew a circle around the project centroid on the diameterof which was based on information about project areaprovided by project developers. See SupportingInformation for details on the REDD+ database.
The PA data set for Indonesia was obtained from thenewly updated World Database on PAs (IUCN & UNEP-WCMC 2013). We included PAs in categories I–VI andnationally recognized PAs without an IUCN category(280 in total).
We used the econometric model OSIRIS-Indonesia de-veloped by Busch et al. (2010) to predict deforestationin the absence of REDD+ carbon incentives. The modelpredicts deforestation based on estimated potential grossagricultural revenues and the cost of converting land fromforest to agriculture.
Analyses
Data sets were analyzed at 5 km × 5 km resolution in theWGS 1984 World Mercator projection. We clipped globaldata sets to the Indonesian Archipelago (total terrestrialland areas), which covers 79,555 terrestrial cells. (Sup-porting Information for additional information on thespatial analysis methods.)
Species distribution analyses were based on thepolygon vector ranges of 367 amphibian, 281 reptile,665 mammal, 1559 bird species, and SDMs of 1720 plantspecies. Following Wang et al. (2013), we calculatedspecies richness as the number of species range poly-gons that intersect each grid cell. We used 3 measures ofspecies richness: total species, threatened species, andrestricted range species.
Threatened species were those classified by the IUCN(2012) as critically endangered, endangered, and vulner-able. Restricted range species were species with a globalrange in the lowest quartile of their range class (Ormeet al. 2005; Grenyer et al. 2006). Species richness ofthreatened and restricted range species was analyzedonly for vertebrates. We identified the richest grid cells(hereafter hotspots [Orme et al. 2005]) for each richness
measure for vertebrates and plants (total richness forSundaland only). We explored the degree to whichhotspots overlapped when defined as the richest 10% ofcells and the effects of using different hotspot definitions(richest 5%, 10%, 15%, and 25%). We found thatregardless of the definition used, there was no overlapbetween hotspots identified based on different measuresof species richness. (Details in Supporting Information.)
Indonesian islands differ in size, isolation, topography,climate, and geology, which results in very different is-land mean biodiversity and carbon values. We thereforeinvestigated congruence at 3 levels—national and withinthe 5 major islands (Sumatra, Borneo, Papua, Sulawesi,and Java)—to investigate if national scale patterns areconsistent within islands. We selected AGB and SOC upto 100 cm depth based on findings that when congru-ence was evaluated at 3 soil depths (0, 30, and 100 cm),SOC depth had a clear effect on the congruence patterns,particularly in areas identified as carbon-rich peat swampforests (see Supporting Information).
Congruence between carbon and the 3 measures ofbiodiversity richness were assessed using Spearman’srank correlation coefficient; the effective degreesof freedom were corrected by the level of spatialautocorrelation in the data following Dutilleul (1993).We used hexagonal binning (an esthetic mappingtechnique that shows differences between data-rich anddata-sparse parts of the distribution) to visualize therelationship between carbon and biodiversity and fitteda generalized additive model with 95% CIs. All statisticalanalyses were carried out in R statistical software (RCore Team 2014). Congruence maps were developed inArcGis 10.1 with the RGB composite band tool.
We assessed the distance and overlap between REDD+projects (centroid) and PAs (polygon) with the nearfunction in ArcGIS 10.1. We explored the distributionof carbon and biodiversity in Indonesia for 3 categoriesof forested areas: REDD+ project areas, PAs, and otherunprotected forest (outside REDD+ projects and PAs).We defined forest as those pixels comprising mangrove,peat swamp forest, lowland forest, lower montane forest,upper montane forest, and plantation or regrowth as inMiettinen et al. (2012). We sampled 1000 random pointsfrom all 3 forest categories and compared the means ofthe 3 groups with analysis of variance followed by apost hoc Tukey’s honestly significant difference test todetermine categories that were significantly different.
The modeled deforestation data from OSIRIS-Indonesiaversion 1.5 showing predicted deforestation in the ab-sence of a REDD+ mechanism (Busch et al. 2010) wasexported into ArcGIS 10.1 and resampled to 25 km2
grid cells (from 9 km2). We calculated predicted defor-estation per hectare for all grid cells classed as forestin 2010. We extracted predicted deforestation values(percent) for each forested cell and reclassified theseinto 5 deforestation threat classes (very low to very
Conservation BiologyVolume 00, No. 0, 2015

4 The delivery of biodiversity benefits in REDD+
high) based on natural breaks. Using the zonal statis-tic function in ArcGIS, we calculated the proportion ofREDD+ project area, PAs, and unprotected forests thatfell into each deforestation class.
Limitations
Our analyses relied on available data sets, such as verte-brate vector range maps, which tend to overestimate thelikelihood of species occurrence. Some species will beabsent in fragments, logged forests, and recently defor-ested areas. We dealt with this by refining the speciesrange maps and confining our analyses to remaining for-est area-based on 2012 forest cover map, as suggested byJenkins et al. (2013). We also assumed that most speciespersist in logged or secondary forests based on the largebody of literature which supports this (e.g., Sitompulet al. 2013; Struebig et al. 2013; Edwards et al. 2014).Our projected deforestation threat was based on econo-metric modeling. The results are therefore a scenario-specific prediction of where threats are most likely tooccur given the defined model assumptions. The modelpredicts deforestation based on the conversion of forestland to agriculture.
Results
Patterns of Biodiversity Distribution
Patterns of potential species richness were highly variablefrom taxon to taxon and depended strongly on the rich-ness measure used. For total species richness, the high-est potential vertebrate species richness was in Sumatra;lower potential species richness was to the East of Wal-lace’s Line in Sulawesi and Papua (Fig. 1a). When bothplant and vertebrate data were combined (possible forSundaland only), the highest total richness shifted fromlowland Sumatra to lowland Kalimantan (Fig. 1d), and thenorthern tip of Kalimantan had the highest total potentialspecies richness (>1270 species in a single cell). Threat-ened vertebrate species richness was distributed differ-ently. The highest potential richness was concentratedin coastal lowlands of Sumatra and submontane regionsof Kalimantan (Fig. 1b), whereas Papua had the lowestpotential threatened species richness. Potential restrictedrange species richness was mostly concentrated in the up-lands (Java, Sulawesi, and Papua) and the smaller islandsof Buru, Seram, and Halmahera in the Wallacea ecore-gion (Fig. 1c). Richness patterns for individual taxa andmeasures of biodiversity are in Supporting Information.
Hotspots of biodiversity richness identified based ondifferent measures did not generally overlap, further em-phasizing that the identification of areas important forbiodiversity depended on the measure used (Fig. 1). Forexample, when hotspots were defined as the richest 10%
of cells, no cells were identified as hotspots for all 3 mea-sures of total species richness (vertebrates and plants).Supporting Information contains additional informationon the effects of using different hotspot definitions (5%,10%, 15%, and 25%).
Congruence between Carbon and Biodiversity
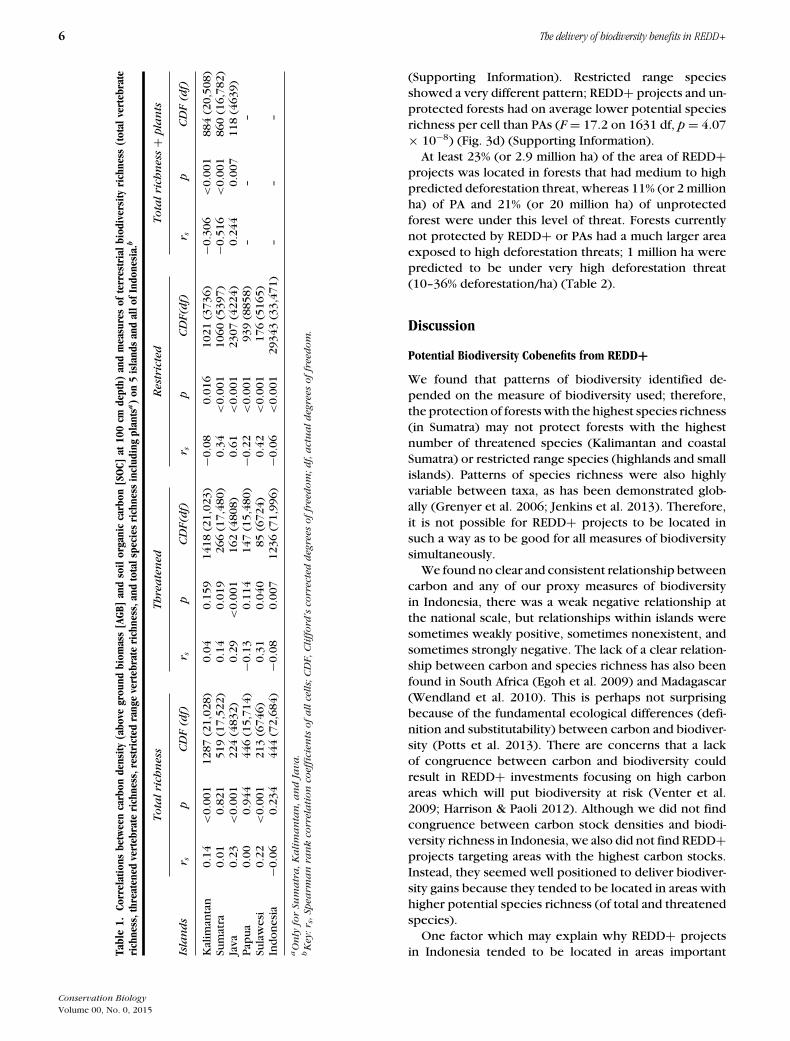
At the national scale, there was some evidence of a neg-ative relationship between organic carbon stock and all3 measures of terrestrial vertebrate richness (Table 1,Fig. 2). This negative relationship was significant at the5% level for threatened species richness and restrictedrange species richness but was not significant for totalspecies richness. However, this relationship did not holdwhen analyzed for islands independently (Table 1, Fig. 2).
The relationship between carbon density and totalspecies richness was either not significant or onlyweakly correlated for each of the major islands. Withthe inclusion of plants, results showed a strong negativerelationship between carbon and overall species richnessin Kalimantan (rs = −0.306, p < 0.001), and Sumatra(rs = −0.516, p < 0.001) (Table 1, Fig. 2d). This resultreflected the fact that peat swamp forests store verylarge amounts of carbon but do not have particularlyhigh overall plant species richness.
The relationship between carbon density and threat-ened species richness was neither strong nor monotonicin any of the 4 major islands (Table 1, Fig. 2b). The rela-tionship was strongest in Java, where the correlation wasbroadly positive (rs = 0.29, p < 0.001). Montane regionsof Kalimantan and Papua coincided with the highest con-centrations of restricted range vertebrate species (Fig 2c);however, these regions have relatively low carbon den-sities. Thus, a generally negative relationship betweencarbon and restricted range species richness was evidentin Kalimantan (rs = −0.075, p = 0.016) and Papua(rs = −0.222, p < 0.001) (Table 2, Fig. 2c). The oppositetrend was evident on Java (rs = 0.61, p < 0.001), wherethere was a nearly monotonic positive relationshipbetween carbon and restricted range vertebrate species(Table 2, Fig. 2c), both of which are confined toremaining upland forests. The relationship betweeneach measure of species richness and carbon was alsogreatly influenced by which taxa were included in theanalyses; for example, restricted range birds (rs = 0.636,p < 0.001) and mammals (rs = 0.49, p < 0.001) in Javahad strong positive correlation with carbon, whereasplants had a strong negative correlation with carbon inSumatra (Supporting Information).
Carbon, Biodiversity, and Deforestation Threat
We identified 36 active REDD+ projects in 15 provincesof Indonesia (25 projects reported as no longer active).Projects varied in size from site-level activities to those
Conservation BiologyVolume 00, No. 0, 2015

Murray et al. 5
Figure 1. The distribution in Indonesia of(a) total vertebrate species richness,(b) threatened vertebrate species richness,(c) species richness of restricted rangevertebrates, and (d) total species richnessof vertebrates and plants for Sundalandonly, and the location of species richhotspots (10% of richest cells) for thebiodiversity richness measures examined(a–d).
operating at the district or subprovince level. Over half(53%) of the project developers were conservation non-governmental organizations (NGOs), 33% were privatefor-profit organizations, and 17% were projects estab-lished in collaboration with the Indonesian governmentor bilateral agencies. At least 25% of REDD+ project cen-troids overlapped with the boundaries of PAs (SupportingInformation).
The REDD+ forests tended to have, on average, lowercarbon densities (mean = 433.5 t CO2/ha) than PAs(mean = 493.2 t CO2/ha) and unprotected forests in
Indonesia (mean = 447.6 t CO2/ha) (Fig. 3a). Mean car-bon density did not differ significantly between REDD+projects and unprotected forests (F = 17.39 on 2877 df,p = 3.1 × 10⁻⁸) (Supporting Information). The REDD+projects had significantly higher potential total verte-brate species richness (F = 130.2 on 2966 df, p = 2× 10⁻¹⁶) and threatened species richness (F = 152.2on 2930 df, p = 2 × 10⁻¹⁶) (Figs. 3b & 3c and Sup-porting Information). This relationship held true whenplants were included in the measures of potential speciesrichness (F = 16.35 on 2730 df, p = 8.77 × 10⁻⁸)
Conservation BiologyVolume 00, No. 0, 2015
6 The delivery of biodiversity benefits in REDD+
Tabl
e1.
Corr
elat
ions
betw
een
carb
onde
nsity
(abo
vegr
ound
biom
ass
[AGB
]an
dso
ilor
gani
cca
rbon
[SO
C]at
100
cmde
pth)
and
mea
sure
sof
terr
estr
ial
biod
iver
sity
rich
ness
(tot
alve
rteb
rate
rich
ness
,thr
eate
ned
vert
ebra
teri
chne
ss,r
estr
icte
dra
nge
vert
ebra
teri
chne
ss,a
ndto
tals
peci
esri
chne
ssin
clud
ing
plan
tsa)
on5
isla
nds
and
allo
fInd
ones
ia.b
Tota
lri
chn
ess
Th
rea
ten
edR
estr
icte
dTota
lri
chn
ess+
pla
nts
Isla
nds
r sp
CD
F(d
f)r s
pC
DF(
df)
r sp
CD
F(df)
r sp
CD
F(d
f)
Kal
iman
tan
0.14
<0.
001
1287
(21,
028)
0.04
0.15
914
18(2
1,02
3)−0
.08
0.01
610
21(3
736)
−0.3
06<
0.00
188
4(2
0,50
8)Su
mat
ra0.
010.
821
519
(17,
522)
0.14
0.01
926
6(1
7,48
0)0.
34<
0.00
110
60(5
397)
−0.5
16<
0.00
186
0(1
6,78
2)Ja
va0.
23<
0.00
122
4(4
832)
0.29
<0.
001
162
(480
8)0.
61<
0.00
123
07(4
224)
0.24
40.
007
118
(463
9)P
apu
a0.
000.
944
446
(15,
714)
−0.1
30.
114
147
(15,
480)
−0.2
2<
0.00
193
9(8
858)
––
–Su
law
esi
0.22
<0.
001
213
(674
6)0.
310.
040
85(6
724)
0.42
<0.
001
176
(516
5)In
do
nes
ia−0
.06
0.23
444
4(7
2,68
4)−0
.08
0.00
712
36(7
1,99
6)−0
.06
<0.
001
2934
3(3
3,47
1)–
––
aO
nly
for
Sum
atr
a,K
ali
ma
nta
n,a
nd
Java
.bK
ey:r
s,Sp
earm
an
ran
kco
rrel
ati
on
coef
fici
ents
of
all
cells;
CD
F,C
liff
ord
’sco
rrec
ted
deg
rees
of
free
dom
;df,
act
ua
ldeg
rees
of
free
dom
.
(Supporting Information). Restricted range speciesshowed a very different pattern; REDD+ projects and un-protected forests had on average lower potential speciesrichness per cell than PAs (F = 17.2 on 1631 df, p = 4.07× 10⁻⁸) (Fig. 3d) (Supporting Information).
At least 23% (or 2.9 million ha) of the area of REDD+projects was located in forests that had medium to highpredicted deforestation threat, whereas 11% (or 2 millionha) of PA and 21% (or 20 million ha) of unprotectedforest were under this level of threat. Forests currentlynot protected by REDD+ or PAs had a much larger areaexposed to high deforestation threats; 1 million ha werepredicted to be under very high deforestation threat(10–36% deforestation/ha) (Table 2).
Discussion
Potential Biodiversity Cobenefits from REDD+We found that patterns of biodiversity identified de-pended on the measure of biodiversity used; therefore,the protection of forests with the highest species richness(in Sumatra) may not protect forests with the highestnumber of threatened species (Kalimantan and coastalSumatra) or restricted range species (highlands and smallislands). Patterns of species richness were also highlyvariable between taxa, as has been demonstrated glob-ally (Grenyer et al. 2006; Jenkins et al. 2013). Therefore,it is not possible for REDD+ projects to be located insuch a way as to be good for all measures of biodiversitysimultaneously.
We found no clear and consistent relationship betweencarbon and any of our proxy measures of biodiversityin Indonesia, there was a weak negative relationship atthe national scale, but relationships within islands weresometimes weakly positive, sometimes nonexistent, andsometimes strongly negative. The lack of a clear relation-ship between carbon and species richness has also beenfound in South Africa (Egoh et al. 2009) and Madagascar(Wendland et al. 2010). This is perhaps not surprisingbecause of the fundamental ecological differences (defi-nition and substitutability) between carbon and biodiver-sity (Potts et al. 2013). There are concerns that a lackof congruence between carbon and biodiversity couldresult in REDD+ investments focusing on high carbonareas which will put biodiversity at risk (Venter et al.2009; Harrison & Paoli 2012). Although we did not findcongruence between carbon stock densities and biodi-versity richness in Indonesia, we also did not find REDD+projects targeting areas with the highest carbon stocks.Instead, they seemed well positioned to deliver biodiver-sity gains because they tended to be located in areas withhigher potential species richness (of total and threatenedspecies).
One factor which may explain why REDD+ projectsin Indonesia tended to be located in areas important
Conservation BiologyVolume 00, No. 0, 2015

Murray et al. 7
Figure 2. The relationship between biomass carbon (above ground biomass and soil organic carbon) andmeasures of terrestrial species richness: (a) total vertebrate richness, (b) threatened vertebrate richness,(c) restricted range vertebrate richness, and (d) total vertebrate and plant richness (for Sundaland only) (species,number of species; carbon density units of measure, t CO2; 95% CI is displayed around the fitted general additivemodel; data for island graphs shown on a hexagonal grid shaded logarithmically from white to dark blue toindicate the degree of overplotting).
Conservation BiologyVolume 00, No. 0, 2015

8 The delivery of biodiversity benefits in REDD+
for biodiversity is that REDD+ development in Indone-sia has been spearheaded by conservation NGOs. Suchproject developers may be seeing REDD+ as a novelfunding stream for conservation rather than simply seek-ing to maximize potential carbon revenues. Our resultsfor Indonesia are consistent with findings from studiesin Tanzania (Lin et al. 2014) and Brazil (De Barros etal. 2014), which show evidence of REDD+ initiativesspatially targeting high biodiversity areas. The REDD+project areas may tend to have lower than average car-bon stock because remaining forests outside PAs havemostly been logged (Margono et al. 2014). We also foundthat many REDD+ projects in our sample are pursuingreforestation and forest restoration as their key projectactivities, we expect such projects with aims to enhanceforest carbon stock to be located in degraded or sec-ondary forests, with perhaps lower than average carboncontent.
Contribution of REDD+ to Conservation in PAs
Implementing REDD+ in PAs has been criticized as notbeing “additional” (Macdonald et al. 2011) because sup-posedly PAs are already conserved. However, given theunderfunding of many PAs worldwide, it could be arguedthat improved funding could result in additional gains(Macdonald et al. 2011). Despite their protected status,many PAs in Indonesia are under continuing threat; over12% of primary forest loss in Indonesia (2000–2012) islocated in PAs (Margono et al. 2014), and enforcementis lax (Gaveau et al. 2012). Similarly, we found that PAswere not completely spared from the threat of deforesta-tion; at least 11% (or >2 million ha) of PA area was inareas predicted to have medium to high deforestationthreat. We found evidence that REDD+ is indeed beingused to support conservation in Indonesia’s PAs; at least25% of REDD+ project boundaries overlapped with PAs(Supporting Information). If REDD+ funding could beused to increase the effectiveness of PAs, the benefits forbiodiversity could be large. The REDD+ projects locatedadjacent to current PAs could also play an important rolein softening the matrix, which would reduce the effectiveisolation of species in the PAs and improve populationviability (Jantz et al. 2014).
Priorities for Achieving Biodiversity Cobenefits with REDD+Peat swamp forests in Indonesia have global importancein climate mitigation and they are highly threatenedbecause they represent the last frontiers for productionof food, pulp, and biofuels (Posa et al. 2011). Recentfindings show that 43% (2.6 million ha) of primary forestloss in Indonesia (2000–2012) took place in peatlands,which have an overall increasing rate of loss greater thanlowland primary forests (Margono et al. 2014). A largenumber of REDD+ projects are located in carbon-rich Ta
ble
2.M
odel
edde
fore
stat
ion
inRE
DD+
proj
ecta
reas
,pro
tect
edar
eas,
and
unpr
otec
ted
fore
sts
inIn
done
sia
base
don
5de
fore
stat
ion
thre
atca
tego
ries
RE
DD
+a
rea
sP
rote
cted
are
as
Un
pro
tect
edfo
rest
Def
ore
sta
tion
/ha
(%)
Th
rea
tle
vel∗
Are
a(1
00
0s
ha
)M
ean
(%)
%of
are
aA
rea
(10
00
sh
a)
Mea
n(%
)%
of
are
aA
rea
(10
00
sh
a)
Mea
n(%
)%
of
are
a
0.00
02–0
.88
Ver
ylo
w64
430.
351
13,1
930.
271
44,9
750.
446
1.88
–2.1
3Lo
w32
801.
426
3408
1.5
1832
,063
1.4
332.
13–4
.55
Med
ium
2190
2.9
1717
482.
89
15,3
303.
016
4.55
–9.5
2H
igh
493
6.1
424
35.
91
3530
6.1
49.
52–3
6V
ery
hig
h17
012
.31
5312
.00.
312
1813
.11
∗ Def
ore
sta
tion
thre
at
cate
gory
isba
sed
on
na
tura
lbre
aks,
an
da
rea
(ha
)is
calc
ula
ted
ba
sed
on
the
nu
mber
of
cells
tha
tfa
lls
wit
hin
each
thre
at
cate
gory
.
Conservation BiologyVolume 00, No. 0, 2015

Murray et al. 9
(a) (b)
(c) (d)
tCO2/ha
Figure 3. Distribution of carbon and total, threatened, and restricted range vertebrate species richness in REDD+project areas (REDD+), protected areas (PA), and unprotected forests (Forest) in Indonesia (solid dot, mean;notches in bars, approximate 95% CI around the median value; letters above boxes, different letters showsignificant difference with Tukey honestly significant difference test). The analysis was of 1000 random samplepoints from each group.
Conservation BiologyVolume 00, No. 0, 2015

10 The delivery of biodiversity benefits in REDD+
peat swamp forests (Harrison & Paoli 2012). We alsofound this to be true; however, the total area covered bythese projects was much smaller than the area coveredby projects on mineral soils (Supporting Information).Highly threatened lowland forests, such as those in thelowlands of Borneo and Sumatra, should remain a priorityfor future REDD+ planning despite having below-averagecarbon content. Large expanses of selectively loggedforests in Indonesia are now degraded and under highthreat of conversion because these are prime agriculturelands where the Indonesian government intends tolocate future palm-oil plantations in an attempt todivert palm-oil development away from carbon-rich peatswamp forests and pristine mineral soil forests (Gingold2010). Margono et al. (2014) found that from 2000 to2012, 98% (15.8 million ha) of forest loss took place indegraded forests. However, even heavily logged forestscan be of high conservation value (Struebig et al. 2013).Meijaard and Sheil (2007) estimate that about 75% ofBornean orangutans (Pongo pygmaeus) live in loggingconcessions, and Sitompul et al. (2013) found that at least1.6 million ha of Sumatran elephant (Elephas maximussumatranus) habitat is in active logging concessions or inpreviously logged areas. These forests contain importantbiodiversity that would be reduced if they were loggedagain or cleared for oil palm or pulpwood plantations(Edwards et al. 2012). Opportunities for biodiversityin the REDD+ mechanism do not rely on the spatialcongruence between carbon and biodiversity alone.The REDD+ policies are important if biodiversityconservation is to be integrated into the national REDD+architecture (Phelps et al. 2012). Biodiversity-specificmanagement will need to be incorporated in theplanning, design, and implementation of REDD+ on theground (Martin et al. 2013) because protecting existingforest carbon stocks alone will not automatically protectother forest values (Huettner 2012).
Cost of Delivering Biodiversity Cobenefits in REDD+Our results show that first-generation REDD+ projects inIndonesia are not necessarily located in the highest threatareas. This is consistent with the findings of Cerbu et al.(2011), who showed that predicted future deforestationappeared to be less of a criteria among first-generationdevelopers for the location of REDD+ projects thanthe interests of NGOs or government agencies. EarlyREDD+ projects have built on prior forest managementapproaches, such as integrated conservation and devel-opment projects, as a springboard for REDD+ (Minang& van Noordwijk 2013) and a testing ground for proof ofconcept (Murdiyarso et al. 2012). The REDD+ projectsin our study are in the early stages of development andare operating largely from bilateral REDD+ funding. Asthe REDD+ mechanism develops, the conditions un-der which project location is selected will differ; the
non-colocation of carbon and biodiversity priority ar-eas in Indonesia highlights an important structural fea-ture which will affect the cost of delivering biodiversitycobenefits in future REDD+ projects.
It can be assumed, based on our findings, that REDD+projects located in forests most important for biodiversitywill cost more per unit of carbon delivered than thoselocated in high carbon forests because forests with thehighest biodiversity tend to have low carbon densities buthigh threat to future deforestation due to high agriculturerent (Busch et al. 2010). Our results show that expandingREDD+ in forest with the lowest deforestation threat(generally on cheaper land) will have low incrementalbenefits for both biodiversity and carbon. We recom-mend that future research explicitly assess the costs as-sociated with locating REDD+ projects in forests mostimportant for biodiversity conservation, in light of thelimited colocation between carbon and biodiversity wefound. A future regulatory mechanism is likely to focuson cost-effective delivery of carbon benefits and not thelarge-scale delivery of noncarbon benefits (Busch 2013).Biodiversity conservation in the context of REDD+ istherefore likely to require additional investment (Phelpset al. 2012). Options include the introduction of premi-ums for the delivery of biodiversity benefits (Dinersteinet al. 2013), to allow REDD+ credits to protect foreststhat are carbon priorities, and use of supplementaryfunds to protect biodiversity priority areas even whenthey exhibit low carbon content (Venter et al. 2013).It is an empirical question which of these strategieswould be more cost-effective under different contextualpreconditions.
We found that patterns of biodiversity varied stronglyamong taxa and depended on the measure of biodiver-sity. It would therefore not be possible to place REDD+projects in areas which are universally good for all mea-sures of biodiversity. In Indonesia carbon stocks cor-relate poorly with all measures of biodiversity both atthe national level and within major islands. However,REDD+ projects under development in Indonesia werelocated in areas with below-average carbon stock but rel-atively high biodiversity (according to most measures weused), possibly reflecting the prominent role of conser-vation NGOs in the development of these first-generationREDD+ projects. Although nearly one-quarter of REDD+project area was located where deforestation threat waspredicted to be relatively high, the majority of REDD+project area was not in highly threatened forests. Thislimits the opportunity to achieve the greatest benefitsfor both emissions reductions and biodiversity conserva-tion. The patterns of biodiversity, threat, and locationsof REDD+ projects in Indonesia suggest that biodiversitycobenefits could be achieved through REDD+ in Indone-sia, especially if future expansion focused on areas underhigh deforestation threat. As the world looks toward aglobal mechanism to address climate change to be agreed
Conservation BiologyVolume 00, No. 0, 2015

Murray et al. 11
upon at the 21st Conference of Parties in Paris at the endof 2015, our findings make an important contribution todebates surrounding the design of REDD+ to maximizethe potential for cobenefits. The realized benefits of anyREDD+ network will, of course, depend not only on thedesign and spatial planning but also on the effectivenessof interventions on the ground.
Acknowledgments
We acknowledge G. S. Leng from the Forest Research In-stitute of Malaysia (FRIM) and S. Lee from the SingaporeBotanical Gardens for their contributions to the plantSDM data. We are grateful to J. Busch for the modeleddeforestation (OSIRIS-Indonesia) data. We acknowledgethe Centre for Remote Imaging, Sensing and Processing(CRISP) for the 2010 land cover map of insular SoutheastAsia. R. G. acknowledges the Fell Fund of the Universityof Oxford. N. R. acknowledges the Netherlands ResearchCouncil NWO-ALW (grant 819.01.014). S.W. acknowl-edges the CGIAR’s Forests, Trees, and Agroforestry (FTA)program. J.P.M. and S.W. acknowledge the Centre of In-ternational Forestry Research’s (CIFOR) Global Compara-tive Study on REDD+ (GCS-REDD+), which they are affil-iated with. J.P.G.J. acknowledges NERC NE-K010220–1.J.P.M. is a PhD fellow supported by FONASO, a EuropeanUnion Joint Doctorate Degree Programme.
Supporting Information
Additional information on the biodiversity data set usedin the study (Appendix S1), spatial analysis methods (Ap-pendix S2), biodiversity distribution patterns (AppendixS3), effects of using different hotspot definitions and mea-sures of species richness (Appendix S4), and effects ofsoil organic carbon depth (Appendix S5), the REDD+project database for Indonesia (Appendix S6), sum-mary statistics for carbon and biodiversity distribution(Appendix S7), and the deforestation model (AppendixS8) are available online. The authors are responsible forthe content and functionality of these materials. Queries(other than absence of the material) should be directedto the corresponding authors.
Literature Cited
Alexander S, et al. 2011. Opportunities and challenges for ecologicalrestoration within REDD+. Restoration Ecology 19:683–689.
Baccini A, et al. 2012. Estimated carbon dioxide emissions from tropi-cal deforestation improved by carbon-density maps. Nature ClimateChange 2:182–185.
BirdLife International and NatureServe. 2012. Bird species distribu-tion maps of the world. BirdLife International, Cambridge, UKand NatureServe, Arlington, Virginia. Available from http://www.birdlife.org/datazone/info/spcdownload (accessed August 28,2012).
Brockhaus M, Obidzinski K, Dermawan A, Laumonier Y, Luttrell C.2012. An overview of forest and land allocation policies in Indonesia:Is the current framework sufficient to meet the needs of REDD plus?Forest Policy and Economics 18:30–37.
Busch J. 2013. Supplementing REDD+ with biodiversity payments: theparadox of paying for multiple ecosystem services. Land Economics89:655–675.
Busch J, and HS Grantham. 2013. Parks versus payments: reconcilingdivergent policy responses to biodiversity loss and climate changefrom tropical deforestation. Environmental Research Letters8:034028. Available from http://stacks.iop.org/1748–9326/8/i=3/a=034028?key=crossref.bd28aef72ab39567e8f17e6c0c8afe17(accessed February 2014).
Busch J, Lubowski R, Godoy F, Juhn D, Austin K, Hewson J, SteiningerM. 2010. Open source impacts of REDD+incentives spreadsheet– Indonesia (OSIRIS-Indonesia). Available from http://sp10.conservation.org/osiris/Documents/InstructionsfordownloadingOSIRIS-Indonesia.pdf (accessed January 16, 2014).
Cerbu GA, Swallow BM, Thompson DY. 2011. Locating REDD: A globalsurvey and analysis of REDD readiness and demonstration activities.Governing and Implementing REDD+ 14:168–180.
De Barros AE, Macdonald EA, Matsumoto MH, Paula RC, Nijhawan S,Malhi Y, Macdonald DW. 2014. Identification of areas in Brazil thatoptimize conservation of forest carbon, jaguars, and biodiversity.Conservation Biology 28:580–593.
Dinerstein E, et al. 2013. Enhancing conservation, ecosystem services,and local livelihoods through a wildlife premium mechanism. Con-servation Biology 27:14–23.
Dutilleul P. 1993. Modifying the t test for assessing the correlationbetween two spatial processes. Biometrics 49:305–314.
Edwards DP, Koh LP, Laurance WF. 2012. Indonesia’s REDD+ pact: Sav-ing imperilled forests or business as usual? Biological Conservation151:41–44.
Edwards DP, Tobias JA, Sheil D, Meijaard E, Laurance WF. 2014. Main-taining ecosystem function and services in logged tropical forests.Trends in Ecology and Evolution 29:511–520.
Egoh B, Reyers B, Rouget M, Bode M, Richardson DM. 2009. Spatialcongruence between biodiversity and ecosystem services in SouthAfrica. Biological Conservation 142:553–562.
Gardner TA, et al. 2012. A framework for integrating biodiversity con-cerns into national REDD+ programmes. Biological Conservation154:61–71.
Gaveau DLA, Curran LM, Paoli GD, Carlson KM, Wells P, Besse-Rimba A, Ratnasari D, Leader-Williams N. 2012. Examining pro-tected area effectiveness in Sumatra: importance of regula-tions governing unprotected lands. Conservation Letters 5:142–148.
Gingold BRI. 2010. Degraded land, sustainable palm oil, andIndonesia’s future. Available from http://www.wri.org/stories/2010/07/degraded-land-sustainable-palm-oil-and-indonesias- future(accessed October 14, 2013).
GOI. 2012. REDD+National strategy. Page 44. Indonesian REDD+ TaskForce, Jakarta, Indonesia. Available from http://www.unorcid.org/upload/doc_lib/IndonesiaREDD+NationalStrategy.pdf (accessedDecember 12, 2013).
Grenyer R, et al. 2006. Global distribution and conservation of rare andthreatened vertebrates. Nature 444:93–96.
Harrison ME, Paoli GaD. 2012. Managing the risk of biodiversity leak-age from prioritising REDD+ in the most carbon-rich forests: thecase study of peat-swamp forests in Kalimantan, Indonesia. TropicalConservation Science 5:426–433.
Hiederer R, Kochy M. 2012. Global soil organic carbon estimates andthe harmonized world soil database. EUR Scientific and TechnicalResearch series DOI: 10.2788/13267.
Huettner M. 2012. Risks and opportunities of REDD+ implementationfor environmental integrity and socio-economic compatibility. Envi-ronmental Science and Policy 15:4–12.
Conservation BiologyVolume 00, No. 0, 2015

12 The delivery of biodiversity benefits in REDD+
IUCN (International Union for Conservation of Nature). 2012.Red list of threatened species. Version 2012. Availablefrom http://www.iucnredlist.org/technical-documents/spatial-data(accessed August 2012).
IUCN and UNEP-WCMC. 2013. The world database on protectedareas (WDPA). Cambridge, UK: UNEP-WCMC. Available fromhttp://protectedplanet.net/ (accessed October 14, 2013).
Jantz P, Goetz S, Laporte N. 2014. Carbon stock corridors to mitigateclimate change and promote biodiversity in the tropics. Nature Cli-mate Change 4:138–142.
Jenkins CN, Pimm SL, Joppa LN. 2013. Global patterns of terrestrialvertebrate diversity and conservation. Proceedings of the NationalAcademy of Sciences of the United States of America 110:E2602–E2610.
Lin L, Sills E, Cheshire H. 2014. Targeting areas for reducing emissionsfrom deforestation and forest degradation (REDD+) projects in Tan-zania. Global Environmental Change 24:277–286.
Macdonald EA, Collins M, Johnson PJ, Clayton LM, Malhi Y, FisherJB, Milner-Gulland EJ, Macdonald DW. 2011. Wildlife conserva-tion and reduced emissions from deforestation in a case studyof Nantu National Park, Sulawesi. 1. The effectiveness of forestprotection—many measures, one goal. Environmental Science andPolicy 14:697–708.
Margono BA, Potapov PV, Turubanova S, Stolle F, Hansen MC. 2014. Pri-mary forest cover loss in Indonesia over 2000–2012. Nature ClimateChange 4:730–735.
Martin PA, Newton AC, Bullock JM. 2013. Carbon pools recovermore quickly than plant biodiversity in tropical secondary forests.Proceedings. Biological Sciences/The Royal Society 280:2013–2236.
Meijaard E, Sheil D. 2007. A logged forest in Borneo is better than noneat all. Nature 446:974.
Miettinen J, Shi C, Tan WJ, Liew SC. 2012. 2010 land cover map ofinsular Southeast Asia in 250-m spatial resolution. Remote SensingLetters 3:11–20.
Minang Pa, van Noordwijk M. 2013. Design challenges for achieving re-duced emissions from deforestation and forest degradation throughconservation: leveraging multiple paradigms at the tropical forestmargins. Land Use Policy 31:61–70.
Murdiyarso D, Brockhaus M, Sunderlin WD, Verchot L. 2012. Somelessons learned from the first generation of REDD+ activities. Cur-rent Opinion in Environmental Sustainability 4:678–685.
Orme CDL, et al. 2005. Global hotspots of species richness arenot congruent with endemism or threat. Nature 436:1016–1019.
Phelps J, Webb EL, Adams WM. 2012. Biodiversity co-benefits of policiesto reduce forest-carbon emissions. Nature Climate Change 2:497–503.
Posa MRC, Wijedasa LS, Corlett RT. 2011. Biodiversity and conservationof tropical peat swamp forests. BioScience 61:49–57.
Potts MD, Kelley LC, Doll HM. 2013. Maximizing biodiversity co-benefitsunder REDD+: a decoupled approach. Environmental Research Let-ters 8:024019(5pp).
R Core Team. 2014. R: A language and environment for statistical com-puting. R Core Development Team, Vienna.
Raes N, Saw LG, van Welzen PC, Yahara T. 2013. Legume diversityas indicator for botanical diversity on Sundaland, South East Asia.South African Journal of Botany 89:265–272.
Sangermano F, Toledano J, Eastman JR. 2012. Land cover change in theBolivian Amazon and its implications for REDD plus and endemicbiodiversity. Landscape Ecology 27:571–584.
Sitompul AF, Griffin CR, Rayl ND, Fuller TK. 2013. Spatial and temporalhabitat use of an Asian elephant in Sumatra. Animals 3:670–679.
Sodhi NS, Koh LP, Brook BW, Ng PKL. 2004. Southeast Asian biodi-versity: an impending disaster. Trends in Ecology and Evolution19:654–660.
Strassburg BBN, et al. 2010. Global congruence of carbon storage andbiodiversity in terrestrial ecosystems. Conservation Letters 3:98–105.
Struebig MJ, Turner A, Giles E, Lasmana F, Tollington S, Bernard H, BellD. 2013. Quantifying the biodiversity value of repeatedly logged rain-forests: gradient and comparative approaches from Borneo. Pages183–224 in Woodward G, O´Gorman EJ, editors. Global changein multispecies systems: part 3 advances in ecological research.Academic Press, United Kingdom.
UNFCCC. 2008. Report of the conference of the parties on its 13thsession, 2007. Part two: action taken by the conference of the par-ties at its 13th session decisions adopted by the conference of theparties:1–60. Bali, Indonesia.
Venter O, Koh LP. 2011. Reducing emissions from deforestation andforest degradation (REDD+): Game changer or just another quickfix? Annals of the New York Academy of Sciences 1249:137–150.
Venter O, Laurance WF, Iwamura T, Wilson KA, Fuller RA, and Possing-ham HP. 2009. Harnessing carbon payments to protect biodiversity.Science 326:1368.
Venter O, Hovani L, Bode M, Possingham H. 2013. Acting optimally forbiodiversity in a world obsessed with REDD+. Conservation Letters6:410–417.
Wang YC, Srivathsan A, Feng CC, Salim A, Shekelle M. 2013. Asian pri-mate species richness correlates with rainfall. PLOS ONE 8 (e54995–e54995) DOI: 10.1371/journal.pone.0054995.
Wendland KJ, Honzak M, Portela R, Vitale B, Rubinoff S, RandrianarisoaJ. 2010. Targeting and implementing payments for ecosystem ser-vices: opportunities for bundling biodiversity conservation withcarbon and water services in Madagascar. Ecological Economics69:2093–2107.
Conservation BiologyVolume 00, No. 0, 2015