spatial and temporal patterns of mineralization rates and oxygen distribution in a permeable...
TRANSCRIPT
Spatial and Temporal Patterns of Mineralization Rates and Oxygen Distribution in a PermeableIntertidal Sand Flat (Sylt, Germany)Author(s): Ursula Werner, Markus Billerbeck, Lubos Polerecky, Ulrich Franke, MarkusHuettel, Justus E. E. van Beusekom and Dirk de BeerSource: Limnology and Oceanography, Vol. 51, No. 6 (Nov., 2006), pp. 2549-2563Published by: American Society of Limnology and OceanographyStable URL: http://www.jstor.org/stable/4499638 .
Accessed: 15/06/2014 17:34
Your use of the JSTOR archive indicates your acceptance of the Terms & Conditions of Use, available at .http://www.jstor.org/page/info/about/policies/terms.jsp
.JSTOR is a not-for-profit service that helps scholars, researchers, and students discover, use, and build upon a wide range ofcontent in a trusted digital archive. We use information technology and tools to increase productivity and facilitate new formsof scholarship. For more information about JSTOR, please contact [email protected].
.
American Society of Limnology and Oceanography is collaborating with JSTOR to digitize, preserve andextend access to Limnology and Oceanography.
http://www.jstor.org
This content downloaded from 195.34.79.223 on Sun, 15 Jun 2014 17:34:27 PMAll use subject to JSTOR Terms and Conditions
Limnol Oceanogr., 51(6), 2006, 2549-2563
? 2006, by the American Society of Limnology and Oceanography, Inc.
Spatial and temporal patterns of mineralization rates and oxygen distribution in a permeable intertidal sand flat (Sylt, Germany)
Ursula Werner, 1 Markus Billerbeck, Lubos Polerecky, Ulrich Franke, and Markus Huettel2 Max Planck Institute for Marine Microbiology, Celsiusstrasse 1, 28359 Bremen, Germany
Justus E. E. van Beusekom Alfred Wegener Institute for Polar and Marine Research/Wadden Sea Station Sylt, HafenstraBe 43, 25992 List, Germany
Dirk de Beer Max Planck Institute for Marine Microbiology, Celsiusstrasse 1, 28359 Bremen, Germany
Abstract
Oxygen distribution and benthic mineralization rates were investigated in a permeable intertidal sand flat (permeability: 3.9 x 10⁻¹¹ m2) in a transect from the low toward the high waterline. At all stations, oxygen penetrated several millimeters to centimeters into the sediments during inundation because of pore-water advection. The wave- and current-driven deep oxygen penetration caused high oxygen consumption rates (OCRs) and high aerobic mineralization rates at all stations. Because oxygen penetration was enhanced during inundation, 71-90% of the daily oxygen consumption took place in that period. OCRs and sulfate reduction rates (SRRs) changed with inundation time of the stations, emphasizing the importance of pore-water advection for benthic mineralization: OCRs were elevated at the lower flat in summer (lower flat 131-187; middle and upper flat 64-108 mmol C m-2 d-1). SRRs increased sharply from the high to the low waterline during all seasons (e.g., in summer: lower flat 18-40; middle flat 8.8-9.4, upper flat 0.5-4 mmol C m-2 d-1). A one-dimensional model of the advective organic matter supply to the sediment could only explain a fraction of the organic carbon required for benthic mineralization. This suggests that either transport of particles via the seawater is more efficient than the one-dimensional concept can explain or that additional carbon was supplied through other sources (e.g., benthic photosynthesis). Mineralization rates were higher in summer than in winter. Only in summer did sulfate reduction contribute >20% to total mineralization.
Permeable sandy sediments are relatively poor in organic carbon and were for a long time considered biological deserts (Boudreau et al. 2001). More recent research has shown that sands can have high mineralization rates, with rates being similar to those in organic-rich, cohesive sediments (Andersen and Helder 1987; Cammen 1991; Huettel and Gust 1992).
An important source of organic carbon and oxygen in shallow-water sediments is benthic photosynthesis (Cam- men 1991; Berninger and Huettel 1997). However, the
magnitude and depth distribution of benthic mineralization processes depend also to a large extent on the transport of electron acceptors and electron donors from the water column to the sediment and from the sediment surface to deeper sediment layers (Aller and Aller 1998; Huettel et al. 2003). In cohesive sediments, the main transport occurs by diffusion and by faunal activity (bioturbation/bioirriga- tion). In permeable sediments, pore-water advection is an additional interfacial exchange mechanism (Huettel and Gust 1992; Shum 1992) that can exceed diffusive solute transport rates by orders of magnitude (Boudreau et al. 2001). Pore-water advection is considered the major reason for high mineralization rates in sands (Webb and Theodor 1968; Shum and Sundby 1996; Huettel and Rusch 2000) because it provides solutes such as oxygen (Forster et al. 1996; Ziebis et al. 1996) and particulate organic carbon (POC; Rusch and Huettel 2000; Ehrenhauss and Huettel 2004) to the sediments while removing potentially in- hibitory end products of mineralization processes. Because of deep oxygen penetration, aerobic mineralization was found to be the dominant mineralization process in permeable sediments (D'Andrea et al. 2002; de Beer et al. 2005).
The flow rate of fluids in permeable sediments is proportional to the pressure gradient driving the flow and to sediment permeability (Darcy 1856). In an inundated intertidal sand, flat pore-water advection is driven by pressure gradients caused by the interaction of tidal and
1 Corresponding author ([email protected]). 2 Present address: Department of Oceanography, Florida State
University, West Call Street, Tallahassee, Florida 32306-4320.
Acknowledgments We thank Martina Alisch, Christiane Hueerkamp, and
Kyriakos Vamvakopoulos for support during fieldwork. Gabriele Eickert, Ines Schr6der, Karin Hohmann, Ingrid Dohrmann, and Cecilia Wiegand are thanked for making the sensors and for their help. Volker Meyer, Paul Firber, Harald Osmers, Alfred Kutsche, and Georg Herz are acknowledged for their technical help. Felix Janssen and Perran Cook are thanked for discussion. The valuable comments of two reviewers are much appreciated. We also thank the staff of the Wadden Sea Station on Sylt (Alfred Wegener Institute) for their support and hospitality. Thomas Krieger of Wasser- und Schifffahrtsamt T6nning-Gewdisserkunde is acknowledged for the permission to use Sylt tide gauge data.
This study was financed by the Max Planck Society (MPG), Germany.
2549
This content downloaded from 195.34.79.223 on Sun, 15 Jun 2014 17:34:27 PMAll use subject to JSTOR Terms and Conditions
2550 Werner et al.
wind-/wave-driven currents with sediment topography (Huettel and Gust 1992; Precht and Huettel 2003) or by density changes (Webster et al. 1996; Rocha 1998). When an intertidal sand flat is exposed, pore-water flow can occur as drainage, driven by a hydraulic gradient developing between the seawater level and the slower dropping pore- water level (Nielsen 1990). Thus, advective exchange can vary over the tidal cycle. The advective supply of oxygen and organic matter from the water column should, therefore, be proportional to the inundation time of the sediment and, thus, to the distance to the low waterline. This should lead to a spatial heterogeneity in mineraliza- tion rates, with rates increasing toward the low waterline.
Field studies on transport and mineralization rates in permeable intertidal sediments (Rusch and Huettel 2000; D'Andrea et al. 2002; de Beer et al. 2005) are rare because the dynamic nature of permeable sediments complicates in situ measurements (Reimers et al. 2004). Pore-water advection was shown to cause deepest oxygen penetration during the inundation period in an intertidal flat in the North Sea (de Beer et al. 2005), whereas air intrusion during exposure caused deepest oxygen penetration in an intertidal flat in southern Portugal (Brotas et al. 1990). The importance of the advective organic carbon supply for benthic mineralization was stressed in an in situ study that found the advectively supplied organic carbon to be in balance with the organic carbon mineralized in the sediments (Rusch and Huettel 2000).
In this study, we investigate the influence of pore-water advection on mineralization rates and sediment oxygena- tion in an intertidal sand flat. The central objective was to assess whether different inundation times lead to spatial and temporal patterns of oxygen distribution and miner- alization rates across the intertidal sand flat. To that end, we measured during different seasons oxygen distribution dynamics, sediment oxygen consumption, and sulfate reduction rates (SRRs) at three stations along a transect stretching from the high waterline toward the low waterline.
Materials and methods
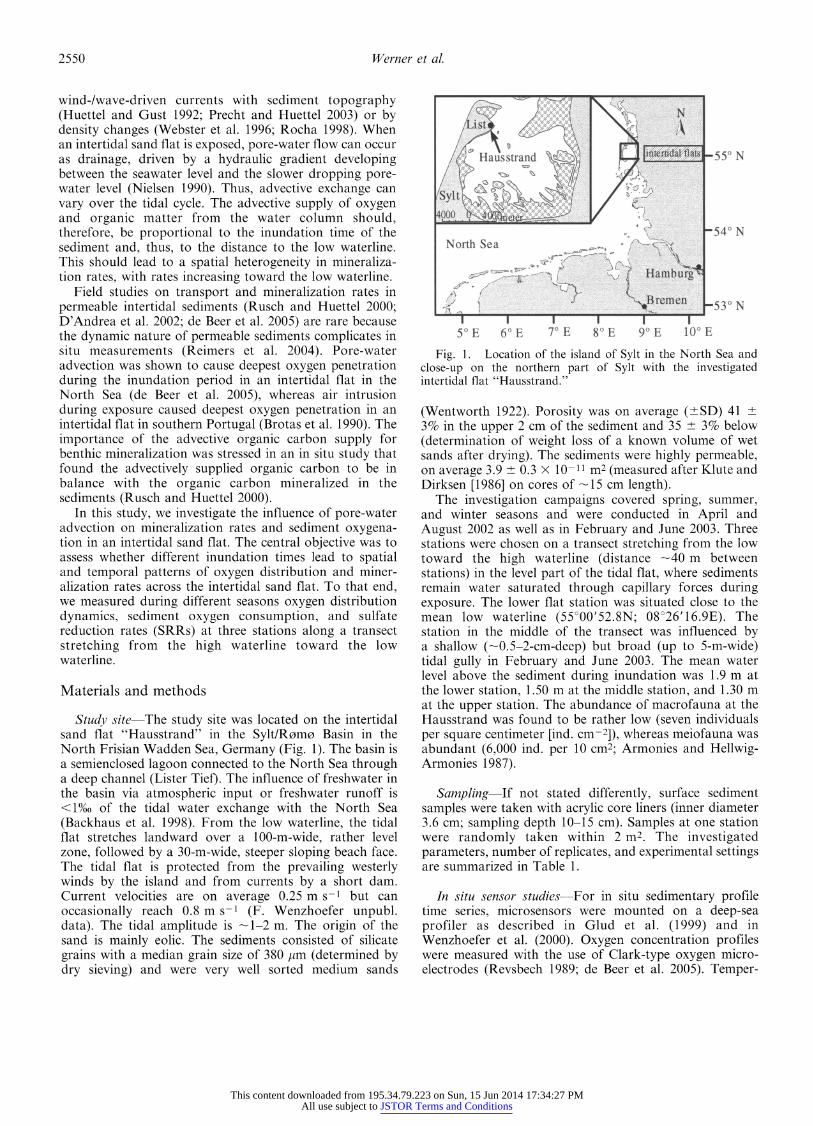
Study site-The study site was located on the intertidal sand flat "Hausstrand" in the Sylt/Romo Basin in the North Frisian Wadden Sea, Germany (Fig. 1). The basin is a semienclosed lagoon connected to the North Sea through a deep channel (Lister Tief). The influence of freshwater in the basin via atmospheric input or freshwater runoff is <1%o of the tidal water exchange with the North Sea (Backhaus et al. 1998). From the low waterline, the tidal flat stretches landward over a 100-m-wide, rather level zone, followed by a 30-m-wide, steeper sloping beach face. The tidal flat is protected from the prevailing westerly winds by the island and from currents by a short dam. Current velocities are on average 0.25 m s-1 but can occasionally reach 0.8 m s-1 (F. Wenzhoefer unpubl. data). The tidal amplitude is - 1-2 m. The origin of the sand is mainly eolic. The sediments consisted of silicate grains with a median grain size of 380
/m (determined by dry sieving) and were very well sorted medium sands
% N ist
0 e
SHausstrand - 55 N
Sylt d
4000
540 N
North Sea
L
Hambur g
;f
Bremen 53 N S6 E 8 9530 N
5o0 E 60 E 70 E 80 E 90 E 100 E
Fig. 1. Location of the island of Sylt in the North Sea and close-up on the northern part of Sylt with the investigated intertidal flat "Hausstrand."
(Wentworth 1922). Porosity was on average (__SD)
41 ?
3% in the upper 2 cm of the sediment and 35 ? 3% below (determination of weight loss of a known volume of wet sands after drying). The sediments were highly permeable, on average 3.9 + 0.3 x 10⁻¹¹ m2 (measured after Klute and Dirksen [1986] on cores of -15 cm length).
The investigation campaigns covered spring, summer, and winter seasons and were conducted in April and August 2002 as well as in February and June 2003. Three stations were chosen on a transect stretching from the low toward the high waterline (distance -40 m between stations) in the level part of the tidal flat, where sediments remain water saturated through capillary forces during exposure. The lower flat station was situated close to the mean low waterline (55000'52.8N; 08026'16.9E). The station in the middle of the transect was influenced by a shallow (-0.5-2-cm-deep) but broad (up to 5-m-wide) tidal gully in February and June 2003. The mean water level above the sediment during inundation was 1.9 m at the lower station, 1.50 m at the middle station, and 1.30 m at the upper station. The abundance of macrofauna at the Hausstrand was found to be rather low (seven individuals per square centimeter [ind. cm-2]), whereas meiofauna was abundant (6,000 ind. per 10 cm2; Armonies and Hellwig- Armonies 1987).
Sampling-If not stated differently, surface sediment samples were taken with acrylic core liners (inner diameter 3.6 cm; sampling depth 10-15 cm). Samples at one station were randomly taken within 2 m2. The investigated parameters, number of replicates, and experimental settings are summarized in Table 1.
In situ sensor studies-For in situ sedimentary profile time series, microsensors were mounted on a deep-sea profiler as described in Glud et al. (1999) and in Wenzhoefer et al. (2000). Oxygen concentration profiles were measured with the use of Clark-type oxygen micro- electrodes (Revsbech 1989; de Beer et al. 2005). Temper-
This content downloaded from 195.34.79.223 on Sun, 15 Jun 2014 17:34:27 PMAll use subject to JSTOR Terms and Conditions
Mineralization patterns in a sand flat 2551
Table 1. Overview of investigated parameters per station for the four investigation campaigns. Numbers in parentheses identify number of replicate sediment cores or seawater samples taken for analysis. Number in square brackets for water column current velocities and pore-water flow velocities identify the number of inundation or exposure periods, respectively, for which measurements were made. For additional details, see text.
Parameter April 2002 August 2002 February 2003 June 2003
In situ 02 All All All All OCRs MF(3) LF, MF(1); UF(2) A11(3-4) A11(3) SRRs A11(3) A1(3) All(2) All(3) Incub. T ('C) 10 20 2 18 Porosity All(2) A11(3) A11(2) Grain sizes All(2) A11(2) A1(2) Permeability LF, MF(2*) MF(3*) TOC (sed.) A11(2) A11(2-3) All(2) All(2) PW solutes LF, MF(3t) LF, MF(3t); UF(2) LF, MF(3t); UF(2) All(1) SW sol./POC (3) (4) (4) (3) Water column current velocity LF, MF [2] MF [2] Pore-water flow velocity during exposure at sediment depth (cm)
2 - MF, LF [2-3] 5 - MF [3]
10 - MF [1] Macrofauna MF(3)
All, all stations; LF, lower flat station; MF, middle flat station; UF, upper flat station; Incub. T, incubation temperature for OCRs and SRRs; PW solutes, pore-water solutes (DOC, nutrients, sulfate, salinity); SW sol./OC, seawater column solutes and particulate organic matter.
* Four different pressure heads were applied per replicate core. t Five or six cores pooled per replicate; replicates taken at three time points over the tidal cycle.
ature was measured with a Pt100 electrode (Umweltsen- sortechnik, Germany); the sediment surface was monitored with a resistivity sensor. Time series of downward profiles were continuously measured over several tidal cycles (up to 56 h). Each profile was recorded within 25-35 min. A pause of 5 min between profiles reduced sediment distur- bance by the intruding microsensors.
Oxygen consumption rates-Potential volumetric oxygen consumption rates (pOCRs) were measured in the labora- tory on freshly collected intact sediment cores as described previously (de Beer et al. 2005; Polerecky et al. 2005). This method derives the local pOCRs from the decrease of oxygen in time after stopping air-saturated water flow through the core. Oxygen was monitored with microsensors (April 2002) or planar oxygen optodes (all other cam- paigns). The oxygen microsensor was successively posi- tioned at various depths within the sediments to obtain pOCR profiles with depth intervals of 2 mm (0-3-cm depth) to 5 mm (below the 3-cm depth). For the assessment of pOCR with planar optodes, we used rectangular stainless steel cores (inner dimensions 70 x 75 mm, height 250 mm). The planar optode technique allowed the calculation of pOCR with a resolution of -300 ~m (optode area -25 x 150 mm; resulting oxygen image size 80 x 480 pixels). Experiments were conducted at the average in situ temperature (Table 1).
To obtain areal OCR, the pOCR were integrated over the oxygen penetration depths as obtained from the in situ oxygen profile time series (de Beer et al. 2005). We assumed pOCR to follow zero-order kinetics with respect to oxygen (Thamdrup et al. 1998). For the assessment of daily areal
OCR, oxygen penetration depths measured over full tidal cycles were used.
Sulfate reduction rates-Volumetric SRRs were mea- sured with the whole core 35SO 2- radiotracer incubation method (Jorgensen 1978) modified for permeable sediments (de Beer et al. 2005). Radiolabeled 35SO2- (Amersham) was added to 70 mL of ambient seawater to a specific activity of 340 MBq mol-1 SO 2-. The anoxic seawater tracer solution was percolated into the core within 2 min. After incubation of 4-6 h at the average in situ temperature (Table 1), the incubation was terminated by transferring the sediments into 20% ZnAc (sectioned with 1-cm depth resolution). Samples were processed by the cold chromium distillation procedure (Kallmeyer et al. 2004). Radioactivity of 35SO2- and total reduced inorganic sulfur was de- termined with a liquid scintillation counter (Packard 2500 TR) with the use of Lumasafe Plus (Lumac BV, Holland) scintillation cocktail. Because the SRRs were assessed without an effect of advectively supplied oxygen on SRRs, the volumetric SRRs are considered potential SRRs (pSRRs). In the field, deep oxygen penetration might lower SRRs. Therefore, we considered pSRRs integrated over the entire sampling depth as a maximum estimation of depth- integrated SRRs. To obtain a minimum estimation of depth-integrated SRRs, we integrated pSRRs over only the anoxic sediment depths as deduced from the in situ oxygen measurements.
Aerobic mineralization rates-Aerobic mineralization rates were calculated by subtracting depth-integrated SRRs (expressed in equivalents of oxygen used for the oxidation
This content downloaded from 195.34.79.223 on Sun, 15 Jun 2014 17:34:27 PMAll use subject to JSTOR Terms and Conditions
2552 Werner et al.
of sulfides produced to sulfate) from the OCRs. We regarded sulfate reduction to be the most important anaerobic respiration process; other anaerobic processes were not considered.
Bottom water filtration rates-Bottom water filtration rates (L m-2 d-1) during inundation were estimated from in situ oxygen penetration depths and pOCR data (Pole- recky et al. 2005) according to
Vf
za
OCR(z)dz x (co - Cza)1 fo
where vf is the flow rate (L m-2 h-1), Ja OCR(z)dz is OCRs (mol m-2 h-1) integrated over the sediment depth (za) where oxygen transport is dominated by pore-water advection (i.e., deduced from oxygen profiles, the zone za, where diffusion is negligible, is - 1.5-3.5 mm shallower than the oxygen penetration depth), co is the oxygen concentration in the overlying water (mol L-1), and cza is oxygen concentration at depth Za. With this approach, only the vertical component of the water flow is estimated. The amount of organic carbon that is transferred to the sediments by bottom water filtration was estimated from the bottom water filtration rates and the POC content of the water column.
Water column current velocities-Water currents 5 cm above the seafloor were measured with a Nortek Acoustic Doppler velocimeter (ADV).
Pore-water flow velocity-Pore-water flow velocities were measured with a modification of the method described in Precht and Huettel (2004). The passage of a fluorescent dye tracer (Fluorescein, 100 mg L-1) through the sedi- ments was followed by six optical glass fiber sensors (tip diameter 140 jm, Radiall) fixed to a plane wire mesh with a distance of 6 mm between sensors. The average pore- water flow velocity was calculated from the time interval between the geometric centroids of the signal curves at consecutive sensors. During exposure, a small incision was cut into the sediment to the desired depth (see Table 1), and the optical fibers were carefully inserted several centimeters into the undisturbed part of the sediment. After rebuilding the sediment surface, 1 mL of the dye solution was injected into the sediments at the depth of the sensors through a syringe needle that was fixed to the upstream end of the mesh. The sensor array orientation was parallel to the sediment surface and roughly perpendicular to the low waterline, with the first sensor (near the dye injection) positioned toward the upper flat and the last sensor toward the low waterline. Other orientations did not show any measurable pore-water flow. During inundation, the sensor array was carefully pushed into the sediments by a diver and positioned first parallel to the sediment surface at 2-cm depth, with the sensor tips arranged along the main current direction. The dye was injected near the first sensor that was positioned toward the upstream direction of the current flow. To measure vertical flow below ripple troughs, we also inserted the sensor array vertically in
relation to the sediment surface (dye injection near the sediment surface).
Sedimentary total organic carbon and pore-water solutes- Sediment samples (1-cm depth intervals) for the analysis of total organic carbon (TOC) were freeze dried, ground, and acidified with 1 mol L-1 HCI to remove the inorganic carbon. TOC was determined with the use of a Heraeus CHNO rapid elemental analyzer with sulfanilamide as a calibration standard. Pore-water sulfate concentrations were determined as described in Ferdelman et al. (1997) with nonsuppressed ion chromatography and conductivity detection with a Waters IC-Pak anion exchange column (50 x 4.6 mm) and a Waters 430 conductivity detector. Salinity was measured with a refractometer.
Water column parameters-For the analysis of POC and suspended matter (SM), water was filtered on weighed and precombusted (6000C, 6 h) Whatman GF/F filters, rinsed with deionized water to remove the sea salts, and stored at -200C. POC was analyzed as described above for TOC. SM was determined by the weight differences of the empty and loaded dry filter. Water samples for the analysis of chlorophyll a (Chl a) were filtered through Whatman GF/C filters, extracted overnight in 90% acetone at 40C in the dark, and analyzed spectrophotometrically for Chl a con- tent according to Jeffrey and Humphrey (1975). Chl a samples were taken every 3-5 d within an annual sampling campaign.
Macrofauna-Samples for macrofaunal abundance were taken with plastic core liners (inner diameter 19 cm; sampling depth 15 cm) during exposure at the middle flat in August 2002. The samples were sieved through a 500-pm mesh. Animals were sorted and determined to species level with a stereo microscope. Individuals of Nereis diversicolor were divided into juveniles (<1 mm prostomium width) and adults. Abundance of Arenicola marina was determined by counting fecal mounds in randomly chosen quadrates (n = 10).
Results
General site description-The average daily inundation time was 7.5 h longer at the lower flat station than at the upper flat station (Table 2). Longest inundation times were recorded for all stations in June. The inundation times were calculated over a 4-week period, including the 3 weeks of the investigation campaigns (tide gauge list, with permission of Wasser- und Schifffahrtsamt T6n- ning, Germany). Highest average water temperatures were measured in August 2002 and lowest in February 2003 (Table 3). Sediment grain size distribution, poros- ity, and permeability did not vary between stations or seasons.
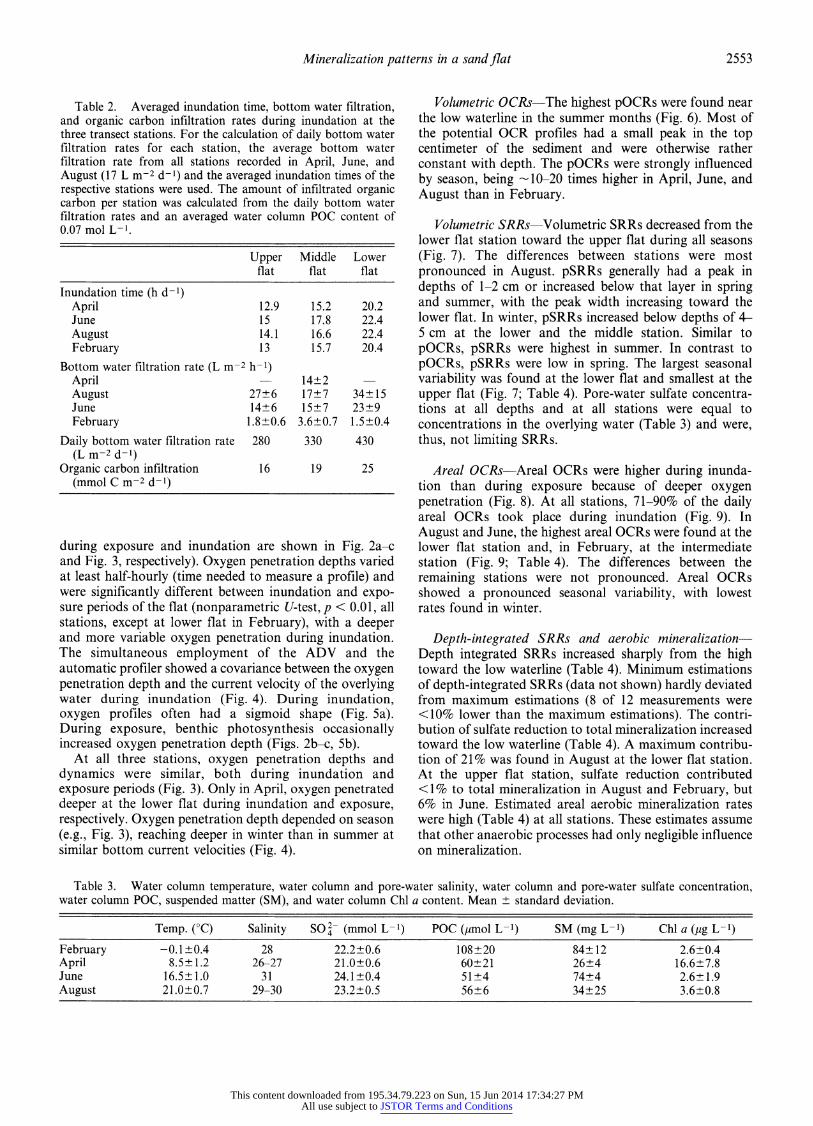
Oxygen penetration depth and dynamics-Oxygen pene- tration reached several millimeters to centimeters into the sediments at all stations (exemplary time series of oxygen profiles and summary of all oxygen penetration depths
This content downloaded from 195.34.79.223 on Sun, 15 Jun 2014 17:34:27 PMAll use subject to JSTOR Terms and Conditions
Mineralization patterns in a sand flat 2553
Table 2. Averaged inundation time, bottom water filtration, and organic carbon infiltration rates during inundation at the three transect stations. For the calculation of daily bottom water filtration rates for each station, the average bottom water filtration rate from all stations recorded in April, June, and August (17 L m-2 d-1) and the averaged inundation times of the respective stations were used. The amount of infiltrated organic carbon per station was calculated from the daily bottom water filtration rates and an averaged water column POC content of 0.07 mol L-1.
Upper Middle Lower flat flat flat
Inundation time (h d-1) April 12.9 15.2 20.2 June 15 17.8 22.4 August 14.1 16.6 22.4 February 13 15.7 20.4
Bottom water filtration rate (L m-2 h-1) April 14?2 August 27+6 17+7 34+15 June 14?6 15?7 23?9 February 1.8?0.6 3.6+0.7 1.5+0.4
Daily bottom water filtration rate 280 330 430 (L m-2 d-1)
Organic carbon infiltration 16 19 25 (mmol C m-2 d-1)
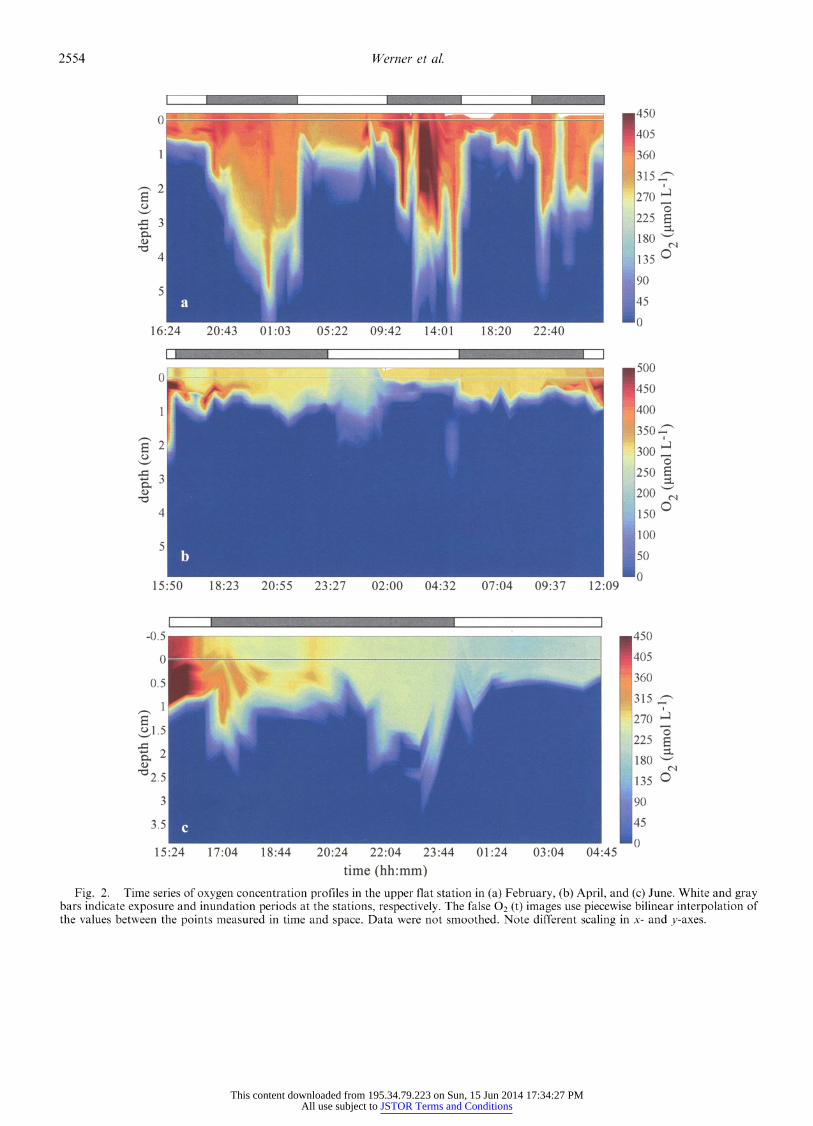
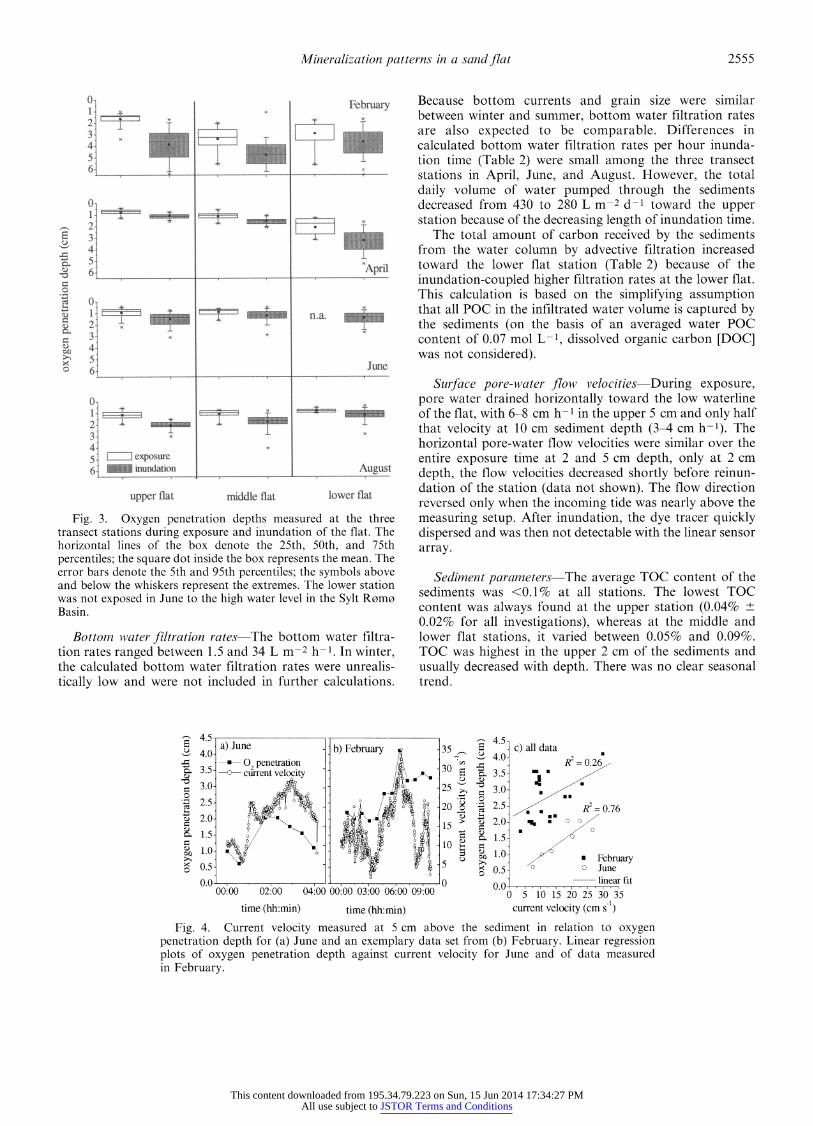
during exposure and inundation are shown in Fig. 2a-c and Fig. 3, respectively). Oxygen penetration depths varied at least half-hourly (time needed to measure a profile) and were significantly different between inundation and expo- sure periods of the flat (nonparametric U-test, p < 0.01, all stations, except at lower flat in February), with a deeper and more variable oxygen penetration during inundation. The simultaneous employment of the ADV and the automatic profiler showed a covariance between the oxygen penetration depth and the current velocity of the overlying water during inundation (Fig. 4). During inundation, oxygen profiles often had a sigmoid shape (Fig. 5a). During exposure, benthic photosynthesis occasionally increased oxygen penetration depth (Figs. 2b-c, 5b).
At all three stations, oxygen penetration depths and dynamics were similar, both during inundation and exposure periods (Fig. 3). Only in April, oxygen penetrated deeper at the lower flat during inundation and exposure, respectively. Oxygen penetration depth depended on season (e.g., Fig. 3), reaching deeper in winter than in summer at similar bottom current velocities (Fig. 4).
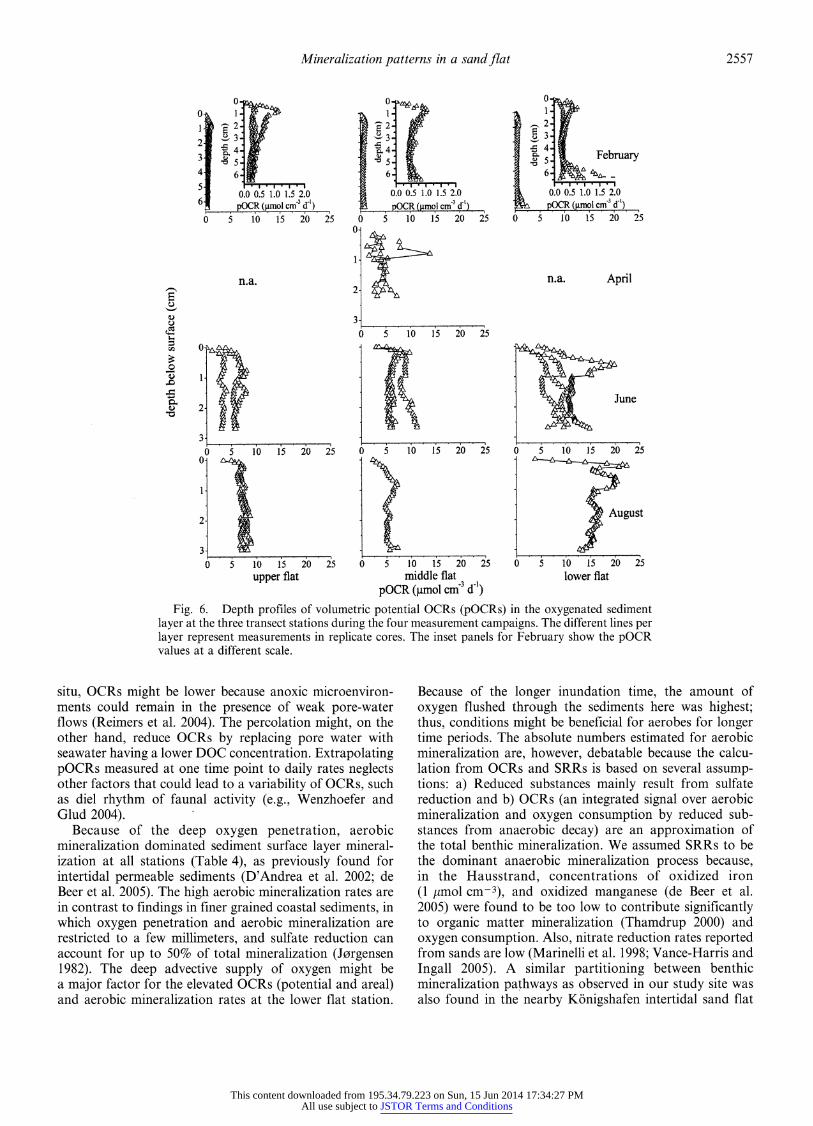
Volumetric OCRs-The highest pOCRs were found near the low waterline in the summer months (Fig. 6). Most of the potential OCR profiles had a small peak in the top centimeter of the sediment and were otherwise rather constant with depth. The pOCRs were strongly influenced by season, being -10-20 times higher in April, June, and August than in February.
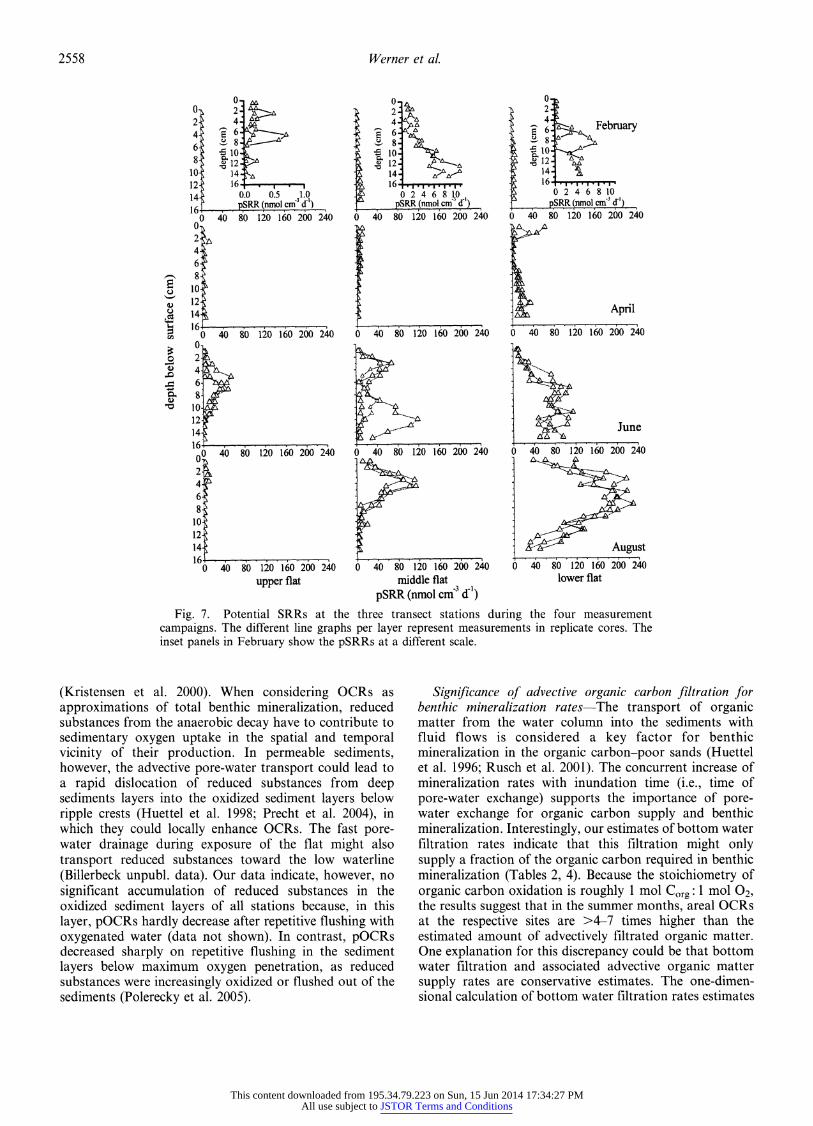
Volumetric SRRs-Volumetric SRRs decreased from the lower flat station toward the upper flat during all seasons (Fig. 7). The differences between stations were most pronounced in August. pSRRs generally had a peak in depths of 1-2 cm or increased below that layer in spring and summer, with the peak width increasing toward the lower flat. In winter, pSRRs increased below depths of 4- 5 cm at the lower and the middle station. Similar to pOCRs, pSRRs were highest in summer. In contrast to pOCRs, pSRRs were low in spring. The largest seasonal variability was found at the lower flat and smallest at the upper flat (Fig. 7; Table 4). Pore-water sulfate concentra- tions at all depths and at all stations were equal to concentrations in the overlying water (Table 3) and were, thus, not limiting SRRs.
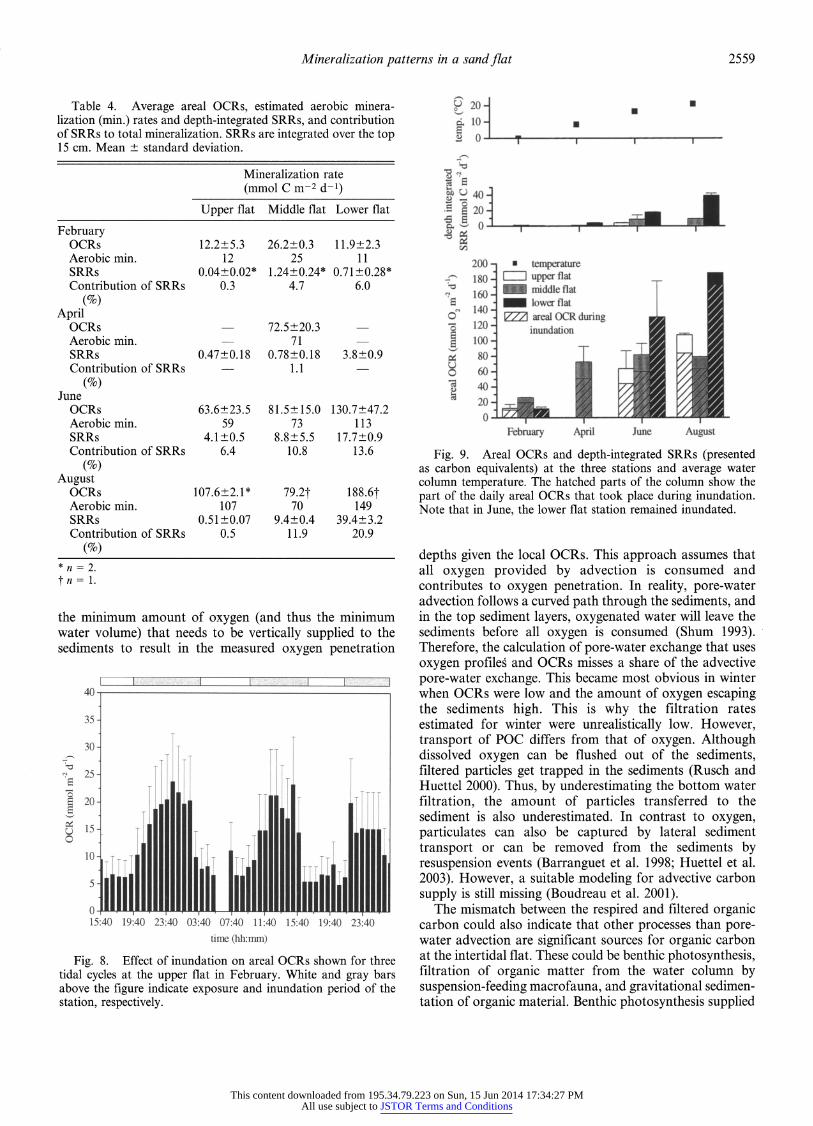
Areal OCRs-Areal OCRs were higher during inunda- tion than during exposure because of deeper oxygen penetration (Fig. 8). At all stations, 71-90% of the daily areal OCRs took place during inundation (Fig. 9). In August and June, the highest areal OCRs were found at the lower flat station and, in February, at the intermediate station (Fig. 9; Table 4). The differences between the remaining stations were not pronounced. Areal OCRs showed a pronounced seasonal variability, with lowest rates found in winter.
Depth-integrated SRRs and aerobic mineralization- Depth integrated SRRs increased sharply from the high toward the low waterline (Table 4). Minimum estimations of depth-integrated SRRs (data not shown) hardly deviated from maximum estimations (8 of 12 measurements were <10% lower than the maximum estimations). The contri- bution of sulfate reduction to total mineralization increased toward the low waterline (Table 4). A maximum contribu- tion of 21% was found in August at the lower flat station. At the upper flat station, sulfate reduction contributed <1% to total mineralization in August and February, but 6% in June. Estimated areal aerobic mineralization rates were high (Table 4) at all stations. These estimates assume that other anaerobic processes had only negligible influence on mineralization.
Table 3. Water column temperature, water column and pore-water salinity, water column and pore-water sulfate concentration, water column POC, suspended matter (SM), and water column Chl a content. Mean ? standard deviation.
Temp. (?C) Salinity SO2- (mmol L-1) POC ([imol L-1) SM (mg L-1) Chl a (Mg L-1)
February -0.1?0.4 28 22.2-0.6 1084+20 84+12 2.6?0.4 April 8.5?1.2 26-27 21.0?0.6 60?21 26?4 16.6?7.8 June 16.5+1.0 31 24.1?0.4 51?4 74+4 2.6?1.9 August 21.0+0.7 29-30 23.2-0.5 56?6 34_+25 3.6?0.8
This content downloaded from 195.34.79.223 on Sun, 15 Jun 2014 17:34:27 PMAll use subject to JSTOR Terms and Conditions
2554 Werner et al.
0o -.. . . . ---........- •4 5 0
405
360 315 2
270
3 225
0180
4 1.5 O
45
16:24 20:43 01:03 05:22 09:42 14:01 18:20 22:40 4
time-(hh- )500 ...450
400
350 2 300
\. 250 3 :
o 200
4 150 100
5 50 50
15:50 18:23 20:55 23:27 02:00 04:32 07:04 09:37 12:09
-0.5 450
0 ----- 405 36
0.5 360 315
270 1.5 "o
20 ~180
2.5 135 O
3 90
3.5 45
15:24 17:04 18:44 20:24 22:04 23:44 01:24 03:04 04:450
time (hh:mm)
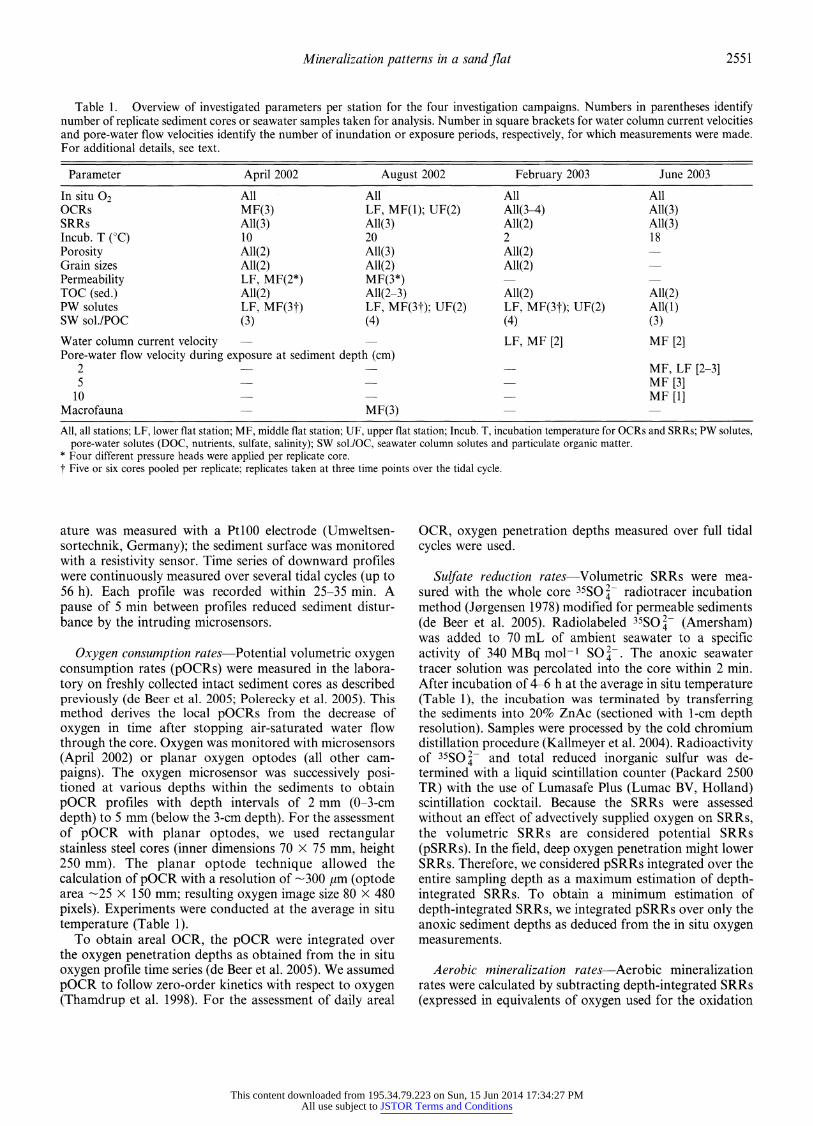
Fig. 2. Time series of oxygen concentration profiles in the upper flat station in (a) February, (b) April, and (c) June. White and gray bars indicate exposure and inundation periods at the stations, respectively. The false 02 (t) images use piecewise bilinear interpolation of the values between the points measured in time and space. Data were not smoothed. Note different scaling in x- and y-axes.
This content downloaded from 195.34.79.223 on Sun, 15 Jun 2014 17:34:27 PMAll use subject to JSTOR Terms and Conditions
Mineralization patterns in a sand flat 2555
0 February • ,
5- 6 T
0-
2- 53
5 5April 6
0 4
Sn.a.
6 June
1 6 0.
4- 5 [- ---- exposure 6 inundation August
upper flat middle flat lower flat
Fig. 3. Oxygen penetration depths measured at the three transect stations during exposure and inundation of the flat. The horizontal lines of the box denote the 25th, 50th, and 75th percentiles; the square dot inside the box represents the mean. The error bars denote the 5th and 95th percentiles; the symbols above and below the whiskers represent the extremes. The lower station was not exposed in June to the high water level in the Sylt Romo Basin.
Bottom water filtration rates-The bottom water filtra- tion rates ranged between 1.5 and 34 L m-2 h-1. In winter, the calculated bottom water filtration rates were unrealis- tically low and were not included in further calculations.
Because bottom currents and grain size were similar between winter and summer, bottom water filtration rates are also expected to be comparable. Differences in calculated bottom water filtration rates per hour inunda- tion time (Table 2) were small among the three transect stations in April, June, and August. However, the total daily volume of water pumped through the sediments decreased from 430 to 280 L m-2 d-1 toward the upper station because of the decreasing length of inundation time.
The total amount of carbon received by the sediments from the water column by advective filtration increased toward the lower flat station (Table 2) because of the inundation-coupled higher filtration rates at the lower flat. This calculation is based on the simplifying assumption that all POC in the infiltrated water volume is captured by the sediments (on the basis of an averaged water POC content of 0.07 mol L-1, dissolved organic carbon [DOC] was not considered).
Surface pore-water flow velocities-During exposure, pore water drained horizontally toward the low waterline of the flat, with 6-8 cm h-1 in the upper 5 cm and only half that velocity at 10 cm sediment depth (3-4 cm h-1). The horizontal pore-water flow velocities were similar over the entire exposure time at 2 and 5 cm depth, only at 2 cm depth, the flow velocities decreased shortly before reinun- dation of the station (data not shown). The flow direction reversed only when the incoming tide was nearly above the measuring setup. After inundation, the dye tracer quickly dispersed and was then not detectable with the linear sensor array.
Sediment parameters-The average TOC content of the sediments was <0.1% at all stations. The lowest TOC content was always found at the upper station (0.04% + 0.02% for all investigations), whereas at the middle and lower flat stations, it varied between 0.05% and 0.09%. TOC was highest in the upper 2 cm of the sediments and usually decreased with depth. There was no clear seasonal trend.
4.5 4.5- 4. a) June b) February 35 . c) alldata
0-2O penetration 3 .
4.0c 26
3 _ currentvelocity 30 3.5
S3.0-
0 20 02.5 -=0.76 2.50.
,
\
• 20 >
2. "
1 • - 15
2.0 - uo0
S 1.
O-C1
o1.5- 1.0
U-
.
0-
1.0 0.5 5 •
10 U•
February 0 x 0.5 0 June
0.0 0 0.0 -linear
fit 00:00 02:00 04:00 00:00 03:00 06:00 09:00 0 5 10 15 20 25 30 35
time (hh:min) time (hh:min) current velocity (cm s-')
Fig. 4. Current velocity measured at 5 cm above the sediment in relation to oxygen penetration depth for (a) June and an exemplary data set from (b) February. Linear regression plots of oxygen penetration depth against current velocity for June and of data measured in February.
This content downloaded from 195.34.79.223 on Sun, 15 Jun 2014 17:34:27 PMAll use subject to JSTOR Terms and Conditions
2556 Werner et al.
-1- -1-
o- 0.--
Q U U • 1 1-
2 2 2
3 3
4-r--day 4 a) inundation -- night b) exposure
0 100 200 300 400 0 250 500 750 1000 1250 oxygen conc. ([mol L[)
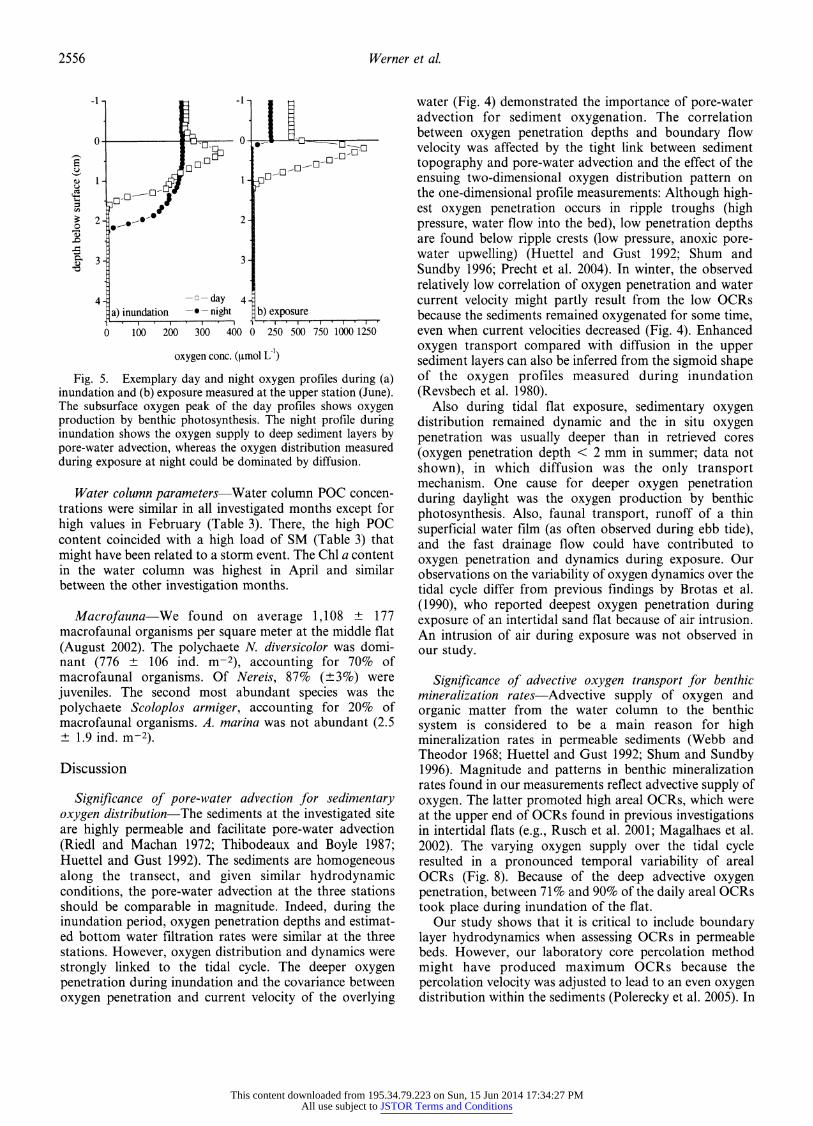
Fig. 5. Exemplary day and night oxygen profiles during (a) inundation and (b) exposure measured at the upper station (June). The subsurface oxygen peak of the day profiles shows oxygen production by benthic photosynthesis. The night profile during inundation shows the oxygen supply to deep sediment layers by pore-water advection, whereas the oxygen distribution measured during exposure at night could be dominated by diffusion.
Water column parameters-Water column POC concen- trations were similar in all investigated months except for high values in February (Table 3). There, the high POC content coincided with a high load of SM (Table 3) that might have been related to a storm event. The Chl a content in the water column was highest in April and similar between the other investigation months.
Macrofauna-We found on average 1,108 + 177 macrofaunal organisms per square meter at the middle flat (August 2002). The polychaete N. diversicolor was domi- nant (776 ? 106 ind. m-2), accounting for 70% of macrofaunal organisms. Of Nereis, 87% (?3%) were juveniles. The second most abundant species was the polychaete Scoloplos armiger, accounting for 20% of macrofaunal organisms. A. marina was not abundant (2.5 ? 1.9 ind. m-2).
Discussion
Significance of pore-water advection for sedimentary oxygen distribution-The sediments at the investigated site are highly permeable and facilitate pore-water advection (Riedl and Machan 1972; Thibodeaux and Boyle 1987; Huettel and Gust 1992). The sediments are homogeneous along the transect, and given similar hydrodynamic conditions, the pore-water advection at the three stations should be comparable in magnitude. Indeed, during the inundation period, oxygen penetration depths and estimat- ed bottom water filtration rates were similar at the three stations. However, oxygen distribution and dynamics were strongly linked to the tidal cycle. The deeper oxygen penetration during inundation and the covariance between oxygen penetration and current velocity of the overlying
water (Fig. 4) demonstrated the importance of pore-water advection for sediment oxygenation. The correlation between oxygen penetration depths and boundary flow velocity was affected by the tight link between sediment topography and pore-water advection and the effect of the ensuing two-dimensional oxygen distribution pattern on the one-dimensional profile measurements: Although high- est oxygen penetration occurs in ripple troughs (high pressure, water flow into the bed), low penetration depths are found below ripple crests (low pressure, anoxic pore- water upwelling) (Huettel and Gust 1992; Shum and Sundby 1996; Precht et al. 2004). In winter, the observed relatively low correlation of oxygen penetration and water current velocity might partly result from the low OCRs because the sediments remained oxygenated for some time, even when current velocities decreased (Fig. 4). Enhanced oxygen transport compared with diffusion in the upper sediment layers can also be inferred from the sigmoid shape of the oxygen profiles measured during inundation (Revsbech et al. 1980).
Also during tidal flat exposure, sedimentary oxygen distribution remained dynamic and the in situ oxygen penetration was usually deeper than in retrieved cores (oxygen penetration depth < 2 mm in summer; data not shown), in which diffusion was the only transport mechanism. One cause for deeper oxygen penetration during daylight was the oxygen production by benthic photosynthesis. Also, faunal transport, runoff of a thin superficial water film (as often observed during ebb tide), and the fast drainage flow could have contributed to oxygen penetration and dynamics during exposure. Our observations on the variability of oxygen dynamics over the tidal cycle differ from previous findings by Brotas et al. (1990), who reported deepest oxygen penetration during exposure of an intertidal sand flat because of air intrusion. An intrusion of air during exposure was not observed in our study.
Significance of advective oxygen transport for benthic mineralization rates-Advective supply of oxygen and organic matter from the water column to the benthic system is considered to be a main reason for high mineralization rates in permeable sediments (Webb and Theodor 1968; Huettel and Gust 1992; Shum and Sundby 1996). Magnitude and patterns in benthic mineralization rates found in our measurements reflect advective supply of oxygen. The latter promoted high areal OCRs, which were at the upper end of OCRs found in previous investigations in intertidal flats (e.g., Rusch et al. 2001; Magalhaes et al. 2002). The varying oxygen supply over the tidal cycle resulted in a pronounced temporal variability of areal OCRs (Fig. 8). Because of the deep advective oxygen penetration, between 71% and 90% of the daily areal OCRs took place during inundation of the flat.
Our study shows that it is critical to include boundary layer hydrodynamics when assessing OCRs in permeable beds. However, our laboratory core percolation method might have produced maximum OCRs because the percolation velocity was adjusted to lead to an even oxygen distribution within the sediments (Polerecky et al. 2005). In
This content downloaded from 195.34.79.223 on Sun, 15 Jun 2014 17:34:27 PMAll use subject to JSTOR Terms and Conditions
Mineralization patterns in a sand flat 2557
February
0 o
60-
.0051015200.0 0.5 1.0 1.5 2.0 0.0 0.5 1.0 1.5 2.0 6 pOCR (jimol cm" d") pOCR (mol cmn d4' pOCR (tmol cm3 d")
0 5 10 15 20 25 0 5 10 15 20 25 0 5 10 15 20 25
00
n.a. n.a. April
E.)1
0 5 10 15 20 25
02
6
33
3 -t
,4
3.
0 5 10 15 20 25 0 5 10 15 20 25 0 5 10 15 20 25
0-
3 3
0 5 10 15 20 25 0-1
June
2-
3.
0 5 10 15 20 25 0 5 10 15 20 25 0 5 10 15 20 25
0.
2- •August
31 .....
. .
'.
.
0 5 10 15 20 25 0 5 10 15 20 25 0 5 10 15 20 25
upper flat middle flat lower flat pOCR (gmol cm3 d1)
Fig. 6. Depth profiles of volumetric potential OCRs (pOCRs) in the oxygenated sediment layer at the three transect stations during the four measurement campaigns. The different lines per layer represent measurements in replicate cores. The inset panels for February show the pOCR values at a different scale.
situ, OCRs might be lower because anoxic microenviron- ments could remain in the presence of weak pore-water flows (Reimers et al. 2004). The percolation might, on the other hand, reduce OCRs by replacing pore water with seawater having a lower DOC concentration. Extrapolating pOCRs measured at one time point to daily rates neglects other factors that could lead to a variability of OCRs, such as diel rhythm of faunal activity (e.g., Wenzhoefer and Glud 2004).
Because of the deep oxygen penetration, aerobic mineralization dominated sediment surface layer mineral- ization at all stations (Table 4), as previously found for intertidal permeable sediments (D'Andrea et al. 2002; de Beer et al. 2005). The high aerobic mineralization rates are in contrast to findings in finer grained coastal sediments, in which oxygen penetration and aerobic mineralization are restricted to a few millimeters, and sulfate reduction can account for up to 50% of total mineralization (Jorgensen 1982). The deep advective supply of oxygen might be a major factor for the elevated OCRs (potential and areal) and aerobic mineralization rates at the lower flat station.
Because of the longer inundation time, the amount of oxygen flushed through the sediments here was highest; thus, conditions might be beneficial for aerobes for longer time periods. The absolute numbers estimated for aerobic mineralization are, however, debatable because the calcu- lation from OCRs and SRRs is based on several assump- tions: a) Reduced substances mainly result from sulfate reduction and b) OCRs (an integrated signal over aerobic mineralization and oxygen consumption by reduced sub- stances from anaerobic decay) are an approximation of the total benthic mineralization. We assumed SRRs to be the dominant anaerobic mineralization process because, in the Hausstrand, concentrations of oxidized iron (1 ymol cm-3), and oxidized manganese (de Beer et al. 2005) were found to be too low to contribute significantly to organic matter mineralization (Thamdrup 2000) and oxygen consumption. Also, nitrate reduction rates reported from sands are low (Marinelli et al. 1998; Vance-Harris and Ingall 2005). A similar partitioning between benthic mineralization pathways as observed in our study site was also found in the nearby K6nigshafen intertidal sand flat
This content downloaded from 195.34.79.223 on Sun, 15 Jun 2014 17:34:27 PMAll use subject to JSTOR Terms and Conditions
2558 Werner et al.
0 0 o0 0 22 642
2 4
.4 '&,& "'"6 6 A6 6 February
46 8. il10, 8 212 .2,
A
10 14 A 14 14 16 12 16 f 16
.6,I. 16
"T,..
14 0.0 0.5 1.0 0 2 4 6 8 0 0 2 4 6 8 10
16 pSRR (nmol cm3 d') pSRR (nmol cm d ) pSRR (nmol cm d) 0 40 80 120 160 200 240 0 40 80 120 160 200 240 0 40 80 120 160 200 240
0 2 4 6
12~ 14 April
0 40 80 120 160 200 240 0 40 80 120 160 200 240 0 40 80 120 160 200 240 0
02
4
6 8
S 10 12 14 June
12
14,__.____-______
ugust 16
0 40 80 120 160 200 240 0 40 80 120 160 200 240 0 40 80 120 160 200 240
upper flat middle flat lower flat pSRR (nmol cm3 d'i)
Fig. 7. Potential SRRs at the three transect stations during the four measurement campaigns. The different line graphs per layer represent measurements in replicate cores. The inset panels in February show the pSRRs at a different scale.
(Kristensen et al. 2000). When considering OCRs as approximations of total benthic mineralization, reduced substances from the anaerobic decay have to contribute to sedimentary oxygen uptake in the spatial and temporal vicinity of their production. In permeable sediments, however, the advective pore-water transport could lead to a rapid dislocation of reduced substances from deep sediments layers into the oxidized sediment layers below ripple crests (Huettel et al. 1998; Precht et al. 2004), in which they could locally enhance OCRs. The fast pore- water drainage during exposure of the flat might also transport reduced substances toward the low waterline (Billerbeck unpubl. data). Our data indicate, however, no significant accumulation of reduced substances in the oxidized sediment layers of all stations because, in this layer, pOCRs hardly decrease after repetitive flushing with oxygenated water (data not shown). In contrast, pOCRs decreased sharply on repetitive flushing in the sediment layers below maximum oxygen penetration, as reduced substances were increasingly oxidized or flushed out of the sediments (Polerecky et al. 2005).
Significance of advective organic carbon filtration for benthic mineralization rates-The transport of organic matter from the water column into the sediments with fluid flows is considered a key factor for benthic mineralization in the organic carbon-poor sands (Huettel et al. 1996; Rusch et al. 2001). The concurrent increase of mineralization rates with inundation time (i.e., time of pore-water exchange) supports the importance of pore- water exchange for organic carbon supply and benthic mineralization. Interestingly, our estimates of bottom water filtration rates indicate that this filtration might only supply a fraction of the organic carbon required in benthic mineralization (Tables 2, 4). Because the stoichiometry of organic carbon oxidation is roughly 1 mol Corg: 1 mol 02, the results suggest that in the summer months, areal OCRs at the respective sites are >4-7 times higher than the estimated amount of advectively filtrated organic matter. One explanation for this discrepancy could be that bottom water filtration and associated advective organic matter supply rates are conservative estimates. The one-dimen- sional calculation of bottom water filtration rates estimates
This content downloaded from 195.34.79.223 on Sun, 15 Jun 2014 17:34:27 PMAll use subject to JSTOR Terms and Conditions
Mineralization patterns in a sand flat 2559
Table 4. Average areal OCRs, estimated aerobic minera- lization (min.) rates and depth-integrated SRRs, and contribution of SRRs to total mineralization. SRRs are integrated over the top 15 cm. Mean ? standard deviation.
Mineralization rate (mmol C m-2 d-1)
Upper flat Middle flat Lower flat
February OCRs 12.2?5.3 26.2+0.3 11.9+2.3 Aerobic min. 12 25 11 SRRs 0.04?_0.02* 1.24+0.24* 0.71+0.28* Contribution of SRRs 0.3 4.7 6.0
(%) April
OCRs 72.5?_20.3 Aerobic min. 71 SRRs 0.47?0.18 0.78?0.18 3.8?+0.9 Contribution of SRRs 1.1
(%) June
OCRs 63.6+23.5 81.5+15.0 130.7?47.2 Aerobic min. 59 73 113 SRRs 4.1+0.5 8.8?5.5 17.7?+0.9 Contribution of SRRs 6.4 10.8 13.6
(%) August
OCRs 107.6?2.1* 79.2t 188.6t Aerobic min. 107 70 149 SRRs 0.51+0.07 9.4+0.4 39.4+3.2 Contribution of SRRs 0.5 11.9 20.9
(%) * n = 2. tn= 1.
the minimum amount of oxygen (and thus the minimum water volume) that needs to be vertically supplied to the sediments to result in the measured oxygen penetration
I I I I I I I 40
35
30-
25
20-
15-
10
5 .
0 15:40 19:40 23:40 03:40 07:40 11:40 15:40 19:40 23:40
time (hh:mm)
Fig. 8. Effect of inundation on areal OCRs shown for three tidal cycles at the upper flat in February. White and gray bars above the figure indicate exposure and inundation period of the station, respectively.
S 20
10 T
2 0
U40
20
200 - temperature 180- E upper flat
Smiddle flat ,, 160 O 140 lower flat 140
2"Z areal OCR during 3 120 - inundation 100
S 80 U 0 60
40- 20- 0
February April June August
Fig. 9. Areal OCRs and depth-integrated SRRs (presented as carbon equivalents) at the three stations and average water column temperature. The hatched parts of the column show the part of the daily areal OCRs that took place during inundation. Note that in June, the lower flat station remained inundated.
depths given the local OCRs. This approach assumes that all oxygen provided by advection is consumed and contributes to oxygen penetration. In reality, pore-water advection follows a curved path through the sediments, and in the top sediment layers, oxygenated water will leave the sediments before all oxygen is consumed (Shum 1993). Therefore, the calculation of pore-water exchange that uses oxygen profileg and OCRs misses a share of the advective pore-water exchange. This became most obvious in winter when OCRs were low and the amount of oxygen escaping the sediments high. This is why the filtration rates estimated for winter were unrealistically low. However, transport of POC differs from that of oxygen. Although dissolved oxygen can be flushed out of the sediments, filtered particles get trapped in the sediments (Rusch and Huettel 2000). Thus, by underestimating the bottom water filtration, the amount of particles transferred to the sediment is also underestimated. In contrast to oxygen, particulates can also be captured by lateral sediment transport or can be removed from the sediments by resuspension events (Barranguet et al. 1998; Huettel et al. 2003). However, a suitable modeling for advective carbon supply is still missing (Boudreau et al. 2001).
The mismatch between the respired and filtered organic carbon could also indicate that other processes than pore- water advection are significant sources for organic carbon at the intertidal flat. These could be benthic photosynthesis, filtration of organic matter from the water column by suspension-feeding macrofauna, and gravitational sedimen- tation of organic material. Benthic photosynthesis supplied
This content downloaded from 195.34.79.223 on Sun, 15 Jun 2014 17:34:27 PMAll use subject to JSTOR Terms and Conditions
2560 Werner et al.
organic material on the order of 35 mmol C m-2 d-1 (net rates) at the middle flat in summer and autumn (de Beer et al. 2005; Billerbeck unpubl. data). Thus, -50% of the organic carbon used in benthic mineralization could be provided by benthic photosynthesis. To explain the pattern found for mineralization rates along the transect, benthic photosynthesis must increase toward the low waterline and maintain high rates during the inundation of the flat. Measurements of benthic photosynthesis in intertidal Wadden Sea sediments were mostly conducted during exposure (e.g., Colijn and De Jonge 1984; Migne et al. 2004) because water turbidity is considered to limit light availability for benthic photosynthesis during inundation. In an in situ study at a nearby intertidal flat at Sylt, where waters were clear, Asmus (1982) showed that microphyto- benthos contributed 68% to total primary production during inundation. In a sublittoral station 100 m away from our study site, sands were found to be net autotrophic, and photosynthesis rates increased with increasing pore-water advection rates (Cook and Roy 2006). Thus, longer periods of pore-water advection are beneficial to benthic photosynthesis rates and can compen- sate for the effect of reduced light conditions.
Macrofaunal abundance was low at the middle station and lower compared with previous investigations (Armo- nies and Hellwig-Armonies 1987). However, the dominat- ing polychaete N. diversicolor, a facultative suspension feeder (Riisgird 1991), was found to be able to pump 500- 9,500 L m-2 d-1 of water (453-3,357 ind. m-2) into the sublittoral sediments when restricted to suspension feeding (Vedel and Riisgaird 1993). Suspension feeding might, thus, contribute noticeably to organic carbon fluxes into the sediments. However, the individual pumping rates de- pended on the biomass (Vedel and Riisgaird 1993), which might be low at the Hausstrand because the N. diversicolor population was dominated by juveniles and small adults. An estimate of the transport of organic carbon by N. diversicolor is further complicated because it is not known how frequently these organisms use the suspension-feeding mode at the study site. At all stations, we occasionally observed ephemeral oxygen peaks in the oxygen profile time series that might result from faunal irrigation activity. Bioirrigation can, however, not be quantified from these one-dimensional oxygen profiles. Armonies and Hellwig- Armonies (1987) observed highest abundances of macro- fauna at the high waterline, which suggests a less important role of macrofaunal pumping for the pattern found in the benthic mineralization rates. However, differentiation down to species level is missing to clarify the role of bioirrigation for the pattern found in mineralization rates.
Gravitational sedimentation of POC from the water column might be highest at the station with the longest inundation time. However, we estimated a bed shear stress of 0.4 Pa for the intertidal flat (calculated from June ADV data; Billerbeck unpubl. data). A bed shear stress of -0.2 Pa was reported to be sufficient to erode sediments, with a grain size up to 63 pm (Deussfeld and Pasche 2003). This indicates that gravitational sedimentation of POC might be of minor importance as a source of organic carbon because deposited fine particles can be immediately
removed from the sediment surface. Other sources for organic material, such as terrestrial, groundwater, or eolic fluxes, might also be of minor importance for the pattern and magnitude found in benthic mineralization rates in surface sediments (e.g., a groundwater inflow was not detected in the surface sediments). The fast drainage transport toward the low waterline during exposure might support microbial activity at the low waterline by cotransporting electron donors and electron acceptors.
The differences in mineralization rates between stations were most pronounced for SRRs. Sulfate was not limiting and similar for all stations; thus, our data suggest an increasing limitation of SRRs by suitable organic sub- stances toward the upper flat. At the upper flat, SRRs hardly increased after an addition of acetate (Werner unpubl. data). Thus, the abundance of active sulfate- reducing bacteria (SRB) might be relatively low at this station, indicating unfavorable environmental conditions for SRB over long time periods. Because of the lower input of organic matter, compared with the other stations, the sediments at the upper flat might remain more oxidized, which could hamper sulfate reduction. For OCRs, differ- ences between sites were less pronounced than for SRRs, which could be explained by a variety of factors. The organic material at the upper station might be more refractory and, thus, more susceptible to aerobic than anaerobic mineralization (Hulthe et al. 1998; Kristensen and Holmer 2001) and thereby maintain higher aerobic mineralization rates. A contribution by meiofauna to the utilization of oxygen might increase toward the upper flat stations, where highest abundances were found (Armonies and Hellwig-Armonies 1987). Macrofaunal oxygen con- sumption is not quantitatively included in the OCRs because the cores used for the measurements were too small to retrieve a representative sample for macrofauna evaluation.
The input of organic material from the water column or from the top sediment layer by benthic photosynthesis is reflected in the depth distribution of the potential OCRs and SRRs. In some measurements, maximum pOCRs were found above the pSRR peaks (Figs. 6, 7). Highest pSRRs were often measured at the interface between the oxygen- ated and anoxic sediment layers, which explains why SRRs integrated either over the entire or only over the anoxic sampling depths were rather similar. Most sedimentary bacteria are attached to sand grains; thus, a horizontal stratification of microbial populations in the top sediment layers was not expected because of the advective pore-water flow pattern, regular reworking of sediments by migrating ripples, and bioturbation. Our results indicate, neverthe- less, that a zonation of pOCRs and pSRRs can be established.
Seasonal pattern of mineralization rates and oxygen distribution As reported in numerous studies, benthic mineralization rates vary in the sediments of the Wadden Sea over the year because of the dependency of chemical and biological processes on temperature and because of the variation of the organic matter supply by the water column and benthic primary production (Kristensen et al. 1997).
This content downloaded from 195.34.79.223 on Sun, 15 Jun 2014 17:34:27 PMAll use subject to JSTOR Terms and Conditions
Mineralization patterns in a sand flat 2561
Our results support these observations because OCRs, aerobic mineralization, and SRRs were highest in the warmer months. June had lower mineralization rates than August, which can be explained by lower ambient temperatures and the low carbon content in the overlying water column. In April, measurements were preceded by the spring bloom (van Beusekom unpubl. data). The high load of easily degradable organic carbon (as indicated by the high Chl a concentration in the overlying water) promoted OCRs in April that were comparable to OCRs measured in summer, although temperatures were lower. The response of SRRs seemed to be more delayed because SRRs in April showed only a small peak in the upper sediment layer but generally remained low. At the upper flat, SRRs hardly varied between seasons, stressing the limitation of SRRs by organic matter at this station.
Although hydrodynamic conditions were comparable between summer and winter (Fig. 4), oxygen penetrated deeper in winter than in summer because of increased oxygen solubility and reduced sedimentary pOCRs. The low areal OCRs during winter showed that the deeper oxygen penetration could not counteract the lower OCRs. In April, oxygen penetrated deeper at the lower flat than at the other stations, perhaps because of 3-40C lower temperatures during these measurements, which were conducted first within the campaign. The following measurements at the other two stations were conducted at higher ambient temperatures and directly after the spring bloom, which might also have fueled benthic mineralization rates.
Our study demonstrates the importance of pore-water advection for sediment oxygenation and for benthic mineralization in high-permeability intertidal sediments. The advective supply of oxygen shifted total benthic mineralization toward aerobic processes and, because of the deep oxygen penetration, areal OCRs were elevated during inundation compared with the exposure time of the sand flat. It is likely that this advective effect is not restricted to the intertidal but extends to the shallow shelf, where permeable beds permit flushing of the upper sediment layer (Marinelli et al. 1998; Jahnke et al. 2000; Reimers et al. 2004). However, the contribution of organic matter supply by pore-water advection to total benthic mineralization remains to be investigated. The high benthic mineralization rates emphasize the importance of sandy sediments for the coastal marine carbon cycle.
References
ALLER, R. C., AND J. Y. ALLER. 1998. The effect of biogenic irrigation intensity and solute exchange on diagenetic reaction rates in marine sediments. J. Mar. Res. 56: 905-936.
ANDERSEN, F. O., AND W. HELDER. 1987. Comparison of oxygen microgradients, oxygen flux rates and electron-transport system activity in coastal marine-sediments. Mar. Ecol. Prog. Ser. 37: 259-264.
ARMONIES, W., AND M. HELLWIG-ARMONIES. 1987. Synoptic patterns of meiofaunal and macrofaunal abundances and specific composition in littoral sediments. Helgol. Wiss. Meeresunters. 41: 83-111.
AsMus, R. 1982. Field-measurements on seasonal-variation of the activity of primary producers on a sandy tidal flat in the northern Wadden Sea. Neth. J. Sea Res. 16: 389-402.
BACKHAUS, J., D. HARTKE, U. HJBNER, H. LOHSE, AND A. MOLLER. 1998. Hydrography und Klima im Lister Tidenbecken, p. 39- 54. In C. Gatje and K. Reise [eds.], Okosystem Wattenmer: Austausch-, Transport- und Stoffumwandlungsprozesse. Springer Verlag.
BARRANGUET, C., J. KROMKAMP, AND J. PEENE. 1998. Factors controlling primary production and photosynthetic charac- teristics of intertidal microphytobenthos. Mar. Ecol. Prog. Ser. 173: 117-126.
BERNINGER, U. G., AND M. HUETTEL. 1997. Impact of flow on oxygen dynamics in photosynthetically active sediments. Aquat. Microb. Ecol. 12: 291-302.
BOUDREAU, B., AND OTHERS. 2001. Permeable marine sediments: Overturning an old paradigm. EOS, Trans. AGU 82: 133-136.
BROTAS, V., A. AMORIMFERREIRA, C. VALE, AND F. CATARINO. 1990. Oxygen profiles in intertidal sediments of Ria Formosa (S Portugal). Hydrobiologia 207: 123-129.
CAMMEN, L. M. 1991. Annual bacterial production in relation to benthic microalgal production and sediment oxygen-uptake in an intertidal sandflat and an intertidal mudflat. Mar. Ecol. Prog. Ser. 71: 13-25.
COLIJN, F., AND V. N. DE JONGE. 1984. Primary production of microphytobenthos in the Ems-Dollard estuary. Mar. Ecol. Prog. Ser. 14: 185-196.
COOK, P., AND H. RoY. 2006. Advective relief of CO2 limitation in highly productive sandy sediments. Limnol. Oceanogr. 51: 1594-1601.
D'ANDREA, A. F., R. C. ALLER, AND G. R. LOPEZ. 2002. Organic matter flux and reactivity on a South Carolina sandflat: The impacts of porewater advection and macrobiological struc- tures. Limnol. Oceanogr. 47: 1056-1070.
DARCY, H. 1856. Les Fontaines Publiques de la Ville de Dijon. Dalmont.
DE BEER, D., AND OTHERS. 2005. Transport and mineralization rates in North Sea sandy intertidal sediments, Sylt-Romo Basin, Wadden Sea. Limnol. Oceanogr. 50: 113-127.
DEUSSFELD, N., AND E. PASCHE. 2003. Hydro- und Morphodyna- mik in Seegraswiesen. HANSA Int. Maritim J. 5/2003: 67-73.
EHRENHAUSS, S., AND M. HUETTEL. 2004. Advective transport and decomposition of chain-forming planktonic diatoms in permeable sediments. J. Sea Res. 52: 179-197.
FERDELMAN, T. G., C. LEE, S. PANTOJA, J. HARDER, B. M. BEBOUT, AND H. FOSSING. 1997. Sulfate reduction and methanogenesis in a Thioploca-dominated sediment off the coast of Chile. Geochim. Cosmochim. Acta 61: 3065-3079.
FORSTER, S., M. HUETTEL, AND W. ZIEBIs. 1996. Impact of boundary layer flow velocity on oxygen utilisation in coastal sediments. Mar. Ecol. Prog. Ser. 143: 173-185.
GLUD, R. N., I. KLIMANT, G. HOLST, O. KOHLS, V. MEYER, M. KUEHL, AND J. K. GUNDERSEN. 1999. Adaptation, test and in situ measurements with 02 microopt(r)odes on benthic landers. Deep-Sea Res. Part I Oceanogr. Res. Pap. 46: 171-183.
HUETTEL, M., AND G. GUST. 1992. Impact of bioroughness on interfacial solute exchange in permeable sediments. Mar. Ecol. Prog. Ser. 89: 253-267.
- -, H. RoY, E. PRECHT, AND S. EHRENHAUSS. 2003. Hydrodynamical impact on biogeochemical processes in aquatic sediments. Hydrobiologia 494: 231-236.
--, AND A. RUSCH. 2000. Transport and degradation of
phytoplankton in permeable sediment. Limnol. Oceanogr. 45: 534-549.
This content downloaded from 195.34.79.223 on Sun, 15 Jun 2014 17:34:27 PMAll use subject to JSTOR Terms and Conditions
2562 Werner et al.
, W. ZIEBIS, AND S. FORSTER. 1996. Flow-induced uptake of particulate matter in permeable sediments. Limnol. Oceanogr. 41: 309-322.
,- , AND G. W. LUTHER. 1998. Advective transport affecting metal and nutrient distributions and interfacial fluxes in permeable sediments. Geochim. Cosmo- chim. Acta 62: 613-631.
HULTHE, G., S. HULTH, AND P. O. J. HALL. 1998. Effect of oxygen on degradation rate of refractory and labile organic matter in continental margin sediments. Geochim. Cosmochim. Acta 62: 1319-1328.
JAHNKE, R. A., J. R. NELSON, R. L. MARINELLI, AND J. E. ECKMAN. 2000. Benthic flux of biogenic elements on the southeastern US continental shelf: Influence of pore water advective transport and benthic microalgae. Cont. Shelf Res. 20: 109-127.
JEFFREY, S. W., AND G. F. HUMPHREY. 1975. New spectrophoto- metric equations for determining chlorophylls a, b, cl and c2 in higher-plants, algae and natural phytoplankton. Biochem. Physiol. Pflanzen 167: 191-194.
JORGENSEN, B. B. 1978. Comparison of methods for the quantification of bacterial sulfate reduction in coastal marine-sediments. 1. Measurement with radiotracer tech- niques. Geomicrobiol. J. 1:11-27.
1982. Mineralization of organic-matter in the sea bed-the role of sulfate reduction. Nature 296: 643-645.
KALLMEYER, J., T. G. FERDELMAN, A. WEBER, H. FOSSING, AND B. B. JORGENSEN. 2004. A cold chromium distillation procedure for radiolabeled sulfide applied to sulfate reduction measure- ments. Limnol. Oceanogr. Methods. 2:171-180.
KLUTE, A., AND C. DIRKSEN. 1986. Hydraulic conductivity and diffusivity: Laboratory methods, p. 687-734. In A. Klute [ed.], Method of soil analysis-part 1-physical and mineralogical methods. American Society of Agronomy.
KRISTENSEN, E., J. BODENBENDER, M. H. JENSEN, H. RENNENBERG, AND K. M. JENSEN. 2000. Sulfur cycling of intertidal Wadden Sea sediments (Kdnigshafen, Island of Sylt, Germany): Sulfate reduction and sulfur gas emission. J. Sea Res. 43: 93-104.
AND M. HOLMER. 2001. Decomposition of plant materials in marine sediment exposed to different electron accepters (02, NO3-, and SO2-4), with emphasis on substrate origin, degradation kinetics, and the role of bioturbation. Geochim. Cosmochim. Acta 65: 419-433.
-, M. H. JENSEN, AND K. M. JENSEN. 1997. Temporal variations in microbenthic metabolism and inorganic nitrogen fluxes in sandy and muddy sediments of a tidally dominated bay in the northern Wadden Sea. Helgol. Wiss. Meeresunters. 51: 295-320.
MAGALHAES, C. M., A. A. BORDALO, AND W. J. WIEBE. 2002. Temporal and spatial patterns of intertidal sediment-water nutrient and oxygen fluxes in the Douro River estuary, Portugal Mar. Ecol. Prog. Ser. 233: 55-71.
MARINELLI, R. L., R. A. JAHNKE, D. B. CRAVEN, J. R. NELSON, AND
J. E. ECKMAN. 1998. Sediment nutrient dynamics on the South Atlantic Bight continental shelf. Limnol. Oceanogr. 43: 1305-1320.
MIGNE, A., N. SPILMONT, AND D. DAVOULT. 2004. In situ measurements of benthic primary production during emer- sion: Seasonal variations and annual production in the Bay of Somme (eastern English Channel, France). Cont. Shelf Res. 24: 1437-1449.
NIELSEN, P. 1990. Tidal dynamics of the water-table in beaches. Water Resour. Res. 26: 2127-2134.
POLERECKY, L., U. FRANKE, U. WERNER, B. GRUNWALD, AND D. DE BEER. 2005. High spatial resolution measurement of oxygen consumption rates in permeable sediments. Limnol. Ocea- nogr. Methods 3: 75-85.
PRECHT, E., U. FRANKE, L. POLERECKY, AND M. HUETTEL. 2004. Oxygen dynamics in permeable sediments with wave-driven pore water exchange. Limnol. Oceanogr. 49: 693-705.
, AND M. HUETTEL. 2003. Advective pore-water exchange driven by surface gravity waves and its ecological implica- tions. Limnol. Oceanogr. 48: 1674-1684.
-, AND -. 2004. Rapid wave-driven advective pore water exchange in a permeable coastal sediment. J. Sea Res. 51: 93-107.
REIMERS, C. E., AND OTHERS. 2004. In situ measurements of advective solute transport in permeable shelf sands. Cont. Shelf Res. 24: 183-201.
REVSBECH, N. P. 1989. An oxygen microsensor with a guard cathode. Limnol. Oceanogr. 34: 474-478.
, B. B. JORGENSEN, AND T. H. BLACKBURN. 1980. Oxygen in the sea bottom measured with a microelectrode. Science 207: 1355-1356.
RIEDL, R. J., AND R. MACHAN. 1972. Hydrodynamic patterns in lotic intertidal sands and their biolimatological implications. Mar. Biol. 13: 179-209.
RIISGARD, H. U. 1991. Suspension feeding in the polychaete Nereis diversicolor. Mar. Ecol. Prog. Ser. 70: 29-37.
ROCHA, C. 1998. Rhythmic ammonium regeneration and flushing in intertidal sediments of the Sado estuary. Limnol. Oceanogr. 43: 823-831.
RUSCH, A., S. FORSTER, AND M. HUETTEL. 2001. Bacteria, diatoms and detritus in an intertidal sandflat subject to advective transport across the water-sediment interface. Biogeochemis- try 55: 1-27.
,AND M. HUETTEL. 2000. Advective particle transport into permeable sediments-evidence from experiments in an intertidal sandflat. Limnol. Oceanogr. 45: 525-533.
SHUM, K. T. 1992. Wave-induced advective transport below a rippled water-sediment interface. J. Geophys. Res. Oceans 97: 789-808.
. 1993. The effects of wave-induced pore-water circulation on the transport of reactive solutes below a rippled sediment bed. J. Geophys. Res. Oceans 98: 10289-10301.
? AND B. SUNDBY. 1996. Organic matter processing in continental shelf sediments-the subtidal pump revisited. Mar. Chem. 53: 81-87.
THAMDRUP, B. 2000. Bacterial manganese and iron reduction in aquatic sediments, p. 41-84. In B. Schink [ed.], Advances in microbial ecology. V. 16. Plenum.
, J. W. HANSEN, AND B. B. JORGENSEN. 1998. Temperature dependence of aerobic respiration in a coastal sediment. FEMS Microbiol. Ecol. 25: 189-200.
THIBODEAUX, L. J., AND J. D. BOYLE. 1987. Bedform-generated convective-transport in bottom sediment. Nature 325: 341-343.
VANCE-HARRIS, C., AND E. INGALL. 2005. Denitrification pathways and rates in the sandy sediments of the Georgia continental
shelf, USA. Geochem. Trans. 6: 12-18. VEDEL, A., AND H. U. RIISGARD. 1993. Filter-feeding in the
polychaete Nereis diversicolor-growth and bioenergetics. Mar. Ecol. Prog. Ser. 100: 145-152.
WEBB, J. E., AND J. THEODOR. 1968. Irrigation of submerged marine sands through wave action. Nature 220: 682-683.
WEBSTER, I. T., S. J. NORQUAY, F. C. Ross, AND R. A. WOODING. 1996. Solute exchange by convection within estuarine sedi- ments. Estuar. Coast. Shelf Sci. 42: 171-183.
This content downloaded from 195.34.79.223 on Sun, 15 Jun 2014 17:34:27 PMAll use subject to JSTOR Terms and Conditions
Mineralization patterns in a sand flat 2563
WENTWORTH, C. K. 1922. A scale of grade and class terms for clastic sediments. J. Geol. 30: 377-392.
WENZHOEFER, F., AND R. N. GLUD. 2004. Small-scale spatial and temporal variability in coastal benthic 02 dynamics: Effects of fauna activity. Limnol. Oceanogr. 49: 1471-1481.
, O. HOLBY, R. N. GLUD, H. K. NIELSEN, AND J. K. GUNDERSEN. 2000. In situ microsensor studies of a shallow- water hydrothermal vent at Milos, Greece. Mar. Chem. 69: 43-54.
ZIEBIS, W., M. HUETTEL, AND S. FORSTER. 1996. Impact of biogenic sediment topography on oxygen fluxes in permeable seabeds. Mar. Ecol. Prog. Ser. 140: 227-237.
Received: 19 July 2005 Accepted.: 10 April 2006
Amended. 8 June 2006
This content downloaded from 195.34.79.223 on Sun, 15 Jun 2014 17:34:27 PMAll use subject to JSTOR Terms and Conditions