spacex falcon 9/dragon operations nas impact and ... · spacex falcon 9/dragon operations nas...
TRANSCRIPT
SpaceX Falcon 9/Dragon Operations NAS Impact and Operational Analysis Jessica Young, FAA ANG-C41 Marie Kee, FAA ANG-C41 January 2014 DOT/FAA/TC-TN13/49

[THIS PAGE IS INTENTIONALLY LEFT BLANK]
ii
NOTICE
This document is disseminated under the sponsorship of the U.S. Department of Transportation in the interest of information exchange. The United States Government assumes no liability for the contents or use thereof. The United States Government does not endorse products or manufacturers. Trade or manufacturer's names appear herein solely because they are considered essential to the objective of this report. This document does not constitute FAA certification policy.
iii

[THIS PAGE IS INTENTIONALLY LEFT BLANK]
iv
Technical Report Documentation Page 1. Report No. DOT/FAA/TC-TN13/49
2. Government Accession No. 3. Recipient’s Catalog No.
4. Title and Subtitle
SpaceX Falcon 9/Dragon Operations NAS Impact and Operational Analysis
5. Report Date January 2014 6. Performing Organization Code ANG-C41
7. Author(s) Jessica Young Marie Kee
8. Performing Organization Report No. DOT/FAA/TC-TN13/49
9. Performing Organization Name and Address U. S. Department of Transportation Federal Aviation Administration, William J. Hughes Technical Center Atlantic City International Airport, NJ 08405
10. Work Unit No. (TRAIS) 11. Contract or Grant No.
12. Sponsoring Agency Name and Address U. S. Department of Transportation NextGen Implementation and Integration Office Washington, D. C. 20590
13. Type of Report and Period Covered Technical Note 14. Sponsoring Agency Code DOT
15. Supplementary Notes The authors identified above represent the FAA NextGen Concept Analysis Branch (ANG-C41).
16. Abstract This document describes the objectives, methods, analyses, and results of a study used to both identify and quantify the current day operational impacts of commercial space launch and reentry operations on the National Airspace System (NAS). Statistical analyses were performed to determine if these operations caused flights to experience significantly longer flight distances, more fuel burned, and longer flight durations as compared to similar flights on other days. Strategies used by air traffic controllers to minimize the impact of space vehicle operations on the NAS were identified using the visualization tool FliteViz4D and an internally developed program to calculate the minimum distance of each flight to each space vehicle operation restricted airspace. Results of this study are critical to accurately representing the NAS impact of commercial space operations in planned fast-time simulation activities that will follow. The FAA’s Concept Analysis Branch studied a historical launch and reentry operation to quantify the current NAS impact of commercial space operations and to identify air traffic control (ATC) practices used to minimize this impact. On March 1, 2013, the SpaceX Falcon 9/Dragon capsule was launched from Cape Canaveral Air Force Station in Florida. Several restricted airspaces were activated to protect air traffic from debris in the event of a vehicle explosion. After being docked to the International Space Station, the Dragon capsule splashed down in the Pacific Ocean off the coast of California on March 26, 2013. This reentry also required a restricted airspace to block traffic from entering the potentially dangerous airspace.
17. Key Words NextGen, Space Vehicle Operations, Space Vehicle Operation, SVO, Space Vehicle Operation Integration in the NAS, SpaceX Dragon, SpaceX, Dragon, SVO Impact Analysis, SVO Impact, Impact Analysis, Restricted Airspace, Hazard Areas, Cape Canaveral Air Force Station, Cape Canaveral, Launch Operation, Reentry Operation, Launch, Reentry
18. Distribution Statement This report is approved for public release and is on file at the William J. Hughes Technical Center, Aviation Security Research and Development Library, Atlantic City International Airport, New Jersey 08405. This document is available to the public through the National Technical Information Service, Springfield, Virginia, 22161.
19. Security Classif. (of this report) Unclassified
20. Security Classif. (of this page) Unclassified
21. No. of Pages 54
22. Price
Form DOT F 1700.7 (8-72) Reproduction of completed page authorized
v

[THIS PAGE IS INTENTIONALLY LEFT BLANK]
6
Acknowledgements This study could not have been conducted without help from several key contributors. The authors of this paper would like to thank: Kevin Hatton (FAA – SVO project lead) and Mike Paglione (FAA – ANG-C41 manager) for their valuable project direction and inspiration; Chris Gomes (Booz Allen Hamilton) for his support in obtaining information on the launch and reentry; Chu Yao (FAA) and Robert Oaks (GDIT) for their hard work in collecting and processing the large amounts of traffic data used in this study; Andrew Fabian (FAA) and Nicole Nelson (FAA) for developing critical analysis and visualization tools tailored to this activity; and finally, Christina Young (FAA) for the long hours spent helping dive through the data.
7

[THIS PAGE IS INTENTIONALLY LEFT BLANK]
8
Executive Summary With the introduction of commercial space operators, space vehicle operations are expected to greatly increase in the coming years. Each launch and reentry requires the space vehicle to pass through the National Airspace System (NAS), resulting in large amounts of airspace blocked for air traffic. The Federal Aviation Administration (FAA) is conducting research to evaluate the potential impact of future commercial space operations and explore the benefits of proposed mitigation strategies. In this study, the FAA’s Concept Analysis Branch studied a historical launch and reentry to quantify the current NAS impact of commercial space operations and to identify air traffic control (ATC) practices used to minimize this impact. On March 1, 2013, the SpaceX Falcon 9/Dragon capsule was launched from Cape Canaveral Air Force Station in Florida. Several Special Activity Airspaces (SAAs) were activated to protect air traffic from debris in the event of a vehicle explosion. After being docked to the International Space Station, the Dragon capsule reentered the atmosphere and splashed down in the Pacific Ocean off the coast of California on March 26, 2013. This reentry also required an SAA to block air traffic from entering the potentially dangerous airspace. A statistical analysis was performed to determine if these operations caused flights to experience significantly longer routes of flight, more fuel burned, and longer flight durations as compared to similar flights on comparable days. Strategies used by air traffic controllers to minimize the impact of space operations on the NAS were identified using the visualization tool FliteViz4D and an internally developed program to calculate the minimum distance of each flight to each SAA. Results showed that flights in the Jacksonville and Miami Air Route Traffic Control Centers (ARTCCs) during the launch were significantly impacted by the operation. The Falcon 9/Dragon launch caused impacted flights to fly between 25 and 84 Nautical Miles (NM) longer, burn between 275 and 2,387 pounds (lbs) more fuel, and fly between 1 and 23 minutes (min) longer as compared to similar days with no launch activity. However, the launch operation did not negatively impact the total hourly operations at key Florida airports. The reentry analysis showed that flights traveling to or from Hawaii and Australia would be impacted by the reentry operation, but domestic and other international flights would be minimally impacted. Flights to or from Hawaii and Australia flew between 15 and 27 NM more, burned between 458 and 576 lbs more fuel, and flew between 1.5 and 7 min longer to avoid the reentry airspace. Also, an operational analysis showed that ATC procedures aim to minimize the impact of the commercial space operations. Controllers allow air traffic to use the restricted airspace as soon as the potential danger to aircraft has passed. Also, over 1,200 flights fly within 1NM of the launch and reentry SAAs, indicating that controllers utilize all available airspace surrounding the operation. Information on impacts and avoidance strategies will be used to develop an accurate representation of space operations in a fast-time simulation. The SpaceX operation examined in this analysis will be duplicated in a fast-time simulation environment. Thus, the research conducted in this study will help to create an accurate simulation of current air traffic control procedures related to commercial space operations.
9
Table of Contents EXECUTIVE SUMMARY ........................................................................................................................ 9
TABLE OF CONTENTS ......................................................................................................................... 10
LIST OF TABLES .................................................................................................................................... 11
LIST OF FIGURES .................................................................................................................................. 11
1 INTRODUCTION ............................................................................................................................. 12
1.1 PURPOSE ......................................................................................................................................... 12 1.2 BACKGROUND ................................................................................................................................ 12 1.3 DOCUMENT ORGANIZATION .......................................................................................................... 13
2 STUDY METHODOLOGY ............................................................................................................. 14
2.1 METRIC SELECTION ....................................................................................................................... 14 2.2 ANALYSIS DESIGN ......................................................................................................................... 14
2.2.1 Models and Tools ................................................................................................................ 15 2.2.2 Scope ................................................................................................................................... 16 2.2.3 Assumptions and Limitations .............................................................................................. 20
3 ANALYSIS ........................................................................................................................................ 21
3.1 METHODS OF ANALYSIS................................................................................................................. 21 3.2 RESULTS ......................................................................................................................................... 23
3.2.1 Impact of SpaceX Launch Operations in ZJX and ZMA ..................................................... 23 3.2.2 Impact of SpaceX Reentry Operations in ZOA and ZLA ..................................................... 27 3.2.3 Identified Operational Practices for SAA Avoidance ......................................................... 30
4 CONCLUSIONS AND NEXT STEPS ............................................................................................ 33
LIST OF ACRONYMS ............................................................................................................................ 35
REFERENCES .......................................................................................................................................... 36
APPENDIX A: WEATHER IMAGES .................................................................................................... 37
APPENDIX B: SPACEX LAUNCH OPERATION SAA DEFINITIONS .......................................... 41
10
List of Tables Table 1. Reduction of Number of Flights in Analysis ................................................................................ 16 Table 2. Number of Flights in Launch Analysis ......................................................................................... 16 Table 3. Number of Flights in Reentry Analysis ........................................................................................ 17 Table 4. SpaceX Falcon 9/Dragon SAA Definitions .................................................................................. 18 Table 5. Flight Distance Analysis for Launch ............................................................................................ 24 Table 6. Fuel Burn Analysis for Launch ..................................................................................................... 24 Table 7. Flight Duration Analysis for Launch ............................................................................................ 25 Table 8. Flight Distance Analysis for Reentry ............................................................................................ 28 Table 9. Fuel Burn Analysis for Reentry .................................................................................................... 29 Table 10. Flight Duration Analysis for Reentry ......................................................................................... 30 Table 11. Average Flight Proximity to SAAs ............................................................................................. 33
List of Figures Figure 1. Falcon 9 Launch SAA ................................................................................................................. 19 Figure 2. Dragon Reentry SAA................................................................................................................... 20 Figure 3. Typical Flight Paths in Launch Day SAAs.................................................................................. 22 Figure 4. Typical Flight Paths in Reentry Day SAA .................................................................................. 23 Figure 5. Florida Airport Throughput by Analysis Day ............................................................................. 26 Figure 6. Flights Entering Launch SAAs .................................................................................................... 31 Figure 7. Flight Entering Reentry SAA ...................................................................................................... 32 Figure 8. Weather Map for March 1, 2013 – Falcon 9/Dragon Launch ..................................................... 37 Figure 9. Weather Map for March 26, 2013 - Dragon Reentry .................................................................. 37 Figure 10. Weather Map for February 28, 2013 ......................................................................................... 38 Figure 11. Weather Map for March 2, 2013 ............................................................................................... 38 Figure 12. Weather Map for March 3, 2013 ............................................................................................... 39 Figure 13. Weather Map for March 7, 2013 ............................................................................................... 39 Figure 14. Weather Map for March 27, 2013 ............................................................................................. 40 Figure 15. Warning Area W497A_Patrick_AFB#1 .................................................................................... 41 Figure 16. Warning Area W-497A_Patrick_AFB_Whole .......................................................................... 42 Figure 17. Temporary Flight Restriction TFR_KSC .................................................................................. 43 Figure 18. Hazard Area Downrange_AC_Hit_HA ..................................................................................... 44 Figure 19. Hazard Area First_Stage_Impact_HA ....................................................................................... 45 Figure 20. Hazard Area Launch_Danger_AC_Hit_HA .............................................................................. 46 Figure 21. Hazard Area Launch_Danger_AC_Hit_WA ............................................................................. 47 Figure 22. Restricted Airspace R-2933_Cape_Canaveral .......................................................................... 48 Figure 23. Restricted Airspace R-2934_Cape_Canaveral#1 and #2 ........................................................... 49 Figure 24. Hazard Area Dragon_ReEntry_Stationary_Reserve_HA .......................................................... 50
11
1 Introduction President Lyndon B. Johnson once said, “if I could get one message to you it would be this: the future of this country and the welfare of the free world depends upon our success in space. There is no room in this country for any but a fully cooperative, urgently motivated all-out effort toward space leadership. No one person, no one company, no one government agency, has a monopoly on the competence, the missions, or the requirements for the space program1.” While this was said many years ago, its spirit is more alive today than it ever has been. With the introduction of commercial space operators, space vehicle operations are expected to greatly increase in the coming years2. Each launch and reentry requires the vehicle to pass through the National Airspace System (NAS), resulting in large amounts of airspace blocked for air traffic. This study aimed to quantify the impact of current commercial space operations on the NAS and to identify air traffic control (ATC) practices used to minimize this impact. To do this, a historical launch and reentry was examined. On March 1, 2013, the SpaceX Falcon 9 was launched from Cape Canaveral Air Force Station in Florida. Several Special Activity Airspaces (SAAs) were activated to protect air traffic from debris in the event of an operational failure. After being docked to the International Space Station, the Dragon capsule splashed down in the Pacific Ocean just off the coast of California on March 26, 2013. This reentry also required an airspace restriction to block traffic from entering the potentially dangerous airspace. Using several methods of analysis, the Federal Aviation Administration’s (FAA) Concept Analysis Branch (ANG-C41) studied the Falcon 9 launch and Dragon reentry to quantify the impact of these operations on air traffic. A statistical analysis was performed to determine if the operations caused flights to experience significantly longer routes of flight, more fuel burned, and longer flight durations as compared to similar flights on comparable days. Strategies used by air traffic controllers to minimize the impact of space operations on the NAS were identified using a visualization tool FliteViz4D3 and an internally developed program to calculate the minimum distance of each flight to each SAA. Information on impacts and avoidance strategies will be used to develop an accurate representation of this SpaceX operation in a fast-time simulation. The research conducted in this study will help to create a realistic simulation of current air traffic control procedures related to commercial space operations.
1.1 Purpose The goal of this study was to understand the current day impacts of commercial space launch and reentry operations on the NAS. This research attempted to identify and quantify the operational impacts through the metrics of flight distance, flight duration, and fuel burn. Results of this study are critical to accurately representing the NAS impact of SpaceX operations in a planned fast-time simulation activity that will follow.
1.2 Background From the beginning of recorded history, humans have had an unyielding fascination with outer space. Over the past century in the United States, space operations have typically been planned, organized, and executed by government entities. With the recent decommissioning of the National Aeronautics and Space Administration’s (NASA) Space Shuttle program and the recent allowance for research and development of Commercial Orbital Transportation Services, new innovations are rapidly ushering in an unprecedented day of space operations and potentially making it accessible to more people.
12
Historically, space vehicle operations have been infrequent, isolated events that were primarily handled by NASA, some entity of Department of Defense (DOD), or a collaboration of the two. To ensure the safety of other NAS operators (i.e. airline operators, general aviation operators, etc.), these organizations would coordinate with the affected FAA Air Traffic Management team to both block and manage airspace that could be impacted by space vehicle operations. This coordination would be executed through a combination of Notices to Airmen (NOTAMs), Temporary Flight Restrictions (TFRs), Special Activity Airspace (SAA), Central Altitude Reservation Function (CARF), Command Center Advisories (CCAs), and manual air traffic situational display entries done in real-time4. As the number of commercial space operations increase over the next decade, the existing procedures and processes for both managing and coordinating space operations will not be able to efficiently accommodate this expansion of the NAS environment. Consequently, different architectures, tools, procedures, and processes must be researched and developed in order to minimize the impact of space operations on the NAS and make the NAS safe for every user.
1.3 Document Organization The remainder of this document provides details on the methodology used to conduct this study, the results of the analysis, and conclusions and next steps. Section 2 provides detailed information on the study metrics and analysis design. The scope of the study is defined and a list of tools and data utilized in the study is provided. Analysis assumptions and limitations are acknowledged in this section as well. The analytical methods and results are included in Section 3, and conclusions drawn from the analyses and future work are discussed in Section 4. This document includes three Appendices. Appendix A includes figures showing Nexrad weather images obtained from a NOAA website for each of the days analyzed in this study6. The amount and levels of weather for each day are comparable to each other, reducing the potential variability between days. In Appendix B, visual depictions are provided of each individual SAA used for the Falcon 9 launch on March 1, 2013 and the Dragon reentry on March 26, 2013. Appendix C and D contain the NOTAMs issued for the launch and reentry.
13
2 Study Methodology This study focused on understanding the current day impacts of commercial space launch/reentry vehicle operations on air traffic in affected ARTCCs. To accomplish this, the SpaceX Falcon 9 launch and Dragon reentry were studied. The launch occurred on March 1, 2013, and the reentry occurred on March 26, 2013. Air traffic data from Miami and Jacksonville ARTCCs (ZMA and ZJX) on March 1 and from Oakland and Los Angeles ARTCCs (ZOA and ZLA) on March 26 was analyzed and compared against a sample of five chosen days to quantify the impact of the launch and reentry on other air traffic. This data was also used to determine the proximity of flights to the SAAs during their activation times. ANG-C41’s internally developed visualization tool FliteViz4D was used to view traffic patterns and typical operations surrounding the launch and reentry sites.
2.1 Metric Selection The following metrics were used to quantify the impact of the Falcon 9 launch and Dragon reentry on neighboring commercial and general aviation flights.
Total Flight Duration
This metric represents the total time a flight flew in the NAS. If the flight is domestic, the total flight duration is the amount of time from takeoff to landing. If the flight is international, the amount of time outside of NAS airspace is not included in this metric.
Total Fuel Burned This metric reflects the total amount of fuel that was used during the flight while in NAS airspace. As with flight duration, the fuel burn value for international flights does not include portions of the flight outside of the NAS.
Total Distance Flown The total distance of the flight in NAS airspace is represented by this metric. If a flight is international, the total distance will only include the portion flown within the NAS.
2.2 Analysis Design Flights that deviated from their normal flight plan to avoid the launch or reentry areas were not easily identified. NOTAMs were distributed well in advance of the airspace restriction; thus, many flight plans were adjusted to avoid the defined SAAs before their departure, eliminating the ability to quantify the impact of the launch or reentry on each flight by comparing its filed flight plan against the route it actually flew. While this direct comparison would be ideal, it was not feasible for this study. Therefore, flights in the impacted ARTCCs on the launch and reentry days were compared against similar flights on comparable days. Five days were chosen to compare against the launch and reentry days, March 1 and March 26. These days were selected to minimize constraint differences with the launch and reentry days. The five days chosen for the comparison are listed below.
• February 28, 2013 • March 2, 2013 • March 3, 2013 • March 7, 2013
14
• March 27, 2013 The five comparison days were all in the same season as the launch and reentry days and had similar levels of weather. It was important to limit the variability among all seven days to minimize additional impacts from other constraints on the NAS (such as weather or military operations). Pictures of the weather activity on the five comparison days as well as the launch and reentry days are in Appendix A.
2.2.1 Models and Tools ANG-C41 develops and maintains numerous analytical tools with an emphasis on flight data processing, metric calculations, and conflict prediction. Commercial products are also used for statistical analyses. The tools used in this study are described below.
2.2.1.1 Scenario Merger Flight data is typically provided for an individual airspace; however, some analyses require a unified NAS traffic file. To create a NAS traffic file, flight data from separate centers are merged through ANG-C41’s Scenario Merger program. This tool attempts to identify flights that appear in multiple ARTCCs and merge their tracks to create one flight profile across the NAS. It looks for matching aircraft identifiers, origins, destinations, aircraft types, and other unique characteristics. Scenario Merger was used in this study to create a traffic file for the launch and reentry days as well as the five comparison days. This was done to increase accuracy in the fuel burn statistics.
2.2.1.2 Aircraft Fuel Evaluation Simulation Tools (AFEST) The Aircraft Fuel Evaluation Simulation Tools (AFEST) is a suite of tools that provide fuel evaluation functionality for recorded and simulated aircraft. The two main tools provided by the suite are the Fuel Burn Calculator and the Takeoff Weight Finder. AFEST makes use of wind data as well as the EUROCONTROL Base of Aircraft Data (BADA) performance model. AFEST was used to calculate fuel burn and flight distance for each flight in the analysis.
2.2.1.3 General Polygon Tracker The General Polygon Tracker was developed specifically for this task. This program uses SAA polygon definitions and flight data to calculate a flight’s closest point of proximity to each SAA. The data provided by this tool was used to identify flights that entered SAAs while they were still active, the time flights started entering active SAAs, and potentially impacted city pair flight paths.
2.2.1.4 JMP Statistical Software The statistical software product JMP® was used to analyze the impacts of the launch and reentry operations on air traffic data. JMP is a product of the SAS Institute that provides a user-friendly graphical interface to perform descriptive and inferential statistical analyses and allows the user to easily manipulate data tables and create meaningful graphs.
2.2.1.5 FliteViz4D FliteViz4D is an interactive three-dimensional visualization tool for air traffic data built by ANG-C41. For this project, the capability was added to display a three dimensional SAA. Using this new option and its ability to animate flight paths, users can view the air traffic data with the space operation SAA and see the rerouted aircraft from all angles with a high level of detail. This tool was useful in identifying avoidance strategies used by air traffic control to minimize the impact of space operations on the NAS.
15
2.2.2 Scope A large amount of air traffic data was collected and processed for this study. SAA information was obtained through NOTAMs for the launch and reentry days. Actual space vehicle trajectories were not needed for this study as they were completely encompassed by the SAA. The data types and processing are described below.
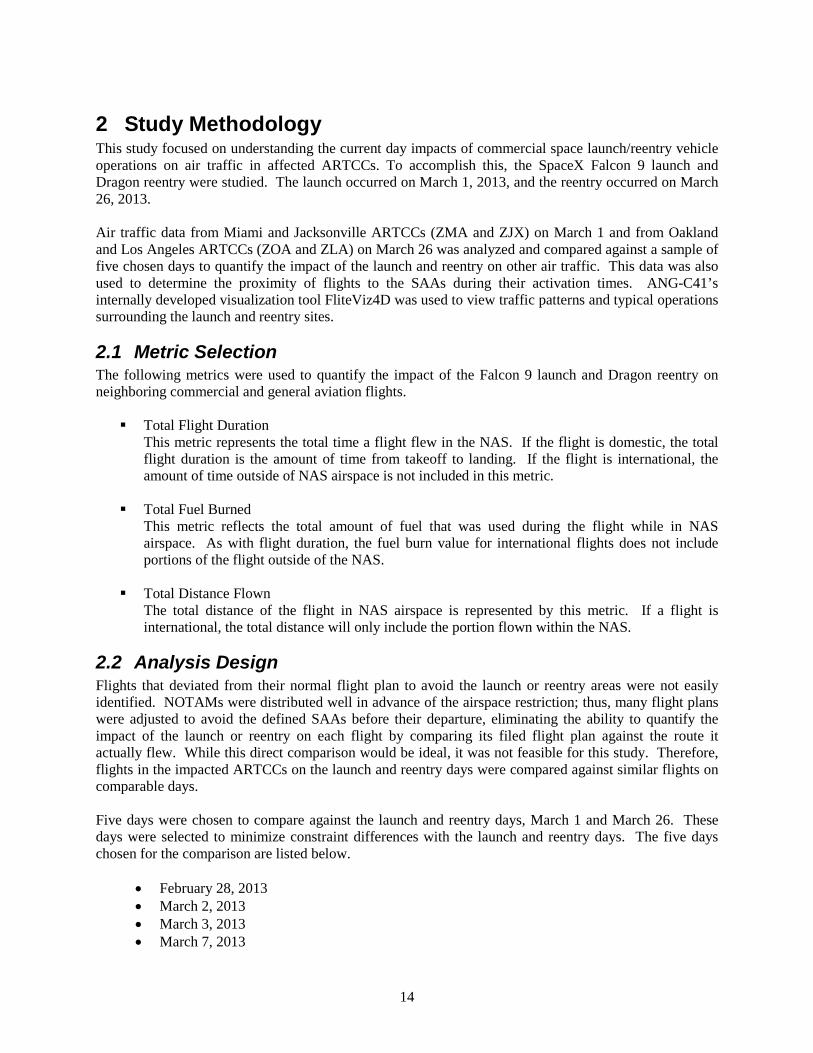
2.2.2.1 Traffic Data Common Message Set (CMS) data was collected for all twenty ARTCCs in the NAS on the launch and reentry days as well as the five comparison days5. This data includes all recorded flight information while a flight is within the ARTCC; therefore, portions of a flight that are outside the ARTCC are not included in the CMS data. The ARTCC traffic data from CMS was uploaded to ANG-C41 databases and run through the Scenario Merger tool, creating one NAS traffic file for each of the days in the analysis. The duration of each flight was obtained from these merged files. The NAS traffic files were then run through AFEST to calculate fuel burn and flight distance statistics. The NAS traffic files were necessary to obtain accurate fuel burn values for each flight. Once tools were run on the NAS traffic files to obtain the metric values, the appropriate data was extracted from the tables. Since the analysis focuses on the Florida and California ARTCCs only, flights that did not enter these airspaces were removed from the data. This reduced the number of flights in the analysis as shown in Table 1. Additional flights were then removed due to incomplete or inaccurate data. For some flights, only partial data was provided in CMS. For example, international flights have large portions of flight data missing because they originated or landed outside the range of NAS radars. In this analysis, only international flights that were identified by the General Polygon Tracker as potentially affected by the space operations were kept in the dataset. Other partial flights and those not correctly merged were removed from the analysis. Tables 2 and 3 below show this reduction in the number of flights used in the analysis.
Number of Flights 02/28/13 03/01/13 Launch 03/02/13 03/03/13 03/07/13 03/26/13
Reentry 03/27/13
NAS Traffic Files 7109 7251 7251 7208 7168 6763 4374 Removed from Analysis 3653 5719 3676 3743 3621 4725 2191
Retained for Analysis 3456 1532 3575 3465 3547 2038 2183
Table 1. Reduction of Number of Flights in Analysis
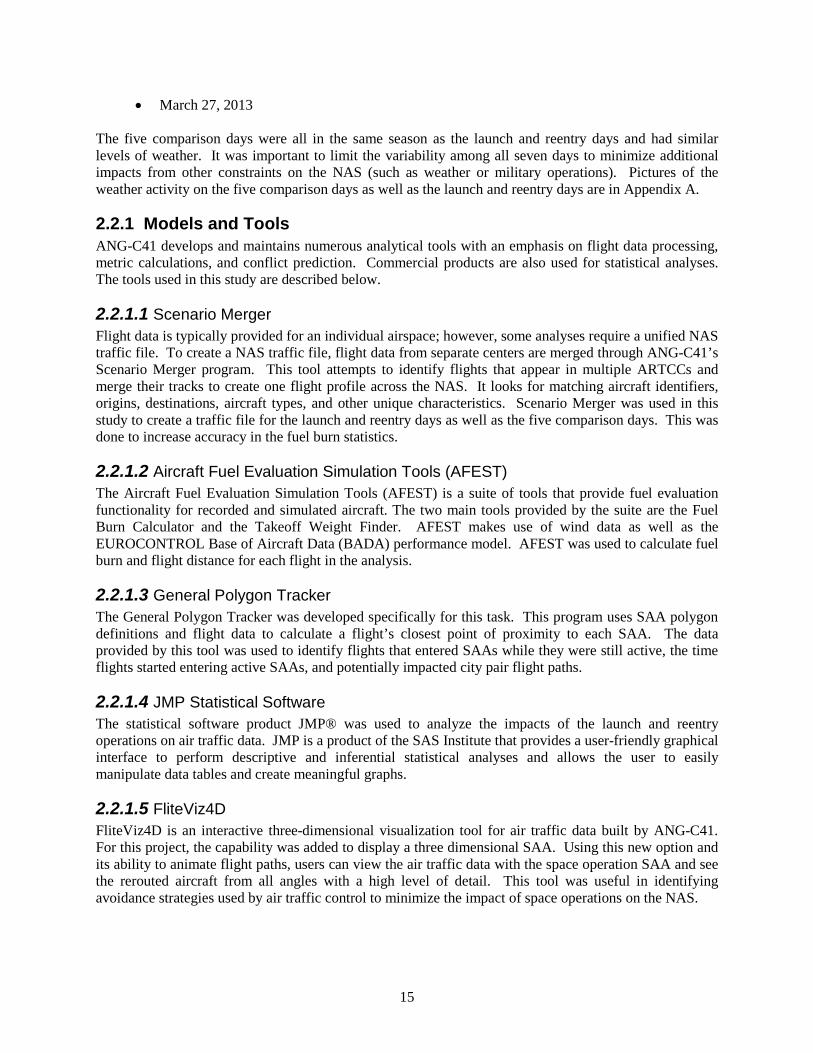
Number of Flights 02/28/13 03/01/13 Launch 03/02/13 03/03/13 03/07/13 03/27/13
ZJX and ZMA Traffic Files 1431 1532 1519 1542 1489 908 Removed from Launch Analysis 544 604 594 590 550 315
Used in Launch Analysis 887 928 925 952 939 593
Table 2. Number of Flights in Launch Analysis
16
Number of Flights 02/28/13 03/02/13 03/03/13 03/07/13 03/26/13 Reentry 03/27/13
ZLA and ZOA Traffic Files 2025 2056 1923 2058 2038 1275 Removed from Reentry Analysis 363 429 398 383 1532 200
Used in Reentry Analysis 1662 1627 1525 1675 506 1075
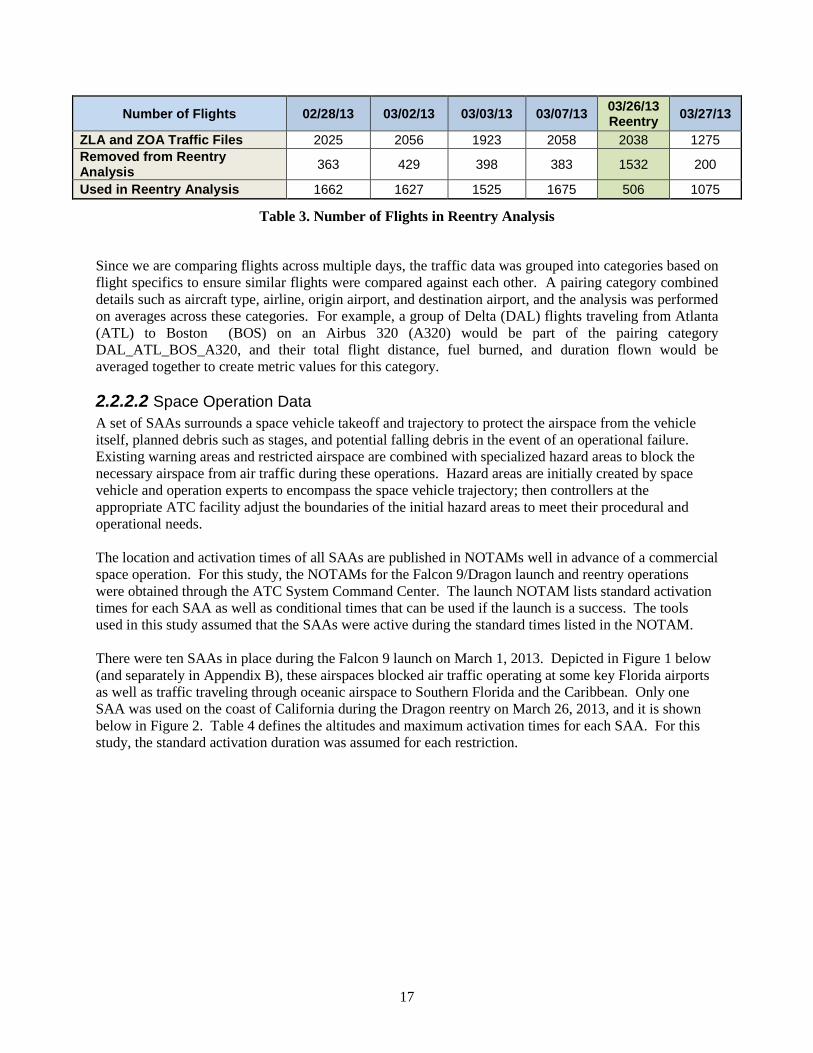
Table 3. Number of Flights in Reentry Analysis
Since we are comparing flights across multiple days, the traffic data was grouped into categories based on flight specifics to ensure similar flights were compared against each other. A pairing category combined details such as aircraft type, airline, origin airport, and destination airport, and the analysis was performed on averages across these categories. For example, a group of Delta (DAL) flights traveling from Atlanta (ATL) to Boston (BOS) on an Airbus 320 (A320) would be part of the pairing category DAL_ATL_BOS_A320, and their total flight distance, fuel burned, and duration flown would be averaged together to create metric values for this category.
2.2.2.2 Space Operation Data A set of SAAs surrounds a space vehicle takeoff and trajectory to protect the airspace from the vehicle itself, planned debris such as stages, and potential falling debris in the event of an operational failure. Existing warning areas and restricted airspace are combined with specialized hazard areas to block the necessary airspace from air traffic during these operations. Hazard areas are initially created by space vehicle and operation experts to encompass the space vehicle trajectory; then controllers at the appropriate ATC facility adjust the boundaries of the initial hazard areas to meet their procedural and operational needs. The location and activation times of all SAAs are published in NOTAMs well in advance of a commercial space operation. For this study, the NOTAMs for the Falcon 9/Dragon launch and reentry operations were obtained through the ATC System Command Center. The launch NOTAM lists standard activation times for each SAA as well as conditional times that can be used if the launch is a success. The tools used in this study assumed that the SAAs were active during the standard times listed in the NOTAM. There were ten SAAs in place during the Falcon 9 launch on March 1, 2013. Depicted in Figure 1 below (and separately in Appendix B), these airspaces blocked air traffic operating at some key Florida airports as well as traffic traveling through oceanic airspace to Southern Florida and the Caribbean. Only one SAA was used on the coast of California during the Dragon reentry on March 26, 2013, and it is shown below in Figure 2. Table 4 defines the altitudes and maximum activation times for each SAA. For this study, the standard activation duration was assumed for each restriction.
17
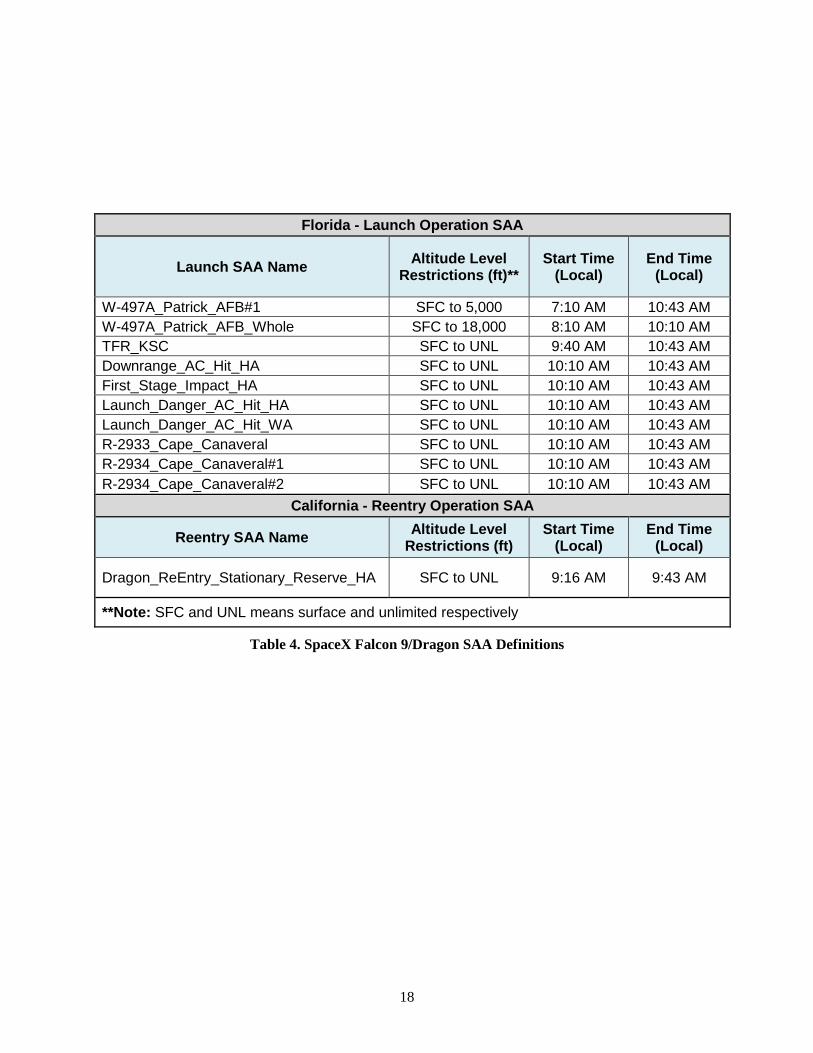
Florida - Launch Operation SAA
Launch SAA Name Altitude Level Restrictions (ft)**
Start Time (Local)
End Time (Local)
W-497A_Patrick_AFB#1 SFC to 5,000 7:10 AM 10:43 AM W-497A_Patrick_AFB_Whole SFC to 18,000 8:10 AM 10:10 AM TFR_KSC SFC to UNL 9:40 AM 10:43 AM Downrange_AC_Hit_HA SFC to UNL 10:10 AM 10:43 AM First_Stage_Impact_HA SFC to UNL 10:10 AM 10:43 AM Launch_Danger_AC_Hit_HA SFC to UNL 10:10 AM 10:43 AM Launch_Danger_AC_Hit_WA SFC to UNL 10:10 AM 10:43 AM R-2933_Cape_Canaveral SFC to UNL 10:10 AM 10:43 AM R-2934_Cape_Canaveral#1 SFC to UNL 10:10 AM 10:43 AM R-2934_Cape_Canaveral#2 SFC to UNL 10:10 AM 10:43 AM
California - Reentry Operation SAA
Reentry SAA Name Altitude Level Restrictions (ft)
Start Time (Local)
End Time (Local)
Dragon_ReEntry_Stationary_Reserve_HA SFC to UNL 9:16 AM 9:43 AM
**Note: SFC and UNL means surface and unlimited respectively
Table 4. SpaceX Falcon 9/Dragon SAA Definitions
18
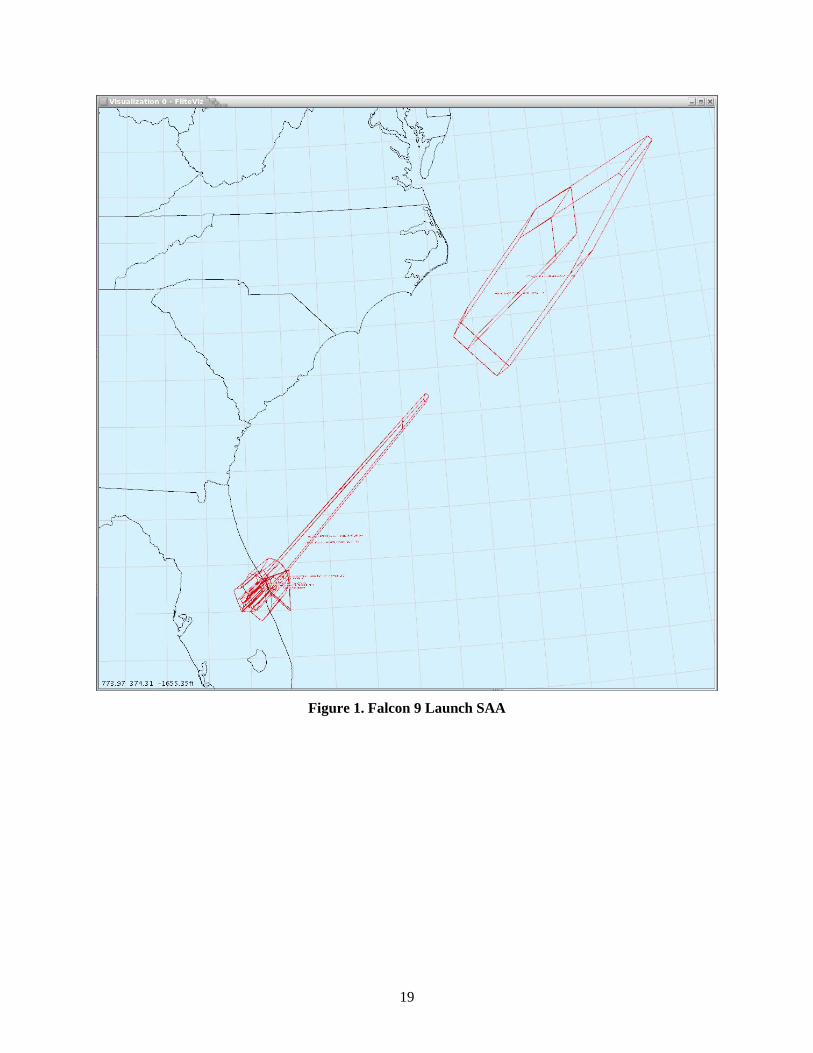
Figure 1. Falcon 9 Launch SAA
19
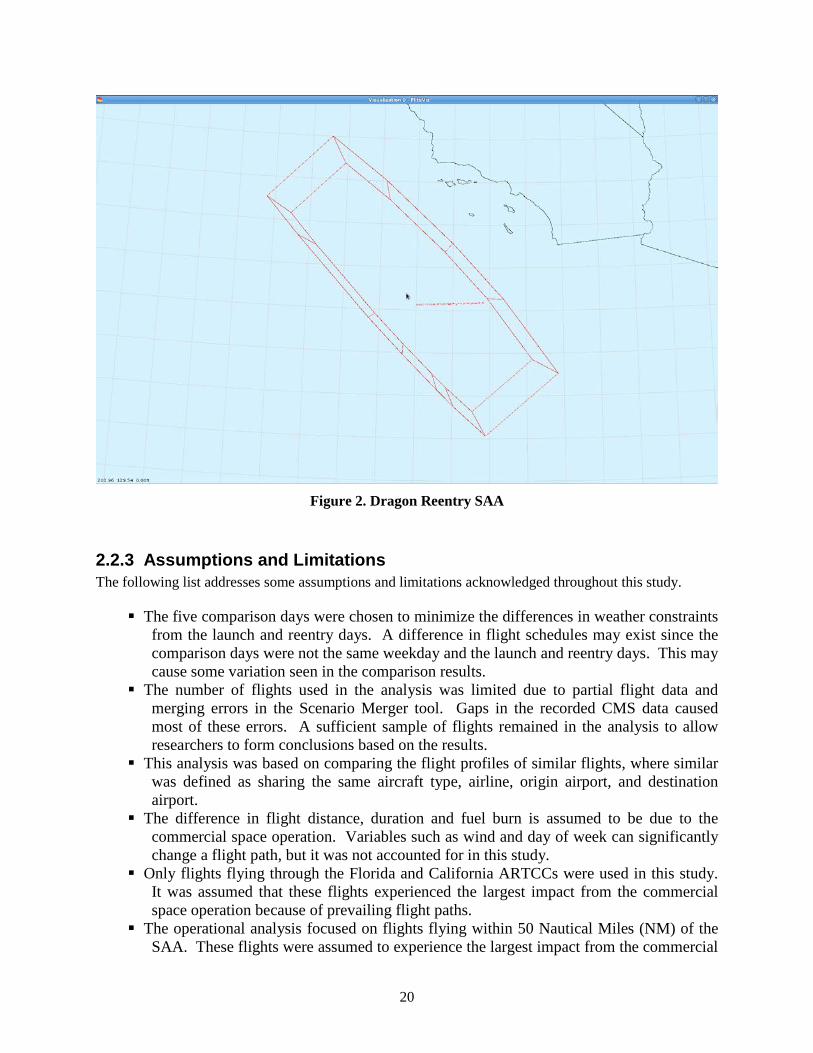
Figure 2. Dragon Reentry SAA
2.2.3 Assumptions and Limitations The following list addresses some assumptions and limitations acknowledged throughout this study.
The five comparison days were chosen to minimize the differences in weather constraints from the launch and reentry days. A difference in flight schedules may exist since the comparison days were not the same weekday and the launch and reentry days. This may cause some variation seen in the comparison results.
The number of flights used in the analysis was limited due to partial flight data and merging errors in the Scenario Merger tool. Gaps in the recorded CMS data caused most of these errors. A sufficient sample of flights remained in the analysis to allow researchers to form conclusions based on the results.
This analysis was based on comparing the flight profiles of similar flights, where similar was defined as sharing the same aircraft type, airline, origin airport, and destination airport.
The difference in flight distance, duration and fuel burn is assumed to be due to the commercial space operation. Variables such as wind and day of week can significantly change a flight path, but it was not accounted for in this study.
Only flights flying through the Florida and California ARTCCs were used in this study. It was assumed that these flights experienced the largest impact from the commercial space operation because of prevailing flight paths.
The operational analysis focused on flights flying within 50 Nautical Miles (NM) of the SAA. These flights were assumed to experience the largest impact from the commercial
20
space operation. Flights that did not fly within 50NM of the SAA were excluded from the analysis.
3 Analysis This study was broken into three separate analyses: one analysis to quantify the impact of the Falcon 9/Dragon launch, a second quantifying the impact of the Dragon reentry, and the third identifying ATC operations to minimize this impact on the NAS. Both the impact analyses and the operational analysis will support the development of a fast-time simulation. Only flights traveling through the Florida ARTCCs (ZJX and ZMA) and California ARTCCs (ZOA and ZLA) were included in all analyses.
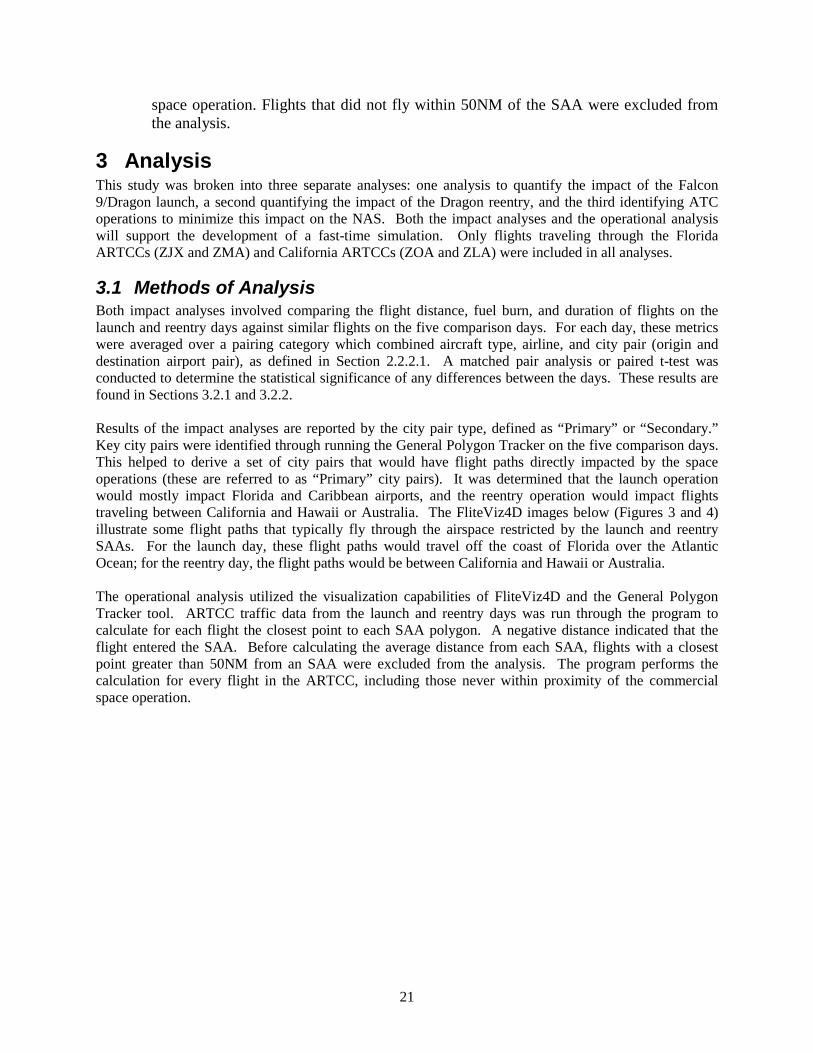
3.1 Methods of Analysis Both impact analyses involved comparing the flight distance, fuel burn, and duration of flights on the launch and reentry days against similar flights on the five comparison days. For each day, these metrics were averaged over a pairing category which combined aircraft type, airline, and city pair (origin and destination airport pair), as defined in Section 2.2.2.1. A matched pair analysis or paired t-test was conducted to determine the statistical significance of any differences between the days. These results are found in Sections 3.2.1 and 3.2.2. Results of the impact analyses are reported by the city pair type, defined as “Primary” or “Secondary.” Key city pairs were identified through running the General Polygon Tracker on the five comparison days. This helped to derive a set of city pairs that would have flight paths directly impacted by the space operations (these are referred to as “Primary” city pairs). It was determined that the launch operation would mostly impact Florida and Caribbean airports, and the reentry operation would impact flights traveling between California and Hawaii or Australia. The FliteViz4D images below (Figures 3 and 4) illustrate some flight paths that typically fly through the airspace restricted by the launch and reentry SAAs. For the launch day, these flight paths would travel off the coast of Florida over the Atlantic Ocean; for the reentry day, the flight paths would be between California and Hawaii or Australia. The operational analysis utilized the visualization capabilities of FliteViz4D and the General Polygon Tracker tool. ARTCC traffic data from the launch and reentry days was run through the program to calculate for each flight the closest point to each SAA polygon. A negative distance indicated that the flight entered the SAA. Before calculating the average distance from each SAA, flights with a closest point greater than 50NM from an SAA were excluded from the analysis. The program performs the calculation for every flight in the ARTCC, including those never within proximity of the commercial space operation.
21
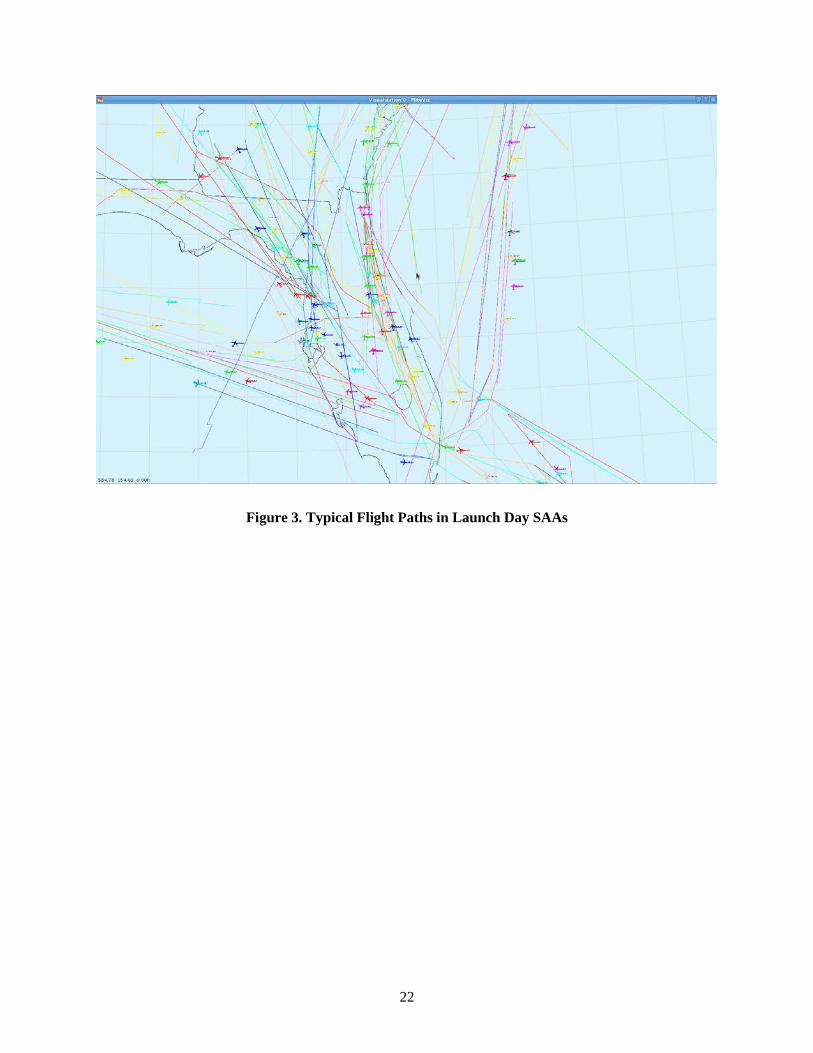
Figure 3. Typical Flight Paths in Launch Day SAAs
22
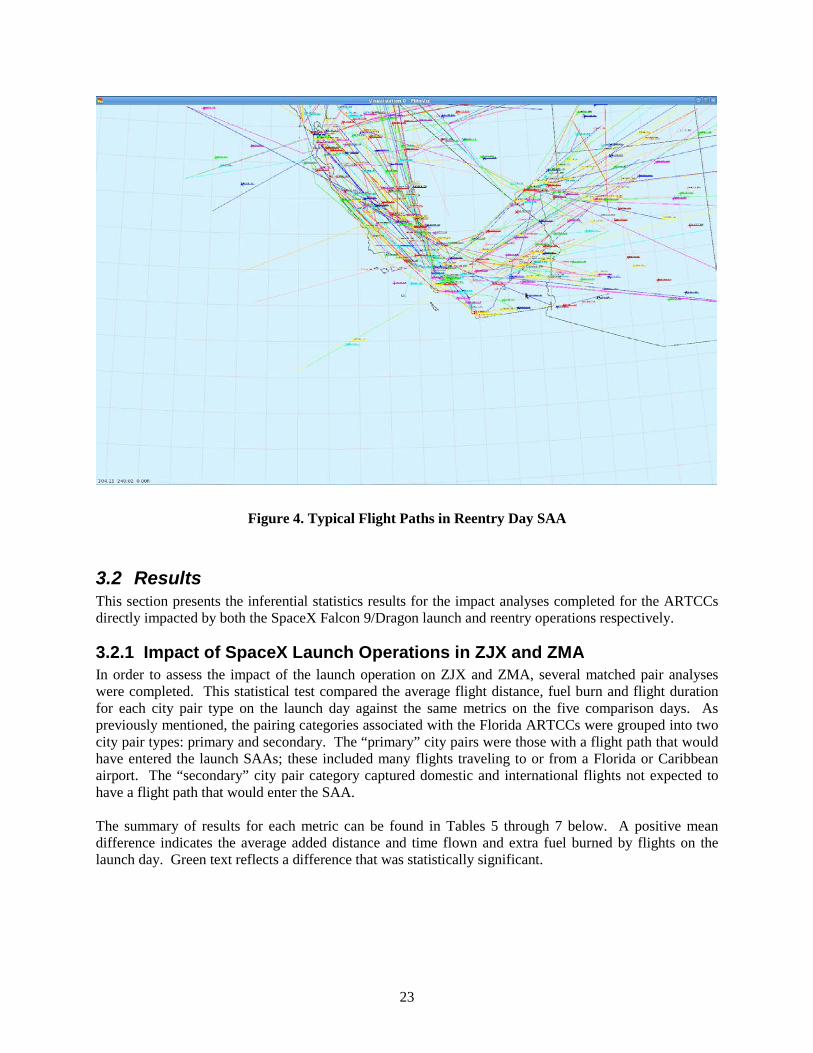
Figure 4. Typical Flight Paths in Reentry Day SAA
3.2 Results This section presents the inferential statistics results for the impact analyses completed for the ARTCCs directly impacted by both the SpaceX Falcon 9/Dragon launch and reentry operations respectively.
3.2.1 Impact of SpaceX Launch Operations in ZJX and ZMA In order to assess the impact of the launch operation on ZJX and ZMA, several matched pair analyses were completed. This statistical test compared the average flight distance, fuel burn and flight duration for each city pair type on the launch day against the same metrics on the five comparison days. As previously mentioned, the pairing categories associated with the Florida ARTCCs were grouped into two city pair types: primary and secondary. The “primary” city pairs were those with a flight path that would have entered the launch SAAs; these included many flights traveling to or from a Florida or Caribbean airport. The “secondary” city pair category captured domestic and international flights not expected to have a flight path that would enter the SAA. The summary of results for each metric can be found in Tables 5 through 7 below. A positive mean difference indicates the average added distance and time flown and extra fuel burned by flights on the launch day. Green text reflects a difference that was statistically significant.
23
Flight Distance Analyses Number of Flights
Mean Difference (NM)
Standard Error (NM) > P-value Significant?
(α level = 0.05)
03/01 - 02/28 (Primary) 9 35.7957 6.4066 0.0003 Yes 03/01 - 02/28 (Secondary) 234 25.3755 1.8600 0.0001 Yes
03/01 - 03/02 (Primary) 11 50.1063 17.3919 0.0082 Yes
03/01 - 03/02 (Secondary) 213 24.9962 2.0291 0.0001 Yes
03/01 - 03/03 (Primary) 10 84.1118 25.0905 0.0042 Yes
03/01 - 03/03 (Secondary) 206 27.8795 1.9297 0.0001 Yes
03/01 - 03/07 (Primary) 8 29.9077 12.4974 0.0240 Yes
03/01 - 03/07 (Secondary) 236 25.2494 1.9309 0.0001 Yes
03/01 - 03/27 (Primary) 10 32.4967 12.7810 0.0158 Yes
03/01 - 03/27 (Secondary) 201 24.7027 2.1590 0.0001 Yes
Table 5. Flight Distance Matched Pair Analysis for Launch
Total Fuel Burn Analyses Number of Flights
Mean Difference (lbs)
Standard Error (lbs) > P-value Significant?
(α level = 0.05)
03/01 - 02/28 (Primary) 9 1170.3700 583.8310 0.0400 Yes 03/01 - 02/28 (Secondary) 234 274.8330 57.8782 0.0001 Yes
03/01 - 03/02 (Primary) 11 98.6020 640.2000 0.4403 No
03/01 - 03/02 (Secondary) 213 304.7870 58.7285 0.0001 Yes
03/01 - 03/03 (Primary) 10 2221.1100 528.7390 0.0012 Yes
03/01 - 03/03 (Secondary) 206 375.7720 94.5692 0.0001 Yes
03/01 - 03/07 (Primary) 8 2357.5800 503.0980 0.0011 Yes
03/01 - 03/07 (Secondary) 236 421.9850 83.1971 0.0001 Yes
03/01 - 03/27 (Primary) 10 2386.7800 724.6000 0.0047 Yes
03/01 - 03/27 (Secondary) 201 365.6890 80.5581 0.0001 Yes
Table 6. Fuel Burn Matched Pair Analysis for Launch
24
Flight Duration Analyses Number of Flights
Mean Difference (sec)
Standard Error (sec) > P-value Significant?
(α level = 0.05)
03/01 - 02/28 (Primary) 9 419.2220 109.7370 0.0025 Yes 03/01 - 02/28 (Secondary) 234 43.0519 29.4818 0.0728 No
03/01 - 03/02 (Primary) 11 20.2273 183.1530 0.4571 No
03/01 - 03/02 (Secondary) 213 66.2854 30.9750 0.0168 Yes
03/01 - 03/03 (Primary) 10 1400.6400 264.8930 0.0003 Yes
03/01 - 03/03 (Secondary) 206 169.6340 52.8204 0.0008 Yes
03/01 - 03/07 (Primary) 8 1319.5800 259.4370 0.0007 Yes
03/01 - 03/07 (Secondary) 236 53.0191 52.6931 0.1577 No
03/01 - 03/27 (Primary) 10 943.4580 184.3930 0.0003 Yes
03/01 - 03/27 (Secondary) 201 29.9282 42.2742 0.2399 No
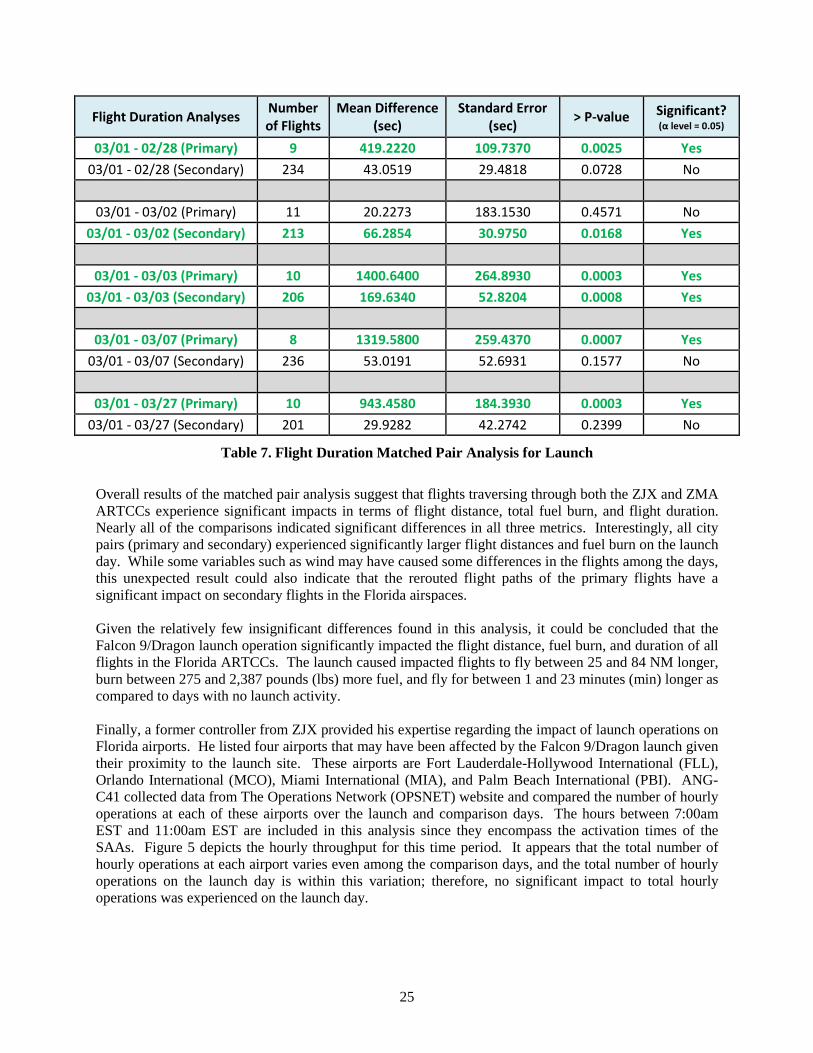
Table 7. Flight Duration Matched Pair Analysis for Launch
Overall results of the matched pair analysis suggest that flights traversing through both the ZJX and ZMA ARTCCs experience significant impacts in terms of flight distance, total fuel burn, and flight duration. Nearly all of the comparisons indicated significant differences in all three metrics. Interestingly, all city pairs (primary and secondary) experienced significantly larger flight distances and fuel burn on the launch day. While some variables such as wind may have caused some differences in the flights among the days, this unexpected result could also indicate that the rerouted flight paths of the primary flights have a significant impact on secondary flights in the Florida airspaces. Given the relatively few insignificant differences found in this analysis, it could be concluded that the Falcon 9/Dragon launch operation significantly impacted the flight distance, fuel burn, and duration of all flights in the Florida ARTCCs. The launch caused impacted flights to fly between 25 and 84 NM longer, burn between 275 and 2,387 pounds (lbs) more fuel, and fly for between 1 and 23 minutes (min) longer as compared to days with no launch activity. Finally, a former controller from ZJX provided his expertise regarding the impact of launch operations on Florida airports. He listed four airports that may have been affected by the Falcon 9/Dragon launch given their proximity to the launch site. These airports are Fort Lauderdale-Hollywood International (FLL), Orlando International (MCO), Miami International (MIA), and Palm Beach International (PBI). ANG-C41 collected data from The Operations Network (OPSNET) website and compared the number of hourly operations at each of these airports over the launch and comparison days. The hours between 7:00am EST and 11:00am EST are included in this analysis since they encompass the activation times of the SAAs. Figure 5 depicts the hourly throughput for this time period. It appears that the total number of hourly operations at each airport varies even among the comparison days, and the total number of hourly operations on the launch day is within this variation; therefore, no significant impact to total hourly operations was experienced on the launch day.
25
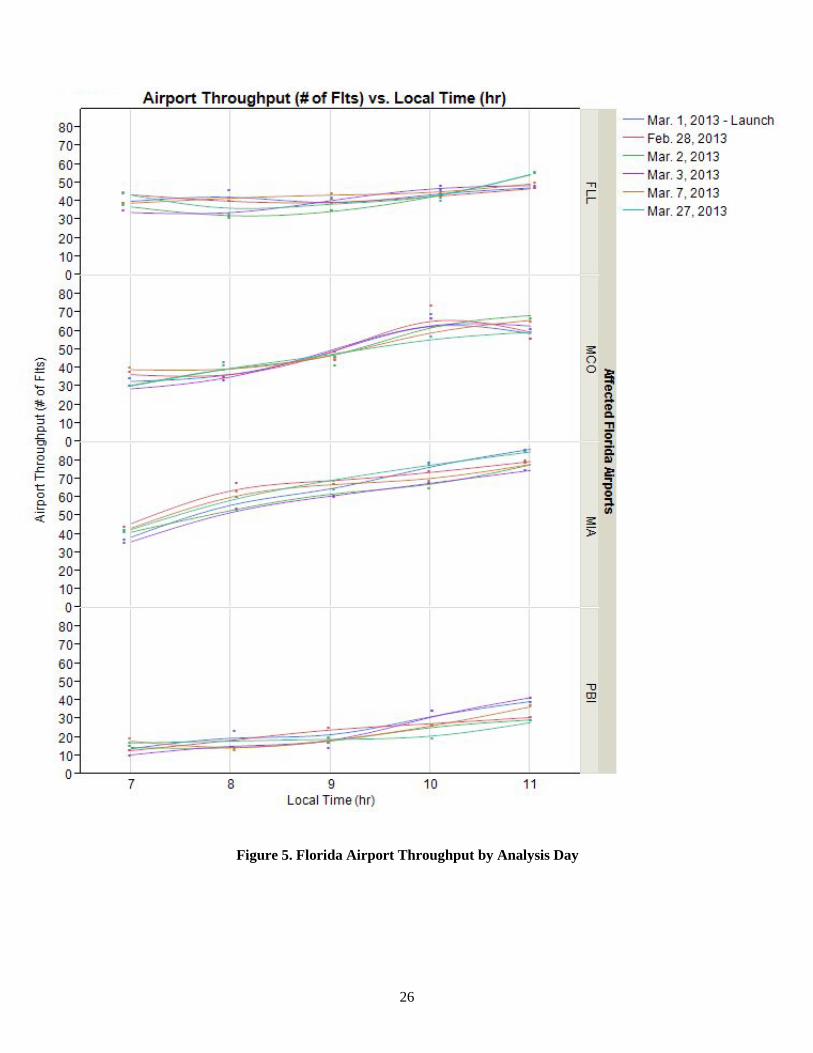
Figure 5. Florida Airport Throughput by Analysis Day
26
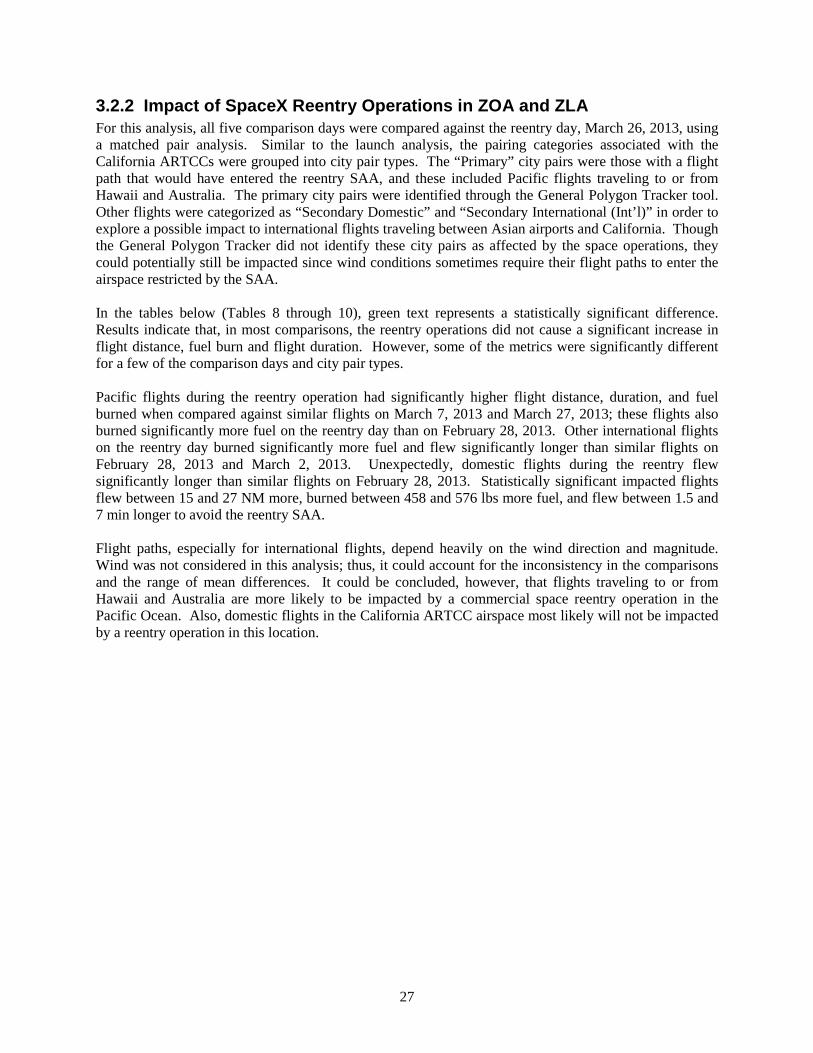
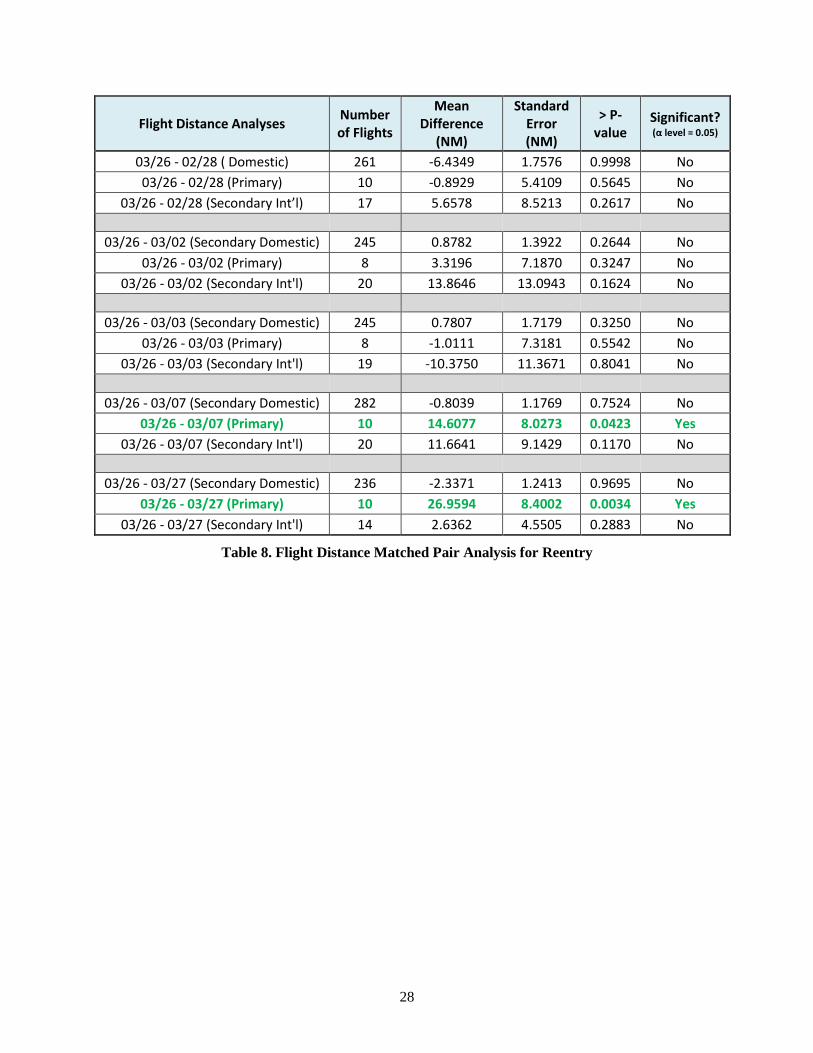
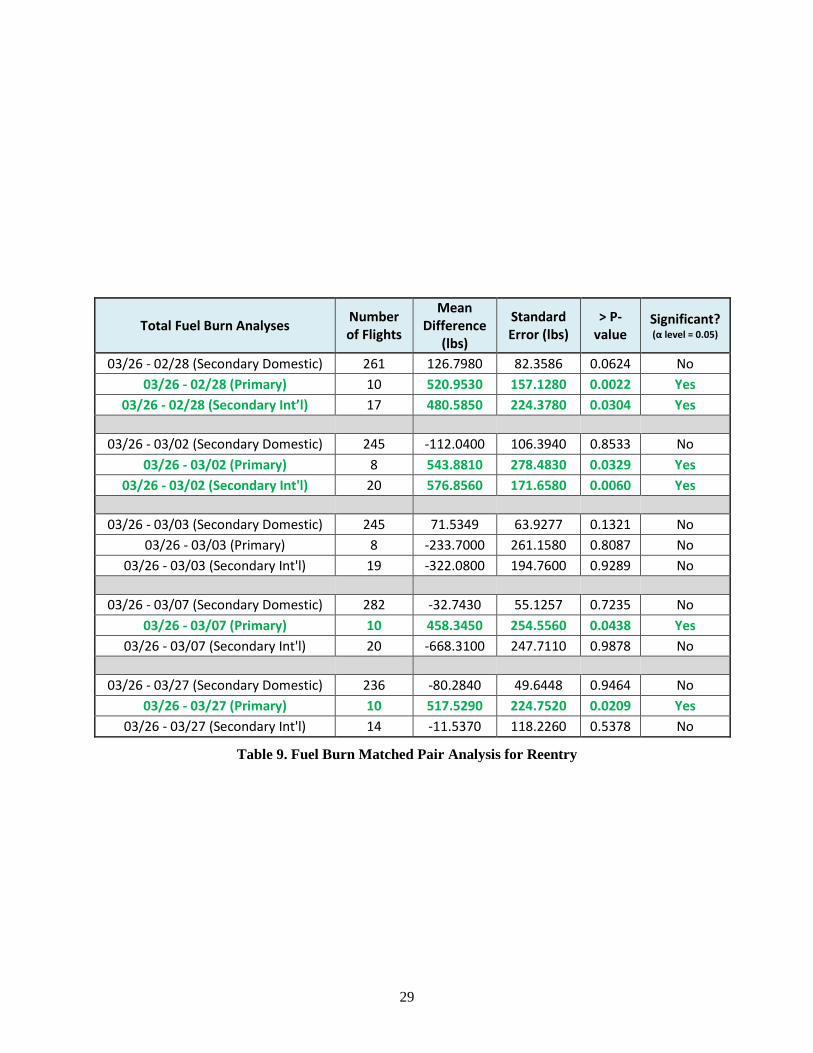
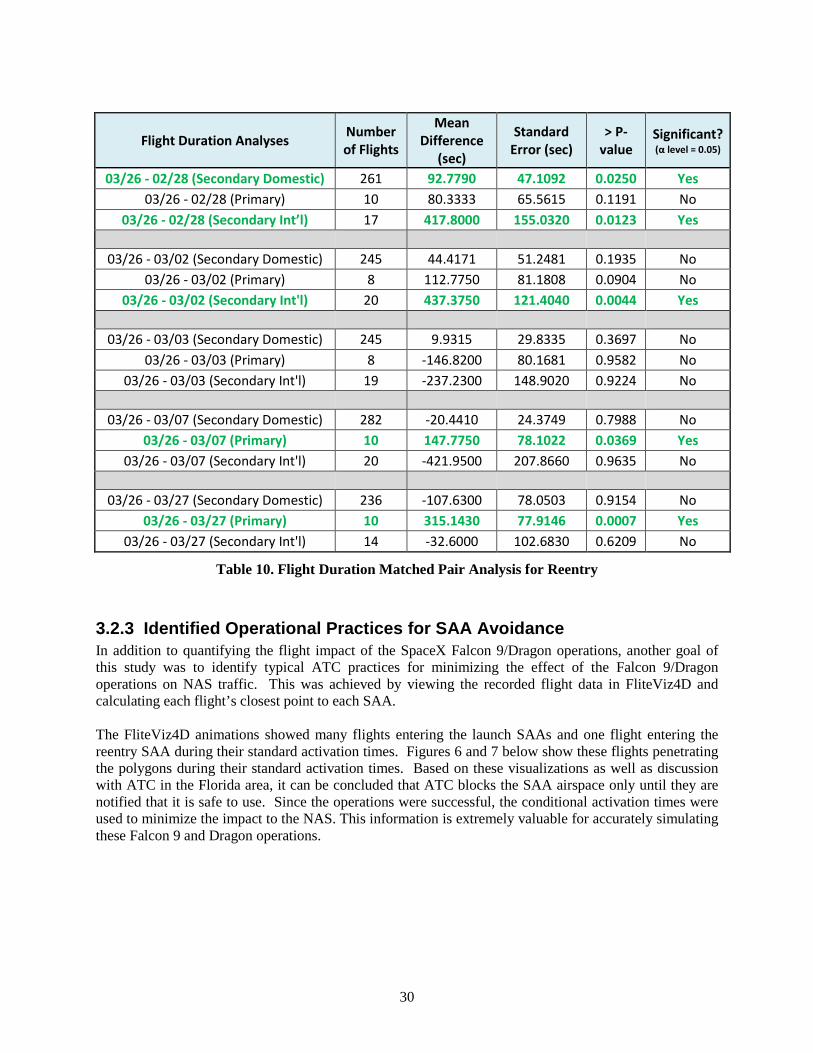
3.2.2 Impact of SpaceX Reentry Operations in ZOA and ZLA For this analysis, all five comparison days were compared against the reentry day, March 26, 2013, using a matched pair analysis. Similar to the launch analysis, the pairing categories associated with the California ARTCCs were grouped into city pair types. The “Primary” city pairs were those with a flight path that would have entered the reentry SAA, and these included Pacific flights traveling to or from Hawaii and Australia. The primary city pairs were identified through the General Polygon Tracker tool. Other flights were categorized as “Secondary Domestic” and “Secondary International (Int’l)” in order to explore a possible impact to international flights traveling between Asian airports and California. Though the General Polygon Tracker did not identify these city pairs as affected by the space operations, they could potentially still be impacted since wind conditions sometimes require their flight paths to enter the airspace restricted by the SAA. In the tables below (Tables 8 through 10), green text represents a statistically significant difference. Results indicate that, in most comparisons, the reentry operations did not cause a significant increase in flight distance, fuel burn and flight duration. However, some of the metrics were significantly different for a few of the comparison days and city pair types. Pacific flights during the reentry operation had significantly higher flight distance, duration, and fuel burned when compared against similar flights on March 7, 2013 and March 27, 2013; these flights also burned significantly more fuel on the reentry day than on February 28, 2013. Other international flights on the reentry day burned significantly more fuel and flew significantly longer than similar flights on February 28, 2013 and March 2, 2013. Unexpectedly, domestic flights during the reentry flew significantly longer than similar flights on February 28, 2013. Statistically significant impacted flights flew between 15 and 27 NM more, burned between 458 and 576 lbs more fuel, and flew between 1.5 and 7 min longer to avoid the reentry SAA. Flight paths, especially for international flights, depend heavily on the wind direction and magnitude. Wind was not considered in this analysis; thus, it could account for the inconsistency in the comparisons and the range of mean differences. It could be concluded, however, that flights traveling to or from Hawaii and Australia are more likely to be impacted by a commercial space reentry operation in the Pacific Ocean. Also, domestic flights in the California ARTCC airspace most likely will not be impacted by a reentry operation in this location.
27
Flight Distance Analyses Number of Flights
Mean Difference
(NM)
Standard Error (NM)
> P-value
Significant? (α level = 0.05)
03/26 - 02/28 ( Domestic) 261 -6.4349 1.7576 0.9998 No 03/26 - 02/28 (Primary) 10 -0.8929 5.4109 0.5645 No
03/26 - 02/28 (Secondary Int’l) 17 5.6578 8.5213 0.2617 No
03/26 - 03/02 (Secondary Domestic) 245 0.8782 1.3922 0.2644 No
03/26 - 03/02 (Primary) 8 3.3196 7.1870 0.3247 No 03/26 - 03/02 (Secondary Int'l) 20 13.8646 13.0943 0.1624 No
03/26 - 03/03 (Secondary Domestic) 245 0.7807 1.7179 0.3250 No
03/26 - 03/03 (Primary) 8 -1.0111 7.3181 0.5542 No 03/26 - 03/03 (Secondary Int'l) 19 -10.3750 11.3671 0.8041 No
03/26 - 03/07 (Secondary Domestic) 282 -0.8039 1.1769 0.7524 No
03/26 - 03/07 (Primary) 10 14.6077 8.0273 0.0423 Yes 03/26 - 03/07 (Secondary Int'l) 20 11.6641 9.1429 0.1170 No
03/26 - 03/27 (Secondary Domestic) 236 -2.3371 1.2413 0.9695 No
03/26 - 03/27 (Primary) 10 26.9594 8.4002 0.0034 Yes 03/26 - 03/27 (Secondary Int'l) 14 2.6362 4.5505 0.2883 No
Table 8. Flight Distance Matched Pair Analysis for Reentry
28
Total Fuel Burn Analyses Number of Flights
Mean Difference
(lbs)
Standard Error (lbs)
> P-value
Significant? (α level = 0.05)
03/26 - 02/28 (Secondary Domestic) 261 126.7980 82.3586 0.0624 No 03/26 - 02/28 (Primary) 10 520.9530 157.1280 0.0022 Yes
03/26 - 02/28 (Secondary Int’l) 17 480.5850 224.3780 0.0304 Yes
03/26 - 03/02 (Secondary Domestic) 245 -112.0400 106.3940 0.8533 No
03/26 - 03/02 (Primary) 8 543.8810 278.4830 0.0329 Yes 03/26 - 03/02 (Secondary Int'l) 20 576.8560 171.6580 0.0060 Yes
03/26 - 03/03 (Secondary Domestic) 245 71.5349 63.9277 0.1321 No
03/26 - 03/03 (Primary) 8 -233.7000 261.1580 0.8087 No 03/26 - 03/03 (Secondary Int'l) 19 -322.0800 194.7600 0.9289 No
03/26 - 03/07 (Secondary Domestic) 282 -32.7430 55.1257 0.7235 No
03/26 - 03/07 (Primary) 10 458.3450 254.5560 0.0438 Yes 03/26 - 03/07 (Secondary Int'l) 20 -668.3100 247.7110 0.9878 No
03/26 - 03/27 (Secondary Domestic) 236 -80.2840 49.6448 0.9464 No
03/26 - 03/27 (Primary) 10 517.5290 224.7520 0.0209 Yes 03/26 - 03/27 (Secondary Int'l) 14 -11.5370 118.2260 0.5378 No
Table 9. Fuel Burn Matched Pair Analysis for Reentry
29
Flight Duration Analyses Number of Flights
Mean Difference
(sec)
Standard Error (sec)
> P-value
Significant? (α level = 0.05)
03/26 - 02/28 (Secondary Domestic) 261 92.7790 47.1092 0.0250 Yes 03/26 - 02/28 (Primary) 10 80.3333 65.5615 0.1191 No
03/26 - 02/28 (Secondary Int’l) 17 417.8000 155.0320 0.0123 Yes
03/26 - 03/02 (Secondary Domestic) 245 44.4171 51.2481 0.1935 No
03/26 - 03/02 (Primary) 8 112.7750 81.1808 0.0904 No 03/26 - 03/02 (Secondary Int'l) 20 437.3750 121.4040 0.0044 Yes
03/26 - 03/03 (Secondary Domestic) 245 9.9315 29.8335 0.3697 No
03/26 - 03/03 (Primary) 8 -146.8200 80.1681 0.9582 No 03/26 - 03/03 (Secondary Int'l) 19 -237.2300 148.9020 0.9224 No
03/26 - 03/07 (Secondary Domestic) 282 -20.4410 24.3749 0.7988 No
03/26 - 03/07 (Primary) 10 147.7750 78.1022 0.0369 Yes 03/26 - 03/07 (Secondary Int'l) 20 -421.9500 207.8660 0.9635 No
03/26 - 03/27 (Secondary Domestic) 236 -107.6300 78.0503 0.9154 No
03/26 - 03/27 (Primary) 10 315.1430 77.9146 0.0007 Yes 03/26 - 03/27 (Secondary Int'l) 14 -32.6000 102.6830 0.6209 No
Table 10. Flight Duration Matched Pair Analysis for Reentry
3.2.3 Identified Operational Practices for SAA Avoidance In addition to quantifying the flight impact of the SpaceX Falcon 9/Dragon operations, another goal of this study was to identify typical ATC practices for minimizing the effect of the Falcon 9/Dragon operations on NAS traffic. This was achieved by viewing the recorded flight data in FliteViz4D and calculating each flight’s closest point to each SAA. The FliteViz4D animations showed many flights entering the launch SAAs and one flight entering the reentry SAA during their standard activation times. Figures 6 and 7 below show these flights penetrating the polygons during their standard activation times. Based on these visualizations as well as discussion with ATC in the Florida area, it can be concluded that ATC blocks the SAA airspace only until they are notified that it is safe to use. Since the operations were successful, the conditional activation times were used to minimize the impact to the NAS. This information is extremely valuable for accurately simulating these Falcon 9 and Dragon operations.
30
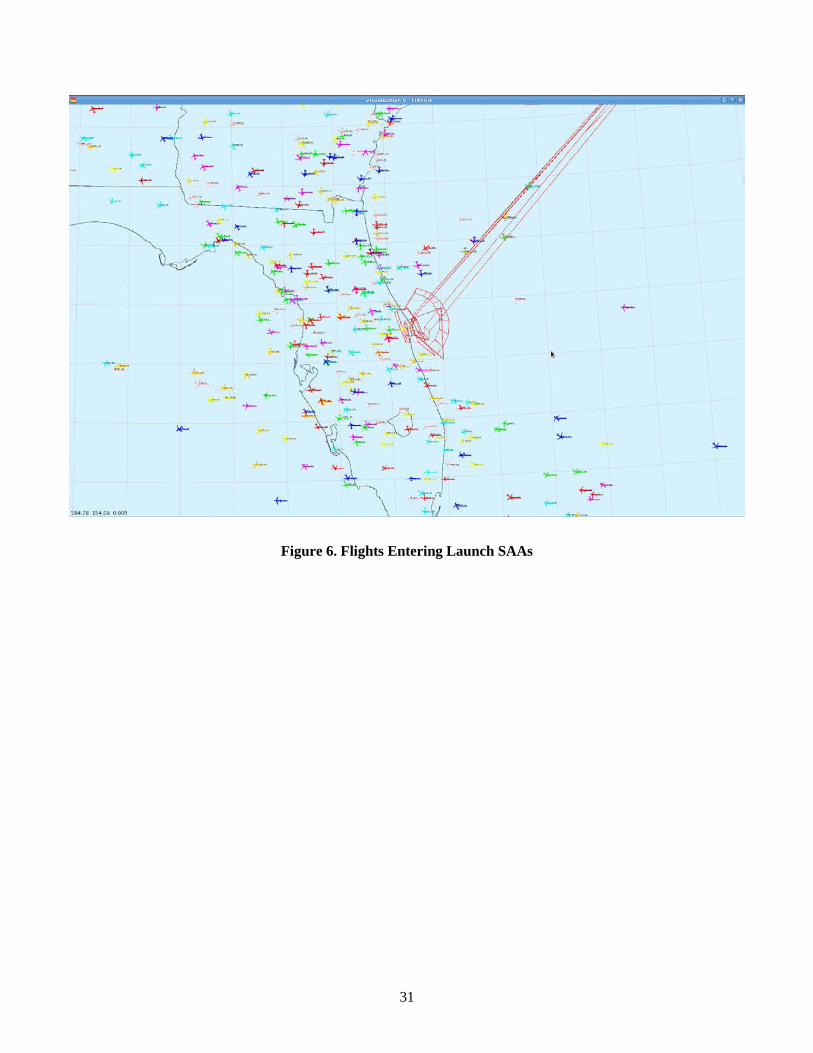
Figure 6. Flights Entering Launch SAAs
31
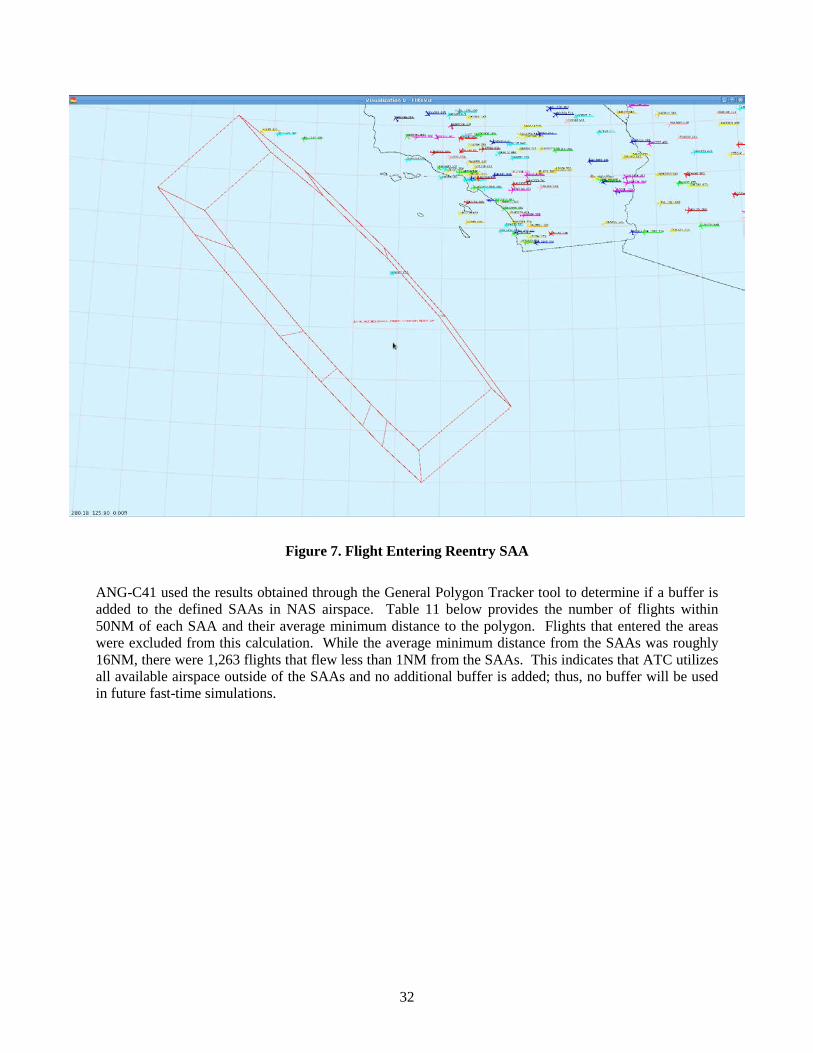
Figure 7. Flight Entering Reentry SAA
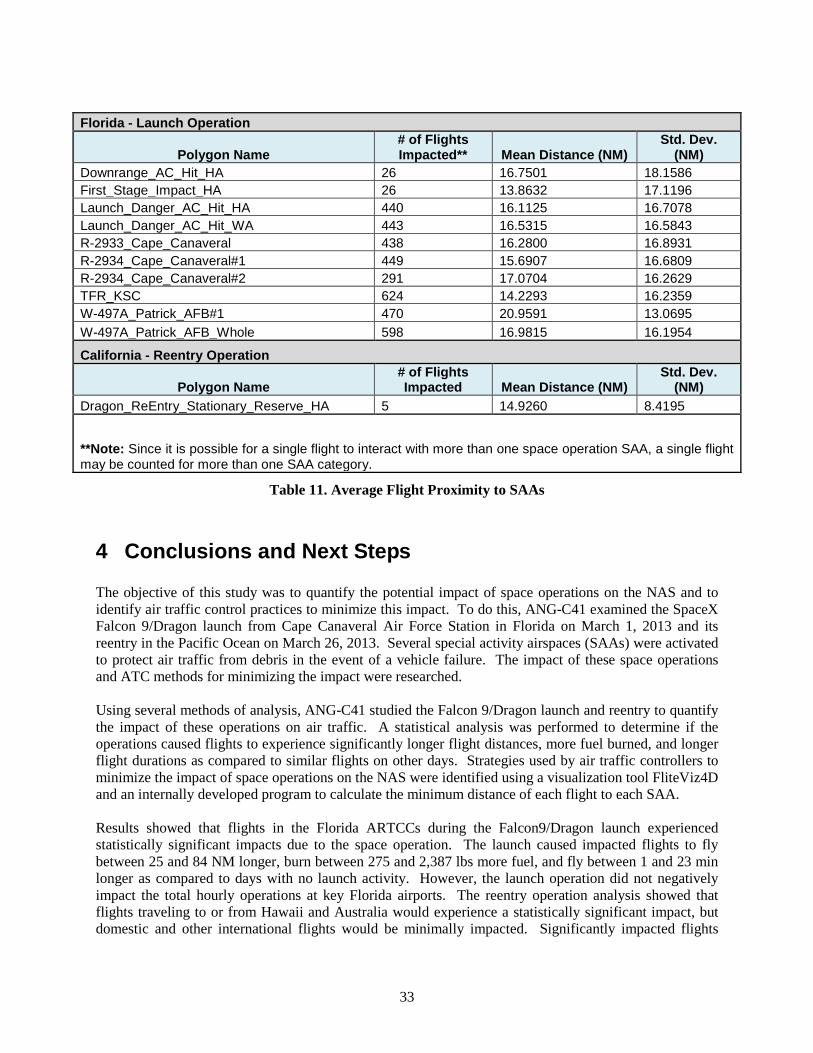
ANG-C41 used the results obtained through the General Polygon Tracker tool to determine if a buffer is added to the defined SAAs in NAS airspace. Table 11 below provides the number of flights within 50NM of each SAA and their average minimum distance to the polygon. Flights that entered the areas were excluded from this calculation. While the average minimum distance from the SAAs was roughly 16NM, there were 1,263 flights that flew less than 1NM from the SAAs. This indicates that ATC utilizes all available airspace outside of the SAAs and no additional buffer is added; thus, no buffer will be used in future fast-time simulations.
32
Florida - Launch Operation
Polygon Name # of Flights Impacted** Mean Distance (NM)
Std. Dev. (NM)
Downrange_AC_Hit_HA 26 16.7501 18.1586 First_Stage_Impact_HA 26 13.8632 17.1196 Launch_Danger_AC_Hit_HA 440 16.1125 16.7078 Launch_Danger_AC_Hit_WA 443 16.5315 16.5843 R-2933_Cape_Canaveral 438 16.2800 16.8931 R-2934_Cape_Canaveral#1 449 15.6907 16.6809 R-2934_Cape_Canaveral#2 291 17.0704 16.2629 TFR_KSC 624 14.2293 16.2359 W-497A_Patrick_AFB#1 470 20.9591 13.0695 W-497A_Patrick_AFB_Whole 598 16.9815 16.1954
California - Reentry Operation
Polygon Name # of Flights Impacted Mean Distance (NM)
Std. Dev. (NM)
Dragon_ReEntry_Stationary_Reserve_HA 5 14.9260 8.4195
**Note: Since it is possible for a single flight to interact with more than one space operation SAA, a single flight may be counted for more than one SAA category.
Table 11. Average Flight Proximity to SAAs
4 Conclusions and Next Steps The objective of this study was to quantify the potential impact of space operations on the NAS and to identify air traffic control practices to minimize this impact. To do this, ANG-C41 examined the SpaceX Falcon 9/Dragon launch from Cape Canaveral Air Force Station in Florida on March 1, 2013 and its reentry in the Pacific Ocean on March 26, 2013. Several special activity airspaces (SAAs) were activated to protect air traffic from debris in the event of a vehicle failure. The impact of these space operations and ATC methods for minimizing the impact were researched. Using several methods of analysis, ANG-C41 studied the Falcon 9/Dragon launch and reentry to quantify the impact of these operations on air traffic. A statistical analysis was performed to determine if the operations caused flights to experience significantly longer flight distances, more fuel burned, and longer flight durations as compared to similar flights on other days. Strategies used by air traffic controllers to minimize the impact of space operations on the NAS were identified using a visualization tool FliteViz4D and an internally developed program to calculate the minimum distance of each flight to each SAA. Results showed that flights in the Florida ARTCCs during the Falcon9/Dragon launch experienced statistically significant impacts due to the space operation. The launch caused impacted flights to fly between 25 and 84 NM longer, burn between 275 and 2,387 lbs more fuel, and fly between 1 and 23 min longer as compared to days with no launch activity. However, the launch operation did not negatively impact the total hourly operations at key Florida airports. The reentry operation analysis showed that flights traveling to or from Hawaii and Australia would experience a statistically significant impact, but domestic and other international flights would be minimally impacted. Significantly impacted flights
33
flew between 15 and 27 NM more, burned between 458 and 576 lbs more fuel, and flew between 1.5 and 7 min longer to avoid the reentry SAA. Also, an analysis of air traffic control procedures to minimize the impact of the space operations showed that flights were not required to avoid the SAAs for the entire length of the restriction time. Controllers allowed air traffic to use the airspace as soon as the danger of a vehicle failure had passed. While they were routed to avoid the airspace, many flights flew within 1NM of the SAAs. Next, a fast-time simulation study will be conducted to evaluate the potential NAS impact of predicted commercial space operations. This Falcon 9/Dragon operation will be used to validate the simulation model’s performance, and the information gained through this analysis on impacts and avoidance strategies will be used as input to develop scenarios. The research conducted in this study will help to create an accurate simulation of current air traffic control procedures related to commercial space operations.
34
List of Acronyms
AFEST Aircraft Fuel Evaluation Simulation Tools
ANG-C41 Concept Analysis Branch
ARTCC Air Route Traffic Control Center
ATC Air Traffic Control
BADA Base of Aircraft Data
CMS Common Message Set
EST Eastern Standard Time
FAA Federal Aviation Administration
FLL Fort Lauderdale- Hollywood International Airport
ft Feet
Int’l International
lbs pounds (measure of fuel)
MCO Orlando International Airport
MIA Miami International Airport
min minutes (measure of time)
NAS National Airspace System
NM Nautical Miles
NOTAM Notice to Airmen
OPSNET Operations Network
PBI Palm Beach International Airport
sec seconds (measure of time)
SFC Surface (0 feet)
SVO Space Vehicle Operations
UNL Unlimited (airspace ceiling)
ZJX Jacksonville, FL ARTCC
ZLA Los Angeles, CA ARTCC
ZMA Miami, FL ARTCC
ZOA Oakland, CA ARTCC
35
References 1 National Aeronautics and Space Administration (NASA). (updated February 15, 2000)
Space Quotes. Retrieved September 16, 2013, from http://er.jsc.nasa.gov/seh/quotes.html.
2 Federal Aviation Administration (2013). Notional Spaceport Growth: Estimates of “Operational” Launch Dates and Rates. Washington, DC.
3 Crowell, A., Andrew Fabian, and Nicole Nelson (2012). An Interactive 4D Visualization system for Air Traffic Concept Analysis. 31st Digital Avionics Systems Conference, Williamsburg, VA.
4 Hayes, A. (2008). SMP Presentation 4.1 AIAA 4-16-08.ppt. Presentation Briefing presented at the Improving Space Operations Workshop, Suitland, MD.
5
Federal Aviation Administration (2007). ARTCC Host Computer System (HCS)/Air Traffic Management Applications: Interface Requirements Document. Atlantic City International Airport, NJ.
6 National Oceanic and Atmospheric Administration (NOAA). (updated daily) NEXRAD National Mosaic Reflectivity Images. Retrieved August 1, 2013, from gis.ncdc.noaa.gov/map/viewer.
36
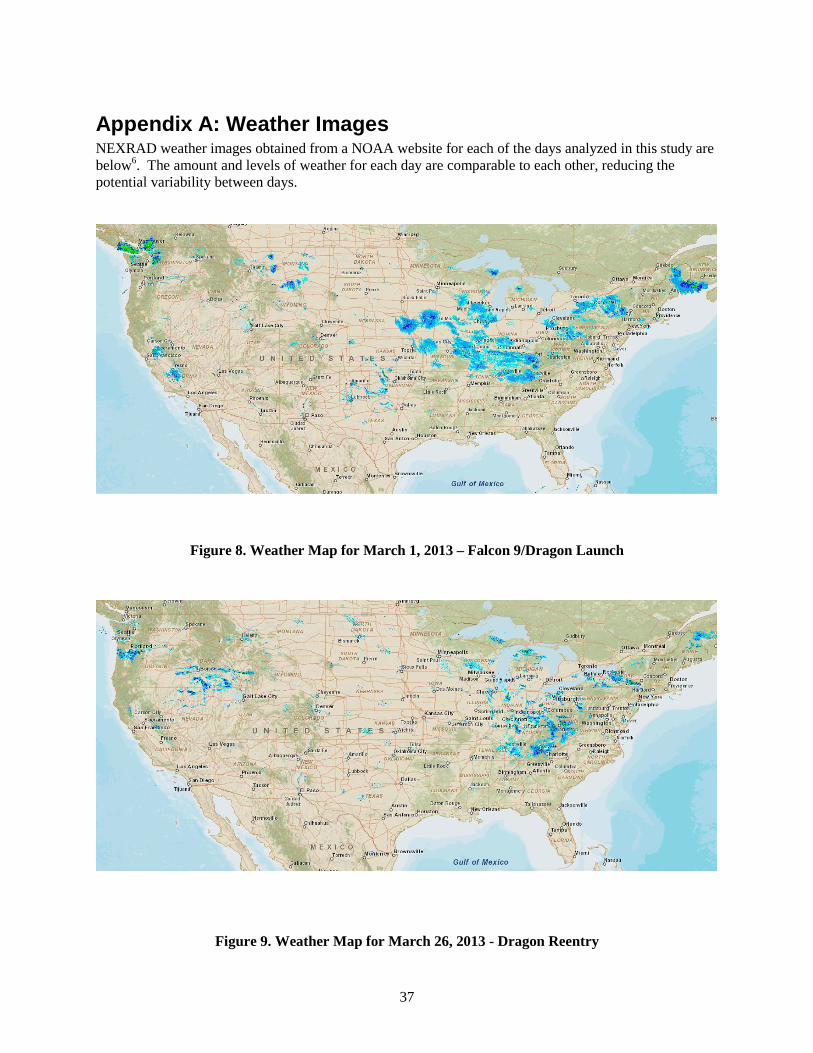
Appendix A: Weather Images NEXRAD weather images obtained from a NOAA website for each of the days analyzed in this study are below6. The amount and levels of weather for each day are comparable to each other, reducing the potential variability between days.
Figure 8. Weather Map for March 1, 2013 – Falcon 9/Dragon Launch
Figure 9. Weather Map for March 26, 2013 - Dragon Reentry
37
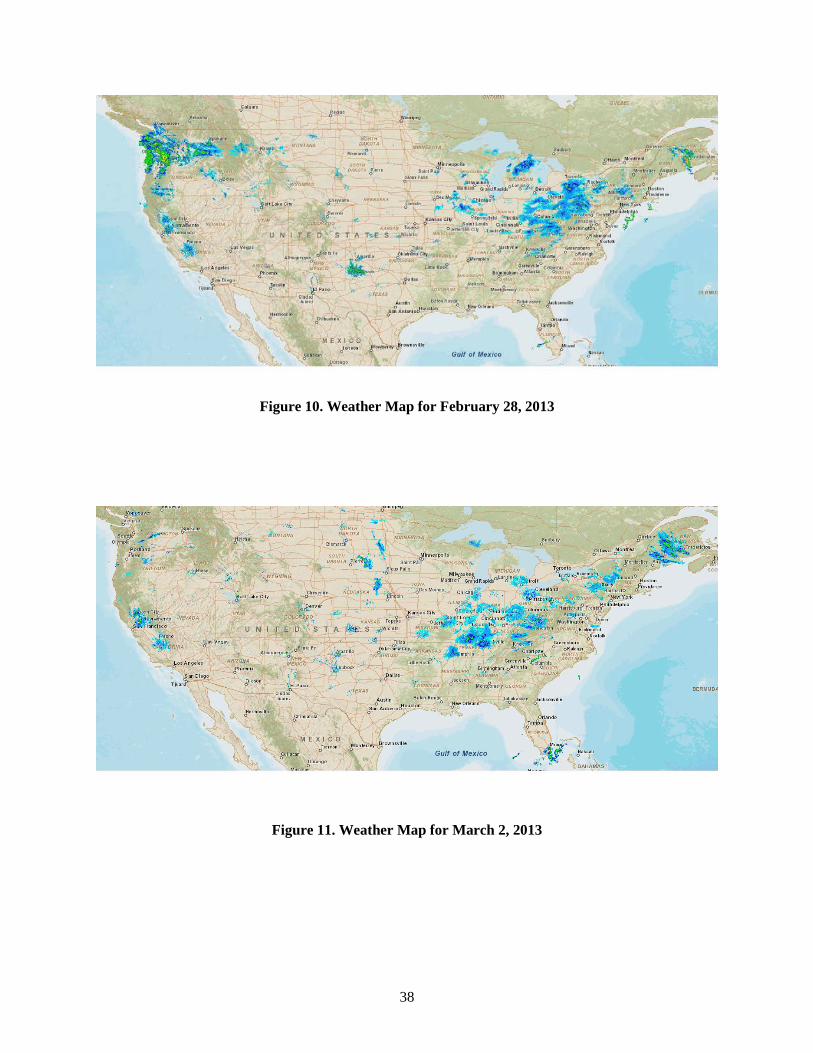
Figure 10. Weather Map for February 28, 2013
Figure 11. Weather Map for March 2, 2013
38
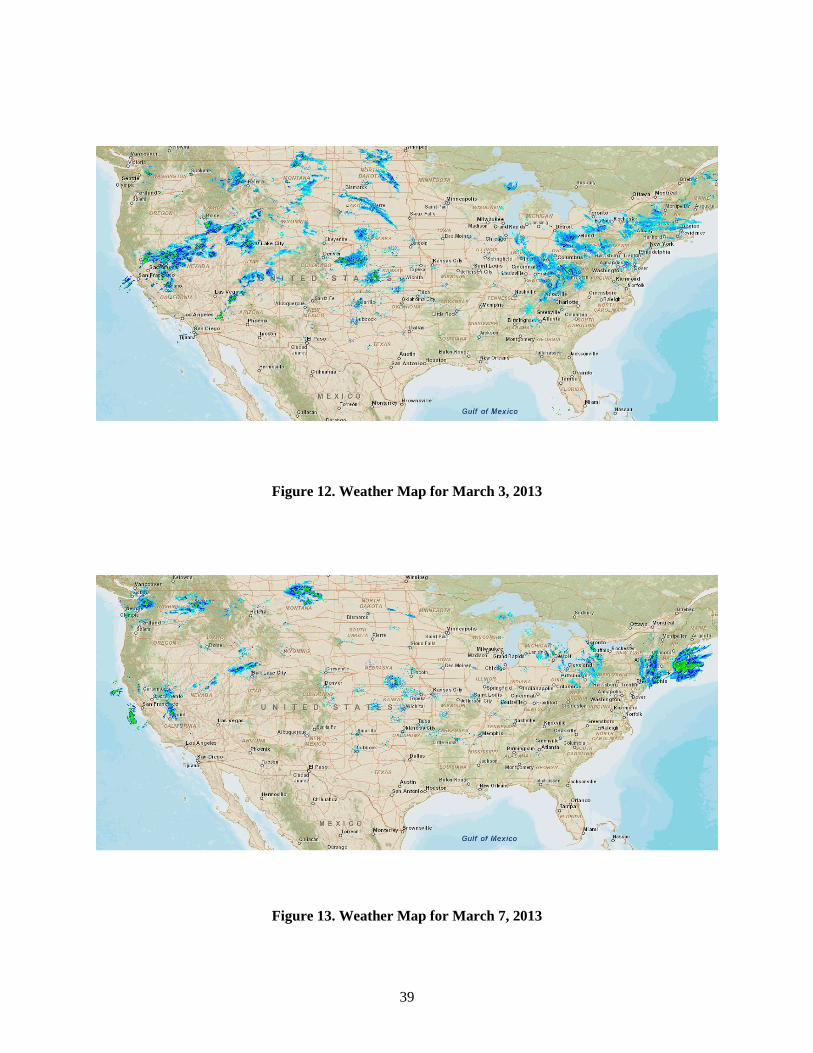
Figure 12. Weather Map for March 3, 2013
Figure 13. Weather Map for March 7, 2013
39
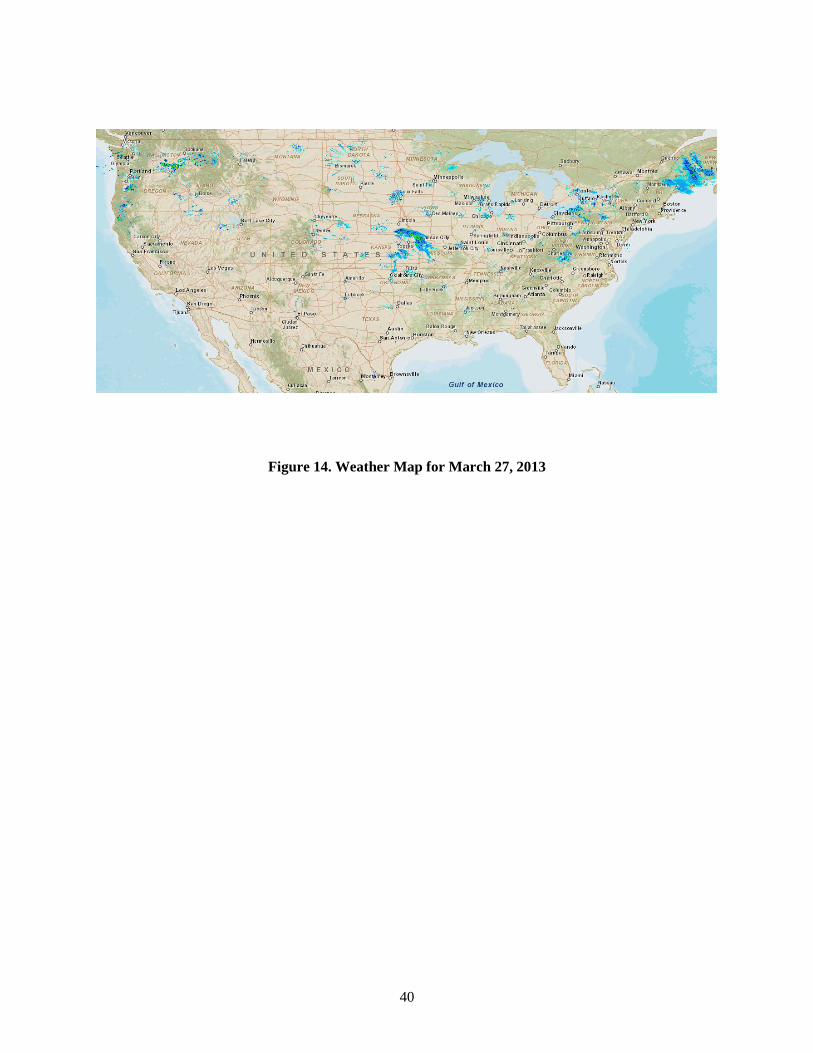
Figure 14. Weather Map for March 27, 2013
40
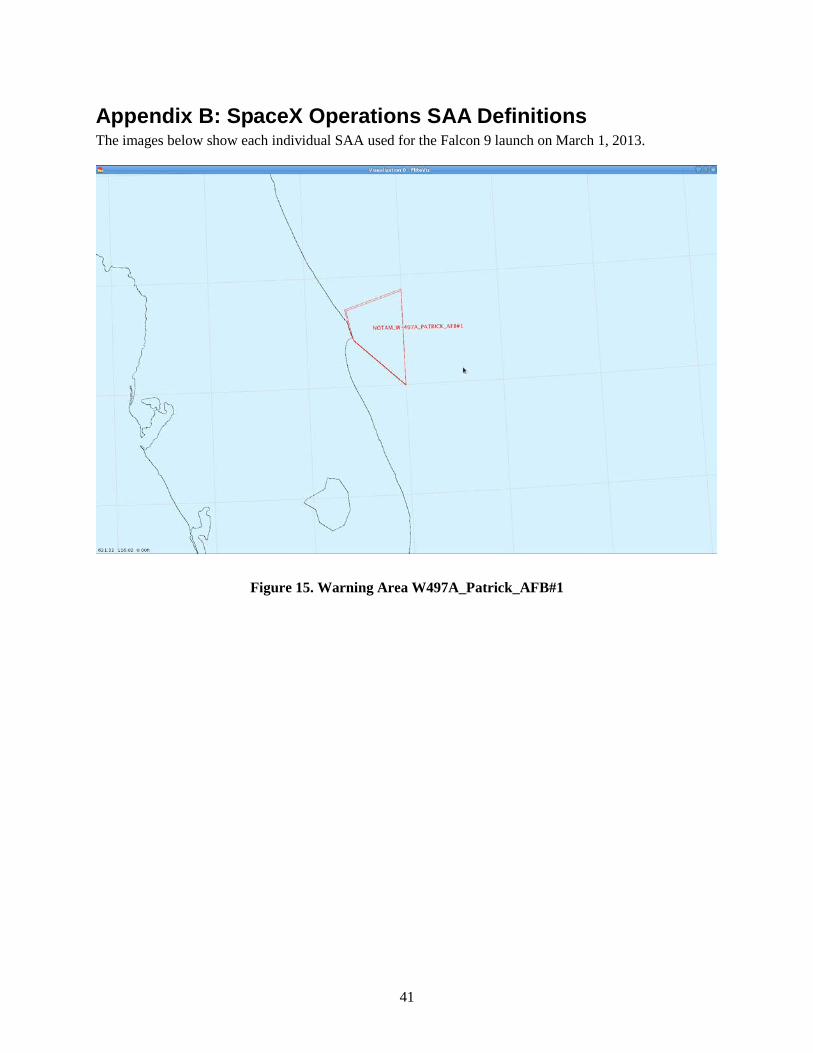
Appendix B: SpaceX Operations SAA Definitions The images below show each individual SAA used for the Falcon 9 launch on March 1, 2013.
Figure 15. Warning Area W497A_Patrick_AFB#1
41
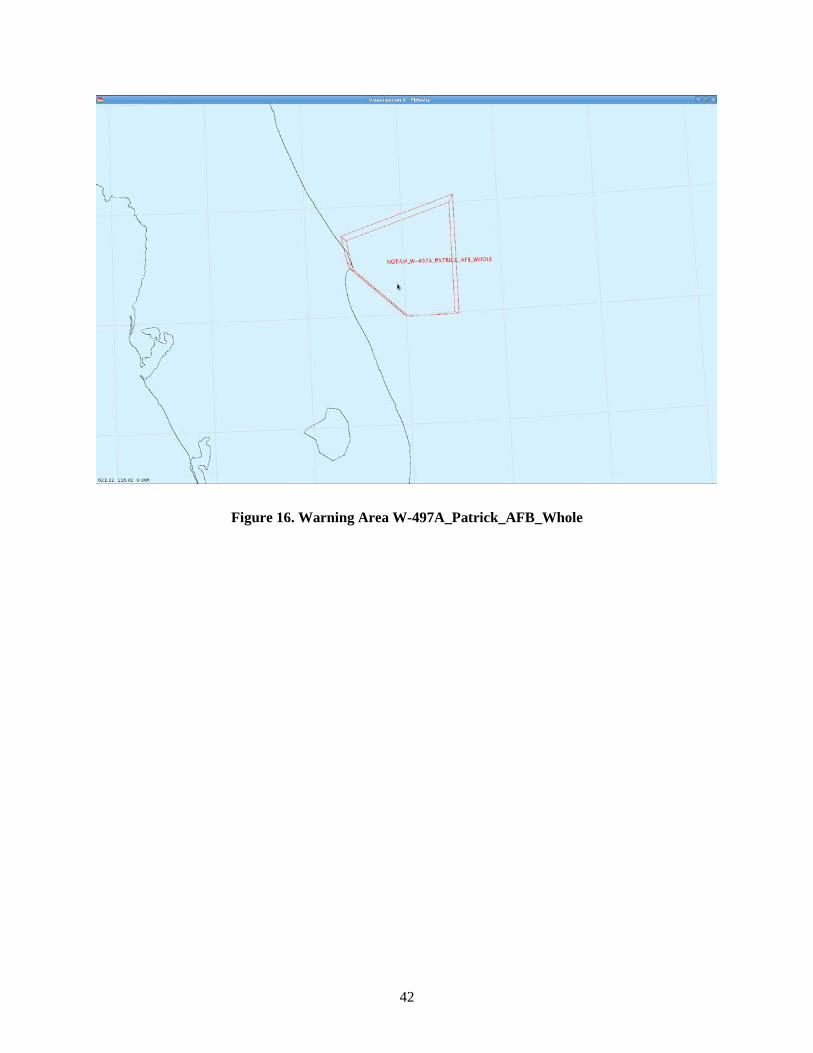
Figure 16. Warning Area W-497A_Patrick_AFB_Whole
42
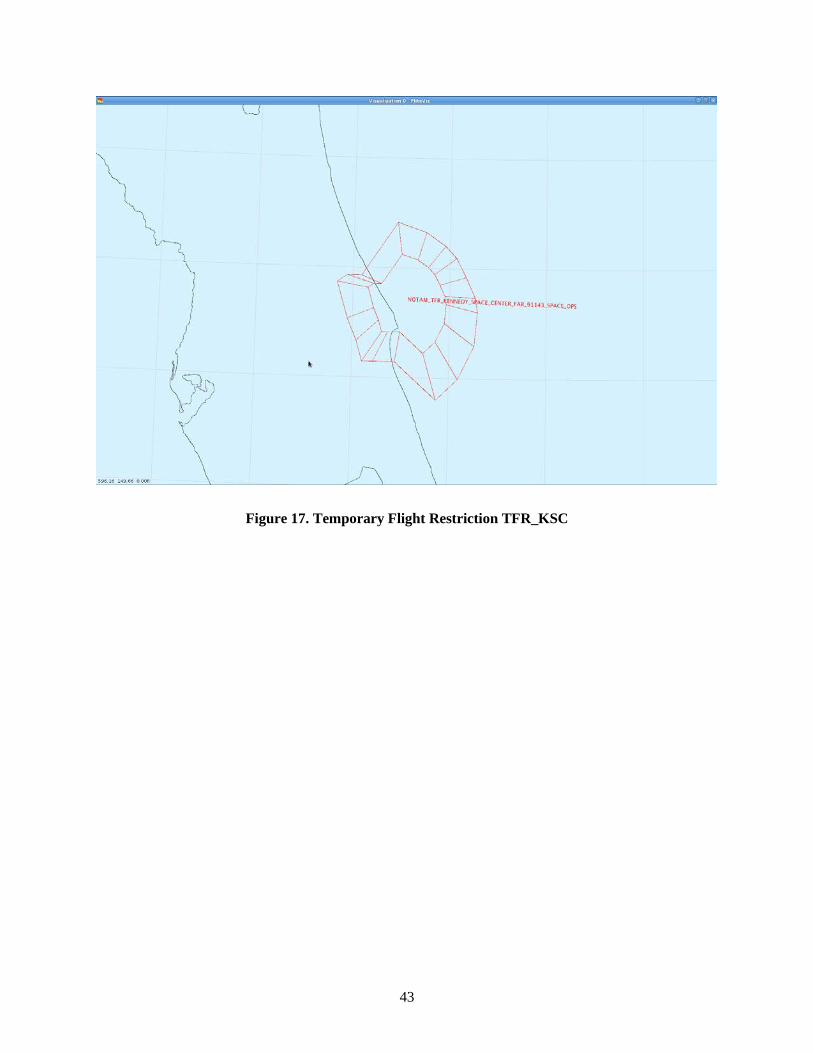
Figure 17. Temporary Flight Restriction TFR_KSC
43
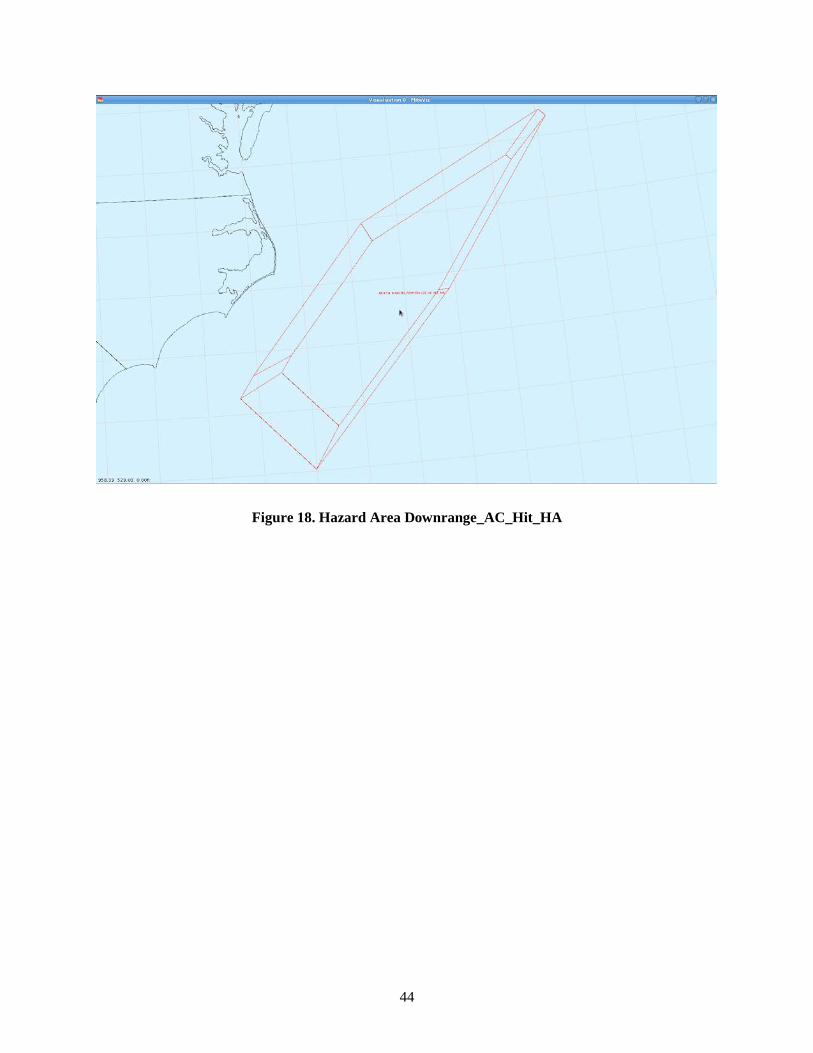
Figure 18. Hazard Area Downrange_AC_Hit_HA
44
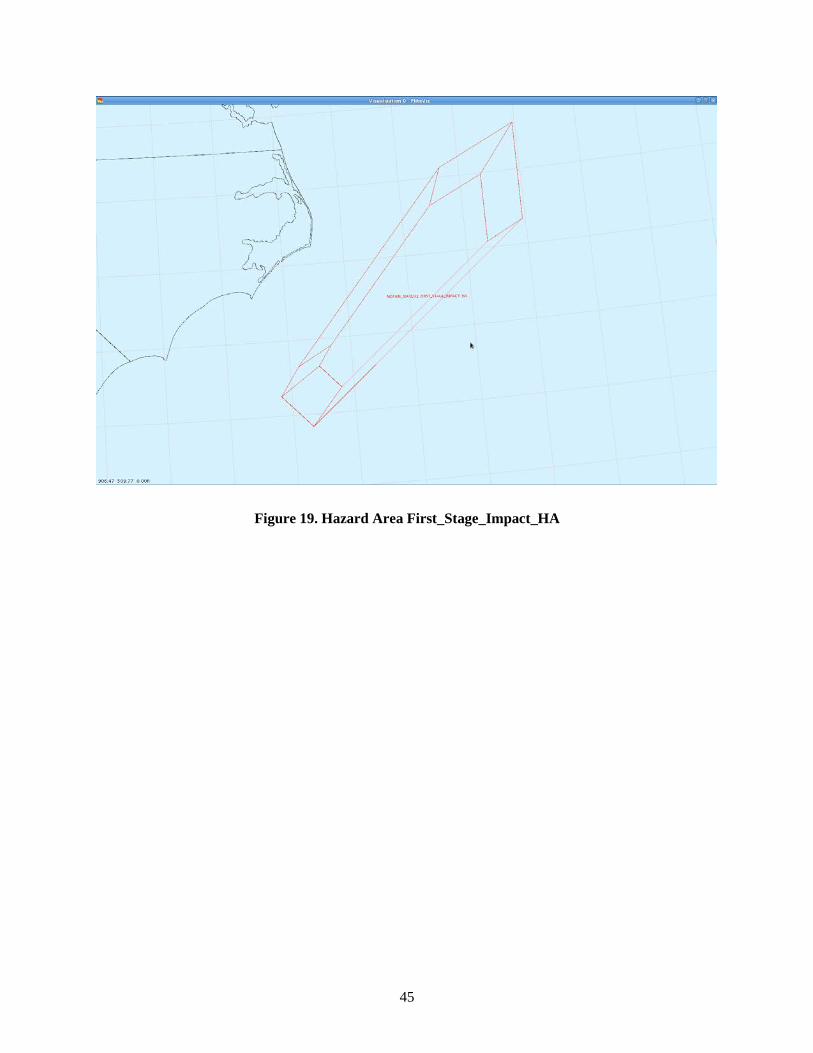
Figure 19. Hazard Area First_Stage_Impact_HA
45
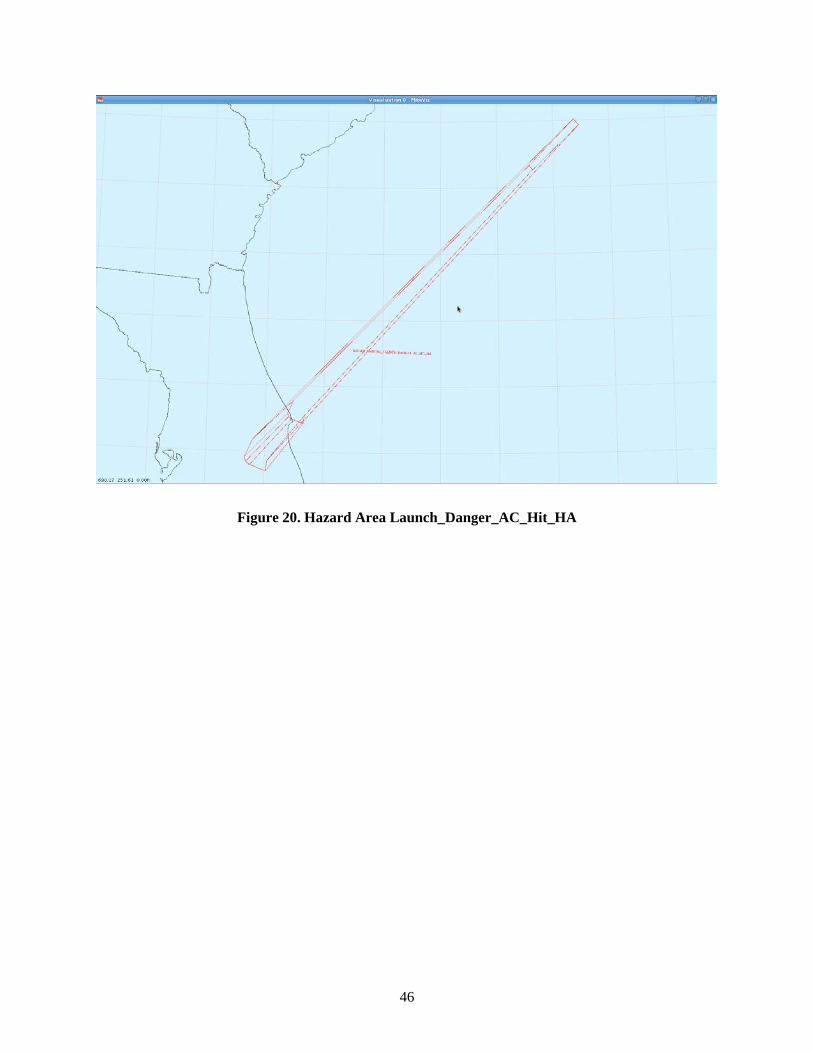
Figure 20. Hazard Area Launch_Danger_AC_Hit_HA
46
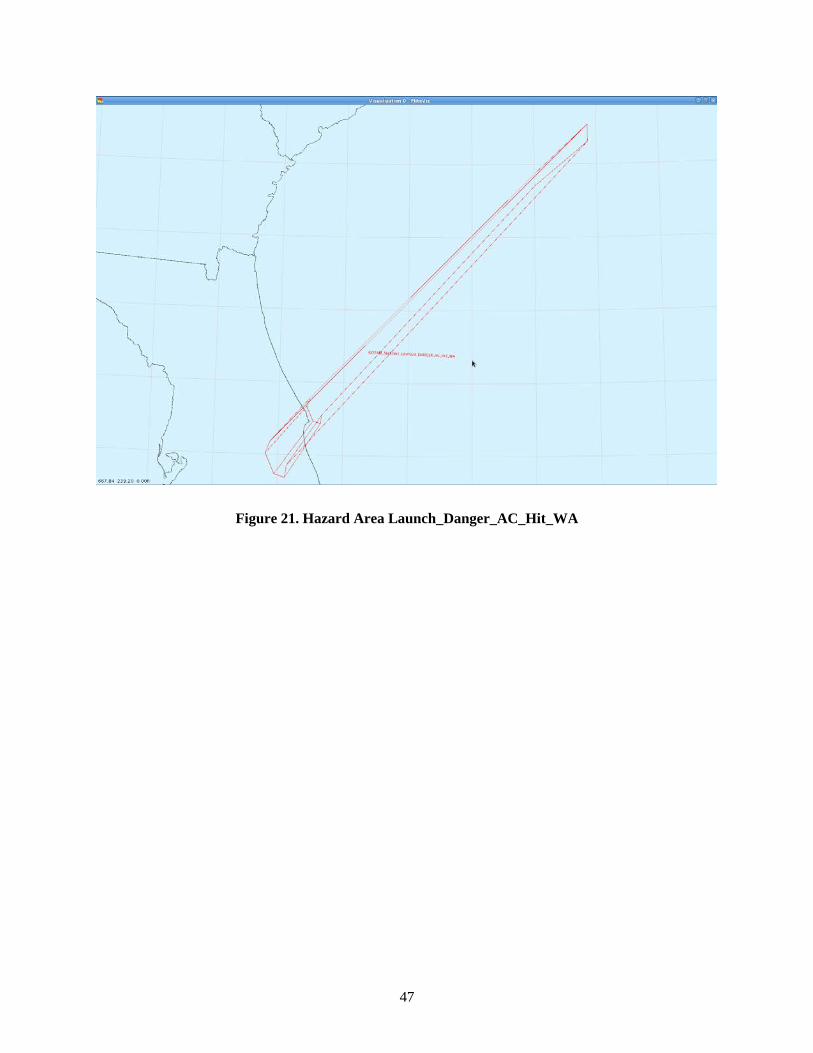
Figure 21. Hazard Area Launch_Danger_AC_Hit_WA
47
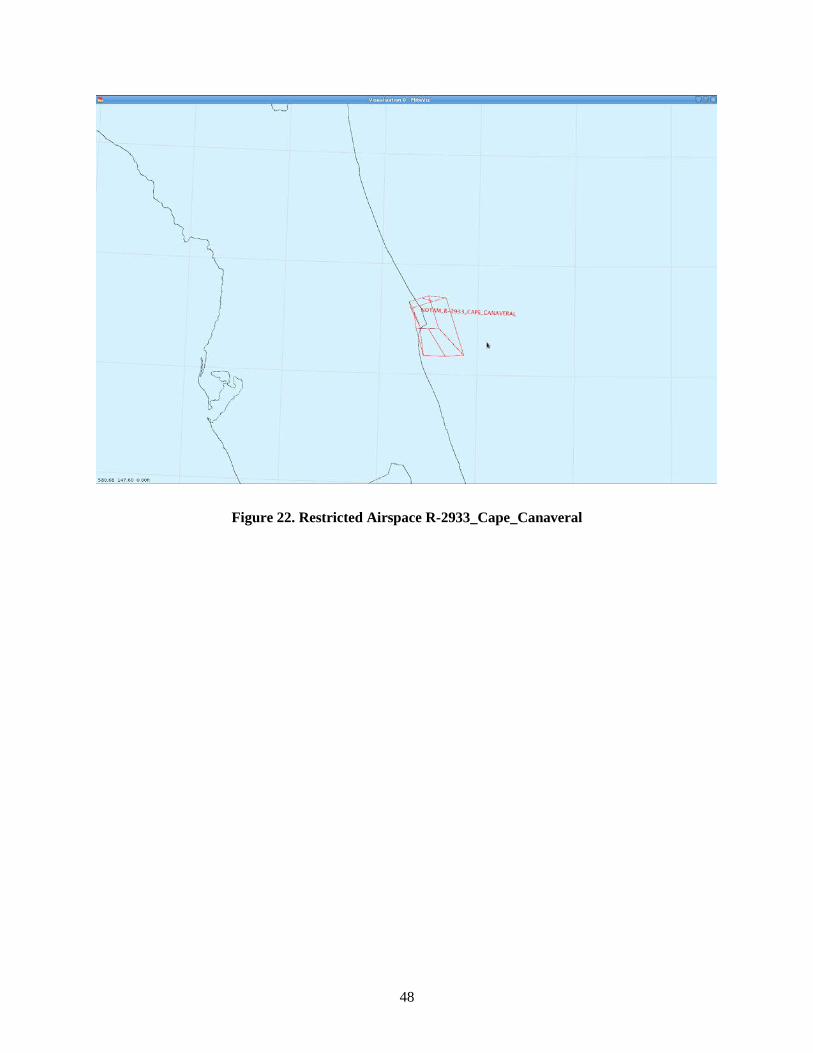
Figure 22. Restricted Airspace R-2933_Cape_Canaveral
48
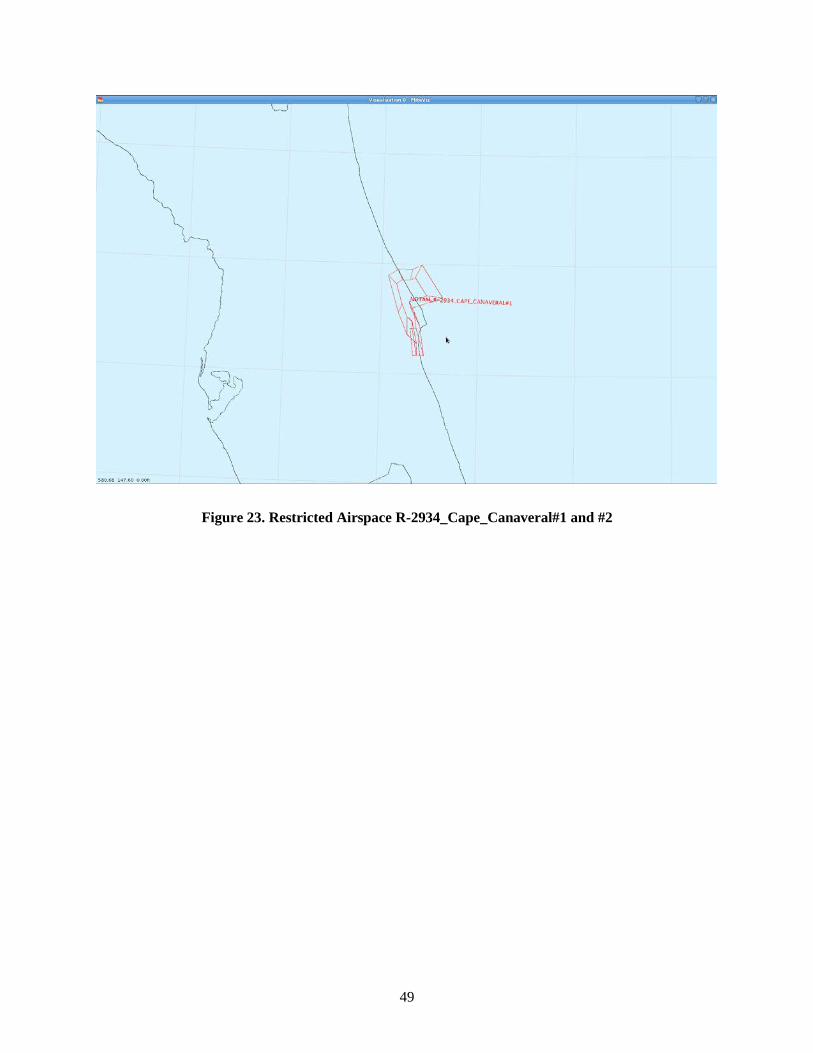
Figure 23. Restricted Airspace R-2934_Cape_Canaveral#1 and #2
49
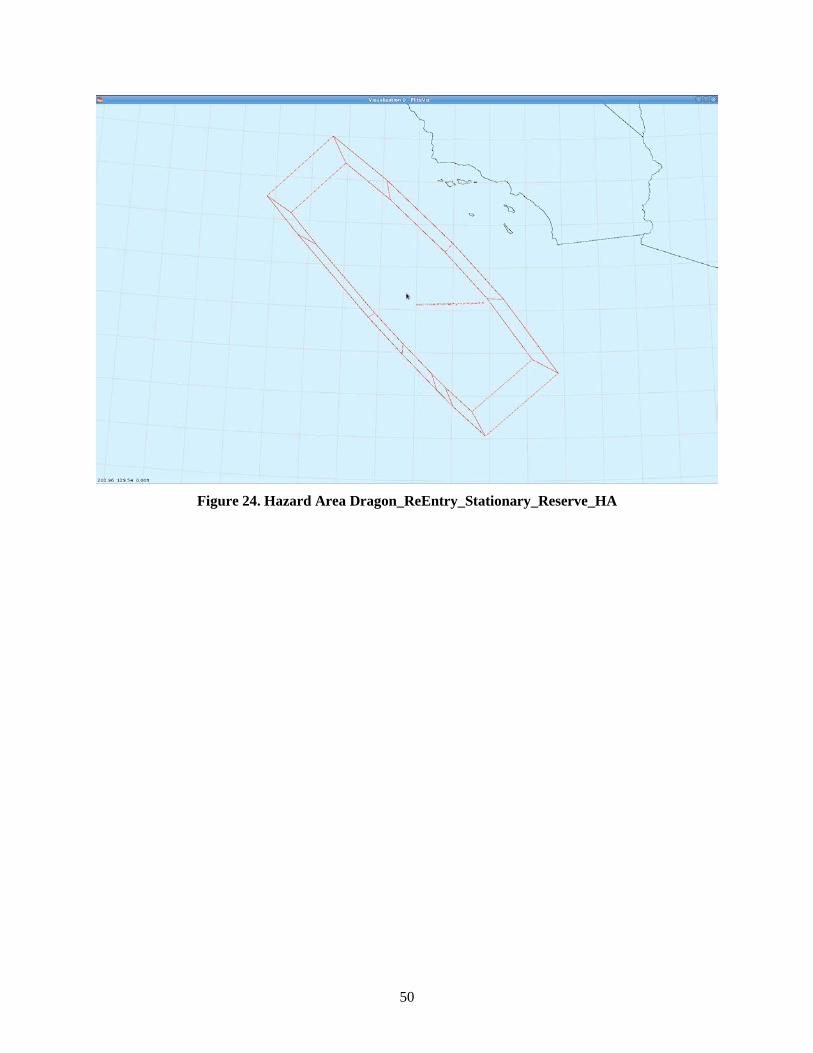
Figure 24. Hazard Area Dragon_ReEntry_Stationary_Reserve_HA
50
Appendix C: SpaceX Launch ATC NOTAM Data Current as of: Thu, 28 Feb 2013 15:59:00 GMT KZMA MIAMI (ARTCC), FL. A0177/13 (Issued for KZMA PART 1 OF 7) - QWMLW ER OP X5952 THE FOLLOWING AIRSPACE IN USE FOR A MISSILE LAUNCH/SPLASH DOWN. DURING THESE TIMES KZMA ARTCC/OAC, KZNY ARTCC/OAC & TJZS ARTCC/OAC WILL NOT APPROVE IFR FLIGHT WITHIN 45NM OF THE AFFECTED OCEANIC STATIONARY AIRSPACE RESERVATIONS WEST OF 5000W AND 50NM EAST OF 5000W OR WITHIN AFFECTED WARNING AREA AIRSPACE. EFF: 1303011210 THRU 1303011543 W497A WEST OF 8000W. SFC-FL050. EFF: 1303011310 THRU 1303011510 W497A SFC-FL180. EFF: 1303011510 THRU 1303011543 1. FROM 2835N 8037W TO 2847N 8031W TO 3036N 7830W TO 3220N 7626W TO 3216N 7622W TO 2833N 8020W TO 2826N 8021W TO 2830N 8033W TO 2832N 8036W TO BEGINNING. SURFACCE TO UNLIMITED. , - SEE TEXT END PART 1 OF 7 PARTS, SEE TEXT, 01 MAR 12:10 2013 UNTIL 01 MAR 15:43 2013. CREATED: 28 FEB 14:20 2013 A0177/13 (Issued for KZMA PART 2 OF 7) - ) QWMLW ER OP X5952 2. FROM 3354N 7519W TO 3538N 7332W TO 3646N 7042W TO 3641N 7036W TO 3444N 7220W TO 3242N 7431W TO 3338N 7532W TO BEGINNING. SURFACE TO UNLIMITED. 3. R2933 R2934. SURFACE TO UNLIMITED. 4. THAT PORTION OF W497A/B, W157 W158 W159 FROM 2840N 8034W TO 2847N 8031W TO 3152N 7700W TO 3142N 7700W TO 2833N 8020W TO 2826N 8021W TO 2828N 8028W TO BEGINNING. SURFACE TO UNLIMITED. 5. THAT PORTION OF W110, W122, W72 FROM 3338N 7532W TO 3354N 7519W TO 3538N 7332W TO 3559N 7239W TO 3505N 7239W TO 3320N 7512W TO BEGINNING. SURFACE TO UNLIMITED. IN THE INTEREST OF SAFETY ALL NONPARTICIPATING PILOTS ARE STRONGLY ADVISED TO AVOID THE ABOVE AREAS, EXCEPT AS NOTED BELOW FOR FLIGHT PLAN FILING PURPOSES. THE FOLLOWING RESTRICTIONS WILL BE IN EFFECT WITHIN KZMA KZJX KZNY TJZS FIRS. ALL SOUTHBOUND AR3, AR6, AR15, AR16, AR17, AR18, AR19, AR21, AR22, AR23, AR24, AND ALL OTHER TRAFFIC RALT MUST BE ESTIMATED END PART 2 OF 7 PARTS. SEE TEXT, 01 MAR 12:10 2013 UNTIL 01 MAR 15:43 2013. CREATED: 28 FEB 14:20 2013 A0177/13 (Issued for KZMA PART 3 OF 7) - QWMLW ER OP X5952 TO CLEAR THE ABOVE PORTIONS OF W497A/B, W157/158, W110,W122, W72, AND OCEANIC ALTRV(S) OR BEFORE 1303011505. THIS OPERATION MUST LAUNCH AT 1303011510, THERE IS NO EXTENDED WINDOW AND THE OPERATION HAS A LESS THAN NORMAL HAZARD WINDOW. LAUNCH HAZARD AREA 1 WINDOW IS 1303011510 TO 1303011513. LAUNCH HAZARD AREA 2 WINDOW IS 1303011510 TO 1303011516. IN THE EVENT OF A MALFUNCTION BOTH AREAS WILL BE CLOSED 1510-1542. FLIGHTS WITH TAS OF 450K AND ABOVE SHOULD PLAN DEPARTURES/ENROUTE TIMING TO BE CLEAR OF THE HAZARD AREAS BY 1504Z OR NOT ARRIVE AT THE HAZARD AREA UNTIL AFTER 1542Z. FLIGHTS THAT DO NOT MEET THESE TIMES WILL RECEIVE A REROUTE AROUND THE AIRSPACE WHICH WILL EXCEED ANY DELAY TIME REQUIRED TO MEET THE HAZARD PERIOD. NORTHBOUND JET TRAFFIC DEPARTING SO FLA ARPTS FILED AR ROUTES WILL BE REROUTED AFTER 1303011410. TURBOPROP/PROPS REQUIRE ADDITIONAL TIME. ATC WILL ISSUE FLOW RESTRICTIONS FOR DOMESTIC REROUTES TO AVOID AIRSPACE IN USE. THE FOLLOWING INTERNATIONAL ROUTES WILL BE IMPACTED, AR3, AR4, AR5, END PART 3 OF 7 PARTS. SEE TEXT, 01 MAR 12:10 2013 UNTIL 01 MAR 15:43 2013. CREATED: 28 FEB 14:20 2013 A0177/13 (Issued for KZMA PART 4 OF 7) - QWMLW ER OP X5952 AR6, AR8, AR15, AR16, AR17, AR18, AR19, AR21, AR22, AR23, AR24, B24, G446, L375, L435, L451, L452, L453, L454, L455, L457, L459, L463, M201, M202, M325, M326, AND Y585. INTERNATIONAL REROUTES ARE AS FOLLOWS:
51
FOR MYNN/MYGF REQUEST SOUTHBOUND TFC VIA ILM J174 CHS J79 TRV J45 BLUFI DCT ZFP BR63V ZQA. FOR MYGF REQUEST NORTHBOUND TFC DCT PBI DCT ORL J53 CRG J55 CHS J174 ILM THEN AS FILED. FOR MYNN REQUEST NORTHBOUND TFC DCT FLL DCT ORL J53 CRG J55 CHS J174 ILM THEN AS FILED. SOUTHBOUND OVERFLIGHT TRAFFIC TO OVER ZBV CAN EXPECT ROUTING O/ILM J174 CHS J79 PBI DCT ZBV THEN AS FILED. NORTHBOUND OVERFLIGHT TRAFFIC FROM OVER ZBV CAN EXPECT ROUTING VIA DCT FLL DCT ORL J53 CRG J55 CHS J174 ILM THEN AS FILED. AR3 NO.BND: EXPECT ZQA DCT FLL DCT ORL J53 CRG J55 CHS J174 ILM THEN AS FILED. SO.BND: EXPECT O/ILM J174 CHS J79 OMN J79 TRV J45 BLUFI DCT END PART 4 OF 7 PARTS. SEE TEXT, 01 MAR 12:10 2013 UNTIL 01 MAR 15:43 2013. CREATED: 28 FEB 14:20 2013 A0177/13 (Issued for KZMA PART 5 OF 7) - QWMLW ER OP X5952 ZFP BR63V ZQA. AR4 CLOSED. AR5 CLOSED. AR6 CLOSED. AR8 CLOSED. AR15 EXPECT O/ILM J174 CHS J79 OMN BITHO ARVL. AR16 EXPECT J53 CRG J55 CHS J174 ILM. AR17 EXPECT O/ILM J174 CHS J79 PBI DCT VKZ. AR18 EXPECT J53 CRG J55 CHS J174 DIW THEN AS FILED. AR19 EXPECT O/DIW J174 CHS J121 CRG J79 TRV CAYSL/FAWAY/TUXXI ARVL. AR21 EXPECT O/ILM J174 CHS J79 TRV FISEL/GISSH ARVL. AR22 EXPECT O/DIW J174 CHS J79 TRV ANNEY/HILEY ARVL. AR23 NO. BND: EXPECT URSUS A509 DHP J53 CRG J55 CHS J174 DIW THEN AS FILED. SO. BND: EXPECT O/DIW J174 CHS J79 TRV DCT PBI DCT URSUS THEN AS FILED. END PART 5 OF 7 PARTS. SEE TEXT, 01 MAR 12:10 2013 UNTIL 01 MAR 15:43 2013. CREATED: 28 FEB 14:20 2013 A0177/13 (Issued for KZMA PART 6 OF 7) - QWMLW ER OP X5952 AR24 NO.BND: EXPECT URSUS A509 DHP J53 CRG J55 CHS J174 DIW THEN AS FILED. SO. BND: EXPECT DIW J174 CHS J79 PBI DCT URSUS. B24 CONSIDER GROUND DELAY OR USE INLAND ROUTING. G446 NO. BND: EXPECT O/GTK A555 ZQA DCT FLL DCT ORL J53 CRG J55 CHS DCT CLB. SO. BND: EXPECT O/CLB DCT CHS J79 TRV J45 BLUFI DCT ZFP BR1L GTK. L375 EXPECT GROUND DELAY. L435 EXPECT GROUND DELAY. L451 CONSIDER GROUND DELAY OR USE INLAND ROUTING. L452 CONSIDER GROUND DELAY OR USE INLAND ROUTING. L453 CONSIDER GROUND DELAY OR USE L456 DARUX DCT ALOBI DCT L453 AND REVERSE. L454 CONSIDER GROUND DELAY OR USE L456 DARUX DCT SAVON L454 AND REVERSE. L455 CONSIDER GROUND DELAY OR USE L456 DARUS DCT BEXUM L455 AND REVERSE. END PART 6 OF 7 PARTS. SEE TEXT, 01 MAR 12:10 2013 UNTIL 01 MAR 15:43 2013. CREATED: 28 FEB 14:20 2013 A0177/13 (Issued for KZMA PART 7 OF 7) - QWMLW ER OP X5952 L463 NO. BND: IF NOT PROG PERIE BY 1504Z EXPECT TO HOLD AT CASPR, SCOBY, OR NUCAR FOR UNTIL 1518Z OR LONGER, OR EXPECT THE FOLLOWING RERTE - BTLER A555 ZQA DCT FLL DCT ORL J53 CRG J55 CHS CLB. SO. BND: EXPECT O/CLB DCT CHS J79 TRV J45 BLUFI DCT ZFP BR1L BRRGO L463. M201 USE M203 AND REVERSE. M202 USE M203 AND REVERSE. M325 EXPECT GROUND DELAY. M326 EXPECT GROUND DELAY.
52
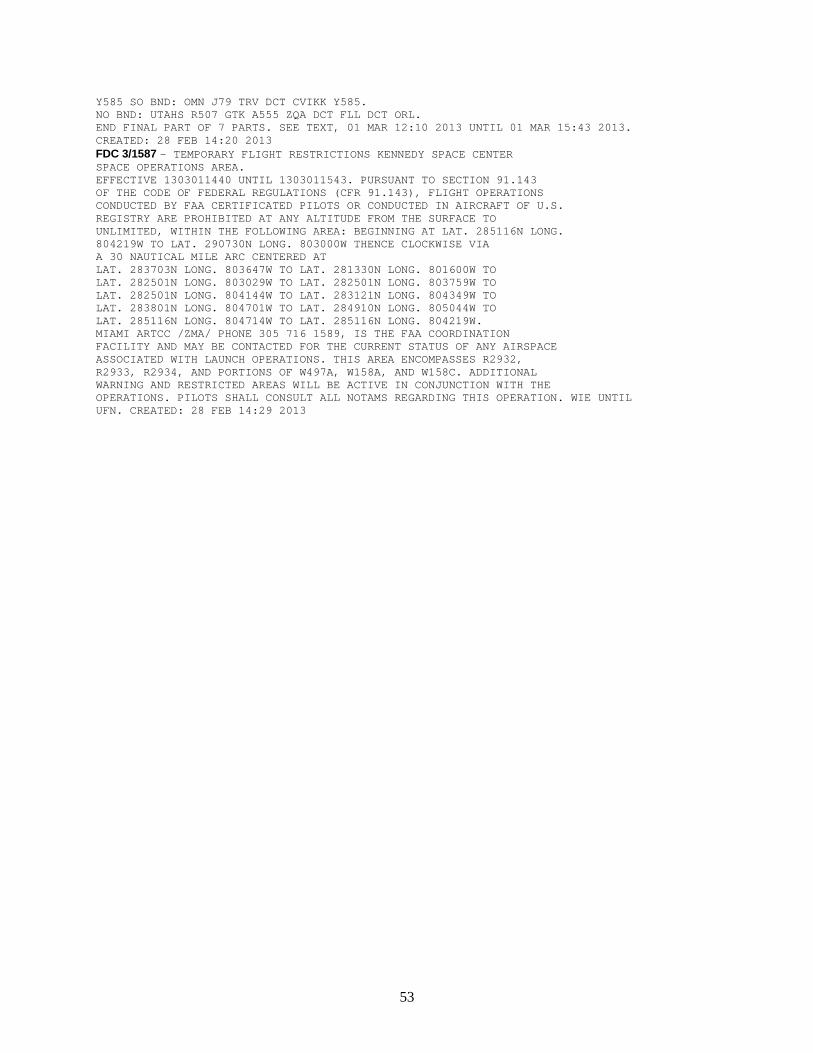
Y585 SO BND: OMN J79 TRV DCT CVIKK Y585. NO BND: UTAHS R507 GTK A555 ZQA DCT FLL DCT ORL. END FINAL PART OF 7 PARTS. SEE TEXT, 01 MAR 12:10 2013 UNTIL 01 MAR 15:43 2013. CREATED: 28 FEB 14:20 2013 FDC 3/1587 - TEMPORARY FLIGHT RESTRICTIONS KENNEDY SPACE CENTER SPACE OPERATIONS AREA. EFFECTIVE 1303011440 UNTIL 1303011543. PURSUANT TO SECTION 91.143 OF THE CODE OF FEDERAL REGULATIONS (CFR 91.143), FLIGHT OPERATIONS CONDUCTED BY FAA CERTIFICATED PILOTS OR CONDUCTED IN AIRCRAFT OF U.S. REGISTRY ARE PROHIBITED AT ANY ALTITUDE FROM THE SURFACE TO UNLIMITED, WITHIN THE FOLLOWING AREA: BEGINNING AT LAT. 285116N LONG. 804219W TO LAT. 290730N LONG. 803000W THENCE CLOCKWISE VIA A 30 NAUTICAL MILE ARC CENTERED AT LAT. 283703N LONG. 803647W TO LAT. 281330N LONG. 801600W TO LAT. 282501N LONG. 803029W TO LAT. 282501N LONG. 803759W TO LAT. 282501N LONG. 804144W TO LAT. 283121N LONG. 804349W TO LAT. 283801N LONG. 804701W TO LAT. 284910N LONG. 805044W TO LAT. 285116N LONG. 804714W TO LAT. 285116N LONG. 804219W. MIAMI ARTCC /ZMA/ PHONE 305 716 1589, IS THE FAA COORDINATION FACILITY AND MAY BE CONTACTED FOR THE CURRENT STATUS OF ANY AIRSPACE ASSOCIATED WITH LAUNCH OPERATIONS. THIS AREA ENCOMPASSES R2932, R2933, R2934, AND PORTIONS OF W497A, W158A, AND W158C. ADDITIONAL WARNING AND RESTRICTED AREAS WILL BE ACTIVE IN CONJUNCTION WITH THE OPERATIONS. PILOTS SHALL CONSULT ALL NOTAMS REGARDING THIS OPERATION. WIE UNTIL UFN. CREATED: 28 FEB 14:29 2013
53
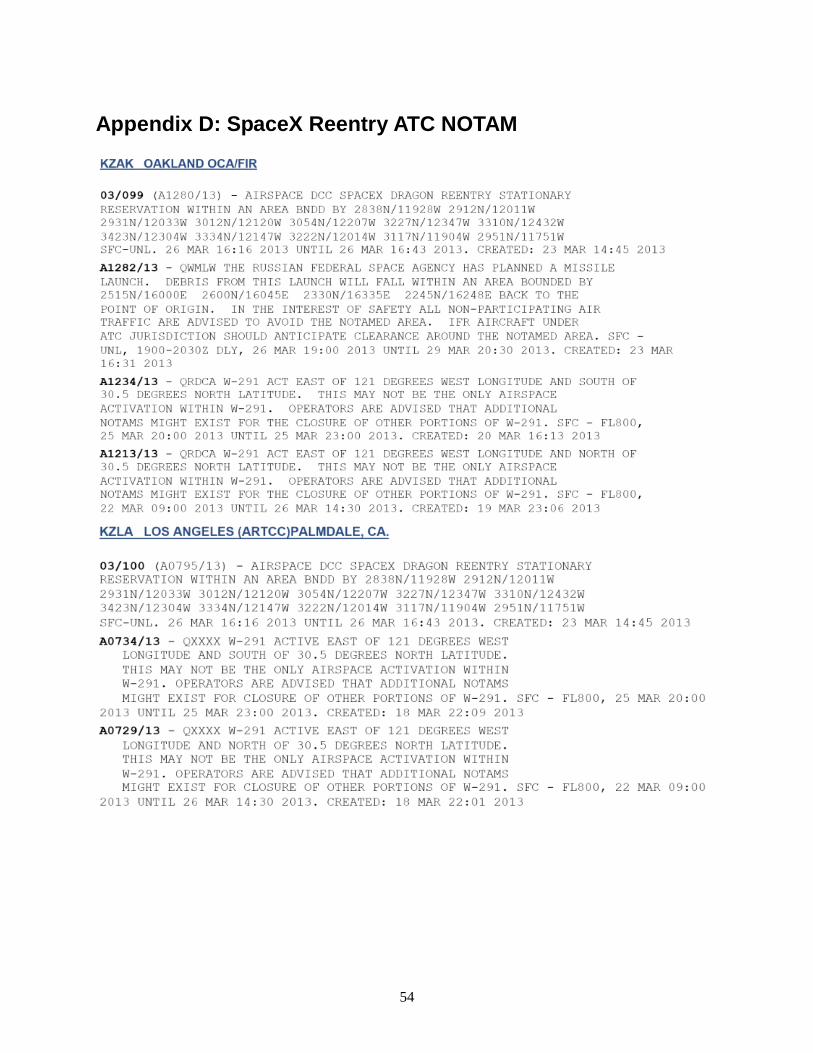
Appendix D: SpaceX Reentry ATC NOTAM
54