s&p dow jones indices etf masterclass 2017 sheraton centre ...€¦ · s&p dow jones...
TRANSCRIPT

ETFinsightYOUR SOURCEFOR THE LATESTETF NEWS & INSIGHTS
S&P Dow Jones Indices ETF Masterclass 2017Sheraton Centre Toronto Hotel
1

2
ETFinsight – A more Active Approach to Passive Investing

3
ETFinsight – A more Active Approach to Passive Investing
Latest Developments “Factors” Front:
• S&P/TSX Composite Enhanced Value Index. The index is designed to measure stocks with attractive valuations in the S&P/TSX Composite on the basis of their value score, which is calculated based on three fundamental measures, book value-to-price, earnings-to-price and sales-to-price.
• S&P/TSX Composite Low Volatility High Dividend Index. The index is designed to measure the performance of the 50 least volatile high yielding stocks within the S&P/TSX Composite. Volatility is defined as the standard deviation of the security’s daily price returns in local currency over the past year. Constituents are weighted relative to the inverse of their corresponding volatility, with the least volatile stocks receiving the highest weights.
• S&P/TSX Composite Momentum Index. The index is designed to measure the performance of securities in the S&P/TSX Composite that exhibit persistence in their relative performance.
• S&P/TSX Composite Quality Index – The index is designed to measure high quality stocks in the S&P/TSX Composite on the basis of their quality score, which is calculated based on three fundamental measures, return on equity, accruals ratio and financial leverage ratio.
• S&P/TSX Composite Volatility – Highest Quintile Index. The index is designed to measure the performance of the 50 most volatile stocks in the S&P/TSX composite. Volatility is defined as the standard deviation of the security’s daily price returns in local currency over the past year.

4
ETFinsight – A more Active Approach to Passive Investing
Latest Developments “Factors” Front:
• Other: • S&P/TSX Composite Enhanced Value – Lowest Quintile Index. The index is designed to
meaasure the performance of the 50 lowest ranked stocks in the S&P/TSX Composite based on their value score, which is calculated base on three fundamental measures: book value-to-price, earnings-to-price, and sales-to price.
• S&P/TSX Composite Momentum – Lowest Quintile Index. The index is designed to measure the performance of the stocks in the S&P/TSX Composite that exhibit the least persistence in their relative performance.
• S&P/TSX Composite Quality – Lowest Quintile Index. The index is designed to measure the performance of the 50 lowest ranked stocks in the S&P/TSX Composite based on their quality score, which is calculated based on three fundamental measures: return on equity, accruals ratio, and financial leverage ratio.

5
Once upon a time …Basic, simple factors:• Value; Growth; SRI
More recently:More factors drawing on “Academic” return premia ingredient:• More Factors – Value; Momentum; Yield; Low/Min Volatility;
Quality; Size• Multi Factors – Combination of Low Volatility and High
Dividend; Quality and Yield; Value, momentum, quality, and size
Other: Modified Market Capitalization; Thematic
ETFinsight – A more Active Approach to Passive Investing

6
The following slides look at the Smart Beta “phenomenon” with data updated to May 31, 2017
ETFinsight – A more Active Approach to Passive Investing

7
ETFs – From Market Cap weighted (totally passive) to Factors based (Smart Beta) to Actively Managed …
ETFinsight – A more Active Approach to Passive Investing
VALUE MOMENTUM + GROWTH RAFI QUALITY SMALL CAP/EW VOL "DRIVEN" YIELD Multi-Factors aggregate factorsyoy yoy yoy y/o/y yoy yoy yoy yoy yoy
-4.9% -7.8% 8.5% 88.7% 27.7% 15.5% 43.4% 425.5% 34.4%2016 2016 2016 2016 2016 2016 2016 2016 2016-5.3% -24.5% 7.0% 52.2% 39.5% 87.9% 56.2% 260.0% 49.9%
yoy $ growth yoy $ growth yoy $ growth yoy $ growth yoy $ growth yoy $ growth yoy $ growth yoy $ growth yoy $ growth-$28,979,220 -$29,809,809 $106,515,037 $391,587,597 $989,464,184 $604,660,932 $3,734,137,884 $742,613,872 $6,510,190,477
-0.4% -0.5% 1.6% 6.0% 15.2% 9.3% 57.4% 11.4% 100.0%Y/O/Y AUM CHANGE 3.31% CIE/CIE.A CIE performance: 23.3%Y/O/Y AUM CHANGE 7.67% CJP/CJP.A CJP performance: 16.3%Y/O/Y AUM CHANGE -5.12% CLU/CLU.A CLU performance: 14.2%Y/O/Y AUM CHANGE 1.79% CLU.C/CLU.B CLU performance: #N/AY/O/Y AUM CHANGE 6.73% CRQ.A CRQ performance: 13.5%Y/O/Y AUM CHANGE 57.94% CWO/CWO.A CWO performance: 39.5%Y/O/Y AUM CHANGE 34.87% PXC PXC performance: 13.8%Y/O/Y AUM CHANGE 12.74% PXU.F PXU performance: 14.6%
LOW SIZE VALUE MOMENTUM QUALITY (INCL.RAFI) YIELD VOL DRIVEN Multi-Factors
$4,564,253,195 $565,422,805 $350,024,156 $2,197,470,786 $12,333,795,508 $4,498,029,716 $917,124,405 $25,426,120,572
18.0% 2.2% 1.4% 8.6% 48.5% 17.7% 3.6% 100.0%

8
ETFs – From Market Cap weighted (totally passive) to Factors based (Smart Beta) to Actively Managed …
ETFinsight – A more Active Approach to Passive Investing
VALUE MOMENTUM + GROWTH RAFI / Quality SMALL CAP/EW VOL "DRIVEN" YIELD MULTI-FACTORS31-May-10 61,227,882$ 51,216,092$ 461,858,784$ 387,783,212$ -$ 972,031,399$
VALUE MOMENTUM + GROWTH RAFI / Quality SMALL CAP/EW VOL "DRIVEN" YIELD31-May-13 65,485,681$ 53,854,866$ 1,048,473,587$ 2,003,862,710$ 264,945,451$ 3,353,729,865$
VALUE MOMENTUM + GROWTH RAFI / Quality SMALL CAP/EW VOL "DRIVEN" YIELD31-May-16 594,402,025$ 379,833,965$ 1,699,368,152$ 3,574,789,011$ 3,893,368,783$ 8,599,657,625$ 174,510,534$
VALUE MOMENTUM + GROWTH RAFI / Quality SMALL CAP/EW VOL "DRIVEN" YIELD MULTI-FACTORS31-May-17 565,422,805$ 350,024,156$ 2,197,470,786$ 4,564,253,195$ 4,498,029,716$ 12,333,795,508$ 917,124,405$
VALUE MOMENTUM + GROWTH RAFI / Quality SMALL CAP/EW VOL "DRIVEN" YIELD MULTI-FACTORS$9.23 $6.83 $4.76 $11.77 infinity… $12.69

9
ETFinsight – A more Active Approach to Passive Investing

10
ETFs – From Market Cap weighted (totally passive) to Factors based (Smart Beta) to Actively Managed …
ETFinsight – A more Active Approach to Passive Investing

11
ETFs – From Market Cap weighted (totally passive) to Factors based (Smart Beta) to Actively Managed …
ETFinsight – A more Active Approach to Passive Investing
12
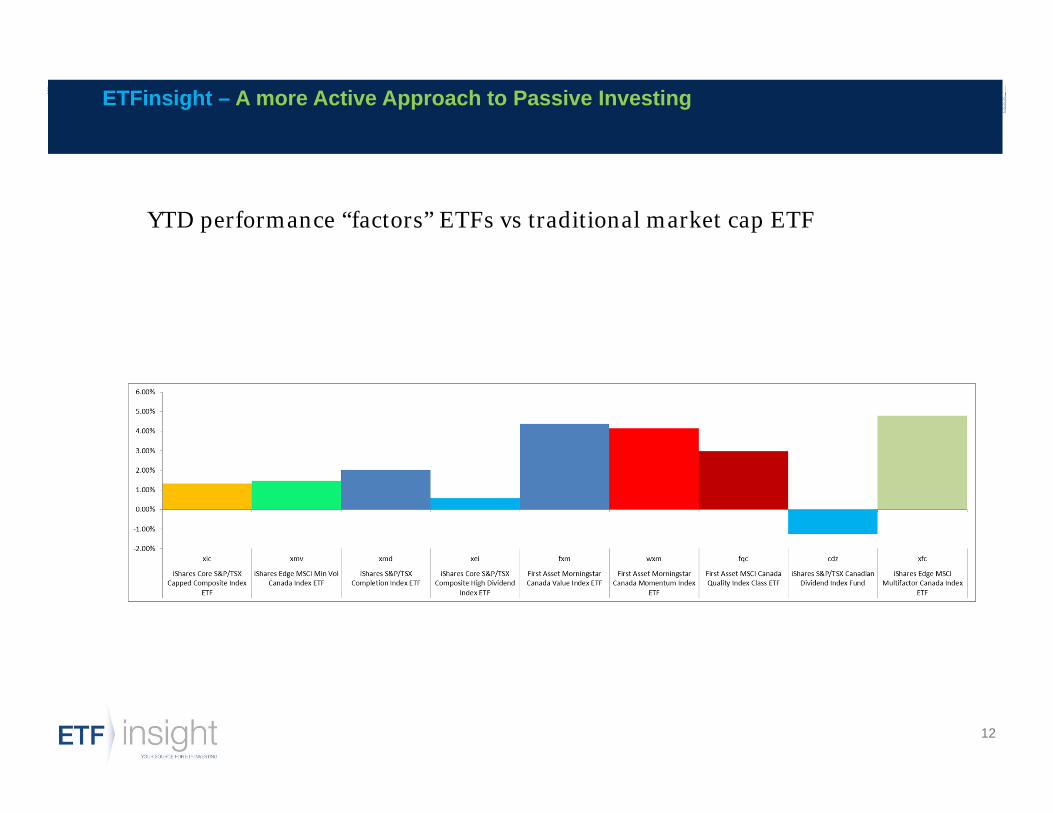
YTD performance “factors” ETFs vs traditional market cap ETF
ETFinsight – A more Active Approach to Passive Investing

13
YTD – World Factors versus Traditional All-countries ETF
ETFinsight – A more Active Approach to Passive Investing

14
ETFinsight – A more Active Approach to Passive Investing
Using “Factors”• Understand - “Core” Factor Attribute• Determine - fit with Portfolio need / client’s potential bias respectively
investment philosophy• Be aware - of potential for differential between back tests and real life
performance• Appreciate - that factors a) cost more (but pricing is also under pressure…)
and also importantly b) individually can be out of favor for lengthy periods• Understand – that Factors don’t necessarily behave similarly across
different geographies• Evaluate – whether Factors exposure is implemented as a strategic position,
or more as a tactical move

15
ETFinsight – A more Active Approach to Passive Investing
Following slides:
Industry growth – backdropRunway ahead – why still very significant?

16
ETFinsight – A more Active Approach to Passive Investing

17
ETFinsight – A more Active Approach to Passive Investing
So why haven’t we seen anything yet?
• Unlike the US, where $$$ have flown out of Actively Managed Mutual Funds, here, while ETFs punch above their weight in net Inflows terms, they still represent less than 1/10 of the Mutual Fund Industry (and the MFDA “channel” is opening up … in 2017!)
• That costs matter will eventually dawn on Canadians … Regulators hopefully put an end to practices that have possibly entrenched conflicts of interests …(CSA looking for rigorous evidence-based feedback – Investment Executive, May 2017).
• The realization that the odds of Active outperforming are very low will eventually reached returns challenged Canadians…
• New channels capitalizing on the opportunity this presents are developing• ONLY 1 bank out of the big 5 (or 6) has a significant stake in the ETF game (BMO)• ONLY 1 insurance company has thus far joined the fray (Manulife)• A handful of Mutual Funds cos have begun to tackle the task (CI; Mackenzie; AGF; Excel;
Franklin Templeton)

18
ETFinsight – A more Active Approach to Passive Investing
So why haven’t we seen anything yet? (continued)
• Democratization of Access (yes) of Benefits (cost side) perhaps not as broadly …• Active / Passive discussion … (complete non-sense … Mark Wiseman ex CPPIB head,
now at BlackRock. Reality every decision is ACTIVE – Active decision to Index; Active decision to use “Factors” or “Smart/Strategic Beta”; Active decision to use Quants; Active decision to invest Fundamentally; Active decision to pursue high conviction strategy; Active decision to use ALTs; and Private Equity

19
ETFinsight – A more Active Approach to Passive Investing
So why haven’t we seen anything yet? (continued)
And we don’t have these either:• Obesity ETF; nor Forensic Accounting
ETF (Hello Veritas); nor OLD; nor cloud Computing ETF … nor, for that matter WSKY or Nashville ETFs … but we do have … HMMJ (fastest ETF AUM growth out of the gate … EVER)!

20
Canadian ETF industry (Aug 31, 2017)
ETFinsight – A more Active Approach to Passive Investing

21
ETFinsight – A more Active Approach to Passive Investing

22
ETFs in 2017/2018 – Further Growth Acceleration?/Trends:
• Beta - accessible at exceedingly low (3-5 bps) costs (incl. Bonds!)• Alpha – (Smart Beta) – Adoption rate higher than pure passive, but
of smaller base. Alpha Fees to experience compression• Investors – More attuned to fees impact and potential conflicts:
CRM2. Trailer fees: what will CSA do? Fiduciary duty - Could it land here too?
• Outcome? – Look to New Intermediaries in wealth management –ROBOs, ETF Strategists, and Providers as partners.
• ETF Industry – Everyone becoming … Everything? Asset Manager; ROBO; Strategist; etc (Distr. Channels MF used by ETFs)
ETFinsight – A more Active Approach to Passive Investing

23
ETFinsight – A more Active Approach to Passive Investing
So why haven’t we seen anything yet?• Unlike the US, where $$$ have flown out of Actively Managed Mutual Funds, here, while
ETFs punch above their weight in net Inflows terms, they still represent less than 1/10 of the Mutual Fund Industry
• That costs matter will eventually dawn on Canadians … Regulators hopefully put an end to practices that have possibly entrenched conflicts of interests …
• The realization that the odds of Active outperforming at very low will eventually reached returns challenged Canadians…
• New channels capitalizing on the opportunity this presents are developing• ONLY 1 bank out of the big 5 (or 6) has a significant stake in the ETF game (BMO)• ONLY 1 insurance company has thus far joined the fray (Manulife)• A handful of Mutual Funds cos have begun to tackle the task (CI; Mackenzie; AGF; Excel;
Franklin Templeton)

24
ETFINSIGHTYOUR SOURCEFOR THE LATESTETF NEWS& INSIGHTS