southern connecticut community traffic safety conference
TRANSCRIPT
Occupant Protection/Impaired DrivingConnecticut Observational and Attitudinal Data
Tara Casanova-Powell
2011 Southern Connecticut Community Traffic Safety Conference
Southern Connecticut Community Traffic Safety Conference, March 10, 2011—New Haven, CT
Occupant Protection-BackgroundOccupant Protection-Background
Seat belt use is one of the most important factors in preventing or reducing injuries to occupants involved in a crash.
Belts reduce the risk of: fatal injury by 45% and; moderate to severe injury by 50%.
Of the 21,652 occupants of passenger vehicles killed in traffic crashes in 2009 where belt use was known, an estimated 53% were not wearing seat belts.
Southern Connecticut Community Traffic Safety Conference, March 10, 2011—New Haven, CT
Occupant Protection-CT Belt UseOccupant Protection-CT Belt Use
Belt use surveys have been conducted under the direction of the Connecticut Department of Transportation’s (CDOT) Transportation Safety Section (TSS) since 1995.
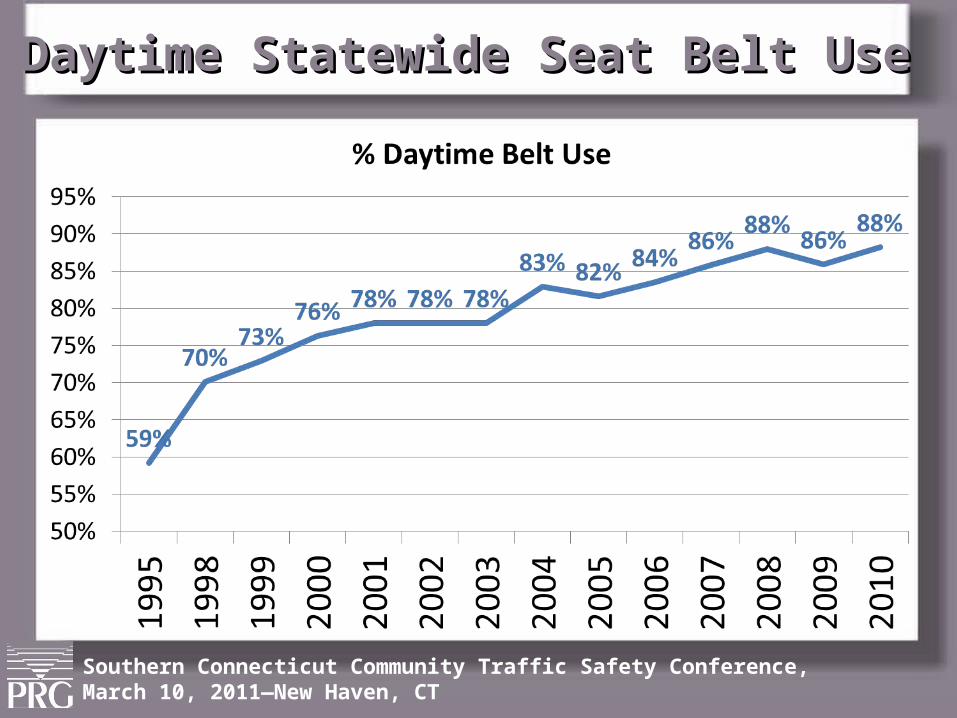
Statewide daytime safety belt use has increased 29 percentage points since the first comparable statewide survey in 1995.
Southern Connecticut Community Traffic Safety Conference, March 10, 2011—New Haven, CT
Daytime Statewide Seat Belt UseDaytime Statewide Seat Belt Use
Southern Connecticut Community Traffic Safety Conference, March 10, 2011—New Haven, CT
Seat Belt Observation SurveysSeat Belt Observation Surveys
Surveys determine statewide safety belt usage for drivers and outboard front seat passengers in passenger vehicles once during daytime hours and again at night.
Additional use rates are calculated for specific locations, type of vehicle, day and time as well as other conditions that may be associated with seat belt use.
Surveys are conducted in June directly after the national (and State) Click It or Ticket campaign at the same 100 sites every year.
Southern Connecticut Community Traffic Safety Conference, March 10, 2011—New Haven, CT
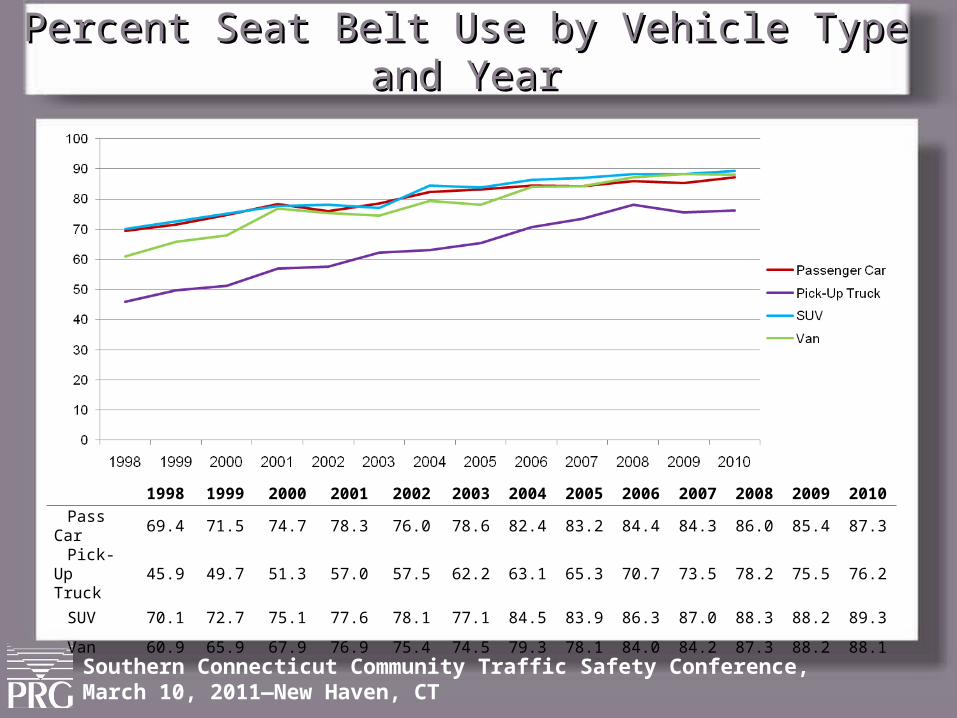
Percent Seat Belt Use by Vehicle Type and YearPercent Seat Belt Use by Vehicle Type and Year
1998 1999 2000 2001 2002 2003 2004 2005 2006 2007 2008 2009 2010Pass
Car69.4 71.5 74.7 78.3 76.0 78.6 82.4 83.2 84.4 84.3 86.0 85.4 87.3
Pick-Up Truck
45.9 49.7 51.3 57.0 57.5 62.2 63.1 65.3 70.7 73.5 78.2 75.5 76.2
SUV 70.1 72.7 75.1 77.6 78.1 77.1 84.5 83.9 86.3 87.0 88.3 88.2 89.3
Van 60.9 65.9 67.9 76.9 75.4 74.5 79.3 78.1 84.0 84.2 87.3 88.2 88.1
Southern Connecticut Community Traffic Safety Conference, March 10, 2011—New Haven, CT
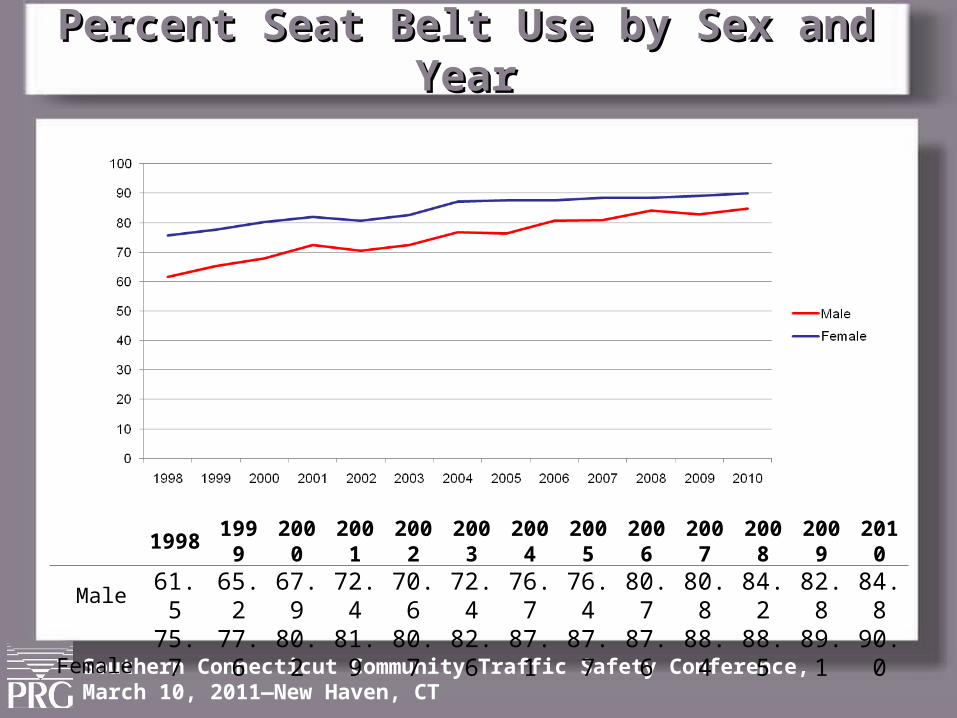
Percent Seat Belt Use by Sex and YearPercent Seat Belt Use by Sex and Year
1998 1999 2000 2001 2002 2003 2004 2005 2006 2007 2008 2009 2010
Male 61.5 65.2 67.9 72.4 70.6 72.4 76.7 76.4 80.7 80.8 84.2 82.8 84.8Female 75.7 77.6 80.2 81.9 80.7 82.6 87.1 87.7 87.6 88.4 88.5 89.1 90.0
Southern Connecticut Community Traffic Safety Conference, March 10, 2011—New Haven, CT
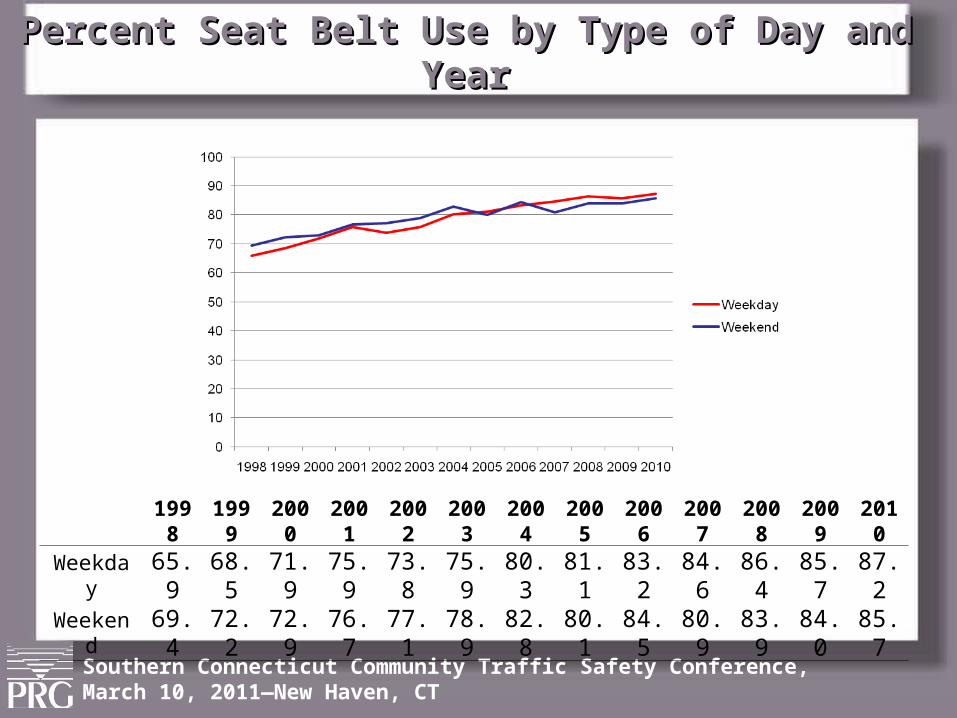
Percent Seat Belt Use by Type of Day and YearPercent Seat Belt Use by Type of Day and Year
1998 1999 2000 2001 2002 2003 2004 2005 2006 2007 2008 2009 2010
Weekday 65.9 68.5 71.9 75.9 73.8 75.9 80.3 81.1 83.2 84.6 86.4 85.7 87.2
Weekend 69.4 72.2 72.9 76.7 77.1 78.9 82.8 80.1 84.5 80.9 83.9 84.0 85.7
Southern Connecticut Community Traffic Safety Conference, March 10, 2011—New Haven, CT
The Problem of Night Belt UseThe Problem of Night Belt Use
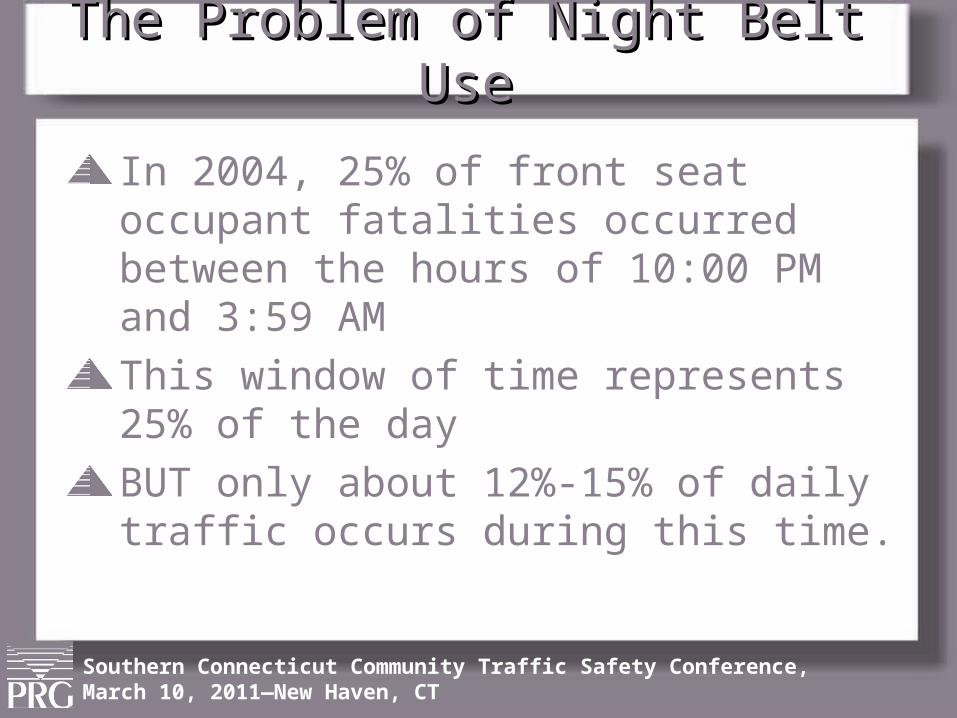
In 2004, 25% of front seat occupant fatalities occurred between the hours of 10:00 PM and 3:59 AM
This window of time represents 25% of the day
BUT only about 12%-15% of daily traffic occurs during this time.

Southern Connecticut Community Traffic Safety Conference, March 10, 2011—New Haven, CT
20
25
30
35
40
45
50
55
60N
oo
n1
:00
PM
2:0
0 P
M3
:00
PM
4:0
0 P
M5
:00
PM
6:0
0 P
M7
:00
PM
8:0
0 P
M9
:00
PM
10
:00
PM
11
:00
PM
Mid
nig
ht
1:0
0 A
M2
:00
AM
3:0
0 A
M4
:00
AM
5:0
0 A
M6
:00
AM
7:0
0 A
M8
:00
AM
9:0
0 A
M1
0:0
0 A
M1
1:0
0 A
M
Time
Per
cen
t B
elte
dThe Problem of Night Belt UseThe Problem of Night Belt Use
% Belted among fatally injured front seat occupants of passenger vehicles
Source: FARS 1998-2004
Southern Connecticut Community Traffic Safety Conference, March 10, 2011—New Haven, CT
Night Belt UseNight Belt Use
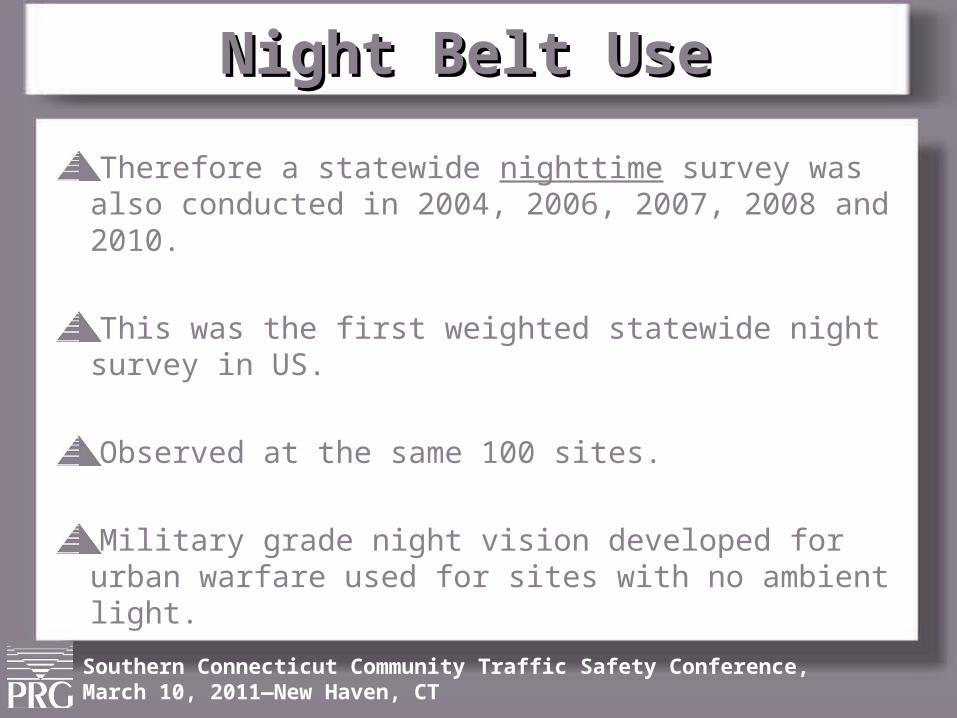
Therefore a statewide nighttime survey was also conducted in 2004, 2006, 2007, 2008 and 2010.
This was the first weighted statewide night survey in US.
Observed at the same 100 sites.
Military grade night vision developed for urban warfare used for sites with no ambient light.
Southern Connecticut Community Traffic Safety Conference, March 10, 2011—New Haven, CT
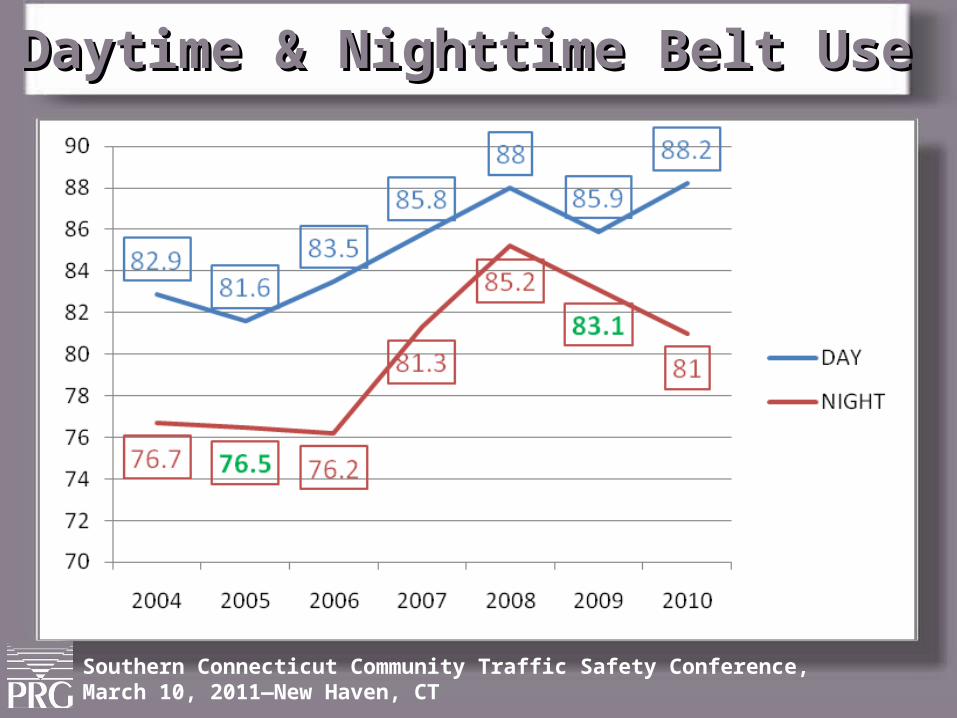
Daytime & Nighttime Belt UseDaytime & Nighttime Belt Use
Southern Connecticut Community Traffic Safety Conference, March 10, 2011—New Haven, CT
2010 Daytime & Nighttime Belt Use2010 Daytime & Nighttime Belt Use
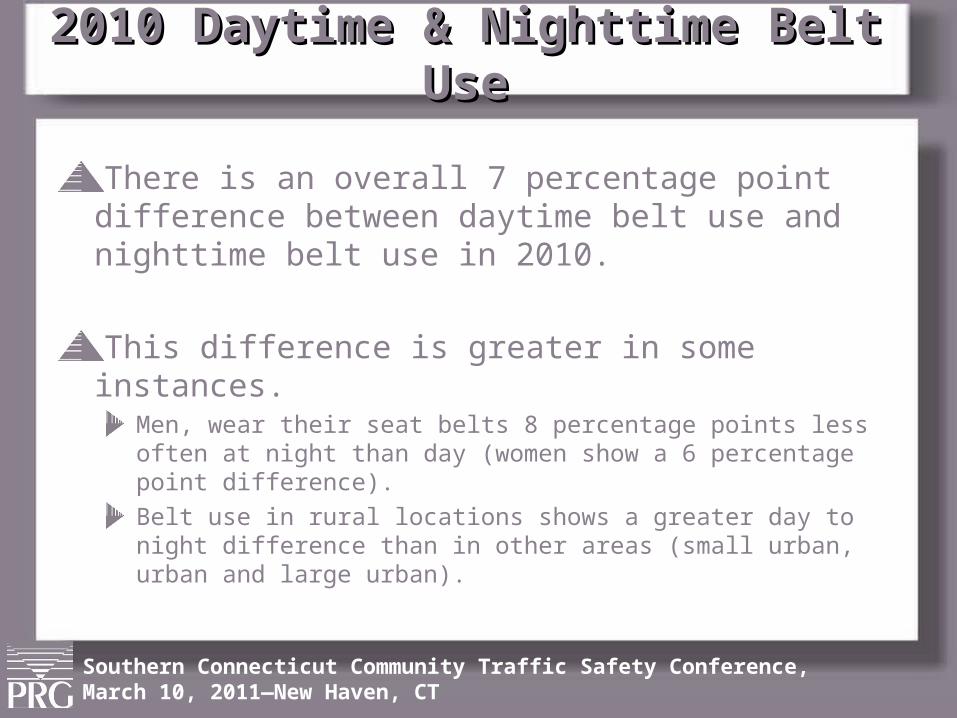
There is an overall 7 percentage point difference between daytime belt use and nighttime belt use in 2010.
This difference is greater in some instances. Men, wear their seat belts 8 percentage points less often at night than day (women show a 6 percentage point difference).
Belt use in rural locations shows a greater day to night difference than in other areas (small urban, urban and large urban).
Southern Connecticut Community Traffic Safety Conference, March 10, 2011—New Haven, CT
Seat Belt Awareness SurveysSeat Belt Awareness Surveys
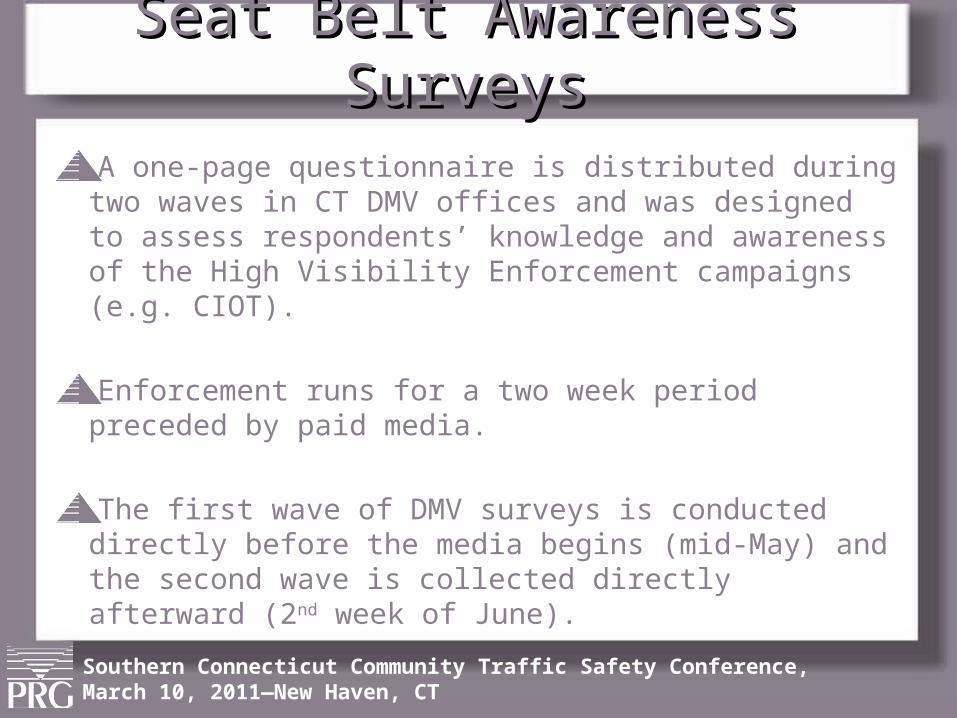
A one-page questionnaire is distributed during two waves in CT DMV offices and was designed to assess respondents’ knowledge and awareness of the High Visibility Enforcement campaigns (e.g. CIOT).
Enforcement runs for a two week period preceded by paid media.
The first wave of DMV surveys is conducted directly before the media begins (mid-May) and the second wave is collected directly afterward (2nd week of June).
Southern Connecticut Community Traffic Safety Conference, March 10, 2011—New Haven, CT
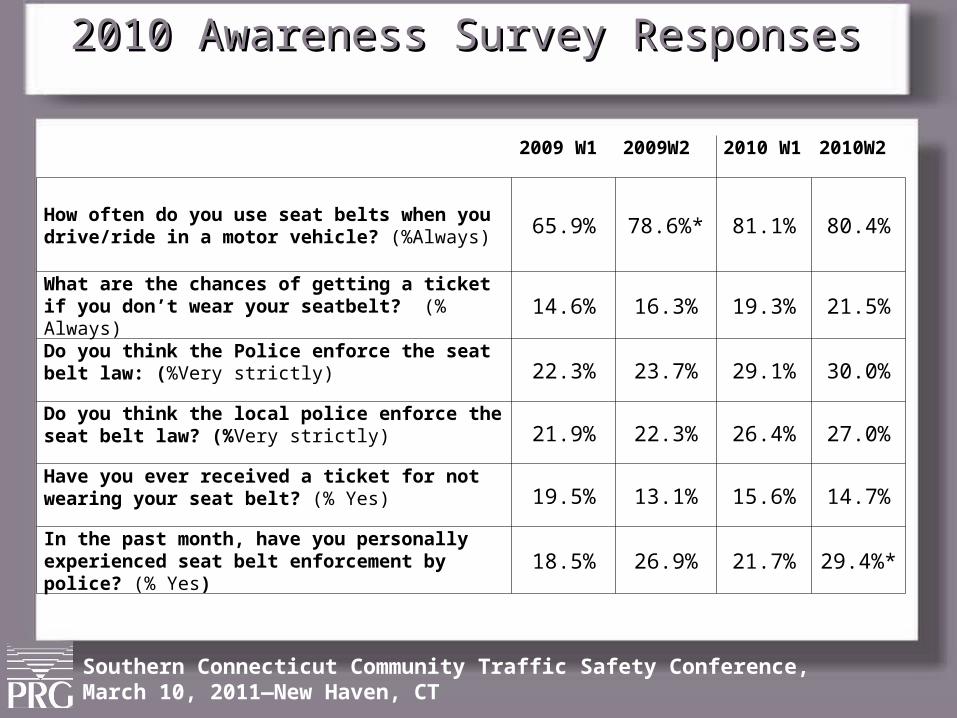
2010 Awareness Survey Responses2010 Awareness Survey Responses
2009 W1 2009W2 2010 W1 2010W2
How often do you use seat belts when you drive/ride in a motor vehicle? (%Always) 65.9% 78.6%* 81.1% 80.4%
What are the chances of getting a ticket if you don’t wear your seatbelt? (% Always) 14.6% 16.3% 19.3% 21.5%
Do you think the Police enforce the seat belt law: (%Very strictly) 22.3% 23.7% 29.1% 30.0%
Do you think the local police enforce the seat belt law? (%Very strictly) 21.9% 22.3% 26.4% 27.0%
Have you ever received a ticket for not wearing your seat belt? (% Yes) 19.5% 13.1% 15.6% 14.7%
In the past month, have you personally experienced seat belt enforcement by police? (% Yes) 18.5% 26.9% 21.7% 29.4%*
Southern Connecticut Community Traffic Safety Conference, March 10, 2011—New Haven, CT
Impaired Driving-BackgroundImpaired Driving-Background
In 2003 Connecticut launched a statewide impaired-driving publicity and enforcement campaign.
This represents the first time CT expended substantial resources for both media and enforcement in it’s efforts to reduce impaired driving and ultimately alcohol related injury and fatal crashes.
Southern Connecticut Community Traffic Safety Conference, March 10, 2011—New Haven, CT
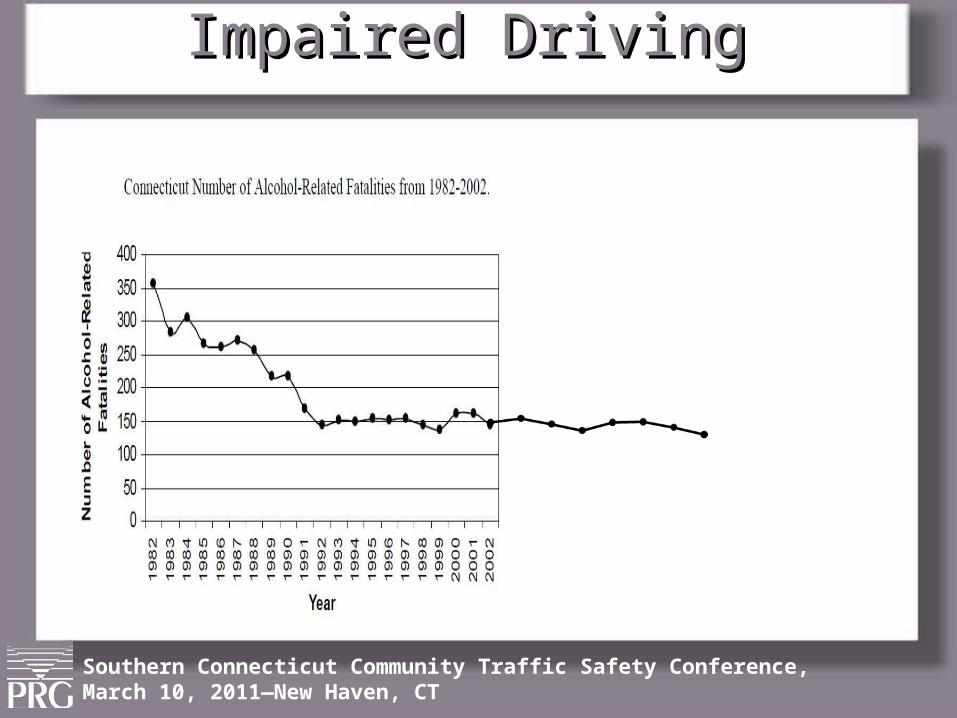
Impaired DrivingImpaired Driving

Southern Connecticut Community Traffic Safety Conference, March 10, 2011—New Haven, CT
Impaired Driving-Program DescriptionImpaired Driving-Program Description
Campaign consisted of three components:Media with enforcement message.
Enhanced periods of enforcement surrounding July 4th and winter holidays focusing on the use of sobriety checkpoints.
Sustained enforcement between holiday enforcement periods.
Southern Connecticut Community Traffic Safety Conference, March 10, 2011—New Haven, CT
Impaired Driving Program Description-MediaImpaired Driving Program Description-Media
$11 million was appropriated by Congress for paid media.
$5.5 million – TV air time.
For each campaign period a 4-6 week paid and earned media campaign with a strong enforcement message was implemented.
In short---HUGE
Southern Connecticut Community Traffic Safety Conference, March 10, 2011—New Haven, CT
Impaired Driving Program Description-EnforcementImpaired Driving Program Description-Enforcement
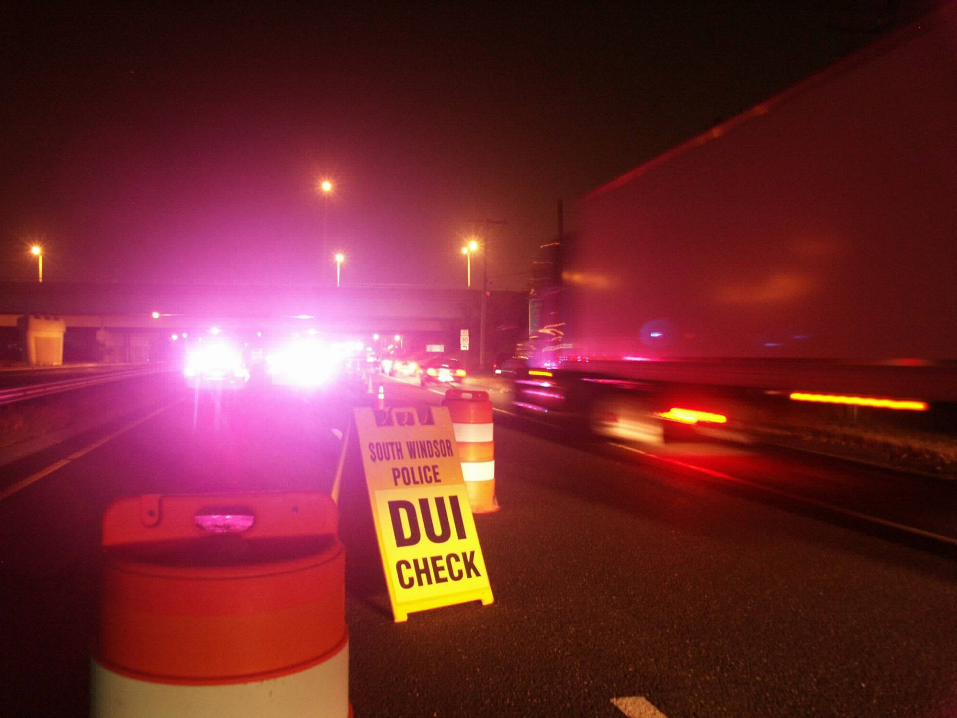
Sobriety Checkpoints constituted the main focus of the enforcement effort.
Town and State Police conducted a total of 24 sobriety checkpoints during the July 4th holiday period and 51 during the winter holiday period.
Southern Connecticut Community Traffic Safety Conference, March 10, 2011—New Haven, CT
Impaired Driving Campaign- EvaluationImpaired Driving Campaign- Evaluation
Various types of data were collected before and after each holiday campaign:
Telephone Surveys
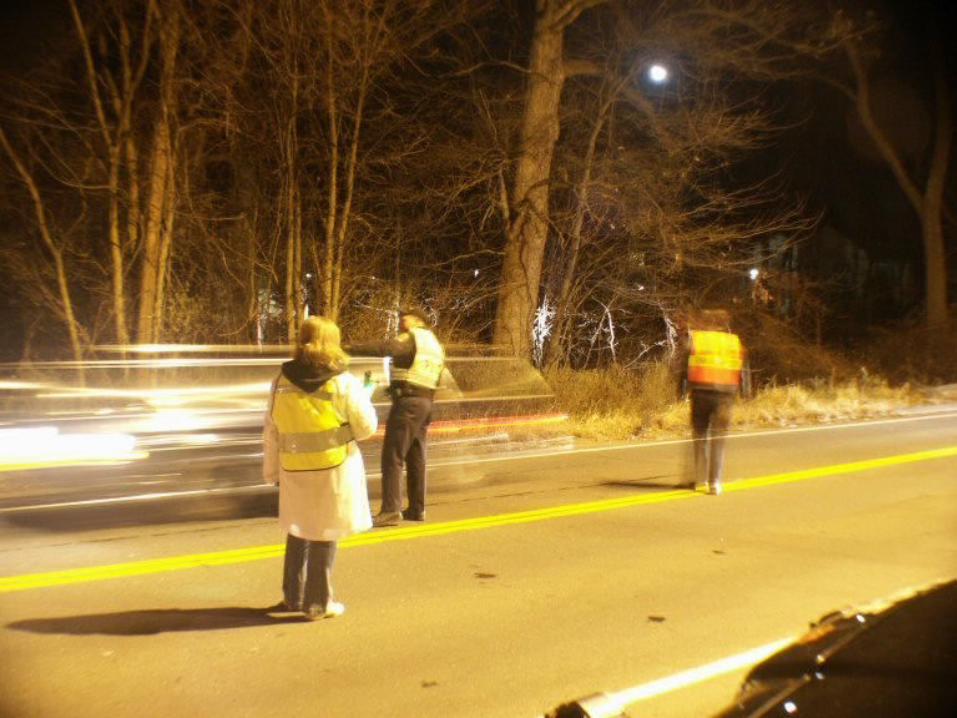
Sobriety checkpoint observations/surveys
DWI Arrest Data
Alcohol-related fatality data.
Southern Connecticut Community Traffic Safety Conference, March 10, 2011—New Haven, CT
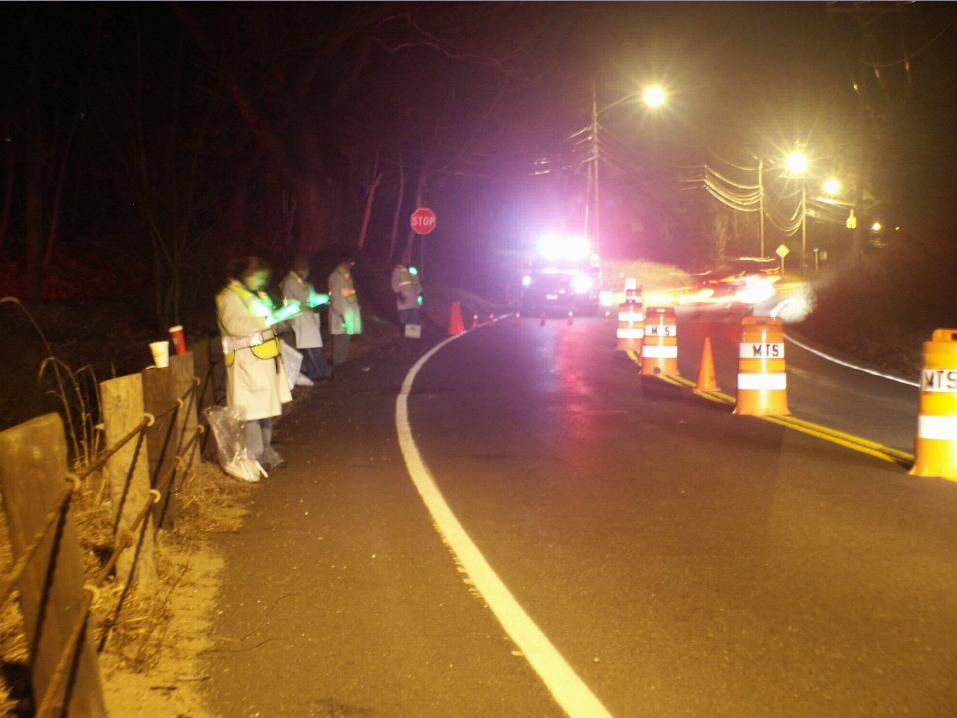
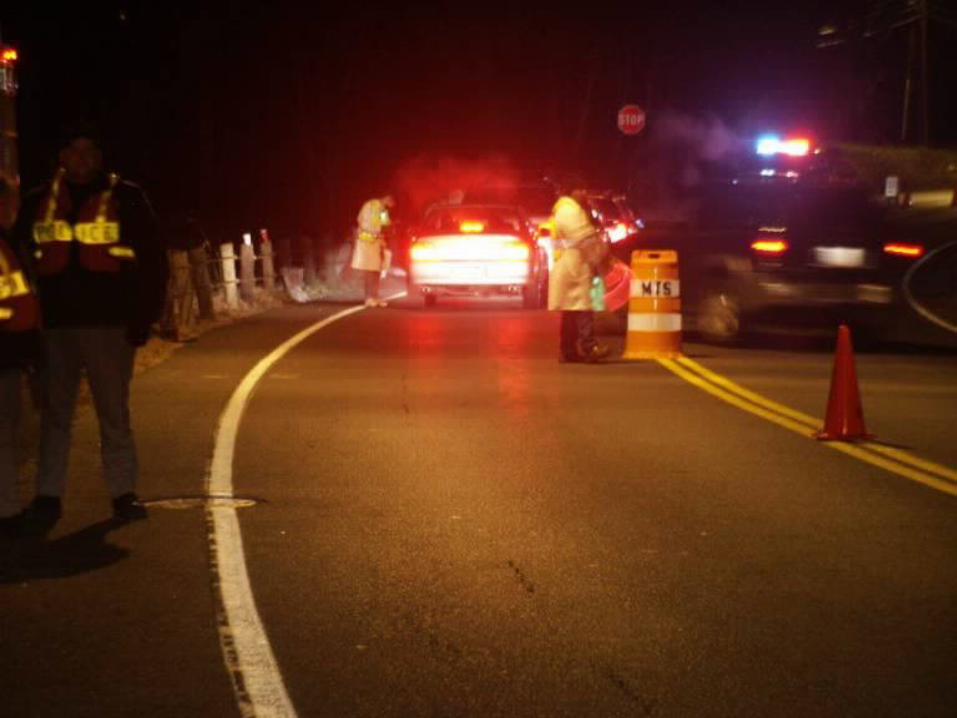
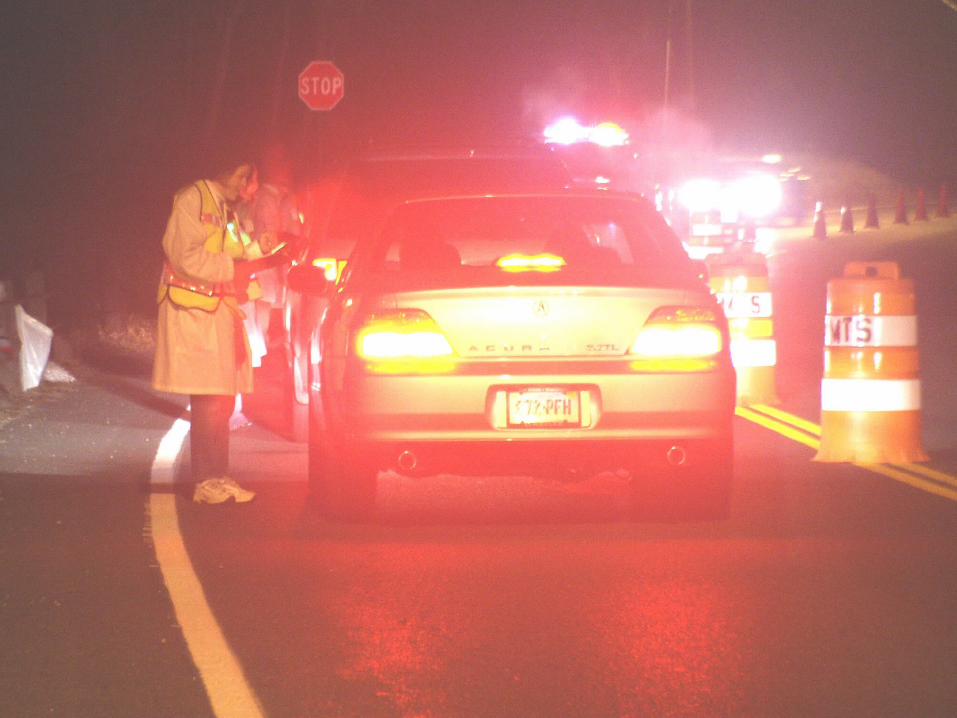
Evaluation-Sobriety CheckpointsEvaluation-Sobriety Checkpoints
A
B
C
D
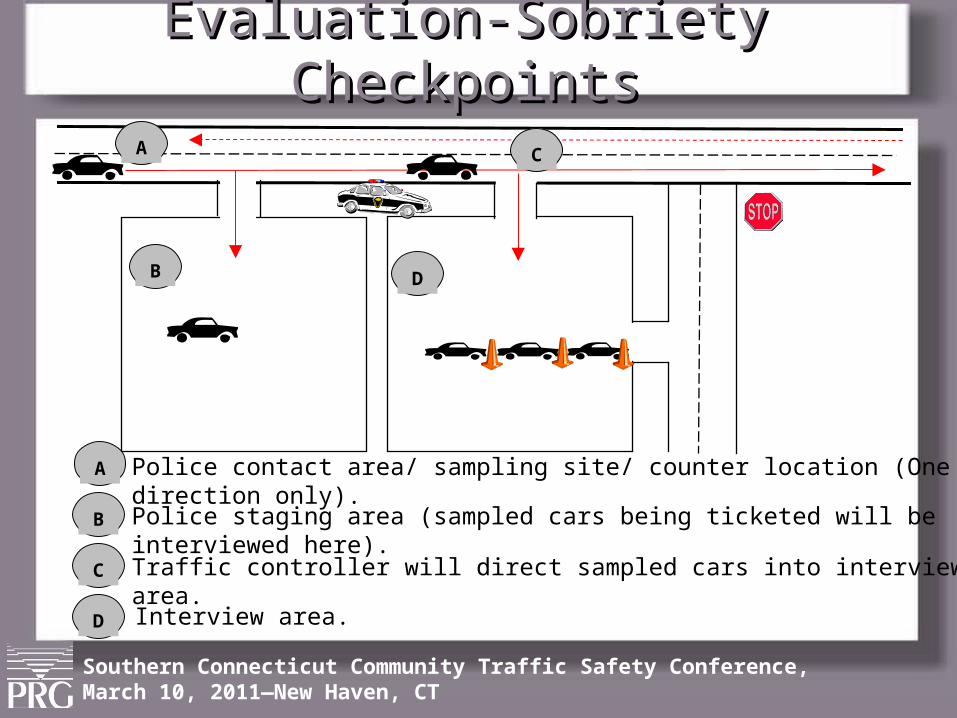
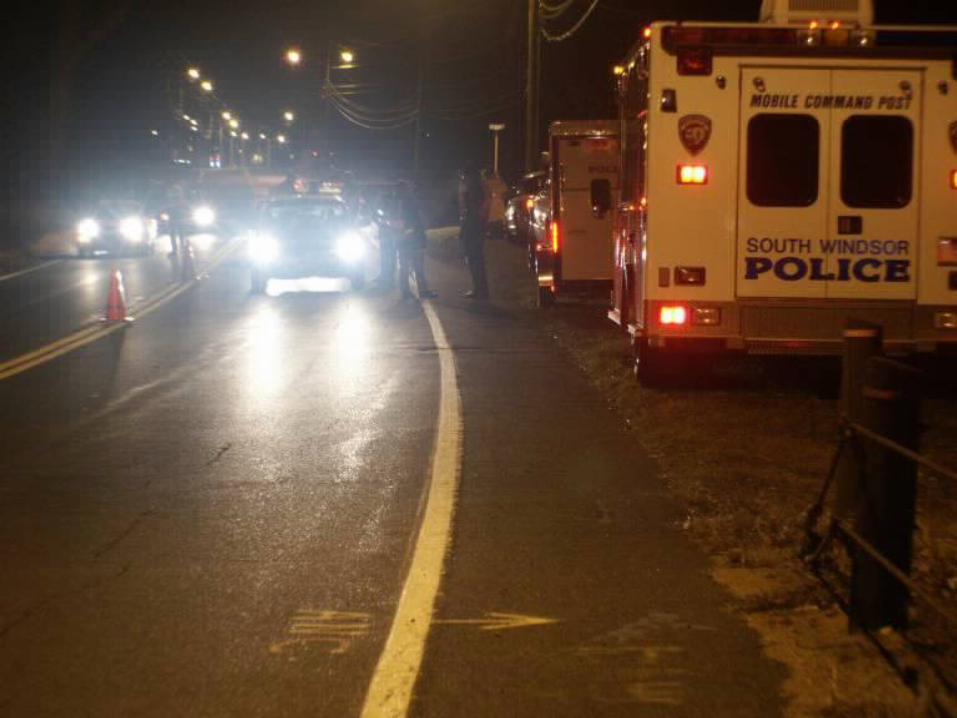
Police contact area/ sampling site/ counter location (One direction only).
Police staging area (sampled cars being ticketed will be interviewed here).
Traffic controller will direct sampled cars into interview area.
Interview area.
A
B D
C
Southern Connecticut Community Traffic Safety Conference, March 10, 2011—New Haven, CT
Southern Connecticut Community Traffic Safety Conference, March 10, 2011—New Haven, CT
Southern Connecticut Community Traffic Safety Conference, March 10, 2011—New Haven, CT
Southern Connecticut Community Traffic Safety Conference, March 10, 2011—New Haven, CT
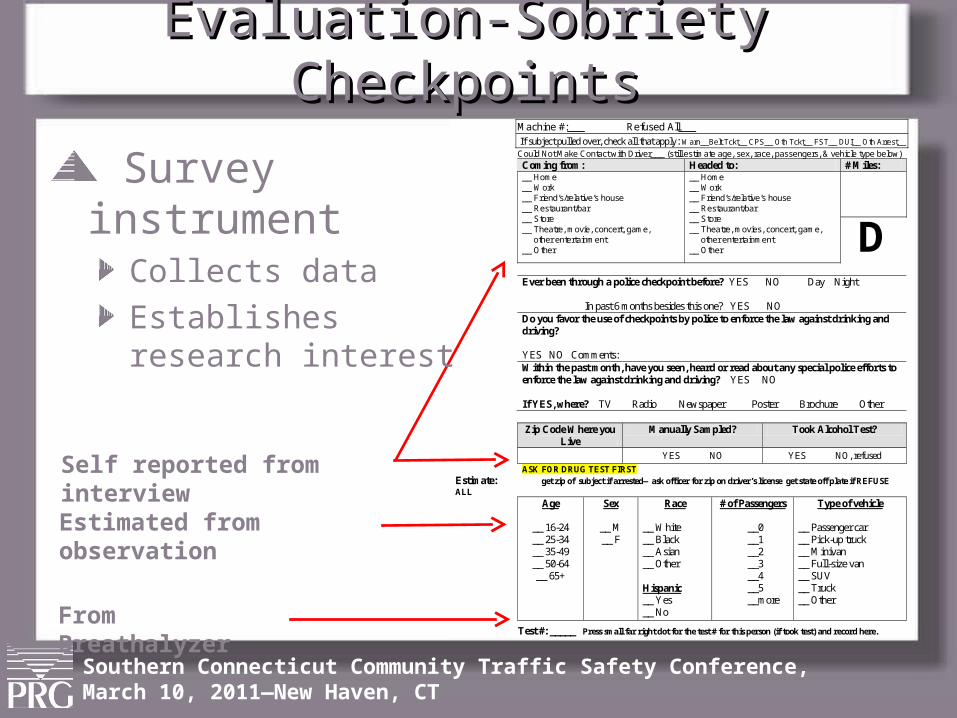
Machine #:___ Refused All___ If subject pulled over, check all that apply: Warn__Belt Tckt__ CPS__ Oth Tckt__ FST__ DUI__ Oth Arrest__
Could Not Make Contact with Driver___ (still estimate age, sex, race, passengers, & vehicle type below)
Coming from: Headed to: # Miles: __ Home
__ Work __ Friend’s/relative’s house __ Restaurant/bar __ Store __ Theatre, movie, concert, game, other entertainment __ Other
__ Home __ Work __ Friend’s/relative’s house __ Restaurant/bar __ Store __ Theatre, movies, concert, game, other entertainment __ Other D
Ever been through a police checkpoint before? YES NO Day Night
In past 6 months besides this one? YES NO Do you favor the use of checkpoints by police to enforce the law against drinking and driving? YES NO Comments: Within the past month, have you seen, heard or read about any special police efforts to enforce the law against drinking and driving? YES NO If YES, where? TV Radio Newspaper Poster Brochure Other
Zip Code Where you
Live Manually Sampled? Took Alcohol Test?
YES NO YES NO, refused
ASK FOR DRUG TEST FIRST Estimate: get zip of subject if arrested—ask officer for zip on driver’s license get state off plate if REFUSE ALL
Age
__ 16-24 __ 25-34 __ 35-49 __ 50-64 __ 65+
Sex
__ M __ F
Race
__ White __ Black __ Asian __ Other Hispanic __ Yes __ No
# of Passengers __0 __1 __2 __3 __4 __5 __more
Type of vehicle
__ Passenger car __ Pick-up truck __ Minivan __ Full-size van __ SUV __ Truck __ Other
Test #: _____ Press small far right dot for the test # for this person (if took test) and record here.
Self reported from interview
Estimated from observation
From Breathalyzer
Survey instrumentCollects data
Establishes research interest
Evaluation-Sobriety CheckpointsEvaluation-Sobriety Checkpoints
Southern Connecticut Community Traffic Safety Conference, March 10, 2011—New Haven, CT
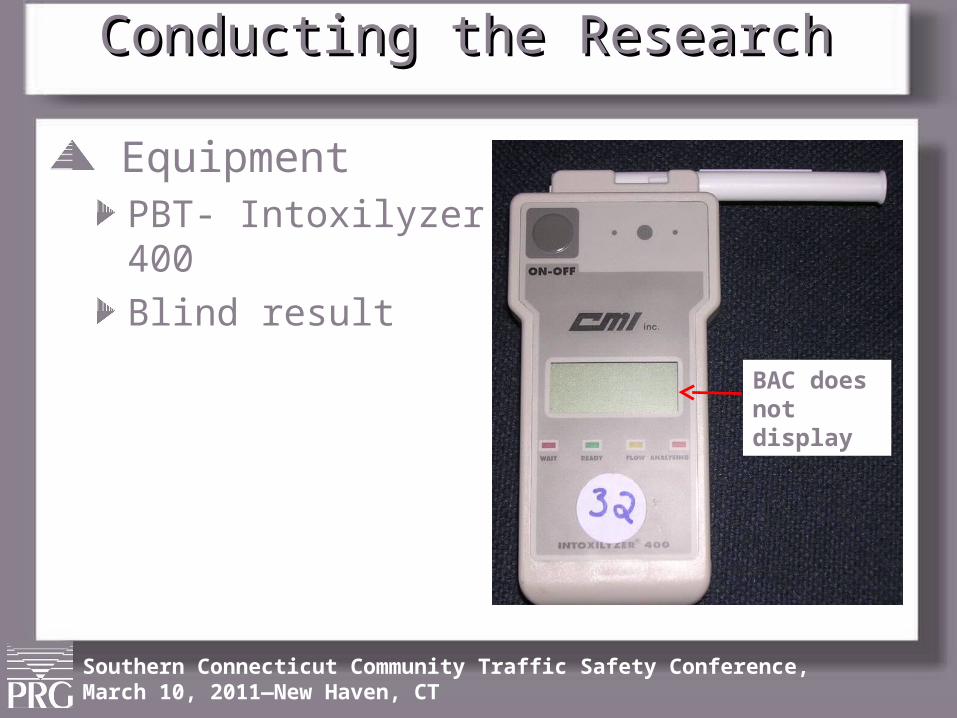
Conducting the ResearchConducting the Research
EquipmentPBT- Intoxilyzer 400
Blind result
BAC does not display
Southern Connecticut Community Traffic Safety Conference, March 10, 2011—New Haven, CT
Southern Connecticut Community Traffic Safety Conference, March 10, 2011—New Haven, CT
Southern Connecticut Community Traffic Safety Conference, March 10, 2011—New Haven, CT
Southern Connecticut Community Traffic Safety Conference, March 10, 2011—New Haven, CT
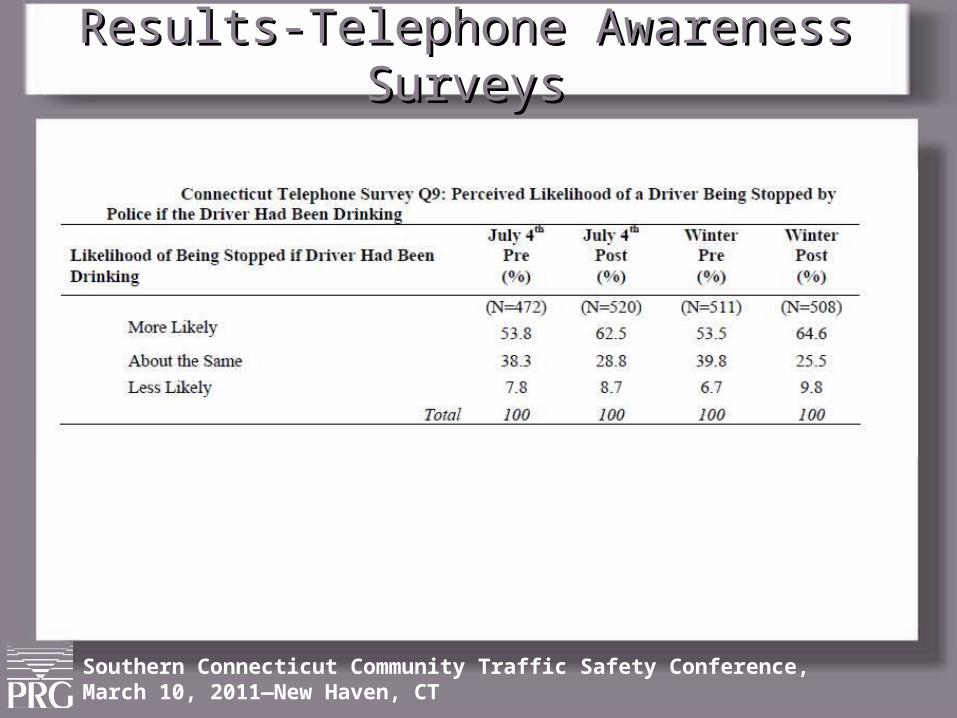
Results-Telephone Awareness SurveysResults-Telephone Awareness Surveys
Southern Connecticut Community Traffic Safety Conference, March 10, 2011—New Haven, CT
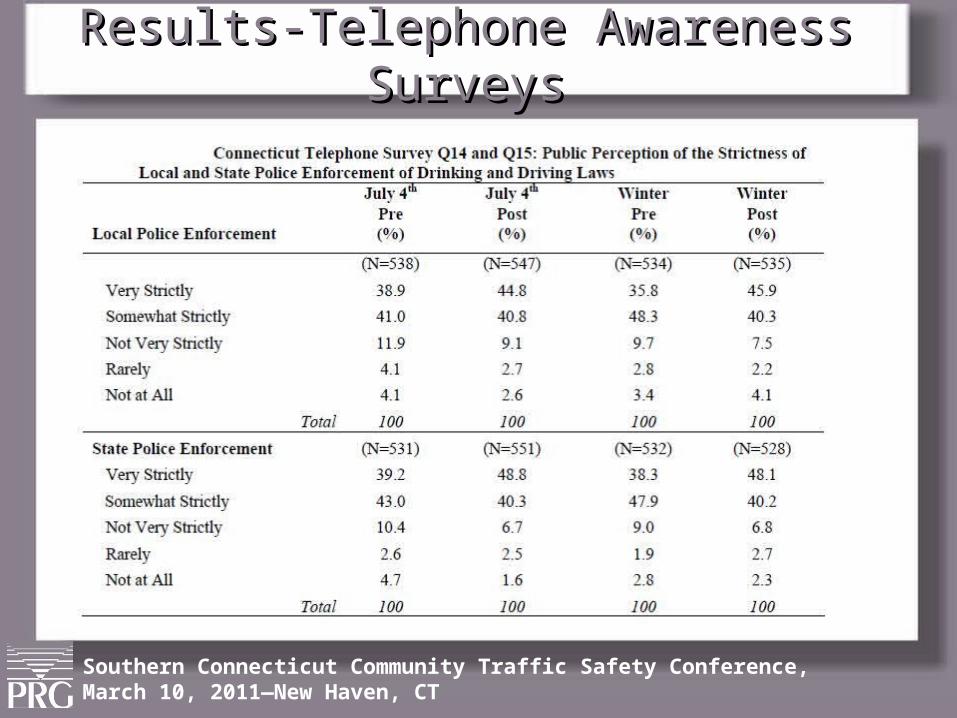
Results-Telephone Awareness SurveysResults-Telephone Awareness Surveys
Southern Connecticut Community Traffic Safety Conference, March 10, 2011—New Haven, CT
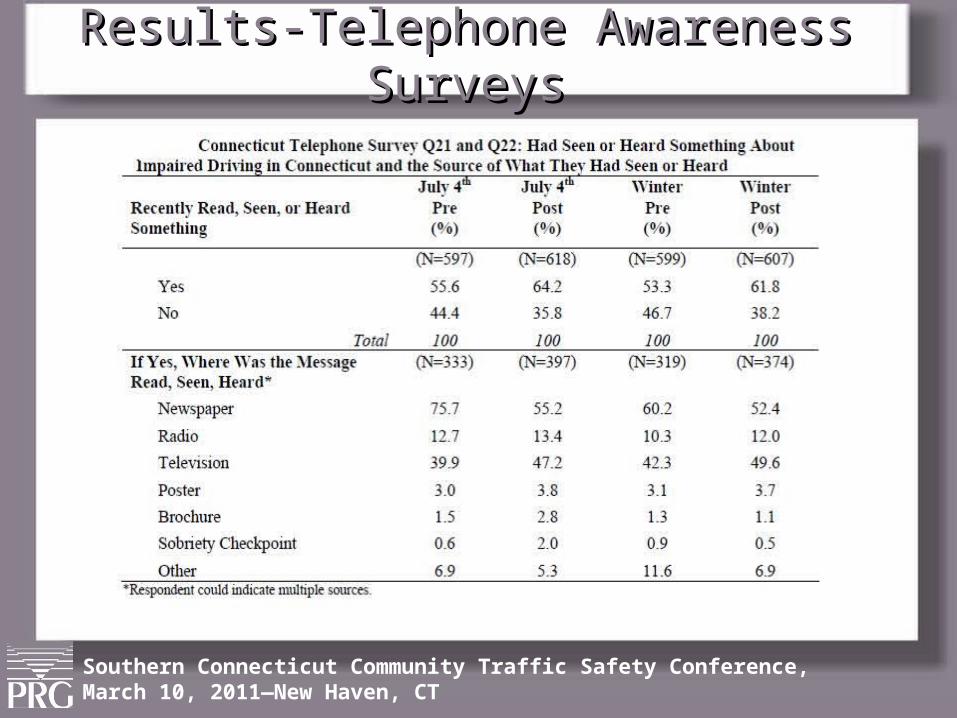
Results-Telephone Awareness SurveysResults-Telephone Awareness Surveys
Southern Connecticut Community Traffic Safety Conference, March 10, 2011—New Haven, CT
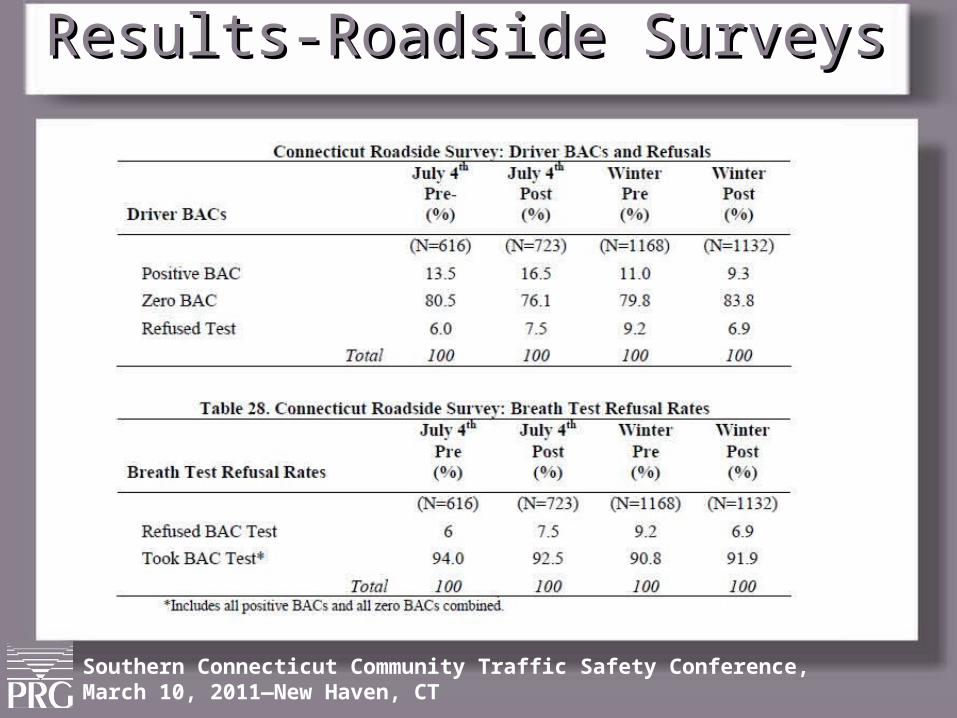
Results-Roadside SurveysResults-Roadside Surveys
Southern Connecticut Community Traffic Safety Conference, March 10, 2011—New Haven, CT
Results-DWI ArrestsResults-DWI Arrests
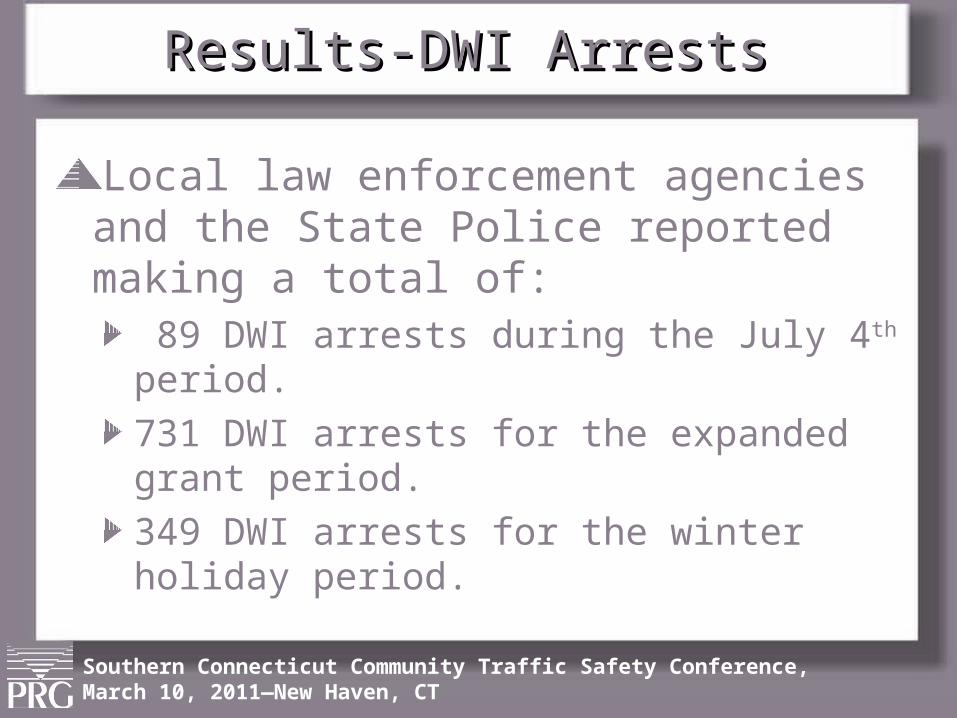
Local law enforcement agencies and the State Police reported making a total of:
89 DWI arrests during the July 4th period.
731 DWI arrests for the expanded grant period.
349 DWI arrests for the winter holiday period.
Southern Connecticut Community Traffic Safety Conference, March 10, 2011—New Haven, CT
Results-DWI ArrestsResults-DWI Arrests
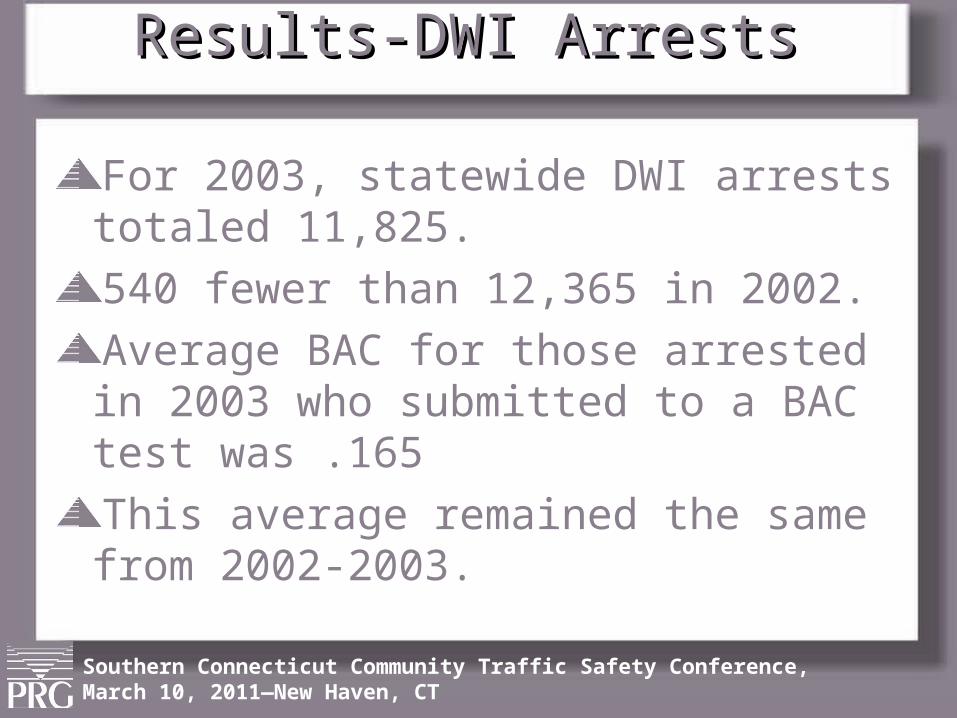
For 2003, statewide DWI arrests totaled 11,825.
540 fewer than 12,365 in 2002.
Average BAC for those arrested in 2003 who submitted to a BAC test was .165
This average remained the same from 2002-2003.
Southern Connecticut Community Traffic Safety Conference, March 10, 2011—New Haven, CT
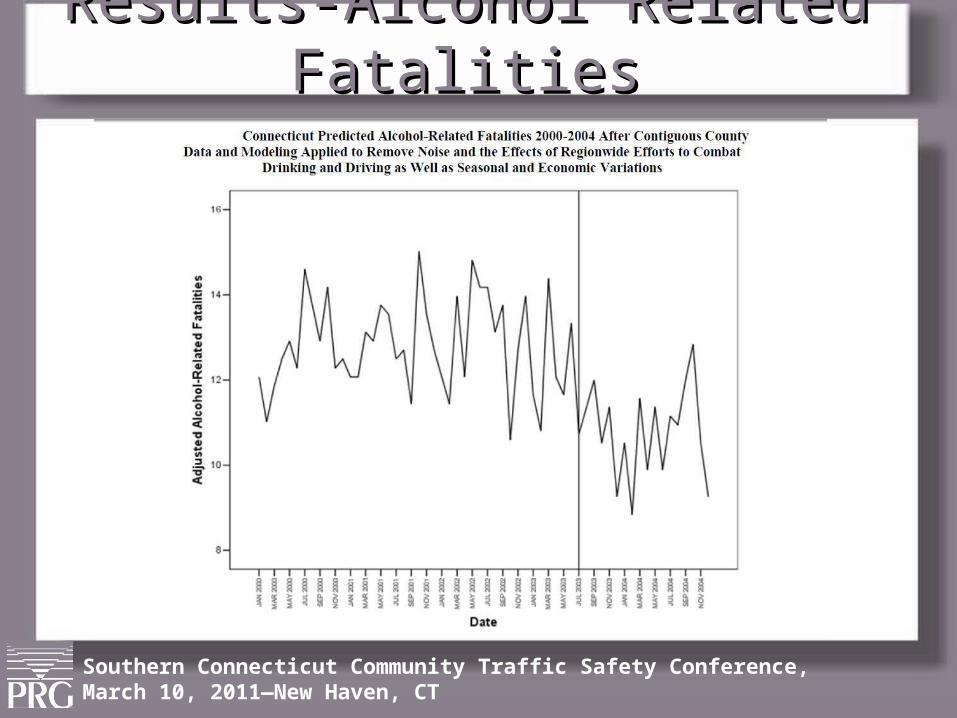
Results-Alcohol Related FatalitiesResults-Alcohol Related Fatalities
Southern Connecticut Community Traffic Safety Conference, March 10, 2011—New Haven, CT
Results-Alcohol Related FatalitiesResults-Alcohol Related Fatalities
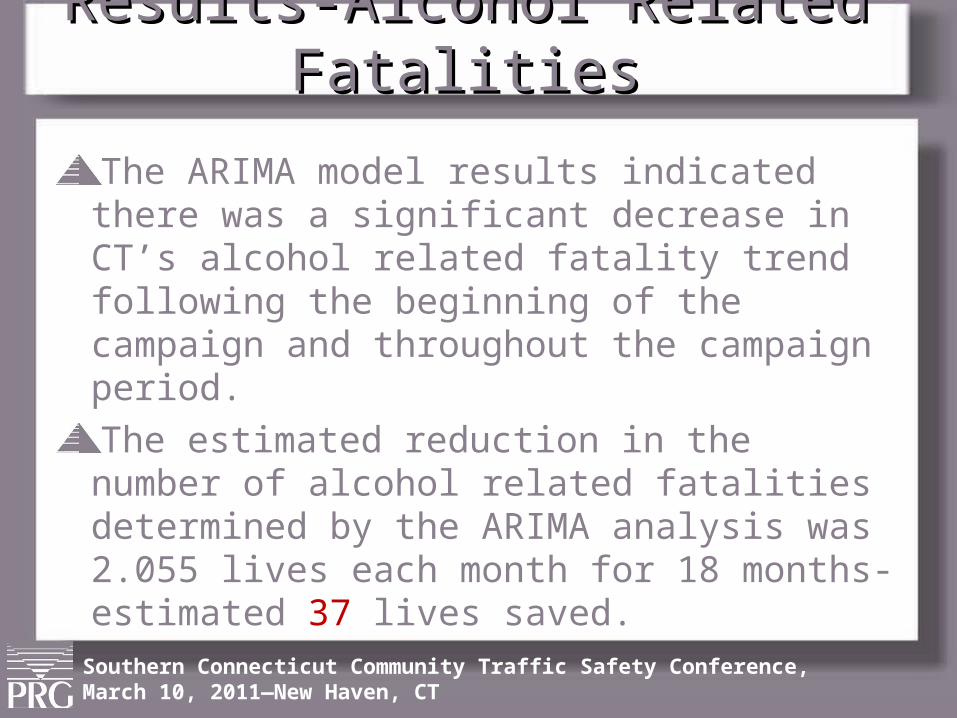
The ARIMA model results indicated there was a significant decrease in CT’s alcohol related fatality trend following the beginning of the campaign and throughout the campaign period.
The estimated reduction in the number of alcohol related fatalities determined by the ARIMA analysis was 2.055 lives each month for 18 months-estimated 37 lives saved.