southeast florida’s resilient water resources - … · adaptation to sea level rise and other...
TRANSCRIPT
Center for Urban and
Environmental Solutions at
Florida Atlantic University
11/15/2009
Southeast Florida’s Resilient Water Resources Adaptation to Sea Level Rise and Other Impacts of Climate Change
Miami
Fort Lauderdale
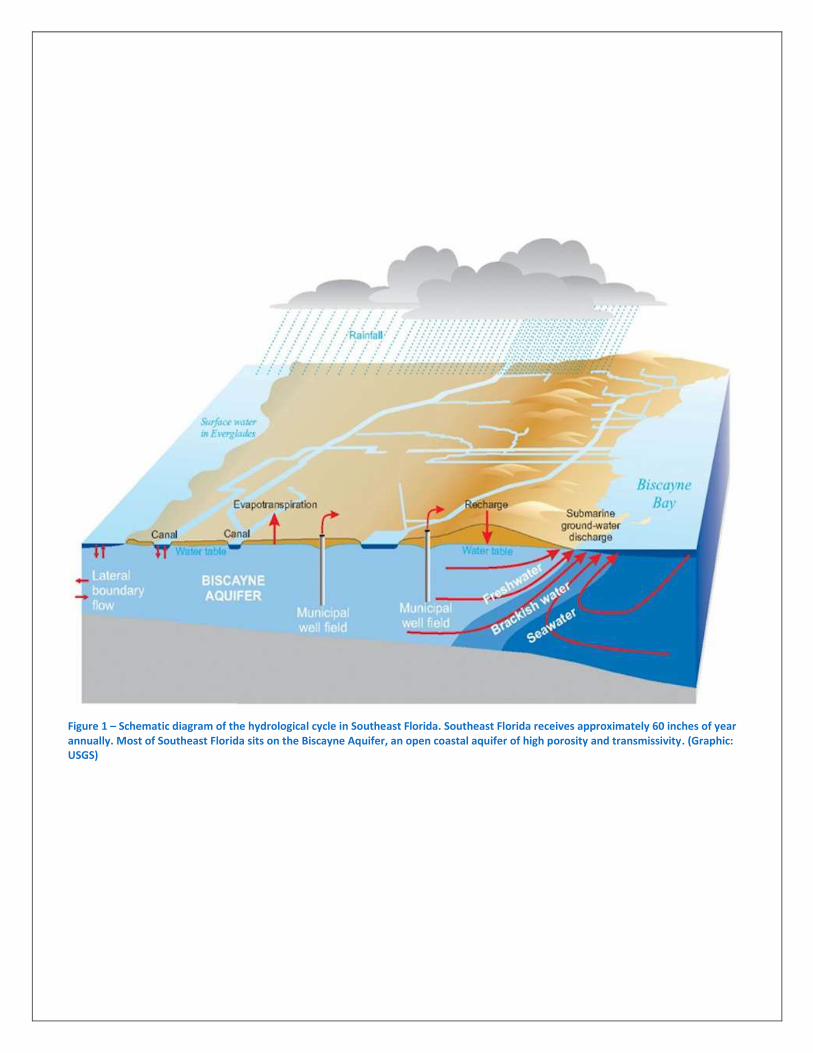
Figure 1 – Schematic diagram of the hydrological cycle in Southeast Florida. Southeast Florida receives approximately 60 inches of year annually. Most of Southeast Florida sits on the Biscayne Aquifer, an open coastal aquifer of high porosity and transmissivity. (Graphic: USGS)

Southeast Florida’s Resilient Water Resources Adaptation to Sea Level Rise and Other Impacts of Climate Change
Barry N. Heimlich, Lead Researcher
Frederick Bloetscher, Ph.D., P.E.
Daniel E. Meeroff, Ph.D., E.I.
James Murley, Principal Investigator
Case Study:
Frederick Bloetscher, Ph.D., P.E.
Daniel E. Meeroff, Ph.D., E.I.
Barry N. Heimlich, M.S.E.
A Research Project of:
Florida Atlantic University Center for Urban and Environmental Solutions
and
Department of Civil Engineering, Environmental, and Geomatics Engineering
Sponsored by:
National Commission on Energy Policy
BIPARTISAN POLICY CENTER
Table of Contents Table of Contents ......................................................................................................................................... iv
Acknowledgment ......................................................................................................................................... vi
About the Authors ...................................................................................................................................... vii
1 Executive Summary ............................................................................................................................... 1
1.1 Unforeseen Near-term Consequences ......................................................................................... 2
1.2 Major Conclusions ......................................................................................................................... 2
1.3 Major Recommendations: ............................................................................................................ 3
2 Introduction .......................................................................................................................................... 6
2.1 Project Goals ............................................................................................................................... 10
2.2 Methodology ............................................................................................................................... 10
3 Southeast Florida’s Topography, Geology, Climate, and Hydrology .................................................. 12
3.1 Topography ................................................................................................................................. 12
3.2 Geology ....................................................................................................................................... 13
3.3 Climate ........................................................................................................................................ 15
3.4 Hydrology .................................................................................................................................... 18
4 Climate Change Impacts on Southeast Florida’s Water Resources .................................................... 24
4.1 Sea Level Rise .............................................................................................................................. 26
4.2 Impacts of Sea Level Rise on Southeast Florida’s Water Resources ........................................... 33
4.3 Rainfall Patterns .......................................................................................................................... 46
4.4 Hurricanes and Tropical Storms .................................................................................................. 47
4.5 Elevated Temperatures ............................................................................................................... 48
4.6 Climate Change Impacts in Combination .................................................................................... 49
5 Toolbox for Protecting Water Resources ............................................................................................ 53
5.1 Water Conservation .................................................................................................................... 53
5.2 Protection of Existing Water Sources ......................................................................................... 55
5.3 Development of Alternative Water Sources ............................................................................... 59
5.4 Wastewater Reclaim and Reuse ................................................................................................. 68
5.5 Regionalization of Alternative Water Supplies and Reclamation Projects ................................. 70
5.6 Wastewater Alternatives ............................................................................................................ 71
5.7 Recharging the Everglades .......................................................................................................... 74
5.8 Reengineering Canal Systems, Control Structures, and Pumping .............................................. 76
6 Case Study– Lessons Learned from a Model Municipal Water Utility ................................................ 77
7 Adaptive Management as Applied to Water Resource Resiliency...................................................... 80
8 Adaptive Planning Framework ............................................................................................................ 84
8.1 Issues to Consider ....................................................................................................................... 84
8.2 Major Questions ......................................................................................................................... 86
8.3 Major Conclusions ....................................................................................................................... 86
9 Strategic Recommendations ............................................................................................................... 87
10 Policy Recommendations ................................................................................................................ 88
10.1 State and Local Government Policy Recommendations ............................................................. 88
10.2 Federal/Regional Government Policy Recommendations .......................................................... 89
11 Recommendations for Future Research ......................................................................................... 89
Appendix A - Case Study of a City Water Utility ......................................................................................... 91
Appendix B – Contributors and Reviewers ................................................................................................. 92
Appendix C – Method for Forecasting Sea Level Rise ................................................................................. 94
Appendix D – Estimated Capacity Loss of Coastal Structures ..................................................................... 97
Bibliography .............................................................................................................................................. 104
Related References ................................................................................................................................... 106
List of Tables ............................................................................................................................................. 109
List of Figures ............................................................................................................................................ 109
Acknowledgment The authors wish to acknowledge its sponsors, the National Commission for Energy Policy, an initiative
of the Bipartisan Policy Center, for funding this research project and to David Rosner and Sasha Mackler
for their guidance and encouragement.
The authors express their appreciation to Jim Murley, the project’s Principal Investigator and Director of
the Center for Urban and Environmental Solutions at Florida Atlantic University, for his vision, insight
and support.
This research relied heavily upon input from 35 experts who generously donated their time and
expertise in open consultations both in person and over the telephone. They are listed with their titles
and affiliations in Appendix B. Those who participated in consultations in person and over the
telephone include: John Abbott, P.G.; Bevin Beaudet, P.E.; Leonard Berry, Ph.D.; William Brant, P.E.;
Randolph Brown, M.B.A.; Albert Carbon, P.E.; Lynette Cardoch, Ph.D.; Michael Davis, Ph.D.; Patrick
Davis, P.E.; Shannon Estenoz; Susan Glickman; Rohit Goswami, Ph.D.; Howard Hanson, Ph.D.; Christian
Langevin, Ph.D.; David Major, Ph.D.; Sean McCrackine; Donald McNeill, Ph.D., P.G.; Victoria Morrow,
GISP; John Mulliken; Albert Perez, P.E.; Robert Renken; Winnie Said; Leo Schwartzberg, P.E., C.E.P.;
Georgio Tachiev, Ph.D.; Lenny Vialpando, P.E.; Hal Wanless, Ph.D.; and Michael Zygnerski, Ph.D. The
report was reviewed by: John Abbott, P.G.; George Cavros, Esq.; John Crouse, P.E.; Rohit Goswami,
Ph.D.; Dan Kimball; Elizabeth Plater-Zyberk, F.A.I.A., C.N.U.; Leo Schwartzberg, P.E., C.E.P.; and Henry
Sniezek, AICP. Special recognition goes to Jennifer Jurado, Ph.D.; Jayantha (Obey) Obeysekera, Ph.D.,
P.E., D.WRE; and Doug Yoder who significantly contributed through active dialogue and debate and by
reviewing multiple drafts of the report. Ellen Heimlich, Esq. proofread this report and gave moral
support to the lead author, both of which are greatly appreciated.
About the Authors The study was carried out by the Center for Urban and Environmental Studies (CUES) at Florida Atlantic University,
in partnership with FAU’s Department of Civil, Environmental, and Geomatics Engineering, under the sponsorship
of the National Commission on Energy Policy. The project team included:
Barry N. Heimlich, Lead Researcher of the project, is a Senior Fellow at CUES and co-author of Florida’s Resilient
Coasts: a State Policy Framework on Adaptation to Climate Change. He is a member of the Broward County
Climate Change Task Force, and was chair of the Ad Hoc Subcommittee on Global Warming that recommended its
formation to the county commission. He serves on the built environment adaptation, greenhouse gas reduction,
and science and technology committees of the Miami-Dade Climate Change Advisory Task Force and the Broward
County Climate Change Task Force. Since 2003, he has served on the Technical Advisory Committee of the Broward
County Water Advisory Board. Mr. Heimlich is a chemical engineer with a Master of Science in Engineering degree
from the University of Michigan. He formerly held executive, management and engineering positions in the
pharmaceutical and petroleum industries.
Frederick Bloetscher, Ph.D. spearheaded the Case Study of the Pompano Beach Water Utility in this study and
contributed his expertise to this research report. He is an assistant professor in FAU’s Department of Civil,
Environmental, and Geomatics Engineering. Dr. Bloetscher’s related research focuses on groundwater injection,
water quality, and public water and wastewater utility management and finance. He is author of three civil
engineering textbooks: Well Drilling, Groundwater Injection and Water Basics for Decision Makers – Local Officials’
Guide to Water & Wastewater Systems, published by the American Water Works Association.
Daniel E. Meeroff, Ph.D. is an associate professor in FAU’s Department of Civil, Environmental, and Geomatics
Engineering, and he is the Director of the Laboratories for Engineered Environmental Solutions (Lab.EES). Dr.
Meeroff’s related research focuses on water quality issues, pollution prevention, and water and wastewater
treatment process design and infrastructure management.
Jim Murley was, Principal Investigator of the project, is Director of the Center for Urban and Environmental
Studies. Previously he served as Florida Secretary of Community Affairs in the Cabinet of Governor Lawton Chiles
at Florida Atlantic University. Mr. Murley was appointed in 2008 by Florida Governor Charlie Crist to be chair of the
Florida Energy and Climate Commission. He is vice chair of the Miami-Dade Climate Change Advisory Task Force
and a member of the Broward County Climate Change Task Force, where he also chairs the Subcommittee on Built
Environment and Infrastructure Adaptation. He serves on the Water Resources Advisory Committee (WRAC), the
technical advisory body of the South Florida Water Management District. He was Principal Investigator of Florida’s
Resilient Coasts: a State Policy Framework on Adaptation to Climate Change.
The authors used their best efforts to acquire up-to-date information from many sources, public and private, peer-reviewed and not, and took
reasonable care to verify its validity. The findings, guidelines, opinions, conclusions and recommendations presented in this report are solely
those of the authors and not necessarily that of Florida Atlantic University, the National Commission on Energy Policy, or any of the experts
who contributed to this study except where cited. The accuracy or validity of information presented in this report cannot be guaranteed. It is
intended for use by local, state, and federal policy and decision makers, water managers, the scientific community, consulting engineers,
government agencies, the business and environmental communities, and interested parties as they deem appropriate and advisable.

Southeast Florida’s Resilient Water Resources Page 1
1 Executive Summary Anthropogenic activity is now widely accepted by the overwhelming majority of the world’s scientists as
the major cause of global climate change (IPCC, 2007); (Karl, etal, USCCSP, & NOAA, 2009);
(International Alliance of Research Universities, 2009). Climate change is driven primarily by the
accumulation in the atmosphere of greenhouse gases from the burning of fossil fuels, deforestation,
land use, and agricultural practices. Climate change has begun to exert significant effects in many
regions of the world and there is already enough energy stored in the oceans, atmosphere, and land for
adverse impacts to continue for centuries. In addition to an aggressive, concerted, global mitigation
program to reduce greenhouse gas emissions in order to limit the extent of climate change, forward-
thinking local adaptation is needed to cope with the unavoidable, potential, area-specific impacts of
climate change.
Southeast Florida, comprised of Miami-Dade, Broward, Palm Beach, and Monroe Counties with a
combined population of 5.5 million (US Census, 2008), was reported to be one of the ten most
vulnerable coastal metropolitan areas in the world, ranking 4th in terms of exposed population and 1st in
terms of the value of exposed assets by the Organisation for Economic Co-Operation and Development
(Nicholls & OECD, 2008). The region is especially susceptible to sea level rise and expected changes in
local weather patterns. Recent reports from the U.S. Global Climate Change Science Program (Karl, etal,
USCCSP, & NOAA, 2009) and the International Alliance of Research Universities (IARU, 2009) indicate
that global average sea level may rise by approximately 2 to 4 feet or more by 2100, an amount that will
have significant effects on coastal Southeast Florida.
Southeast Florida’s vulnerability derives from its geographic location, low elevation, porous geology,
unusual ground and surface water hydrology, subtropical weather patterns, and proximity to the
Atlantic Ocean and Gulf of Mexico. Its highly engineered water infrastructure and flood control systems
play an essential role in assuring that region’s habitability. Water managers must balance demand for
potable water and agricultural and landscape irrigation with ground and surface water management,
flood control, and the needs of the natural environment including the Everglades, coastal and
freshwater wetlands, and coastal marine habitat. Because the region’s hydrological system is very
interdependent and interactive, water supply cannot be considered separately from the other elements
of the region’s water resources, such as wastewater management, flood control, and stormwater
management, which are addressed comprehensively in this study.
How and to what extent sea level rise and other climate change impacts are likely to influence Southeast
Florida’s water supply, wastewater reuse alternatives, and ground and surface waters are subjects of
this research. Engineering options and management strategies for enhancing the resilience of the
region’s water systems are described. A Case Study of the City of Pompano Beach Water Utility
exemplifies how these tools can be applied to improve the resilience of a local water utility. An adaptive
planning framework is outlined for management of the region’s water resources as sea level continues
to rise and as drought and more severe storm events worsen with time.
Southeast Florida’s Resilient Water Resources Page 2
Until now, planning has implicitly assumed “stationarity” (Obeysekera, 2009), that environmental
conditions, such as climate patterns and sea level, will remain within historic ranges and that only
changes in human circumstances, such as population, technology, and the economy, need be
considered. This assumption is no longer valid. Unprecedented conditions in the future and uncertain
potential consequences demand that climate change be considered in all future planning and
policymaking concerning water resources, other infrastructure, and land use. Furthermore, current
practices, policies, and regulations should be critically reviewed and revised in consideration of climate
change. New ideas and new approaches that may
possibly conflict with current thinking will be needed if
the forecasted ranges of sea level rise and weather
extremes are realized.
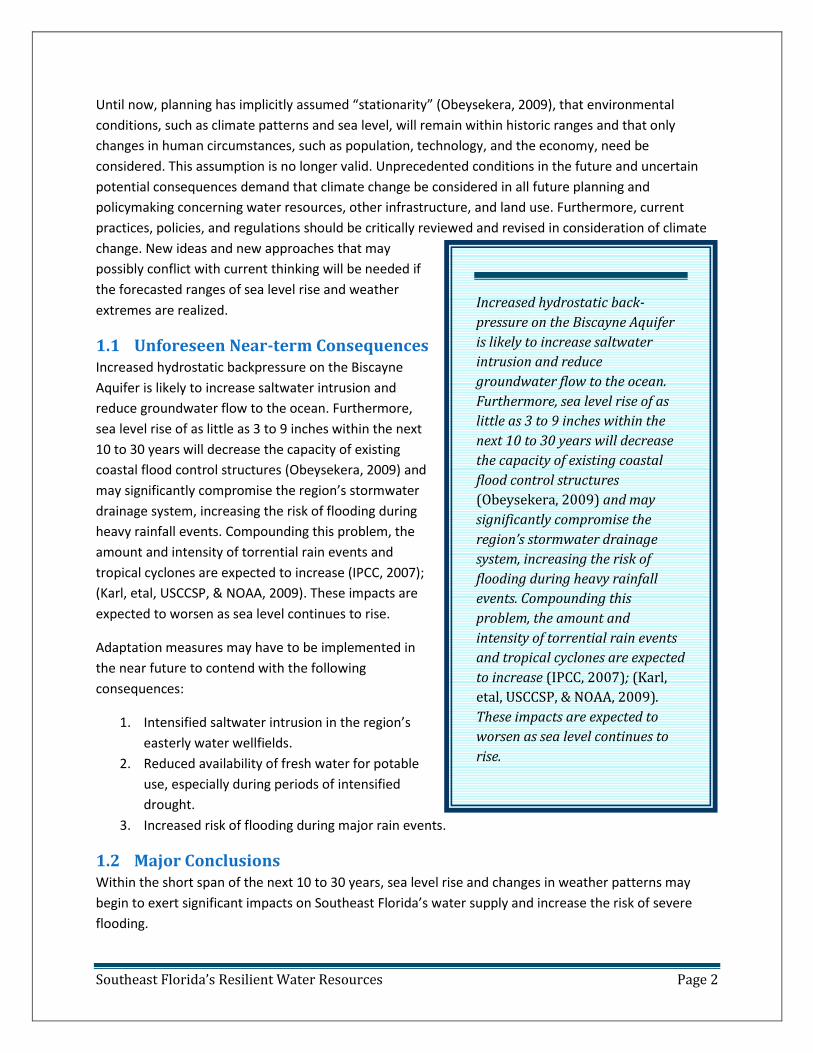
1.1 Unforeseen Near-term Consequences Increased hydrostatic backpressure on the Biscayne
Aquifer is likely to increase saltwater intrusion and
reduce groundwater flow to the ocean. Furthermore,
sea level rise of as little as 3 to 9 inches within the next
10 to 30 years will decrease the capacity of existing
coastal flood control structures (Obeysekera, 2009) and
may significantly compromise the region’s stormwater
drainage system, increasing the risk of flooding during
heavy rainfall events. Compounding this problem, the
amount and intensity of torrential rain events and
tropical cyclones are expected to increase (IPCC, 2007);
(Karl, etal, USCCSP, & NOAA, 2009). These impacts are
expected to worsen as sea level continues to rise.
Adaptation measures may have to be implemented in
the near future to contend with the following
consequences:
1. Intensified saltwater intrusion in the region’s
easterly water wellfields.
2. Reduced availability of fresh water for potable
use, especially during periods of intensified
drought.
3. Increased risk of flooding during major rain events.
1.2 Major Conclusions Within the short span of the next 10 to 30 years, sea level rise and changes in weather patterns may
begin to exert significant impacts on Southeast Florida’s water supply and increase the risk of severe
flooding.
Increased hydrostatic back-
pressure on the Biscayne Aquifer
is likely to increase saltwater
intrusion and reduce
groundwater flow to the ocean.
Furthermore, sea level rise of as
little as 3 to 9 inches within the
next 10 to 30 years will decrease
the capacity of existing coastal
flood control structures
(Obeysekera, 2009) and may
significantly compromise the
region’s stormwater drainage
system, increasing the risk of
flooding during heavy rainfall
events. Compounding this
problem, the amount and
intensity of torrential rain events
and tropical cyclones are expected
to increase (IPCC, 2007); (Karl,
etal, USCCSP, & NOAA, 2009).
These impacts are expected to
worsen as sea level continues to
rise.
Southeast Florida’s Resilient Water Resources Page 3
1. Sea level rise of as little as 3 to 6 inches is likely to intensify saltwater intrusion, and it could reduce
the amount of fresh water available for potable use.
2. The likelihood of recurring drought during the dry winter-spring season may cause water shortages
and exacerbate saltwater intrusion.
3. More intense rainfall events and wetter hurricanes may significantly increase the risk of flooding.
4. Sea level rise of as little as 3 to 6 inches may begin to compromise the effectiveness of the area’s
coastal flood control structures reducing their capacity by as much as 20 to 40% by 2030. By about
2040, 6 to 9 inches of sea level rise may reduce their capacity by 65 to 70%. Most of these early
impacts will be felt in southern Miami-Dade County where water tables are low due to the area’s
extremely low elevations.
5. Sea level rise would increase the damage potential of hurricanes due to storm surge. Storm surge
could penetrate further inland and cause temporary saltwater contamination of potable water
supplies.
6. As sea level rises throughout the 21st Century, the southernmost Everglades are likely to be
progressively converted into a saltwater marsh. This would change its ecology and could eventually
threaten to contaminate the southern part of the Biscayne Aquifer with brackish water.
7. These risks are likely to worsen as sea level continues to rise throughout the 21st Century and
beyond.
1.3 Major Recommendations:
1. Climate change should immediately be formally incorporated into all planning and policymaking
concerning the region’s water resources.
2. Current water resource management plans and policies should be reevaluated within the context of
climate change and revised as necessary.
3. Workshops and conferences should be convened at the earliest opportunity to bring scientists,
engineers, water managers and decision makers together to exchange knowledge about the impacts
of climate change on the region’s water resources and to begin developing a comprehensive list of
policy and planning recommendations for enhancing the resilience of Southeast Florida’s water
resources.
4. Further study including integrated hydrological modeling should be undertaken at the earliest
opportunity to confirm and build upon the conclusions of this report.
5. Evaluation of impacts of sea level rise and other climate change impacts on saltwater intrusion and
development of plans for protecting the Biscayne Aquifer should be accelerated.
6. Comprehensive engineering evaluations should be undertaken to assess the vulnerability and
enhance the resilience of Southeast Florida’s flood control structures and stormwater drainage
systems to sea level rise and more intense rainfall events.
Southeast Florida’s Resilient Water Resources Page 4
7. As much fresh water should be retained in the system as practical without increasing the risk of
flooding. This calls for continued development and implementation of water conservation,
alternative water supply, wastewater recovery and reuse, and stormwater storage programs.
8. State and local governments, water resource agencies, and water utilities should develop policies
and comprehensive plans that set short, intermediate, and long range goals and establish adaptive
management implementation strategies for water resources under their jurisdiction that address
the likely impacts of climate change and its operational, economic, and environmental implications.
9. State and local water resource agencies and water utilities in cooperation with the state university
system should establish a comprehensive research
program to develop scientific and technical knowledge
regarding the impacts of climate change and
adaptation technologies for the region’s water
resources.
10. Alternatives analysis and feasibility studies of large
scale regional advanced water treatment facilities
should be undertaken to establish the applicability of:
a. Advanced treatment of stormwater or
wastewater for aquifer recharge and/or
Everglades hydration.
b. Production of potable water from brackish
water, treated wastewater, or stormwater.
c. Potential for realizing economies of scale.
Adaptation measures are likely to incur high costs that will
have to be justified, not on the basis of economic return,
but rather on the basis of loss avoidance in comparison
with projected costs of failing to act. Eventually, withdrawal
from vulnerable locations may have to be considered if
local conditions preclude feasible and cost-effective
adaptation. It will take innovation and leadership by
policymakers and water managers to choose between
difficult alternatives and implement them in a timely and
cost-effective manner.
This report is intended for the South Florida Water
Management District (SFWMD); the U.S. Army Corps of Engineers (USACE); the Florida Energy and
Climate Commission (FECC); Florida Department of Environmental Protection (FDEP); The South Florida
Everglades Restoration Task Force (SFERTF); the water resources task forces, water advisory boards, and
climate change task forces of Miami-Dade, Broward, Palm Beach, and Monroe Counties; state, regional
and local policymakers, and planners; water resource managers, water utility and drainage district
managers; and other interested parties.
Adaptation measures are likely
to incur high costs that will
have to be justified on the basis
of loss avoidance in
comparison with estimates of
the cost of inaction rather than
on the basis of economic
return. Eventually, withdrawal
from vulnerable locations may
become necessary if local
circumstances preclude
feasible and cost-effective
adaptation. It will take
innovation and leadership by
policymakers and water
managers to choose between
difficult alternatives and apply
them in a timely and cost
effective manner.
Southeast Florida’s Resilient Water Resources Page 5
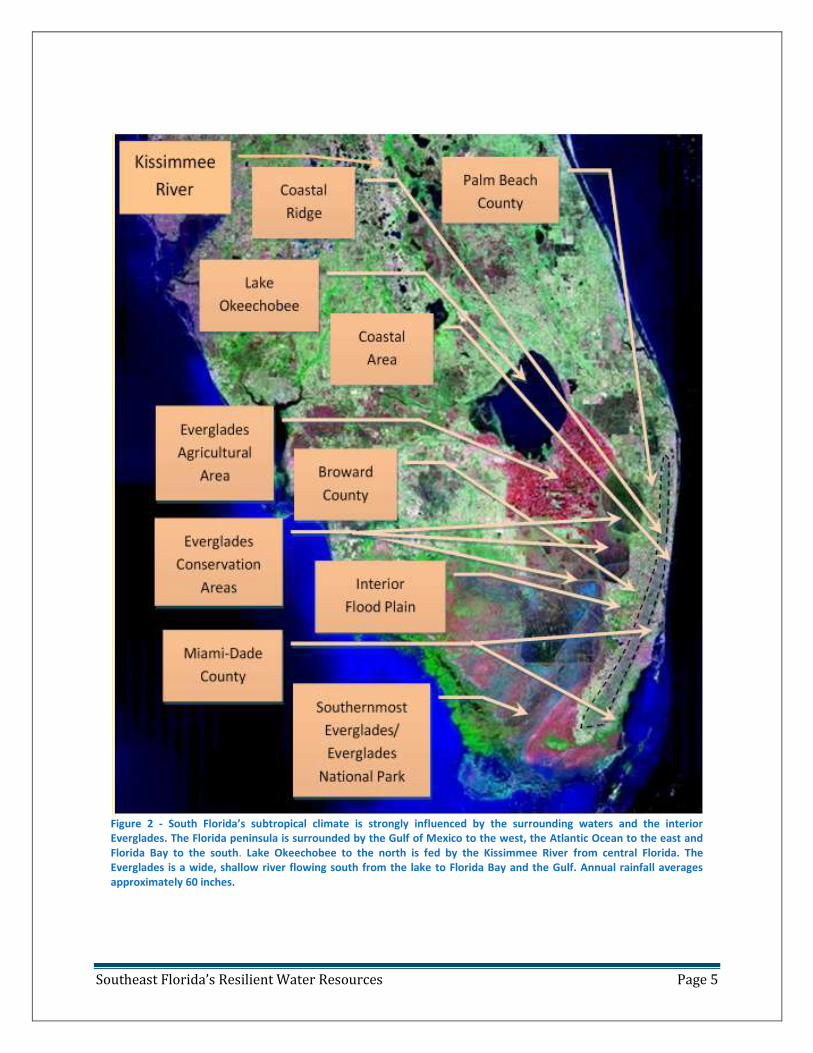
Figure 2 - South Florida’s subtropical climate is strongly influenced by the surrounding waters and the interior Everglades. The Florida peninsula is surrounded by the Gulf of Mexico to the west, the Atlantic Ocean to the east and Florida Bay to the south. Lake Okeechobee to the north is fed by the Kissimmee River from central Florida. The Everglades is a wide, shallow river flowing south from the lake to Florida Bay and the Gulf. Annual rainfall averages approximately 60 inches.
Southeast Florida’s Resilient Water Resources Page 6
2 Introduction Southeast Florida is recognized as one of the most vulnerable regions of the world to the impacts of
global climate change. Of critical concern is the potential threat that sea level rise and other impacts of
climate change could have on Southeast Florida’s water supply. This study is among the first to examine
Southeast Florida’s water infrastructure through the lens of climate change. It is hoped that it will
heighten awareness to this critical issue, bring climate change to the forefront of water resource
planning and policymaking, and stimulate new policy and planning for improving the resilience of
Southeast Florida’s water infrastructure to climate change.
This is the second of a series of studies concerning Florida’s resilience to climate change conducted by
the Center for Urban and Environmental Solutions (CUES) at Florida Atlantic University (FAU) sponsored
by the National Commission on Energy Policy (NCEP). The first report published in 2008, entitled
Florida’s Resilient Coasts – a State Policy Framework for Adaptation to Climate Change (Murley,
Heimlich, Bollman, 2008), presented a policy framework for improving the resilience of Florida’s coasts
statewide that was accepted as the foundation for recommendations on adaptation policy made by the
Florida Governor’s Action Team on Energy and Climate Change. (Florida Energy and Climate Change
Action Plan, Chapter 8, 2008). The vulnerability of Southeast Florida’s water supply was identified in that
report.
There is strong evidence that global climate change is already impacting the world’s water resources
(Dragoni, 1998); (Buffoni, 2002); (Labat, 2004); (IPCC, 2007); (Huntington, 2006); (Dragoni & Sukhija,
2008). A critical concern for water managers is that climate change is altering the hydrologic cycle in
ways that might not be readily predicted. In 2008, a coalition of eight leading national water
management associations called upon the U.S. Congress to recognize the severe impacts of global
climate change on water resources in the United States (AWWA, et al, 2008). The water organizations
stressed that:
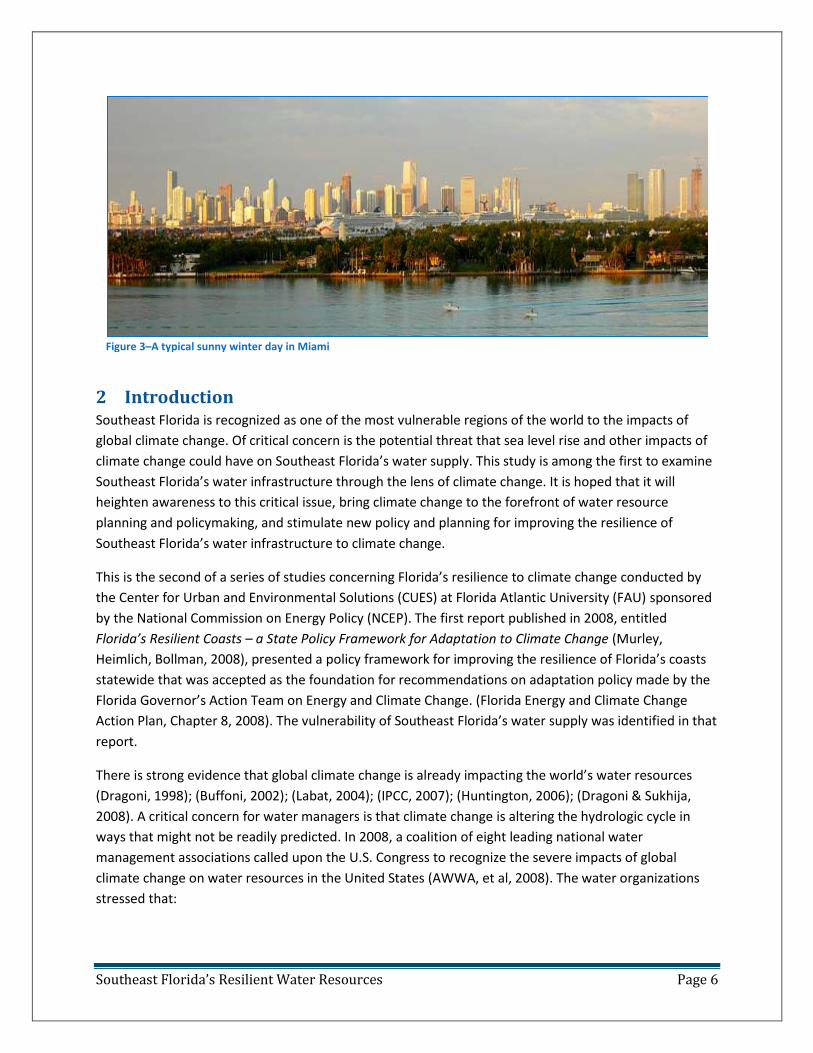
Figure 3–A typical sunny winter day in Miami
Southeast Florida’s Resilient Water Resources Page 7
“Many of the most critical impacts of global
climate change will manifest themselves
through the hydrologic system, and there is
already strong evidence that climate change is
having an impact on the world’s water
resources. … Because the exact effects of
climate change on water resources are
uncertain and will vary by region, the drinking
water, wastewater, flood management, and
stormwater utilities responsible for managing
water resources for local communities face
daunting challenges.”
There is nowhere that these statements are more
applicable than in Southeast Florida, the location of
the Miami-Fort Lauderdale-West Palm Beach
Metropolitan Statistical Area with a growing
population of approximately 5.5 million (US Census,
2008). Its water supply is jeopardized by the
anticipated effects of climate-change-induced sea level
rise on the area’s surface and ground waters, increased
flooding due to hurricane storm surge and torrential
rains, and prolonged periods of drought.
The impacts of climate change that are most likely to
affect water supplies in Southeast Florida are: 1)
uncertainty in the amount and timing of precipitation
and 2) sea level rise induced effects on the area’s
surface and ground waters including saltwater
“Many of the most critical
impacts of global climate change
will manifest themselves through
the hydrologic system, and there
is already strong evidence that
climate change is having an
impact on the world’s water
resources. … Because the exact
effects of climate change on
water resources are uncertain
and will vary by region, the
drinking water, wastewater,
flood management, and
stormwater utilities responsible
for managing water resources
for local communities face
daunting challenges. …”
Joint statement of eight leading
national water management
associations, May 20, 2008
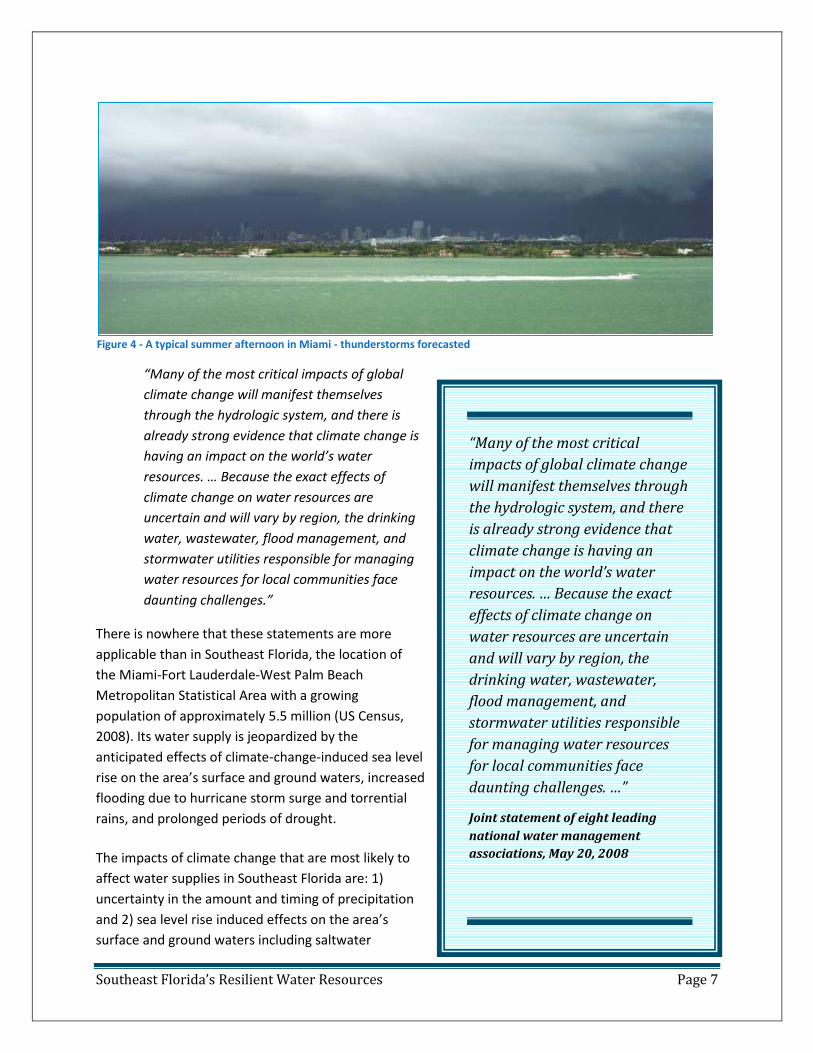
Figure 4 - A typical summer afternoon in Miami - thunderstorms forecasted

Southeast Florida’s Resilient Water Resources Page 8
intrusion and changes in flows and levels. Many regions, including Florida, will see wetter wet seasons
and drier dry seasons (Karl, etal, USCCSP, & NOAA,
2009).
The Intergovernmental Panel on Climate Change 4th
Assessment Report (IPCC, 2007) reported that
“Warming of the climate system is unequivocal, as is
now evident from observations of increases in global
average air and ocean temperatures, widespread
melting of snow and ice, rising global average sea level,
and acidification of the oceans.”
The report indicates that it is “very likely,” meaning
with greater than 90% certainty; these changes in
world-wide climate are due to rapidly increasing
atmospheric greenhouse gas concentrations from the
combustion of fossil fuels, deforestation, agriculture,
and other anthropogenic activities. Average global
temperatures could rise by several degrees Centigrade
and the warming trend could last for centuries.
The United Nations Framework Convention on Climate
Change (UNFCCC) was held in Copenhagen in
December 2009 to develop a global response to the
threat of climate change and as a successor to the
Kyoto Agreement, which is scheduled to expire in 2012.
In anticipation of this convention, the International
Alliance of Research Universities held an international
scientific congress on climate change in Copenhagen
from March 10-12, 2009. In its report issued in June
2009 (IARU, 2009), it stated,
“The scientific evidence today overwhelmingly indicates
that allowing the emission of greenhouse gases from
human activities to continue unchecked constitutes a
significant threat to the well-being and continued
development of contemporary society.”
The report also stated in its Key Message 1 - Climatic
Trends:
Key Message 1 - Climatic Trends:
“Recent observations show that
greenhouse gas emissions and
many aspects of the climate are
changing near the upper
boundary of the IPCC range of
projections. Many key climate
indicators are already moving
beyond the patterns of natural
variability within which
contemporary society and
economy have developed and
thrived. These indicators include
global mean surface
temperature, sea-level rise,
global ocean temperature,
Arctic sea ice extent, ocean
acidification, and extreme
climatic events. With unabated
emissions, many trends in
climate will likely accelerate,
leading to an increasing risk of
abrupt or irreversible climatic
shifts.”
International Alliance of
Research Universities
Synthesis Report, CLIMATE CHANGE:
Global Risks, Challenges & Decisions
Copenhagen, 10-12 March, 2009
Southeast Florida’s Resilient Water Resources Page 9
…it may be difficult to
determine whether what has
been considered a 100-year
natural disaster has become
a 25-year or 10-year event as
a result of gradual changes
in underlying climatic
conditions.
In the face of increased risk,
precautionary adaptation
modifications to the flood
control system and other
infrastructure may be
justified in order to reduce
the amount of property
damage and lives lost in such
catastrophic events.
“Recent observations show that greenhouse gas emissions and many aspects of the climate are
changing near the upper boundary of the IPCC range of projections. Many key climate indicators
are already moving beyond the patterns of natural variability within which contemporary society
and economy have developed and thrived. These indicators include global mean surface
temperature, sea-level rise, global ocean temperature, Arctic sea ice extent, ocean acidification,
and extreme climatic events. With unabated emissions, many trends in climate will likely
accelerate, leading to an increasing risk of abrupt or irreversible climatic shifts.”
Many of the effects of climate change in Florida are occurring gradually and are expected to worsen
throughout the 21st Century. They are masked by the normal extremes of weather events and are
difficult to differentiate from natural cycles. Long periods of time can lapse before underlying trends
become evident, especially when incremental changes do not have an early detectable effect on
everyday circumstances. Also, people tend to be reactive rather than proactive, especially when
considering the possibility of uncertain future disasters. People are likely to at first deny or make
excuses not to prepare adequately or are just slow to act. On the other hand, when disaster does strike,
such as in the case of a major hurricane or flood, people are quick to react in order to recover and
rebuild and prepare better for a possible recurrence, assuming that everything will return to normal and
life can resume as before – i.e. the assumption of stationarity. Furthermore, it may be difficult to
determine whether what has been considered a 100-year natural disaster has become a 25-year or 10-
year event as a result of gradual changes in underlying climatic conditions. For example, if in the next 15
to 25 years, a 0.5oF increase in sea surface temperatures coupled with a 6 inch rise in sea level takes
place, it could result in a multifold increase in the probability of a Category 4 or 5 hurricane that could
cause severe wind damage, storm surge that penetrates for miles inland, flooding that may overwhelm
the region’s stormwater drainage systems, temporary saltwater contamination of the water supply, and
weeks-long power disruptions. Predictions are needed to ascertain the effects of climate change on the
likelihood of such events. If increased risk can be established, it may be possible to justify precautionary
adaptation modifications to the flood control system and other infrastructure in order to reduce the
severity of property damage and personal injury in such a catastrophic event.
The region’s geographic location, extremely low topography, porous geology, ground and surface water
hydrology, subtropical weather patterns, and proximity to the ocean comprise an extremely complex
and interactive system. Water managers must balance demands for potable water and agricultural and
landscape irrigation with ground and surface water management, flood control, wastewater
management, and the needs of the natural environment including the Everglades, the coastal and
freshwater wetlands, and the coastal marine habitat, all of which are intricately linked through the
hydrological cycle. The region’s water supply is highly interdependent and interactive with the other
elements of the region’s water resources. A narrow focus on water supply in isolation would not suffice
because the increased threat of flooding resulting from sea level rise, more intense rain events and
hurricanes will have direct and indirect impacts on the water supply. Therefore, this report considers
water supply resilience within the context of the entire hydrological system including the impacts of
climate change on ground and surface waters and the reuse and discharge of treated wastewater.
Southeast Florida’s Resilient Water Resources Page 10
2.1 Project Goals This purpose of this study was to determine the likely effects of climate change on Southeast Florida’s
water resources and to identify engineering and management options for improving their resilience. The
study set out to accomplish this by undertaking the following:
1. Gather the best available scientific and technical knowledge relating to the impacts of climate
change on Southeast Florida’s water supply and communicate it in language that can be
understood by non-technical as well as technical people engaged in policymaking and
management of the region’s water resource.
2. Identify, discuss and prioritize relevant areas of concern, challenges, opportunities, solutions,
policies, conclusions and recommendations through consultation with water experts,
policymakers, and stakeholders.
3. Undertake a case study of a representative coastal city water utility in Southeast Florida in
cooperation with its management and staff to gain insight into the issues facing local utilities
and to exemplify application of the tools presented in this study. Determine the vulnerabilities
of the utility to predicted climate change impacts and make specific recommendations for
improving its resilience.
4. Propose an adaptation planning framework for protecting Southeast Florida’s water supply from
the unavoidable consequences of global climate change.
2.2 Methodology The project goals were met through the use of three modes of research: 1) consultation with scientists
and experts in fields related to water management, 2) literature research, and 3) the water utility case
study. Scientists, water engineers, water managers, planners, and environmentalists from universities,
engineering consulting firms, the United States Geological Survey (USGS), the South Florida Water
Management District, local governmental agencies, water utilities, and drainage districts were consulted
to gather information and their opinions, concerns, questions, recommendations, and collective wisdom
on climate change and the water supply. These discussions were confidential, open-ended, and without
preconceptions in order to discover both expected and unexpected issues and concerns. The specific
content of disclosures made by each expert is not revealed in this report except for citations of selected
published literature, internet postings, and public presentations. The collective disclosures and opinions
of the experts and reviewers of the draft report were used in deriving the authors’ conclusions,
recommendations, and opinions, which are those of the authors and do not necessarily reflect the
opinions of participating experts or reviewers. Experts and reviewers are listed in Appendix B.
Southeast Florida’s Resilient Water Resources Page 11
Consultations with experts were supplemented with literature research. The literature search focused
on 1) applicable science and technology, 2) potential impacts of climate change on Southeast Florida
water supply, 3) applicable water laws and policies, and 4) approaches to water supply resilience taken
in other regions. Although the literature search was extensive, it should not be regarded as exhaustive.
A Case Study of the City of Pompano Beach Water Treatment Utility was conducted by Frederick
Bloetscher, Ph.D., P.E., and Daniel Meeroff, Ph.D., E.I. both members of the faculty of FAU’s Department
of Civil, Environmental, and Geomatics Engineering. This utility was chosen for several reasons. It
employs state-of-the-art water treatment, alternative water supply, and water reuse technologies. It is
located near the coast and has a skilled and experienced technical management team whose input
contributed materially to the study. The utility’s eastern wellfields are vulnerable to saltwater intrusion.
It is undertaking studies of advanced methods including wastewater reuse and recharge and
hydrological barriers to protect its raw water supply. USGS and the Broward County Environmental
Protection and Growth Management Department have developed a hydrological model of the North
Broward area, which the utility is using to
guide its alternative water supply projects. The
utility’s management and others provided
input and ideas and reviewed the results of
the Case Study.
The Case Study set out to: 1) determine utility-
specific vulnerabilities of its water supply and
its facilities to climate change, challenges,
opportunities, solutions, conclusions and
recommendations; 2) conduct an engineering
assessment of current operating strategies, 3)
recommend improvements to resilience to the
utility’s water supply and its facilities with
associated capital investments and operating
cost estimates; and 4) present generalized methodology and recommendations that other water
treatment facilities in Southeast Florida and elsewhere might be able to use as a guide.
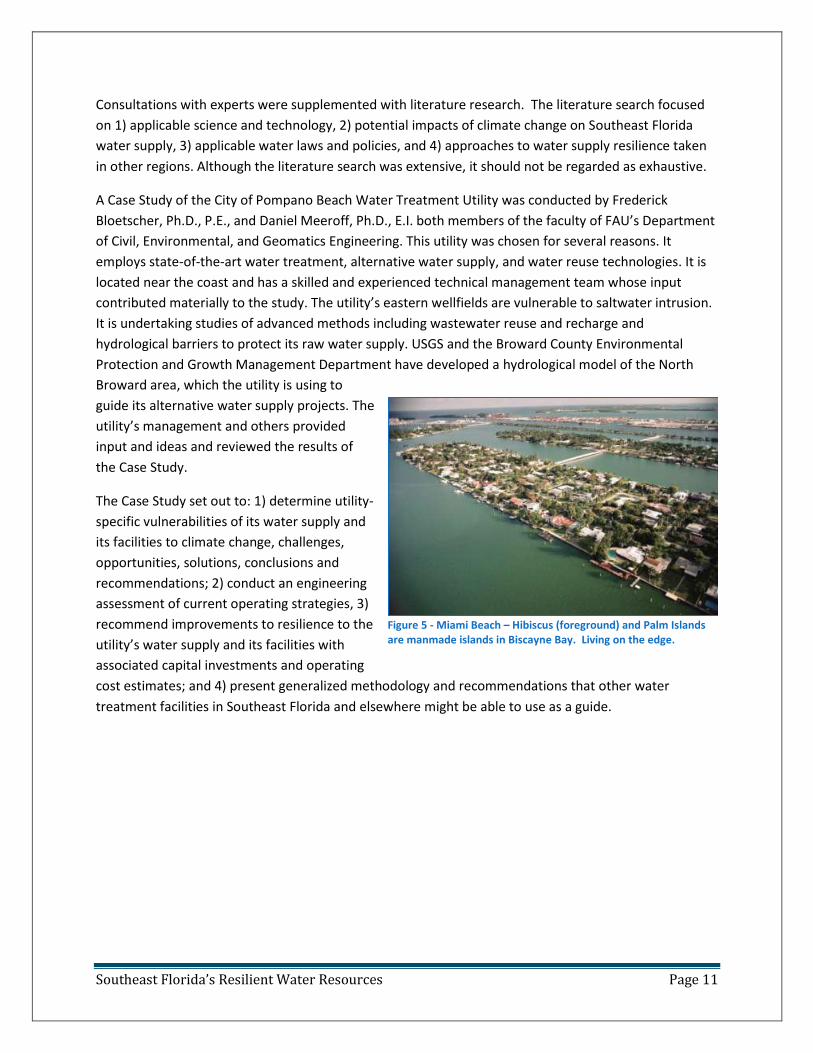
Figure 5 - Miami Beach – Hibiscus (foreground) and Palm Islands are manmade islands in Biscayne Bay. Living on the edge.
Southeast Florida’s Resilient Water Resources Page 12
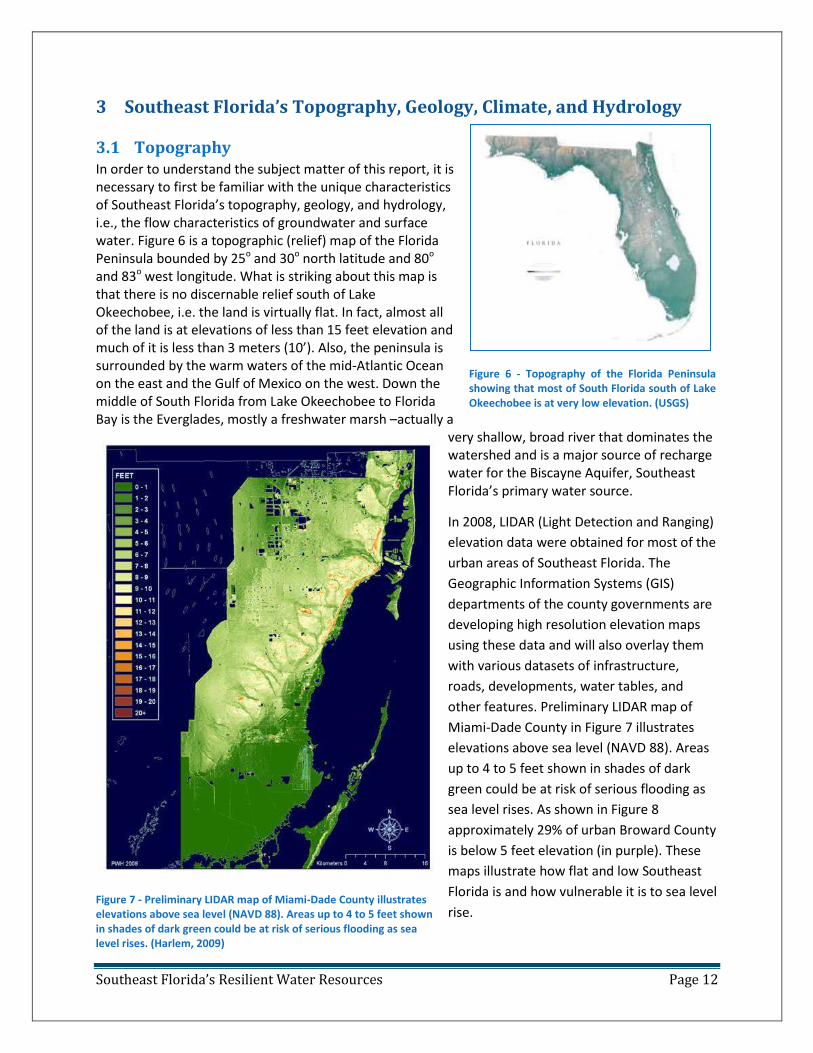
Figure 6 - Topography of the Florida Peninsula showing that most of South Florida south of Lake Okeechobee is at very low elevation. (USGS)
3 Southeast Florida’s Topography, Geology, Climate, and Hydrology
3.1 Topography In order to understand the subject matter of this report, it is necessary to first be familiar with the unique characteristics of Southeast Florida’s topography, geology, and hydrology, i.e., the flow characteristics of groundwater and surface water. Figure 6 is a topographic (relief) map of the Florida Peninsula bounded by 25o and 30o north latitude and 80o and 83o west longitude. What is striking about this map is that there is no discernable relief south of Lake Okeechobee, i.e. the land is virtually flat. In fact, almost all of the land is at elevations of less than 15 feet elevation and much of it is less than 3 meters (10’). Also, the peninsula is surrounded by the warm waters of the mid-Atlantic Ocean on the east and the Gulf of Mexico on the west. Down the middle of South Florida from Lake Okeechobee to Florida Bay is the Everglades, mostly a freshwater marsh –actually a
very shallow, broad river that dominates the watershed and is a major source of recharge water for the Biscayne Aquifer, Southeast Florida’s primary water source.
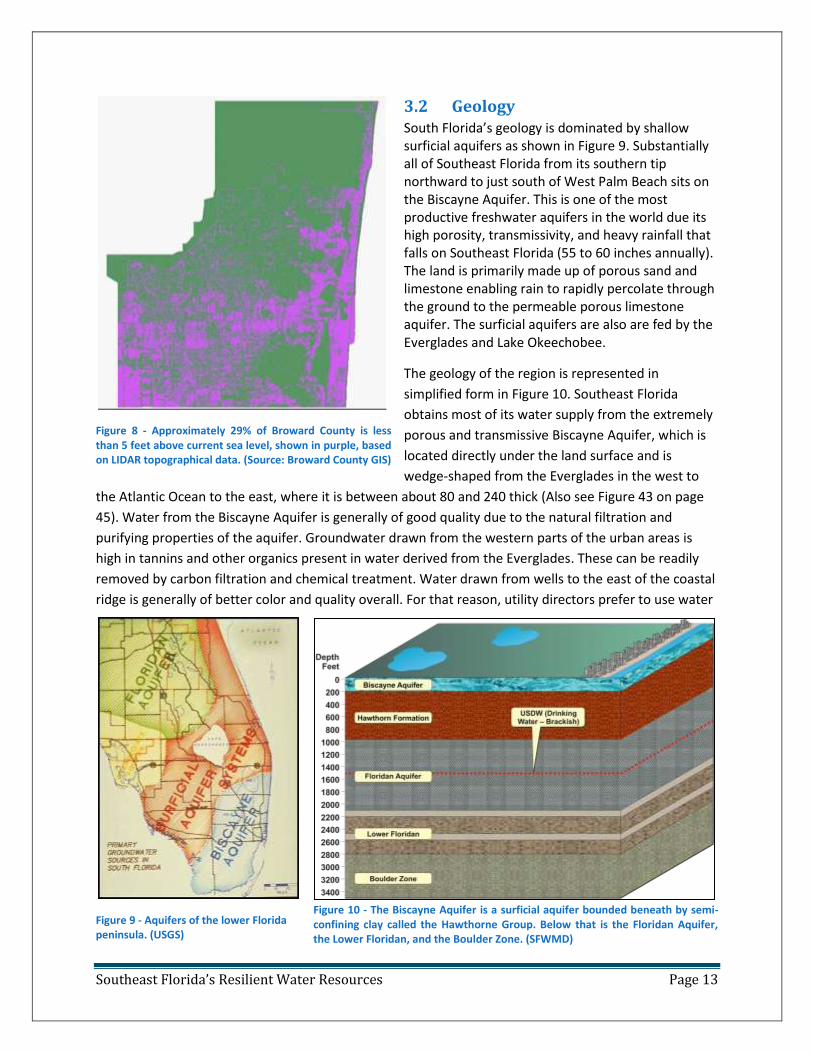
In 2008, LIDAR (Light Detection and Ranging)
elevation data were obtained for most of the
urban areas of Southeast Florida. The
Geographic Information Systems (GIS)
departments of the county governments are
developing high resolution elevation maps
using these data and will also overlay them
with various datasets of infrastructure,
roads, developments, water tables, and
other features. Preliminary LIDAR map of
Miami-Dade County in Figure 7 illustrates
elevations above sea level (NAVD 88). Areas
up to 4 to 5 feet shown in shades of dark
green could be at risk of serious flooding as
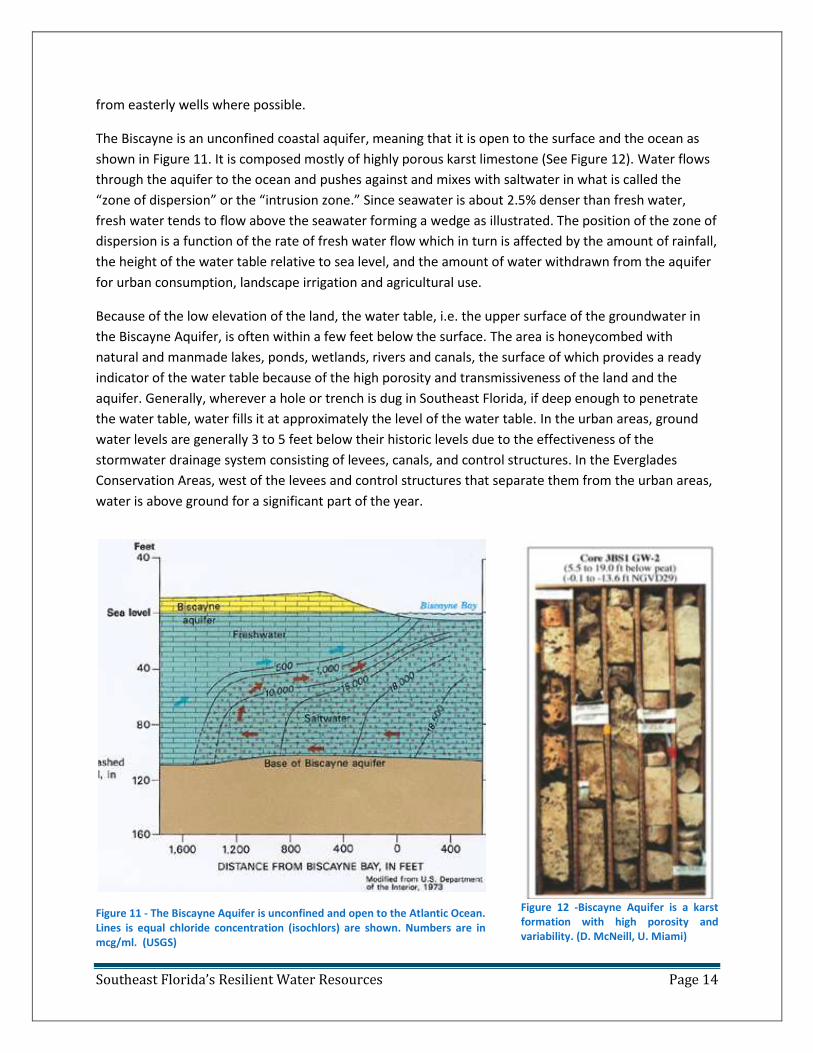
sea level rises. As shown in Figure 8
approximately 29% of urban Broward County
is below 5 feet elevation (in purple). These
maps illustrate how flat and low Southeast
Florida is and how vulnerable it is to sea level
rise.
Figure 7 - Preliminary LIDAR map of Miami-Dade County illustrates elevations above sea level (NAVD 88). Areas up to 4 to 5 feet shown in shades of dark green could be at risk of serious flooding as sea level rises. (Harlem, 2009)
Southeast Florida’s Resilient Water Resources Page 13
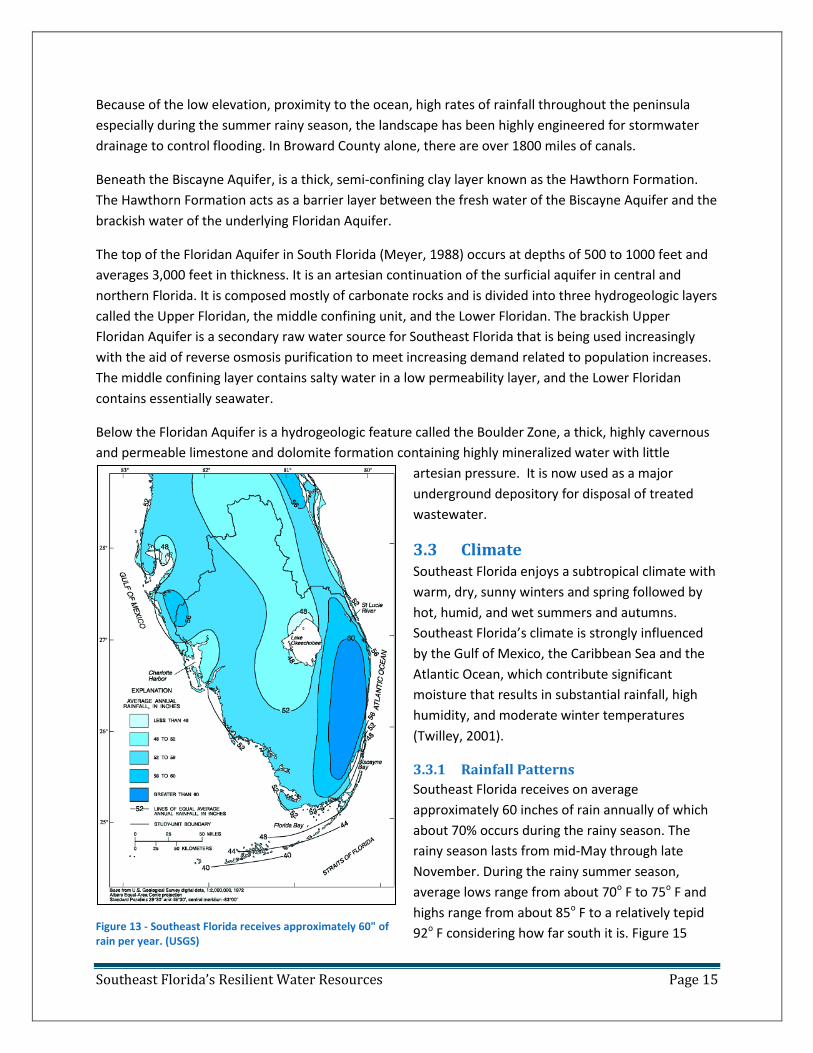
3.2 Geology South Florida’s geology is dominated by shallow surficial aquifers as shown in Figure 9. Substantially all of Southeast Florida from its southern tip northward to just south of West Palm Beach sits on the Biscayne Aquifer. This is one of the most productive freshwater aquifers in the world due its high porosity, transmissivity, and heavy rainfall that falls on Southeast Florida (55 to 60 inches annually). The land is primarily made up of porous sand and limestone enabling rain to rapidly percolate through the ground to the permeable porous limestone aquifer. The surficial aquifers are also are fed by the Everglades and Lake Okeechobee.
The geology of the region is represented in
simplified form in Figure 10. Southeast Florida
obtains most of its water supply from the extremely
porous and transmissive Biscayne Aquifer, which is
located directly under the land surface and is
wedge-shaped from the Everglades in the west to
the Atlantic Ocean to the east, where it is between about 80 and 240 thick (Also see Figure 43 on page
45). Water from the Biscayne Aquifer is generally of good quality due to the natural filtration and
purifying properties of the aquifer. Groundwater drawn from the western parts of the urban areas is
high in tannins and other organics present in water derived from the Everglades. These can be readily
removed by carbon filtration and chemical treatment. Water drawn from wells to the east of the coastal
ridge is generally of better color and quality overall. For that reason, utility directors prefer to use water
Figure 10 - The Biscayne Aquifer is a surficial aquifer bounded beneath by semi-confining clay called the Hawthorne Group. Below that is the Floridan Aquifer, the Lower Floridan, and the Boulder Zone. (SFWMD)
Figure 8 - Approximately 29% of Broward County is less than 5 feet above current sea level, shown in purple, based on LIDAR topographical data. (Source: Broward County GIS)
Figure 9 - Aquifers of the lower Florida peninsula. (USGS)
Southeast Florida’s Resilient Water Resources Page 14
from easterly wells where possible.
The Biscayne is an unconfined coastal aquifer, meaning that it is open to the surface and the ocean as
shown in Figure 11. It is composed mostly of highly porous karst limestone (See Figure 12). Water flows
through the aquifer to the ocean and pushes against and mixes with saltwater in what is called the
“zone of dispersion” or the “intrusion zone.” Since seawater is about 2.5% denser than fresh water,
fresh water tends to flow above the seawater forming a wedge as illustrated. The position of the zone of
dispersion is a function of the rate of fresh water flow which in turn is affected by the amount of rainfall,
the height of the water table relative to sea level, and the amount of water withdrawn from the aquifer
for urban consumption, landscape irrigation and agricultural use.
Because of the low elevation of the land, the water table, i.e. the upper surface of the groundwater in
the Biscayne Aquifer, is often within a few feet below the surface. The area is honeycombed with
natural and manmade lakes, ponds, wetlands, rivers and canals, the surface of which provides a ready
indicator of the water table because of the high porosity and transmissiveness of the land and the
aquifer. Generally, wherever a hole or trench is dug in Southeast Florida, if deep enough to penetrate
the water table, water fills it at approximately the level of the water table. In the urban areas, ground
water levels are generally 3 to 5 feet below their historic levels due to the effectiveness of the
stormwater drainage system consisting of levees, canals, and control structures. In the Everglades
Conservation Areas, west of the levees and control structures that separate them from the urban areas,
water is above ground for a significant part of the year.
Figure 12 -Biscayne Aquifer is a karst formation with high porosity and variability. (D. McNeill, U. Miami)
Figure 11 - The Biscayne Aquifer is unconfined and open to the Atlantic Ocean. Lines is equal chloride concentration (isochlors) are shown. Numbers are in mcg/ml. (USGS)
Southeast Florida’s Resilient Water Resources Page 15
Because of the low elevation, proximity to the ocean, high rates of rainfall throughout the peninsula
especially during the summer rainy season, the landscape has been highly engineered for stormwater
drainage to control flooding. In Broward County alone, there are over 1800 miles of canals.
Beneath the Biscayne Aquifer, is a thick, semi-confining clay layer known as the Hawthorn Formation.
The Hawthorn Formation acts as a barrier layer between the fresh water of the Biscayne Aquifer and the
brackish water of the underlying Floridan Aquifer.
The top of the Floridan Aquifer in South Florida (Meyer, 1988) occurs at depths of 500 to 1000 feet and
averages 3,000 feet in thickness. It is an artesian continuation of the surficial aquifer in central and
northern Florida. It is composed mostly of carbonate rocks and is divided into three hydrogeologic layers
called the Upper Floridan, the middle confining unit, and the Lower Floridan. The brackish Upper
Floridan Aquifer is a secondary raw water source for Southeast Florida that is being used increasingly
with the aid of reverse osmosis purification to meet increasing demand related to population increases.
The middle confining layer contains salty water in a low permeability layer, and the Lower Floridan
contains essentially seawater.
Below the Floridan Aquifer is a hydrogeologic feature called the Boulder Zone, a thick, highly cavernous
and permeable limestone and dolomite formation containing highly mineralized water with little
artesian pressure. It is now used as a major
underground depository for disposal of treated
wastewater.
3.3 Climate Southeast Florida enjoys a subtropical climate with
warm, dry, sunny winters and spring followed by
hot, humid, and wet summers and autumns.
Southeast Florida’s climate is strongly influenced
by the Gulf of Mexico, the Caribbean Sea and the
Atlantic Ocean, which contribute significant
moisture that results in substantial rainfall, high
humidity, and moderate winter temperatures
(Twilley, 2001).
3.3.1 Rainfall Patterns
Southeast Florida receives on average
approximately 60 inches of rain annually of which
about 70% occurs during the rainy season. The
rainy season lasts from mid-May through late
November. During the rainy summer season,
average lows range from about 70o F to 75o F and
highs range from about 85o F to a relatively tepid
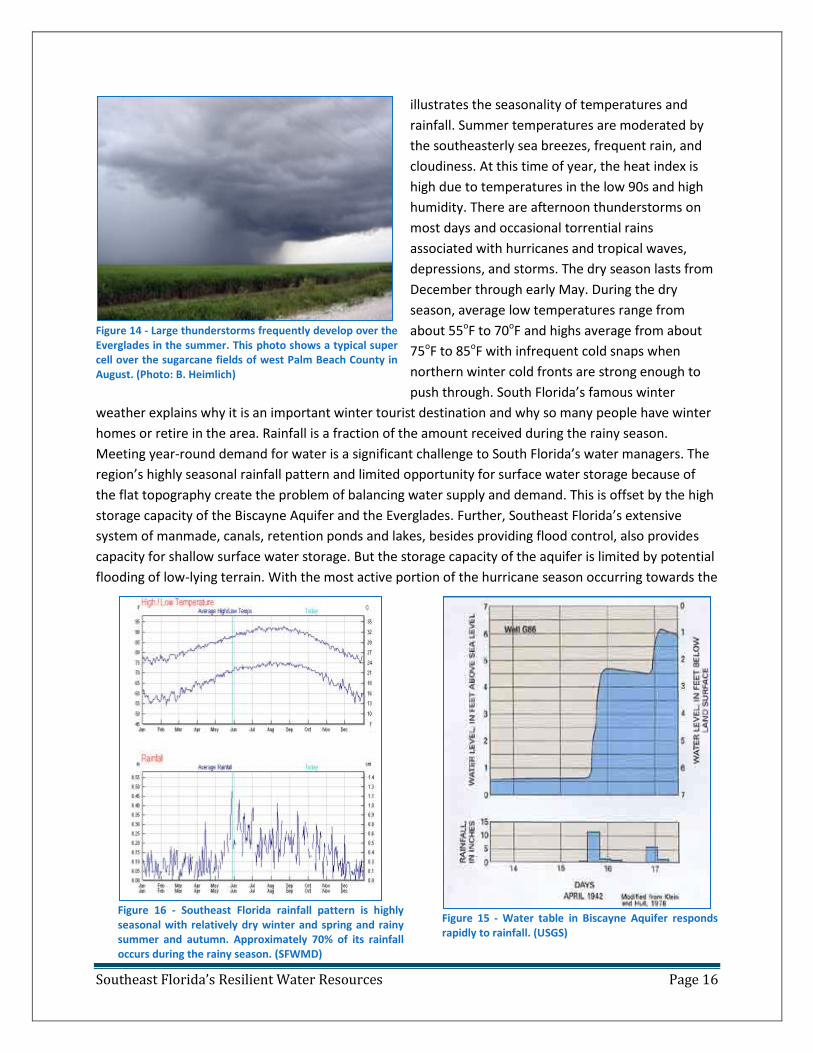
92o F considering how far south it is. Figure 15
Figure 13 - Southeast Florida receives approximately 60" of rain per year. (USGS)
Southeast Florida’s Resilient Water Resources Page 16
Figure 15 - Water table in Biscayne Aquifer responds rapidly to rainfall. (USGS)
Figure 14 - Large thunderstorms frequently develop over the Everglades in the summer. This photo shows a typical super cell over the sugarcane fields of west Palm Beach County in August. (Photo: B. Heimlich)
illustrates the seasonality of temperatures and
rainfall. Summer temperatures are moderated by
the southeasterly sea breezes, frequent rain, and
cloudiness. At this time of year, the heat index is
high due to temperatures in the low 90s and high
humidity. There are afternoon thunderstorms on
most days and occasional torrential rains
associated with hurricanes and tropical waves,
depressions, and storms. The dry season lasts from
December through early May. During the dry
season, average low temperatures range from
about 55oF to 70oF and highs average from about
75oF to 85oF with infrequent cold snaps when
northern winter cold fronts are strong enough to
push through. South Florida’s famous winter
weather explains why it is an important winter tourist destination and why so many people have winter
homes or retire in the area. Rainfall is a fraction of the amount received during the rainy season.
Meeting year-round demand for water is a significant challenge to South Florida’s water managers. The
region’s highly seasonal rainfall pattern and limited opportunity for surface water storage because of
the flat topography create the problem of balancing water supply and demand. This is offset by the high
storage capacity of the Biscayne Aquifer and the Everglades. Further, Southeast Florida’s extensive
system of manmade, canals, retention ponds and lakes, besides providing flood control, also provides
capacity for shallow surface water storage. But the storage capacity of the aquifer is limited by potential
flooding of low-lying terrain. With the most active portion of the hurricane season occurring towards the
Figure 16 - Southeast Florida rainfall pattern is highly seasonal with relatively dry winter and spring and rainy summer and autumn. Approximately 70% of its rainfall occurs during the rainy season. (SFWMD)
Southeast Florida’s Resilient Water Resources Page 17
end of the wet season, water managers’ efforts to end the wet season with high ground water levels to
maximize storage for the dry season represent a significant risk when late season storms develop.
The length of the rainy season is influenced by the location and relative strength of the Bermuda High
pressure systems during the summer (Twilley, 2001). If the Bermuda High remains strong in the
summer, the wet season is delayed and there is drought. The Bermuda High is small and located to the
south and east of Florida during the winter. In the spring, it expands and moves northward.
The El Niño/Southern Oscillation (ENSO) has significant influence on Florida’s climate. El Niño episodes
feature the development of abnormally warm sea-surface temperatures across the eastern tropical
Pacific. This is the opposite of the normal condition when the warmest waters are in the western Pacific.
During La Niña episodes, there are abnormally cold sea-surface temperatures across the eastern tropical
Pacific. El Niño is associated with significant shifts in the position of the jet stream over North America
and elsewhere. El Niño significantly decreases temperatures in winter and spring in Florida. During La
Niña, warmer temperatures during fall and winter seasons in the Gulf region followed by higher than
average temperatures in summer often contribute to regional drought. ENSO events also strongly
influence the number of hurricanes in the North Atlantic Basin. During La Niña events, the average
number of hurricanes making landfall in Florida and the Gulf Coast is typically higher than during El Niño
years (Twilley, 2001).
As will be discussed later, climate change is expected to exacerbate the seasonal variability of Southeast
Florida’s rainfall, with more extended and dryer dry seasons and shorter wet seasons with more intense
rain events.
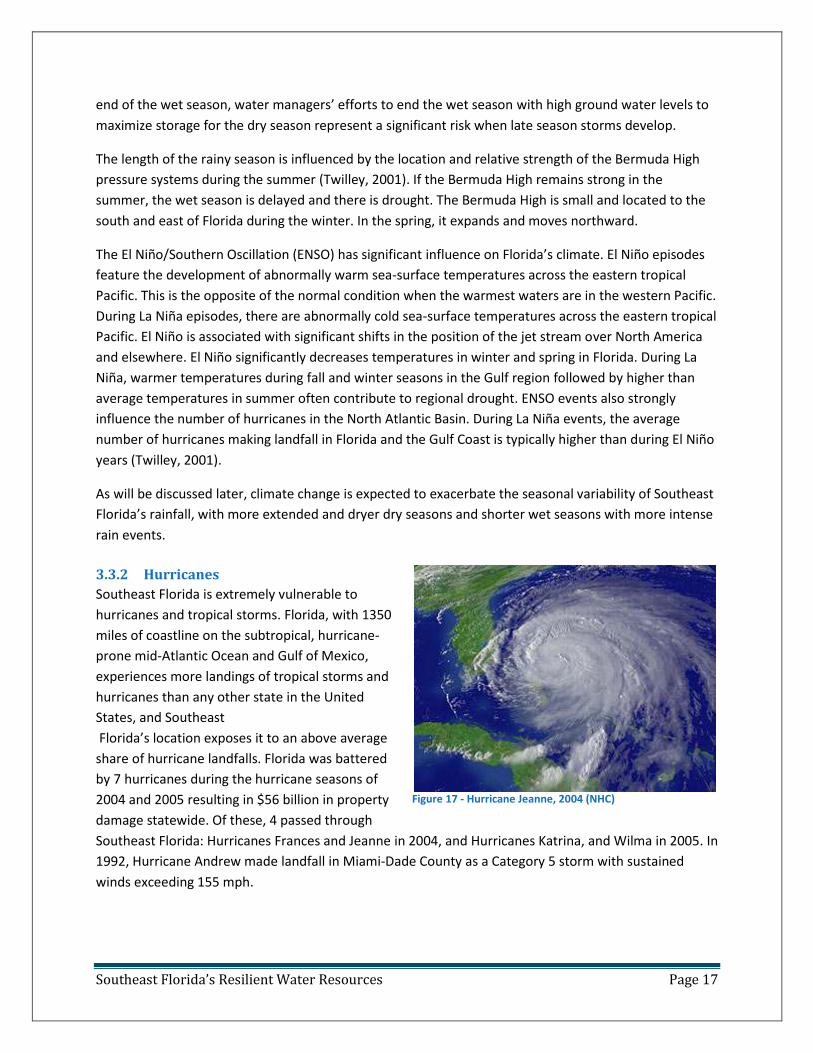
3.3.2 Hurricanes
Southeast Florida is extremely vulnerable to
hurricanes and tropical storms. Florida, with 1350
miles of coastline on the subtropical, hurricane-
prone mid-Atlantic Ocean and Gulf of Mexico,
experiences more landings of tropical storms and
hurricanes than any other state in the United
States, and Southeast
Florida’s location exposes it to an above average
share of hurricane landfalls. Florida was battered
by 7 hurricanes during the hurricane seasons of
2004 and 2005 resulting in $56 billion in property
damage statewide. Of these, 4 passed through
Southeast Florida: Hurricanes Frances and Jeanne in 2004, and Hurricanes Katrina, and Wilma in 2005. In
1992, Hurricane Andrew made landfall in Miami-Dade County as a Category 5 storm with sustained
winds exceeding 155 mph.
Figure 17 - Hurricane Jeanne, 2004 (NHC)
Southeast Florida’s Resilient Water Resources Page 18
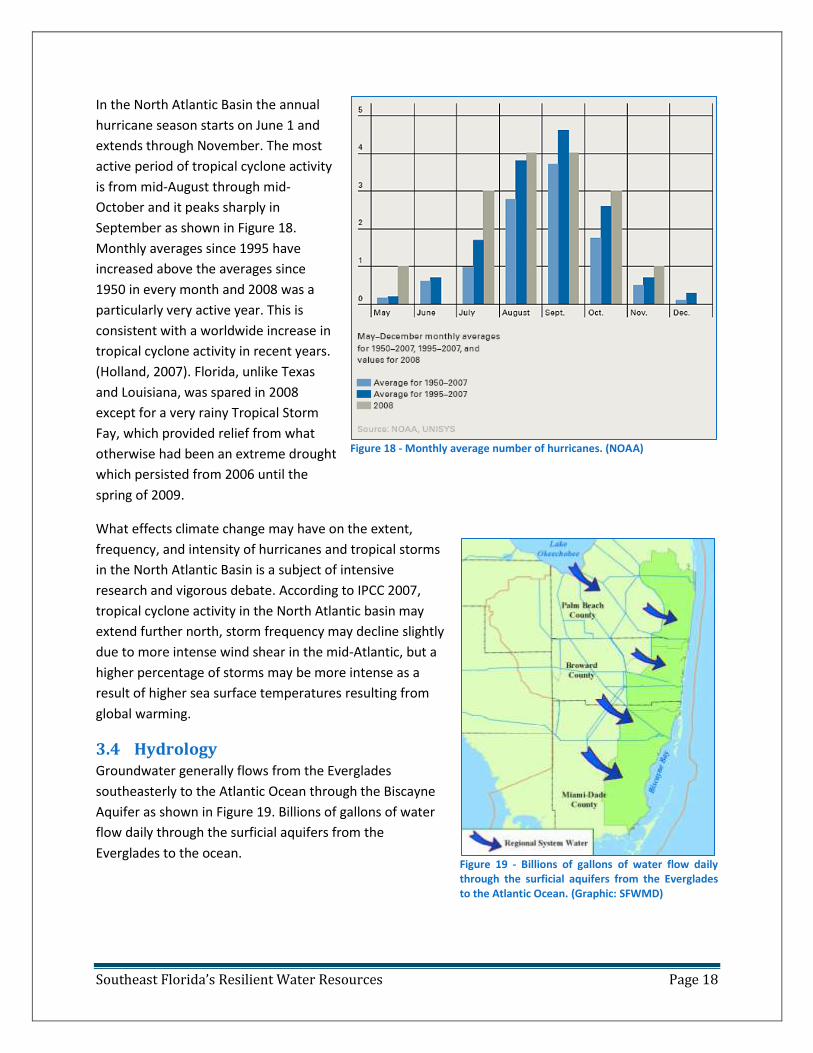
Figure 18 - Monthly average number of hurricanes. (NOAA)
In the North Atlantic Basin the annual
hurricane season starts on June 1 and
extends through November. The most
active period of tropical cyclone activity
is from mid-August through mid-
October and it peaks sharply in
September as shown in Figure 18.
Monthly averages since 1995 have
increased above the averages since
1950 in every month and 2008 was a
particularly very active year. This is
consistent with a worldwide increase in
tropical cyclone activity in recent years.
(Holland, 2007). Florida, unlike Texas
and Louisiana, was spared in 2008
except for a very rainy Tropical Storm
Fay, which provided relief from what
otherwise had been an extreme drought
which persisted from 2006 until the
spring of 2009.
What effects climate change may have on the extent,
frequency, and intensity of hurricanes and tropical storms
in the North Atlantic Basin is a subject of intensive
research and vigorous debate. According to IPCC 2007,
tropical cyclone activity in the North Atlantic basin may
extend further north, storm frequency may decline slightly
due to more intense wind shear in the mid-Atlantic, but a
higher percentage of storms may be more intense as a
result of higher sea surface temperatures resulting from
global warming.
3.4 Hydrology Groundwater generally flows from the Everglades
southeasterly to the Atlantic Ocean through the Biscayne
Aquifer as shown in Figure 19. Billions of gallons of water
flow daily through the surficial aquifers from the
Everglades to the ocean.
Figure 19 - Billions of gallons of water flow daily through the surficial aquifers from the Everglades to the Atlantic Ocean. (Graphic: SFWMD)
Southeast Florida’s Resilient Water Resources Page 19
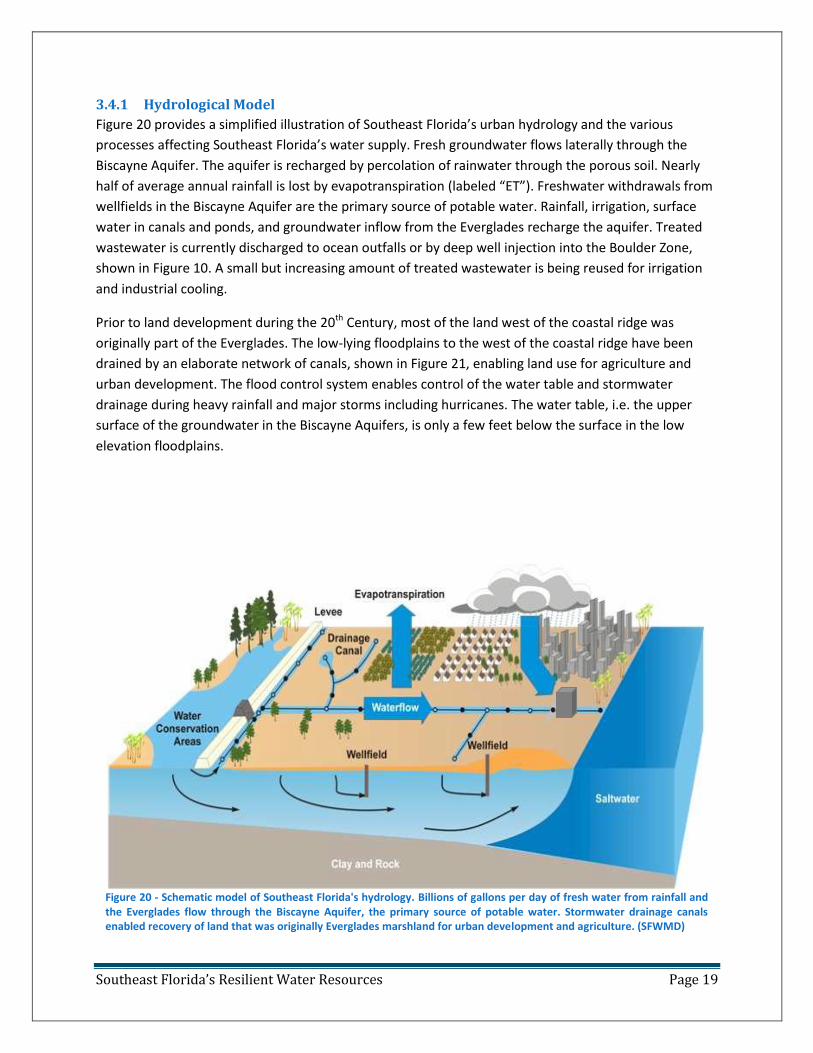
3.4.1 Hydrological Model
Figure 20 provides a simplified illustration of Southeast Florida’s urban hydrology and the various
processes affecting Southeast Florida’s water supply. Fresh groundwater flows laterally through the
Biscayne Aquifer. The aquifer is recharged by percolation of rainwater through the porous soil. Nearly
half of average annual rainfall is lost by evapotranspiration (labeled “ET”). Freshwater withdrawals from
wellfields in the Biscayne Aquifer are the primary source of potable water. Rainfall, irrigation, surface
water in canals and ponds, and groundwater inflow from the Everglades recharge the aquifer. Treated
wastewater is currently discharged to ocean outfalls or by deep well injection into the Boulder Zone,
shown in Figure 10. A small but increasing amount of treated wastewater is being reused for irrigation
and industrial cooling.
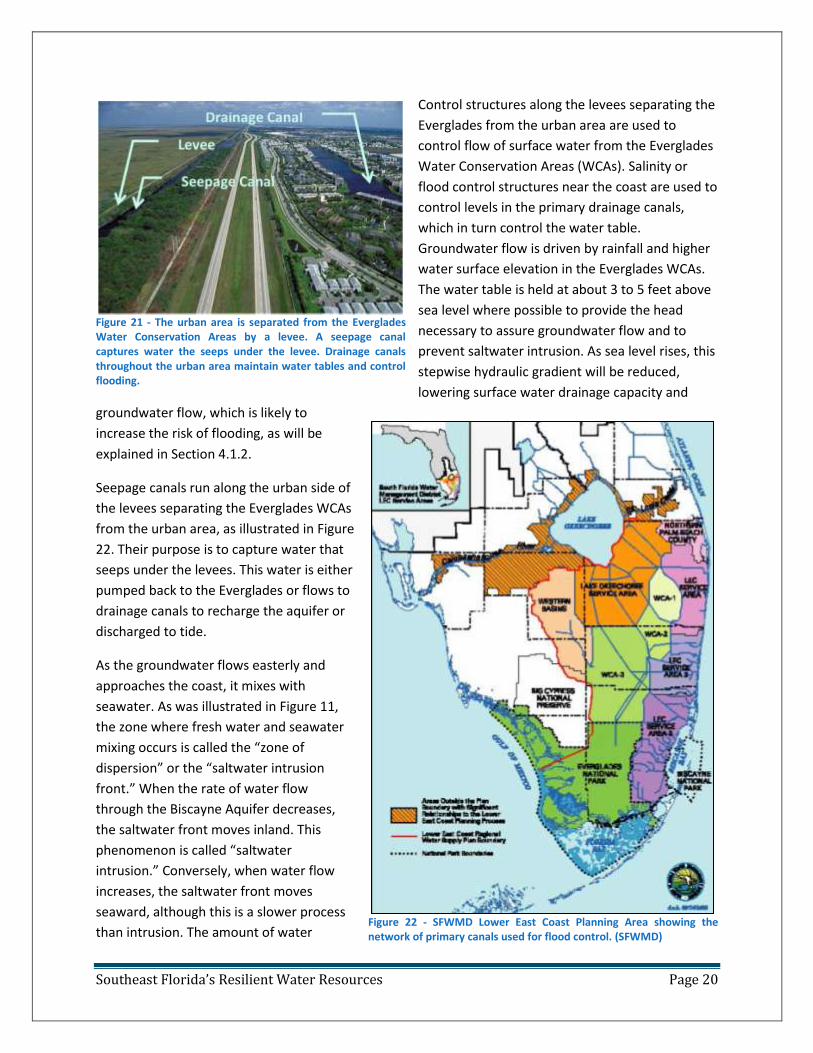
Prior to land development during the 20th Century, most of the land west of the coastal ridge was
originally part of the Everglades. The low-lying floodplains to the west of the coastal ridge have been
drained by an elaborate network of canals, shown in Figure 21, enabling land use for agriculture and
urban development. The flood control system enables control of the water table and stormwater
drainage during heavy rainfall and major storms including hurricanes. The water table, i.e. the upper
surface of the groundwater in the Biscayne Aquifers, is only a few feet below the surface in the low
elevation floodplains.
Figure 20 - Schematic model of Southeast Florida's hydrology. Billions of gallons per day of fresh water from rainfall and the Everglades flow through the Biscayne Aquifer, the primary source of potable water. Stormwater drainage canals enabled recovery of land that was originally Everglades marshland for urban development and agriculture. (SFWMD)
Southeast Florida’s Resilient Water Resources Page 20
Control structures along the levees separating the
Everglades from the urban area are used to
control flow of surface water from the Everglades
Water Conservation Areas (WCAs). Salinity or
flood control structures near the coast are used to
control levels in the primary drainage canals,
which in turn control the water table.
Groundwater flow is driven by rainfall and higher
water surface elevation in the Everglades WCAs.
The water table is held at about 3 to 5 feet above
sea level where possible to provide the head
necessary to assure groundwater flow and to
prevent saltwater intrusion. As sea level rises, this
stepwise hydraulic gradient will be reduced,
lowering surface water drainage capacity and
groundwater flow, which is likely to
increase the risk of flooding, as will be
explained in Section 4.1.2.
Seepage canals run along the urban side of
the levees separating the Everglades WCAs
from the urban area, as illustrated in Figure
22. Their purpose is to capture water that
seeps under the levees. This water is either
pumped back to the Everglades or flows to
drainage canals to recharge the aquifer or
discharged to tide.
As the groundwater flows easterly and
approaches the coast, it mixes with
seawater. As was illustrated in Figure 11,
the zone where fresh water and seawater
mixing occurs is called the “zone of
dispersion” or the “saltwater intrusion
front.” When the rate of water flow
through the Biscayne Aquifer decreases,
the saltwater front moves inland. This
phenomenon is called “saltwater
intrusion.” Conversely, when water flow
increases, the saltwater front moves
seaward, although this is a slower process
than intrusion. The amount of water
Figure 21 - The urban area is separated from the Everglades Water Conservation Areas by a levee. A seepage canal captures water the seeps under the levee. Drainage canals throughout the urban area maintain water tables and control flooding.
Figure 22 - SFWMD Lower East Coast Planning Area showing the network of primary canals used for flood control. (SFWMD)
Southeast Florida’s Resilient Water Resources Page 21
flowing depends upon the amount of recharge from rainfall, groundwater flowing from the Everglades,
wastewater reuse, urban water withdrawals, and other variables, as will be discussed later.
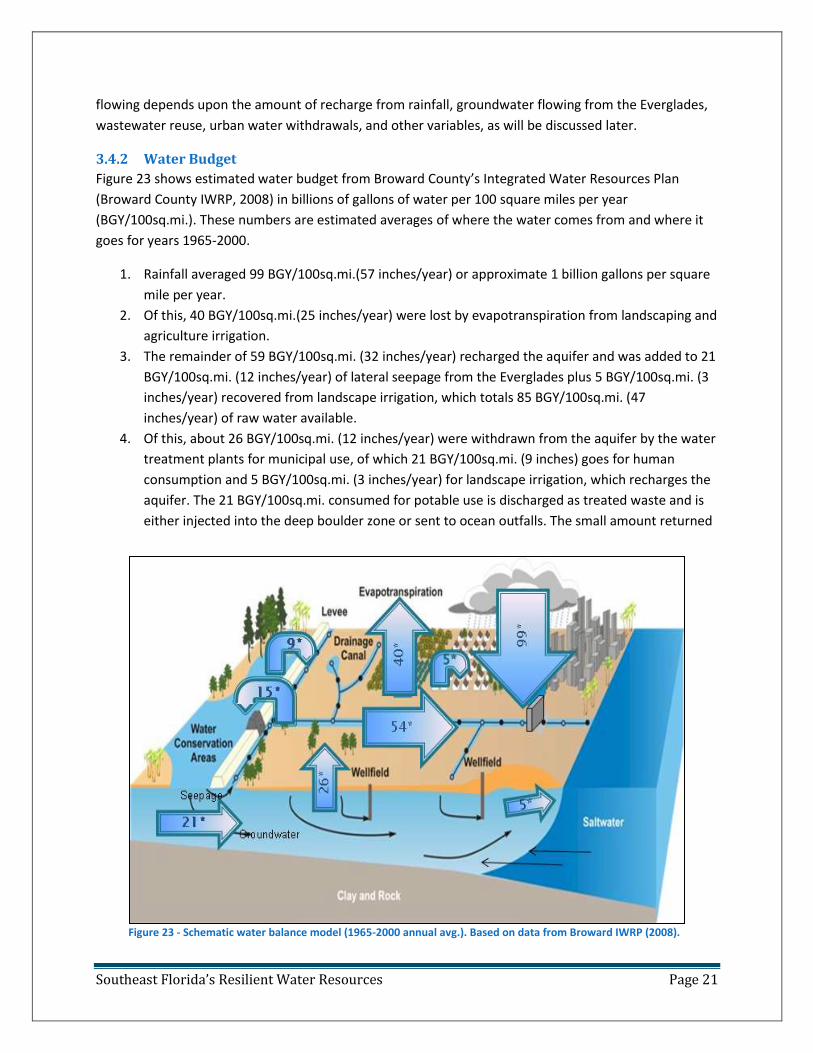
3.4.2 Water Budget
Figure 23 shows estimated water budget from Broward County’s Integrated Water Resources Plan
(Broward County IWRP, 2008) in billions of gallons of water per 100 square miles per year
(BGY/100sq.mi.). These numbers are estimated averages of where the water comes from and where it
goes for years 1965-2000.
1. Rainfall averaged 99 BGY/100sq.mi.(57 inches/year) or approximate 1 billion gallons per square
mile per year.
2. Of this, 40 BGY/100sq.mi.(25 inches/year) were lost by evapotranspiration from landscaping and
agriculture irrigation.
3. The remainder of 59 BGY/100sq.mi. (32 inches/year) recharged the aquifer and was added to 21
BGY/100sq.mi. (12 inches/year) of lateral seepage from the Everglades plus 5 BGY/100sq.mi. (3
inches/year) recovered from landscape irrigation, which totals 85 BGY/100sq.mi. (47
inches/year) of raw water available.
4. Of this, about 26 BGY/100sq.mi. (12 inches/year) were withdrawn from the aquifer by the water
treatment plants for municipal use, of which 21 BGY/100sq.mi. (9 inches) goes for human
consumption and 5 BGY/100sq.mi. (3 inches/year) for landscape irrigation, which recharges the
aquifer. The 21 BGY/100sq.mi. consumed for potable use is discharged as treated waste and is
either injected into the deep boulder zone or sent to ocean outfalls. The small amount returned
Figure 23 - Schematic water balance model (1965-2000 annual avg.). Based on data from Broward IWRP (2008).
Southeast Florida’s Resilient Water Resources Page 22
to the groundwater from septic tanks was not considered in this analysis.
5. Seepage to the ocean from the aquifer is estimated to be 5 BGY/100sq.mi. (3 inches/year). The
basis for this value could not be ascertained as of this writing, but it is a very critical value
because hydrostatic backpressure due to sea level rise can dramatically affect groundwater flow
to the ocean. This value is 10% of 54 BGY/100sq.mi. (31 inches/year) discharged to the ocean via
the primary canal flood control system. The effect fo sea level rise on groundwater flow to the
ocean relative to surface water flow via the canals is very important and will be discussed in
Section 4.2.2.
6. The remaining 57 BGY/100sq.mi. (32 inches/year) plus 8.7 BGY/100sq.mi. (5 inches/year)
drainage from the Everglades plus 3.5 BGY/100sq.mi. (2 inches/year) surface water runoff from
rainfall is discharged from the urban area. At the time of that study, 13.9 BGY/100sq.mi.(8
inches/year) were pumped back to the Everglades water conservation areas and 54
BGY/100sq.mi. (31 inches/year) was sent to tide. In recent years, discharge to the Everglades
water conservation areas has been greatly reduced to reduce phosphorus contamination. This
water is now also released to tide with the help of modifications to the stormwater drainage
system.
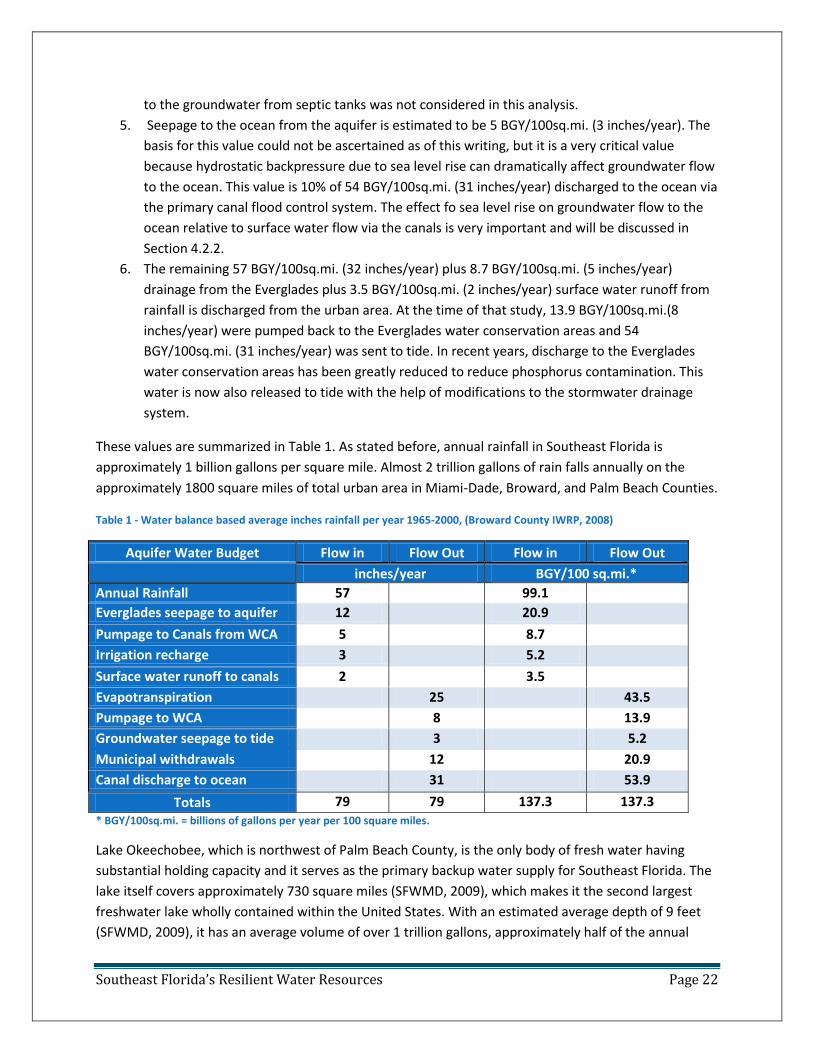
These values are summarized in Table 1. As stated before, annual rainfall in Southeast Florida is
approximately 1 billion gallons per square mile. Almost 2 trillion gallons of rain falls annually on the
approximately 1800 square miles of total urban area in Miami-Dade, Broward, and Palm Beach Counties.
Table 1 - Water balance based average inches rainfall per year 1965-2000, (Broward County IWRP, 2008)
Aquifer Water Budget Flow in Flow Out Flow in Flow Out
inches/year BGY/100 sq.mi.*
Annual Rainfall 57 99.1
Everglades seepage to aquifer 12 20.9
Pumpage to Canals from WCA 5 8.7
Irrigation recharge 3 5.2
Surface water runoff to canals 2 3.5
Evapotranspiration 25 43.5
Pumpage to WCA 8 13.9
Groundwater seepage to tide 3 5.2
Municipal withdrawals 12 20.9
Canal discharge to ocean 31 53.9
Totals 79 79 137.3 137.3 * BGY/100sq.mi. = billions of gallons per year per 100 square miles.
Lake Okeechobee, which is northwest of Palm Beach County, is the only body of fresh water having
substantial holding capacity and it serves as the primary backup water supply for Southeast Florida. The
lake itself covers approximately 730 square miles (SFWMD, 2009), which makes it the second largest
freshwater lake wholly contained within the United States. With an estimated average depth of 9 feet
(SFWMD, 2009), it has an average volume of over 1 trillion gallons, approximately half of the annual
Southeast Florida’s Resilient Water Resources Page 23
rainfall on the tri-county urban area. Recharge is
provided from rainfall across a watershed
including the Kissimmee River and Fisheating
Creek that is approximately 6 times the area of
the lake itself. Assuming that average annual
rainfall is 1 billion gallons per square mile, there is
over 4 trillion gallons of rainfall on the watershed
feeding Lake Okeechobee. The Everglades add
another ___ square miles and approximately ___
trillions gallons of rainfall annually.
Large areas of the northern Everglades have been
developed as “stormwater treatment areas”
(STAs). STAs provide storage, retention and water
quality treatment for runoff from the Everglades
Agricultural Area (EAA) south of Lake Okeechobee.
The EAA is an area of intense sugarcane
production. Figure 2 is a map showing these areas.
3.4.3 Stormwater Drainage System
South Florida’s landscape has been changed
dramatically by construction of its elaborate
system of canals, dikes, levees, flow control
structures, pumps, and other water control
facilities. These changes in the landscape allow
Southeast Florida to be one of the largest
metropolitan areas in the United States.
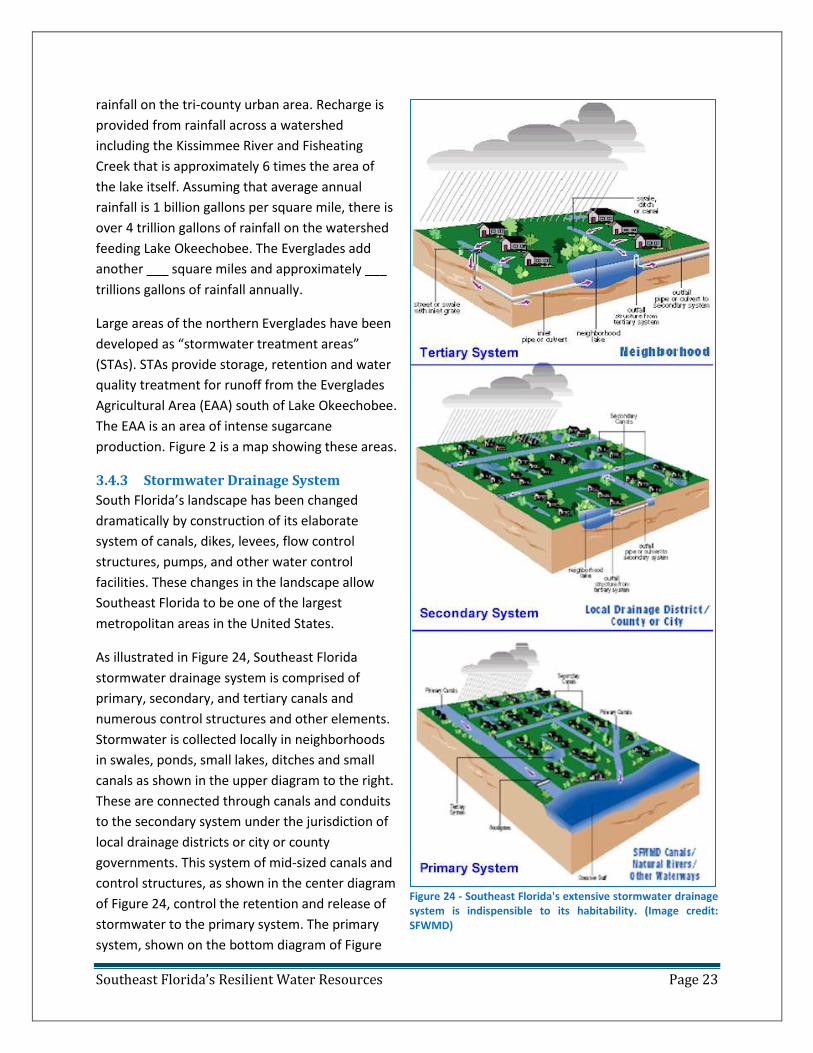
As illustrated in Figure 24, Southeast Florida
stormwater drainage system is comprised of
primary, secondary, and tertiary canals and
numerous control structures and other elements.
Stormwater is collected locally in neighborhoods
in swales, ponds, small lakes, ditches and small
canals as shown in the upper diagram to the right.
These are connected through canals and conduits
to the secondary system under the jurisdiction of
local drainage districts or city or county
governments. This system of mid-sized canals and
control structures, as shown in the center diagram
of Figure 24, control the retention and release of
stormwater to the primary system. The primary
system, shown on the bottom diagram of Figure
Figure 24 - Southeast Florida's extensive stormwater drainage system is indispensible to its habitability. (Image credit: SFWMD)
Southeast Florida’s Resilient Water Resources Page 24
24, is operated by the South Florida Water
Management District (SFWMD). Levels and flows in
the primary canals are controlled using flood control
structures, which also serve as salinity barriers that
keep tidal water from flowing inland. By maintaining
the highest water table levels possible that are
consistent with adequate flood control, saltwater
intrusion is minimized. Fresh water is conserved by
releasing as little fresh water to tide as possible.
During periods of excessive rainfall or in anticipation
of major rainstorms or hurricane landfall, levels in the
canals and the water table are lowered to increase
stormwater storage capacity. The performance of the
stormwater drainage system may be adversely
affected by sea level rise, as will be discussed in
Sections 4.2.2 and 4.2.3.
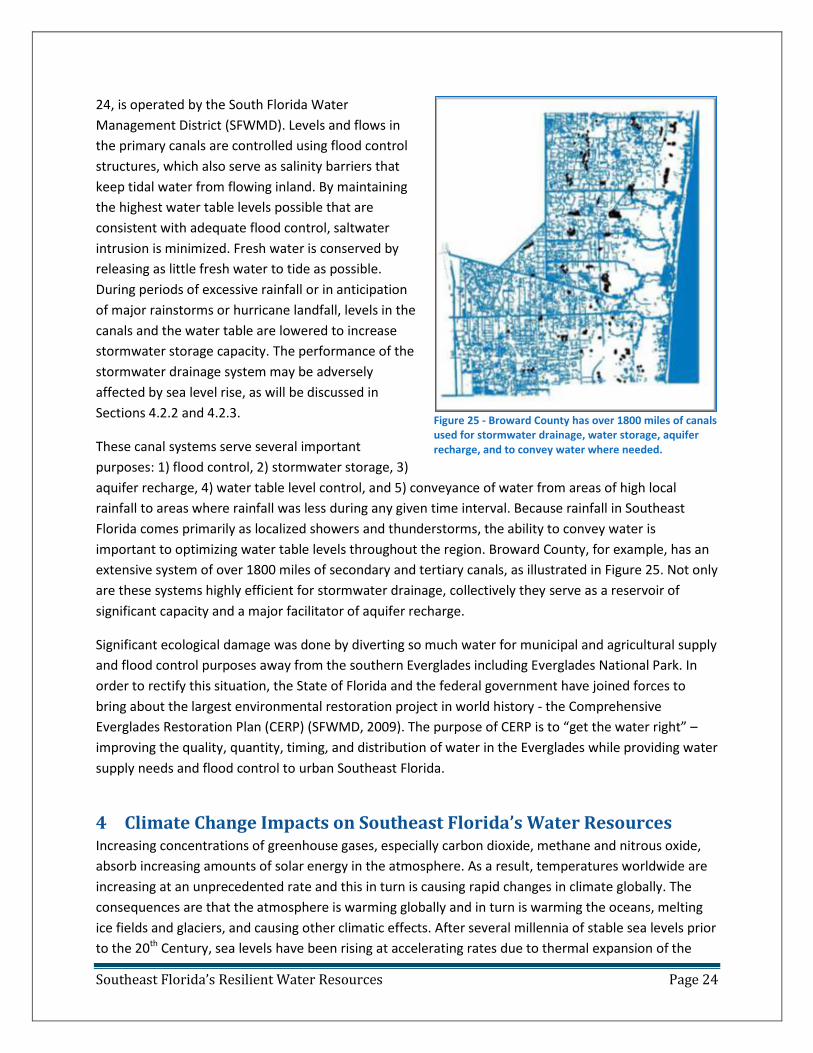
These canal systems serve several important
purposes: 1) flood control, 2) stormwater storage, 3)
aquifer recharge, 4) water table level control, and 5) conveyance of water from areas of high local
rainfall to areas where rainfall was less during any given time interval. Because rainfall in Southeast
Florida comes primarily as localized showers and thunderstorms, the ability to convey water is
important to optimizing water table levels throughout the region. Broward County, for example, has an
extensive system of over 1800 miles of secondary and tertiary canals, as illustrated in Figure 25. Not only
are these systems highly efficient for stormwater drainage, collectively they serve as a reservoir of
significant capacity and a major facilitator of aquifer recharge.
Significant ecological damage was done by diverting so much water for municipal and agricultural supply
and flood control purposes away from the southern Everglades including Everglades National Park. In
order to rectify this situation, the State of Florida and the federal government have joined forces to
bring about the largest environmental restoration project in world history - the Comprehensive
Everglades Restoration Plan (CERP) (SFWMD, 2009). The purpose of CERP is to “get the water right” –
improving the quality, quantity, timing, and distribution of water in the Everglades while providing water
supply needs and flood control to urban Southeast Florida.
4 Climate Change Impacts on Southeast Florida’s Water Resources Increasing concentrations of greenhouse gases, especially carbon dioxide, methane and nitrous oxide,
absorb increasing amounts of solar energy in the atmosphere. As a result, temperatures worldwide are
increasing at an unprecedented rate and this in turn is causing rapid changes in climate globally. The
consequences are that the atmosphere is warming globally and in turn is warming the oceans, melting
ice fields and glaciers, and causing other climatic effects. After several millennia of stable sea levels prior
to the 20th Century, sea levels have been rising at accelerating rates due to thermal expansion of the
Figure 25 - Broward County has over 1800 miles of canals used for stormwater drainage, water storage, aquifer recharge, and to convey water where needed.
Southeast Florida’s Resilient Water Resources Page 25
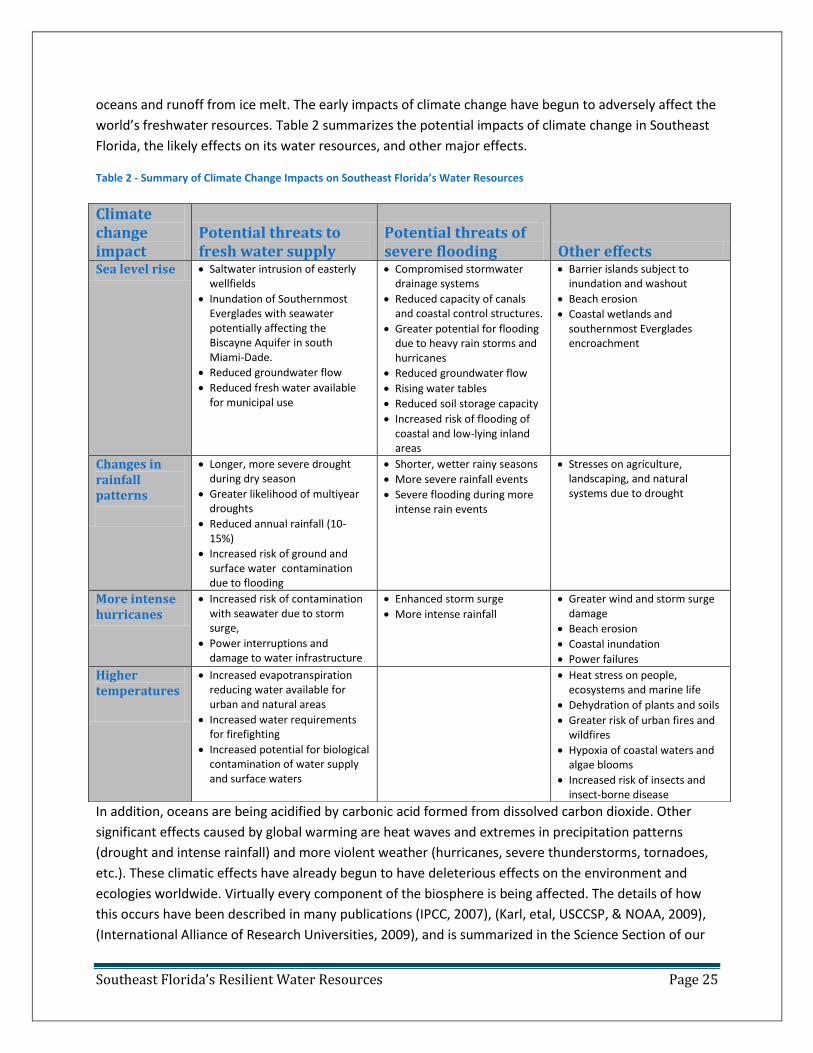
oceans and runoff from ice melt. The early impacts of climate change have begun to adversely affect the
world’s freshwater resources. Table 2 summarizes the potential impacts of climate change in Southeast
Florida, the likely effects on its water resources, and other major effects.
Table 2 - Summary of Climate Change Impacts on Southeast Florida’s Water Resources
In addition, oceans are being acidified by carbonic acid formed from dissolved carbon dioxide. Other
significant effects caused by global warming are heat waves and extremes in precipitation patterns
(drought and intense rainfall) and more violent weather (hurricanes, severe thunderstorms, tornadoes,
etc.). These climatic effects have already begun to have deleterious effects on the environment and
ecologies worldwide. Virtually every component of the biosphere is being affected. The details of how
this occurs have been described in many publications (IPCC, 2007), (Karl, etal, USCCSP, & NOAA, 2009),
(International Alliance of Research Universities, 2009), and is summarized in the Science Section of our
Climate change impact
Potential threats to fresh water supply
Potential threats of severe flooding Other effects
Sea level rise Saltwater intrusion of easterly wellfields
Inundation of Southernmost Everglades with seawater potentially affecting the Biscayne Aquifer in south Miami-Dade.
Reduced groundwater flow
Reduced fresh water available for municipal use
Compromised stormwater drainage systems
Reduced capacity of canals and coastal control structures.
Greater potential for flooding due to heavy rain storms and hurricanes
Reduced groundwater flow
Rising water tables
Reduced soil storage capacity
Increased risk of flooding of coastal and low-lying inland areas
Barrier islands subject to inundation and washout
Beach erosion
Coastal wetlands and southernmost Everglades encroachment
Changes in rainfall patterns
Longer, more severe drought during dry season
Greater likelihood of multiyear droughts
Reduced annual rainfall (10-15%)
Increased risk of ground and surface water contamination due to flooding
Shorter, wetter rainy seasons
More severe rainfall events
Severe flooding during more intense rain events
Stresses on agriculture, landscaping, and natural systems due to drought
More intense hurricanes
Increased risk of contamination with seawater due to storm surge,
Power interruptions and damage to water infrastructure
Enhanced storm surge
More intense rainfall
Greater wind and storm surge damage
Beach erosion
Coastal inundation
Power failures
Higher temperatures
Increased evapotranspiration reducing water available for urban and natural areas
Increased water requirements for firefighting
Increased potential for biological contamination of water supply and surface waters
Heat stress on people, ecosystems and marine life
Dehydration of plants and soils
Greater risk of urban fires and wildfires
Hypoxia of coastal waters and algae blooms
Increased risk of insects and insect-borne disease
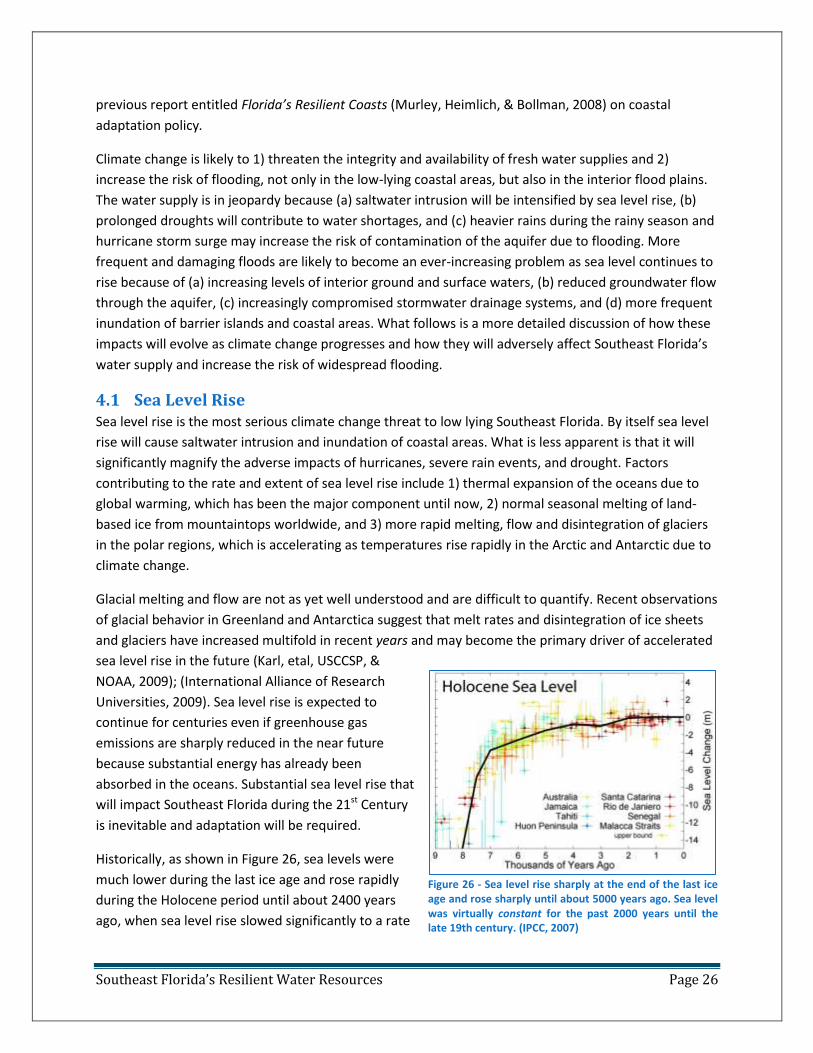
Southeast Florida’s Resilient Water Resources Page 26
previous report entitled Florida’s Resilient Coasts (Murley, Heimlich, & Bollman, 2008) on coastal
adaptation policy.
Climate change is likely to 1) threaten the integrity and availability of fresh water supplies and 2)
increase the risk of flooding, not only in the low-lying coastal areas, but also in the interior flood plains.
The water supply is in jeopardy because (a) saltwater intrusion will be intensified by sea level rise, (b)
prolonged droughts will contribute to water shortages, and (c) heavier rains during the rainy season and
hurricane storm surge may increase the risk of contamination of the aquifer due to flooding. More
frequent and damaging floods are likely to become an ever-increasing problem as sea level continues to
rise because of (a) increasing levels of interior ground and surface waters, (b) reduced groundwater flow
through the aquifer, (c) increasingly compromised stormwater drainage systems, and (d) more frequent
inundation of barrier islands and coastal areas. What follows is a more detailed discussion of how these
impacts will evolve as climate change progresses and how they will adversely affect Southeast Florida’s
water supply and increase the risk of widespread flooding.
4.1 Sea Level Rise Sea level rise is the most serious climate change threat to low lying Southeast Florida. By itself sea level
rise will cause saltwater intrusion and inundation of coastal areas. What is less apparent is that it will
significantly magnify the adverse impacts of hurricanes, severe rain events, and drought. Factors
contributing to the rate and extent of sea level rise include 1) thermal expansion of the oceans due to
global warming, which has been the major component until now, 2) normal seasonal melting of land-
based ice from mountaintops worldwide, and 3) more rapid melting, flow and disintegration of glaciers
in the polar regions, which is accelerating as temperatures rise rapidly in the Arctic and Antarctic due to
climate change.
Glacial melting and flow are not as yet well understood and are difficult to quantify. Recent observations
of glacial behavior in Greenland and Antarctica suggest that melt rates and disintegration of ice sheets
and glaciers have increased multifold in recent years and may become the primary driver of accelerated
sea level rise in the future (Karl, etal, USCCSP, &
NOAA, 2009); (International Alliance of Research
Universities, 2009). Sea level rise is expected to
continue for centuries even if greenhouse gas
emissions are sharply reduced in the near future
because substantial energy has already been
absorbed in the oceans. Substantial sea level rise that
will impact Southeast Florida during the 21st Century
is inevitable and adaptation will be required.
Historically, as shown in Figure 26, sea levels were
much lower during the last ice age and rose rapidly
during the Holocene period until about 2400 years
ago, when sea level rise slowed significantly to a rate
Figure 26 - Sea level rise sharply at the end of the last ice age and rose sharply until about 5000 years ago. Sea level was virtually constant for the past 2000 years until the late 19th century. (IPCC, 2007)
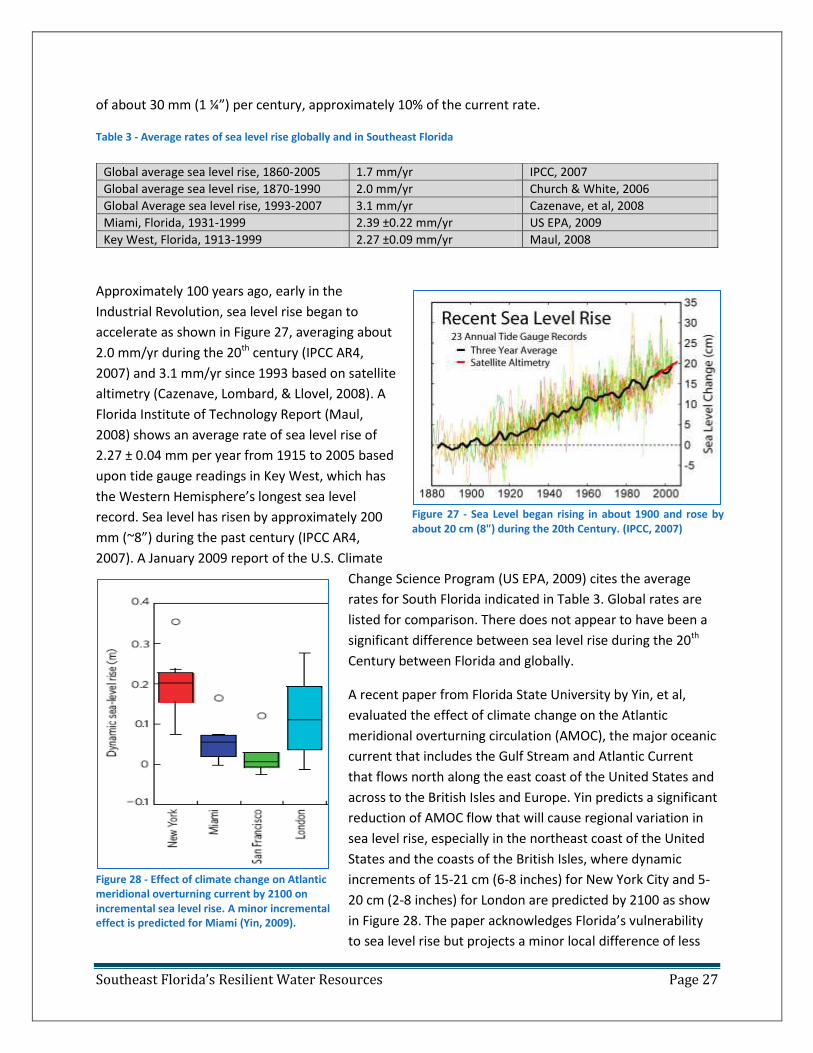
Southeast Florida’s Resilient Water Resources Page 27
of about 30 mm (1 ¼”) per century, approximately 10% of the current rate.
Table 3 - Average rates of sea level rise globally and in Southeast Florida
Approximately 100 years ago, early in the
Industrial Revolution, sea level rise began to
accelerate as shown in Figure 27, averaging about
2.0 mm/yr during the 20th century (IPCC AR4,
2007) and 3.1 mm/yr since 1993 based on satellite
altimetry (Cazenave, Lombard, & Llovel, 2008). A
Florida Institute of Technology Report (Maul,
2008) shows an average rate of sea level rise of
2.27 ± 0.04 mm per year from 1915 to 2005 based
upon tide gauge readings in Key West, which has
the Western Hemisphere’s longest sea level
record. Sea level has risen by approximately 200
mm (~8”) during the past century (IPCC AR4,
2007). A January 2009 report of the U.S. Climate
Change Science Program (US EPA, 2009) cites the average
rates for South Florida indicated in Table 3. Global rates are
listed for comparison. There does not appear to have been a
significant difference between sea level rise during the 20th
Century between Florida and globally.
A recent paper from Florida State University by Yin, et al,
evaluated the effect of climate change on the Atlantic
meridional overturning circulation (AMOC), the major oceanic
current that includes the Gulf Stream and Atlantic Current
that flows north along the east coast of the United States and
across to the British Isles and Europe. Yin predicts a significant
reduction of AMOC flow that will cause regional variation in
sea level rise, especially in the northeast coast of the United
States and the coasts of the British Isles, where dynamic
increments of 15-21 cm (6-8 inches) for New York City and 5-
20 cm (2-8 inches) for London are predicted by 2100 as show
in Figure 28. The paper acknowledges Florida’s vulnerability
to sea level rise but projects a minor local difference of less
Global average sea level rise, 1860-2005 1.7 mm/yr IPCC, 2007
Global average sea level rise, 1870-1990 2.0 mm/yr Church & White, 2006
Global Average sea level rise, 1993-2007 3.1 mm/yr Cazenave, et al, 2008
Miami, Florida, 1931-1999 2.39 ±0.22 mm/yr US EPA, 2009
Key West, Florida, 1913-1999 2.27 ±0.09 mm/yr Maul, 2008
Figure 28 - Effect of climate change on Atlantic meridional overturning current by 2100 on incremental sea level rise. A minor incremental effect is predicted for Miami (Yin, 2009).
Figure 27 - Sea Level began rising in about 1900 and rose by about 20 cm (8") during the 20th Century. (IPCC, 2007)
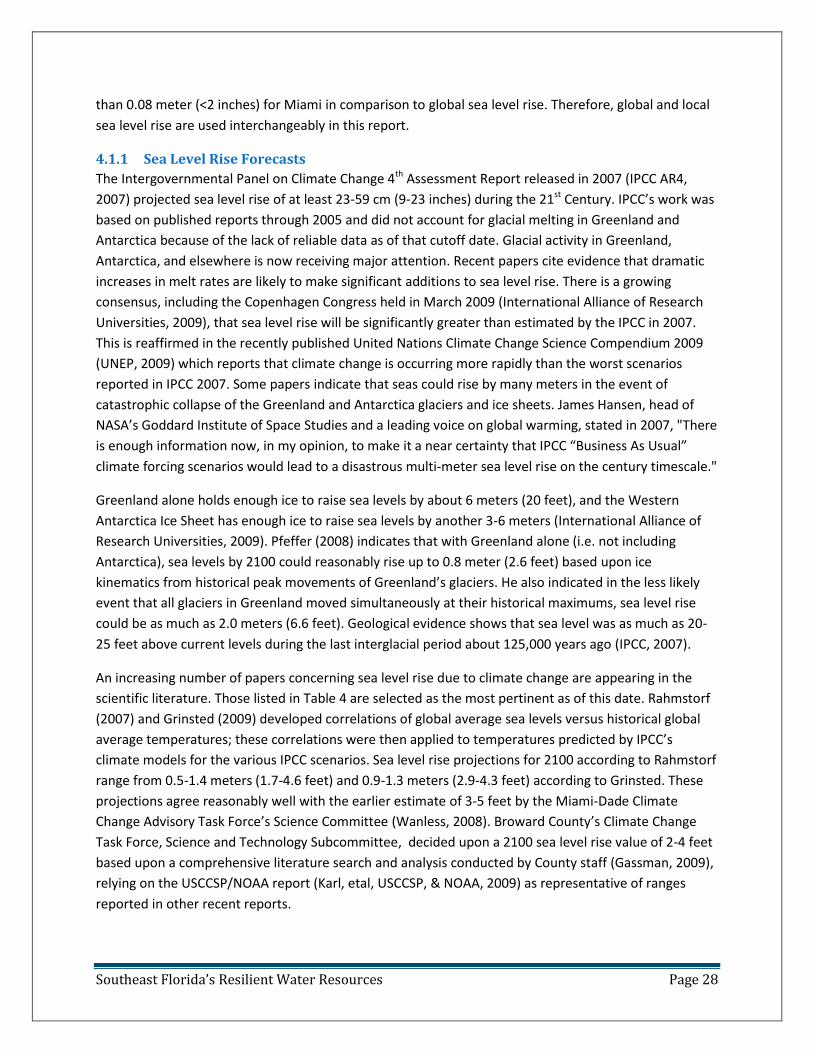
Southeast Florida’s Resilient Water Resources Page 28
than 0.08 meter (<2 inches) for Miami in comparison to global sea level rise. Therefore, global and local
sea level rise are used interchangeably in this report.
4.1.1 Sea Level Rise Forecasts
The Intergovernmental Panel on Climate Change 4th Assessment Report released in 2007 (IPCC AR4,
2007) projected sea level rise of at least 23-59 cm (9-23 inches) during the 21st Century. IPCC’s work was
based on published reports through 2005 and did not account for glacial melting in Greenland and
Antarctica because of the lack of reliable data as of that cutoff date. Glacial activity in Greenland,
Antarctica, and elsewhere is now receiving major attention. Recent papers cite evidence that dramatic
increases in melt rates are likely to make significant additions to sea level rise. There is a growing
consensus, including the Copenhagen Congress held in March 2009 (International Alliance of Research
Universities, 2009), that sea level rise will be significantly greater than estimated by the IPCC in 2007.
This is reaffirmed in the recently published United Nations Climate Change Science Compendium 2009
(UNEP, 2009) which reports that climate change is occurring more rapidly than the worst scenarios
reported in IPCC 2007. Some papers indicate that seas could rise by many meters in the event of
catastrophic collapse of the Greenland and Antarctica glaciers and ice sheets. James Hansen, head of
NASA’s Goddard Institute of Space Studies and a leading voice on global warming, stated in 2007, "There
is enough information now, in my opinion, to make it a near certainty that IPCC “Business As Usual”
climate forcing scenarios would lead to a disastrous multi-meter sea level rise on the century timescale."
Greenland alone holds enough ice to raise sea levels by about 6 meters (20 feet), and the Western
Antarctica Ice Sheet has enough ice to raise sea levels by another 3-6 meters (International Alliance of
Research Universities, 2009). Pfeffer (2008) indicates that with Greenland alone (i.e. not including
Antarctica), sea levels by 2100 could reasonably rise up to 0.8 meter (2.6 feet) based upon ice
kinematics from historical peak movements of Greenland’s glaciers. He also indicated in the less likely
event that all glaciers in Greenland moved simultaneously at their historical maximums, sea level rise
could be as much as 2.0 meters (6.6 feet). Geological evidence shows that sea level was as much as 20-
25 feet above current levels during the last interglacial period about 125,000 years ago (IPCC, 2007).
An increasing number of papers concerning sea level rise due to climate change are appearing in the
scientific literature. Those listed in Table 4 are selected as the most pertinent as of this date. Rahmstorf
(2007) and Grinsted (2009) developed correlations of global average sea levels versus historical global
average temperatures; these correlations were then applied to temperatures predicted by IPCC’s
climate models for the various IPCC scenarios. Sea level rise projections for 2100 according to Rahmstorf
range from 0.5-1.4 meters (1.7-4.6 feet) and 0.9-1.3 meters (2.9-4.3 feet) according to Grinsted. These
projections agree reasonably well with the earlier estimate of 3-5 feet by the Miami-Dade Climate
Change Advisory Task Force’s Science Committee (Wanless, 2008). Broward County’s Climate Change
Task Force, Science and Technology Subcommittee, decided upon a 2100 sea level rise value of 2-4 feet
based upon a comprehensive literature search and analysis conducted by County staff (Gassman, 2009),
relying on the USCCSP/NOAA report (Karl, etal, USCCSP, & NOAA, 2009) as representative of ranges
reported in other recent reports.
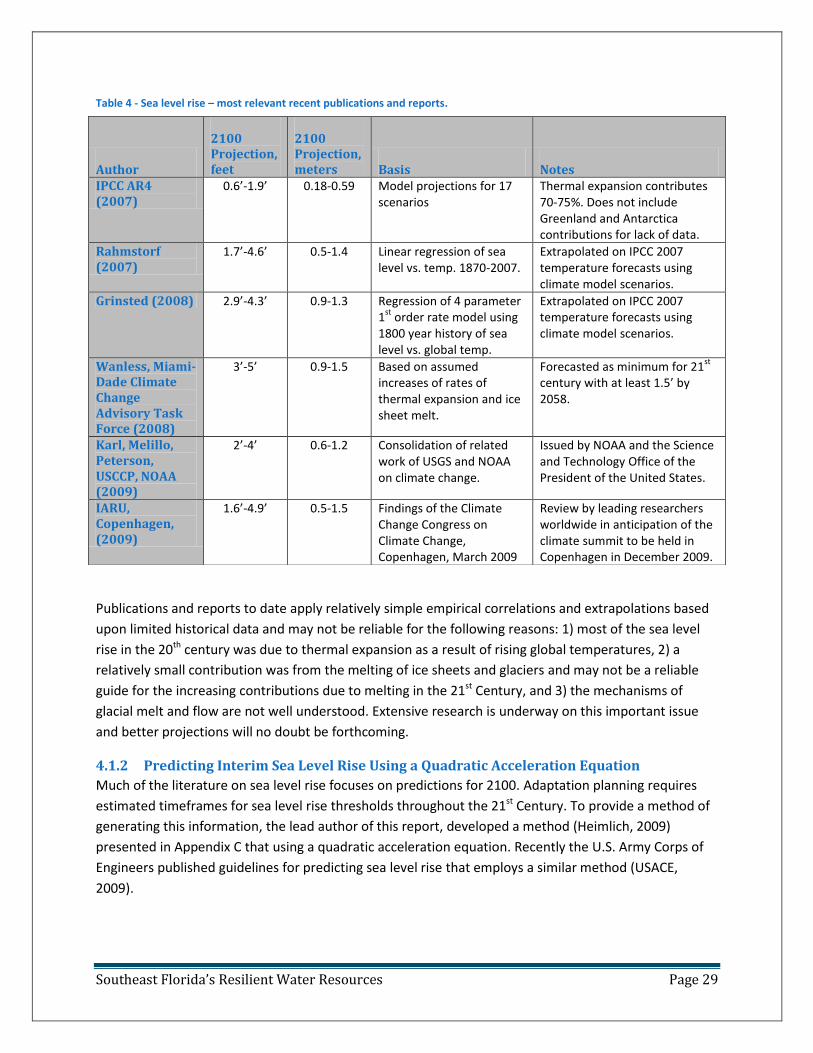
Southeast Florida’s Resilient Water Resources Page 29
Table 4 - Sea level rise – most relevant recent publications and reports.
Publications and reports to date apply relatively simple empirical correlations and extrapolations based
upon limited historical data and may not be reliable for the following reasons: 1) most of the sea level
rise in the 20th century was due to thermal expansion as a result of rising global temperatures, 2) a
relatively small contribution was from the melting of ice sheets and glaciers and may not be a reliable
guide for the increasing contributions due to melting in the 21st Century, and 3) the mechanisms of
glacial melt and flow are not well understood. Extensive research is underway on this important issue
and better projections will no doubt be forthcoming.
4.1.2 Predicting Interim Sea Level Rise Using a Quadratic Acceleration Equation
Much of the literature on sea level rise focuses on predictions for 2100. Adaptation planning requires
estimated timeframes for sea level rise thresholds throughout the 21st Century. To provide a method of
generating this information, the lead author of this report, developed a method (Heimlich, 2009)
presented in Appendix C that using a quadratic acceleration equation. Recently the U.S. Army Corps of
Engineers published guidelines for predicting sea level rise that employs a similar method (USACE,
2009).
Author
2100 Projection, feet
2100 Projection, meters Basis Notes
IPCC AR4 (2007)
0.6’-1.9’ 0.18-0.59 Model projections for 17 scenarios
Thermal expansion contributes 70-75%. Does not include Greenland and Antarctica contributions for lack of data.
Rahmstorf (2007)
1.7’-4.6’ 0.5-1.4 Linear regression of sea level vs. temp. 1870-2007.
Extrapolated on IPCC 2007 temperature forecasts using climate model scenarios.
Grinsted (2008) 2.9’-4.3’ 0.9-1.3 Regression of 4 parameter 1
st order rate model using
1800 year history of sea level vs. global temp.
Extrapolated on IPCC 2007 temperature forecasts using climate model scenarios.
Wanless, Miami-Dade Climate Change Advisory Task Force (2008)
3’-5’ 0.9-1.5 Based on assumed increases of rates of thermal expansion and ice sheet melt.
Forecasted as minimum for 21st
century with at least 1.5’ by 2058.
Karl, Melillo, Peterson, USCCP, NOAA (2009)
2’-4’ 0.6-1.2 Consolidation of related work of USGS and NOAA on climate change.
Issued by NOAA and the Science and Technology Office of the President of the United States.
IARU, Copenhagen, (2009)
1.6’-4.9’ 0.5-1.5 Findings of the Climate Change Congress on Climate Change, Copenhagen, March 2009
Review by leading researchers worldwide in anticipation of the climate summit to be held in Copenhagen in December 2009.
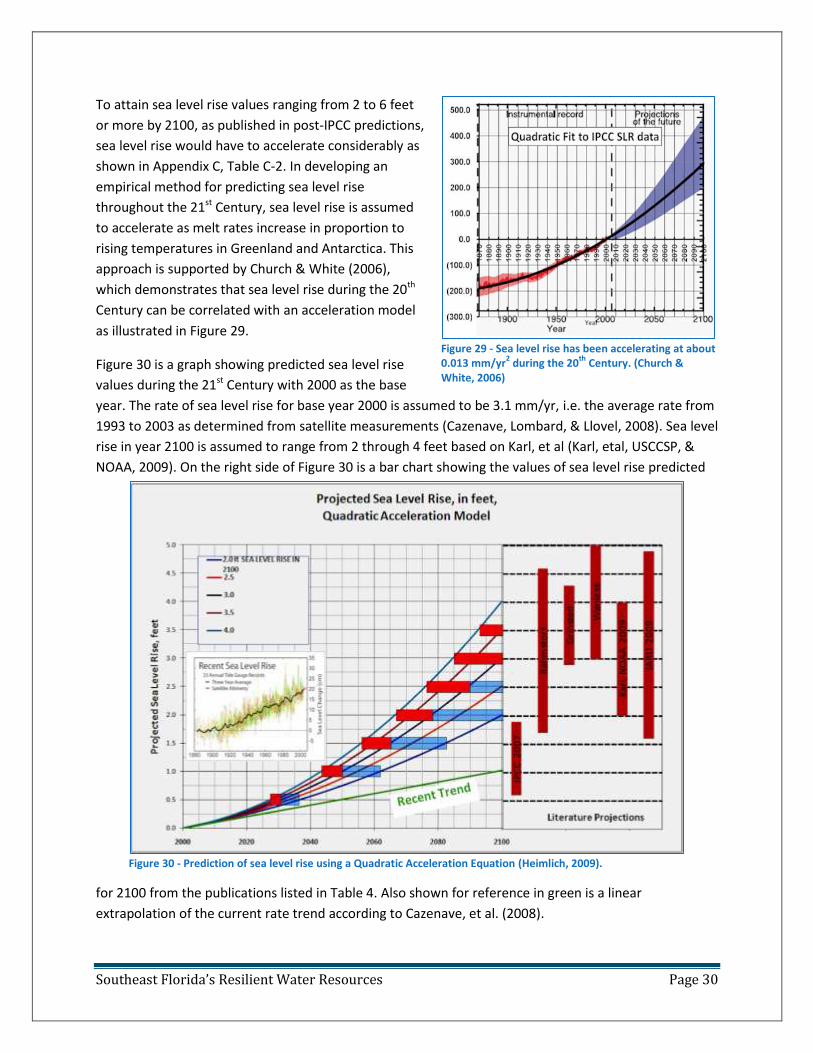
Southeast Florida’s Resilient Water Resources Page 30
To attain sea level rise values ranging from 2 to 6 feet
or more by 2100, as published in post-IPCC predictions,
sea level rise would have to accelerate considerably as
shown in Appendix C, Table C-2. In developing an
empirical method for predicting sea level rise
throughout the 21st Century, sea level rise is assumed
to accelerate as melt rates increase in proportion to
rising temperatures in Greenland and Antarctica. This
approach is supported by Church & White (2006),
which demonstrates that sea level rise during the 20th
Century can be correlated with an acceleration model
as illustrated in Figure 29.
Figure 30 is a graph showing predicted sea level rise
values during the 21st Century with 2000 as the base
year. The rate of sea level rise for base year 2000 is assumed to be 3.1 mm/yr, i.e. the average rate from
1993 to 2003 as determined from satellite measurements (Cazenave, Lombard, & Llovel, 2008). Sea level
rise in year 2100 is assumed to range from 2 through 4 feet based on Karl, et al (Karl, etal, USCCSP, &
NOAA, 2009). On the right side of Figure 30 is a bar chart showing the values of sea level rise predicted
for 2100 from the publications listed in Table 4. Also shown for reference in green is a linear
extrapolation of the current rate trend according to Cazenave, et al. (2008).
Figure 30 - Prediction of sea level rise using a Quadratic Acceleration Equation (Heimlich, 2009).
Figure 29 - Sea level rise has been accelerating at about 0.013 mm/yr
2 during the 20
th Century. (Church &
White, 2006)
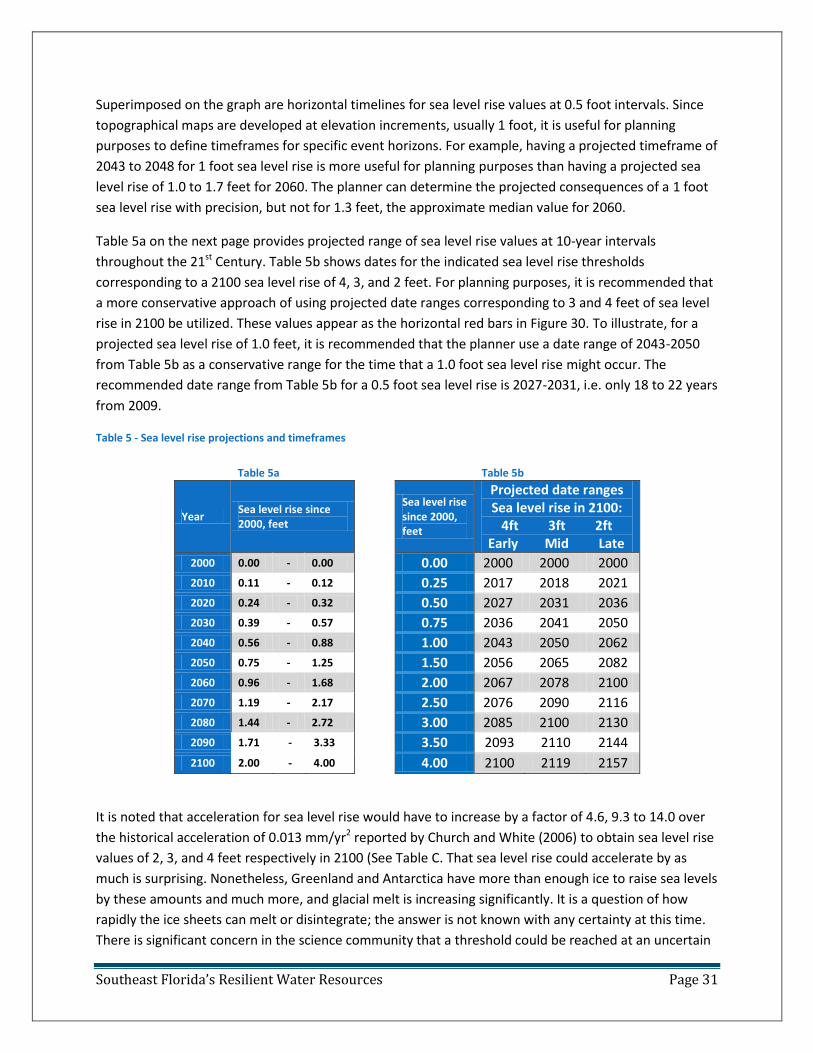
Southeast Florida’s Resilient Water Resources Page 31
Superimposed on the graph are horizontal timelines for sea level rise values at 0.5 foot intervals. Since
topographical maps are developed at elevation increments, usually 1 foot, it is useful for planning
purposes to define timeframes for specific event horizons. For example, having a projected timeframe of
2043 to 2048 for 1 foot sea level rise is more useful for planning purposes than having a projected sea
level rise of 1.0 to 1.7 feet for 2060. The planner can determine the projected consequences of a 1 foot
sea level rise with precision, but not for 1.3 feet, the approximate median value for 2060.
Table 5a on the next page provides projected range of sea level rise values at 10-year intervals
throughout the 21st Century. Table 5b shows dates for the indicated sea level rise thresholds
corresponding to a 2100 sea level rise of 4, 3, and 2 feet. For planning purposes, it is recommended that
a more conservative approach of using projected date ranges corresponding to 3 and 4 feet of sea level
rise in 2100 be utilized. These values appear as the horizontal red bars in Figure 30. To illustrate, for a
projected sea level rise of 1.0 feet, it is recommended that the planner use a date range of 2043-2050
from Table 5b as a conservative range for the time that a 1.0 foot sea level rise might occur. The
recommended date range from Table 5b for a 0.5 foot sea level rise is 2027-2031, i.e. only 18 to 22 years
from 2009.
Table 5 - Sea level rise projections and timeframes
Table 5a Table 5b
Year Sea level rise since 2000, feet
Sea level rise since 2000, feet
Projected date ranges Sea level rise in 2100:
4ft 3ft 2ft Early Mid Late
2000 0.00 - 0.00
0.00 2000 2000 2000
2010 0.11 - 0.12
0.25 2017 2018 2021
2020 0.24 - 0.32
0.50 2027 2031 2036
2030 0.39 - 0.57
0.75 2036 2041 2050
2040 0.56 - 0.88
1.00 2043 2050 2062
2050 0.75 - 1.25
1.50 2056 2065 2082
2060 0.96 - 1.68
2.00 2067 2078 2100
2070 1.19 - 2.17
2.50 2076 2090 2116
2080 1.44 - 2.72
3.00 2085 2100 2130
2090 1.71 - 3.33
3.50 2093 2110 2144
2100 2.00 - 4.00
4.00 2100 2119 2157
It is noted that acceleration for sea level rise would have to increase by a factor of 4.6, 9.3 to 14.0 over
the historical acceleration of 0.013 mm/yr2 reported by Church and White (2006) to obtain sea level rise
values of 2, 3, and 4 feet respectively in 2100 (See Table C. That sea level rise could accelerate by as
much is surprising. Nonetheless, Greenland and Antarctica have more than enough ice to raise sea levels
by these amounts and much more, and glacial melt is increasing significantly. It is a question of how
rapidly the ice sheets can melt or disintegrate; the answer is not known with any certainty at this time.
There is significant concern in the science community that a threshold could be reached at an uncertain
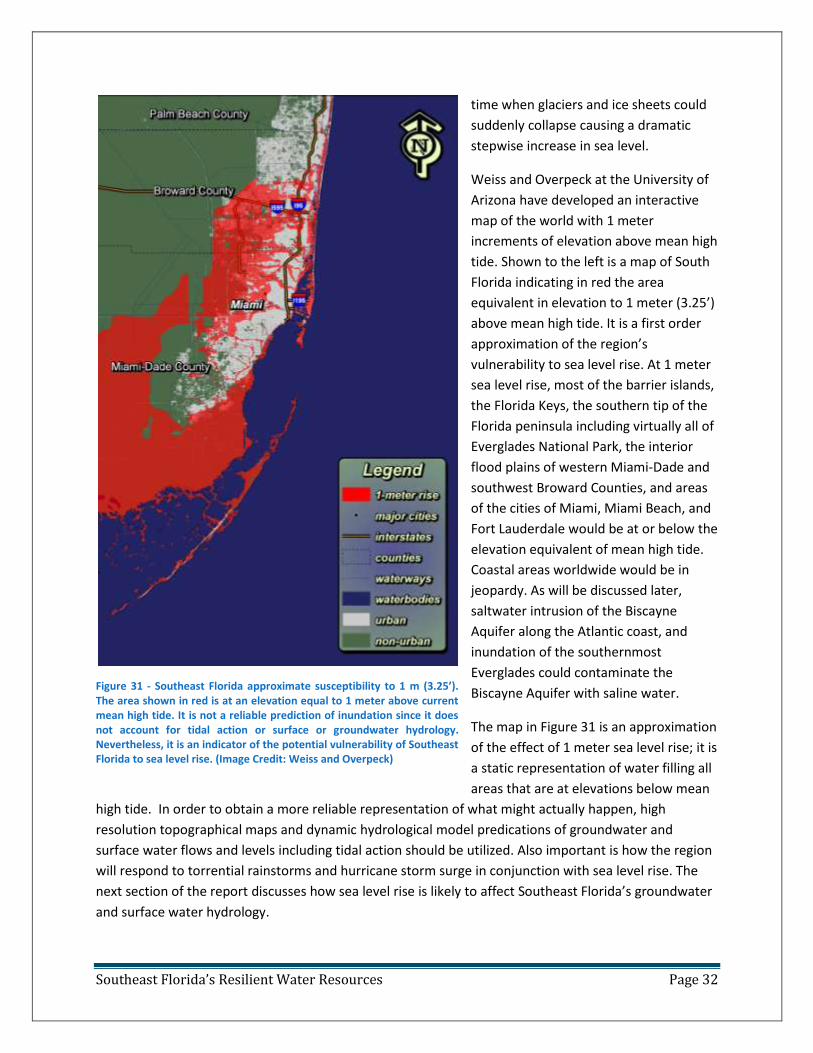
Southeast Florida’s Resilient Water Resources Page 32
Figure 31 - Southeast Florida approximate susceptibility to 1 m (3.25’). The area shown in red is at an elevation equal to 1 meter above current mean high tide. It is not a reliable prediction of inundation since it does not account for tidal action or surface or groundwater hydrology. Nevertheless, it is an indicator of the potential vulnerability of Southeast Florida to sea level rise. (Image Credit: Weiss and Overpeck)
time when glaciers and ice sheets could
suddenly collapse causing a dramatic
stepwise increase in sea level.
Weiss and Overpeck at the University of
Arizona have developed an interactive
map of the world with 1 meter
increments of elevation above mean high
tide. Shown to the left is a map of South
Florida indicating in red the area
equivalent in elevation to 1 meter (3.25’)
above mean high tide. It is a first order
approximation of the region’s
vulnerability to sea level rise. At 1 meter
sea level rise, most of the barrier islands,
the Florida Keys, the southern tip of the
Florida peninsula including virtually all of
Everglades National Park, the interior
flood plains of western Miami-Dade and
southwest Broward Counties, and areas
of the cities of Miami, Miami Beach, and
Fort Lauderdale would be at or below the
elevation equivalent of mean high tide.
Coastal areas worldwide would be in
jeopardy. As will be discussed later,
saltwater intrusion of the Biscayne
Aquifer along the Atlantic coast, and
inundation of the southernmost
Everglades could contaminate the
Biscayne Aquifer with saline water.
The map in Figure 31 is an approximation
of the effect of 1 meter sea level rise; it is
a static representation of water filling all
areas that are at elevations below mean
high tide. In order to obtain a more reliable representation of what might actually happen, high
resolution topographical maps and dynamic hydrological model predications of groundwater and
surface water flows and levels including tidal action should be utilized. Also important is how the region
will respond to torrential rainstorms and hurricane storm surge in conjunction with sea level rise. The
next section of the report discusses how sea level rise is likely to affect Southeast Florida’s groundwater
and surface water hydrology.
Southeast Florida’s Resilient Water Resources Page 33
4.2 Impacts of Sea Level Rise on Southeast Florida’s Water Resources Sea level rise will result in the following impacts on coastal areas (Murley, Heimlich, Bollman, 2008):
1. Inundation of barrier islands and coastal property.
2. Beach erosion.
3. Encroachment of coastal wetlands including the southern Everglades with significant
modification of wetland habitat as they become more saline.
4. Impacts on the region’s water resources, namely the water supply and groundwater and
surface water hydrology.
In this report, we focus upon the hydrological effects that will impact the region’s water resources.
These could include:
1. Saltwater intrusion.
2. Reduced fresh groundwater flow through the aquifer.
3. Compromised stormwater drainage due to rise in the water table causing reduced
groundwater storage capacity and reduced hydraulic gradient between inland surface
waters and sea level.
4. Inland penetration of saline surface waters as a result of hurricane storm surge.
5. Inundation of the southern Everglades watershed with saline water.
4.2.1 Saltwater Intrusion
As sea level rises, the ocean’s hydrostatic head will increase. This would cause the saltwater interface to
migrate inland, especially if the water table is held constant, as has been historically assumed in
extensive hydrological modeling by the USGS and Broward County (Zygnerski & Langevin, 2007)
(Zygnerski M. , 2008). In addition to the extent of saltwater intrusion, sea level rise can affect
groundwater flow and water table height which will seek a new equilibrium with the risen ocean that
depends on the extent of sea level and the rates of rainfall, evapotranspiration, wellfield withdrawals,
stormwater drainage, and lateral groundwater flow in or out at the boundaries of the area under study.
In accordance with the Ghyben-Herzberg Relation, which governs flow in an open coastal aquifer like
the Biscayne Aquifer (Todd & Mays, 2008), and assuming uniform aquifer transmissivity, the depth of
the saltwater interface, z, will be approximately 40 times the height of the water table, h, at equilibrium
according to the equation below, where ρf is the density of freshwater, 1.000 gm/ml, and ρs is the
density of seawater, approximately 1.025 gm/ml. Therefore, the ratio, z/h = ~1.0/(1.025-1.000) = ~40.
𝑧 =
𝜌𝑓(𝜌𝑠 − 𝜌𝑓
) = ~40
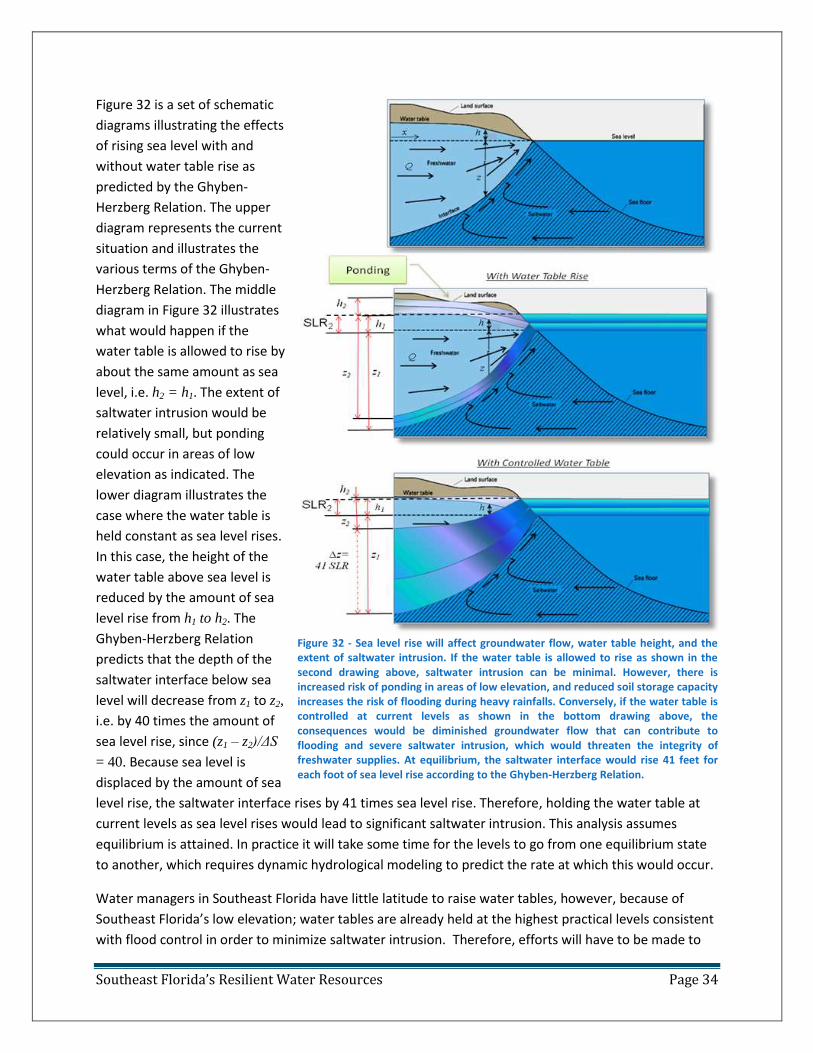
Southeast Florida’s Resilient Water Resources Page 34
Figure 32 - Sea level rise will affect groundwater flow, water table height, and the extent of saltwater intrusion. If the water table is allowed to rise as shown in the second drawing above, saltwater intrusion can be minimal. However, there is increased risk of ponding in areas of low elevation, and reduced soil storage capacity increases the risk of flooding during heavy rainfalls. Conversely, if the water table is controlled at current levels as shown in the bottom drawing above, the consequences would be diminished groundwater flow that can contribute to flooding and severe saltwater intrusion, which would threaten the integrity of freshwater supplies. At equilibrium, the saltwater interface would rise 41 feet for each foot of sea level rise according to the Ghyben-Herzberg Relation.
Figure 32 is a set of schematic
diagrams illustrating the effects
of rising sea level with and
without water table rise as
predicted by the Ghyben-
Herzberg Relation. The upper
diagram represents the current
situation and illustrates the
various terms of the Ghyben-
Herzberg Relation. The middle
diagram in Figure 32 illustrates
what would happen if the
water table is allowed to rise by
about the same amount as sea
level, i.e. h2 = h1. The extent of
saltwater intrusion would be
relatively small, but ponding
could occur in areas of low
elevation as indicated. The
lower diagram illustrates the
case where the water table is
held constant as sea level rises.
In this case, the height of the
water table above sea level is
reduced by the amount of sea
level rise from h1 to h2. The
Ghyben-Herzberg Relation
predicts that the depth of the
saltwater interface below sea
level will decrease from z1 to z2,
i.e. by 40 times the amount of
sea level rise, since (z1 – z2)/ΔS
= 40. Because sea level is
displaced by the amount of sea
level rise, the saltwater interface rises by 41 times sea level rise. Therefore, holding the water table at
current levels as sea level rises would lead to significant saltwater intrusion. This analysis assumes
equilibrium is attained. In practice it will take some time for the levels to go from one equilibrium state
to another, which requires dynamic hydrological modeling to predict the rate at which this would occur.
Water managers in Southeast Florida have little latitude to raise water tables, however, because of
Southeast Florida’s low elevation; water tables are already held at the highest practical levels consistent
with flood control in order to minimize saltwater intrusion. Therefore, efforts will have to be made to
Southeast Florida’s Resilient Water Resources Page 35
hold the water table close to the current level by means of the flood control system. The unfortunate
conclusion for Southeast Florida is that sea level rise would result in extensive saltwater intrusion.
Literature reports indicate that saltwater intrusion can extend by miles inland as a consequence of sea
level rise (Placeholder3). Other means that can be used to protect wellfields from saltwater intrusion are
discussed in Section 5.2 and include hydrodynamic barriers, horizontal wells, relocation of salinity
structures, and relocation of wellfields away from the saltwater interface.
While considering of the hydrological science concerning this issue, it became apparent that the effect
of sea level rise on groundwater flow, stormwater runoff, water table level, and flood control has not
been extensively evaluated to date in hydrological modeling or by local water managers and decision
makers. As we delved into these issues, it was concluded that sea level rise will not only threaten
saltwater intrusion in Southeast Florida, but it could substantially increase the risk of flooding as
discussed in the next section.
4.2.2 The Effect of Sea Level Rise on Groundwater and Surface Water Flow
The theoretical analysis that follows is based upon established hydrological theory and it should be
subjected to further study and verification including testing with integrated surface and groundwater
hydrological models that can predict the effects of sea level rise, seasonal rainfall patterns, and heavy
rainfall events.
Maintaining the water table as sea level rise progresses at current levels may become increasingly
difficult and costly. Sea level may rise to the point where it may become impossible or impractical to
prevent the water table from rising with increased risk of flooding as a consequence. Surprisingly,
hydrological theory predicts that maintaining water tables at current levels as sea level rises may also
lead to increased susceptibility to flooding.
Sea level rise is likely to result in:
1. Increased risk of severe flooding during heavy rainfall events.
2. Reduced effectiveness of flood control and stormwater drainage systems.
3. Increased water table levels that could increase the risk of flooding.
4. Reduced groundwater flow through the aquifer to the ocean.
5. Reduced availability of fresh water potable use, especially during the dry season.
Complicating these concerns, climate change is expected to cause more intense rainfall events, such as
more severe thunderstorms and tropical cyclones (IPCC, 2007); (Karl, etal, USCCSP, & NOAA, 2009).
The effects of sea level rise on open coastal aquifer using an idealized hydrological model were studied
by Werner and Simmons (2009) in two distinct cases: 1) where water table level is held constant and 2)
persistent flow of groundwater discharge to the sea despite increased sea level. In the constant water
table case, reduced groundwater flow and significant saltwater intrusion is predicted. In the persistent
flow case, rise of the water table is predicted and saltwater intrusion would be substantially reduced as
is illustrated in Figure 32.
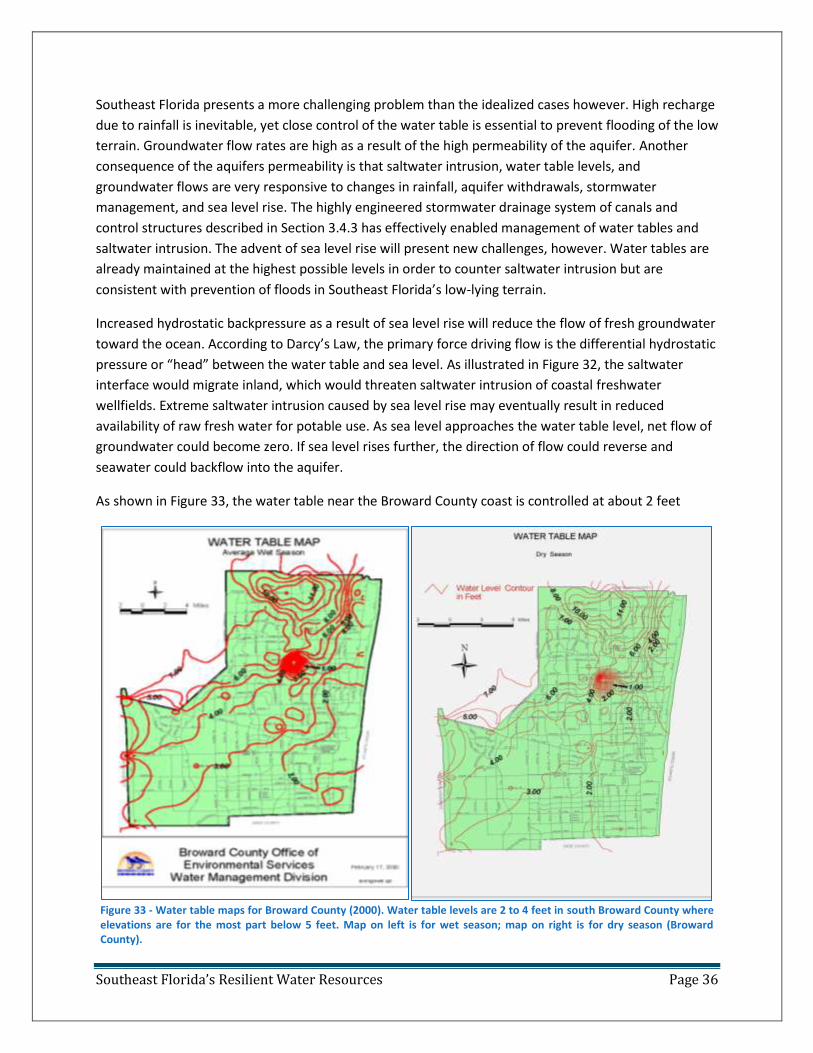
Southeast Florida’s Resilient Water Resources Page 36
Southeast Florida presents a more challenging problem than the idealized cases however. High recharge
due to rainfall is inevitable, yet close control of the water table is essential to prevent flooding of the low
terrain. Groundwater flow rates are high as a result of the high permeability of the aquifer. Another
consequence of the aquifers permeability is that saltwater intrusion, water table levels, and
groundwater flows are very responsive to changes in rainfall, aquifer withdrawals, stormwater
management, and sea level rise. The highly engineered stormwater drainage system of canals and
control structures described in Section 3.4.3 has effectively enabled management of water tables and
saltwater intrusion. The advent of sea level rise will present new challenges, however. Water tables are
already maintained at the highest possible levels in order to counter saltwater intrusion but are
consistent with prevention of floods in Southeast Florida’s low-lying terrain.
Increased hydrostatic backpressure as a result of sea level rise will reduce the flow of fresh groundwater
toward the ocean. According to Darcy’s Law, the primary force driving flow is the differential hydrostatic
pressure or “head” between the water table and sea level. As illustrated in Figure 32, the saltwater
interface would migrate inland, which would threaten saltwater intrusion of coastal freshwater
wellfields. Extreme saltwater intrusion caused by sea level rise may eventually result in reduced
availability of raw fresh water for potable use. As sea level approaches the water table level, net flow of
groundwater could become zero. If sea level rises further, the direction of flow could reverse and
seawater could backflow into the aquifer.
As shown in Figure 33, the water table near the Broward County coast is controlled at about 2 feet
Figure 33 - Water table maps for Broward County (2000). Water table levels are 2 to 4 feet in south Broward County where elevations are for the most part below 5 feet. Map on left is for wet season; map on right is for dry season (Broward County).
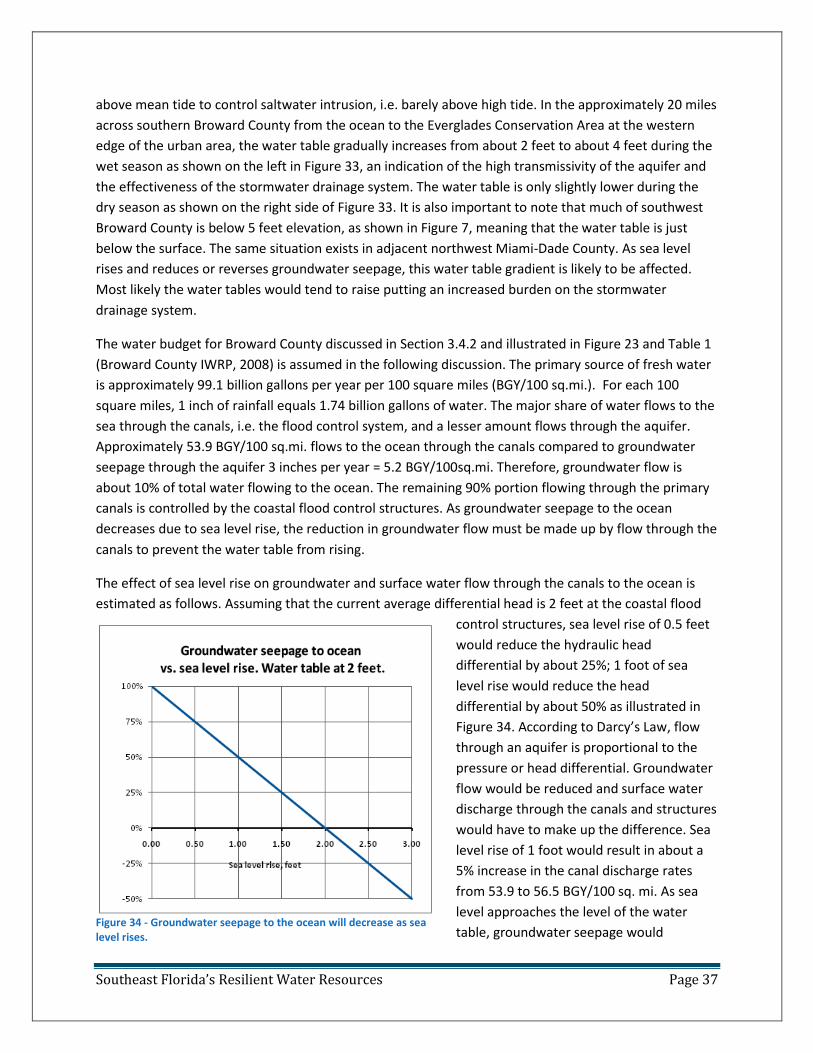
Southeast Florida’s Resilient Water Resources Page 37
above mean tide to control saltwater intrusion, i.e. barely above high tide. In the approximately 20 miles
across southern Broward County from the ocean to the Everglades Conservation Area at the western
edge of the urban area, the water table gradually increases from about 2 feet to about 4 feet during the
wet season as shown on the left in Figure 33, an indication of the high transmissivity of the aquifer and
the effectiveness of the stormwater drainage system. The water table is only slightly lower during the
dry season as shown on the right side of Figure 33. It is also important to note that much of southwest
Broward County is below 5 feet elevation, as shown in Figure 7, meaning that the water table is just
below the surface. The same situation exists in adjacent northwest Miami-Dade County. As sea level
rises and reduces or reverses groundwater seepage, this water table gradient is likely to be affected.
Most likely the water tables would tend to raise putting an increased burden on the stormwater
drainage system.
The water budget for Broward County discussed in Section 3.4.2 and illustrated in Figure 23 and Table 1
(Broward County IWRP, 2008) is assumed in the following discussion. The primary source of fresh water
is approximately 99.1 billion gallons per year per 100 square miles (BGY/100 sq.mi.). For each 100
square miles, 1 inch of rainfall equals 1.74 billion gallons of water. The major share of water flows to the
sea through the canals, i.e. the flood control system, and a lesser amount flows through the aquifer.
Approximately 53.9 BGY/100 sq.mi. flows to the ocean through the canals compared to groundwater
seepage through the aquifer 3 inches per year = 5.2 BGY/100sq.mi. Therefore, groundwater flow is
about 10% of total water flowing to the ocean. The remaining 90% portion flowing through the primary
canals is controlled by the coastal flood control structures. As groundwater seepage to the ocean
decreases due to sea level rise, the reduction in groundwater flow must be made up by flow through the
canals to prevent the water table from rising.
The effect of sea level rise on groundwater and surface water flow through the canals to the ocean is
estimated as follows. Assuming that the current average differential head is 2 feet at the coastal flood
control structures, sea level rise of 0.5 feet
would reduce the hydraulic head
differential by about 25%; 1 foot of sea
level rise would reduce the head
differential by about 50% as illustrated in
Figure 34. According to Darcy’s Law, flow
through an aquifer is proportional to the
pressure or head differential. Groundwater
flow would be reduced and surface water
discharge through the canals and structures
would have to make up the difference. Sea
level rise of 1 foot would result in about a
5% increase in the canal discharge rates
from 53.9 to 56.5 BGY/100 sq. mi. As sea
level approaches the level of the water
table, groundwater seepage would Figure 34 - Groundwater seepage to the ocean will decrease as sea level rises.
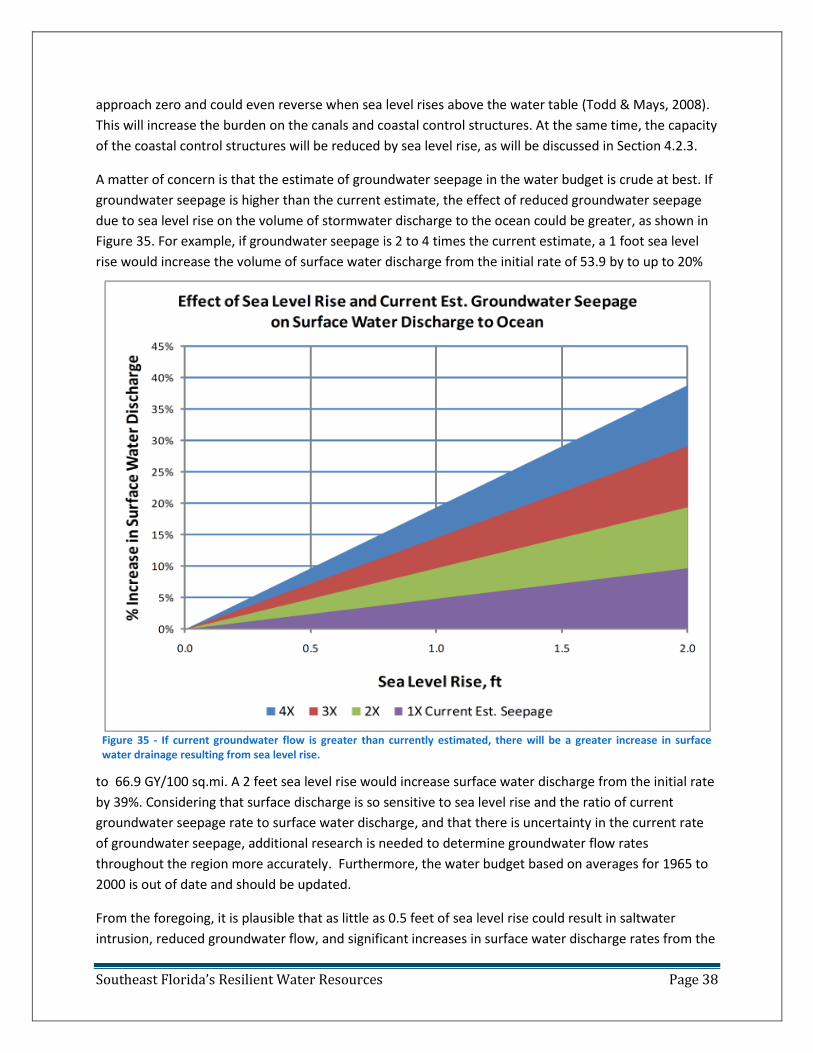
Southeast Florida’s Resilient Water Resources Page 38
approach zero and could even reverse when sea level rises above the water table (Todd & Mays, 2008).
This will increase the burden on the canals and coastal control structures. At the same time, the capacity
of the coastal control structures will be reduced by sea level rise, as will be discussed in Section 4.2.3.
A matter of concern is that the estimate of groundwater seepage in the water budget is crude at best. If
groundwater seepage is higher than the current estimate, the effect of reduced groundwater seepage
due to sea level rise on the volume of stormwater discharge to the ocean could be greater, as shown in
Figure 35. For example, if groundwater seepage is 2 to 4 times the current estimate, a 1 foot sea level
rise would increase the volume of surface water discharge from the initial rate of 53.9 by to up to 20%
to 66.9 GY/100 sq.mi. A 2 feet sea level rise would increase surface water discharge from the initial rate
by 39%. Considering that surface discharge is so sensitive to sea level rise and the ratio of current
groundwater seepage rate to surface water discharge, and that there is uncertainty in the current rate
of groundwater seepage, additional research is needed to determine groundwater flow rates
throughout the region more accurately. Furthermore, the water budget based on averages for 1965 to
2000 is out of date and should be updated.
From the foregoing, it is plausible that as little as 0.5 feet of sea level rise could result in saltwater
intrusion, reduced groundwater flow, and significant increases in surface water discharge rates from the
Figure 35 - If current groundwater flow is greater than currently estimated, there will be a greater increase in surface water drainage resulting from sea level rise.

Southeast Florida’s Resilient Water Resources Page 39
canals and coastal control structures. As explained in the next section, sea level rise will also reduce the
capacity of the coastal flood control structures and increase the risk of flooding.
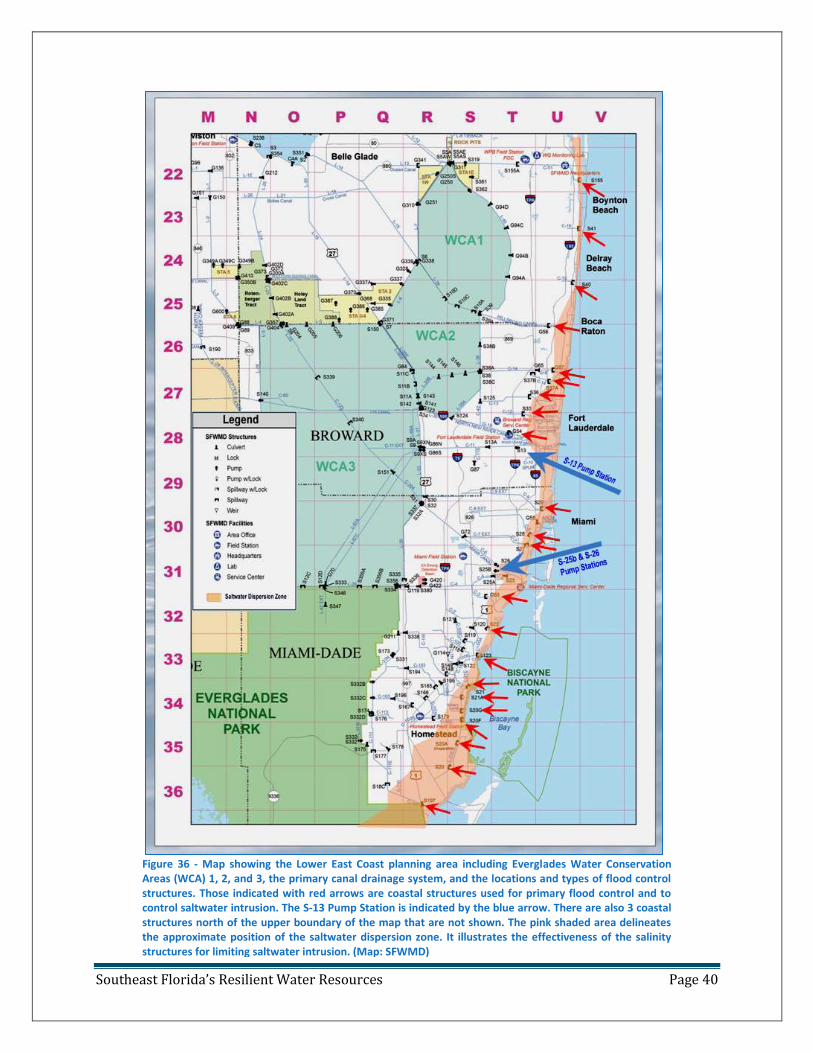
Southeast Florida’s Resilient Water Resources Page 40
Figure 36 - Map showing the Lower East Coast planning area including Everglades Water Conservation Areas (WCA) 1, 2, and 3, the primary canal drainage system, and the locations and types of flood control structures. Those indicated with red arrows are coastal structures used for primary flood control and to control saltwater intrusion. The S-13 Pump Station is indicated by the blue arrow. There are also 3 coastal structures north of the upper boundary of the map that are not shown. The pink shaded area delineates the approximate position of the saltwater dispersion zone. It illustrates the effectiveness of the salinity structures for limiting saltwater intrusion. (Map: SFWMD)
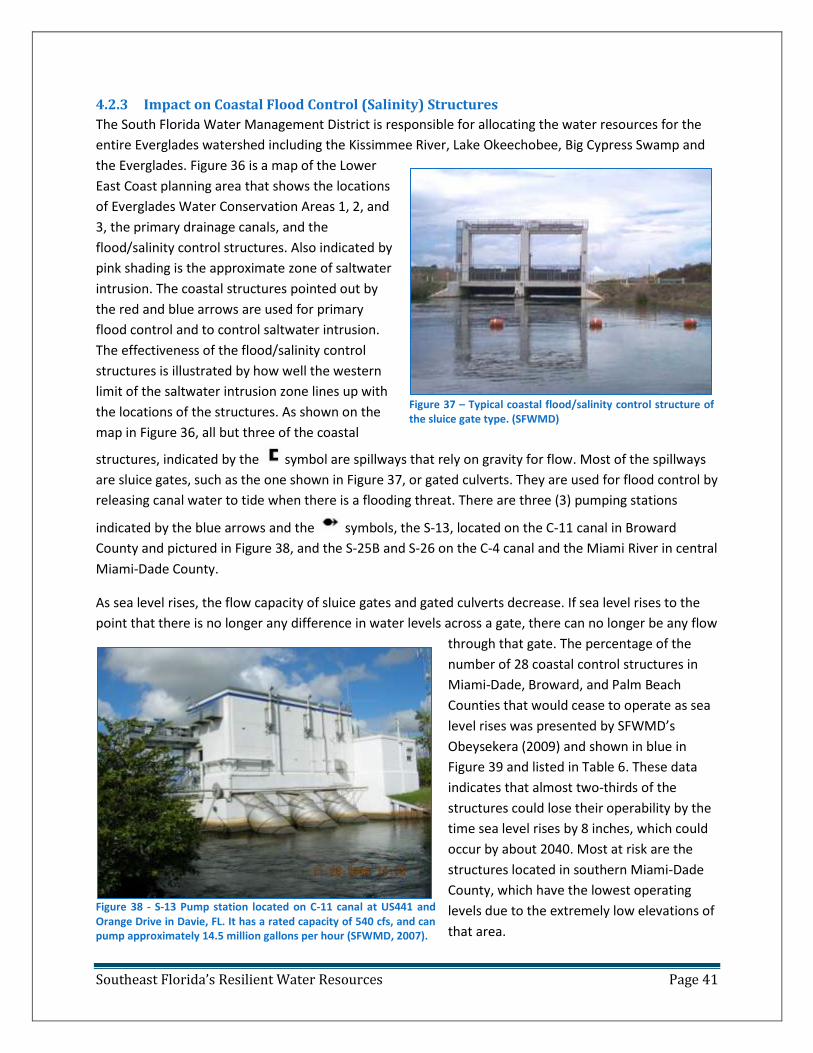
Southeast Florida’s Resilient Water Resources Page 41
Figure 38 - S-13 Pump station located on C-11 canal at US441 and Orange Drive in Davie, FL. It has a rated capacity of 540 cfs, and can pump approximately 14.5 million gallons per hour (SFWMD, 2007).
4.2.3 Impact on Coastal Flood Control (Salinity) Structures
The South Florida Water Management District is responsible for allocating the water resources for the
entire Everglades watershed including the Kissimmee River, Lake Okeechobee, Big Cypress Swamp and
the Everglades. Figure 36 is a map of the Lower
East Coast planning area that shows the locations
of Everglades Water Conservation Areas 1, 2, and
3, the primary drainage canals, and the
flood/salinity control structures. Also indicated by
pink shading is the approximate zone of saltwater
intrusion. The coastal structures pointed out by
the red and blue arrows are used for primary
flood control and to control saltwater intrusion.
The effectiveness of the flood/salinity control
structures is illustrated by how well the western
limit of the saltwater intrusion zone lines up with
the locations of the structures. As shown on the
map in Figure 36, all but three of the coastal
structures, indicated by the symbol are spillways that rely on gravity for flow. Most of the spillways
are sluice gates, such as the one shown in Figure 37, or gated culverts. They are used for flood control by
releasing canal water to tide when there is a flooding threat. There are three (3) pumping stations
indicated by the blue arrows and the symbols, the S-13, located on the C-11 canal in Broward
County and pictured in Figure 38, and the S-25B and S-26 on the C-4 canal and the Miami River in central
Miami-Dade County.
As sea level rises, the flow capacity of sluice gates and gated culverts decrease. If sea level rises to the
point that there is no longer any difference in water levels across a gate, there can no longer be any flow
through that gate. The percentage of the
number of 28 coastal control structures in
Miami-Dade, Broward, and Palm Beach
Counties that would cease to operate as sea
level rises was presented by SFWMD’s
Obeysekera (2009) and shown in blue in
Figure 39 and listed in Table 6. These data
indicates that almost two-thirds of the
structures could lose their operability by the
time sea level rises by 8 inches, which could
occur by about 2040. Most at risk are the
structures located in southern Miami-Dade
County, which have the lowest operating
levels due to the extremely low elevations of
that area.
Figure 37 – Typical coastal flood/salinity control structure of the sluice gate type. (SFWMD)
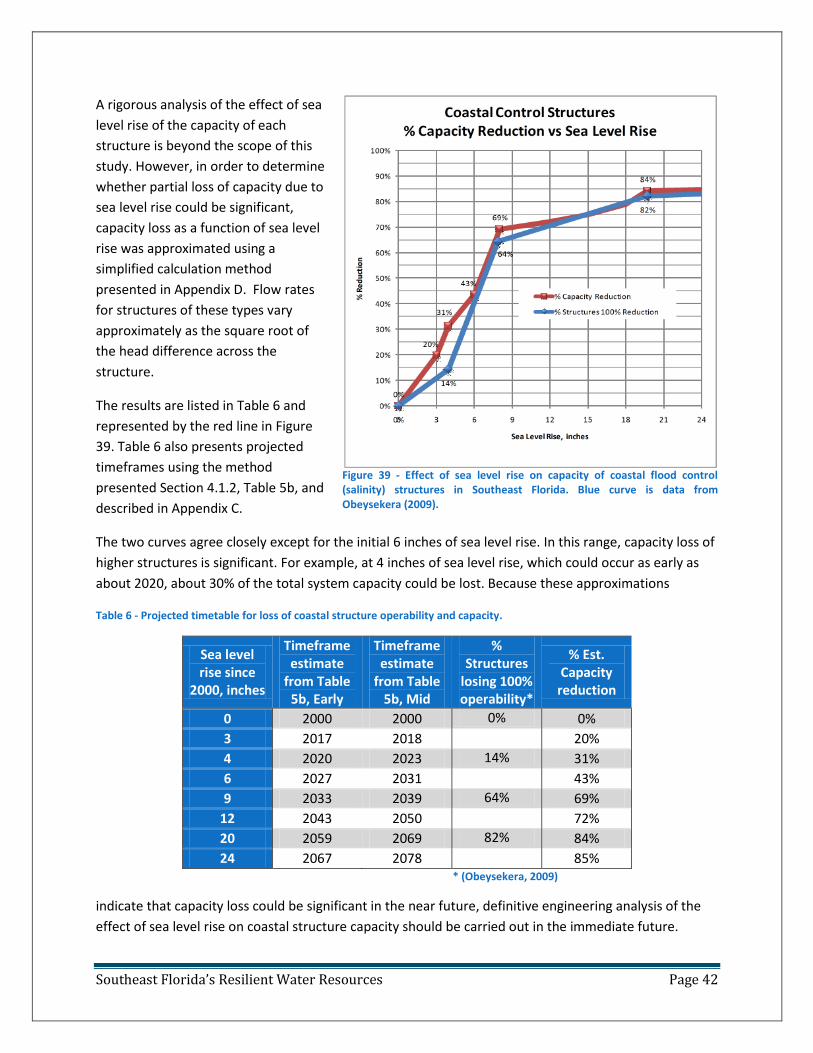
Southeast Florida’s Resilient Water Resources Page 42
A rigorous analysis of the effect of sea
level rise of the capacity of each
structure is beyond the scope of this
study. However, in order to determine
whether partial loss of capacity due to
sea level rise could be significant,
capacity loss as a function of sea level
rise was approximated using a
simplified calculation method
presented in Appendix D. Flow rates
for structures of these types vary
approximately as the square root of
the head difference across the
structure.
The results are listed in Table 6 and
represented by the red line in Figure
39. Table 6 also presents projected
timeframes using the method
presented Section 4.1.2, Table 5b, and
described in Appendix C.
The two curves agree closely except for the initial 6 inches of sea level rise. In this range, capacity loss of
higher structures is significant. For example, at 4 inches of sea level rise, which could occur as early as
about 2020, about 30% of the total system capacity could be lost. Because these approximations
Table 6 - Projected timetable for loss of coastal structure operability and capacity.
Sea level rise since
2000, inches
Timeframe estimate
from Table 5b, Early
Timeframe estimate
from Table 5b, Mid
% Structures
losing 100% operability*
% Est. Capacity
reduction
0 2000 2000 0% 0%
3 2017 2018 20%
4 2020 2023 14% 31%
6 2027 2031 43%
9 2033 2039 64% 69%
12 2043 2050 72%
20 2059 2069 82% 84%
24 2067 2078 85% * (Obeysekera, 2009)
indicate that capacity loss could be significant in the near future, definitive engineering analysis of the
effect of sea level rise on coastal structure capacity should be carried out in the immediate future.
Figure 39 - Effect of sea level rise on capacity of coastal flood control (salinity) structures in Southeast Florida. Blue curve is data from Obeysekera (2009).
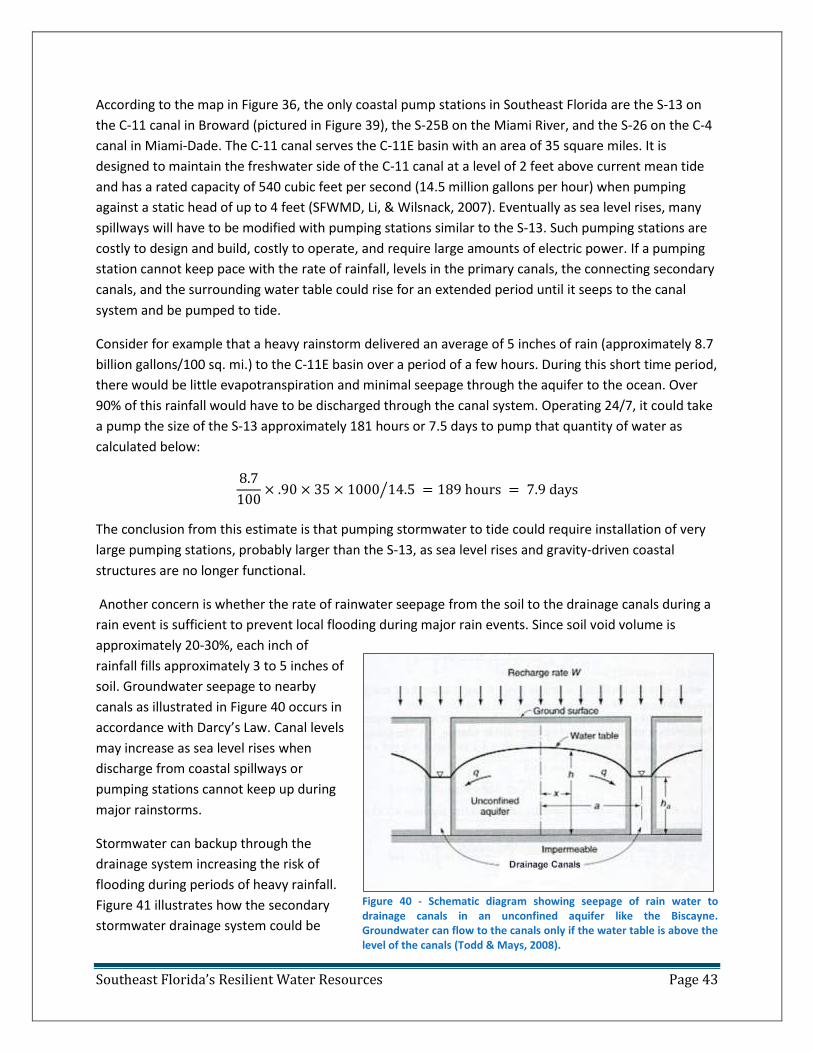
Southeast Florida’s Resilient Water Resources Page 43
According to the map in Figure 36, the only coastal pump stations in Southeast Florida are the S-13 on
the C-11 canal in Broward (pictured in Figure 39), the S-25B on the Miami River, and the S-26 on the C-4
canal in Miami-Dade. The C-11 canal serves the C-11E basin with an area of 35 square miles. It is
designed to maintain the freshwater side of the C-11 canal at a level of 2 feet above current mean tide
and has a rated capacity of 540 cubic feet per second (14.5 million gallons per hour) when pumping
against a static head of up to 4 feet (SFWMD, Li, & Wilsnack, 2007). Eventually as sea level rises, many
spillways will have to be modified with pumping stations similar to the S-13. Such pumping stations are
costly to design and build, costly to operate, and require large amounts of electric power. If a pumping
station cannot keep pace with the rate of rainfall, levels in the primary canals, the connecting secondary
canals, and the surrounding water table could rise for an extended period until it seeps to the canal
system and be pumped to tide.
Consider for example that a heavy rainstorm delivered an average of 5 inches of rain (approximately 8.7
billion gallons/100 sq. mi.) to the C-11E basin over a period of a few hours. During this short time period,
there would be little evapotranspiration and minimal seepage through the aquifer to the ocean. Over
90% of this rainfall would have to be discharged through the canal system. Operating 24/7, it could take
a pump the size of the S-13 approximately 181 hours or 7.5 days to pump that quantity of water as
calculated below:
8.7
100× .90 × 35 × 1000 14.5 = 189 hours = 7.9 days
The conclusion from this estimate is that pumping stormwater to tide could require installation of very
large pumping stations, probably larger than the S-13, as sea level rises and gravity-driven coastal
structures are no longer functional.
Another concern is whether the rate of rainwater seepage from the soil to the drainage canals during a
rain event is sufficient to prevent local flooding during major rain events. Since soil void volume is
approximately 20-30%, each inch of
rainfall fills approximately 3 to 5 inches of
soil. Groundwater seepage to nearby
canals as illustrated in Figure 40 occurs in
accordance with Darcy’s Law. Canal levels
may increase as sea level rises when
discharge from coastal spillways or
pumping stations cannot keep up during
major rainstorms.
Stormwater can backup through the
drainage system increasing the risk of
flooding during periods of heavy rainfall.
Figure 41 illustrates how the secondary
stormwater drainage system could be
Figure 40 - Schematic diagram showing seepage of rain water to drainage canals in an unconfined aquifer like the Biscayne. Groundwater can flow to the canals only if the water table is above the level of the canals (Todd & Mays, 2008).
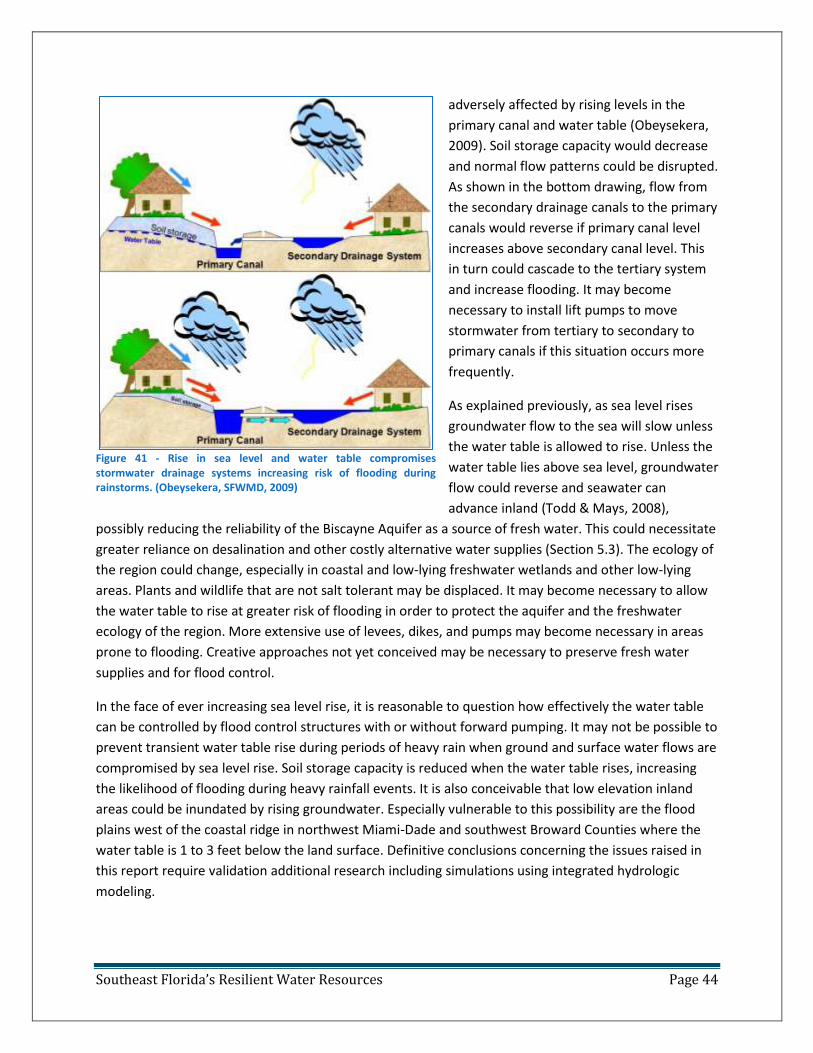
Southeast Florida’s Resilient Water Resources Page 44
adversely affected by rising levels in the
primary canal and water table (Obeysekera,
2009). Soil storage capacity would decrease
and normal flow patterns could be disrupted.
As shown in the bottom drawing, flow from
the secondary drainage canals to the primary
canals would reverse if primary canal level
increases above secondary canal level. This
in turn could cascade to the tertiary system
and increase flooding. It may become
necessary to install lift pumps to move
stormwater from tertiary to secondary to
primary canals if this situation occurs more
frequently.
As explained previously, as sea level rises
groundwater flow to the sea will slow unless
the water table is allowed to rise. Unless the
water table lies above sea level, groundwater
flow could reverse and seawater can
advance inland (Todd & Mays, 2008),
possibly reducing the reliability of the Biscayne Aquifer as a source of fresh water. This could necessitate
greater reliance on desalination and other costly alternative water supplies (Section 5.3). The ecology of
the region could change, especially in coastal and low-lying freshwater wetlands and other low-lying
areas. Plants and wildlife that are not salt tolerant may be displaced. It may become necessary to allow
the water table to rise at greater risk of flooding in order to protect the aquifer and the freshwater
ecology of the region. More extensive use of levees, dikes, and pumps may become necessary in areas
prone to flooding. Creative approaches not yet conceived may be necessary to preserve fresh water
supplies and for flood control.
In the face of ever increasing sea level rise, it is reasonable to question how effectively the water table
can be controlled by flood control structures with or without forward pumping. It may not be possible to
prevent transient water table rise during periods of heavy rain when ground and surface water flows are
compromised by sea level rise. Soil storage capacity is reduced when the water table rises, increasing
the likelihood of flooding during heavy rainfall events. It is also conceivable that low elevation inland
areas could be inundated by rising groundwater. Especially vulnerable to this possibility are the flood
plains west of the coastal ridge in northwest Miami-Dade and southwest Broward Counties where the
water table is 1 to 3 feet below the land surface. Definitive conclusions concerning the issues raised in
this report require validation additional research including simulations using integrated hydrologic
modeling.
Figure 41 - Rise in sea level and water table compromises stormwater drainage systems increasing risk of flooding during rainstorms. (Obeysekera, SFWMD, 2009)
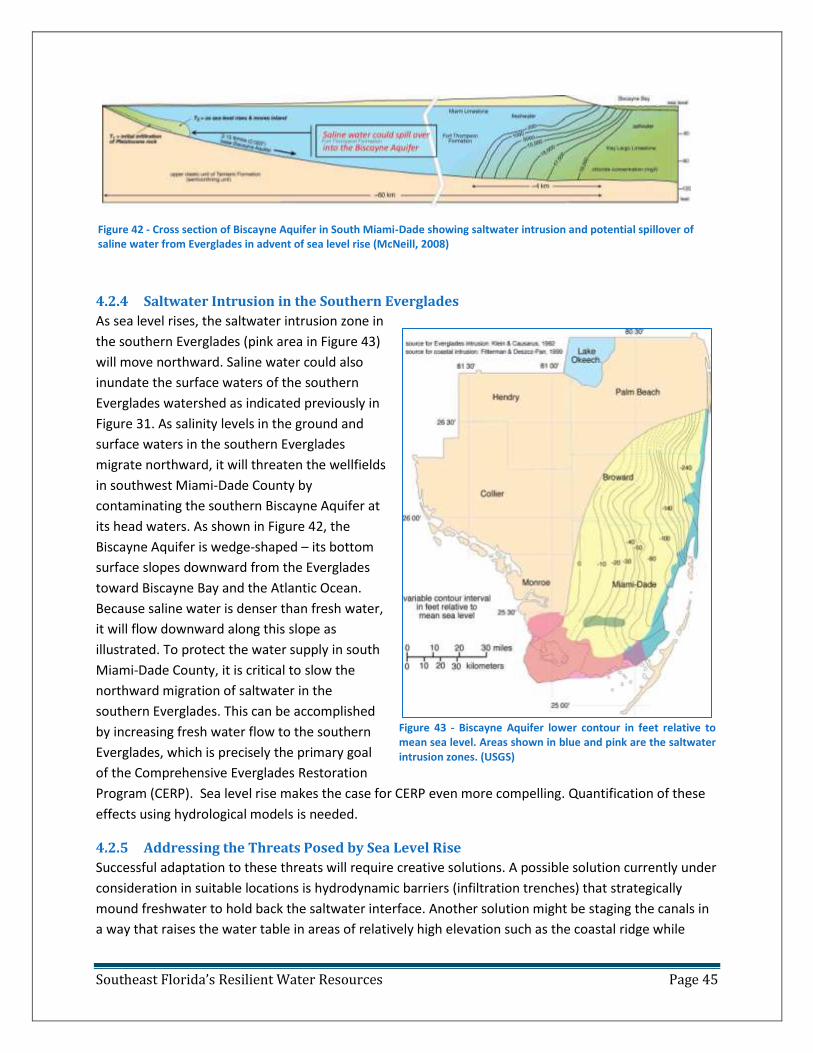
Southeast Florida’s Resilient Water Resources Page 45
4.2.4 Saltwater Intrusion in the Southern Everglades
As sea level rises, the saltwater intrusion zone in
the southern Everglades (pink area in Figure 43)
will move northward. Saline water could also
inundate the surface waters of the southern
Everglades watershed as indicated previously in
Figure 31. As salinity levels in the ground and
surface waters in the southern Everglades
migrate northward, it will threaten the wellfields
in southwest Miami-Dade County by
contaminating the southern Biscayne Aquifer at
its head waters. As shown in Figure 42, the
Biscayne Aquifer is wedge-shaped – its bottom
surface slopes downward from the Everglades
toward Biscayne Bay and the Atlantic Ocean.
Because saline water is denser than fresh water,
it will flow downward along this slope as
illustrated. To protect the water supply in south
Miami-Dade County, it is critical to slow the
northward migration of saltwater in the
southern Everglades. This can be accomplished
by increasing fresh water flow to the southern
Everglades, which is precisely the primary goal
of the Comprehensive Everglades Restoration
Program (CERP). Sea level rise makes the case for CERP even more compelling. Quantification of these
effects using hydrological models is needed.
4.2.5 Addressing the Threats Posed by Sea Level Rise
Successful adaptation to these threats will require creative solutions. A possible solution currently under
consideration in suitable locations is hydrodynamic barriers (infiltration trenches) that strategically
mound freshwater to hold back the saltwater interface. Another solution might be staging the canals in
a way that raises the water table in areas of relatively high elevation such as the coastal ridge while
Figure 43 - Biscayne Aquifer lower contour in feet relative to mean sea level. Areas shown in blue and pink are the saltwater intrusion zones. (USGS)
Figure 42 - Cross section of Biscayne Aquifer in South Miami-Dade showing saltwater intrusion and potential spillover of saline water from Everglades in advent of sea level rise (McNeill, 2008)
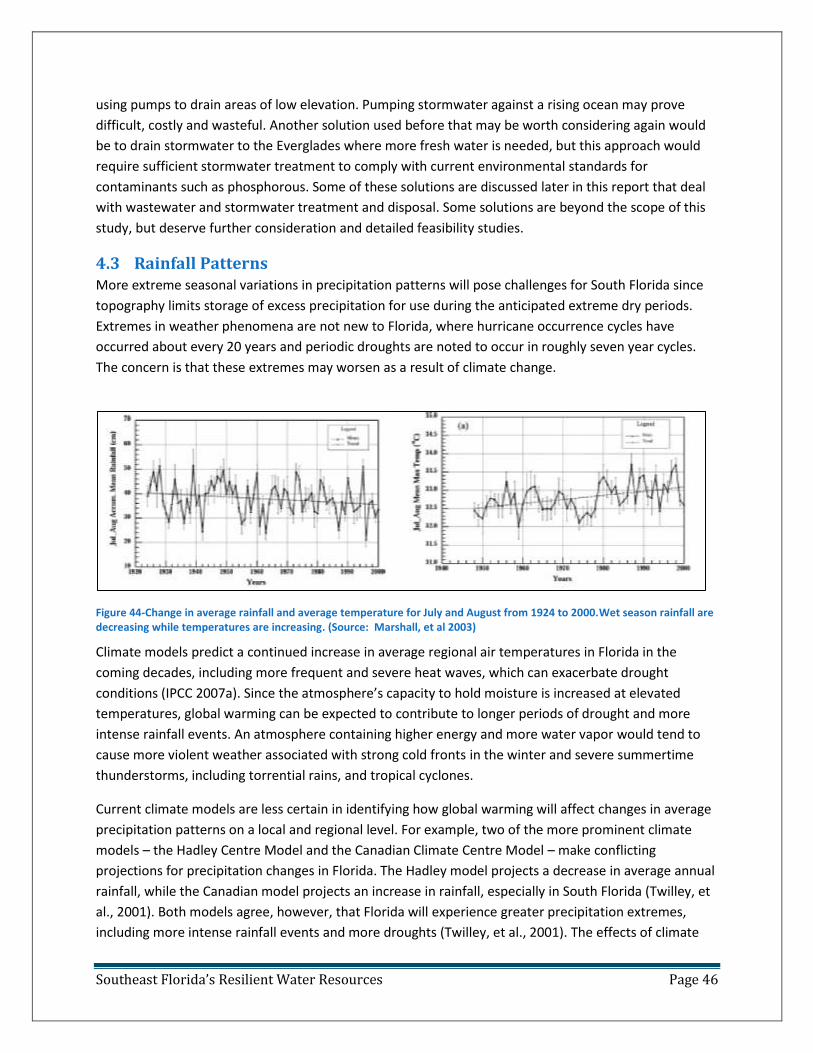
Southeast Florida’s Resilient Water Resources Page 46
using pumps to drain areas of low elevation. Pumping stormwater against a rising ocean may prove
difficult, costly and wasteful. Another solution used before that may be worth considering again would
be to drain stormwater to the Everglades where more fresh water is needed, but this approach would
require sufficient stormwater treatment to comply with current environmental standards for
contaminants such as phosphorous. Some of these solutions are discussed later in this report that deal
with wastewater and stormwater treatment and disposal. Some solutions are beyond the scope of this
study, but deserve further consideration and detailed feasibility studies.
4.3 Rainfall Patterns More extreme seasonal variations in precipitation patterns will pose challenges for South Florida since
topography limits storage of excess precipitation for use during the anticipated extreme dry periods.
Extremes in weather phenomena are not new to Florida, where hurricane occurrence cycles have
occurred about every 20 years and periodic droughts are noted to occur in roughly seven year cycles.
The concern is that these extremes may worsen as a result of climate change.
Climate models predict a continued increase in average regional air temperatures in Florida in the
coming decades, including more frequent and severe heat waves, which can exacerbate drought
conditions (IPCC 2007a). Since the atmosphere’s capacity to hold moisture is increased at elevated
temperatures, global warming can be expected to contribute to longer periods of drought and more
intense rainfall events. An atmosphere containing higher energy and more water vapor would tend to
cause more violent weather associated with strong cold fronts in the winter and severe summertime
thunderstorms, including torrential rains, and tropical cyclones.
Current climate models are less certain in identifying how global warming will affect changes in average
precipitation patterns on a local and regional level. For example, two of the more prominent climate
models – the Hadley Centre Model and the Canadian Climate Centre Model – make conflicting
projections for precipitation changes in Florida. The Hadley model projects a decrease in average annual
rainfall, while the Canadian model projects an increase in rainfall, especially in South Florida (Twilley, et
al., 2001). Both models agree, however, that Florida will experience greater precipitation extremes,
including more intense rainfall events and more droughts (Twilley, et al., 2001). The effects of climate
Figure 44-Change in average rainfall and average temperature for July and August from 1924 to 2000.Wet season rainfall are decreasing while temperatures are increasing. (Source: Marshall, et al 2003)
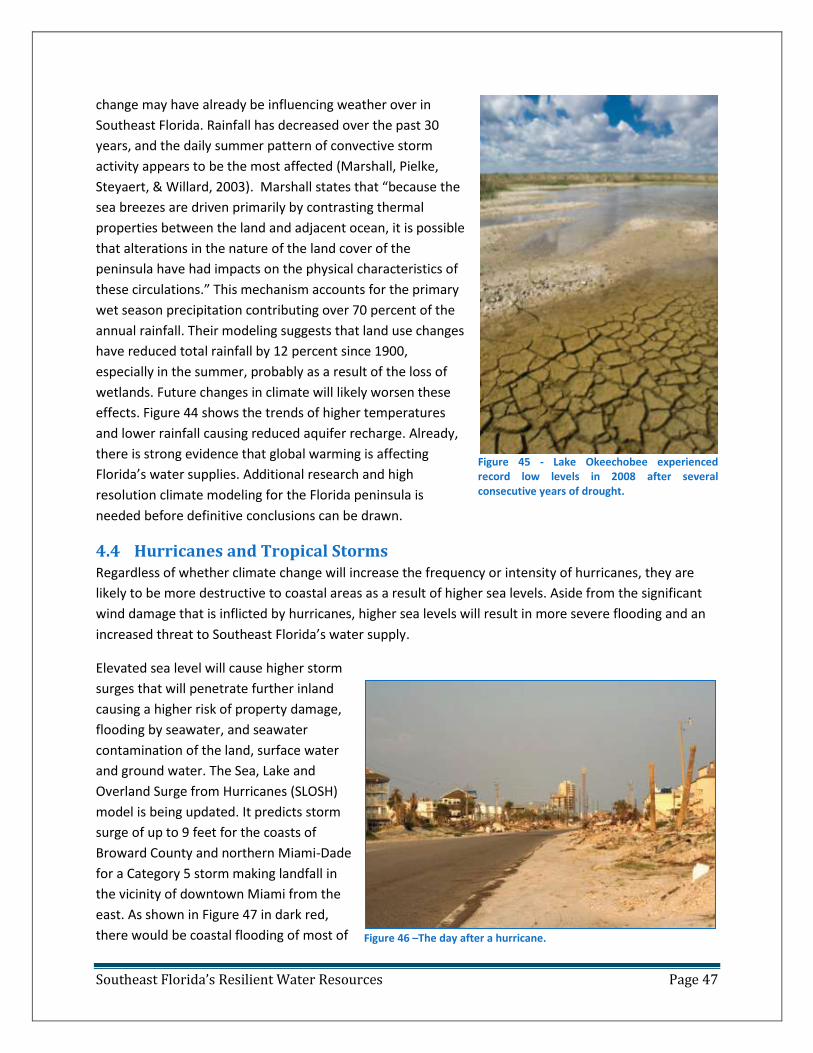
Southeast Florida’s Resilient Water Resources Page 47
change may have already be influencing weather over in
Southeast Florida. Rainfall has decreased over the past 30
years, and the daily summer pattern of convective storm
activity appears to be the most affected (Marshall, Pielke,
Steyaert, & Willard, 2003). Marshall states that “because the
sea breezes are driven primarily by contrasting thermal
properties between the land and adjacent ocean, it is possible
that alterations in the nature of the land cover of the
peninsula have had impacts on the physical characteristics of
these circulations.” This mechanism accounts for the primary
wet season precipitation contributing over 70 percent of the
annual rainfall. Their modeling suggests that land use changes
have reduced total rainfall by 12 percent since 1900,
especially in the summer, probably as a result of the loss of
wetlands. Future changes in climate will likely worsen these
effects. Figure 44 shows the trends of higher temperatures
and lower rainfall causing reduced aquifer recharge. Already,
there is strong evidence that global warming is affecting
Florida’s water supplies. Additional research and high
resolution climate modeling for the Florida peninsula is
needed before definitive conclusions can be drawn.
4.4 Hurricanes and Tropical Storms Regardless of whether climate change will increase the frequency or intensity of hurricanes, they are
likely to be more destructive to coastal areas as a result of higher sea levels. Aside from the significant
wind damage that is inflicted by hurricanes, higher sea levels will result in more severe flooding and an
increased threat to Southeast Florida’s water supply.
Elevated sea level will cause higher storm
surges that will penetrate further inland
causing a higher risk of property damage,
flooding by seawater, and seawater
contamination of the land, surface water
and ground water. The Sea, Lake and
Overland Surge from Hurricanes (SLOSH)
model is being updated. It predicts storm
surge of up to 9 feet for the coasts of
Broward County and northern Miami-Dade
for a Category 5 storm making landfall in
the vicinity of downtown Miami from the
east. As shown in Figure 47 in dark red,
there would be coastal flooding of most of
Figure 46 –The day after a hurricane.
Figure 45 - Lake Okeechobee experienced record low levels in 2008 after several consecutive years of drought.
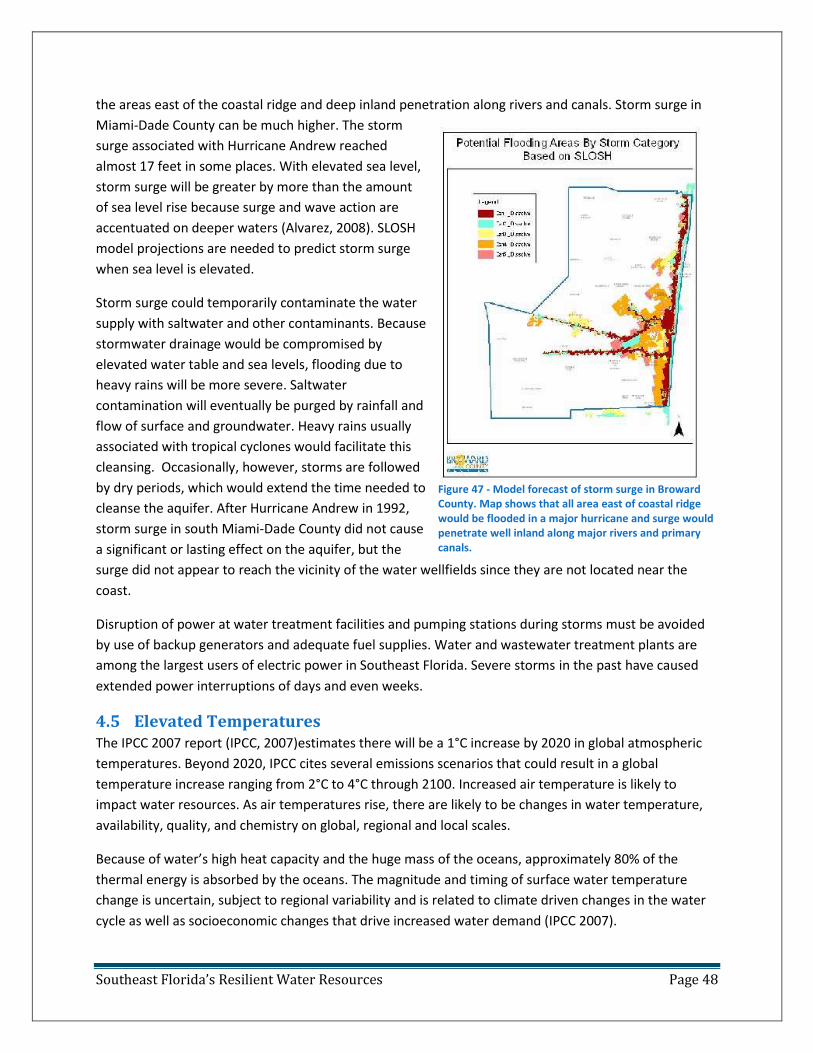
Southeast Florida’s Resilient Water Resources Page 48
the areas east of the coastal ridge and deep inland penetration along rivers and canals. Storm surge in
Miami-Dade County can be much higher. The storm
surge associated with Hurricane Andrew reached
almost 17 feet in some places. With elevated sea level,
storm surge will be greater by more than the amount
of sea level rise because surge and wave action are
accentuated on deeper waters (Alvarez, 2008). SLOSH
model projections are needed to predict storm surge
when sea level is elevated.
Storm surge could temporarily contaminate the water
supply with saltwater and other contaminants. Because
stormwater drainage would be compromised by
elevated water table and sea levels, flooding due to
heavy rains will be more severe. Saltwater
contamination will eventually be purged by rainfall and
flow of surface and groundwater. Heavy rains usually
associated with tropical cyclones would facilitate this
cleansing. Occasionally, however, storms are followed
by dry periods, which would extend the time needed to
cleanse the aquifer. After Hurricane Andrew in 1992,
storm surge in south Miami-Dade County did not cause
a significant or lasting effect on the aquifer, but the
surge did not appear to reach the vicinity of the water wellfields since they are not located near the
coast.
Disruption of power at water treatment facilities and pumping stations during storms must be avoided
by use of backup generators and adequate fuel supplies. Water and wastewater treatment plants are
among the largest users of electric power in Southeast Florida. Severe storms in the past have caused
extended power interruptions of days and even weeks.
4.5 Elevated Temperatures The IPCC 2007 report (IPCC, 2007)estimates there will be a 1°C increase by 2020 in global atmospheric
temperatures. Beyond 2020, IPCC cites several emissions scenarios that could result in a global
temperature increase ranging from 2°C to 4°C through 2100. Increased air temperature is likely to
impact water resources. As air temperatures rise, there are likely to be changes in water temperature,
availability, quality, and chemistry on global, regional and local scales.
Because of water’s high heat capacity and the huge mass of the oceans, approximately 80% of the
thermal energy is absorbed by the oceans. The magnitude and timing of surface water temperature
change is uncertain, subject to regional variability and is related to climate driven changes in the water
cycle as well as socioeconomic changes that drive increased water demand (IPCC 2007).
Figure 47 - Model forecast of storm surge in Broward County. Map shows that all area east of coastal ridge would be flooded in a major hurricane and surge would penetrate well inland along major rivers and primary canals.
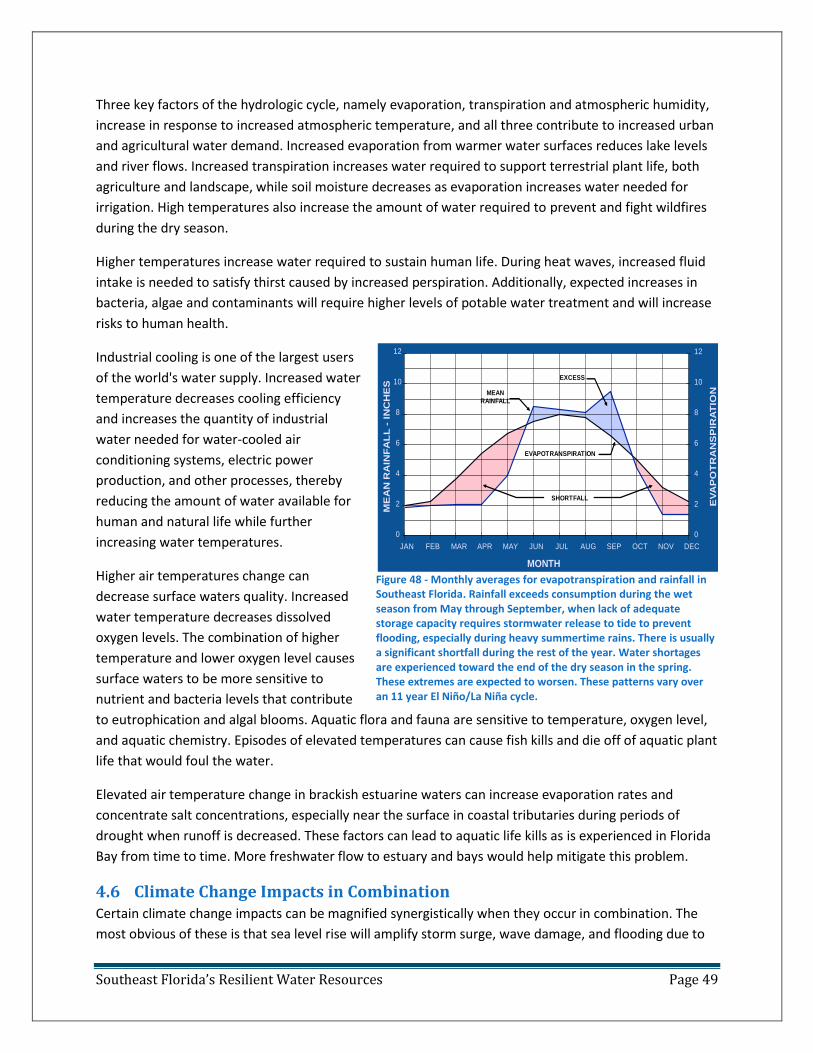
Southeast Florida’s Resilient Water Resources Page 49
Three key factors of the hydrologic cycle, namely evaporation, transpiration and atmospheric humidity,
increase in response to increased atmospheric temperature, and all three contribute to increased urban
and agricultural water demand. Increased evaporation from warmer water surfaces reduces lake levels
and river flows. Increased transpiration increases water required to support terrestrial plant life, both
agriculture and landscape, while soil moisture decreases as evaporation increases water needed for
irrigation. High temperatures also increase the amount of water required to prevent and fight wildfires
during the dry season.
Higher temperatures increase water required to sustain human life. During heat waves, increased fluid
intake is needed to satisfy thirst caused by increased perspiration. Additionally, expected increases in
bacteria, algae and contaminants will require higher levels of potable water treatment and will increase
risks to human health.
Industrial cooling is one of the largest users
of the world's water supply. Increased water
temperature decreases cooling efficiency
and increases the quantity of industrial
water needed for water-cooled air
conditioning systems, electric power
production, and other processes, thereby
reducing the amount of water available for
human and natural life while further
increasing water temperatures.
Higher air temperatures change can
decrease surface waters quality. Increased
water temperature decreases dissolved
oxygen levels. The combination of higher
temperature and lower oxygen level causes
surface waters to be more sensitive to
nutrient and bacteria levels that contribute
to eutrophication and algal blooms. Aquatic flora and fauna are sensitive to temperature, oxygen level,
and aquatic chemistry. Episodes of elevated temperatures can cause fish kills and die off of aquatic plant
life that would foul the water.
Elevated air temperature change in brackish estuarine waters can increase evaporation rates and
concentrate salt concentrations, especially near the surface in coastal tributaries during periods of
drought when runoff is decreased. These factors can lead to aquatic life kills as is experienced in Florida
Bay from time to time. More freshwater flow to estuary and bays would help mitigate this problem.
4.6 Climate Change Impacts in Combination Certain climate change impacts can be magnified synergistically when they occur in combination. The
most obvious of these is that sea level rise will amplify storm surge, wave damage, and flooding due to
Figure 48 - Monthly averages for evapotranspiration and rainfall in Southeast Florida. Rainfall exceeds consumption during the wet season from May through September, when lack of adequate storage capacity requires stormwater release to tide to prevent flooding, especially during heavy summertime rains. There is usually a significant shortfall during the rest of the year. Water shortages are experienced toward the end of the dry season in the spring. These extremes are expected to worsen. These patterns vary over an 11 year El Niño/La Niña cycle.
MONTH
ME
AN
RA
INF
AL
L -
INC
HE
S
EV
AP
OT
RA
NS
PIR
AT
ION
0
2
4
6
8
10
12
JAN FEB MAR APR MAY JUN JUL AUG SEP OCT NOV DEC
0
2
4
6
8
10
12
MEAN
RAINFALL
EXCESS
EVAPOTRANSPIRATION
SHORTFALL
Southeast Florida’s Resilient Water Resources Page 50
hurricanes. A matrix analysis of the combined effects of the relevant climate change impacts when taken
two at a time is shown in Table 7.
The second column of Table 7 lists the most important effects of each impact when considered alone. In
the following columns, each cell presents synergistic effects if the impacts listed in the title row and title
column were to occur in combination. The total effect of each combination would be the solo effects of
each impact plus the synergistic effects. Major conclusions from this analysis are detailed in the sections
that follow.
4.6.1 Sea Level Rise in Combination with Other Impacts:
With increasing sea level, there will be increased beach erosion, coastal inundation, encroachment of
coastal wetlands and Everglades, rising water tables, and increased levels in surface waters, such as
canals, retention ponds, lakes, etc. In addition, sea level rise will exacerbate the impacts of hurricanes,
drought, and torrential rains, as described below.
4.6.2 Sea Level Rise with Hurricanes:
The combination of sea level rise and hurricanes can take an especially heavy toll on coastal areas and
the barrier islands as severe beach erosion, coastal inundation, and substantially increased damage from
storm surge and wave action. Interior flooding can be more extensive because stormwater drainage is
compromised by sea level rise. The water supply is threatened by hurricanes because surface waters
and the aquifer are more likely to become contaminated with seawater and runoff due to storm surge
and flooding. On August 24, 1992 for example, hurricane Andrew struck southern Miami-Dade County as
a Category 5 storm with gusts of over 170 mpg and 17’ storm surge measured on Biscayne Bay. Property
damage was estimated at $25 billion. Because there were no water wellfields in the area where storm
surge occurred, there was no significant effect on the water supply. However, if a similar event occurred
in North Dade or Broward County, where some wellfields are relatively close to the coast, saltwater
contamination from storm surge is a possibility.
4.6.3 Sea Level Rise with Drought:
The threat of saltwater intrusion in coastal wellfields is more serious during periods of drought and the
dry winter/spring season, and this is likely to be reinforced by sea level rise, as explained in Section
4.2.1. Increased backpressure caused by sea level rise reduces aquifer flow gradients and could reduce
freshwater availability. Surface migration of saline water in the southernmost Everglades because of sea
level rise will be exacerbated by reduced sheet flow due to diminished rainfall.
4.6.4 Sea Level Rise with Torrential Rains
Severe summertime thunderstorms, tropical storms and hurricanes are likely to be more intense as a
consequence of climate change. As discussed in Section 4.2.2, sea level rise is likely to cause reduced
groundwater flow and/or elevated water tables, along with a compromised stormwater drainage system
and reduced flood control structure capacity. Sea level rise and torrential rains may substantially
increase the region’s vulnerability to flooding.
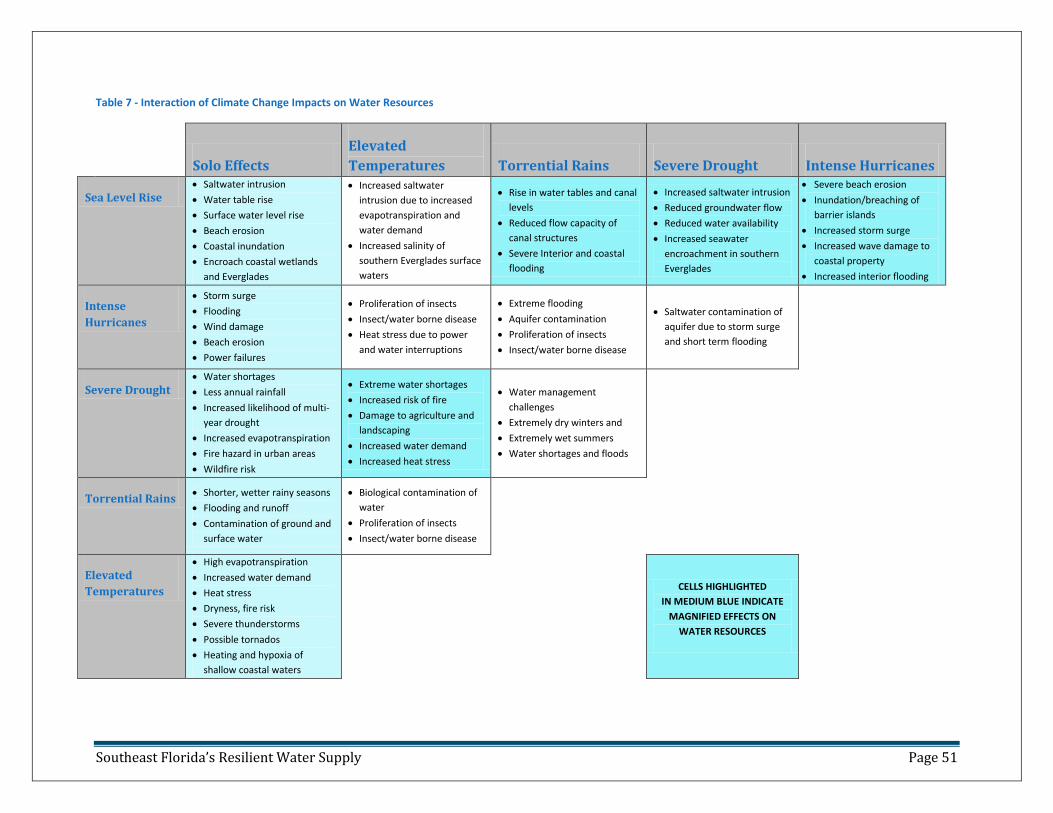
Southeast Florida’s Resilient Water Supply Page 51
Table 7 - Interaction of Climate Change Impacts on Water Resources
Solo Effects
Elevated
Temperatures Torrential Rains Severe Drought Intense Hurricanes
Sea Level Rise Saltwater intrusion
Water table rise
Surface water level rise
Beach erosion
Coastal inundation
Encroach coastal wetlands
and Everglades
Increased saltwater
intrusion due to increased
evapotranspiration and
water demand
Increased salinity of
southern Everglades surface
waters
Rise in water tables and canal
levels
Reduced flow capacity of
canal structures
Severe Interior and coastal
flooding
Increased saltwater intrusion
Reduced groundwater flow
Reduced water availability
Increased seawater
encroachment in southern
Everglades
Severe beach erosion
Inundation/breaching of
barrier islands
Increased storm surge
Increased wave damage to
coastal property
Increased interior flooding
Intense
Hurricanes
Storm surge
Flooding
Wind damage
Beach erosion
Power failures
Proliferation of insects
Insect/water borne disease
Heat stress due to power
and water interruptions
Extreme flooding
Aquifer contamination
Proliferation of insects
Insect/water borne disease
Saltwater contamination of
aquifer due to storm surge
and short term flooding
Severe Drought Water shortages
Less annual rainfall
Increased likelihood of multi-
year drought
Increased evapotranspiration
Fire hazard in urban areas
Wildfire risk
Extreme water shortages
Increased risk of fire
Damage to agriculture and
landscaping
Increased water demand
Increased heat stress
Water management
challenges
Extremely dry winters and
Extremely wet summers
Water shortages and floods
Torrential Rains Shorter, wetter rainy seasons
Flooding and runoff
Contamination of ground and
surface water
Biological contamination of
water
Proliferation of insects
Insect/water borne disease
Elevated
Temperatures
High evapotranspiration
Increased water demand
Heat stress
Dryness, fire risk
Severe thunderstorms
Possible tornados
Heating and hypoxia of
shallow coastal waters
CELLS HIGHLIGHTED
IN MEDIUM BLUE INDICATE
MAGNIFIED EFFECTS ON
WATER RESOURCES
Southeast Florida’s Resilient Water Supply Page 52
4.6.5 Elevated Temperatures in Combination with Drought
As previously discussed, elevated temperatures increase evapotranspiration. Higher temperatures
combined with drought intensify the consequences of water shortages for municipal supplies,
agriculture and the natural environment. Water demand would increase as the region becomes
parched. Heat stress would be exhibited by human and natural systems. The risk of fire increases in
urban areas, forests and grasslands. When extreme drought is combined with heat waves, severe drying
in the Everglades can set up conditions for peat fires that can cause long-term ecological damage. Water
needed to fight fires at the very time was water is in short supply. Crops and landscaping are damaged
by the lack of adequate water as emergency conservation measures are put in place and enforced.
These conditions will become more likely as climate change increases the frequency and intensity of
heat waves and longer, more severe periods of drought.
Southeast Florida’s Resilient Water Supply Page 53
5 Toolbox for Protecting Water Resources A recurring theme in offsetting sea level rise and drought caused by climate change is to provide and
maintain as much fresh water in the hydrologic system as possible within the constraints of stormwater
management. The alternatives break down into five major categories: 1) conservation, 2) protection of
existing sources, 3) development of alternative water sources, 4) reclamation and reuse of treated
wastewater, and 5) stormwater management.
Table 8 – Tools for Protection Water Resources from Climate Change Impacts
Water Resource Adaptation Alternatives Water conservation
Reducing requirements for additional treatment capacity and development of alternative water supplies (AWS)
Protection of existing water sources
Hydrodynamic barriers: aquifer injection/ infiltration trenches to counteract saltwater intrusion using treated wastewater
Horizontal wells
Salinity structures and locks control advance of saltwater intrusion
Relocation of wellfields when saltwater intrusion or other threats render wellfield operations impractical
Development of alternative water sources
Desalination of brackish waters
Regional alternative water supplies
Capture and storage of stormwater in reservoirs and impoundments
Aquifer storage and recovery (ASR)
Wastewater reclaim and reuse
Irrigation to conserve water and recharge aquifer
Industrial use and for cooling water
Indirect aquifer recharge for potable water
Stormwater management
Reengineering canal systems, control structures and pumping
5.1 Water Conservation Water conservation, which has many short and intermediate term benefits not related to climate
change, is also one of the most cost effective tools for climate adaptation.
Water conservation programs encourage reduced per capita water usage. It is said that: “the cheapest
water is the water you don’t use.” From the utility perspective, it enables utilities to support population
growth and economic development while avoiding or delaying the need for expanding treatment
capacity and developing costly alternative water supplies. Conservation programs work best as an
ongoing long-term effort aimed at incentivizing installation of water saving devices, eliminating waste,
and changing end user habits, but it can take years to achieve significant results. During periods of rapid
growth as occurred in Southeast Florida before the recent (presumably temporary) economic turndown,
immature water conservation programs may not be able to keep up with increasing demand. This is a
strong reason why conservation programs should be initiated sooner than later.
Southeast Florida’s Resilient Water Supply Page 54
Another major benefit of conservation is that it facilitates maintaining service during periods of water
shortage such as severe droughts. Emergency restrictions are employed effectively in Southeast Florida
during periods of extreme drought such as has been experience in recent years, but temporary
restrictions, primarily on landscape irrigation, do not provide the full range of benefits attainable with
concerted conservation programs.
Reduced per capita usage through conservation can enable utilities to defer capital costs for plant
expansion or development of alternative water supplies for years. Another important benefit is that
conservation widens safety margins during periods of severe drought. Reduced withdrawals reduce the
risk of saltwater intrusion caused by water table drawdown in vulnerable wellfields. It may also make
capacity available for supplying the needs of nearby utilities for additional supplies.
Well run water plants have significant fixed costs such as debt service, amortization of capital, lean
operating staffs, and administrative expense. Thus, capacity under-utilization can cause budgetary
problems due to reduced revenues that can only be fractionally offset by reduction of variable costs for
electric power, chemicals consumed, etc. Therefore, effective conservation programs may require rate
increases or surcharges to balance budgets, meet bond covenants, etc. This can cause negative public
response by the perception that it penalizes good behavior. Furthermore, capacity underutilization can
cause operating problems such as increased maintenance including flushing of lines. These problems are
offset in the long run as population growth increases demand, capacity utilization, revenues, and
especially when capital costs for plant expansions are avoided or delayed.
The Florida Building Code requires high efficiency water fixtures and rain
sensors with automatic shut- off devices in new construction and major
renovations. Further savings can be achieved through soil moisture sensors
and control devices to prevent unnecessary irrigation. A Broward County
study (Bloetscher et al, 2009) showed that one of the most cost effective
programs is rebates for retrofits with high efficiency fixtures and appliances.
Since irrigation represents about half of the water usage in South Florida,
one of the best approaches from an environmental standpoint is landscaping with native species that
are drought and pest resistant and require less water, fertilization, and pesticides. Broward County’s
NatureScape Broward initiative is a model, prize-winning program that promotes such landscape
principles and recognizes compliant landscapes. Irrigation with reclaimed wastewater is discussed
elsewhere in this report. The U.S. Green Building Council, in its LEED green building certification
program, provides incentives for water conservation through use of water saving devices and irrigation
with gray water, cisterns, air conditioning condensate. Application of these approaches can substantially
reduce water consumption.
Rate structure modifications can be a powerful tool to encourage water conservation. Sewage charges
in most utilities in Southeast Florida are based upon water usage but are often capped. In some
municipalities, garbage collection is also indexed to water usage with a cap. Furthermore, high volume
users often receive lower unit rates above threshold levels. Therefore, unit cost decreases for high
volume water consumption. Inverted rate structures where rates increase at high use levels can be a
strong incentive for conservation.
Southeast Florida’s Resilient Water Supply Page 55
Water conservation programs require expenditures for staff, incentives, outreach, etc. Approximate
costs for the Pompano Beach utility are provided in the attached Case Study Report. Nevertheless,
conservation programs can provide significant long term payback.
Information received from the City of Pompano Beach during our case study reveals how effective
conservation programs can be. The city is promoting water conservation through the implementation of
several ordinances, including mandated hook-up to its reuse system for commercial users and charging
eligible residents an availability fee to encourage hook-up where available. Other city ordinances restrict
irrigation, require installation of rain sensor devices, promote xeriscape, or require the use of ultra low
volume plumbing. In addition, the City is considering new ordinances for permanent year round water
restrictions and incentives for reuse.
Since 2007, the City of Pompano Beach has experienced restricted landscape irrigation due to the water
shortage orders issued by the SFWMD. The City’s 2007 records show a significant water use reduction
mainly attributed to the landscape irrigation restrictions and the city’s conservation program. The per-
capita water usage was reduced from 222 gal/day in 2006 to 181 gal/day in 2007. This per-capita
reduction is equivalent to water savings of approximately 430-580 million gallons from 2008 through
2025.
5.2 Protection of Existing Water Sources Protection of existing water sources is a high priority in water resource management. As sea level rises,
wellfields in the vicinity of the saltwater intrusion front will become more vulnerable. Limiting wellfield
withdrawals is an obvious strategy. Already, many easterly wellfields have had to reduce withdrawals or
shut down altogether. As described in the Case Study report for example, Pompano Beach experienced
saltwater intrusion in their easterly wellfield as withdrawals increased to meet growing demand.
Withdrawals had to be reduced and output from the westerly wellfield was increased. In an effort to
preserve capacity and possibly increase output of the easterly wellfield, the utility is partnering in
undertaking an experimental demonstration of aquifer injection to create a saltwater barrier.
5.2.1 Hydrodynamic Barriers and Infiltration Trenches
Injection of reclaimed wastewater directly into the aquifer is a viable approach for countering saltwater
intrusion. In this concept, treated wastewater is injected into the aquifer downstream of the wellfields
to create a freshwater barrier to offset sea level rise.
The hydrodynamic barrier works by raising the water table with treated wastewater purified using full
membrane treatment. The method increases hydraulic head between the saltwater interface and the
wellfield and pushes back the saltwater intrusion front (See Figure 49). A preferred method for
protecting a large wellfields is to use shallow horizontal injection wells, called infiltration trenches.
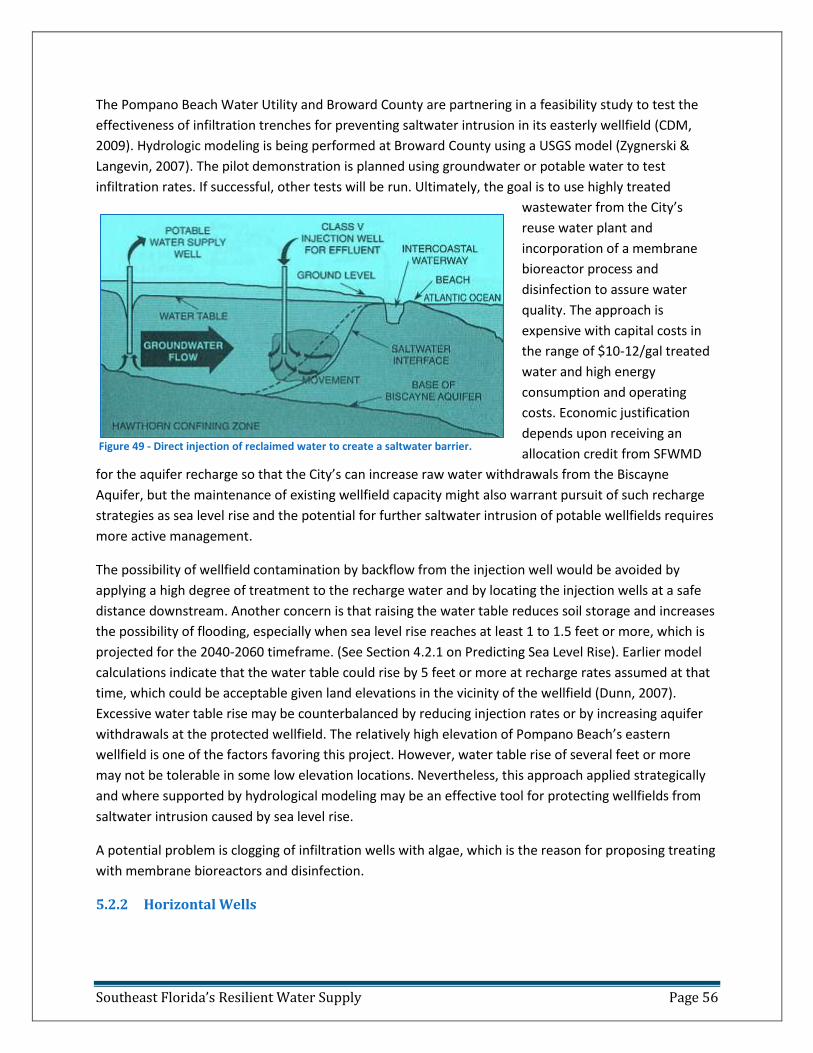
Southeast Florida’s Resilient Water Supply Page 56
Figure 49 - Direct injection of reclaimed water to create a saltwater barrier.
The Pompano Beach Water Utility and Broward County are partnering in a feasibility study to test the
effectiveness of infiltration trenches for preventing saltwater intrusion in its easterly wellfield (CDM,
2009). Hydrologic modeling is being performed at Broward County using a USGS model (Zygnerski &
Langevin, 2007). The pilot demonstration is planned using groundwater or potable water to test
infiltration rates. If successful, other tests will be run. Ultimately, the goal is to use highly treated
wastewater from the City’s
reuse water plant and
incorporation of a membrane
bioreactor process and
disinfection to assure water
quality. The approach is
expensive with capital costs in
the range of $10-12/gal treated
water and high energy
consumption and operating
costs. Economic justification
depends upon receiving an
allocation credit from SFWMD
for the aquifer recharge so that the City’s can increase raw water withdrawals from the Biscayne
Aquifer, but the maintenance of existing wellfield capacity might also warrant pursuit of such recharge
strategies as sea level rise and the potential for further saltwater intrusion of potable wellfields requires
more active management.
The possibility of wellfield contamination by backflow from the injection well would be avoided by
applying a high degree of treatment to the recharge water and by locating the injection wells at a safe
distance downstream. Another concern is that raising the water table reduces soil storage and increases
the possibility of flooding, especially when sea level rise reaches at least 1 to 1.5 feet or more, which is
projected for the 2040-2060 timeframe. (See Section 4.2.1 on Predicting Sea Level Rise). Earlier model
calculations indicate that the water table could rise by 5 feet or more at recharge rates assumed at that
time, which could be acceptable given land elevations in the vicinity of the wellfield (Dunn, 2007).
Excessive water table rise may be counterbalanced by reducing injection rates or by increasing aquifer
withdrawals at the protected wellfield. The relatively high elevation of Pompano Beach’s eastern
wellfield is one of the factors favoring this project. However, water table rise of several feet or more
may not be tolerable in some low elevation locations. Nevertheless, this approach applied strategically
and where supported by hydrological modeling may be an effective tool for protecting wellfields from
saltwater intrusion caused by sea level rise.
A potential problem is clogging of infiltration wells with algae, which is the reason for proposing treating
with membrane bioreactors and disinfection.
5.2.2 Horizontal Wells
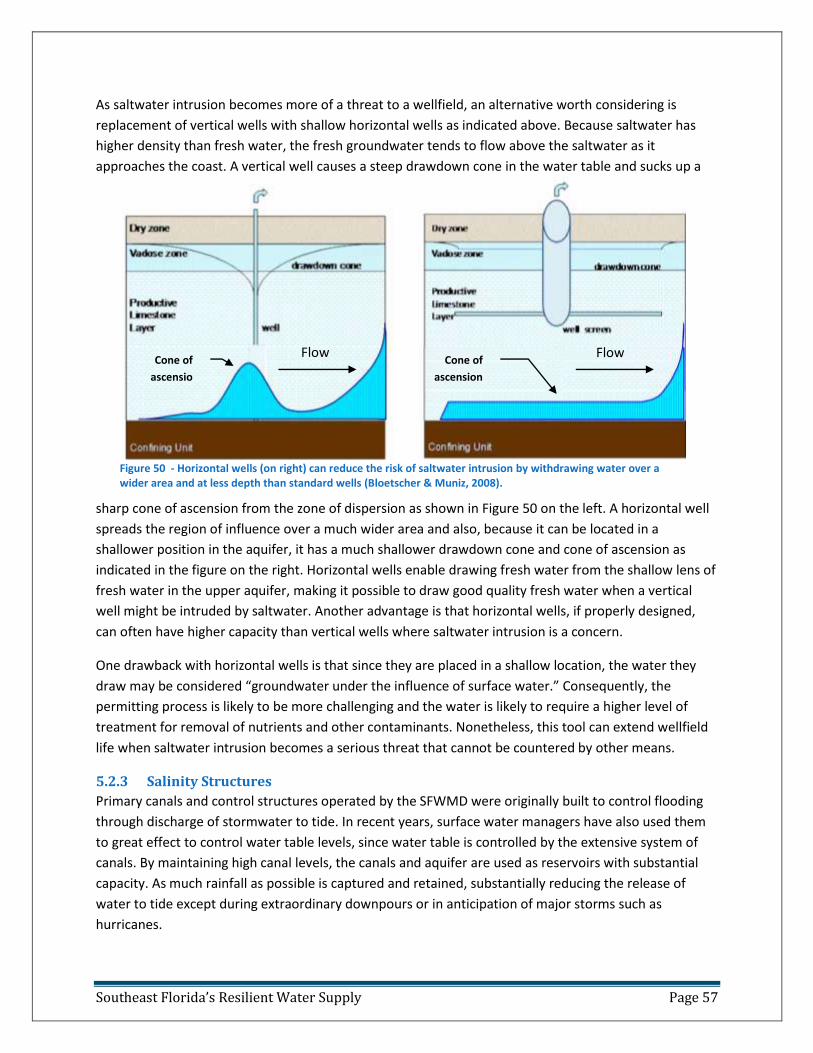
Southeast Florida’s Resilient Water Supply Page 57
As saltwater intrusion becomes more of a threat to a wellfield, an alternative worth considering is
replacement of vertical wells with shallow horizontal wells as indicated above. Because saltwater has
higher density than fresh water, the fresh groundwater tends to flow above the saltwater as it
approaches the coast. A vertical well causes a steep drawdown cone in the water table and sucks up a
sharp cone of ascension from the zone of dispersion as shown in Figure 50 on the left. A horizontal well
spreads the region of influence over a much wider area and also, because it can be located in a
shallower position in the aquifer, it has a much shallower drawdown cone and cone of ascension as
indicated in the figure on the right. Horizontal wells enable drawing fresh water from the shallow lens of
fresh water in the upper aquifer, making it possible to draw good quality fresh water when a vertical
well might be intruded by saltwater. Another advantage is that horizontal wells, if properly designed,
can often have higher capacity than vertical wells where saltwater intrusion is a concern.
One drawback with horizontal wells is that since they are placed in a shallow location, the water they
draw may be considered “groundwater under the influence of surface water.” Consequently, the
permitting process is likely to be more challenging and the water is likely to require a higher level of
treatment for removal of nutrients and other contaminants. Nonetheless, this tool can extend wellfield
life when saltwater intrusion becomes a serious threat that cannot be countered by other means.
5.2.3 Salinity Structures
Primary canals and control structures operated by the SFWMD were originally built to control flooding
through discharge of stormwater to tide. In recent years, surface water managers have also used them
to great effect to control water table levels, since water table is controlled by the extensive system of
canals. By maintaining high canal levels, the canals and aquifer are used as reservoirs with substantial
capacity. As much rainfall as possible is captured and retained, substantially reducing the release of
water to tide except during extraordinary downpours or in anticipation of major storms such as
hurricanes.
Figure 50 - Horizontal wells (on right) can reduce the risk of saltwater intrusion by withdrawing water over a wider area and at less depth than standard wells (Bloetscher & Muniz, 2008).
Cone of
ascensio
n
Cone of
ascension
Flow Flow
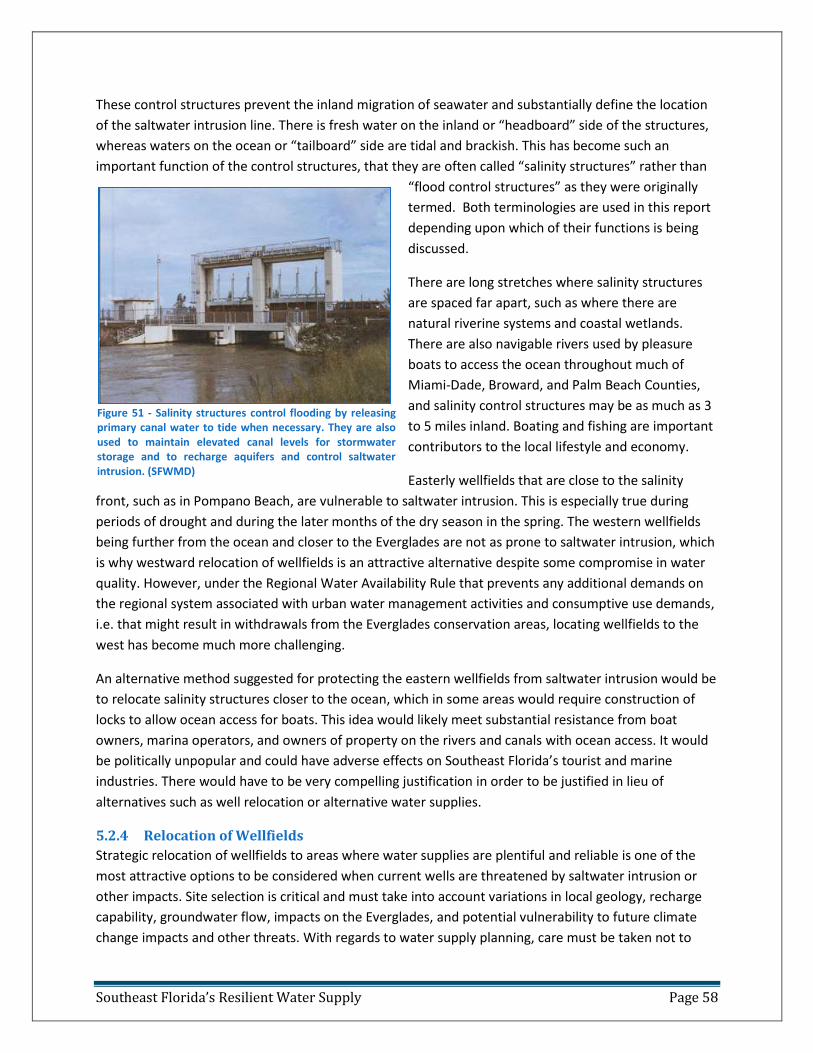
Southeast Florida’s Resilient Water Supply Page 58
These control structures prevent the inland migration of seawater and substantially define the location
of the saltwater intrusion line. There is fresh water on the inland or “headboard” side of the structures,
whereas waters on the ocean or “tailboard” side are tidal and brackish. This has become such an
important function of the control structures, that they are often called “salinity structures” rather than
“flood control structures” as they were originally
termed. Both terminologies are used in this report
depending upon which of their functions is being
discussed.
There are long stretches where salinity structures
are spaced far apart, such as where there are
natural riverine systems and coastal wetlands.
There are also navigable rivers used by pleasure
boats to access the ocean throughout much of
Miami-Dade, Broward, and Palm Beach Counties,
and salinity control structures may be as much as 3
to 5 miles inland. Boating and fishing are important
contributors to the local lifestyle and economy.
Easterly wellfields that are close to the salinity
front, such as in Pompano Beach, are vulnerable to saltwater intrusion. This is especially true during
periods of drought and during the later months of the dry season in the spring. The western wellfields
being further from the ocean and closer to the Everglades are not as prone to saltwater intrusion, which
is why westward relocation of wellfields is an attractive alternative despite some compromise in water
quality. However, under the Regional Water Availability Rule that prevents any additional demands on
the regional system associated with urban water management activities and consumptive use demands,
i.e. that might result in withdrawals from the Everglades conservation areas, locating wellfields to the
west has become much more challenging.
An alternative method suggested for protecting the eastern wellfields from saltwater intrusion would be
to relocate salinity structures closer to the ocean, which in some areas would require construction of
locks to allow ocean access for boats. This idea would likely meet substantial resistance from boat
owners, marina operators, and owners of property on the rivers and canals with ocean access. It would
be politically unpopular and could have adverse effects on Southeast Florida’s tourist and marine
industries. There would have to be very compelling justification in order to be justified in lieu of
alternatives such as well relocation or alternative water supplies.
5.2.4 Relocation of Wellfields
Strategic relocation of wellfields to areas where water supplies are plentiful and reliable is one of the
most attractive options to be considered when current wells are threatened by saltwater intrusion or
other impacts. Site selection is critical and must take into account variations in local geology, recharge
capability, groundwater flow, impacts on the Everglades, and potential vulnerability to future climate
change impacts and other threats. With regards to water supply planning, care must be taken not to
Figure 51 - Salinity structures control flooding by releasing primary canal water to tide when necessary. They are also used to maintain elevated canal levels for stormwater storage and to recharge aquifers and control saltwater intrusion. (SFWMD)
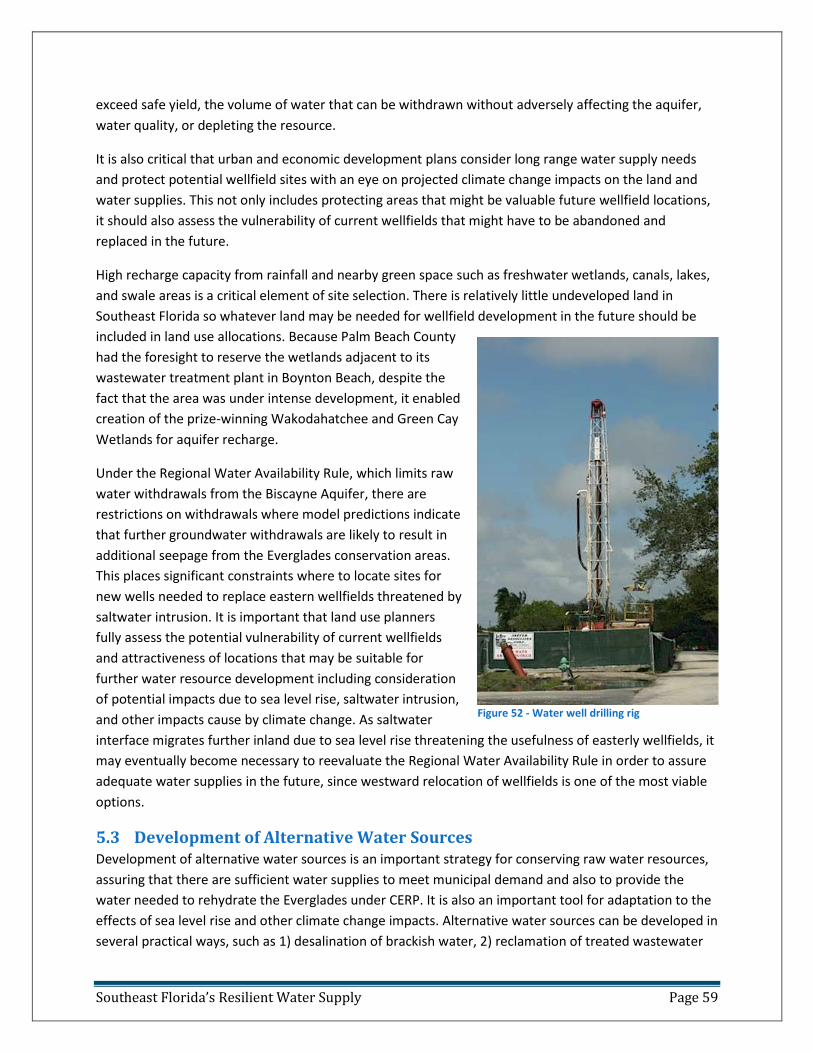
Southeast Florida’s Resilient Water Supply Page 59
exceed safe yield, the volume of water that can be withdrawn without adversely affecting the aquifer,
water quality, or depleting the resource.
It is also critical that urban and economic development plans consider long range water supply needs
and protect potential wellfield sites with an eye on projected climate change impacts on the land and
water supplies. This not only includes protecting areas that might be valuable future wellfield locations,
it should also assess the vulnerability of current wellfields that might have to be abandoned and
replaced in the future.
High recharge capacity from rainfall and nearby green space such as freshwater wetlands, canals, lakes,
and swale areas is a critical element of site selection. There is relatively little undeveloped land in
Southeast Florida so whatever land may be needed for wellfield development in the future should be
included in land use allocations. Because Palm Beach County
had the foresight to reserve the wetlands adjacent to its
wastewater treatment plant in Boynton Beach, despite the
fact that the area was under intense development, it enabled
creation of the prize-winning Wakodahatchee and Green Cay
Wetlands for aquifer recharge.
Under the Regional Water Availability Rule, which limits raw
water withdrawals from the Biscayne Aquifer, there are
restrictions on withdrawals where model predictions indicate
that further groundwater withdrawals are likely to result in
additional seepage from the Everglades conservation areas.
This places significant constraints where to locate sites for
new wells needed to replace eastern wellfields threatened by
saltwater intrusion. It is important that land use planners
fully assess the potential vulnerability of current wellfields
and attractiveness of locations that may be suitable for
further water resource development including consideration
of potential impacts due to sea level rise, saltwater intrusion,
and other impacts cause by climate change. As saltwater
interface migrates further inland due to sea level rise threatening the usefulness of easterly wellfields, it
may eventually become necessary to reevaluate the Regional Water Availability Rule in order to assure
adequate water supplies in the future, since westward relocation of wellfields is one of the most viable
options.
5.3 Development of Alternative Water Sources Development of alternative water sources is an important strategy for conserving raw water resources,
assuring that there are sufficient water supplies to meet municipal demand and also to provide the
water needed to rehydrate the Everglades under CERP. It is also an important tool for adaptation to the
effects of sea level rise and other climate change impacts. Alternative water sources can be developed in
several practical ways, such as 1) desalination of brackish water, 2) reclamation of treated wastewater
Figure 52 - Water well drilling rig
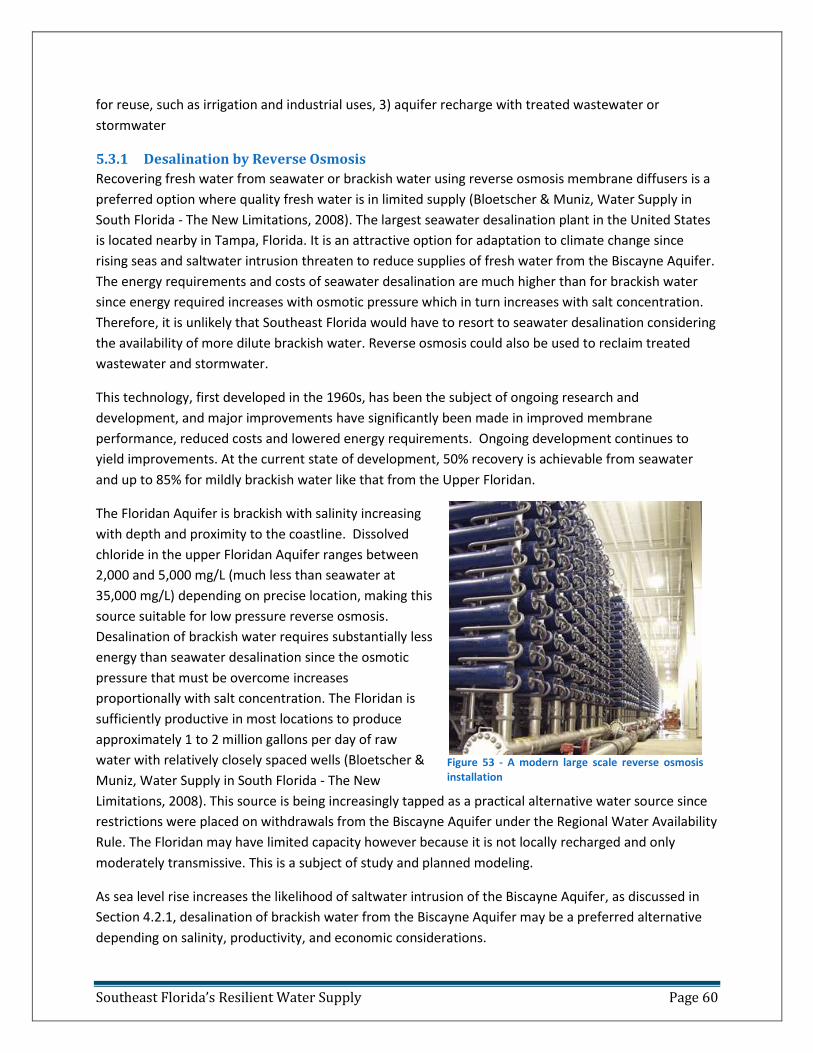
Southeast Florida’s Resilient Water Supply Page 60
for reuse, such as irrigation and industrial uses, 3) aquifer recharge with treated wastewater or
stormwater
5.3.1 Desalination by Reverse Osmosis
Recovering fresh water from seawater or brackish water using reverse osmosis membrane diffusers is a
preferred option where quality fresh water is in limited supply (Bloetscher & Muniz, Water Supply in
South Florida - The New Limitations, 2008). The largest seawater desalination plant in the United States
is located nearby in Tampa, Florida. It is an attractive option for adaptation to climate change since
rising seas and saltwater intrusion threaten to reduce supplies of fresh water from the Biscayne Aquifer.
The energy requirements and costs of seawater desalination are much higher than for brackish water
since energy required increases with osmotic pressure which in turn increases with salt concentration.
Therefore, it is unlikely that Southeast Florida would have to resort to seawater desalination considering
the availability of more dilute brackish water. Reverse osmosis could also be used to reclaim treated
wastewater and stormwater.
This technology, first developed in the 1960s, has been the subject of ongoing research and
development, and major improvements have significantly been made in improved membrane
performance, reduced costs and lowered energy requirements. Ongoing development continues to
yield improvements. At the current state of development, 50% recovery is achievable from seawater
and up to 85% for mildly brackish water like that from the Upper Floridan.
The Floridan Aquifer is brackish with salinity increasing
with depth and proximity to the coastline. Dissolved
chloride in the upper Floridan Aquifer ranges between
2,000 and 5,000 mg/L (much less than seawater at
35,000 mg/L) depending on precise location, making this
source suitable for low pressure reverse osmosis.
Desalination of brackish water requires substantially less
energy than seawater desalination since the osmotic
pressure that must be overcome increases
proportionally with salt concentration. The Floridan is
sufficiently productive in most locations to produce
approximately 1 to 2 million gallons per day of raw
water with relatively closely spaced wells (Bloetscher &
Muniz, Water Supply in South Florida - The New
Limitations, 2008). This source is being increasingly tapped as a practical alternative water source since
restrictions were placed on withdrawals from the Biscayne Aquifer under the Regional Water Availability
Rule. The Floridan may have limited capacity however because it is not locally recharged and only
moderately transmissive. This is a subject of study and planned modeling.
As sea level rise increases the likelihood of saltwater intrusion of the Biscayne Aquifer, as discussed in
Section 4.2.1, desalination of brackish water from the Biscayne Aquifer may be a preferred alternative
depending on salinity, productivity, and economic considerations.
Figure 53 - A modern large scale reverse osmosis installation
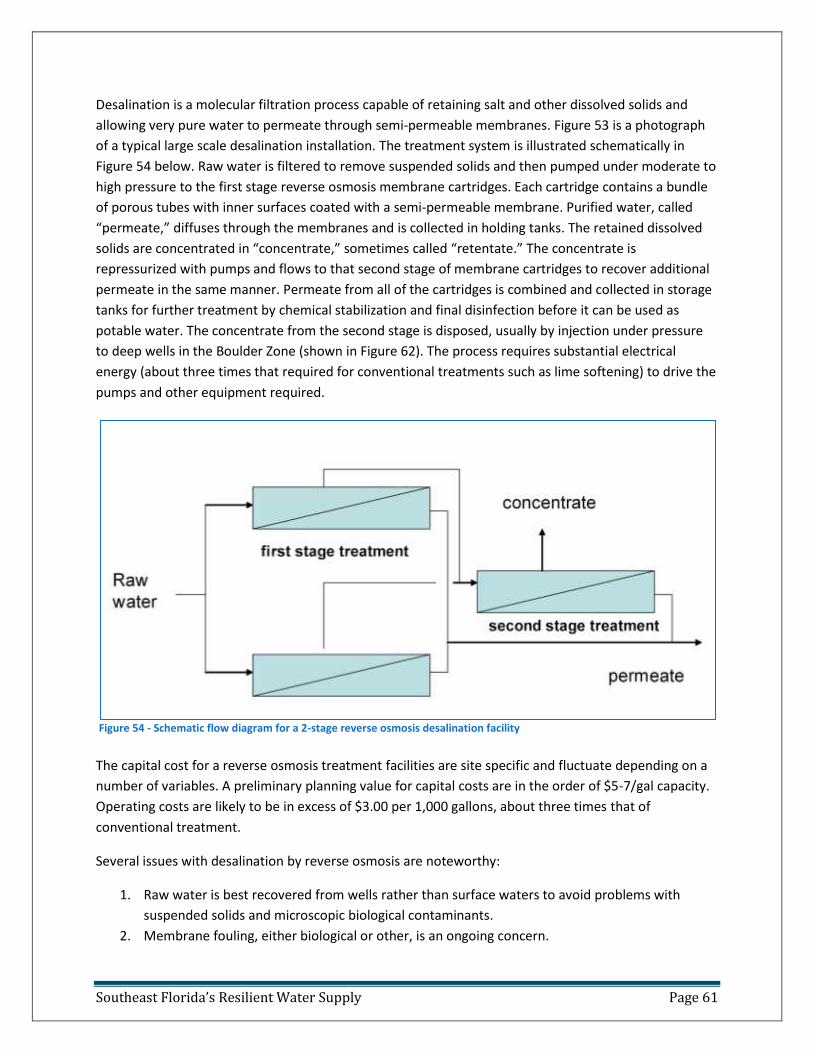
Southeast Florida’s Resilient Water Supply Page 61
Desalination is a molecular filtration process capable of retaining salt and other dissolved solids and
allowing very pure water to permeate through semi-permeable membranes. Figure 53 is a photograph
of a typical large scale desalination installation. The treatment system is illustrated schematically in
Figure 54 below. Raw water is filtered to remove suspended solids and then pumped under moderate to
high pressure to the first stage reverse osmosis membrane cartridges. Each cartridge contains a bundle
of porous tubes with inner surfaces coated with a semi-permeable membrane. Purified water, called
“permeate,” diffuses through the membranes and is collected in holding tanks. The retained dissolved
solids are concentrated in “concentrate,” sometimes called “retentate.” The concentrate is
repressurized with pumps and flows to that second stage of membrane cartridges to recover additional
permeate in the same manner. Permeate from all of the cartridges is combined and collected in storage
tanks for further treatment by chemical stabilization and final disinfection before it can be used as
potable water. The concentrate from the second stage is disposed, usually by injection under pressure
to deep wells in the Boulder Zone (shown in Figure 62). The process requires substantial electrical
energy (about three times that required for conventional treatments such as lime softening) to drive the
pumps and other equipment required.
The capital cost for a reverse osmosis treatment facilities are site specific and fluctuate depending on a
number of variables. A preliminary planning value for capital costs are in the order of $5-7/gal capacity.
Operating costs are likely to be in excess of $3.00 per 1,000 gallons, about three times that of
conventional treatment.
Several issues with desalination by reverse osmosis are noteworthy:
1. Raw water is best recovered from wells rather than surface waters to avoid problems with
suspended solids and microscopic biological contaminants.
2. Membrane fouling, either biological or other, is an ongoing concern.
Figure 54 - Schematic flow diagram for a 2-stage reverse osmosis desalination facility
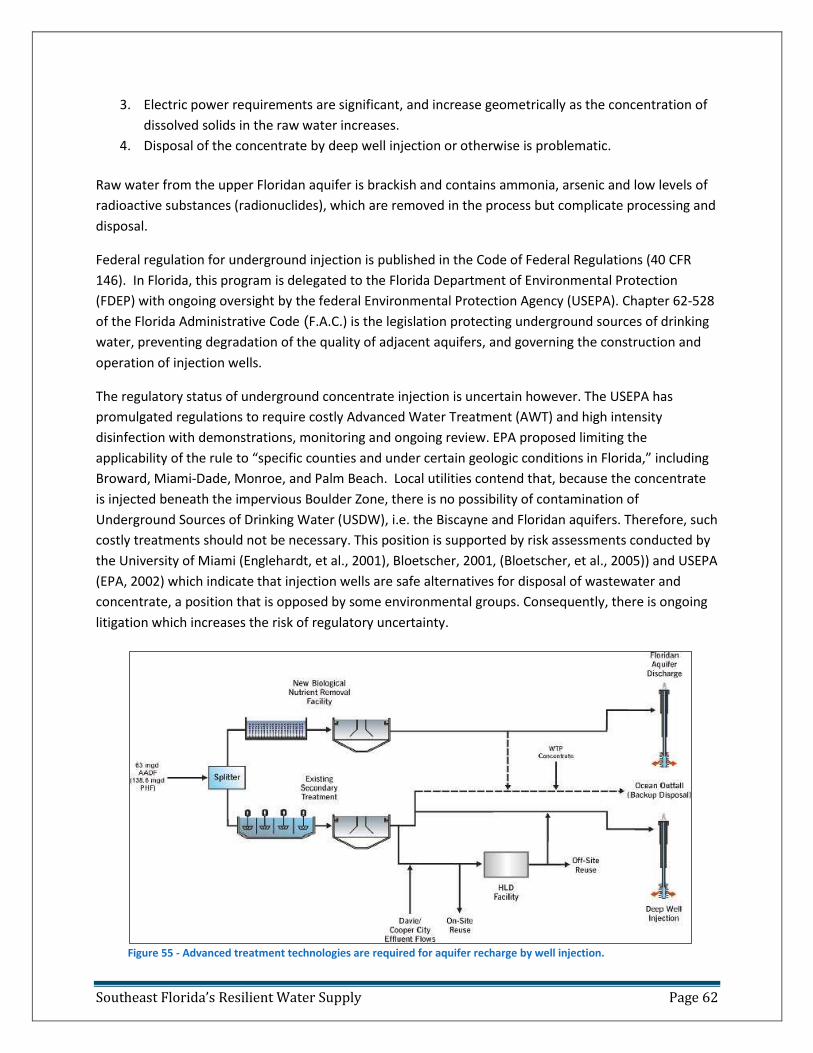
Southeast Florida’s Resilient Water Supply Page 62
3. Electric power requirements are significant, and increase geometrically as the concentration of
dissolved solids in the raw water increases.
4. Disposal of the concentrate by deep well injection or otherwise is problematic.
Raw water from the upper Floridan aquifer is brackish and contains ammonia, arsenic and low levels of
radioactive substances (radionuclides), which are removed in the process but complicate processing and
disposal.
Federal regulation for underground injection is published in the Code of Federal Regulations (40 CFR
146). In Florida, this program is delegated to the Florida Department of Environmental Protection
(FDEP) with ongoing oversight by the federal Environmental Protection Agency (USEPA). Chapter 62-528
of the Florida Administrative Code (F.A.C.) is the legislation protecting underground sources of drinking
water, preventing degradation of the quality of adjacent aquifers, and governing the construction and
operation of injection wells.
The regulatory status of underground concentrate injection is uncertain however. The USEPA has
promulgated regulations to require costly Advanced Water Treatment (AWT) and high intensity
disinfection with demonstrations, monitoring and ongoing review. EPA proposed limiting the
applicability of the rule to “specific counties and under certain geologic conditions in Florida,” including
Broward, Miami-Dade, Monroe, and Palm Beach. Local utilities contend that, because the concentrate
is injected beneath the impervious Boulder Zone, there is no possibility of contamination of
Underground Sources of Drinking Water (USDW), i.e. the Biscayne and Floridan aquifers. Therefore, such
costly treatments should not be necessary. This position is supported by risk assessments conducted by
the University of Miami (Englehardt, et al., 2001), Bloetscher, 2001, (Bloetscher, et al., 2005)) and USEPA
(EPA, 2002) which indicate that injection wells are safe alternatives for disposal of wastewater and
concentrate, a position that is opposed by some environmental groups. Consequently, there is ongoing
litigation which increases the risk of regulatory uncertainty.
Figure 55 - Advanced treatment technologies are required for aquifer recharge by well injection.
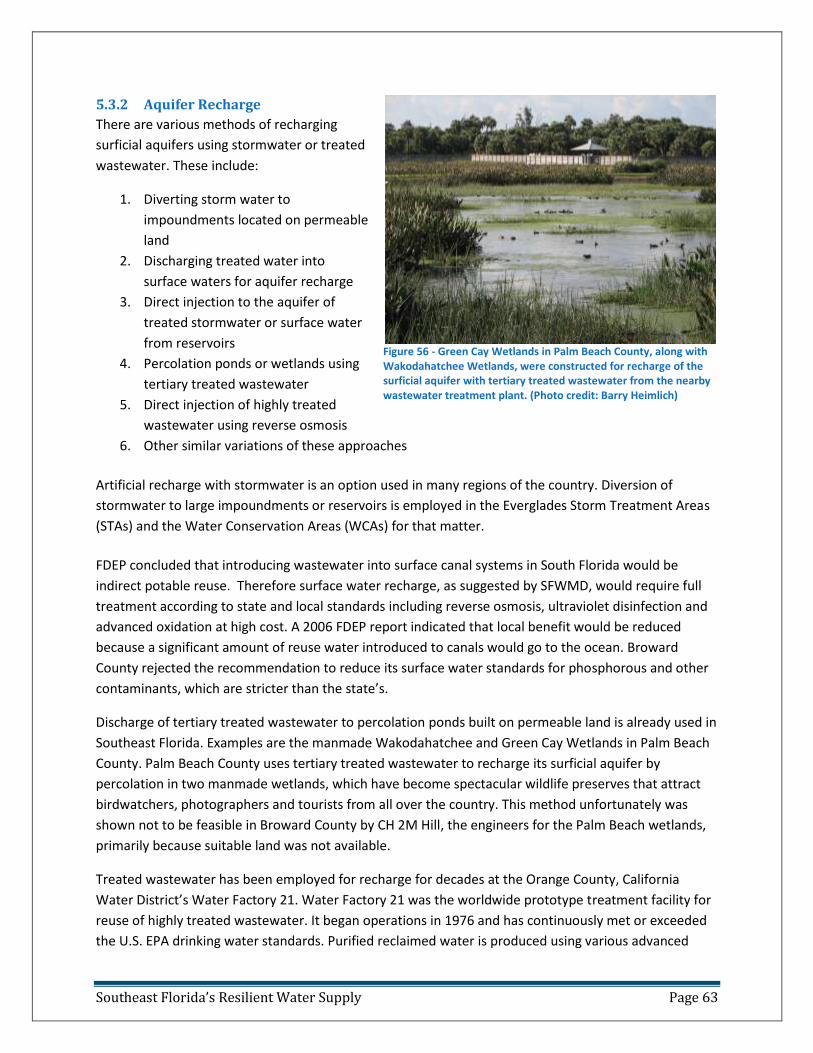
Southeast Florida’s Resilient Water Supply Page 63
5.3.2 Aquifer Recharge
There are various methods of recharging
surficial aquifers using stormwater or treated
wastewater. These include:
1. Diverting storm water to
impoundments located on permeable
land
2. Discharging treated water into
surface waters for aquifer recharge
3. Direct injection to the aquifer of
treated stormwater or surface water
from reservoirs
4. Percolation ponds or wetlands using
tertiary treated wastewater
5. Direct injection of highly treated
wastewater using reverse osmosis
6. Other similar variations of these approaches
Artificial recharge with stormwater is an option used in many regions of the country. Diversion of
stormwater to large impoundments or reservoirs is employed in the Everglades Storm Treatment Areas
(STAs) and the Water Conservation Areas (WCAs) for that matter.
FDEP concluded that introducing wastewater into surface canal systems in South Florida would be
indirect potable reuse. Therefore surface water recharge, as suggested by SFWMD, would require full
treatment according to state and local standards including reverse osmosis, ultraviolet disinfection and
advanced oxidation at high cost. A 2006 FDEP report indicated that local benefit would be reduced
because a significant amount of reuse water introduced to canals would go to the ocean. Broward
County rejected the recommendation to reduce its surface water standards for phosphorous and other
contaminants, which are stricter than the state’s.
Discharge of tertiary treated wastewater to percolation ponds built on permeable land is already used in
Southeast Florida. Examples are the manmade Wakodahatchee and Green Cay Wetlands in Palm Beach
County. Palm Beach County uses tertiary treated wastewater to recharge its surficial aquifer by
percolation in two manmade wetlands, which have become spectacular wildlife preserves that attract
birdwatchers, photographers and tourists from all over the country. This method unfortunately was
shown not to be feasible in Broward County by CH 2M Hill, the engineers for the Palm Beach wetlands,
primarily because suitable land was not available.
Treated wastewater has been employed for recharge for decades at the Orange County, California
Water District’s Water Factory 21. Water Factory 21 was the worldwide prototype treatment facility for
reuse of highly treated wastewater. It began operations in 1976 and has continuously met or exceeded
the U.S. EPA drinking water standards. Purified reclaimed water is produced using various advanced
Figure 56 - Green Cay Wetlands in Palm Beach County, along with Wakodahatchee Wetlands, were constructed for recharge of the surficial aquifer with tertiary treated wastewater from the nearby wastewater treatment plant. (Photo credit: Barry Heimlich)
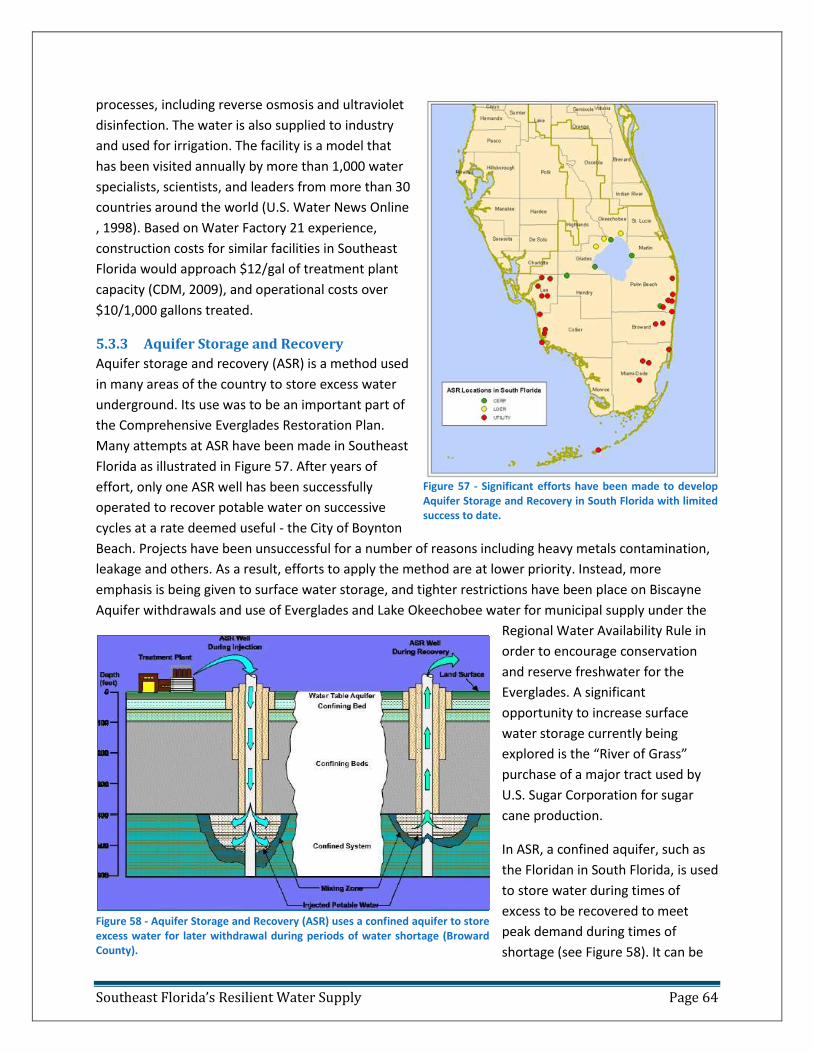
Southeast Florida’s Resilient Water Supply Page 64
processes, including reverse osmosis and ultraviolet
disinfection. The water is also supplied to industry
and used for irrigation. The facility is a model that
has been visited annually by more than 1,000 water
specialists, scientists, and leaders from more than 30
countries around the world (U.S. Water News Online
, 1998). Based on Water Factory 21 experience,
construction costs for similar facilities in Southeast
Florida would approach $12/gal of treatment plant
capacity (CDM, 2009), and operational costs over
$10/1,000 gallons treated.
5.3.3 Aquifer Storage and Recovery
Aquifer storage and recovery (ASR) is a method used
in many areas of the country to store excess water
underground. Its use was to be an important part of
the Comprehensive Everglades Restoration Plan.
Many attempts at ASR have been made in Southeast
Florida as illustrated in Figure 57. After years of
effort, only one ASR well has been successfully
operated to recover potable water on successive
cycles at a rate deemed useful - the City of Boynton
Beach. Projects have been unsuccessful for a number of reasons including heavy metals contamination,
leakage and others. As a result, efforts to apply the method are at lower priority. Instead, more
emphasis is being given to surface water storage, and tighter restrictions have been place on Biscayne
Aquifer withdrawals and use of Everglades and Lake Okeechobee water for municipal supply under the
Regional Water Availability Rule in
order to encourage conservation
and reserve freshwater for the
Everglades. A significant
opportunity to increase surface
water storage currently being
explored is the “River of Grass”
purchase of a major tract used by
U.S. Sugar Corporation for sugar
cane production.
In ASR, a confined aquifer, such as
the Floridan in South Florida, is used
to store water during times of
excess to be recovered to meet
peak demand during times of
shortage (see Figure 58). It can be
Figure 58 - Aquifer Storage and Recovery (ASR) uses a confined aquifer to store excess water for later withdrawal during periods of water shortage (Broward County).
Figure 57 - Significant efforts have been made to develop Aquifer Storage and Recovery in South Florida with limited success to date.
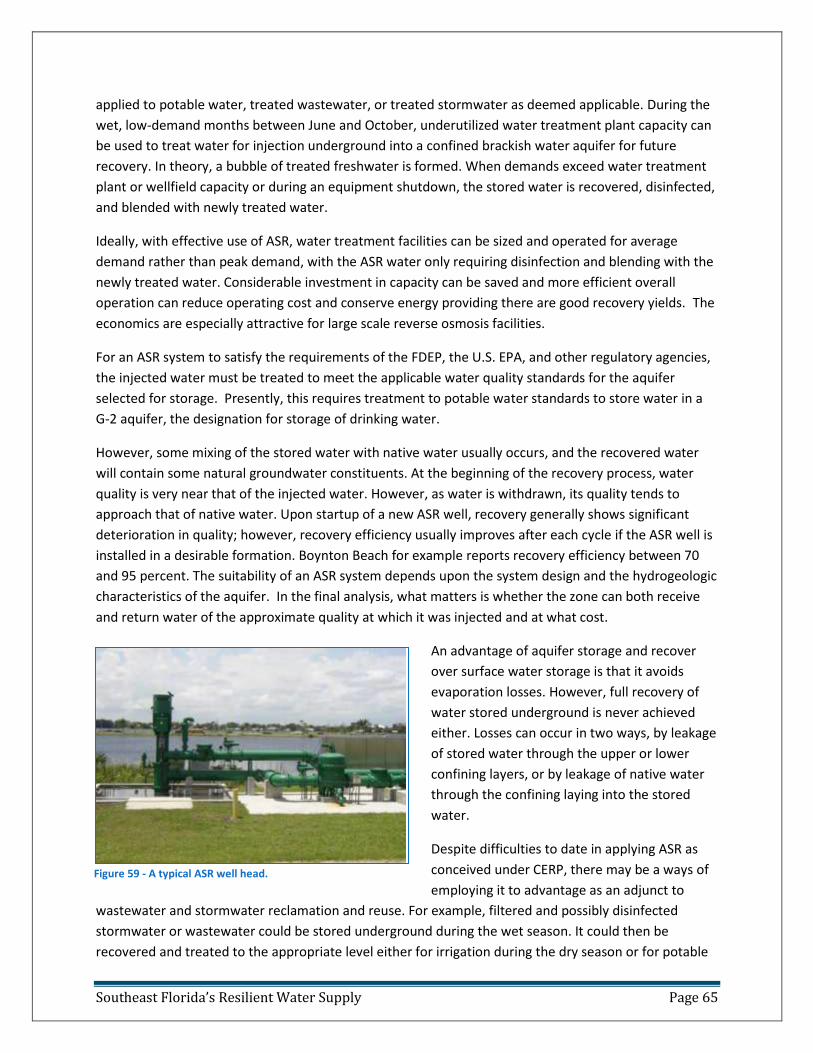
Southeast Florida’s Resilient Water Supply Page 65
applied to potable water, treated wastewater, or treated stormwater as deemed applicable. During the
wet, low-demand months between June and October, underutilized water treatment plant capacity can
be used to treat water for injection underground into a confined brackish water aquifer for future
recovery. In theory, a bubble of treated freshwater is formed. When demands exceed water treatment
plant or wellfield capacity or during an equipment shutdown, the stored water is recovered, disinfected,
and blended with newly treated water.
Ideally, with effective use of ASR, water treatment facilities can be sized and operated for average
demand rather than peak demand, with the ASR water only requiring disinfection and blending with the
newly treated water. Considerable investment in capacity can be saved and more efficient overall
operation can reduce operating cost and conserve energy providing there are good recovery yields. The
economics are especially attractive for large scale reverse osmosis facilities.
For an ASR system to satisfy the requirements of the FDEP, the U.S. EPA, and other regulatory agencies,
the injected water must be treated to meet the applicable water quality standards for the aquifer
selected for storage. Presently, this requires treatment to potable water standards to store water in a
G-2 aquifer, the designation for storage of drinking water.
However, some mixing of the stored water with native water usually occurs, and the recovered water
will contain some natural groundwater constituents. At the beginning of the recovery process, water
quality is very near that of the injected water. However, as water is withdrawn, its quality tends to
approach that of native water. Upon startup of a new ASR well, recovery generally shows significant
deterioration in quality; however, recovery efficiency usually improves after each cycle if the ASR well is
installed in a desirable formation. Boynton Beach for example reports recovery efficiency between 70
and 95 percent. The suitability of an ASR system depends upon the system design and the hydrogeologic
characteristics of the aquifer. In the final analysis, what matters is whether the zone can both receive
and return water of the approximate quality at which it was injected and at what cost.
An advantage of aquifer storage and recover
over surface water storage is that it avoids
evaporation losses. However, full recovery of
water stored underground is never achieved
either. Losses can occur in two ways, by leakage
of stored water through the upper or lower
confining layers, or by leakage of native water
through the confining laying into the stored
water.
Despite difficulties to date in applying ASR as
conceived under CERP, there may be a ways of
employing it to advantage as an adjunct to
wastewater and stormwater reclamation and reuse. For example, filtered and possibly disinfected
stormwater or wastewater could be stored underground during the wet season. It could then be
recovered and treated to the appropriate level either for irrigation during the dry season or for potable
Figure 59 - A typical ASR well head.
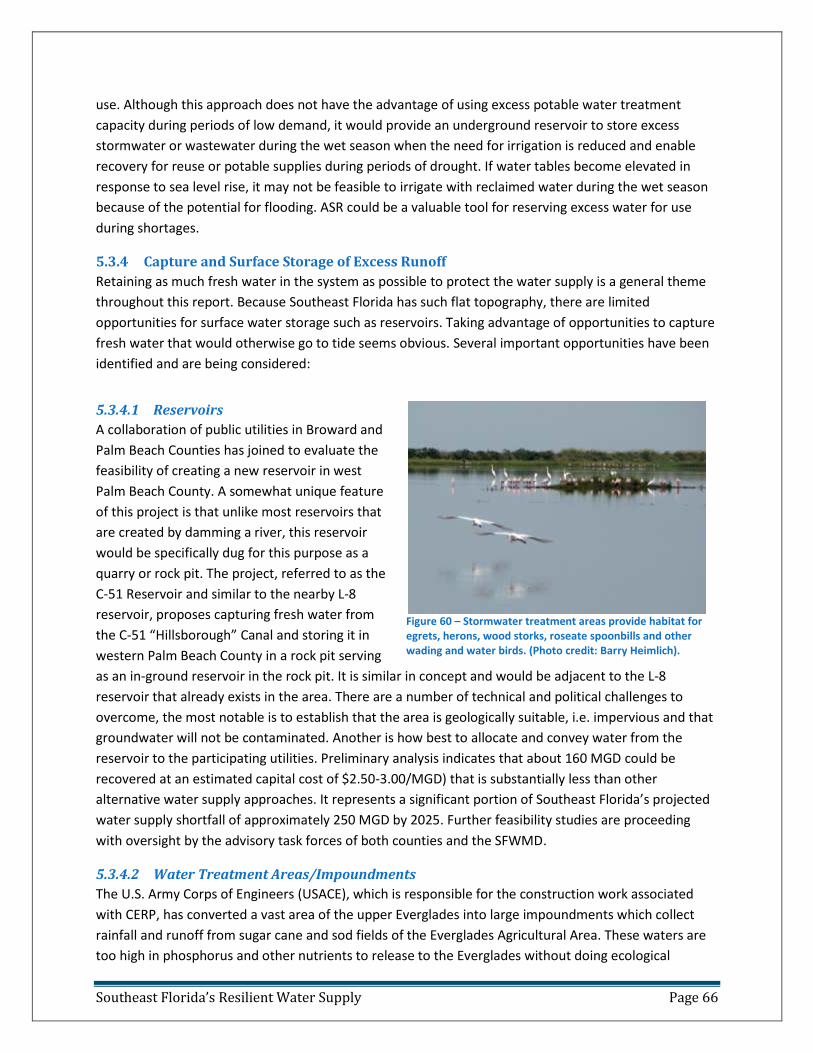
Southeast Florida’s Resilient Water Supply Page 66
use. Although this approach does not have the advantage of using excess potable water treatment
capacity during periods of low demand, it would provide an underground reservoir to store excess
stormwater or wastewater during the wet season when the need for irrigation is reduced and enable
recovery for reuse or potable supplies during periods of drought. If water tables become elevated in
response to sea level rise, it may not be feasible to irrigate with reclaimed water during the wet season
because of the potential for flooding. ASR could be a valuable tool for reserving excess water for use
during shortages.
5.3.4 Capture and Surface Storage of Excess Runoff
Retaining as much fresh water in the system as possible to protect the water supply is a general theme
throughout this report. Because Southeast Florida has such flat topography, there are limited
opportunities for surface water storage such as reservoirs. Taking advantage of opportunities to capture
fresh water that would otherwise go to tide seems obvious. Several important opportunities have been
identified and are being considered:
5.3.4.1 Reservoirs
A collaboration of public utilities in Broward and
Palm Beach Counties has joined to evaluate the
feasibility of creating a new reservoir in west
Palm Beach County. A somewhat unique feature
of this project is that unlike most reservoirs that
are created by damming a river, this reservoir
would be specifically dug for this purpose as a
quarry or rock pit. The project, referred to as the
C-51 Reservoir and similar to the nearby L-8
reservoir, proposes capturing fresh water from
the C-51 “Hillsborough” Canal and storing it in
western Palm Beach County in a rock pit serving
as an in-ground reservoir in the rock pit. It is similar in concept and would be adjacent to the L-8
reservoir that already exists in the area. There are a number of technical and political challenges to
overcome, the most notable is to establish that the area is geologically suitable, i.e. impervious and that
groundwater will not be contaminated. Another is how best to allocate and convey water from the
reservoir to the participating utilities. Preliminary analysis indicates that about 160 MGD could be
recovered at an estimated capital cost of $2.50-3.00/MGD) that is substantially less than other
alternative water supply approaches. It represents a significant portion of Southeast Florida’s projected
water supply shortfall of approximately 250 MGD by 2025. Further feasibility studies are proceeding
with oversight by the advisory task forces of both counties and the SFWMD.
5.3.4.2 Water Treatment Areas/Impoundments
The U.S. Army Corps of Engineers (USACE), which is responsible for the construction work associated
with CERP, has converted a vast area of the upper Everglades into large impoundments which collect
rainfall and runoff from sugar cane and sod fields of the Everglades Agricultural Area. These waters are
too high in phosphorus and other nutrients to release to the Everglades without doing ecological
Figure 60 – Stormwater treatment areas provide habitat for egrets, herons, wood storks, roseate spoonbills and other wading and water birds. (Photo credit: Barry Heimlich).
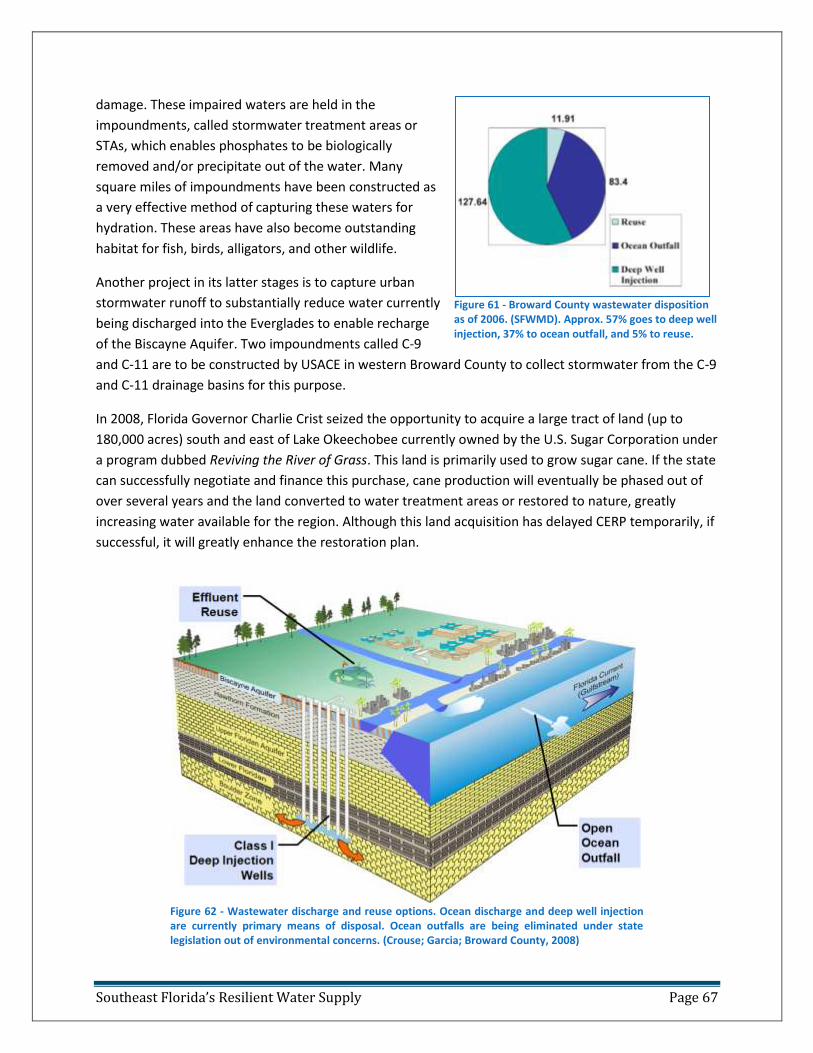
Southeast Florida’s Resilient Water Supply Page 67
damage. These impaired waters are held in the
impoundments, called stormwater treatment areas or
STAs, which enables phosphates to be biologically
removed and/or precipitate out of the water. Many
square miles of impoundments have been constructed as
a very effective method of capturing these waters for
hydration. These areas have also become outstanding
habitat for fish, birds, alligators, and other wildlife.
Another project in its latter stages is to capture urban
stormwater runoff to substantially reduce water currently
being discharged into the Everglades to enable recharge
of the Biscayne Aquifer. Two impoundments called C-9
and C-11 are to be constructed by USACE in western Broward County to collect stormwater from the C-9
and C-11 drainage basins for this purpose.
In 2008, Florida Governor Charlie Crist seized the opportunity to acquire a large tract of land (up to
180,000 acres) south and east of Lake Okeechobee currently owned by the U.S. Sugar Corporation under
a program dubbed Reviving the River of Grass. This land is primarily used to grow sugar cane. If the state
can successfully negotiate and finance this purchase, cane production will eventually be phased out of
over several years and the land converted to water treatment areas or restored to nature, greatly
increasing water available for the region. Although this land acquisition has delayed CERP temporarily, if
successful, it will greatly enhance the restoration plan.
Figure 62 - Wastewater discharge and reuse options. Ocean discharge and deep well injection are currently primary means of disposal. Ocean outfalls are being eliminated under state legislation out of environmental concerns. (Crouse; Garcia; Broward County, 2008)
Figure 61 - Broward County wastewater disposition as of 2006. (SFWMD). Approx. 57% goes to deep well injection, 37% to ocean outfall, and 5% to reuse.
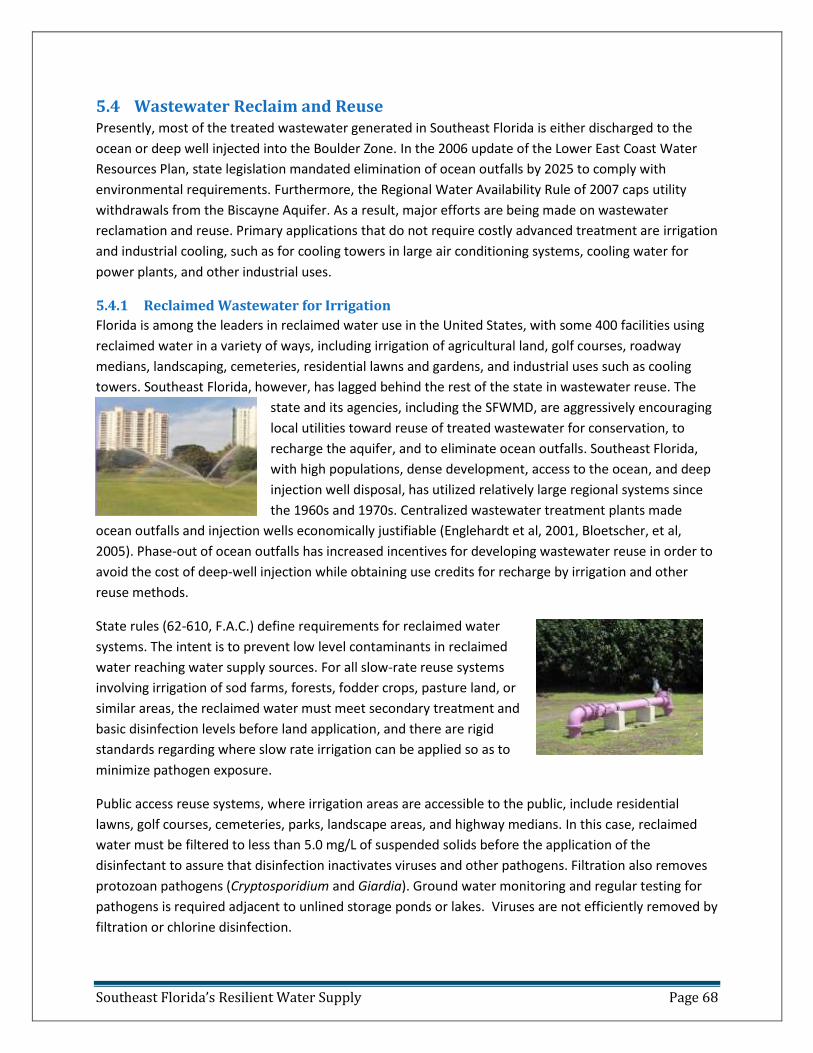
Southeast Florida’s Resilient Water Supply Page 68
5.4 Wastewater Reclaim and Reuse Presently, most of the treated wastewater generated in Southeast Florida is either discharged to the
ocean or deep well injected into the Boulder Zone. In the 2006 update of the Lower East Coast Water
Resources Plan, state legislation mandated elimination of ocean outfalls by 2025 to comply with
environmental requirements. Furthermore, the Regional Water Availability Rule of 2007 caps utility
withdrawals from the Biscayne Aquifer. As a result, major efforts are being made on wastewater
reclamation and reuse. Primary applications that do not require costly advanced treatment are irrigation
and industrial cooling, such as for cooling towers in large air conditioning systems, cooling water for
power plants, and other industrial uses.
5.4.1 Reclaimed Wastewater for Irrigation
Florida is among the leaders in reclaimed water use in the United States, with some 400 facilities using
reclaimed water in a variety of ways, including irrigation of agricultural land, golf courses, roadway
medians, landscaping, cemeteries, residential lawns and gardens, and industrial uses such as cooling
towers. Southeast Florida, however, has lagged behind the rest of the state in wastewater reuse. The
state and its agencies, including the SFWMD, are aggressively encouraging
local utilities toward reuse of treated wastewater for conservation, to
recharge the aquifer, and to eliminate ocean outfalls. Southeast Florida,
with high populations, dense development, access to the ocean, and deep
injection well disposal, has utilized relatively large regional systems since
the 1960s and 1970s. Centralized wastewater treatment plants made
ocean outfalls and injection wells economically justifiable (Englehardt et al, 2001, Bloetscher, et al,
2005). Phase-out of ocean outfalls has increased incentives for developing wastewater reuse in order to
avoid the cost of deep-well injection while obtaining use credits for recharge by irrigation and other
reuse methods.
State rules (62-610, F.A.C.) define requirements for reclaimed water
systems. The intent is to prevent low level contaminants in reclaimed
water reaching water supply sources. For all slow-rate reuse systems
involving irrigation of sod farms, forests, fodder crops, pasture land, or
similar areas, the reclaimed water must meet secondary treatment and
basic disinfection levels before land application, and there are rigid
standards regarding where slow rate irrigation can be applied so as to
minimize pathogen exposure.
Public access reuse systems, where irrigation areas are accessible to the public, include residential
lawns, golf courses, cemeteries, parks, landscape areas, and highway medians. In this case, reclaimed
water must be filtered to less than 5.0 mg/L of suspended solids before the application of the
disinfectant to assure that disinfection inactivates viruses and other pathogens. Filtration also removes
protozoan pathogens (Cryptosporidium and Giardia). Ground water monitoring and regular testing for
pathogens is required adjacent to unlined storage ponds or lakes. Viruses are not efficiently removed by
filtration or chlorine disinfection.
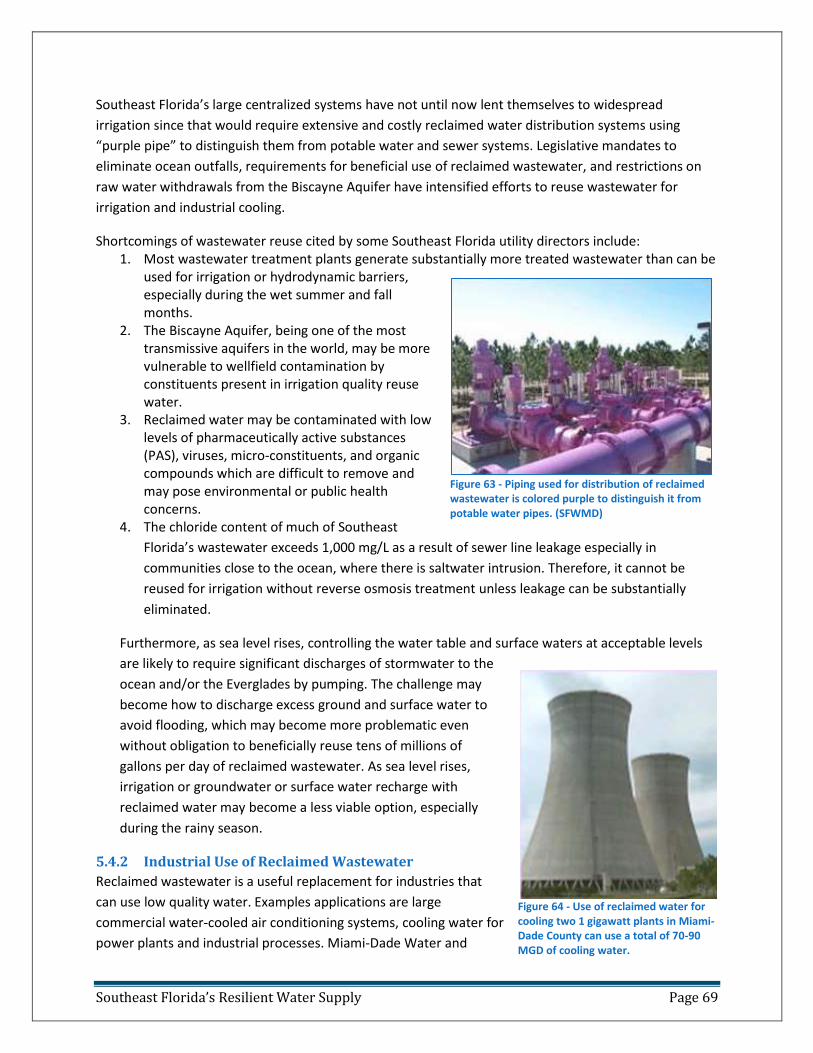
Southeast Florida’s Resilient Water Supply Page 69
Southeast Florida’s large centralized systems have not until now lent themselves to widespread
irrigation since that would require extensive and costly reclaimed water distribution systems using
“purple pipe” to distinguish them from potable water and sewer systems. Legislative mandates to
eliminate ocean outfalls, requirements for beneficial use of reclaimed wastewater, and restrictions on
raw water withdrawals from the Biscayne Aquifer have intensified efforts to reuse wastewater for
irrigation and industrial cooling.
Shortcomings of wastewater reuse cited by some Southeast Florida utility directors include: 1. Most wastewater treatment plants generate substantially more treated wastewater than can be
used for irrigation or hydrodynamic barriers, especially during the wet summer and fall months.
2. The Biscayne Aquifer, being one of the most transmissive aquifers in the world, may be more vulnerable to wellfield contamination by constituents present in irrigation quality reuse water.
3. Reclaimed water may be contaminated with low levels of pharmaceutically active substances (PAS), viruses, micro-constituents, and organic compounds which are difficult to remove and may pose environmental or public health concerns.
4. The chloride content of much of Southeast
Florida’s wastewater exceeds 1,000 mg/L as a result of sewer line leakage especially in
communities close to the ocean, where there is saltwater intrusion. Therefore, it cannot be
reused for irrigation without reverse osmosis treatment unless leakage can be substantially
eliminated.
Furthermore, as sea level rises, controlling the water table and surface waters at acceptable levels
are likely to require significant discharges of stormwater to the
ocean and/or the Everglades by pumping. The challenge may
become how to discharge excess ground and surface water to
avoid flooding, which may become more problematic even
without obligation to beneficially reuse tens of millions of
gallons per day of reclaimed wastewater. As sea level rises,
irrigation or groundwater or surface water recharge with
reclaimed water may become a less viable option, especially
during the rainy season.
5.4.2 Industrial Use of Reclaimed Wastewater
Reclaimed wastewater is a useful replacement for industries that
can use low quality water. Examples applications are large
commercial water-cooled air conditioning systems, cooling water for
power plants and industrial processes. Miami-Dade Water and
Figure 63 - Piping used for distribution of reclaimed wastewater is colored purple to distinguish it from potable water pipes. (SFWMD)
Figure 64 - Use of reclaimed water for cooling two 1 gigawatt plants in Miami-Dade County can use a total of 70-90 MGD of cooling water.

Southeast Florida’s Resilient Water Supply Page 70
Sewer Department is considering supplying about 70-90 MGD of treated wastewater to Florida Power
and Light Company’s Turkey Point nuclear power plant. FPL has two nuclear power plants at Turkey
Point and two new ones are planned. Since over 60% of the water used in the cooling towers is
evaporated, this could be a significant beneficial use of a substantial amount of treated wastewater.
Concurrent municipal and agricultural usage has increased demands on groundwater sources in many
places. Water quality requirements for human and ecosystem use are typically higher than those
needed for agricultural or industrial use. Wastewater reuse rules for agriculture, golf courses, lawns, etc.
require matching evapotranspiration rates.
The cost of implementing reclaimed water use systems is $3-5/GPD in capital costs for standard
filtration, enhanced disinfection, storage, and pumping. The cost to implement reuse at all large facilities
in Southeast Florida could approach $2.5 billion and advanced wastewater treatment could increase
capital costs by another $2 billion.
5.5 Regionalization of Alternative Water Supplies and Reclamation Projects Regionalization can offer opportunities for development of advanced water treatment technologies
while reducing the incremental impacts to water utility rate payers through sharing of costs and risks
and taking advantage of economies of scale. Such projects are difficult to organize because of difficulties
in deciding how responsibility and authority should be divided. Participating utilities, including small
utilities, can substantially reduce investments and operating costs on a pro rata basis. Furthermore, it
enables economies of scale through higher utilization of available resources and centralized
management.
Examples of successful regional water supply partnerships are the large desalination facility at Tampa
Figure 65 - Example of how regional partnerships can offer substantial economies of scale, especially when new capacity can be added onto an existing facility. (Perez, 2009)
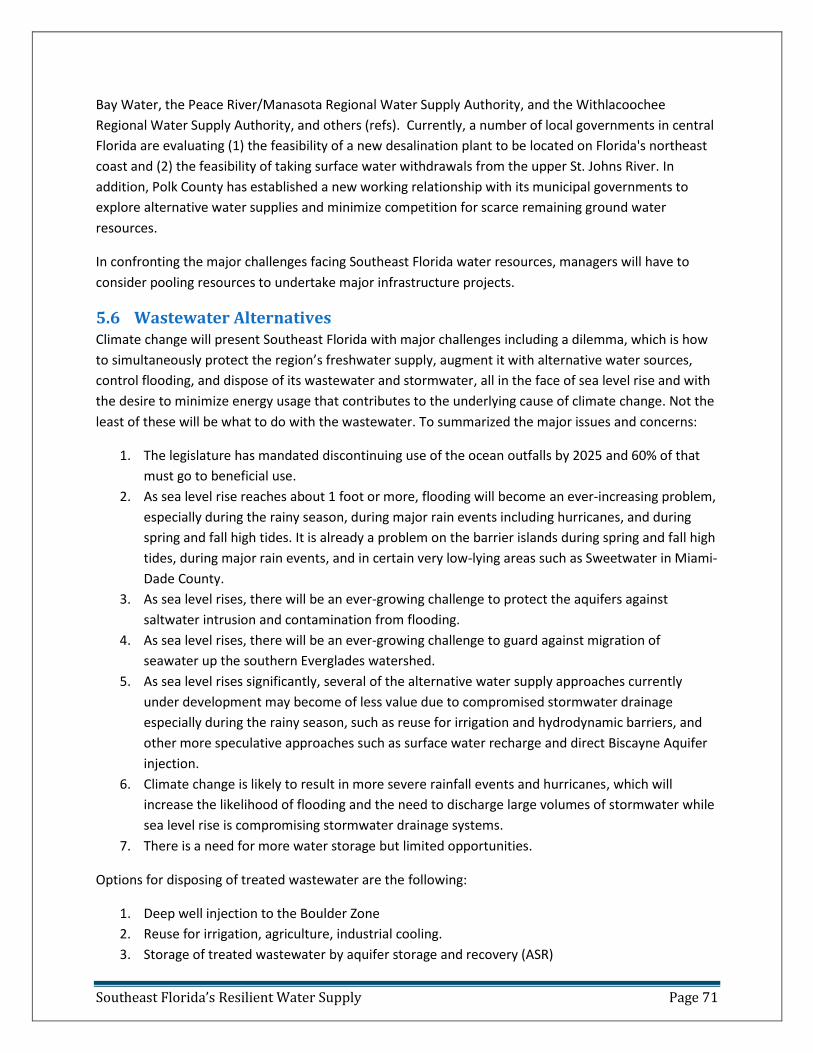
Southeast Florida’s Resilient Water Supply Page 71
Bay Water, the Peace River/Manasota Regional Water Supply Authority, and the Withlacoochee
Regional Water Supply Authority, and others (refs). Currently, a number of local governments in central
Florida are evaluating (1) the feasibility of a new desalination plant to be located on Florida's northeast
coast and (2) the feasibility of taking surface water withdrawals from the upper St. Johns River. In
addition, Polk County has established a new working relationship with its municipal governments to
explore alternative water supplies and minimize competition for scarce remaining ground water
resources.
In confronting the major challenges facing Southeast Florida water resources, managers will have to
consider pooling resources to undertake major infrastructure projects.
5.6 Wastewater Alternatives Climate change will present Southeast Florida with major challenges including a dilemma, which is how
to simultaneously protect the region’s freshwater supply, augment it with alternative water sources,
control flooding, and dispose of its wastewater and stormwater, all in the face of sea level rise and with
the desire to minimize energy usage that contributes to the underlying cause of climate change. Not the
least of these will be what to do with the wastewater. To summarized the major issues and concerns:
1. The legislature has mandated discontinuing use of the ocean outfalls by 2025 and 60% of that
must go to beneficial use.
2. As sea level rise reaches about 1 foot or more, flooding will become an ever-increasing problem,
especially during the rainy season, during major rain events including hurricanes, and during
spring and fall high tides. It is already a problem on the barrier islands during spring and fall high
tides, during major rain events, and in certain very low-lying areas such as Sweetwater in Miami-
Dade County.
3. As sea level rises, there will be an ever-growing challenge to protect the aquifers against
saltwater intrusion and contamination from flooding.
4. As sea level rises, there will be an ever-growing challenge to guard against migration of
seawater up the southern Everglades watershed.
5. As sea level rises significantly, several of the alternative water supply approaches currently
under development may become of less value due to compromised stormwater drainage
especially during the rainy season, such as reuse for irrigation and hydrodynamic barriers, and
other more speculative approaches such as surface water recharge and direct Biscayne Aquifer
injection.
6. Climate change is likely to result in more severe rainfall events and hurricanes, which will
increase the likelihood of flooding and the need to discharge large volumes of stormwater while
sea level rise is compromising stormwater drainage systems.
7. There is a need for more water storage but limited opportunities.
Options for disposing of treated wastewater are the following:
1. Deep well injection to the Boulder Zone
2. Reuse for irrigation, agriculture, industrial cooling.
3. Storage of treated wastewater by aquifer storage and recovery (ASR)
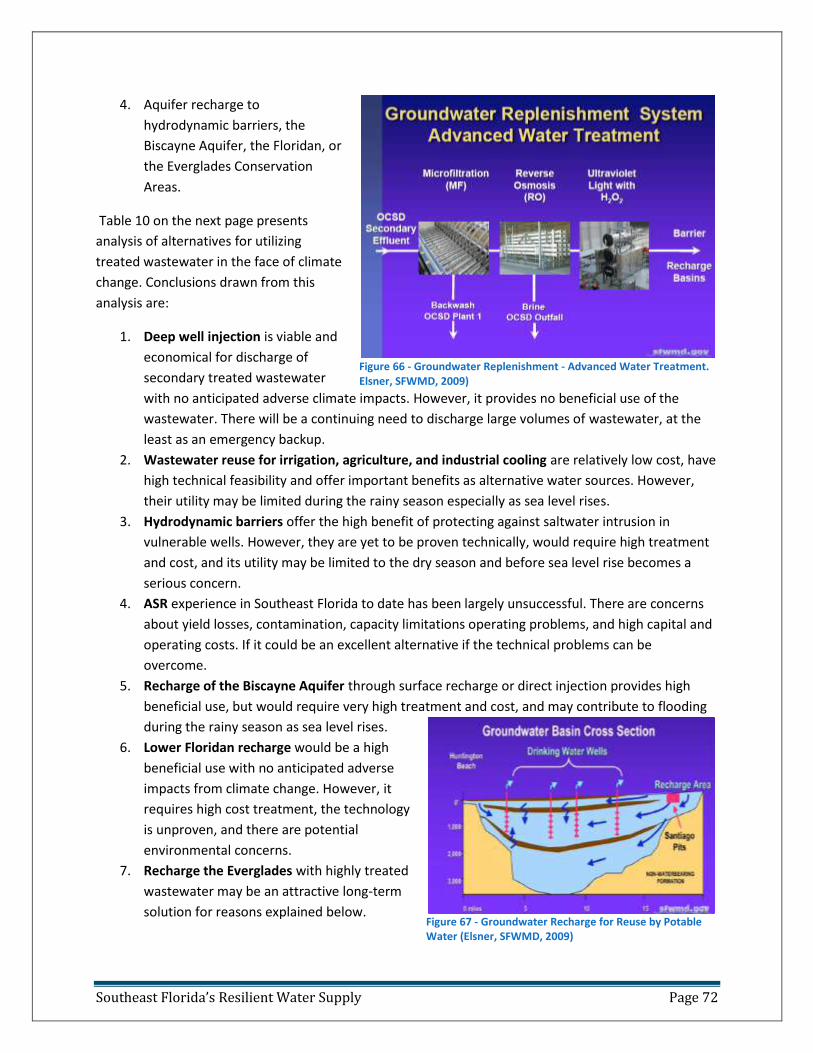
Southeast Florida’s Resilient Water Supply Page 72
4. Aquifer recharge to
hydrodynamic barriers, the
Biscayne Aquifer, the Floridan, or
the Everglades Conservation
Areas.
Table 10 on the next page presents
analysis of alternatives for utilizing
treated wastewater in the face of climate
change. Conclusions drawn from this
analysis are:
1. Deep well injection is viable and
economical for discharge of
secondary treated wastewater
with no anticipated adverse climate impacts. However, it provides no beneficial use of the
wastewater. There will be a continuing need to discharge large volumes of wastewater, at the
least as an emergency backup.
2. Wastewater reuse for irrigation, agriculture, and industrial cooling are relatively low cost, have
high technical feasibility and offer important benefits as alternative water sources. However,
their utility may be limited during the rainy season especially as sea level rises.
3. Hydrodynamic barriers offer the high benefit of protecting against saltwater intrusion in
vulnerable wells. However, they are yet to be proven technically, would require high treatment
and cost, and its utility may be limited to the dry season and before sea level rise becomes a
serious concern.
4. ASR experience in Southeast Florida to date has been largely unsuccessful. There are concerns
about yield losses, contamination, capacity limitations operating problems, and high capital and
operating costs. If it could be an excellent alternative if the technical problems can be
overcome.
5. Recharge of the Biscayne Aquifer through surface recharge or direct injection provides high
beneficial use, but would require very high treatment and cost, and may contribute to flooding
during the rainy season as sea level rises.
6. Lower Floridan recharge would be a high
beneficial use with no anticipated adverse
impacts from climate change. However, it
requires high cost treatment, the technology
is unproven, and there are potential
environmental concerns.
7. Recharge the Everglades with highly treated
wastewater may be an attractive long-term
solution for reasons explained below.
Figure 66 - Groundwater Replenishment - Advanced Water Treatment. Elsner, SFWMD, 2009)
Figure 67 - Groundwater Recharge for Reuse by Potable Water (Elsner, SFWMD, 2009)
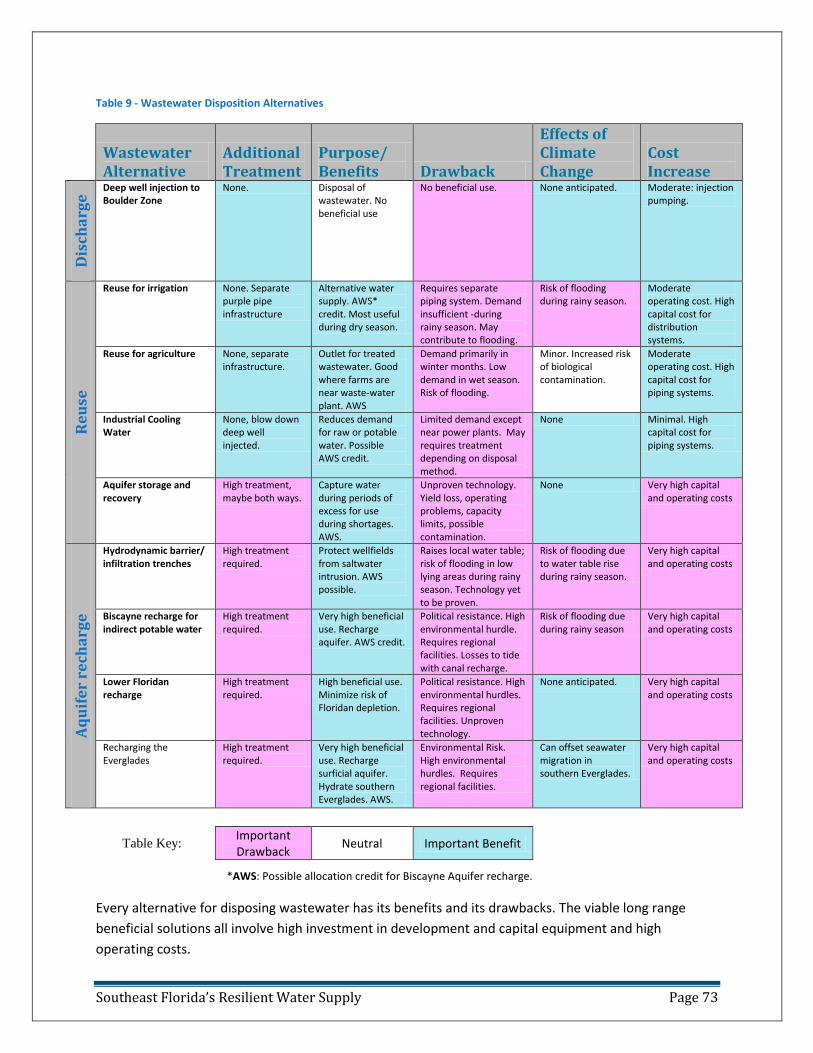
Southeast Florida’s Resilient Water Supply Page 73
Table 9 - Wastewater Disposition Alternatives
Wastewater Alternative
Additional Treatment
Purpose/ Benefits Drawback
Effects of Climate Change
Cost Increase
Dis
cha
rge
Deep well injection to Boulder Zone
None. Disposal of wastewater. No beneficial use
No beneficial use. None anticipated. Moderate: injection pumping.
Re
use
Reuse for irrigation None. Separate purple pipe infrastructure
Alternative water supply. AWS* credit. Most useful during dry season.
Requires separate piping system. Demand insufficient -during rainy season. May contribute to flooding.
Risk of flooding during rainy season.
Moderate operating cost. High capital cost for distribution systems.
Reuse for agriculture None, separate infrastructure.
Outlet for treated wastewater. Good where farms are near waste-water plant. AWS
Demand primarily in winter months. Low demand in wet season. Risk of flooding.
Minor. Increased risk of biological contamination.
Moderate operating cost. High capital cost for piping systems.
Industrial Cooling Water
None, blow down deep well injected.
Reduces demand for raw or potable water. Possible AWS credit.
Limited demand except near power plants. May requires treatment depending on disposal method.
None Minimal. High capital cost for piping systems.
Aquifer storage and recovery
High treatment, maybe both ways.
Capture water during periods of excess for use during shortages. AWS.
Unproven technology. Yield loss, operating problems, capacity limits, possible contamination.
None Very high capital and operating costs
Aq
uif
er
rech
arg
e
Hydrodynamic barrier/ infiltration trenches
High treatment required.
Protect wellfields from saltwater intrusion. AWS possible.
Raises local water table; risk of flooding in low lying areas during rainy season. Technology yet to be proven.
Risk of flooding due to water table rise during rainy season.
Very high capital and operating costs
Biscayne recharge for indirect potable water
High treatment required.
Very high beneficial use. Recharge aquifer. AWS credit.
Political resistance. High environmental hurdle. Requires regional facilities. Losses to tide with canal recharge.
Risk of flooding due during rainy season
Very high capital and operating costs
Lower Floridan recharge
High treatment required.
High beneficial use. Minimize risk of Floridan depletion.
Political resistance. High environmental hurdles. Requires regional facilities. Unproven technology.
None anticipated. Very high capital and operating costs
Recharging the Everglades
High treatment required.
Very high beneficial use. Recharge surficial aquifer. Hydrate southern Everglades. AWS.
Environmental Risk. High environmental hurdles. Requires regional facilities.
Can offset seawater migration in southern Everglades.
Very high capital and operating costs
*AWS: Possible allocation credit for Biscayne Aquifer recharge.
Every alternative for disposing wastewater has its benefits and its drawbacks. The viable long range
beneficial solutions all involve high investment in development and capital equipment and high
operating costs.
Table Key: Important Drawback
Neutral Important Benefit
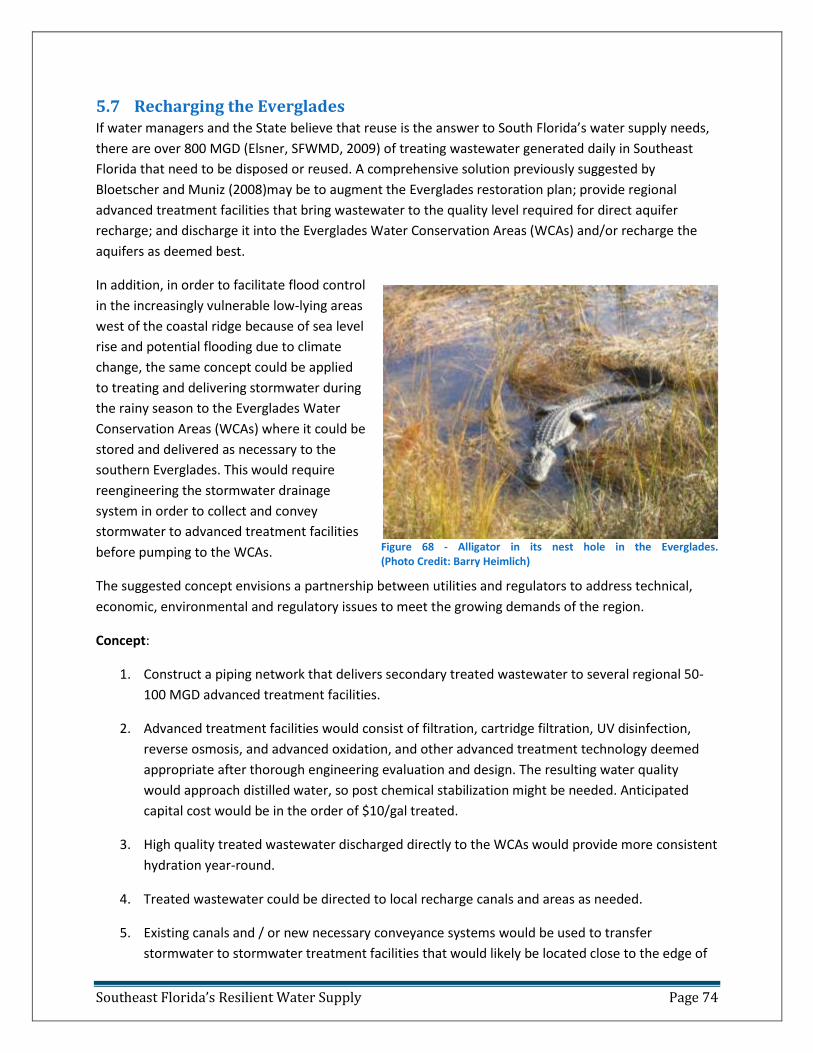
Southeast Florida’s Resilient Water Supply Page 74
5.7 Recharging the Everglades If water managers and the State believe that reuse is the answer to South Florida’s water supply needs,
there are over 800 MGD (Elsner, SFWMD, 2009) of treating wastewater generated daily in Southeast
Florida that need to be disposed or reused. A comprehensive solution previously suggested by
Bloetscher and Muniz (2008)may be to augment the Everglades restoration plan; provide regional
advanced treatment facilities that bring wastewater to the quality level required for direct aquifer
recharge; and discharge it into the Everglades Water Conservation Areas (WCAs) and/or recharge the
aquifers as deemed best.
In addition, in order to facilitate flood control
in the increasingly vulnerable low-lying areas
west of the coastal ridge because of sea level
rise and potential flooding due to climate
change, the same concept could be applied
to treating and delivering stormwater during
the rainy season to the Everglades Water
Conservation Areas (WCAs) where it could be
stored and delivered as necessary to the
southern Everglades. This would require
reengineering the stormwater drainage
system in order to collect and convey
stormwater to advanced treatment facilities
before pumping to the WCAs.
The suggested concept envisions a partnership between utilities and regulators to address technical,
economic, environmental and regulatory issues to meet the growing demands of the region.
Concept:
1. Construct a piping network that delivers secondary treated wastewater to several regional 50-
100 MGD advanced treatment facilities.
2. Advanced treatment facilities would consist of filtration, cartridge filtration, UV disinfection,
reverse osmosis, and advanced oxidation, and other advanced treatment technology deemed
appropriate after thorough engineering evaluation and design. The resulting water quality
would approach distilled water, so post chemical stabilization might be needed. Anticipated
capital cost would be in the order of $10/gal treated.
3. High quality treated wastewater discharged directly to the WCAs would provide more consistent
hydration year-round.
4. Treated wastewater could be directed to local recharge canals and areas as needed.
5. Existing canals and / or new necessary conveyance systems would be used to transfer
stormwater to stormwater treatment facilities that would likely be located close to the edge of
Figure 68 - Alligator in its nest hole in the Everglades. (Photo Credit: Barry Heimlich)
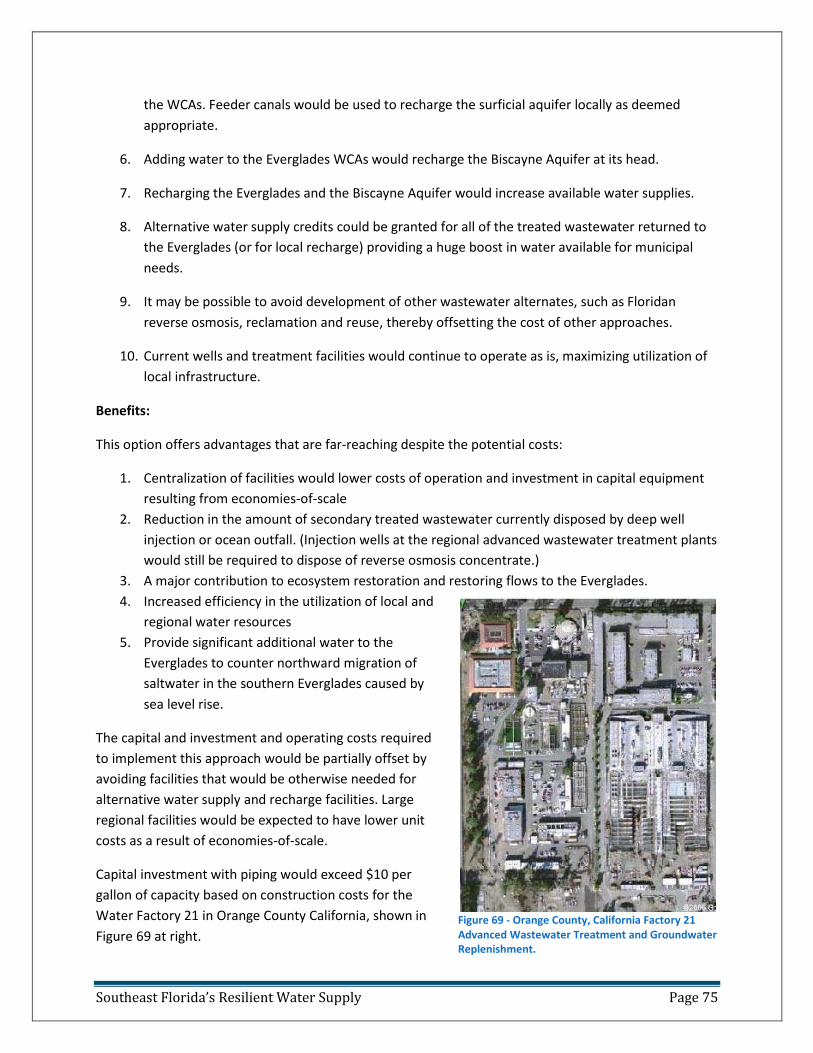
Southeast Florida’s Resilient Water Supply Page 75
the WCAs. Feeder canals would be used to recharge the surficial aquifer locally as deemed
appropriate.
6. Adding water to the Everglades WCAs would recharge the Biscayne Aquifer at its head.
7. Recharging the Everglades and the Biscayne Aquifer would increase available water supplies.
8. Alternative water supply credits could be granted for all of the treated wastewater returned to
the Everglades (or for local recharge) providing a huge boost in water available for municipal
needs.
9. It may be possible to avoid development of other wastewater alternates, such as Floridan
reverse osmosis, reclamation and reuse, thereby offsetting the cost of other approaches.
10. Current wells and treatment facilities would continue to operate as is, maximizing utilization of
local infrastructure.
Benefits:
This option offers advantages that are far-reaching despite the potential costs:
1. Centralization of facilities would lower costs of operation and investment in capital equipment
resulting from economies-of-scale
2. Reduction in the amount of secondary treated wastewater currently disposed by deep well
injection or ocean outfall. (Injection wells at the regional advanced wastewater treatment plants
would still be required to dispose of reverse osmosis concentrate.)
3. A major contribution to ecosystem restoration and restoring flows to the Everglades.
4. Increased efficiency in the utilization of local and
regional water resources
5. Provide significant additional water to the
Everglades to counter northward migration of
saltwater in the southern Everglades caused by
sea level rise.
The capital and investment and operating costs required
to implement this approach would be partially offset by
avoiding facilities that would be otherwise needed for
alternative water supply and recharge facilities. Large
regional facilities would be expected to have lower unit
costs as a result of economies-of-scale.
Capital investment with piping would exceed $10 per
gallon of capacity based on construction costs for the
Water Factory 21 in Orange County California, shown in
Figure 69 at right. Figure 69 - Orange County, California Factory 21 Advanced Wastewater Treatment and Groundwater Replenishment.
Southeast Florida’s Resilient Water Supply Page 76
5.8 Reengineering Canal Systems, Control Structures, and Pumping Stormwater management during the rainy season and major rainfall events will become increasingly
difficult as sea level continues to rise to levels approaching and exceeding current water table levels. As
explained in Section 4.2, the risk of flooding will increase as sea level rise causes reduced groundwater
flow, compromises the flow capacity of the storm drainage system and coastal structures, and may
cause water tables to rise.
As sea level rises, beneficial use of treated wastewater for irrigation or hydrodynamic saltwater barriers
during the rainy season may become less practical.
If seas rise by up to 3 feet or more, the southern Everglades are likely to be dramatically changed. There
may be a point where freshwater flow alone will not prevent the southern Everglades from becoming a
brackish environment. When that happens, Southeast Florida’s primary water source may be
progressively threatened from the west by saltwater contamination. In order to extend the habitability
of the region for as long as possible, dramatic engineering solutions may be required. Hopefully, but
only if early global mitigation of the causes of climate change is achieved, Southeast Florida can be
spared from the worst consequences of ever-increasing sea levels of 3 to 4 feet and more.
Historically, the natural flow of water from the western floodplains of Southeast Florida was to the west.
The major goal of CERP is to restore the sheet flow that took place in the Everglades prior to its being
redirected through the primary canals to the Atlantic Ocean. Reengineering the canal systems west of
the coastal ridge to direct stormwater to the Everglades Water Conservation Areas in a similar manner
as discussed for treated wastewater in Section 5.7 may be worthy of serious consideration (Bloetscher &
Muniz, Water Supply in South Florida - The New Limitations, 2008). Highly treated wastewater
processed in large-scale regional advanced treatment plants could provide a reliable resource for
Everglades hydration.
Because of Southeast Florida’s porous geology, some believe that it may not be possible to armor its
coasts and waterways against the rising sea. However, without detailed engineering analysis it is
premature to jump to this conclusion. Necessity is the mother of invention. The word ingenuity is the
linguistic root of the word engineer. The question of whether and how this might be accomplished is
beyond the scope of this study, but this is a question that should be answered by civil engineers with the
relevant expertise. Based on informal conversations with members of USACE, armoring Southeast
Florida’s coasts is not beyond possibility and it is worth evaluating when there is so much at stake. It
may be possible to protect most of Southeast Florida’s land and assets with coastal dikes, strategically
locating sea gates, redesigned canals, levees and flood control structures, salinity barriers and locks,
installation of high capacity stormwater pumps, and the like.
Southeast Florida’s Resilient Water Supply Page 77
6 Case Study– Lessons Learned from a Model Municipal Water Utility A Case Study of the City of Pompano Beach Water Utility was conducted in cooperation with the utility’s
management and staff by Frederick Bloetscher, Ph.D., Daniel Meeroff, Ph.D., faculty members of Florida
Atlantic University’s Department of Civil, Environmental and Geomatics Engineering, and Barry Heimlich,
a senior fellow at the Center for Urban and Environmental Solutions at FAU. The Case Study, attached as
Appendix A, describes the water utility’s jurisdiction, governing agencies, raw water sources, water
treatment process plant and processes, plans for growth, plans for development of alternative water
sources, special situations, its expanding wastewater reclamation and reuse program using wastewater
drawn from the County’s ocean outfall line, its efforts to develop hydrodynamic saltwater barriers to
protect its eastern water wellfield from saltwater intrusion, etc. The City does not operate its own
wastewater treatment plant – its sewage is processed at Broward County’s nearby regional wastewater
treatment facility. The Case Study report should be referred to for detailed information including
estimated costs.
The challenge for water suppliers is to determine how to manage the hydrologic cycle in providing water
to service areas, in what quantities, and with what level of reliability (Bloetscher & Muniz, Defining
Sustainabiity for Water Supply Purposes, 2006). The City of Pompano Beach was chosen for the case
study because it is confronting many of the issues faced by utilities in Southeast Florida. Saltwater
intrusion, flooding and storm events are common to all coastal areas of Southeast Florida. However, sea
level rise was found to be the most significant climate change issue the City faces.
The City of Pompano Beach, FL is located in northeast Broward County, along the coast of the Atlantic
Ocean. The City includes three miles of beachfront that extends from the intersection of State Road A1A
and Terra del Mar to the Hillsboro Inlet. Water bodies within the City include the Intracoastal Canal, and
minor canals for drainage. The per capita water usage is projected to be 191 gallons per day. As a
result, the projected annual daily average water demand will increase by 4.96 MGD during the indicated
20 year planning horizon from 2005 to 2025. The City operates two wellfields. The eastern wellfield has
had its permitted withdrawals reduced to a third of installed capacity due to the proximity of the
saltwater intrusion interface. In addition, the City’s overall permitted withdrawals from the Biscayne
aquifer have been reduced after 2010 by over 2 MGD.
Based on an understanding of the City’s service area, the following are the most vulnerable areas of the
system as a result of encroachment from sea level rise:
1. Inundation of certain low-elevation areas with salt water.
2. Contamination of groundwater from sea water inundation and storm surge.
3. Higher water table throughout the service area, which means less capacity to store rainfall.
4. Inundated land on which septic tanks operate. Septic tanks will be jeopardized as the water
table rises. Fortunately there are a limited number of septic tanks in the utility’s service
area.
5. Increased manhole leakage/inflow from saltwater intrusion and surface flooding.
6. An associated increase in chlorides in raw wastewater and hence added treatment required
for reclaimed water for irrigation or aquifer recharge.
Southeast Florida’s Resilient Water Supply Page 78
7. Saltwater migration toward eastern raw water wellfields.
8. Loss of soil capacity for stormwater storage, which means less potential for irrigation with
reclaimed water or other sources as sea level and water tables rise.
These findings mean that the City may:
1. Be forced to rely less on its eastern wellfield due to the potential for increased saltwater
intrusion potential or inundation from storm surge.
2. Need to convert septic tank areas to central sewers since they will likely not function
correctly in the future due to sea level rise.
3. Need to harden the sewer system to prevent inflow that would be contrary to their reuse
goals
4. Need to reconsider reuse efforts in light of lessened soil storage capacity
5. Need to consider infrastructure to protect the wellfields
These challenges bring opportunities for solutions and specific recommendations on action steps that
the utility could consider for improving the resilience of their facilities. For the long-term the City has a
number of efforts it can pursue to harden its water supply, and protect its vulnerable residents from the
impacts of sea level rise. However, rather than dictate a timeline, it would appear to be more
appropriate to match the implementation goals to milestones in the sea level elevation. There are four
scenarios: minimal risk (under 1 foot), low risk (1-2 ft), high risk (2-3 ft), and critical risk (3 ft or more).
Minimal risk (less than 1.0 foot sea level rise, 2020-2060): A slight increase in sea level probably will
create no significant impacts on the utility. Flooding in low-lying areas will increase but localized
solutions like additional stormwater pump stations can alleviate much of these concerns. Increased
inflow to the sewer collection system would indicate that solutions should be implemented to protect
against sea level rise involving the wastewater system infrastructure – G7 program (see Appendix A for
details), and added reclaimed water use to migrate private well users away from the Biscayne aquifer.
Additional implementation of the City’s water conservation program could be pursued immediately and
probably should be to stay ahead of the issue.
Low Risk (1-2 feet sea level rise, 2040-2070): Once it is determined that sea level rise will reach the 1
foot stage within the foreseeable future, the utility should start reviewing desalination options using the
Floridan aquifer, and those associated with salinity barriers. Aquifer recharge, salinity barriers, added
reuse, and similar options would be appropriate actions.
High Risk (2-3 feet sea level rise, 2070-2100): By the time sea level rise is 2 feet, the appropriate steps
should have been taken. Before sea level rise reaches 2 feet, low-lying areas in the east and along the
beach will flood more frequently. While initially a nuisance, people will notice that very small rainstorms
may create significant flooding. The problem will be exacerbated as storm intensities increase and as sea
levels continue to rise.
Critical risk (3 feet or more sea level rise, 2080 or later): As sea level rise increases towards 3 feet, large
areas of the utility service area may flood frequently during rainstorms. Small storms may cause
localized flooding. Pump stations will probably be required to deal with the flooding problem. Reduced
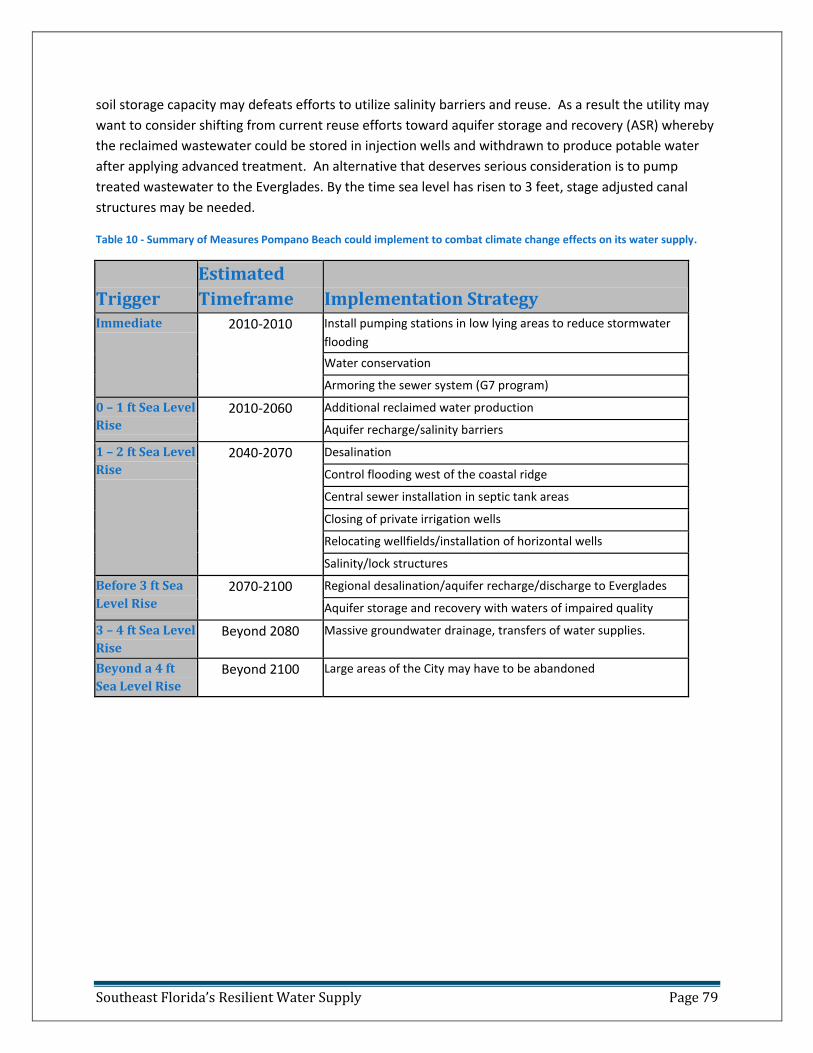
Southeast Florida’s Resilient Water Supply Page 79
soil storage capacity may defeats efforts to utilize salinity barriers and reuse. As a result the utility may
want to consider shifting from current reuse efforts toward aquifer storage and recovery (ASR) whereby
the reclaimed wastewater could be stored in injection wells and withdrawn to produce potable water
after applying advanced treatment. An alternative that deserves serious consideration is to pump
treated wastewater to the Everglades. By the time sea level has risen to 3 feet, stage adjusted canal
structures may be needed.
Table 10 - Summary of Measures Pompano Beach could implement to combat climate change effects on its water supply.
Trigger
Estimated
Timeframe Implementation Strategy Immediate 2010-2010 Install pumping stations in low lying areas to reduce stormwater
flooding
Water conservation
Armoring the sewer system (G7 program)
0 – 1 ft Sea Level
Rise
2010-2060 Additional reclaimed water production
Aquifer recharge/salinity barriers
1 – 2 ft Sea Level
Rise
2040-2070 Desalination
Control flooding west of the coastal ridge
Central sewer installation in septic tank areas
Closing of private irrigation wells
Relocating wellfields/installation of horizontal wells
Salinity/lock structures
Before 3 ft Sea
Level Rise
2070-2100 Regional desalination/aquifer recharge/discharge to Everglades
Aquifer storage and recovery with waters of impaired quality
3 – 4 ft Sea Level
Rise
Beyond 2080 Massive groundwater drainage, transfers of water supplies.
Beyond a 4 ft
Sea Level Rise
Beyond 2100 Large areas of the City may have to be abandoned
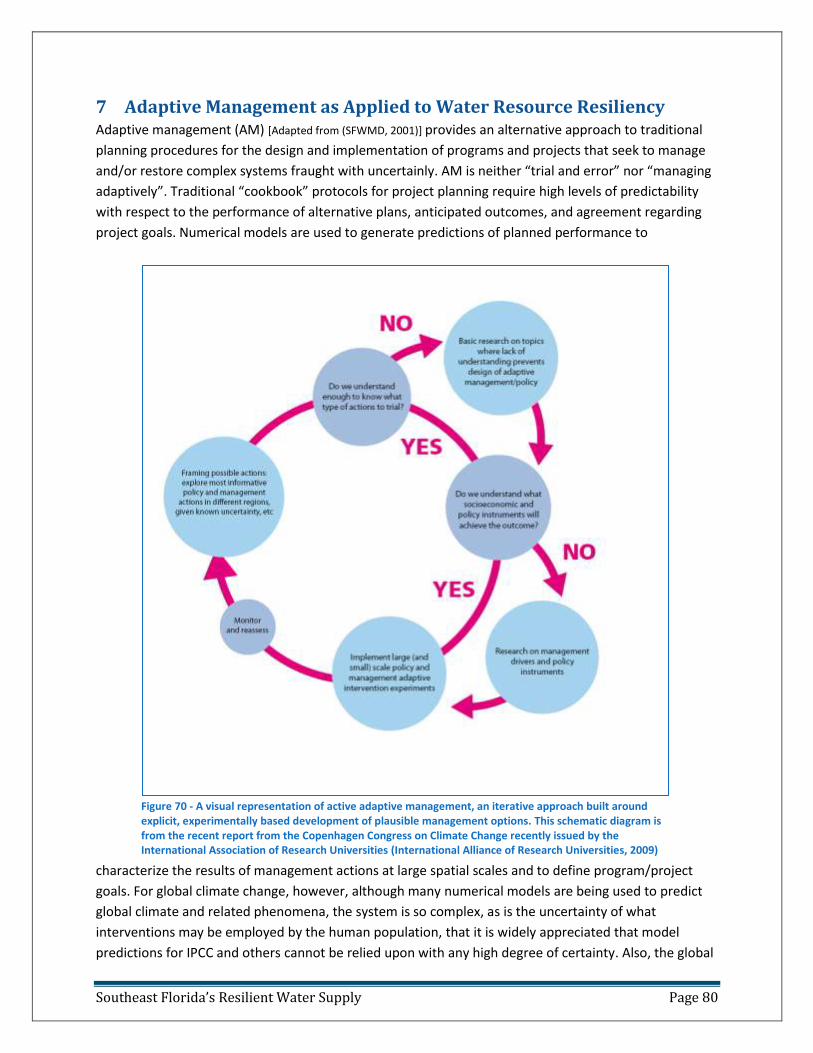
Southeast Florida’s Resilient Water Supply Page 80
7 Adaptive Management as Applied to Water Resource Resiliency Adaptive management (AM) [Adapted from (SFWMD, 2001)] provides an alternative approach to traditional
planning procedures for the design and implementation of programs and projects that seek to manage
and/or restore complex systems fraught with uncertainly. AM is neither “trial and error” nor “managing
adaptively”. Traditional “cookbook” protocols for project planning require high levels of predictability
with respect to the performance of alternative plans, anticipated outcomes, and agreement regarding
project goals. Numerical models are used to generate predictions of planned performance to
characterize the results of management actions at large spatial scales and to define program/project
goals. For global climate change, however, although many numerical models are being used to predict
global climate and related phenomena, the system is so complex, as is the uncertainty of what
interventions may be employed by the human population, that it is widely appreciated that model
predictions for IPCC and others cannot be relied upon with any high degree of certainty. Also, the global
Figure 70 - A visual representation of active adaptive management, an iterative approach built around explicit, experimentally based development of plausible management options. This schematic diagram is from the recent report from the Copenhagen Congress on Climate Change recently issued by the International Association of Research Universities (International Alliance of Research Universities, 2009)

Southeast Florida’s Resilient Water Supply Page 81
system has many feedback mechanisms that are not well understood and cannot be predicted
accurately. This leads to uncertainty about what management decisions should be made and
disagreement about what goals should be set and the most effective routes for achieving any set of
project objectives.
Adaptive management is an adaptation of the scientific process, i.e. hypothesis, experimentation,
measuring outcomes, comparison of observed results versus expectations, hypothesis revision taking
into account the new observations, and experimenting again. Adaptive management is applied in
environmental, sociological, economic, and political programs. It is used to manage actual undertakings
where there is risk and uncertainty, not experimental research and hypothetical models. AM integrates
goal setting, program design, planning, execution, systematic monitoring to test assumptions, learning
from the new information and unanticipated results, adaptation, resetting goals and plans, and
continuing the iterative process until the desired goals are achieved or abandoned as unachievable or no
longer desirable.
To help address these uncertainties, and to improve the performance of a restoration project, AM has
evolved to deal with the challenges inherent in predicting and restoring large-scale complex ecosystems.
AM replaces the current dependencies on numerical models and traditional planning guidelines by
applying a focused “learning-by-doing” approach to decision-making. The “learning-by-doing” approach
is proactive – it is an iterative and deliberate process of applying principles of scientific investigation to
the design and implementation of restoration projects to better understand the ecosystem and to
reduce the key uncertainties, as a basis for continuously refining the program/project design and
operation. New information that can guide a project plan can include results from scientific research and
monitoring, new or updated modeling information gleaned from iterative project implementation and
as input from managers and the public. Potential applications of this “learning by doing” AM approach
include: (1) transfer of lessons learned from one program/project to another to avoid pitfalls; (2) use of
physical models/modeling to test possible outcomes of management decisions; and (3) incorporation of
flexibility and versatility into project design and implementation.
There are many reasons why AM is well suited for regional climate change adaptation programs since it
improves the chance of success in meeting program/project goals in light of the large uncertainties
associated with climate change and the wide range of opinions and options concerning desired
outcomes. AM fosters the success of project planning, implementation, and assessment by applying the
following principles:
1. Use of scientific inquiry to address the most important structural, operational, and scientific
questions;
2. Incorporation of robustness (i.e., maintaining design and operational options) into project
design;
3. Use of feedback loops that iteratively feed new information into the decision-making process for
planning, implementation and assessment of project components;
4. Emphasis on an open, inclusive, and integrative process for design and implementation of
adaptation programs/projects; and
Southeast Florida’s Resilient Water Supply Page 82
5. Emphasis on collaboration and conflict resolution in order to reconcile competing scientific and
socioeconomic objectives.
These principles maximize learning to address key uncertainties and disagreements and help build an
expanding body of knowledge that will support both current and future decision-making. The
continuously updated body of knowledge and open collaborative process facilitate consensus on the
ultimate plan design and the desired endpoints. Because decision-making in an atmosphere of
uncertainty can lead to an uninformed and distrustful public, AM incorporates active collaboration the
purpose of creating an informed and contributing public, and for bridging gaps in communication and
understanding among the public, the scientific community, and managers responsible for implementing
the program.
In summary, the use of AM is essential for achieving program/project objectives in any situation where
there are comparatively high levels of uncertainty and/or disagreement about: (1) the validity,
complexity, and predictability of global climate change; (2) the most effective design and operation to
achieve program/project goals; and (3) what constitutes program/project success. In these situations,
applying the principles and guidelines of AM is a means of reducing the hurdles to planning and
program/project implementation caused by uncertainty and a lack of consensus.
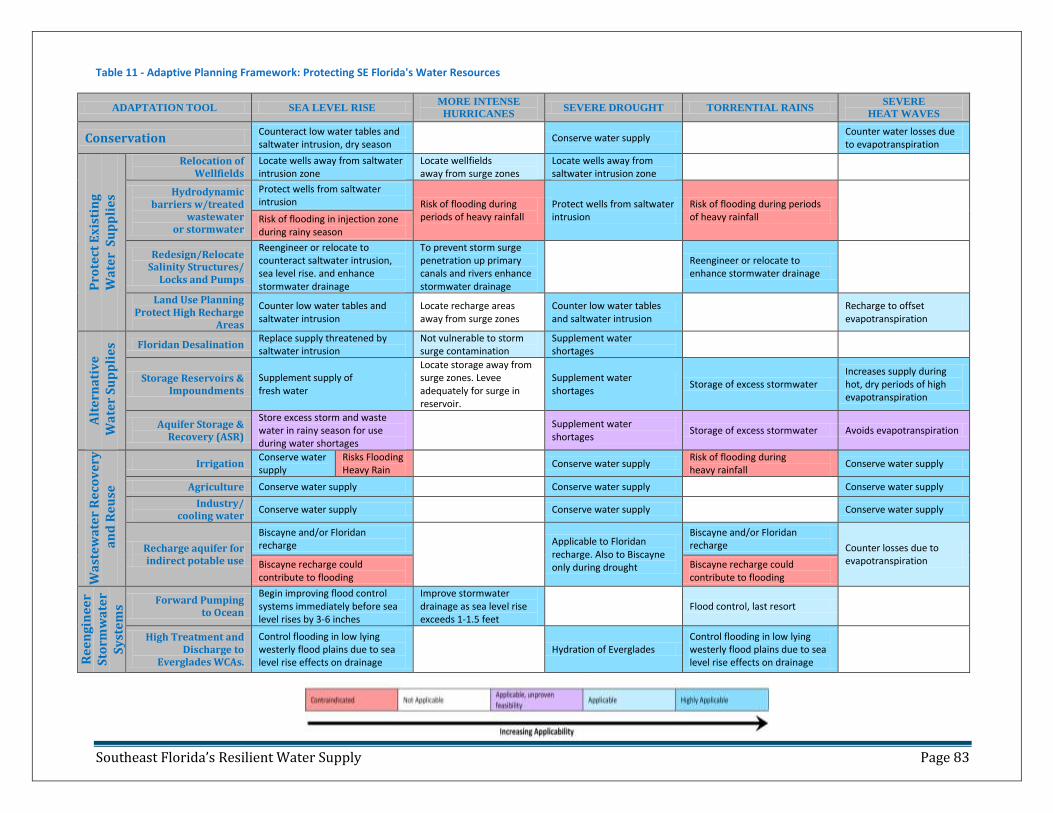
Southeast Florida’s Resilient Water Supply Page 83
Table 11 - Adaptive Planning Framework: Protecting SE Florida's Water Resources
ADAPTATION TOOL SEA LEVEL RISE MORE INTENSE
HURRICANES SEVERE DROUGHT TORRENTIAL RAINS
SEVERE
HEAT WAVES
Conservation Counteract low water tables and saltwater intrusion, dry season
Conserve water supply Counter water losses due to evapotranspiration
Pro
tect
Ex
isti
ng
W
ate
r S
up
pli
es
Relocation of Wellfields
Locate wells away from saltwater intrusion zone
Locate wellfields away from surge zones
Locate wells away from saltwater intrusion zone
Hydrodynamic barriers w/treated
wastewater or stormwater
Protect wells from saltwater intrusion Risk of flooding during
periods of heavy rainfall Protect wells from saltwater intrusion
Risk of flooding during periods of heavy rainfall
Risk of flooding in injection zone during rainy season
Redesign/Relocate Salinity Structures/
Locks and Pumps
Reengineer or relocate to counteract saltwater intrusion, sea level rise. and enhance stormwater drainage
To prevent storm surge penetration up primary canals and rivers enhance stormwater drainage
Reengineer or relocate to enhance stormwater drainage
Land Use Planning Protect High Recharge
Areas
Counter low water tables and saltwater intrusion
Locate recharge areas away from surge zones
Counter low water tables and saltwater intrusion
Recharge to offset evapotranspiration
Alt
ern
ati
ve
W
ate
r S
up
pli
es
Floridan Desalination Replace supply threatened by saltwater intrusion
Not vulnerable to storm surge contamination
Supplement water shortages
Storage Reservoirs & Impoundments
Supplement supply of fresh water
Locate storage away from surge zones. Levee adequately for surge in reservoir.
Supplement water shortages
Storage of excess stormwater Increases supply during hot, dry periods of high evapotranspiration
Aquifer Storage & Recovery (ASR)
Store excess storm and waste water in rainy season for use during water shortages
Supplement water shortages
Storage of excess stormwater Avoids evapotranspiration
Wa
ste
wa
ter
Re
cov
ery
a
nd
Re
use
Irrigation Conserve water supply
Risks Flooding Heavy Rain
Conserve water supply Risk of flooding during heavy rainfall
Conserve water supply
Agriculture Conserve water supply Conserve water supply Conserve water supply
Industry/ cooling water
Conserve water supply Conserve water supply Conserve water supply
Recharge aquifer for indirect potable use
Biscayne and/or Floridan recharge
Applicable to Floridan recharge. Also to Biscayne only during drought
Biscayne and/or Floridan recharge Counter losses due to
evapotranspiration Biscayne recharge could contribute to flooding
Biscayne recharge could contribute to flooding
Re
en
gin
ee
r
Sto
rmw
ate
r S
yst
em
s
Forward Pumping to Ocean
Begin improving flood control systems immediately before sea level rises by 3-6 inches
Improve stormwater drainage as sea level rise exceeds 1-1.5 feet
Flood control, last resort
High Treatment and Discharge to
Everglades WCAs.
Control flooding in low lying westerly flood plains due to sea level rise effects on drainage
Hydration of Everglades Control flooding in low lying westerly flood plains due to sea level rise effects on drainage
Southeast Florida’s Resilient Water Resources Page 84
8 Adaptive Planning Framework Southeast Florida’s water resources are seriously challenged by the prospect of climate change and its
expected impacts in the region. In order to determine which tools would be most appropriate to use in
response to those impacts, a matrix of impacts versus adaptation tools was developed (Table 11 on the
previous page) in order to establish which tools would be most applicable for responding to each
climate impact. The note in each cell describes the major reason or goal for application of that tool to
that impact. The matrix is color coded to indicate degree of applicability as follows:
8.1 Issues to Consider 1. Relating to Sea Level Rise and Saltwater Intrusion
1.1. There is uncertainty about the extent and rate of sea level rise. More reliable predictions of sea
level rise are needed.
1.2. Sea level rise will increase the threat of saltwater intrusion. Since water tables must be
controlled at near current levels, hydrological theory predicts that significant inland migration
of the saltwater interface is likely to occur.
1.3. Sea level rise will reduce groundwater flow and compromise stormwater drainage and flood
control systems.
1.4. As sea level rise approaches the level of the water table, it may become impractical or
impossible to prevent water tables from rising since the aquifer is recharged by heavy rainfall,
especially during the wet season. Elevated water tables will reduce soil storage capacity and
increase the risk of flooding.
1.5. Sea level rise may reduce the amount of fresh water available for withdrawal as groundwater
flow toward the ocean decreases and saltwater intrusion increases as a result of backpressure
from the ocean.
1.6. Desalination by reverse osmosis of supplies from the Biscayne Aquifer may become necessary
as saltwater intrusion causes increases in salinity.
2. Relating to Other Climate Change Impacts
2.1. Combinations of sea level rise with more severe or prolonged drought, torrential rains, and
intense hurricanes will exacerbate impacts on water resources. Heat waves in combination with
severe drought will intensify their impacts.
3. Relating to Flooding
3.1. The flow capacity of coastal control structures will be adversely affected by reduced head
differential between headwater and tailwater as sea level rises. Preliminary analysis (Section
4.2.3) indicates that there may be significant loss of coastal structure capacity with as little as 3
to 6 inches of sea level rise within the next 10 to 20 years. Engineering studies are needed at
the earliest opportunity to confirm the magnitude of this threat and to plan appropriate
responses.
3.2. Comprehensive integrated regional surface and ground water modeling is needed to predict
how water tables, groundwater flow, and saltwater intrusion will respond to increasing sea
levels.
Southeast Florida’s Resilient Water Resources Page 85
3.3. Hydrological model predictions of effects of sea level rise on stormwater drainage should be
overlaid on topographical maps to predict where and how flooding may occur during major rain
events.
3.4. Since sea level rise will exacerbate the effects of hurricane storm surge, storm surge modeling
studies are needed to predict the magnitude of this effect.
3.5. During the dry season and periods of drought when water tables are low, treated wastewater
reused for irrigation and hydrodynamic barriers may be a tool for offsetting saltwater intrusion.
However, during the rainy season, water tables elevated by sea level rise and heavy rain may
reduce or eliminate the utility of hydrodynamic barriers because of flooding risk.
4. Relating to Adaptive Planning
4.1. Adaptation strategies and policies are needed to protect water resources, land and property.
4.2. A dilemma will be created by the likelihood that there will be freshwater shortages during the
dry winter and spring months and freshwater overabundance during the rainy season that will
challenge capacity to store or discharge excess stormwater. This will call for major public works
projects to convey, store, treat and discard excess stormwater.
4.3. Reengineering of primary canals system will likely be required to manage stormwater drainage.
4.4. Desalination and other advanced water treatment (AWT) methods will substantially raise the
cost of potable water. It will also substantially increase energy usage and the carbon footprint
for potable water treatment, wastewater treatment, stormwater management, and flood
control.
4.5. As sea level rise exceeds 2 to 3 feet, there may be places where flood control may become
impractical or impossible, and it may be necessary to consider various strategic alternatives
including strategic retreat from indefensible areas.
5. Relating to Application of Adaptation Tools
5.1. The extent to which saltwater intrusion can be countered by raising the water table using
conservation and wastewater reclamation and reuse alternatives is limited by flood control
considerations and because reduced soil storage capacity will increase the risk of flooding.
5.2. The ability to reuse treated wastewater for irrigation and aquifer recharge is likely to be
reduced as sea levels rises by 2 to 3 feet or more. The possibility of rising water tables and
reduction of soil storage capacity increases the risk of flooding during the rainy season or
during major rainfall events.
5.3. In the face of sea level rise and intensified rainfall events, high capacity pumps and advanced
water treatment facilities may be needed to discharge stormwater to the ocean and/or the
Everglades.
6. Relating to the Everglades and CERP
6.1. Saline surface water will migrate north in the southern Everglades as sea level rises, threatening
ecosystems and the integrity of the Biscayne Aquifer in southern Miami-Dade County. This
increases incentives for Comprehensive Everglades Restoration Plan (CERP).
6.2. More fresh water flow to the southern Everglades than currently planned may be needed to
offset the threat of saltwater migration up the southern Everglades watershed.
Southeast Florida’s Resilient Water Resources Page 86
6.3. Highly treated wastewater and stormwater could be supplied to the southern Everglades to
help offset saltwater migration. The high cost for new infrastructure and treatment to levels
suitable for discharge to the Everglades may be justified.
8.2 Major Questions 1. How to dispose of excess stormwater runoff during the rainy season and major rain events
and hurricanes as sea level rise compromises the capacity of the stormwater drainage
system?
2. How much stormwater forward pumping capacity will be needed as a function sea level
rise?
3. How best to draw off, capture, and store stormwater?
4. How best to move, treat, and distribute stormwater to Everglades?
5. How to control flooding in the coastal areas and low-lying westerly flood plains?
6. How best to discharge water to tide or the Everglades during emergency flooding events?
7. How much freshwater flow is needed to offset migration of seawater up southern
Everglades?
8. How to improve the resiliency of the barrier islands and low-lying coastal areas?
9. Is coastal armoring feasible for defense against hurricane storm surge?
10. How to moderate or adapt to coastal inundation due to sea level rise?
11. How to dispose of excess wastewater that cannot be used for irrigation and hydrodynamic
barriers?
12. What should be the criteria and policy for land use in areas that will become more flood-
prone?
13. What criteria and policy should be set for restricting development in areas vulnerable to
sea level rise?
14. What criteria and policy should be established for deciding when and how to fortify or
abandon vulnerable areas?
8.3 Major Conclusions 1. All of the freshwater sources that can be developed are needed.
a. Fresh water is the primary tool for offsetting sea level rise and saltwater intrusion, for
providing urban and natural area water supply needs, and for forestalling northward
migration of seawater through the southern Everglades watershed.
b. To the extent possible, loss of stormwater to tide during the dry season should be
prevented, and capture and storage during the rainy season should be promoted.
c. More capacity is needed to capture and store stormwater runoff during the rainy season
for use in dry season, such as more stormwater treatment areas, impoundments (such
as C-9 and C-11), reservoirs (such as C-51), and “River of Grass” U.S. Sugar land
acquisition.
2. New approaches to augment flood control systems will be needed as sea level rise compromises
existing systems.
Southeast Florida’s Resilient Water Resources Page 87
3. As sea level rises and with the likelihood of more intense hurricanes, the engineering feasibility
of coastal armor, such as dunes, dikes, seawalls, sea gates, pumping stations, etc. should be
explored.
4. More clean, fresh water will be needed for the Everglades, probably more than currently
anticipated in CERP, to forestall migration of seawater northward up the southern Everglades
watershed as a result of sea level rise.
5. As sea level rise continues to about 2-3 feet or more, water flow alone may become inadequate
for protecting the Everglades from becoming saline and jeopardizing headwaters of the water
supply for urban Southeast Florida. At that time, it may become necessary to stem invasion of
saline water northward through the Everglades watershed.
9 Strategic Recommendations 1. Considering the possibility that Southeast Florida’s stormwater drainage systems, especially its
coastal control structures, could be compromised by sea level rise of as little as 3 to 6 inches,
which could occur by about 2020-2030, engineering evaluation and planning should begin
immediately to assess their vulnerability and determine what steps are needed to improve their
resilience.
2. Conferences and workshops should be convened where regional scientists, engineers, water
managers, planners, policymakers and other stakeholders in Southeast Florida can be informed
of the results of this study and related work being conducted by the South Florida Water
Management District and other agencies, where knowledge can be exchanged and
comprehensive recommendations can be developed for protecting Southeast Florida’s water
resources from the impacts of climate change.
3. Utilities and water resources agencies should develop comprehensive adaptive management
plans that set short, intermediate, and long range goals and establish strategic implementation
strategies for water resources under their jurisdiction that embody the likely impacts of climate
change, and its operational, economic, and environmental effects.
4. The South Florida Water Management District, in cooperation with state universities, Southeast
Florida local government agencies and water utilities and municipal utilities, should establish a
comprehensive research program to develop scientific and technical knowledge relating to the
impacts of climate change and adaptation solutions for the region’s water resources to inform
policy and decision makers.
5. Development of alternative water supplies should be continued to meet increased water
demands of the urban community and the environment while offsetting saltwater intrusion and
other impacts.
6. New approaches will eventually be needed to best utilize excess wastewater and stormwater as
sea level and water tables continue to rise since current approaches for wastewater reclamation
and reuse may become impractical during the wet season.
7. Feasibility studies of large scale regional advanced water treatment facilities should be
undertaken to evaluate:
a. Production if potable water from brackish water, treated wastewater, or stormwater.
Southeast Florida’s Resilient Water Resources Page 88
b. Advanced treatment of stormwater or wastewater for aquifer recharge and/or
Everglades hydration.
c. Potential for realizing economies of scale.
8. In the event that sea level rises by 1½ to 3 feet or more, innovative and aggressive approaches
will be needed to protect the region’s water resources and land from inundation.
10 Policy Recommendations
10.1 State and Local Government Policy Recommendations 1. Climate change should be formally incorporated in all planning and policymaking concerning the
region’s water resources.
2. Current water resource management plans should be reevaluated from the vantage point of
climate change and revised as necessary.
3. State and local governments should reexamine all current and anticipated water resource
development projects to explicitly address climate change and its anticipated impacts.
4. Florida Department of Environmental Protection (FDEP) should upgrade stormwater regulations,
taking the effect of sea level rise and the likelihood of more intense heavy rainfall events and
prolonged drought into consideration.
5. State and local water managers should end their reliance on historic ranges of sea level rise and
climate patterns in water resource planning and establish guidelines that take into account
projections that account for climate change in water resource planning, including potable water,
wastewater treatment, reuse and disposal, stormwater management, and flood control.
6. Local governments should revise land use, zoning, building, and related codes and regulations in
consideration of projected climate change impacts incorporating advanced planning strategies
such as Smart Growth and Low Impact Development.
7. State and local government agencies should coordinate planning, policies, and regulations.
8. Prior to issuing new development permits, the effects of projected climate change impacts
should be required to assure that adequate long-term capacity and infrastructure will be
available for potable water, wastewater, and stormwater management.
9. SFWMD and local governments should collaborate to address advanced wastewater treatment
upgrades and to identify reuse opportunities throughout the region.
10. State and local agencies should establish energy efficiency and greenhouse gas emissions
reduction programs in water, wastewater, and stormwater treatment and distribution facilities.
Consideration should be given to the tradeoffs between energy and water resource
management requirements. Opportunities should be sought to utilize and produce renewable
energy wherever possible.
11. State and local managers should continue emphasis on reducing water demand through
conservation, reclamation and reuse; and fund strategies to make better use of reclaimed
water.
Southeast Florida’s Resilient Water Resources Page 89
12. FDEP, SFWMD and local governments in concert with the US EPA should set science-based
numeric nutrient criteria for reclaimed wastewaters intended for recharge of both the Biscayne
and Floridan aquifers, for recharge into surface waters, and for discharge to the Everglades.
13. SFWMD, the South Florida Everglades Restoration Task Force (SFERTF), relevant federal and
local agencies should reevaluate CERP water requirements, determine the levels and flows
required to rehydrate the Everglades and offset northward migration of saline water caused by
sea level rise and incorporate projected changes in sea level, rainfall patterns, and other impacts
in their planning.
14. USACE and SFWMD should continue to develop and apply adaptive management methods in the
management of CERP with full consideration of climate change and its impacts in their planning.
15. SFWMD and local water managers should develop and apply adaptive management programs in
their planning and decision making of water resources that take climate change and its impacts
into account.
16. SFWMD and local water managers should develop and implement greenhouse gas emissions
reduction programs in their operations.
17. The State of Florida in collaboration with local governments and agencies should develop and/or
update long-term regional water management plans in order to incorporate climate change and
take a more coordinated approach to water management, including water conservation and
reuse, in order to meet the needs of people and the fish and wildlife they depend on for food,
jobs, and recreation
10.2 Federal/Regional Government Policy Recommendations 1. Congress should require all federal water resource-related agencies to incorporate climate
change and sea-level rise projections into their water resources planning procedures and
programs.
2. Congress should provide incentives or pass regulations for all water related utilities to maximize
energy efficiency and minimize direct and indirect greenhouse gas emissions including use and
production of renewable energy wherever possible and feasible.
11 Recommendations for Future Research 1. Comprehensive study of water budgets for Southeast Florida with focus on establishing updated
estimates of all components including those that are not directly measurable, such as
groundwater seepage to the ocean, seepage from the Everglades to the urban areas, and
evapotranspiration.
2. Comprehensive study of the effect of sea level rise on projected flooding during heavy rainfall
events in the lower Florida peninsula through the development of hydrological models for
surface and ground waters and topographical mapping.
3. Determine the energy requirements associated with alternative water supplies, wastewater
treatment alternatives, and flood control systems modifications associated with adaptation to
sea level rise and other climate change impacts.
Southeast Florida’s Resilient Water Resources Page 90
4. Reevaluate projections of hurricane storm surge and its impacts taking into account sea level
rise and future changes in the region’s hydrology using integrated hydrological and storm surge
models.
5. Stormwater drainage adaptation strategies to offset sea level rise induced changes in
groundwater flow patterns, saltwater intrusion, rise of water tables, inundation, and flooding.
6. Address climate change impacts on barrier islands in order to propose and evaluate alternative
adaptation strategies.
7. Evaluate the potential climate change impacts on coastal wastewater treatment plants and
develop alternatives for enhancing their resilience.
8. Similar studies of other Florida coastal regions: Southwest Florida, Treasure Coast, Space Coast,
Northeast Florida, Tampa Bay, Panhandle, etc.
Southeast Florida’s Resilient Water Resources Page 91
Appendix A - Case Study of a City Water Utility
Improving the Resilience of a Municipal Water Utility Against the Likely Impacts of Climate Change
A Case Study: City of Pompano Beach Water Utility
By Frederick Bloetscher, Ph.D., P.E.
Daniel E. Meeroff, Ph.D., E.I.
Department of Civil, Environmental and Geomatics Engineering
Florida Atlantic University
and
Barry N. Heimlich, M.S.E. Center for Environmental Studies at FAU
The Appendix is available online at:
http://www.ces.fau.edu/files/projects/climate_change/PompanoBeachWater_CaseStudy.pdf
Suggested Citation:
Bloetscher, F., Meeroff, D.H., & Heimlich, B.N., 2009, Improving the Resilience of a Municipal Water
Utility Against the Likely Impacts of Climate Change – A Case Study: City of Pompano Beach Water
Utility, Florida Atlantic University
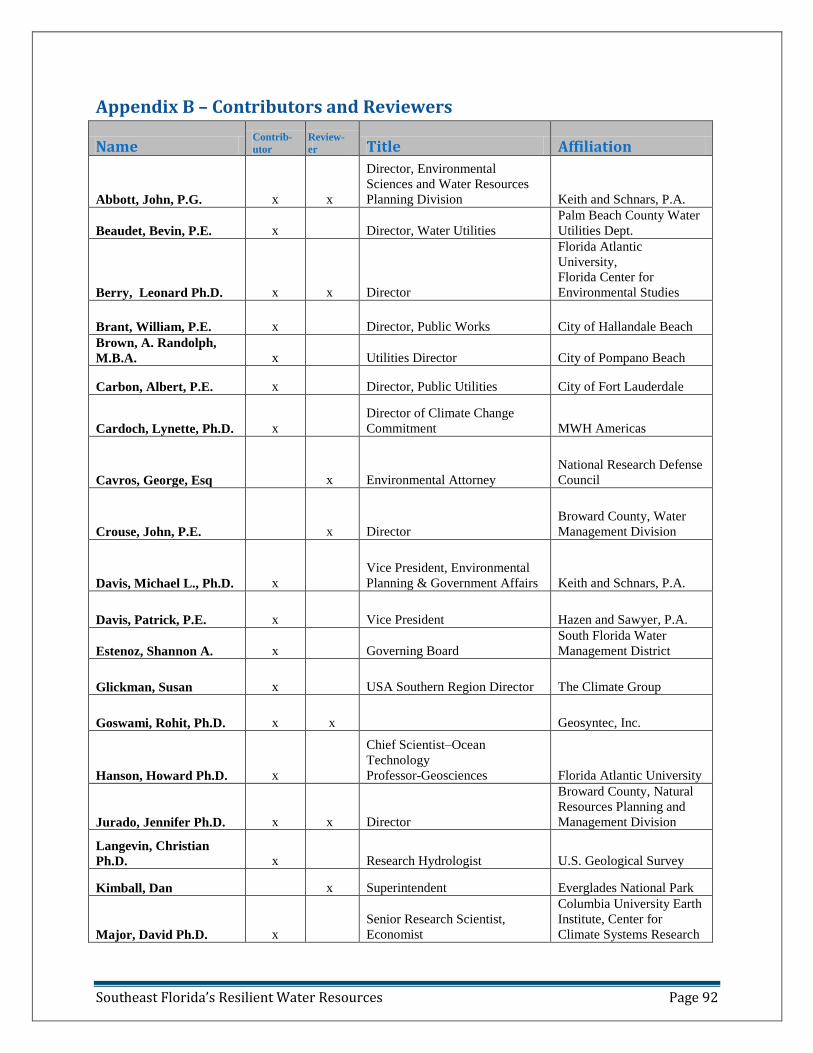
Southeast Florida’s Resilient Water Resources Page 92
Appendix B – Contributors and Reviewers
Name Contrib-
utor
Review-
er Title Affiliation
Abbott, John, P.G. x x
Director, Environmental
Sciences and Water Resources
Planning Division Keith and Schnars, P.A.
Beaudet, Bevin, P.E. x Director, Water Utilities
Palm Beach County Water
Utilities Dept.
Berry, Leonard Ph.D. x x Director
Florida Atlantic
University,
Florida Center for
Environmental Studies
Brant, William, P.E. x Director, Public Works City of Hallandale Beach
Brown, A. Randolph,
M.B.A. x Utilities Director City of Pompano Beach
Carbon, Albert, P.E. x Director, Public Utilities City of Fort Lauderdale
Cardoch, Lynette, Ph.D. x
Director of Climate Change
Commitment MWH Americas
Cavros, George, Esq x Environmental Attorney
National Research Defense
Council
Crouse, John, P.E. x Director
Broward County, Water
Management Division
Davis, Michael L., Ph.D. x
Vice President, Environmental
Planning & Government Affairs Keith and Schnars, P.A.
Davis, Patrick, P.E. x Vice President Hazen and Sawyer, P.A.
Estenoz, Shannon A. x Governing Board
South Florida Water
Management District
Glickman, Susan x USA Southern Region Director The Climate Group
Goswami, Rohit, Ph.D. x x
Geosyntec, Inc.
Hanson, Howard Ph.D. x
Chief Scientist–Ocean
Technology
Professor-Geosciences Florida Atlantic University
Jurado, Jennifer Ph.D. x x Director
Broward County, Natural
Resources Planning and
Management Division
Langevin, Christian
Ph.D. x Research Hydrologist U.S. Geological Survey
Kimball, Dan x Superintendent Everglades National Park
Major, David Ph.D. x
Senior Research Scientist,
Economist
Columbia University Earth
Institute, Center for
Climate Systems Research
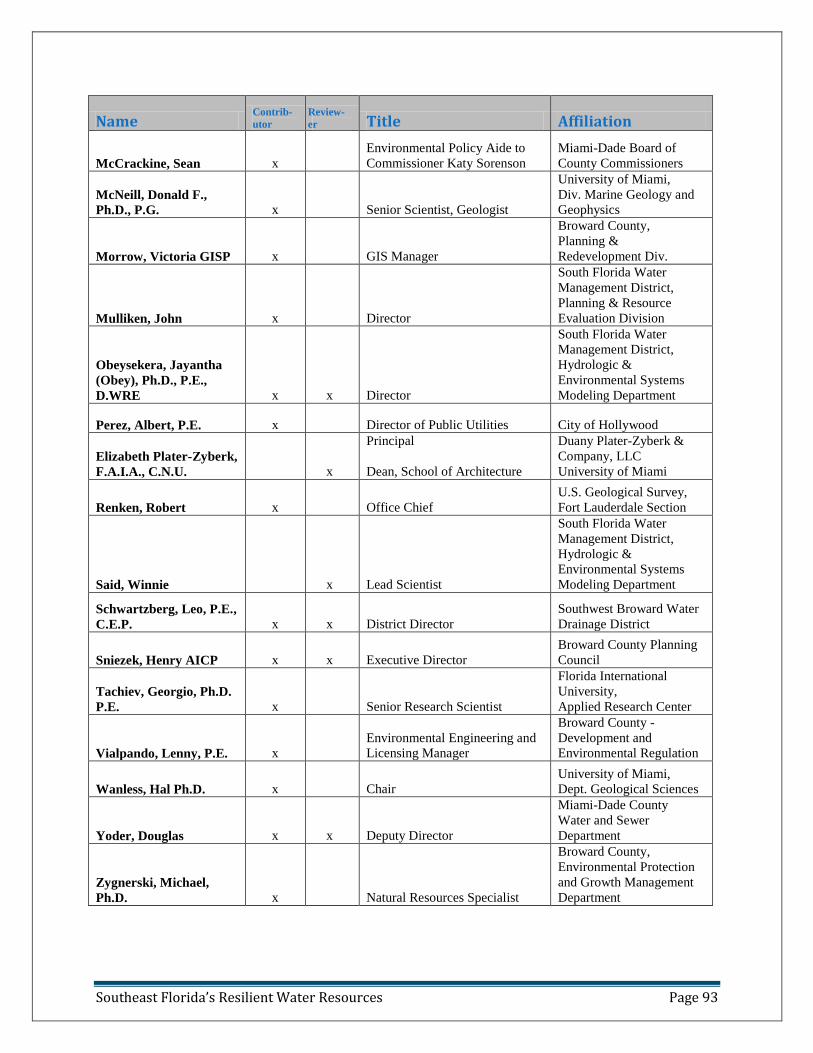
Southeast Florida’s Resilient Water Resources Page 93
Name Contrib-
utor
Review-
er Title Affiliation
McCrackine, Sean x
Environmental Policy Aide to
Commissioner Katy Sorenson
Miami-Dade Board of
County Commissioners
McNeill, Donald F.,
Ph.D., P.G. x Senior Scientist, Geologist
University of Miami,
Div. Marine Geology and
Geophysics
Morrow, Victoria GISP x GIS Manager
Broward County,
Planning &
Redevelopment Div.
Mulliken, John x Director
South Florida Water
Management District,
Planning & Resource
Evaluation Division
Obeysekera, Jayantha
(Obey), Ph.D., P.E.,
D.WRE x x Director
South Florida Water
Management District,
Hydrologic &
Environmental Systems
Modeling Department
Perez, Albert, P.E. x Director of Public Utilities City of Hollywood
Elizabeth Plater-Zyberk,
F.A.I.A., C.N.U. x
Principal
Dean, School of Architecture
Duany Plater-Zyberk &
Company, LLC
University of Miami
Renken, Robert x Office Chief
U.S. Geological Survey,
Fort Lauderdale Section
Said, Winnie x Lead Scientist
South Florida Water
Management District,
Hydrologic &
Environmental Systems
Modeling Department
Schwartzberg, Leo, P.E.,
C.E.P. x x District Director
Southwest Broward Water
Drainage District
Sniezek, Henry AICP x x Executive Director
Broward County Planning
Council
Tachiev, Georgio, Ph.D.
P.E. x Senior Research Scientist
Florida International
University,
Applied Research Center
Vialpando, Lenny, P.E. x
Environmental Engineering and
Licensing Manager
Broward County -
Development and
Environmental Regulation
Wanless, Hal Ph.D. x Chair
University of Miami,
Dept. Geological Sciences
Yoder, Douglas x x Deputy Director
Miami-Dade County
Water and Sewer
Department
Zygnerski, Michael,
Ph.D. x Natural Resources Specialist
Broward County,
Environmental Protection
and Growth Management
Department
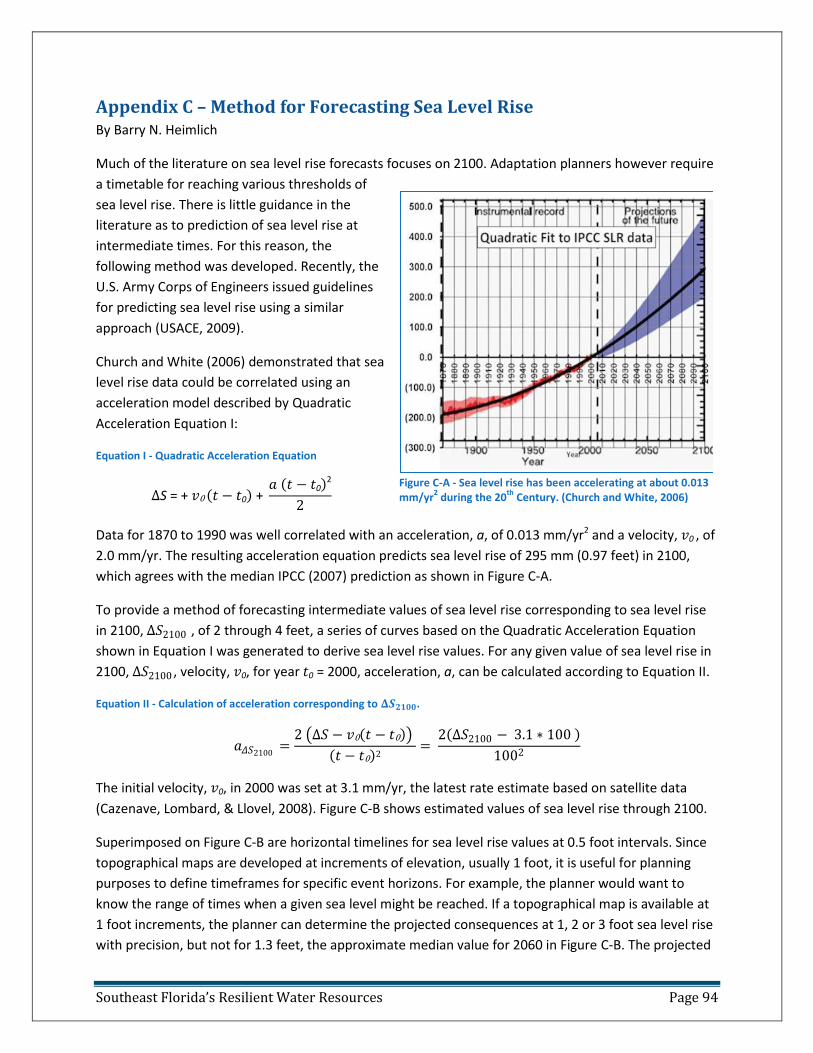
Southeast Florida’s Resilient Water Resources Page 94
Appendix C – Method for Forecasting Sea Level Rise By Barry N. Heimlich
Much of the literature on sea level rise forecasts focuses on 2100. Adaptation planners however require
a timetable for reaching various thresholds of
sea level rise. There is little guidance in the
literature as to prediction of sea level rise at
intermediate times. For this reason, the
following method was developed. Recently, the
U.S. Army Corps of Engineers issued guidelines
for predicting sea level rise using a similar
approach (USACE, 2009).
Church and White (2006) demonstrated that sea
level rise data could be correlated using an
acceleration model described by Quadratic
Acceleration Equation I:
Equation I - Quadratic Acceleration Equation
ΔS = + 𝑣0 𝑡 − 𝑡0 + 𝑎 𝑡 − 𝑡0
2
2
Data for 1870 to 1990 was well correlated with an acceleration, a, of 0.013 mm/yr2 and a velocity, 𝑣0 , of
2.0 mm/yr. The resulting acceleration equation predicts sea level rise of 295 mm (0.97 feet) in 2100,
which agrees with the median IPCC (2007) prediction as shown in Figure C-A.
To provide a method of forecasting intermediate values of sea level rise corresponding to sea level rise
in 2100, Δ𝑆2100 , of 2 through 4 feet, a series of curves based on the Quadratic Acceleration Equation
shown in Equation I was generated to derive sea level rise values. For any given value of sea level rise in
2100, Δ𝑆2100 , velocity, 𝑣0, for year 𝑡0 = 2000, acceleration, a, can be calculated according to Equation II.
Equation II - Calculation of acceleration corresponding to 𝚫𝑺𝟐𝟏𝟎𝟎.
𝑎𝛥𝑆2100=
2 Δ𝑆 − 𝑣0 𝑡 − 𝑡0
𝑡 − 𝑡0 2=
2 Δ𝑆2100 − 3.1 ∗ 100
1002
The initial velocity, 𝑣0, in 2000 was set at 3.1 mm/yr, the latest rate estimate based on satellite data
(Cazenave, Lombard, & Llovel, 2008). Figure C-B shows estimated values of sea level rise through 2100.
Superimposed on Figure C-B are horizontal timelines for sea level rise values at 0.5 foot intervals. Since
topographical maps are developed at increments of elevation, usually 1 foot, it is useful for planning
purposes to define timeframes for specific event horizons. For example, the planner would want to
know the range of times when a given sea level might be reached. If a topographical map is available at
1 foot increments, the planner can determine the projected consequences at 1, 2 or 3 foot sea level rise
with precision, but not for 1.3 feet, the approximate median value for 2060 in Figure C-B. The projected
Figure C-A - Sea level rise has been accelerating at about 0.013 mm/yr
2 during the 20
th Century. (Church and White, 2006)

Southeast Florida’s Resilient Water Resources Page 95
years, T, at which any given amount of sea level rise might occur can be calculated using Equation III if
one knows the initial velocity, 𝑣0, and acceleration, 𝑎𝛥𝑆2100 corresponding to the projected sea level rise
in 2100, 𝛥𝑆2100 , calculated using Equation II,
Equation III - Predicted time at which a given sea level rise might occur.
𝑇 = 2000 +
−𝑣𝑜 + 𝑣𝑜2 + 2 ∗ Δ𝑆 ∗ 𝑎𝛥𝑆2100
𝑎𝛥𝑆2100
Table C-1a provides projected ranges of sea level rise at 10-year intervals beginning in 2020. Table C-1b
shows dates for the indicated sea level rise thresholds assuming a 2100 sea level rise range of 2 to 4
feet. Table C-1c provides the projected date range for 3 to 4 feet in 2100. For planning purposes, it is
recommended that the more conservative values in Table C-1c be used. These values appear as the
horizontal red bars in Figure C-B. For example, for a projected sea level rise of 1.0 feet, it is
recommended that the planner use a date range of 2043-2050 from Table C-1c. From Table C-1c, a 0.5
foot sea level rise is forecasted for 2027-2031, i.e. 18 to 22 years from 2009.
Figure C-B - Projected sea level rise, acceleration model.
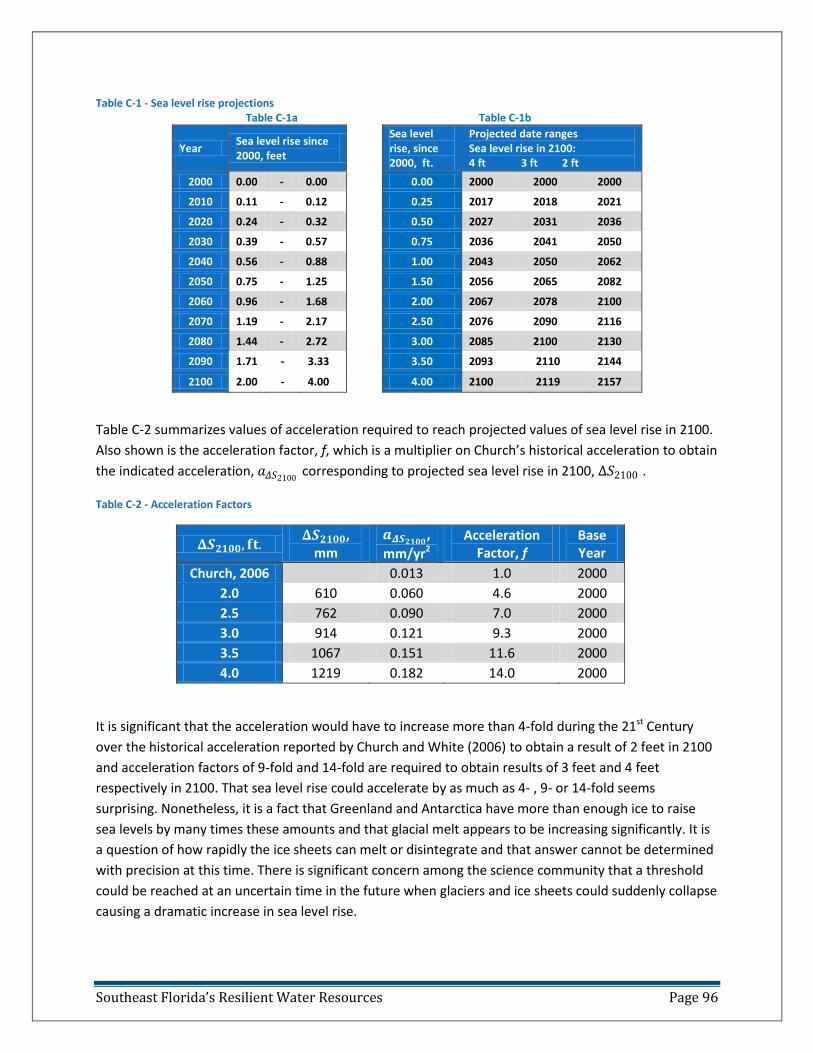
Southeast Florida’s Resilient Water Resources Page 96
Table C-1 - Sea level rise projections Table C-1a Table C-1b
Year Sea level rise since 2000, feet
Sea level rise, since 2000, ft.
Projected date ranges Sea level rise in 2100: 4 ft 3 ft 2 ft
2000 0.00 - 0.00
0.00 2000 2000 2000
2010 0.11 - 0.12
0.25 2017 2018 2021
2020 0.24 - 0.32
0.50 2027 2031 2036
2030 0.39 - 0.57
0.75 2036 2041 2050
2040 0.56 - 0.88
1.00 2043 2050 2062
2050 0.75 - 1.25
1.50 2056 2065 2082
2060 0.96 - 1.68
2.00 2067 2078 2100
2070 1.19 - 2.17
2.50 2076 2090 2116
2080 1.44 - 2.72
3.00 2085 2100 2130
2090 1.71 - 3.33
3.50 2093 2110 2144
2100 2.00 - 4.00
4.00 2100 2119 2157
Table C-2 summarizes values of acceleration required to reach projected values of sea level rise in 2100.
Also shown is the acceleration factor, f, which is a multiplier on Church’s historical acceleration to obtain
the indicated acceleration, 𝑎𝛥𝑆2100 corresponding to projected sea level rise in 2100, Δ𝑆2100 .
Table C-2 - Acceleration Factors
𝚫𝑺𝟐𝟏𝟎𝟎, 𝐟𝐭. 𝚫𝑺𝟐𝟏𝟎𝟎,
mm 𝒂𝜟𝑺𝟐𝟏𝟎𝟎,
mm/yr2
Acceleration Factor, f
Base Year
Church, 2006
0.013 1.0 2000
2.0 610 0.060 4.6 2000
2.5 762 0.090 7.0 2000
3.0 914 0.121 9.3 2000
3.5 1067 0.151 11.6 2000
4.0 1219 0.182 14.0 2000
It is significant that the acceleration would have to increase more than 4-fold during the 21st Century
over the historical acceleration reported by Church and White (2006) to obtain a result of 2 feet in 2100
and acceleration factors of 9-fold and 14-fold are required to obtain results of 3 feet and 4 feet
respectively in 2100. That sea level rise could accelerate by as much as 4- , 9- or 14-fold seems
surprising. Nonetheless, it is a fact that Greenland and Antarctica have more than enough ice to raise
sea levels by many times these amounts and that glacial melt appears to be increasing significantly. It is
a question of how rapidly the ice sheets can melt or disintegrate and that answer cannot be determined
with precision at this time. There is significant concern among the science community that a threshold
could be reached at an uncertain time in the future when glaciers and ice sheets could suddenly collapse
causing a dramatic increase in sea level rise.
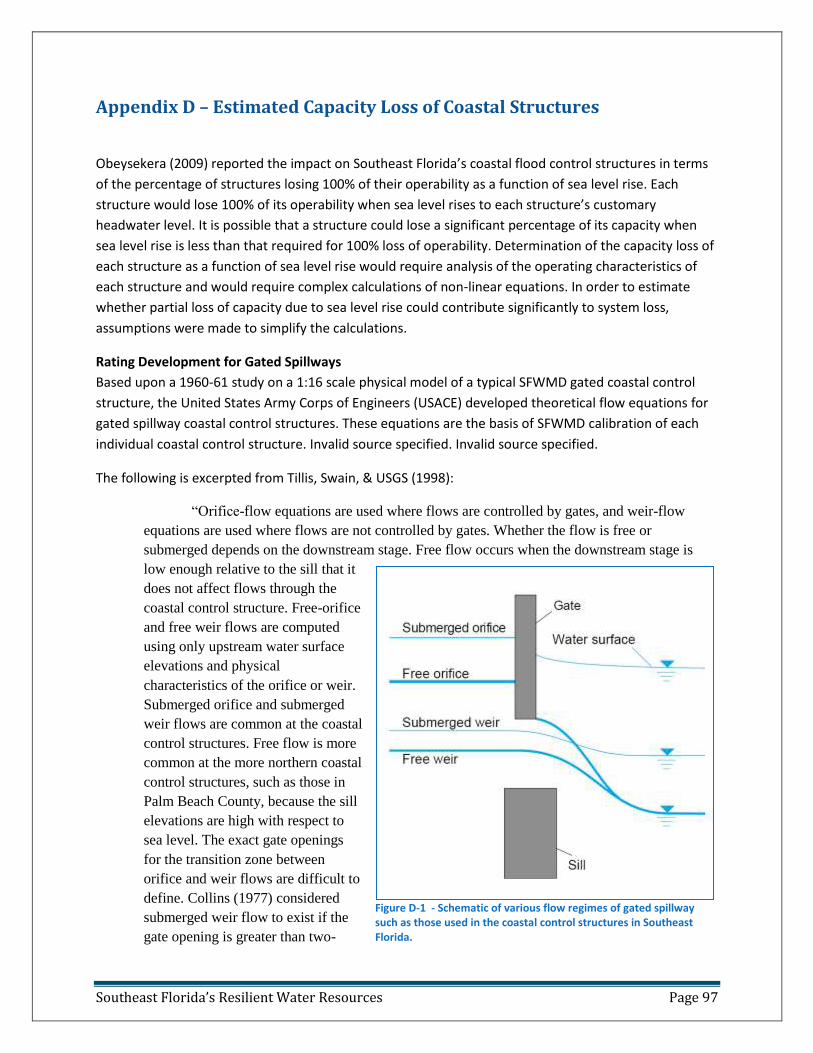
Southeast Florida’s Resilient Water Resources Page 97
Appendix D – Estimated Capacity Loss of Coastal Structures
Obeysekera (2009) reported the impact on Southeast Florida’s coastal flood control structures in terms
of the percentage of structures losing 100% of their operability as a function of sea level rise. Each
structure would lose 100% of its operability when sea level rises to each structure’s customary
headwater level. It is possible that a structure could lose a significant percentage of its capacity when
sea level rise is less than that required for 100% loss of operability. Determination of the capacity loss of
each structure as a function of sea level rise would require analysis of the operating characteristics of
each structure and would require complex calculations of non-linear equations. In order to estimate
whether partial loss of capacity due to sea level rise could contribute significantly to system loss,
assumptions were made to simplify the calculations.
Rating Development for Gated Spillways
Based upon a 1960-61 study on a 1:16 scale physical model of a typical SFWMD gated coastal control
structure, the United States Army Corps of Engineers (USACE) developed theoretical flow equations for
gated spillway coastal control structures. These equations are the basis of SFWMD calibration of each
individual coastal control structure. Invalid source specified. Invalid source specified.
The following is excerpted from Tillis, Swain, & USGS (1998):
“Orifice-flow equations are used where flows are controlled by gates, and weir-flow
equations are used where flows are not controlled by gates. Whether the flow is free or
submerged depends on the downstream stage. Free flow occurs when the downstream stage is
low enough relative to the sill that it
does not affect flows through the
coastal control structure. Free-orifice
and free weir flows are computed
using only upstream water surface
elevations and physical
characteristics of the orifice or weir.
Submerged orifice and submerged
weir flows are common at the coastal
control structures. Free flow is more
common at the more northern coastal
control structures, such as those in
Palm Beach County, because the sill
elevations are high with respect to
sea level. The exact gate openings
for the transition zone between
orifice and weir flows are difficult to
define. Collins (1977) considered
submerged weir flow to exist if the
gate opening is greater than two-
Figure D-1 - Schematic of various flow regimes of gated spillway such as those used in the coastal control structures in Southeast Florida.
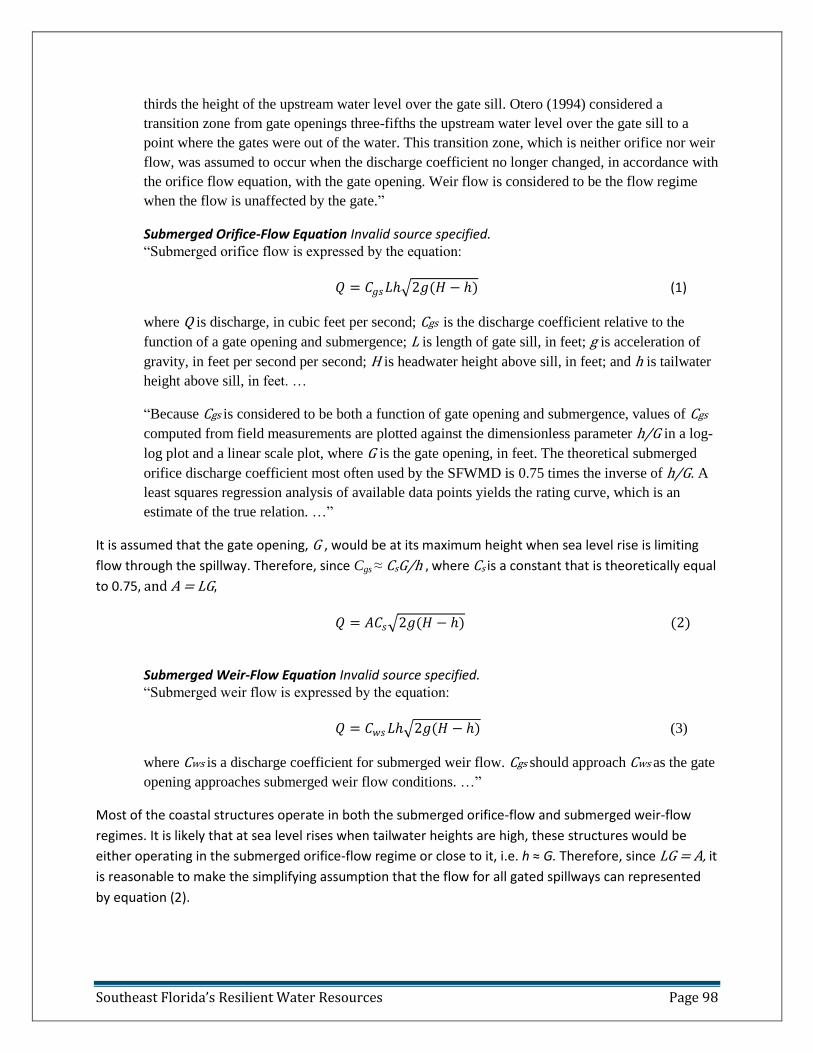
Southeast Florida’s Resilient Water Resources Page 98
thirds the height of the upstream water level over the gate sill. Otero (1994) considered a
transition zone from gate openings three-fifths the upstream water level over the gate sill to a
point where the gates were out of the water. This transition zone, which is neither orifice nor weir
flow, was assumed to occur when the discharge coefficient no longer changed, in accordance with
the orifice flow equation, with the gate opening. Weir flow is considered to be the flow regime
when the flow is unaffected by the gate.”
Submerged Orifice-Flow Equation Invalid source specified. “Submerged orifice flow is expressed by the equation:
𝑄 = 𝐶𝑔𝑠𝐿 2𝑔(𝐻 − ) (1)
where Q is discharge, in cubic feet per second; Cgs is the discharge coefficient relative to the
function of a gate opening and submergence; L is length of gate sill, in feet; g is acceleration of
gravity, in feet per second per second; H is headwater height above sill, in feet; and h is tailwater
height above sill, in feet. …
“Because Cgs is considered to be both a function of gate opening and submergence, values of Cgs
computed from field measurements are plotted against the dimensionless parameter h/G in a log-
log plot and a linear scale plot, where G is the gate opening, in feet. The theoretical submerged
orifice discharge coefficient most often used by the SFWMD is 0.75 times the inverse of h/G. A
least squares regression analysis of available data points yields the rating curve, which is an
estimate of the true relation. …”
It is assumed that the gate opening, G , would be at its maximum height when sea level rise is limiting
flow through the spillway. Therefore, since Cgs ≈ CsG/h , where Cs is a constant that is theoretically equal
to 0.75, and A = LG,
𝑄 = 𝐴𝐶𝑠 2𝑔(𝐻 − ) (2)
Submerged Weir-Flow Equation Invalid source specified. “Submerged weir flow is expressed by the equation:
𝑄 = 𝐶𝑤𝑠𝐿 2𝑔(𝐻 − ) (3)
where Cws is a discharge coefficient for submerged weir flow. Cgs should approach Cws as the gate
opening approaches submerged weir flow conditions. …”
Most of the coastal structures operate in both the submerged orifice-flow and submerged weir-flow
regimes. It is likely that at sea level rises when tailwater heights are high, these structures would be
either operating in the submerged orifice-flow regime or close to it, i.e. h ≈ G. Therefore, since LG = A, it
is reasonable to make the simplifying assumption that the flow for all gated spillways can represented
by equation (2).
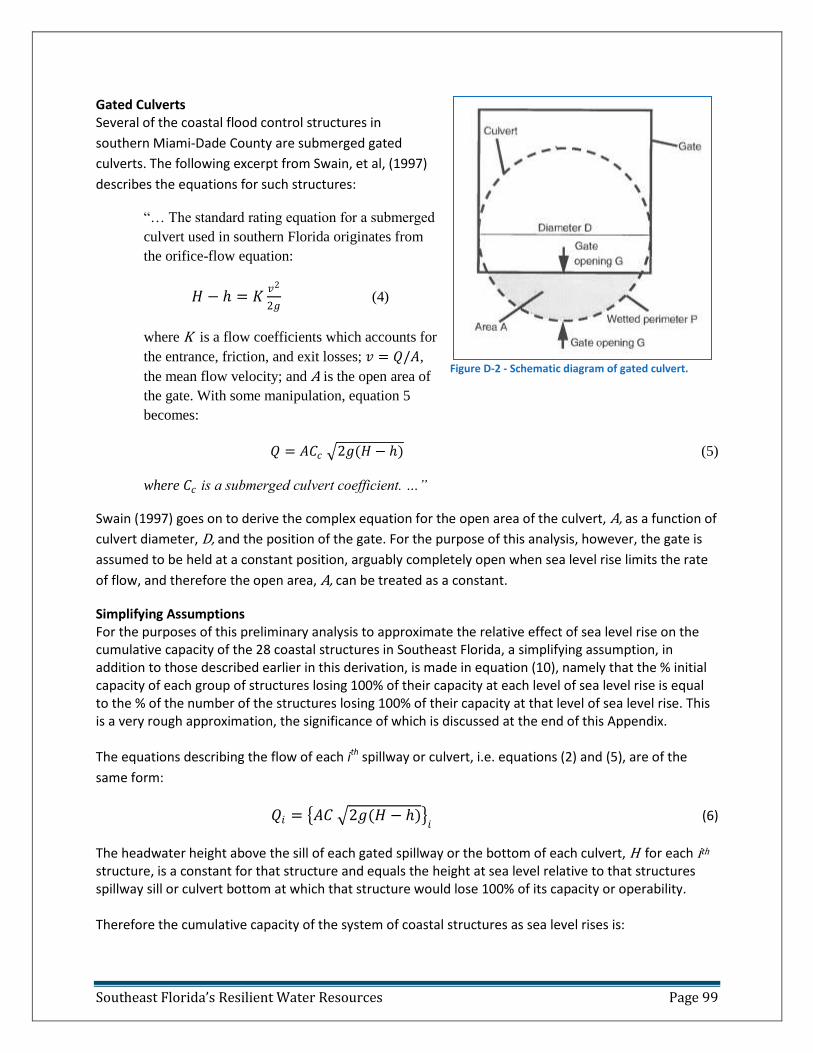
Southeast Florida’s Resilient Water Resources Page 99
Gated Culverts Several of the coastal flood control structures in
southern Miami-Dade County are submerged gated
culverts. The following excerpt from Swain, et al, (1997)
describes the equations for such structures:
“… The standard rating equation for a submerged
culvert used in southern Florida originates from
the orifice-flow equation:
𝐻 − = 𝐾𝑣2
2𝑔 (4)
where K is a flow coefficients which accounts for
the entrance, friction, and exit losses; 𝑣 = 𝑄/𝐴,
the mean flow velocity; and A is the open area of
the gate. With some manipulation, equation 5
becomes:
𝑄 = 𝐴𝐶𝑐 2𝑔(𝐻 − ) (5)
where 𝐶𝑐 is a submerged culvert coefficient. …”
Swain (1997) goes on to derive the complex equation for the open area of the culvert, A, as a function of
culvert diameter, D, and the position of the gate. For the purpose of this analysis, however, the gate is
assumed to be held at a constant position, arguably completely open when sea level rise limits the rate
of flow, and therefore the open area, A, can be treated as a constant.
Simplifying Assumptions For the purposes of this preliminary analysis to approximate the relative effect of sea level rise on the cumulative capacity of the 28 coastal structures in Southeast Florida, a simplifying assumption, in addition to those described earlier in this derivation, is made in equation (10), namely that the % initial capacity of each group of structures losing 100% of their capacity at each level of sea level rise is equal to the % of the number of the structures losing 100% of their capacity at that level of sea level rise. This is a very rough approximation, the significance of which is discussed at the end of this Appendix. The equations describing the flow of each ith spillway or culvert, i.e. equations (2) and (5), are of the
same form:
𝑄𝑖 = 𝐴𝐶 2𝑔(𝐻 − ) 𝑖 (6)
The headwater height above the sill of each gated spillway or the bottom of each culvert, H for each ith structure, is a constant for that structure and equals the height at sea level relative to that structures spillway sill or culvert bottom at which that structure would lose 100% of its capacity or operability. Therefore the cumulative capacity of the system of coastal structures as sea level rises is:
Figure D-2 - Schematic diagram of gated culvert.
Southeast Florida’s Resilient Water Resources Page 100
𝑇𝑜𝑡𝑎𝑙 𝑠𝑦𝑠𝑡𝑒𝑚 𝑐𝑎𝑝𝑎𝑐𝑖𝑡𝑦, 𝑄𝑇 = 𝑄𝑖 = 𝐴𝐶 2𝑔 𝐻 − 𝑖 ii (7)
That the initial capacity of the system of coastal structures in Southeast Florida can be approximated for the purposes of this approximation, by the equation:
𝑄0𝑇 = 𝑄0𝑖 = 𝐴𝐶 2𝑔 𝐻 − 0ii (8)
That the relative cumulative capacity, i.e. the fraction of the total system capacity remaining, can be approximated by: Percent system capacity remaining =
𝑄𝑡𝑜𝑡𝑎𝑙𝑄0 𝑡𝑜𝑡𝑎𝑙
= 𝑄𝑖 𝑄0𝑖
= 𝐴𝐶 2𝑔 𝐻 − 0
𝑄0𝑖
𝐻 − 𝑖
𝐻 − 0
𝑖𝑖
(9)
Since 𝐴𝐶 2𝑔(𝐻−0)
𝑄0𝑖 𝑖 is the initial capacity of each structure as a fraction, 𝑓𝑖 , of the total system
capacity, equation (9) can be simplified to: Percent system capacity remaining =
𝑄𝑡𝑜𝑡𝑎𝑙𝑄0 𝑡𝑜𝑡𝑎𝑙
= 𝑓𝑖 (𝐻 − )
(𝐻 − 0)
𝑖
(10) This is the simplifying assumption referred to previously. The % of the number of structures losing 100%
of their capacity reported by Obeysekera (2009) is used as an estimate of 𝑓𝑖 , the fraction of the initial
capacity of all the structures. The significance of this assumption is discussed at the end of this
Appendix.
As sea level rises, the tailwater level, h, increases according to:
= 0 + ∆𝑆 (11) where ∆𝑆 , is sea level rise.
Therefore, percent system capacity remaining equals:
𝑄𝑡𝑜𝑡𝑎𝑙𝑄0 𝑡𝑜𝑡𝑎𝑙
= 𝑓𝑖 (𝐻 − 0 − ∆𝑆)
(𝐻 − 0)
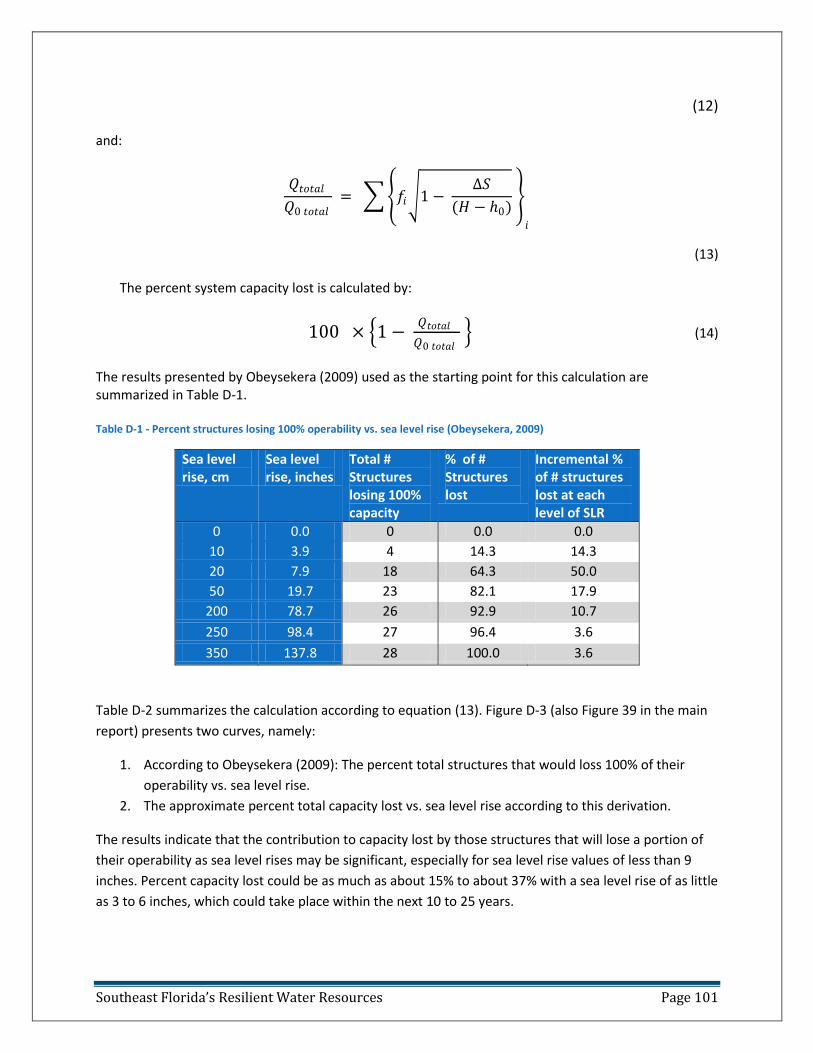
Southeast Florida’s Resilient Water Resources Page 101
(12)
and:
𝑄𝑡𝑜𝑡𝑎𝑙𝑄0 𝑡𝑜𝑡𝑎𝑙
= 𝑓𝑖 1 − ∆𝑆
(𝐻 − 0)
𝑖
(13)
The percent system capacity lost is calculated by:
100 × 1 − 𝑄𝑡𝑜𝑡𝑎𝑙
𝑄0 𝑡𝑜𝑡𝑎𝑙 (14)
The results presented by Obeysekera (2009) used as the starting point for this calculation are summarized in Table D-1. Table D-1 - Percent structures losing 100% operability vs. sea level rise (Obeysekera, 2009)
Sea level rise, cm
Sea level rise, inches
Total # Structures losing 100% capacity
% of # Structures lost
Incremental % of # structures lost at each level of SLR
0 0.0 0 0.0 0.0
10 3.9 4 14.3 14.3
20 7.9 18 64.3 50.0
50 19.7 23 82.1 17.9
200 78.7 26 92.9 10.7
250 98.4 27 96.4 3.6
350 137.8 28 100.0 3.6
Table D-2 summarizes the calculation according to equation (13). Figure D-3 (also Figure 39 in the main
report) presents two curves, namely:
1. According to Obeysekera (2009): The percent total structures that would loss 100% of their
operability vs. sea level rise.
2. The approximate percent total capacity lost vs. sea level rise according to this derivation.
The results indicate that the contribution to capacity lost by those structures that will lose a portion of
their operability as sea level rises may be significant, especially for sea level rise values of less than 9
inches. Percent capacity lost could be as much as about 15% to about 37% with a sea level rise of as little
as 3 to 6 inches, which could take place within the next 10 to 25 years.
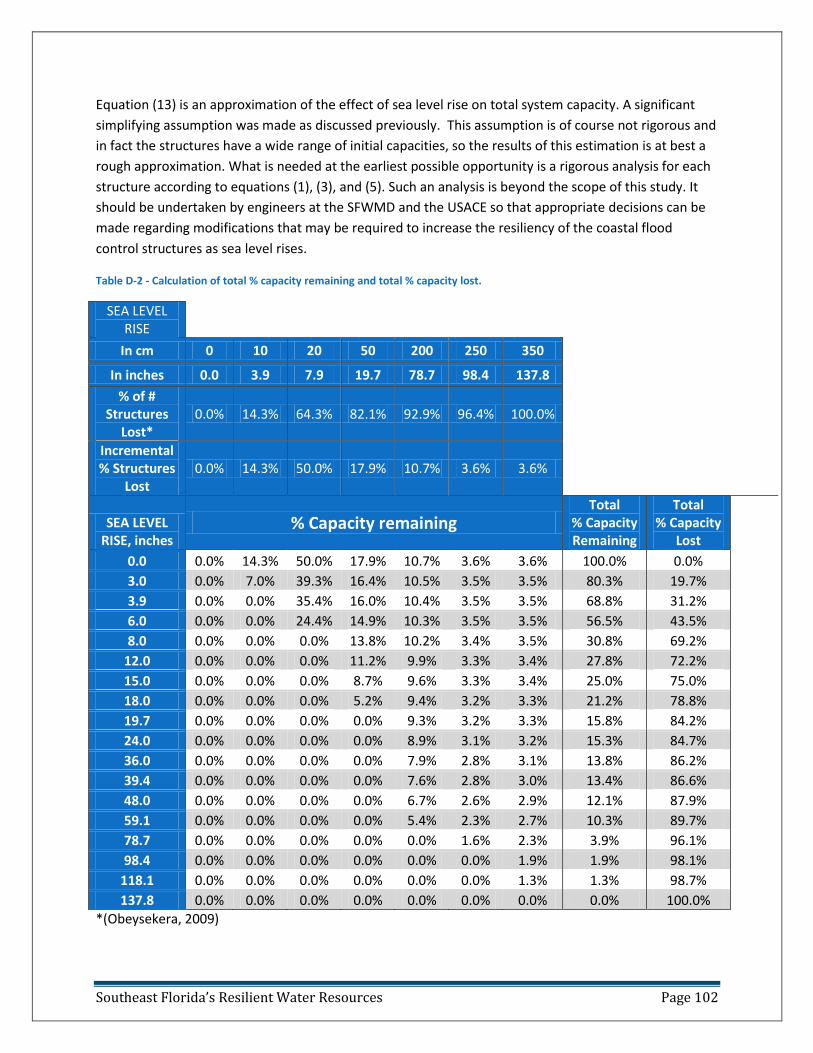
Southeast Florida’s Resilient Water Resources Page 102
Equation (13) is an approximation of the effect of sea level rise on total system capacity. A significant
simplifying assumption was made as discussed previously. This assumption is of course not rigorous and
in fact the structures have a wide range of initial capacities, so the results of this estimation is at best a
rough approximation. What is needed at the earliest possible opportunity is a rigorous analysis for each
structure according to equations (1), (3), and (5). Such an analysis is beyond the scope of this study. It
should be undertaken by engineers at the SFWMD and the USACE so that appropriate decisions can be
made regarding modifications that may be required to increase the resiliency of the coastal flood
control structures as sea level rises.
Table D-2 - Calculation of total % capacity remaining and total % capacity lost.
SEA LEVEL RISE
In cm 0 10 20 50 200 250 350
In inches 0.0 3.9 7.9 19.7 78.7 98.4 137.8
% of # Structures
Lost* 0.0% 14.3% 64.3% 82.1% 92.9% 96.4% 100.0%
Incremental % Structures
Lost 0.0% 14.3% 50.0% 17.9% 10.7% 3.6% 3.6%
SEA LEVEL RISE, inches
% Capacity remaining
Total % Capacity Remaining
Total % Capacity
Lost
0.0 0.0% 14.3% 50.0% 17.9% 10.7% 3.6% 3.6% 100.0% 0.0%
3.0 0.0% 7.0% 39.3% 16.4% 10.5% 3.5% 3.5% 80.3% 19.7%
3.9 0.0% 0.0% 35.4% 16.0% 10.4% 3.5% 3.5% 68.8% 31.2%
6.0 0.0% 0.0% 24.4% 14.9% 10.3% 3.5% 3.5% 56.5% 43.5%
8.0 0.0% 0.0% 0.0% 13.8% 10.2% 3.4% 3.5% 30.8% 69.2%
12.0 0.0% 0.0% 0.0% 11.2% 9.9% 3.3% 3.4% 27.8% 72.2%
15.0 0.0% 0.0% 0.0% 8.7% 9.6% 3.3% 3.4% 25.0% 75.0%
18.0 0.0% 0.0% 0.0% 5.2% 9.4% 3.2% 3.3% 21.2% 78.8%
19.7 0.0% 0.0% 0.0% 0.0% 9.3% 3.2% 3.3% 15.8% 84.2%
24.0 0.0% 0.0% 0.0% 0.0% 8.9% 3.1% 3.2% 15.3% 84.7%
36.0 0.0% 0.0% 0.0% 0.0% 7.9% 2.8% 3.1% 13.8% 86.2%
39.4 0.0% 0.0% 0.0% 0.0% 7.6% 2.8% 3.0% 13.4% 86.6%
48.0 0.0% 0.0% 0.0% 0.0% 6.7% 2.6% 2.9% 12.1% 87.9%
59.1 0.0% 0.0% 0.0% 0.0% 5.4% 2.3% 2.7% 10.3% 89.7%
78.7 0.0% 0.0% 0.0% 0.0% 0.0% 1.6% 2.3% 3.9% 96.1%
98.4 0.0% 0.0% 0.0% 0.0% 0.0% 0.0% 1.9% 1.9% 98.1%
118.1 0.0% 0.0% 0.0% 0.0% 0.0% 0.0% 1.3% 1.3% 98.7%
137.8 0.0% 0.0% 0.0% 0.0% 0.0% 0.0% 0.0% 0.0% 100.0%
*(Obeysekera, 2009)
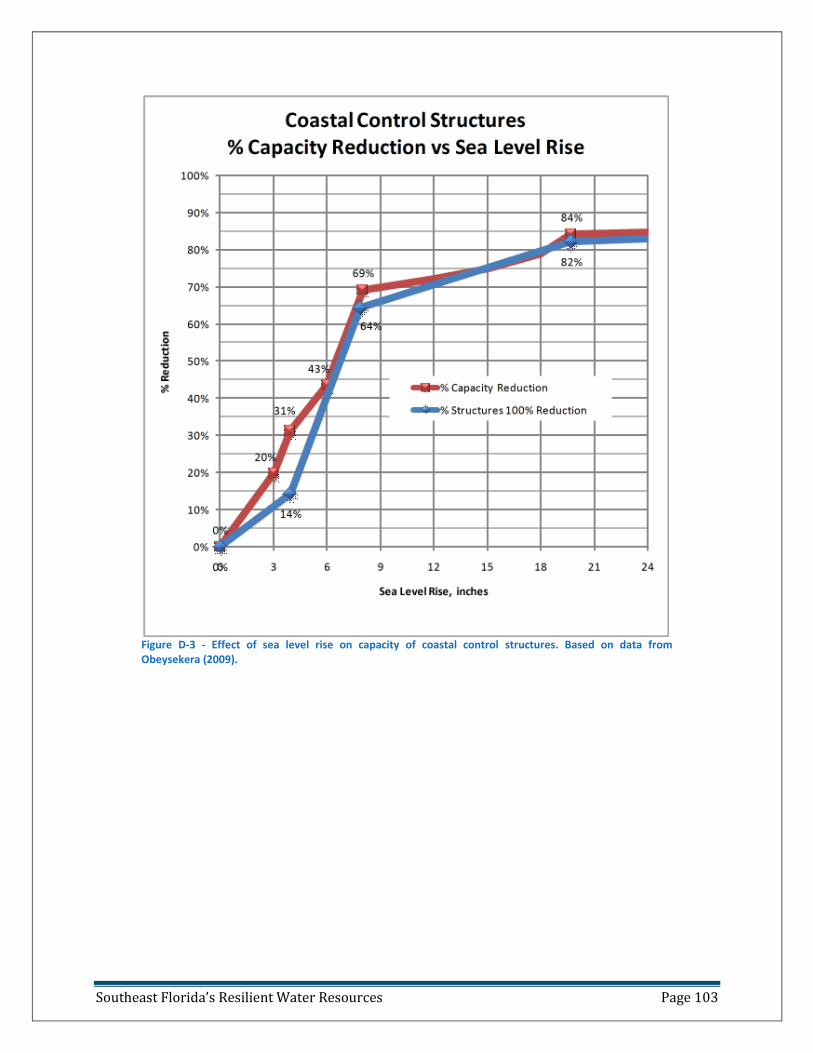
Southeast Florida’s Resilient Water Resources Page 103
Figure D-3 - Effect of sea level rise on capacity of coastal control structures. Based on data from Obeysekera (2009).
Southeast Florida’s Resilient Water Resources Page 104
Bibliography
Alvarez, R. (2008). Adjunct Professor of Architecture, FAU. (B. Heimllich, Interviewer)
AWWA, et al. (2008, May 20). Water Sector Statement on Climate Change and Water Resources. AWWA, AMWA, NACWA, NAFSMA, NAWC,
WEF, WUWC, WUCA.
Bloetscher, F., & Muniz, A. (2006). Defining Sustainabiity for Water Supply Purposes. Florida Section AWWA Conference Proceedings.
Hollywood, FL: AWWA.
Bloetscher, F., & Muniz, A. (2008). Water Supply in South Florida - The New Limitations. Sustainable Water Sources (Reno) Conference
Proceedings. Denver, CO: AWWA.
Bloetscher, F., Englehardt, J. D., Chin, D. A., Rose, J. B., Tchobanoglous, G., Amy, V. P., et al. (2005). Comparative Assessment Municipal
Wastewater Disposal Methods in Southeast Florida. Water Environment Research, Vol. 77 , 480-490.
Broward County. (2008). Broward County-wide Integrated Water Resources Plan - Final Draft. Fort Lauderdale, FL: Broward County.
Broward County IWRP. (2008). Broward County-wide Integrated Water Resources Plan - Final Draft. Fort Lauderdale, FL: Broward County.
Broward County; Dunn, D.;. (2007). Artificial Groundwater Recharge, North Broward County Coastal Area. Broward County, Water Resources
Management.
Buffoni, L. B. (2002). Variazioni Climate Change And Groundwater: A Short Review 7,. Italia Negli Ultimi 130 Anni. Bollettino Geofisico Anno XXIII
.
Cazenave, A., Lombard, A., & Llovel, W. (2008). Present-day sea level rise: A synthesis. Geoscience , 761-770.
CDM. (2009). City of Pompano Beach, Water Supply Plan, Jan 2009.
Church, J. A. (2006). A 20th century acceleration in global sea-level rise. Geophys. Res. Lett. , 33, L01602, doi:10.1029/2005GL024826.
Church, J. A., & White, N. J. (2006). A 20th century acceleration in global sea-level rise. Geophys. Res. Lett. , 33, L01602,
doi:10.1029/2005GL024826.
Crouse; Garcia; Broward County. (2008). Regional Hydrology and Water Supply Concerns. Broward Water Academy.
Dragoni, W. (1998). Some considerations on climatic changes, water resources and water needs in the Italian region south of the 438N. In A. S.
ISSAR, Water, Environment and Society in Times of Climatic Change (pp. 241–271). Kluwer.
Dragoni, W., & Sukhija, B. S. (2008). Climate change and groundwater: a short review. Geological Society, London, Special Publications , 288, pp.
1-12.
Elsner, SFWMD. (2009). Reclaimed Water - A Valuable Resource. Broward County Water Resources Task Force, Feb. 6. 2009. South Florida
Water Management District.
Englehardt, J. D., Amy, V. P., Bloetscher, F., Chin, D. A., Fleming, L. E., Gokgoz, S., et al. (2001). Comparative Assessment of Human and
Ecological Impacts for Municipal Wastewater Disposal Methods in Southeast Florida: Deep Wells, Ocean Outfalls, and Canal Discharges. Coral
Gables, FL: University of Miami.
Florida Governor's Action Team on Energy and Climate Change. (2008). Florida Energy and Climate Change Action Plan, Chapter 8. Florida
Governor's Action Team on Energy and Climate Change.
Gassman, N. (2009). Recommendations on Sea Level Rise. Broward County Climate Change Task Force, Science and Technology Committee.
Grinsted, A. J. (2009). Reconstructing sea level from Paleo and projected temperatures 200 to 2100AD. Clim. Dyn. , doi: 10.1007/s00382-008-
0507-2.
Heimlich, B. (2009). A Quadratic Acceleration Equation for Predicting Sea Level Rise Throughout the 21st Century. Presentation to Science and
Technology Subcommittee. Fort Lauderdale, FL: Broward County Climate Change Task Force.
Holland, G. J. (2007). Heightened tropical cyclone activity in the North Atlantic: natural variability or climate trend? Phil. Trans. R. Soc. A .
Huntington, T. G. (2006). Evidence for intensification of the global water cycle: Review and synthesis. Journal of Hydrology , 319,, 83–95.
International Alliance of Research Universities. (2009). Climate Change: Global Risks, Challenges & Decisions. Synthesis Report, International
Alliance of Research Universities, Copenhagen.
IPCC. (2007). 4th Assessment Report. International Panel on Climate Change.
Karl, T. R., etal, USCCSP, & NOAA. (2009). Global Climate Change Impacts in the United States,. US Climate Change Science Program and NOAA.
Cambridge University Press.
Labat, D. G. (2004). Evidence for global runoff increase related to climate warming. Advances in Water Resources , 27, 631–642.
Southeast Florida’s Resilient Water Resources Page 105
Marshall, C. H., Pielke, R. A., Steyaert, L. T., & Willard, D. A. (2003). The Impact of Anthropogenic Land Cover Charge on the Florida Peninsula
Sea Breezes and Warm Season Sensible Weather. Monthly Weather Review, Vol. 132 , 28.
Meyer, F. W. (1988). Subsurface Storage of Liquids in the Florida Aquifer System in South Florida, OFR 88-477. USGS.
Murley, J., Heimlich, B. N., & Bollman, N. (2008). Florida's Resilient Coasts -- A State Policy Framework for Adaptation to Climate Change. Fort
Lauderdale, FL: Florida Atlantic University Center for Urban and Environmental Solutions and National Commission on Energy Policy.
Nicholls, R. J., & OECD. (2008). Ranking Port Cities with High Exposure and Vulnerability to Climate Extremes: Exposure Estimates.
ORGANISATION FOR ECONOMIC CO-OPERATION AND DEVELOPMENT. OECD Publishing.
Obeysekera, J. S. (2009). Climate Change & Water Management: Planning For Sea Level Rise. Broward Climate Change Task Force, Science &
Technology Subcommittee. Fort Lauderdale.
Perez, A. (2009, May). City of Hollywood Water Supply Plan. Broward Water Resources Task Force .
Pfeffer, W. J. (2008). Kinematic Constraints on Glacier Contributions to 21st-Century Sea-Level Rise. Science , 321, 1340-1343.
Rahmstorf, S. (2007). A semi-empirical approach to projecting future sea-level rise. Science , 315(5810), 368-370.
SFWMD. (2001). Retrieved 2009, from Everglades Plan:
http://www.evergladesplan.org/pm/recover/recover_docs/am/rec_am_exec_summary.pdf
SFWMD. (2009). Retrieved 2009, from Comprehensive Everglades Restoration Plan (CERP): http://www.evergladesplan.org/
SFWMD. (1979). Preliminary Report on Severe storm of April 24-25, 1979. SFWMD.
SFWMD, Li, H., & Wilsnack, M. (2007). TECHNICAL PUBLICATION ERA 451 - RATING ANALYSIS FOR PUMP STATION S13. South Florida Water
Management District.
Todd, D. K., & Mays, L. W. (2008). Groundwater Hydrology. Hoboken, NJ: Wiley.
Twilley, R. R. (2001). Confronting Climate Change in the Gulf Coast Region. Union of Concerned Scientists.
U.S. Water News Online. (1998, March). Retrieved from U.S. Water News Online:
http://www.uswaternews.com/archives/arcconserv/8oracou3.html
UNEP. (2009). Climate Change Science Compendium 2009. New York: United Nations Environmental Programme.
US Census. (2008). US Census, latest estimate for Miami-Dade, Broward, Palm Beach and Monroe Counties.
US EPA. (2009). Synthesis and Assessment Product 4.1, Coastal Sensitivity to Sea Level Rise: A Focus on the Mid-Atlantic Region. U.S. Climate
Change Science Program.
USACE. (2009). WATER RESOURCE POLICIES AND AUTHORITIES INCORPORATING SEA-LEVEL CHANGE CONSIDERATIONS IN CIVIL WORKS
PROGRAMS. Washington, DC: U.S. Army Corps of Engineers.
Wanless, H. (2008). Miami-Dade County Climate Change Advisory Task Force Science and Technology Committee Report: Statement on Sea Level
in the Coming Century.
Werner, A. D. (2009). Impact of Sea-Levl Rise on Sea Water Intrusion in Coastal Aquifers. Ground Water , March-April 197-204.
Werner, A. D., & Simmons, C. T. (2009). Impact of Sea-Levl Rise on Sea Water Intrusion in Coastal Aquifers. Ground Water , March-April 197-
204.
Werner, A. D., & Simmons, C. T. (2009). Impact of Sea-Levl Rise on Sea Water Intrusion in Coastal Aquifers. Ground Water , March-April 197-
204.
Wikipedia. (2009, June 2). Adaptive Management. Retrieved June 26, 2009, from Wikipedia:
http://en.wikipedia.org/wiki/Adaptive_management
Yin, J. M. (2009, March 15). Model projections of rapid sea level rise on the northeast cost of the United States. Nature Geoscience .
Zygnerski, M. (2008, October 10). Saltwater Intrusion,Climate Change and the Biscayne Aquifer. (SFWMD) Retrieved August 14, 2009, from
Water Resources Task Force, Broward County:
http://www.sfwmd.gov/portal/page/portal/pg_grp_sfwmd_regionalserv/portlet_broward_wrtf/tab22133478/btf_mrz_101008.pdf
Zygnerski, M., & Langevin, C. (2007). Long-Term Saltwater Intrusion in a Coastal Aquifer: Quantifying Effects of Natural and Anthropogenic
Stresses: in Coastal Aquifers: Challenges and Solutions. Proceedings: Almeria, Spain, TIAC 2007, (pp. 509-516). Almeria, Spain.
Southeast Florida’s Resilient Water Resources Page 106
Related References American Water Works Association (2002), Survey and Analysis of Aquifer Storage and Recovery (ASR) Systems and Associated Regulatory
Programs in the United States, AWWA, Denver, CO.
Bindoff, N.L., J. Willebrand, V. Artale, A. Cazenave, J. Gregory, S. Gulev, K. Hanawa, Le Quéré, S. Levitus, Y. Nojiri, C.K. Shum, L.D. Talley, and A.
Unnikrishnan, 2007: Observations: oceanic climate change and sea level. Chapter 5 In: Climate Change 2007: The Physical Science Basis.
Contribution of Working Group I to the Fourth Assessment Report of the Intergovernmental Panel on Climate [Solomon, S., D. Qin, M. Manning,
Z. Chen, M. Marquis, K.B. Avery, M. Tignor, and H.L. Miller (eds.)]. Cambridge University Press, Cambridge, UK and New York, pp. 385-432.
Bloetscher, F. (2008) Basics for Decision-makers: a Local Officials Guide to Water and Sewer Utilities, AWWA, Denver, CO.
Bloetscher, F. (2008a), The Potential Impact of Climate Change on Groundwater Recharge, Groundwater Protection Council Annual Forum
Proceedings - Cincinnati, GWPC, Oklahoma City, OK
Bloetscher, F. and Muniz, A. (2006), “Re-visiting the Comparative Assessment of Municipal Wastewater Disposal Methods in Southeast Florida”
GWPC Annual Meeting Proceedings, GWPC, Oklahoma, OK
Bloetscher, Frederick; Englehardt, James D.; Chin, David A.; Rose, Joan B.; Tchobanoglous, George; Amy, Vincent P.;Gokgoz, Sinem (2005),
Comparative Assessment Municipal Wastewater Disposal Methods in Southeast Florida, Water Environment Research, Vol. 77, No. , pp. 480-
490.
Bloetscher, Frederick and Muniz, Albert (2003), “Water Quality Of Aquifer Storage And Recovery Systems May Define Limitations In Use,”
GWPC Annual Meeting Proceedings, GWPC, Oklahoma, OK
Corum, Lyn. 2008. Solar Cost Controller. Water Efficiency Vol. 3, No. 4. pp. 48-52.
Czikowsky, M. J., and D. R. Fitzjarrald, 2004: Evidence of seasonal changes in evapotranspiration in eastern U. S. hydrological records. Accepted
to J. Hydrometeor.
Deyle, R.E.; Bailey, K.C.; and Matheny, A. (2007), Adaptive Response Planning to Sea Level Rise in Florida and Implications for Comprehensive
and Public Facilities Planning, Florida State University, Tallahassee, FL.
Di Matteo, L. & Dragoni, W. (2006), “Climate change and water resources in limestone and mountain areas: the case of Firenzuola Lake
(Umbria, Italy),” Proceedings of the 8th Conference on Limestone Hydrogeology, Neuchatel, Switzerland, 21–23 September 2006, Presses
universitaires de Franche- Comte´ (FRANCE), 83–88.
Enfield, D. B and Cid-Serrano, L. (2006), Projecting the Risk of Future Climate Shifts, International Journal of Climatology 26:885-895.
Enfield, D.B, Mestas-Nunez, A.M., and Trimble, P. (2001), The Atlantic Multidecadal Oscillation and its relation of rainfall and river flows in the
continental U.S., Geophyical Research Letters, v. 28 no 10 p 2077-2080.
FDEP (2008), Chapter, 62-610, F.A.C. Reclaimed Wastewater Rule, accessed 7/1/2008, http://www.dep.state.fl.us/legal/Rules/wastewater/62-
610.pdf
FDEP, Chapter 62-528, F.A.C. is the Underground Injection Control, accessed 3/3/2007, http://www.dep.state.fl.us/water/uic/docs/62-
528_20NOV2002.pdf
FDEP (2006), Canal Recharge, A Report to the Legislature and Governor, Tallahassee, FL.
Fernald, E. A. and Purdum, E. D., eds. (1998), Water Resources Atlas of Florida. Tallahassee: Institute. of Science and Public Affairs, Florida State
University, Tallahassee, FL.
Florida 2030 Climate Change Subcommittee (2008), Climate Change and Florida Water Supplies FSAWWA, Orlando, FL, (unpublished formally).
Freas, K.; Bailey, R.; Muneavar, A.; and Butler, S. (2008), Incorporating Climate Change in Water Planning, JAWWA v 100 no 6, p 93-99.
Frederick, K. and Gleick, P (1999), “Water and Global Climate Change” Potential Impacts on US Water Resources, Pew Center on Global Climate
Changes, Arlington, VA.
Galloway, Devin; Jones, David R. and Ingebritsen, S.E., Land Subsidence in the United States, U.S. Geological Survey Circular 1182, USGS,
Washington, DC.
Goudie, A. (1994), The Human Impact on the Environment. The MIT Press Cambridge, Massachusetts.
Green, Timothy R., Makoto Taniguchi and Henk Kooi, (2006), “Potential Impacts of Climate Change and Human Activity on Subsurface Water
Resources,” Water Resources Research, Vol. 42, W11405, doi:10.1029/2005WR004742, 2006
Hapgood, Charles H. (1999), Path of the Pole (2nd Ed), Adventures Unlimited Press, Kempton, IL.
Herrera-Pantoja, M. and K. M. Hiscock (2008), “The effects of climate change on potential groundwater recharge in Great Britain,” Hydrol.
Process. 22, 73–86
Huggett, R. J. (1991), Climate, Earth Processes and Earth History, Springer-Verlag.
Southeast Florida’s Resilient Water Resources Page 107
Intergovernmental Panel on Climate Change - IPCC (2001), Climate Change 2001: The Scientific Basis, Cambridge University Press, New York, NY.
Issar, A. S. (2005), “Mitigating the greenhouse effect by sequestering carbon by woods planted in dry-zones, utilizing wasted water resources,”
Presented at World Water Week in Stockholm, 21–27 August, 2005. Workshop 2 – Coping with Climate Variability, Climate Change and Water-
Related Hazards.
Kundzewicz, Z. W.; Mata, L. J.; Arnell, N. W.; Döll, P ; Jimenez, .;Miller, K.; Oki, T.; Şen, Z. and Shiklomanov, I (2007), “The implications of
projected climate change for freshwater resources and their management,” Hydrological Sciences Journal, Volume: 53, Issue: 1, Page(s): 3-10.
Lamy, F., Arz, H. W., Bond, G. C., Bahr, A. & Patzold, J. (2006), “Multicentennial-scale hydrological changes in the Black Sea and northern Red
Sea during the Holocene and the Arctic/North Atlantic Oscillation,” Paleoceanography, 21, PA1008, 11.
Leduc C, Favreau G, Schroeter P (2001), “Long-term rise in a Sahelian water-table: the continental terminal in south-west Niger,” Journal of
Hydrology, 243, 43–54.
Lettenmaier D.P. (2008) Chapter 4 Water Resources, in Walsh, M (ed), The effects of climate change on agriculture, land resources, water
resources, and biodiversity in the United States, U.S. Climate Change Science Program and the Subcommittee on Global Change Research,
USDA, Washington, DC.
Lins, H. F. and Slack, J. R. (1999) Streamflow trends in the United States. Geophysical Research Letters, Vol. 26, 227–230.
Lins, H., and J.R. Slack, 1999: Streamflow trends in the United States. Geophysical Research Letters, 26, 227-230.
McDannel, Mark, E. Wheless. 2008. The power of digester gas. WE&T, Vol. 20. No. 6. pp. 36-41.
McGinnis, L (2007), Climate Change and Groundwater Recharge, http://www.ars.usda.gov/IS/pr/2007/070831.htm accessed 8/8/08.
McMahon PB, Dennehy KF, Ellett KM et al. (2003), “Water movement through thick unsaturated zones overlying the central High Plains aquifer,
southwestern Kansas, 2000–2001,” USGS Water Resources Investigation Report, 03-4171, 32pp.
Marshall, Curtis H.; Pielke, Roger A. Sr.; Steyaert, Louis T. And Debra A. Willard (2003), “The Impact of Anthropogenic Land-Cover Change on the
Florida Peninsula Sea Breezes and Warm Season Sensible Weather,”28 Monthly Weather Review, vol. 132.
Maul, G.A. 2008. Florida’s changing sea level. Shoreline: May 2008. Florida Shore and Beach Preservation Association. 3 p.
http://www.fsbpa.com/publications.html .
Miller MR, Brown PL, Donovan JJ et al. (1981), “Saline-seep development and control in the North American Great Plains: hydrogeological
aspects,” Agricultural Water Management, 4, 115–141.
Moore N, Rojstaczer S (2002), “Irrigation’s influence on precipitation: Texas High Plains, U.S.A,” Geophysical Research Letters, 29, 2-1–2-4.
Mulkey, Stephen, “Climate change and land use in Florida: Interdependencies and opportunities” A report prepared for the Century
Commission for a Sustainable Florida, September 30, 2007
Murley, J. (2006), Charting the Course, Where is South Florida Heading, Florida Atlantic University, Boca Raton, FL.
NOAA (2007), Observing Climate Variability and Change http://www.research.noaa.gov/climate/t_observing.html, accessed 3/24/2007
U.S. Climate Change Science Program, “Synthesis and Assessment Product 4.3: The Effects of Climate Change on Agriculture, Land Resources,
Water Resources, and Biodiversity in the United States” May 27, 2008
Pielke, R. A., L. T. Steyaert, P. L. Vidale, G. E. Liston, W. A. Lyons, and T. N. Chase, “The Influence of Anthropogenic Landscape Changes on
Weather in South Florida”, Monthly Weather Review, July 1999, p. 1669.
Ragab R, Finch JW, Harding RJ. (1997), Estimation of groundwater recharge to chalk and sandstone aquifers using simple soil models. Journal of
Hydrology 190: 19–41.
Reilly, Thomas E.; Dennehy, Kevin F.; Alley, William M. and Cunningham, William L. (2008), Ground-Water Availability in the United States, U.S.
Geological Survey Circular 1323, USGS Washington, DC.
Richey, J E.; Costa-Cabral, M. (2006), “Floods, Droughts, and the Human Transformation of the Mekong River Basin,” Eos Trans. AGU, 87(52),
Fall Meet. Suppl., Abstract.
Roark, D.M., Healy, D.F. (1998), “Quantification of deep percolation from two flood-irrigated alfalfa fields, Roswell Basin, New Mexico,” USGS
Water Resources Investigation Report, 98-4096, 32pp.
Salmun, Haydee and Andrea Molod (2006), “Progress in modeling the impact of land cover change on the global climate,” Progress in Physical
Geography 30, 6 (2006) pp. 737–749
Scanlon, Bridget R., Robert C. Reedy, David A. Stonestrom, David E. Prudic and Kevin F. Dennehy (2005), “Impact of land use and land cover
change on groundwater recharge and quality in the southwestern US,” Global Change Biology 11, 1577–1593.
Schilling, K.; and Zhang, Y (2006) “Effects of LULCC on Streamflow and Nitrate-N Concentrations in Iowa and the Mississippi River Basin,” Eos
Trans. AGU, 87(52), Fall Meet. Suppl., Abstract.
Southeast Florida’s Resilient Water Resources Page 108
Scibek J, Allen DM. (2006), “Comparing modelled responses of two high permeability, unconfined aquifers to predicted climate change,” Global
and Planetary Change 50: 50–62.
SFWMD (2007), accessed 3/2/2007, https://my.sfwmd.gov/pls/portal/docs/PAGE/PG_GRP_SFWMD_WATERSUPPLY/SUBTABS%20-
%20LOWER%20EAST%20COAST%20-%20DOCUMENTS/TAB1610173/MIAMI-DADE_UTILITY_SUMMARIES.PDF
Sherif MM, and Singh, VP. (1999), “Effect of climate change on sea water intrusion in coastal aquifers,” Hydrological Processes 13: 1277–1287.
Sililo OTN, and Tellam J. (2000), “Fingering in unsaturated zone flow: a qualitative review with laboratory experiments on heterogeneous
Systems,” Ground Water 38: 864–871.
Singer, F.E. (Ed) (2008), Nature, Not Human Activity, Rules Climate Change, Summary for Policy Makers, the Nongovernmental International
Panel on Climate Changes, The Heartland Institute, Chicago, IL.
Stamm CH, Fluhler HJ, Leuenberger J, and Wenderli H. (1998), „Preferential transport of phosphorus in drained grassland soils,” Journal of
Environmental Quality 27: 515–522.
Strzepek, K. M. and Yates, D. N. (1997), “Climate change impacts on the hydrologic resources of europe: a simplified continental scale analysis,”
Climatic Change, 36, 79–92.
Twilley, R.R., E.J. Barron, H.L. Gholz, M.A. Harwell, R.L. Miller,
D.J. Reed, J.B. Rose, E.H. Siemann, R.G. Wetzel and R.J. Zimmerman (2001). Confronting Climate Change in the Gulf Coast Region: Prospects for
Sustaining Our Ecological Heritage. Union of Concerned Scientists, Cambridge, Massachusetts, and Ecological Society of America, Washington,
D.C.
US Army Corps of Engineers (CERP, 1999), C&SF Comprehensive Review Study Final Integrated Feasibility Report and Programmatic Impact
Statement (PEIS), ACOE, Washington, DC.
U.S. Climate Change Science Program (2008), “Synthesis and Assessment Product 4.3: The Effects of Climate Change on Agriculture, Land
Resources, Water Resources, and Biodiversity in the United States” http://www.climatescience.gov/Library/sap/sap4-3/final-
report/default.htm, accessed 8/8/08
U.S. Geological Survey, 1984, National water summary 1983—Hydrologic events and issues: U.S. Geological Survey Water-Supply Paper 2250,
243 p.
USGS (2005), Sustainable Water Resources Roundtable – Preliminary Report, USGS, Washington, DC.
USEPA (2008), National Water Program Strategy: Response to Climate Change, USEPA, Washington, DC.
van Roosmalen, Lieke,*, Britt S. B. Christensen and Torben O. Sonnenborg (2006) “Regional Differences in Climate Change Impacts on
Groundwater and Stream Discharge in Denmark,” Water Resources Research, Vol. 42, W11405, doi:10.1029/2005WR004742, 2006
Yang, M., Yao, T., Wang, H. & Gou, X. (2006), „Climatic oscillations over the past 120 kyr recorded in the Guliya ice core, China,” Quaternary
International, 154–155, 11–18.
Southeast Florida’s Resilient Water Resources Page 109
List of Tables Table 1 - Aquifer water balance based average inches rainfall per year 1965-2000, (Broward County; Dunn, D., 2008) ........................................ 22
Table 2 - Summary of Climate Change Impacts on Southeast Florida’s Water Resources ....................................................................................... 25
Table 3 - Average rates of sea level rise globally and in Southeast Florida .............................................................................................................. 27
Table 4 - Sea Level Rise, Most Relevant Recent Publications and Reports .............................................................................................................. 29
Table 5 - Sea level rise projections and timeframes ................................................................................................................................................ 31
Table 6 - Projected timetable for loss of coastal structure operability and capacity. .............................................................................................. 42
Table 7 - Interaction of Climate Change Impacts on Water Resources .................................................................................................................... 51
Table 8 – Tools for Protection Water Resources from Climate Change Impacts ..................................................................................................... 53
Table 9 - Wastewater Disposition Alternatives ....................................................................................................................................................... 73
Table 10 - Summary of Measures Pompano Beach could implement to combat climate change effects on its water supply. ............................... 79
Table 11 - Adaptive Planning Framework: Protecting SE Florida's Water Resources .............................................................................................. 83
Table D-1 - Percent structures losing 100% operability vs. sea level rise (Obeysekera, 2009) .............................................................................. 101
Table D-2 - Calculation of total % capacity remaining and total % capacity lost.................................................................................................... 102
List of Figures Figure 1 – Schematic diagram of the hydrological cycle in Southeast Florida. Southeast Florida receives approximately 60 inches of year
annually. Most of Southeast Florida sits on the Biscayne Aquifer, an open coastal aquifer of high porosity and transmissivity. (Graphic: USGS) ... ii
Figure 2 - South Florida’s subtropical climate is strongly influenced by the surrounding waters and the interior Everglades. The Florida peninsula
is surrounded by the Gulf of Mexico to the west, the Atlantic Ocean to the east and Florida Bay to the south. Lake Okeechobee to the north is
fed by the Kissimmee River from central Florida. The Everglades is a wide, shallow river flowing south from the lake to Florida Bay and the Gulf.
Annual rainfall averages approximately 60 inches. ................................................................................................................................................... 5
Figure 3–A typical sunny winter day in Miami ........................................................................................................................................................... 6
Figure 4 - A typical summer afternoon in Miami - thunderstorms forecasted .......................................................................................................... 7
Figure 5 - Miami Beach – Hibiscus (foreground) and Palm Islands are manmade islands in Biscayne Bay. Living on the edge. ............................. 11
Figure 6 - Topography of the Florida Peninsula showing that most of South Florida south of Lake Okeechobee is at very low elevation. (USGS) . 12
Figure 7 - Preliminary LIDAR maps of Miami-Dade County showing current topography on left. Center and right maps show in dark blue those
areas that are at or below 2 ft and 4 ft. (Harlem, 2009) .......................................................................................................................................... 12
Figure 8 - Approximately 29% of Broward County is less than 5 feet above current sea level, shown in purple, based on LIDAR topographical
data. (Source: Broward County GIS) ........................................................................................................................................................................ 13
Figure 9 - Aquifers of the lower Florida peninsula. (USGS) ...................................................................................................................................... 13
Figure 10 - The Biscayne Aquifer is a surficial aquifer bounded beneath by semi-confining clay called the Hawthorne Group. Below that is the
Floridan Aquifer, the Lower Floridan, and the Boulder Zone. (SFWMD) ................................................................................................................. 13
Figure 11 - The Biscayne Aquifer is unconfined and open to the Atlantic Ocean. Lines is equal chloride concentration (isochlors) are shown.
Numbers are in mcg/ml. (USGS) ............................................................................................................................................................................. 14
Figure 12 -Biscayne Aquifer is a karst formation with high porosity and variability. (D. McNeill, U. Miami) ........................................................... 14
Figure 13 - Southeast Florida receives approximately 60" of rain per year. (USGS) ................................................................................................ 15
Figure 14 - Large thunderstorms frequently develop over the Everglades in the summer. This photo shows a typical super cell over the
sugarcane fields of west Palm Beach County in August. (Photo: B. Heimlich) ......................................................................................................... 16
Figure 16 - Water table in Biscayne Aquifer responds rapidly to rainfall. (USGS) .................................................................................................... 16
Figure 15 - Southeast Florida rainfall pattern is highly seasonal with relatively dry winter and spring and rainy summer and autumn.
Approximately 70% of its rainfall occurs during the rainy season. (SFWMD) .......................................................................................................... 16
Figure 17 - Hurricane Jeanne, 2004 (NHC) ............................................................................................................................................................... 17
Figure 18 - Monthly average number of hurricanes. (NOAA) .................................................................................................................................. 18
Figure 19 - Billions of gallons of water flow daily through the surficial aquifers from the Everglades to the Atlantic Ocean. (Graphic: SFWMD) .. 18
Figure 20 - Schematic model of Southeast Florida's hydrology. Billions of gallons per day of fresh water from rainfall and the Everglades flow
through the Biscayne Aquifer, the primary source of potable water. Stormwater drainage canals enabled recovery of land that was originally
Everglades marshland for urban development and agriculture. (SFWMD) ............................................................................................................. 19
Figure 21 - The urban area is separated from the Everglades Water Conservation Areas by a levee. A seepage canal captures water the seeps
under the levee. Drainage canals throughout the urban area maintain water tables and control flooding. ........................................................... 20
Figure 22 - SFWMD Lower East Coast Planning Area showing the network of primary canals used for flood control. (SFWMD) ........................... 20
Figure 23 - Schematic water balance model (1965-2000 annual avg.). Based on data from Broward IWRP (2008). ............................................... 21
Figure 24 - Southeast Florida's extensive stormwater drainage system is indispensible to its habitability. (Image credit: SFWMD) ...................... 23
Figure 25 - Broward County has over 1800 miles of canals used for stormwater drainage, water storage, aquifer recharge, and to convey water
where needed. ........................................................................................................................................................................................................ 24
Southeast Florida’s Resilient Water Resources Page 110
Figure 26 - Sea level rise sharply at the end of the last ice age and rose sharply until about 5000 years ago. Sea level was virtually constant for
the past 2000 years until the late 19th century. (IPCC, 2007) ................................................................................................................................. 26
Figure 27 - Sea Level began rising in about 1900 and rose by about 20 cm (8") during the 20th Century. (IPCC, 2007) ......................................... 27
Figure 28 - Effect of climate change on Atlantic meridional overturning current by 2100 on incremental sea level rise. A minor incremental effect
is predicted for Miami (Yin, 2009). .......................................................................................................................................................................... 27
Figure 29 - Sea level rise has been accelerating at about 0.013 mm/yr2 during the 20th Century. (Church & White, 2006) .................................... 30
Figure 30 - Prediction of sea level rise using a Quadratic Acceleration Equation (Heimlich, 2009). ........................................................................ 30
Figure 31 - Southeast Florida approximate susceptibility to 1 m (3.25’). The area shown in red is at an elevation equal to 1 meter above current
mean high tide. It is not a reliable prediction of inundation since it does not account for tidal action or surface or groundwater hydrology.
Nevertheless, it is an indicator of the potential vulnerability of Southeast Florida to sea level rise. (Image Credit: Weiss and Overpeck) ............ 32
Figure 32 - Sea level rise will affect groundwater flow, water table height, and the extent of saltwater intrusion. If the water table is allowed to
rise as shown in the second drawing above, saltwater intrusion can be minimal. However, there is increased risk of ponding in areas of low
elevation, and reduced soil storage capacity increases the risk of flooding during heavy rainfalls. Conversely, if the water table is controlled at
current levels as shown in the bottom drawing above, the consequences would be diminished groundwater flow that can contribute to flooding
and severe saltwater intrusion, which would threaten the integrity of freshwater supplies. At equilibrium, the saltwater interface would rise 41
feet for each foot of sea level rise according to the Ghyben-Herzberg Relation. .................................................................................................... 34
Figure 33 - Water table maps for Broward County (2000). Water table levels are 2 to 4 feet in south Broward County where elevations are for
the most part below 5 feet. Map on left is for wet season; map on right is for dry season (Broward County). ...................................................... 36
Figure 34 - Groundwater seepage to the ocean will decrease as sea level rises. .................................................................................................... 37
Figure 35 - If current groundwater flow is greater than currently estimated, there will be a greater increase in surface water drainage resulting
from sea level rise. .................................................................................................................................................................................................. 38
Figure 36 - Map showing the Lower East Coast planning area including Everglades Water Conservation Areas (WCA) 1, 2, and 3, the primary
canal drainage system, and the locations and types of flood control structures. Those indicated with red arrows are coastal structures used for
primary flood control and to control saltwater intrusion. The S-13 Pump Station is indicated by the blue arrow. There are also 3 coastal
structures north of the upper boundary of the map that are not shown. The pink shaded area delineates the approximate position of the
saltwater dispersion zone. It illustrates the effectiveness of the salinity structures for limiting saltwater intrusion. (Map: SFWMD) ................... 40
Figure 37 – Typical coastal flood/salinity control structure of the sluice gate type. (SFWMD) ............................................................................... 41
Figure 38 - S-13 Pump station located on C-11 canal at US441 and Orange Drive in Davie, FL. It has a rated capacity of 540 cfs, and can pump
approximately 14.5 million gallons per hour (SFWMD, 2007). ................................................................................................................................ 41
Figure 39 - Effect of sea level rise on capacity of coastal flood control (salinity) structures in Southeast Florida. Blue curve is data from
Obeysekera (2009). ................................................................................................................................................................................................. 42
Figure 40 - Schematic diagram showing seepage of rain water to drainage canals in an unconfined aquifer like the Biscayne. Groundwater can
flow to the canals only if the water table is above the level of the canals (Todd & Mays, 2008). ........................................................................... 43
Figure 41 - Rise in sea level and water table compromises stormwater drainage systems increasing risk of flooding during rainstorms.
(Obeysekera, SFWMD, 2009) .................................................................................................................................................................................. 44
Figure 42 - Cross section of Biscayne Aquifer in South Miami-Dade showing saltwater intrusion and potential spillover of saline water from
Everglades in advent of sea level rise (McNeill, 2008) ............................................................................................................................................. 45
Figure 43 - Biscayne Aquifer lower contour in feet relative to mean sea level. Areas shown in blue and pink are the saltwater intrusion zones.
(USGS) ..................................................................................................................................................................................................................... 45
Figure 44-Change in average rainfall and average temperature for July and August from 1924 to 2000.Wet season rainfall are decreasing while
temperatures are increasing. (Source: Marshall, et al 2003) .................................................................................................................................. 46
Figure 45 - Lake Okeechobee experienced record low levels in 2008 after several consecutive years of drought. ................................................ 47
Figure 46 –The day after a hurricane....................................................................................................................................................................... 47
Figure 47 - Model forecast of storm surge in Broward County. Map shows that all area east of coastal ridge would be flooded in a major
hurricane and surge would penetrate well inland along major rivers and primary canals. ..................................................................................... 48
Figure 48 - Monthly averages for evapotranspiration and rainfall in Southeast Florida. Rainfall exceeds consumption during the wet season from
May through September, when lack of adequate storage capacity requires stormwater release to tide to prevent flooding, especially during
heavy summertime rains. There is usually a significant shortfall during the rest of the year. Water shortages are experienced toward the end of
the dry season in the spring. These extremes are expected to worsen. These patterns vary over an 11 year El Niño/La Niña cycle. .................... 49
Figure 49 - Direct injection of reclaimed water to create a saltwater barrier. ........................................................................................................ 56
Figure 50 - Horizontal wells (on right) can reduce the risk of saltwater intrusion by withdrawing water over a wider area and at less depth than
standard wells (Bloetscher & Muniz, 2008). ............................................................................................................................................................ 57
Figure 51 - Salinity structures control flooding by releasing primary canal water to tide when necessary. They are also used to maintain elevated
canal levels for stormwater storage and to recharge aquifers and control saltwater intrusion. (SFWMD) ............................................................. 58
Figure 52 - Water well drilling rig ............................................................................................................................................................................ 59
Figure 53 - A modern large scale reverse osmosis installation ................................................................................................................................ 60
Figure 54 - Schematic flow diagram for a 2-stage reverse osmosis desalination facility ......................................................................................... 61
Southeast Florida’s Resilient Water Resources Page 111
Figure 55 - Advanced treatment technologies are required for aquifer recharge by well injection. ....................................................................... 62
Figure 56 - Green Cay Wetlands in Palm Beach County, along with Wakodahatchee Wetlands, were constructed for recharge of the surficial
aquifer with tertiary treated wastewater from the nearby wastewater treatment plant. (Photo credit: Barry Heimlich) ...................................... 63
Figure 57 - Significant efforts have been made to develop Aquifer Storage and Recovery in South Florida with limited success to date. ............. 64
Figure 58 - Aquifer Storage and Recovery (ASR) uses a confined aquifer to store excess water for later withdrawal during periods of water
shortage (Broward County). .................................................................................................................................................................................... 64
Figure 59 - A typical ASR well head. ........................................................................................................................................................................ 65
Figure 60 – Stormwater treatment areas provide habitat for egrets, herons, wood storks, roseate spoonbills and other wading and water birds.
(Photo credit: Barry Heimlich). ................................................................................................................................................................................ 66
Figure 61 - Broward County wastewater disposition as of 2006. (SFWMD). Approx. 57% goes to deep well injection, 37% to ocean outfall, and
5% to reuse. ............................................................................................................................................................................................................ 67
Figure 62 - Wastewater discharge and reuse options. Ocean discharge and deep well injection are currently primary means of disposal. Ocean
outfalls are being eliminated under state legislation out of environmental concerns. (Crouse; Garcia; Broward County, 2008) ........................... 67
Figure 63 - Piping used for distribution of reclaimed wastewater is colored purple to distinguish it from potable water pipes. (SFWMD) ........... 69
Figure 64 - Use of reclaimed water for cooling two 1 gigawatt plants in Miami-Dade County can use a total of 70-90 MGD of cooling water...... 69
Figure 65 - Example of how regional partnerships can offer substantial economies of scale, especially when new capacity can be added onto an
existing facility. (Perez, 2009) .................................................................................................................................................................................. 70
Figure 66 - Groundwater Replenishment - Advanced Water Treatment. Elsner, SFWMD, 2009) ........................................................................... 72
Figure 67 - Groundwater Recharge for Reuse by Potable Water (Elsner, SFWMD, 2009) ....................................................................................... 72
Figure 68 - Alligator in its nest hole in the Everglades. (Photo Credit: Barry Heimlich) .......................................................................................... 74
Figure 69 - Orange County, California Factory 21 Advanced Wastewater Treatment and Groundwater Replenishment. ...................................... 75
Figure 70 - A visual representation of active adaptive management, an iterative approach built around explicit, experimentally based
development of plausible management options. This schematic diagram is from the recent report from the Copenhagen Congress on Climate
Change recently issued by the International Association of Research Universities (International Alliance of Research Universities, 2009) .......... 80


A Research Project of:
Florida Atlantic University
Center for Urban and Environmental Solutions
and
Department of Civil, Environmental and Geomatics Engineering
Sponsored by:
National Commission on Energy Policy
BIPARTISAN POLICY CENTER
This document is available online at: http://www.ces.fau.edu/files/projects/climate_change/SE_Florida_Resilient_Water_Resources.pdf Suggested Citation: Heimlich, B.N., Bloetscher, F., Meeroff, D.E. & Murley, J., 2009, Southeast Florida’s Resilient Water Resources: Adaptation to Sea Level Rise and Other Climate Change Impacts, Florida Atlantic University