south east pest management strategy - … · south east pest management strategy ... laughing dove...
TRANSCRIPT

Part 2: Pest Management Plan
Pest Risk Assessment
South EastPestManagementStrategyA regional biosecurity plan forthe control of invasive species

© 2009 South East Natural Resources Management Board

SUMMARY
The aim of this project is to determine the priority pest plants and pest animals of theSouth East region of South Australia. Prioritisation will allow the development ofappropriate and strategic policies and actions to protect the region’s biodiversity and thevalue of primary industries.
It is important to note that this risk assessment was carried out at a regional scale and willtherefore not reflect all local situations or priorities. Such specific local issues can bereflected in local policies, however a regional approach is required for strategic planningpurposes.
The project methodology follows the draft National Post-border Weed Risk ManagementProtocol developed by Standards Australia. A weed and pest risk assessment systemdeveloped by the Department of Water Land Biodiversity Conservation (DWLBC) wasused to determine which pests pose the greatest threats to primary industries and theenvironment in the South East region. Various stakeholders assisted with specialisttechnical information on the pest plant and pest animal species and land use practicesaddressed in this project. The most appropriate management actions for these pestswere then identified using a feasibility of control assessment system also developed byDWLBC.
The results of the project will provide the basis for the South East Natural ResourceManagement Board (herein referred to as ‘the SE NRM Board’) to complete regional weedpolicies. It will also assist the Board and other stakeholders to prioritise on ground works.Table 1.1 lists the priority pest plant and animal species identified by the assessment.
Table 1.1 Priority pest plant and pest animal list
# Environmental weeds
^ Agricultural weeds
Declared SpeciesManagement Action Pest plants Pest animalsNon declared
speciesAlert ListSpecies that are notknown to be presentin the region andwhich represent asignificant threat.Aims to prevent thespecies arriving andestablishing in themanagement area
AlismaAlligator weedArrowheadAzzarolaBroadkernel espartilloBroomrapeCabombaCalomba daisyCane needlegrassChilean needlegrassCoolatai grassElodeaEurasian watermilfoilHorsetailHydrocotyleLagarosiphonLeafy elodeaMexican feathergrassNightstockPheasant's eye
Cane toadCommon mynaFeral pigHouse crowIndian ringneckLaughing doveRed-eared sliderRed-whiskeredbulbulSong thrushTree sparrowWater buffalo
Blue mustardParrot’s featherWater primrose

Declared SpeciesManagement Action Pest plants Pest animalsNon declared
speciesPlumerilloPoison buttercupPrimrose willowRagwortRhus treeSagittariaSalviniaSenegal tea plantSerrated tussockTexas needlegrassWater caltropWater dropwortWater hyacinthWater soldier
Eradication fromRegionAims to remove thepest species from themanagement area
Bridal veil#Golden dodder^
Dingo/ Wilddog^Goat#^
DestroyInfestationsAims to significantlyreduce the extent ofthe pest species inthe managementarea
Blackberry#Western cape bridalcreeper#Innocent weed^Pampas grass#Silverleaf nightshade^#
Chital, Rusa &Sambar deer#^Mallard#Red & Wapitideer#^
Asparagus fernTree of heavenWhite weepingbroom
Contain SpreadAims to prevent theongoing spread ofthe pest species inthe managementarea
African feathergrass#^Aleppo pine#Bathurst burr^Boneseed#Caltrop^Cape tulip (1& 2 leaf)^Creeping knapweed^Gorse#^Hoary cress^Salvation Jane^Three corner jack^Three hornedbedstraw^Variegated thistle^Yellow burrweed^
Brown ratFallow deer#^Hog deer#^Rabbit#^
Bluebell creeper#Dolichos pea#Erica#Radiata pine#Sallow wattle#Carp
Protect SitesAims to preventspread of the pestspecies to keysites/assets of higheconomic,environmental and/orsocial value
African boxthorn#^African lovegrass#^Bladder campion^Cape broom#Cutleaf mignonette^English broom#False caper^Field bindweed^Horehound^Lincoln weed^Noogoora burr^
Black rat#^ Apple of sodom^Bedstraw^Blue psoralea#Buckthorn#Coastal tea tree#Cootamundrawattle#Couch#^Gazania#GoldfishIvy#

Declared SpeciesManagement Action Pest plants Pest animalsNon declared
speciesOlive##Slender thistle^Solider thistle^Spear thistle^Wild carrot^Willow spp.#^
Kikuyu#^MarronMuskweed#Pepper treePolygala#Sea wheatgrass#Shiny leafcoprosma#Spiny rush#^Swamp oak#
Manage PestAims to reduce theoverall economic,environmental and/orsocial impacts of thepest species throughtargetedmanagement
Bridal creeper# Feral cat#Fox#^House mouse#^Starling#^Eurasianblackbird#^Domesticpigeon#^
Acacia cyclops#Annual ryegrass ^Bracken fern^Capeweed^Coastal wattle#Desert ash#Fat hen^Golden wreathwattle#Phalaris^Pin cushiondaisy^#Poa grass^#Poplars^#Pyp grass#^Tall wheatgrass#Veldt grass#Wild oats#^Wild radish^TroutCarp gudgeonGambusiaRedfin
Manage SitesAims to maintain theoverall economic,environmental and/orsocial value of keysites/assets throughimproved generalpest management
Buchan weed^#Dog rose#Onion grass^Onion weed^Perennial thistle^Skeleton weed^Soursob^Sweet briar#
Hare Blue periwinkle#Cotoneaster#Dock^Fleabane^Freesia#Marram grass#Silver grass^South Africanweed orchid#Sweetpittosporum#Tagasaste#Williams grass^Wireweed^Tench
MonitorAims to detect anysignificant changes inthe species ’pest risk
Athel pine^#Chilean dodder^Red dodder^Hawthorn/ May#
Agave#Arum lily#Butterfly bush#English oak#

Declared SpeciesManagement Action Pest plants Pest animalsNon declared
speciesPrickly pear^#Wild artichoke^
Margueritedaisy#Ox tongue^Sea spurge#Wandering jew#
Limited ActionThe pest specieswould only betargeted forcoordinated control inthe managementarea if its localpresence makes itlikely to spread toland uses where itranks as a higherpriority.
Bamboo#Blackberrynightshade^Bulbil watsonia#Sorrell^White arctotis
.

SOUTH EAST PEST MANAGEMENT PLAN – PART 2PEST RISK ASSESSMENT
CONTENTS
SUMMARY 3
CONTENTS 7
1 THE SOUTH EAST REGION 11
2 REGIONAL LAND USE 12
2.1 The Importance of Land Use and its role in Pest Management 12
3 METHOD 16
3.1 Weed Risk Assessment 16
3.1.1 Determining the weed list 163.1.2 Applying the SA Weed Risk Management System 163.1.3 Determine Regional Weed Management Priorities 173.1.4 Guiding principles for each of the management categories in the weed risk matrix: 18
3.2 Vertebrate Pest Risk Assessment 20
3.2.1 Determining the pest list 203.2.2 Applying the SA Pest Risk Management System 203.2.3 Pest Animal Management Action Priorities 223.2.4 Guiding principles for each of the management categories in the vertebrate pest
matrix 23
4 RESULTS 25
4.1 Grazing 26
4.1.1 Description 264.1.2 Assumptions 264.1.3 Results 284.1.4 Summary 33
4.2 Native Vegetation 34
4.2.1 Description 344.2.2 Assumptions 344.2.3 Results 364.2.4 Summary 43
4.3 Cropping 44
4.3.1 Description 444.3.2 Assumptions 444.3.3 Results 464.3.4 Summary 50
4.4 Forestry 51
4.4.1 Description 51

SOUTH EAST PEST MANAGEMENT PLAN – PART 2PEST RISK ASSESSMENT
4.4.2 Assumptions 514.4.3 Results 534.4.4 Summary 56
4.5 Aquatic 57
4.5.1 Description 574.5.2 Assumptions 574.5.3 Results 594.5.4 Summary 62
4.6 Urban 63
4.6.1 Description 634.6.2 Assumptions 634.6.3 Results 654.6.4 Summary 68
4.7 Irrigated crops and pasture 69
4.7.1 Description 694.7.2 Assumptions 694.7.3 Results 714.7.4 Summary 75
4.8 Perennial horticulture 76
4.8.1 Description 764.8.2 Assumptions 764.8.3 Results 784.8.4 Summary 81
4.9 Combined risk Assessment Results 82
5 ALERT LIST 90
6 PRIORITY PEST PLANT AND PEST ANIMAL SPECIES 91
6.1.1 Regional priorities 91
7 DISCUSSION 92
7.1 Conflict of interest 92
7.2 Limitations and interpretation of risk assessment results 92
8 RECOMMENDATIONS 93
9 REFERENCES 94
APPENDIX 1 95

SOUTH EAST PEST MANAGEMENT PLAN – PART 2PEST RISK ASSESSMENTLIST OF FIGURES
Figure 2.1 Major land use of South East South Australia ............................................................15Figure 4.1 Map of grazing land use...............................................................................................27Figure 4.2 Map of native vegetation land use..............................................................................35Figure 4.3 Map of cropping land use............................................................................................45Figure 4.4 Map of forestry land use ..............................................................................................52Figure 4.5 Map of aquatic land use ...............................................................................................58Figure 4.6 Map of urban land use .................................................................................................64Figure 4.7 Map of irrigated crops and pastures land use.............................................................70Figure 4.8 Map of perennial horticulture land use ........................................................................77
LIST OF TABLES
Table 1.1 Priority pest plant and pest animal list..........................................................................3Table 2.1 ALUM Classification version 6 – summary ................................................................13Table 2.2 SE NRM Board land use consolidation ......................................................................14Table 3.1 Regional management guidelines based on weed risk and feasibility of
containment ..................................................................................................................18Table 3.2 Pest animal risk assessment management action matrix ..........................................22Table 4.1 Weed risk assessment results table for grazing land use .................. ........................28Table 4.2 Weed risk assessment matrix for grazing land use ....................................................31Table 4.3 Vertebrate pest risk assessment results for grazing land use ...................................32Table 4.4 Vertebrate pest risk assessment matrix for grazing land use ....................................33Table 4.5 Weed risk assessment results table for native vegetation land use ..........................36Table 4.6 Weed risk assessment matrix for native vegetation land use ....................................40Table 4.7 Vertebrate pest risk assessment results table for native vegetation land use ..........41Table 4.8 Vertebrate pest risk assessment matrix for native vegetation land use ...................42Table 4.9 Weed risk assessment results table for cropping land use .......................................46Table 4.10 Weed risk assessment matrix for cropping land use .................................................48Table 4.11 Vertebrate pest risk assessment results table for cropping land use .......................49Table 4.12 Vertebrate pest risk assessment matrix for cropping land use .................. ...............50Table 4.13 Weed risk assessment results table for forestry land use.........................................53Table 4.14 Weed risk assessment matrix for forestry land use...................................................54Table 4.15 Vertebrate pest risk assessment results table for forestry land use .........................55Table 4.16 Vertebrate pest risk assessment matrix for forestry land use ...................................56Table 4.17 Weed risk assessment results table for aquatic land use .........................................59Table 4.18 Weed risk assessment matrix for aquatic land use ...................................................60Table 4.19 Vertebrate pest risk assessment results table for aquatic land use .........................61Table 4.20 Vertebrate pest risk assessment matrix for aquatic land use ...................................62Table 4.21 Weed risk assessment results table for urban land use............................................65Table 4.22 Weed risk assessment matrix for urban land use....... ...............................................66Table 4.23 Vertebrate pest risk assessment results table for urban land use ............................67Table 4.24 Vertebrate pest risk assessment matrix for urban land use ......................................68Table 4.25 Weed risk assessment results table for irrigated crops and pastures land use .......71Table 4.26 Weed risk assessment matrix for irrigated crops and pastures land use .................73Table 4.27 Vertebrate pest risk assessment results table for irrigated crops and pastures land
use ................................................................................................................................74Table 4.28 Vertebrate pest risk assessment matrix for irrigated crops and pastures land use .....
............................................................................................................... .......................75Table 4.29 Weed risk assessment results table for perennial horticulture land use ..................78Table 4.30 Weed risk assessment matrix for perennial horticulture land use ............................79Table 4.31 Vertebrate pest risk assessment results table for perennial horticulture land use...80Table 4.32 Vertebrate pest risk assessment matrix for perennial horticulture land use.............81Table 4.33 Weed species versus management actions ..............................................................82Table 4.34 Vertebrate pests versus management actions ...........................................................89Table 5.1 Alert species .................................................................................................................90Table 6.1 Priority pest plant and pest animal list......................................................... ...............91

SOUTH EAST PEST MANAGEMENT PLAN – PART 2PEST RISK ASSESSMENT
10
Document Map
Part 1Background and
OverviewThe Strategy
Part 2Pest Risk Assessmentand Management Plan• Pest risk assessment
• Regional pest policies
• Weed spreadprevention
Part 3Community
Engagement Plan• Pest awareness
• CommunicationEngagement
• Education
Part 4Operational Procedures• Weed hygiene
• Incursion response
• Monitoring andevaluation
This Document

SOUTH EAST PEST MANAGEMENT PLAN – PART 2PEST RISK ASSESSMENT
11
1 THE SOUTH EAST REGION
The South East Natural Resources Management (SE NRM) Region is situated in theSouth East corner of South Australia. It is bounded by the Victorian border to the east,the Southern Ocean to the south and west and the Murray Darling Basin NaturalResources Management Region to the north. The SE NRM region is made up of ninelocal government areas, these being the District Councils of Grant, Robe, and Tatiara,Kingston District Council, Naracoorte Lucindale Council, Wattle Range Council, CoorongCouncil, Southern Mallee District Council and the City of Mount Gambier. Mount Gambieris the main regional centre and the only city in the South East of South Australia. Theprincipal townships are Bordertown, Keith, Kingston, Millicent, Naracoorte, Penola andRobe.
The highest annual rainfalls are found in the southern areas of the region where theaverage precipitation is approximately 850mm. Rainfall decreases in the north toapproximately 450mm per annum. The majority of rain falls during the winter months,particularly in the coastal zones. The climate of the South East is a cool Mediterraneantemperate climate; warmer in the Upper South East than the Lower South East.
The majority of soil types in the South East are sandy, including deep sands and sandover clay. These soils are scattered across the entire region and dominate in the northwest of the region. Many of the soils of the coastal plains are associated with the ancientdune geological systems running north to south and are dominated by limestone substratewith deep sand and shallow red soils on the dunes and shallow black clays in the swales.Mt Gambier district has a large proportion of volcanic soils which are of high quality.Other patches of high quality soil includes peats in the Lower South East, well structuredblack clays in lower topographic areas and loam over clay soils east of the NaracoorteRange. Moderate to shallow red soils associated with limestone ridges are highlyproductive for the viticulture industry.
Primary production is varied across the region. In the southern zone, there is high forestryactivity, dairy production and livestock production. In the north, large scale cropping,vineyards and grazing are the prominent practices. The majority of the SE NRM regionconsists of grazing lands (modified pasture) used for prime livestock (cattle and sheep)production. There is a large spread of native vegetation across the entire region, whichvaries greatly to include unique wetlands, mallee scrub, coastal vegetation and grassywoodlands.
The economic, environmental and social impact due to the presence of pest plants andpest animals is well documented (Sinden et al. 2004, Gong et al. 2009). At a nationalscale pest plants are suggested to impact upon agricultural production and loss ofbiodiversity to the tune of $4 billion per annum, while pest animals have a direct economicimpact of at least $743 million per annum.

SOUTH EAST PEST MANAGEMENT PLAN – PART 2PEST RISK ASSESSMENT
12
2 REGIONAL LAND USE
2.1 THE IMPORTANCE OF LAND USE AND ITS ROLE IN PEST MANAGEMENT
There are various factors which will determine the capacity of weeds and exotic animals tobecome “pests” and have an impact on a landscape. Climate and availability of naturalresources are very important factors which allow pest plants and pest animals to invadeand exploit their environment. Land use and its management are extremely important inthe capacity of an individual species or combination of species to dominate a landscape.
The classification and description of land uses and its management is significant for themonitoring and evaluation of each pest plant and pest animal and the impacts on thecosts of primary production, environment and social values.
While the full impact of climate change on pest plant populations is limited, it is known thatland use and its management can change rapidly particularly in agricultural production,where the market place often determines which enterprises are undertaken in the short tomedium term.
Climate and soils will be a limiting factor for the adoption of some land uses; however theuse of irrigation or controlled environments such as glasshouse production can extend theland use options available.
The Australian Land Use and Management (ALUM) classification scheme has beenagreed to by all state and territory authorities in Australia and is based on a classificationsystem developed by Baxter and Russell in 1994.
Table 2.1, the ALUM classification Version 6 is a simple classification system, whichprovides the basis for measuring land use and its management across the whole ofAustralia at a range of landscapes, from National to catchment levels. It has six primaryclasses, which are then split into secondary and tertiary classifications to allow for moredetailed land use categories.
Table 2.2, SE NRM Board land use consolidation shows the comparison between the landuses in the SE NRM region and the classification identified under the ALUM classification.
The adoption and use of the ALUM classification system will ensure that the SE NRMBoard will be able meet national standards in monitoring and evaluating the impact of landuse and its management on the presence of pest plants and pest animals.

SOUTH EAST PEST MANAGEMENT PLAN – PART 2PEST RISK ASSESSMENT
13
Table 2.1 ALUM Classification version 6 – summary

SOUTH EAST PEST MANAGEMENT PLAN – PART 2PEST RISK ASSESSMENT
14
Table 2.2 SE NRM Board land use consolidation
ALUM Classification V6_Primary land use ALUM Classification V6_Secondary landuse
SENRMB land use1 Conservation and natural environments 1.1 Nature conservation Native Vegetation
1.2 Managed resource protection Native Vegetation1.3 Other minimal use Native Vegetation
2 Production from relatively natural environments 2.1 Grazing natural vegetation Grazing3 Production from dryland agriculture and plantations 3.1 Plantation forestry Forestry
3.2 Grazing modified pastures Grazing3.3 Cropping Cropping3.4 Perennial horticulture Perennial Horticulture3.5 Seasonal horticulture Perennial Horticulture
4 Production from irrigated agriculture and plantations 4.1 Irrigated plantation forestry Forestry4.2 Irrigated modified pastures Irrigated Crops and Pastures4.3 Irrigated cropping Irrigated Crops and Pastures4.4 Irrigated perennial horticulture Perennial Horticulture4.5 Irrigated seasonal horticulture Irrigated Crops and Pastures
5 Intensive uses 5.1 Intensive horticulture Perennial Horticulture5.2 Intensive animal production Grazing5.3 Manufacturing and industrial Urban5.4 Residential Urban5.5 Services Urban5.6 Utilities Urban5.7 Transport and communication Urban5.8 Mining Urban5.9 Waste treatment and disposal Urban
6 Water 6.1 Lake Aquatic6.2 Reservoir/dam Aquatic6.3 River Aquatic6.4 Channel and aqueduct Aquatic6.5 Marsh/wetland Aquatic6.6 Estuary/coastal water Aquatic

SOUTH EAST PEST MANAGEMENT PLAN – PART 2PEST RISK ASSESSMENT
15
Figure 2.1 Major land use of South East South Australia

SOUTH EAST PEST MANAGEMENT PLAN – PART 2PEST RISK ASSESSMENT
16
3 METHOD
3.1 WEED RISK ASSESSMENTDetermining priority pest plants allows effective and efficient policies to be developed thatprotect the economic, environmental and social assets of the region. Prioritisation isrequired in order to allocate limited human and financial resources for the most beneficialoutcome for the region. Every pest plant assessed in this project has been assigned to astrategic management action category according to its results within the particular landuse.
The species identified are a combination of the declared plant list under the NaturalResources Management Act 2004 and other non-declared plants considered to be a pestin the South East NRM region.
3.1.1 Determining the weed list
In 2005 a comprehensive assessment process was undertaken by obtaining informationfrom various stakeholders. This was a detailed and thorough process by which groupswere formed for each land use consisting of professionals and community members activein each particular land use. As a group, members then undertook the weed riskassessment for the land use they were representing.
A second assessment was undertaken in 2009 by investigating and assessing otherSouth Australian Natural Resource Management regional Weed Risk Assessments. Pestplants were identified which were not previously assessed in a particular land use, or werenot assessed at all in the South East weed risk assessment in 2005.
3.1.2 Applying the SA Weed Risk Management System
In South Australia, a system to rank the importance of pest plants has been developed foruse in planning control programs and in assessing new species for declaration. TheDepartment of Water Land and Biodiversity Conservation Weed Risk ManagementScoresheet, produced in consultation with regional Authorised Officers, were based on aranking system developed to determine Weeds of National Significance in Australia.
Pest plants are assessed separately for different land uses so that the most importantpest plants of different land uses can be accurately identified. This project assessed pestplants at a regional scale, which required some averaging of scores to account for theenvironmental differences across the region. This method will therefore provide a strategicregional context but may not reflect all local situations.
The assessment system consists of multiple-choice questions to derive scores for variouscharacteristics of each pest plant. This process allows an objective assessment to bemade on a pest plants threat rather than simply react to its presence and appearance.The South Australian Weed Management Guide can be seen in Appendix 1.
Weed RiskThe weed risk is determined by assessing the invasiveness, impacts and potentialdistribution for each species. Invasiveness is used as an indicator of a plant’s rate ofspread, with faster spreading species being considered more important for urgent controland thus of higher priority. The questions to determine a score for invasiveness relate to aplant’s ability to establish, tolerance to routine control, reproductive ability and dispersal bynatural and human-influenced means. The impacts assessment investigates theeconomic, environmental and social effects of pest plants, with the questions covering

SOUTH EAST PEST MANAGEMENT PLAN – PART 2PEST RISK ASSESSMENT
17
effects on establishment and growth of desired plants, animal, human and environmentalhealth as well as reduction in product quality and restriction to physical movement.Potential distribution considers the area of the land use at risk of invasion by the pestplant.
Scores for invasiveness, impacts and potential distribution are multiplied together to givethe total weed risk score. The weed risk score was then divided into categories to allowcomparison within the management action matrix. These categories can be seen below.
Feasibility of controlWithin the landuse the feasibility of controlling the pest plant is also an importantconsideration in prioritising control efforts. Feasibility of control consists of scores forcontrol costs, current distribution and persistence. Control costs investigate howdetectable the plant is, general accessibility to infestations, operating costs, labour costsand level of cooperation expected from landholders. The current distribution of the pestplant within its landuse is calculated together with the spatial pattern of the plant, i.e. is itwidespread, restricted or scattered. The persistence considers how effective the targetedcontrol is, maximum time to reproduction, maximum longevity or production of propagulesand the likelihood of ongoing dispersal. The scores for control costs, current distributionand persistence are multiplied to give a feasibility score. These scores are divided intocategories similar to the weed risk, as seen below:
3.1.3 Determine Regional Weed Management PrioritiesBy comparing a weed’s risk score to its feasibility of control score, recommendations canbe made for the most appropriate management action. This allows priority to be allocatedto those pest plants that have a high risk and are feasible to control. Pest plants that arevery low risk will not be recommended for control over other higher priority species, even ifthey are present. Likewise, species that are widespread but not feasible to control will notrank as a high priority. A matrix for completing this comparison is shown in Table 3.1.The management categories are described below:
Frequency Band Weed RiskScore Weed Risk
80 - 100% (top 20% of possible scores) 192+ Very high60 - 80% < 192 High40 - 60% < 101 Medium20 - 40% < 39 Low0 - 20% (bottom 20% of possible scores) < 13 Negligible
Frequency Band FeasibilityScore
Feasibility ofContainment
80 - 100% (top 20% of possiblescores) 113+ Negligible
60 - 80% < 113 Low40 - 60% < 56 Medium20 - 40% < 31 High0 - 20% (bottom 20% of possiblescores) < 14 Very High

SOUTH EAST PEST MANAGEMENT PLAN – PART 2PEST RISK ASSESSMENT
18
Table 3.1 Regional management guidelines based on weed risk andfeasibility of containment
FEASIBILITY OF CONTAINMENTWEEDRISK Negligible
>113Low>56
Medium>31
High>14
Very High<14
Negligible<13 LIMITED ACTION LIMITED ACTION LIMITED ACTION LIMITED ACTION MONITOR
Low<39 LIMITED ACTION LIMITED ACTION LIMITED ACTION MONITOR MONITOR
Medium<101 MANAGE SITES MANAGE SITES MANAGE SITES PROTECT SITES CONTAIN
SPREAD
High<192 MANAGE WEED MANAGE WEED PROTECT SITES CONTAIN
SPREADDESTROY
INFESTATIONS
Very High>192 MANAGE WEED
PROTECT SITES& MANAGE
WEED
CONTAINSPREAD
DESTROYINFESTATIONS ERADICATE
ALE
RT
3.1.4 Guiding principles for each of the management categories in the weedrisk matrix:
ALERTThis category refers to species that are not known to be present in the management areabut which represent a significant threat. Such species would score “0” in Feasibility ofContainment due to their absence.This management category aims to prevent the species arriving and establishing in themanagement area through:
• Prevention of entry to management area• Ongoing surveillance for incursions of the species (e.g. nursery inspections)• Training and awareness activities for the community to enable early detection
ERADICATEThis management category aims to remove the weed species from the management areathrough:
• Detailed surveillance and mapping to locate all infestations• Destruction of all infestations including seedbanks• Prevention of entry to management area and movement and sale within• Removal and prohibition of all cultivated plants• Monitoring progress towards eradication
DESTROY INFESTATIONSThis management category aims to significantly reduce the extent of the weed species inthe management area through:
• Detailed surveillance and mapping to locate all infestations• Destruction of all infestations, aiming for local eradication at feasible sites• Prevention of entry to management area and movement and sale within the region

SOUTH EAST PEST MANAGEMENT PLAN – PART 2PEST RISK ASSESSMENT
19
• Prohibiting cultivated growth• Monitoring progress towards reduction
CONTAIN SPREADThis management category aims to prevent the ongoing spread of the weed species in themanagement area through:
• Surveillance and mapping to locate all infested properties• Control of all infestations, aiming for a significant reduction in weed density• Prevention of entry to management area and movement and sale within the region• Preventing spread from cultivated plants (if grown)• Monitoring change in current distribution
PROTECT SITESThe weed may be of limited current distribution but only threatens limitedindustries/habitats (lower weed risk). Or the weed may be more widespread but is yet toinvade/impact upon many key industries/habitats (higher weed risk).This managementcategory aims to prevent spread of the weed species to key sites/assets of higheconomic, environmental and/or social value through:
• Surveillance and mapping to locate all infested areas• Identification of key sites/assets in the management area• Control of infestations in close proximity to key sites/assets, aiming for a significant
reduction in weed density• Limits on movement and sale of species within management area• Preventing spread from cultivated plants (if grown) in close proximity to key
sites/assets• Monitoring change in current distribution within and in close proximity to key
sites/assets
MANAGE WEEDThis management category aims to reduce the overall economic, environmental and/orsocial impacts of the weed species through targeted management including:
• Research and development of integrated weed management (IWM) packages forthe species, including herbicides and biological control where feasible
• Promoting IWM packages to landholders• Monitoring decrease in weed impacts with improved management• Identifying key sites/assets in the management area and ensuring adequate
resourcing to manage the weed species
MANAGE SITESThis management category aims to maintain the overall economic, environmental and/orsocial value of key sites/assets through improved general weed management such as:
• Promoting general IWM principles to landholders, including the range of controltechniques, maintaining competitive vegetation/crops/pastures, hygiene andproperty management plans.
• Identifying key sites/assets in the management area and ensuring adequateresourcing to manage these to maintain their values
• Broaden focus beyond weeds to all threatening processes
MONITORThis management category aims to detect any significant changes in the species’ weedrisk by:
• Monitoring the spread of the species and review any perceived changes inweediness

SOUTH EAST PEST MANAGEMENT PLAN – PART 2PEST RISK ASSESSMENT
20
LIMITED ACTIONThe weed species would only be targeted for coordinated control in the management areaif its local presence makes it likely to spread to land uses where it ranks as a higherpriority.
• Undertake control measures if required for the benefit of other land uses at risk• Otherwise limited advice to land managers if required.
3.2 VERTEBRATE PEST RISK ASSESSMENT
Determining priority pest animals allows effective and efficient policies to be developedthat protect the economic, environmental and social assets of the region. Prioritisation isrequired in order to allocate limited human and financial resources for the most beneficialoutcome for the region. Every pest animal assessed in this project has been assigned to astrategic management action category according to its results within the particular landuse.
The pest animals assessed in this report are declared under the Natural ResourcesManagement Act 2004. Non declared species are acknowledged as potential pests butdue to time constraints and the scope of this project they were not put through the riskmanagement system.
3.2.1 Determining the pest listA steering group was formed consisting of members with expert knowledge of each of theland uses. Criteria were defined to exclude some species on the basis of not present inthe region, widespread in the region and not present but poses a risk to the region. Someanimals were assessed on the basis that the species is present in captivity but not foundin feral/wild populations, such as pigs and water buffalo.
3.2.2 Applying the SA Pest Risk Management System
The SA Pest Animal Risk Management Guide was developed by the Animal and PlantControl Group of the Department for Water, Land and Biodiversity Conservation(DWLBC), in cooperation with staff of Rural Solutions SA and Natural ResourceManagement Boards to help in prioritising pest animals for control programs.
This guide was based on and consistent with the SA Weed Risk Assessment Systemdeveloped by Dr John Virtue for Animal and Plant Control Boards in South Australia (nowintegrated into Natural Resource Management Boards). The pest animal riskassessment system can be broadly applied to many geographic scales and for any landuse. Other existing risk assessment systems have been used in the development of thisguide (see references).
The assessment process involves a series of questions to compare the relative risk andfeasibility of control of different pest animals. Pest animals are assessed separately forvarious land uses so that the most important pest animals of different land uses can beidentified.
While the initial pest animal list for each land use within the SE NRM region wasdetermined through the consultation process, the pest attribute information (i.e.distribution, growth habit, reproduction capability, control methods etc) was obtained fromvarious sources of literature.

SOUTH EAST PEST MANAGEMENT PLAN – PART 2PEST RISK ASSESSMENT
21
The key features of the risk assessment process are explained in the following sections.This information has been adapted from the SA Pest Animal Risk Management Systemand Guide – June 2007.
Comparative Pest Risk (CPR)
The pest animal risk questions are divided into three main criteria: Invasiveness,Impacts and Potential distribution.
Invasiveness is used as an indicator as to how fast the pest animal can spread within aparticular land use. It takes account of how well the pest animal can establish, reproduceand disperse.
Impacts criteria determines the potential economic, environmental and social effects of apest animal, with the questions covering the pest animal’s effect on establishment andgrowth of desired plants and animal, human and environmental health as well asreductions in product quality, and limits on physical movement.
Potential distribution considers what proportion of a land use is at risk from the pestanimal in question. This will depend on the climate and habitat preferences of the pestanimal. For example, some pest animals may only be suited to higher rainfall areas, ormay only be a problem on sandy well-drained soils.
Scores for invasiveness, impacts and potential distribution are multiplied to give acomparative pest animal risk score, that is:
Comparative Pest Risk = Invasiveness _ Impacts _ Potential distribution
Dividing the scores into bands of 20% provides discreet classes of pest risk.
Frequency Band Comparative PestRisk (CPR) Score Pest Animal Risk
80 - 100% (top 20% of possible scores) 157+ Very high60 - 80% 84 -156 High40 - 60% 31-83 Medium20 - 40% 10-30 Low0 - 20% (bottom 20% of possiblescores) <10 Negligible
Feasibility of containment (FOC)The feasibility of containment questions are divided into three main criteria; Controlcosts, Current distribution and Persistence.
Control costs consider the costs associated with the detection of the pest animal, on-ground control, enforcement /education needs, and achieving landholder commitment.
Current distribution considers the proportion of the land use currently occupied, and theoverall pattern of pest animal populations.
Persistence refers to how long it takes to eradicate the pest animal. It considers theefficacy of targeted control actions, susceptibility to control actions, re-colonisation andpersistence in the land use.
The score for feasibility of containment is calculated by adjusting then multiplying thecontrol costs, current distribution and persistence scores, that is:

SOUTH EAST PEST MANAGEMENT PLAN – PART 2PEST RISK ASSESSMENT
22
Feasibility of Containment = Control Costs _ Current Distribution _ Persistence
Dividing the scores into bands of 20% provides discreet classes for feasibility ofcontainment.
Frequency BandFeasibility ofContainment(FOC) Score
Feasibility ofContainment
80 - 100% (top 20% of possible scores) >111 Negligible60 - 80% 111-55 Low40 - 60% 31-54 Medium20 - 40% 13-30 High0 - 20% (bottom 20% of possible scores) <13 Very High
3.2.3 Pest Animal Management Action Priorities
By comparing the comparative pest risk and the feasibility of containment of each pestanimal in a matrix a management action is identified that defines the pest managementpriorities for each land use. For example a pest animal with a high Comparative Pest Risk(CPR) and high Feasibility of Containment (FOC) will be assigned a higher prioritymanagement action than a pest animal with a high CPR and low FOC.
The pest risk assessment results are typically displayed as a matrix, as shown in Table3.2. Management actions for each sector of the matrix and explanatory notes for eachmanagement action are described in the remainder of this section.
Table 3.2 Pest animal risk assessment management action matrix
FEASIBILITY OF CONTAINMENTCOMPARATIVE
PEST RISK Negligible>111
Low111-55
Medium31-54
High13-30
Very High<13
Negligible<10 NO ACTION NO ACTION NO ACTION NO ACTION MONITOR
Low10-30 NO ACTION NO ACTION NO ACTION MONITOR PROTECT
SITES
Medium31-83 MANAGE SITES MANAGE SITES MANAGE SITES PROTECT
SITESCONTAINSPREAD
High84-156
MANAGE PESTANIMAL
POPULATIONS
MANAGE PESTANIMAL
POPULATIONS
PROTECTSITES CONTAIN DESTROY
POPULATIONS
Very High>157
MANAGE PESTANIMAL
POPULATIONS
PROTECTSITES
& MANAGEPEST ANIMALPOPULATIONS
CONTAINSPREAD
DESTROYPOPULATIONS
ERADICATEFROM REGION

SOUTH EAST PEST MANAGEMENT PLAN – PART 2PEST RISK ASSESSMENT
23
3.2.4 Guiding principles for each of the management categories in thevertebrate pest matrix
ERADICATE FROM REGIONThis management category aims to remove the pest animal species from the regionthrough:
• Detailed surveillance and mapping to locate all populations• Destruction of all populations including juveniles• Prevention of entry to region and keeping, movement and sale within the region• Monitoring progress towards eradication
DESTROY POPULATIONSThis management category aims to significantly reduce the extent of the pest animalspecies in the region through:
• Detailed surveillance and mapping to locate all populations• Destruction of all populations, aiming for local eradication at feasible sites• Prevention of entry to region and keeping, movement and sale within the region• Considering quarantine provisions• Monitoring progress towards reduction
CONTAIN SPREADThis management category aims to prevent the ongoing spread of the pest animal speciesin the region through:
• Surveillance and mapping to locate all infested properties• Enforcing control of all populations, aiming for a significant reduction in pest animal
density through high level initial control and sustained management• Controlling entry, movement and keeping under permit conditions• Monitoring change in current distribution
PROTECT SITESThe pest animal may be of limited current distribution but only threatens limitedindustries/habitats (lower pest animal risk), or the pest animal may be more widespreadbut is yet to invade/impact upon many key sub-regional industries/habitats (higher pestanimal risk). This management category aims to prevent spread of the pest animalspecies to key sites/assets of high economic, environmental and/or social value through:
• Surveillance and mapping to locate all infested sub-regions• Identification of key sites/assets in the region• Enforcing control of populations in close proximity to key sites/assets, aiming for a
significant reduction in pest animal density• Controlling entry, movement and keeping under permit conditions• Monitoring change in current distribution within and in close proximity to key
sites/assets
MANAGE PEST ANIMAL POPULATIONThis management category aims to reduce the overall economic, environmental and/orsocial impacts of the pest animal species through targeted management, including:
• Research and development of integrated pest animal management (IPM)packages for the species, including cultural, chemical and biological control wherefeasible
• Promoting IPM packages to landholders• Monitoring decrease in pest animal impacts with improved management• Identifying key sites/assets in the region and ensuring adequate resources to
manage the pest animal species

SOUTH EAST PEST MANAGEMENT PLAN – PART 2PEST RISK ASSESSMENT
24
MANAGE SITESThis management category aims to maintain the overall economic, environmental and/orsocial value of key sites/assets through improved general pest animal management, suchas:
• Promoting general IPM principles to landholders, including the range of controltechniques and farm management practices.
• Identifying key sites/assets in the region and ensuring adequate resources tomanage these to maintain their values
• Broaden focus beyond pest animals to all threatening processes
MONITORThis management category aims to detect any significant changes in the species’ pestanimal risk by:
• Monitoring the spread of the species and review any perceived changes in pestanimal invasiveness.
NO ACTIONThe pest animal species is perceived to be of insufficient risk to warrant any investment inregional strategic management actions.

SOUTH EAST PEST MANAGEMENT PLAN – PART 2PEST RISK ASSESSMENT
25
4 RESULTS
For this assessment the South East region was divided into the following land uses, listedbelow according to the largest percentage of area occupied.
Grazing Native vegetation Cropping Forestry Aquatic Urban Irrigated crops and pastures Perennial horticulture
This section provides the results of pest plant and pest animal assessment by land usecategories. Within each land use sub-section, a description of its location and key pestplant and pest animal species are then discussed.

SOUTH EAST PEST MANAGEMENT PLAN – PART 2PEST RISK ASSESSMENT
26
4.1 GRAZING
4.1.1 Description
As the dominant land use in the South East region, dryland grazing comprisesapproximately 57% or 1,613,598 hectares of generally improved pastures. Primarily, stockincludes sheep and cattle, with a small number of specialist farms producing goats, deerand pigs. Pastures predominantly consist of grass species, clover and lucerne, dependanton soil type, rainfall, temperature and other variables. Some farms are intensivelymanaged, with high inputs and subsequent returns, while others are based on aminimalist approach. Variable environmental factors such as rainfall and soil type play asignificant role in the range and distribution of pest species across this land use.
4.1.2 AssumptionsPest PlantsThe assumption of this land use is that there is very little pest plant control conducted bylandowners. The main method of control is spray grazing using a broadleaf herbicidespray such as 2,4D amine/MCPA formulation to increase the sugar levels in the plant tomake them more palatable to stock. This reduces the volume of seed produced by theplant by reducing its ability to flower. This technique is commonly used for Salvation Janeand thistles.
Pest animalsPest animal control is conducted seasonally on an as needs basis. The main method ofcontrol is 1080 baiting for foxes conducted during lambing and 1080 poisoned oats forrabbits during late summer. Shooting is used as a control technique by some landholders.

SOUTH EAST PEST MANAGEMENT PLAN – PART 2PEST RISK ASSESSMENT
27
Figure 4.1 Map of grazing land use

SOUTH EAST PEST MANAGEMENT PLAN – PART 2PEST RISK ASSESSMENT
28
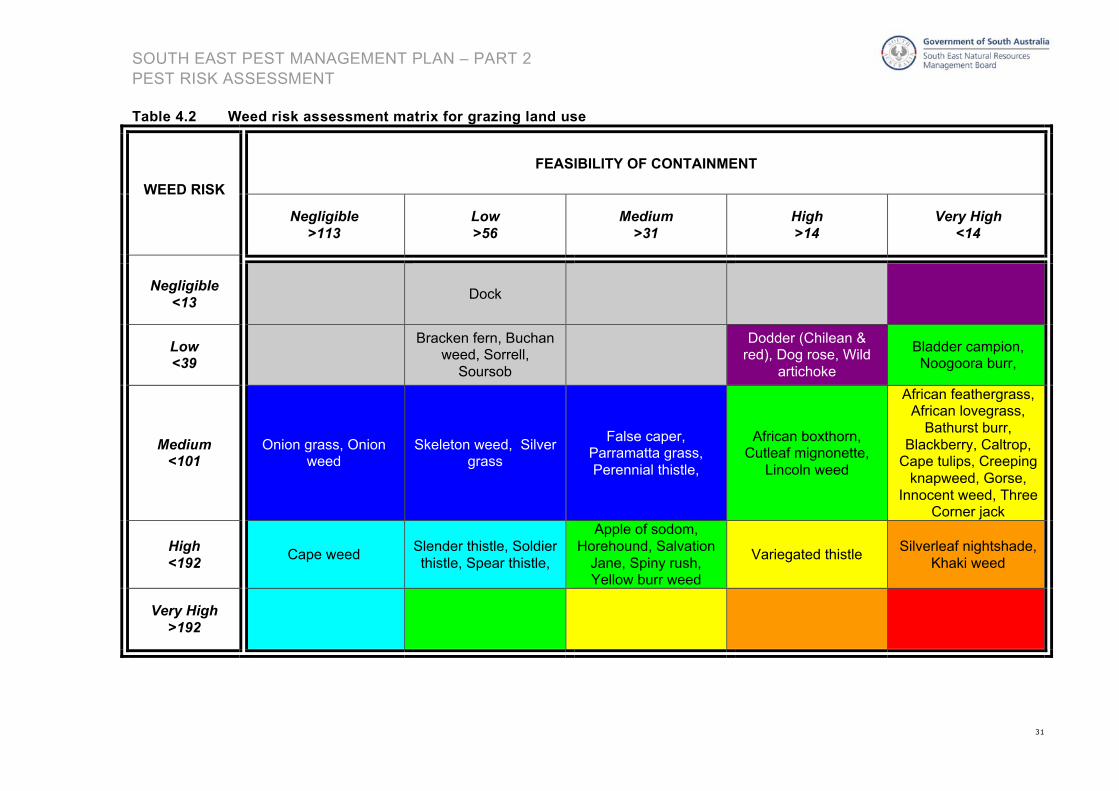
4.1.3 ResultsTables 4.1 and 4.2 show the results from the weed risk assessment of the grazing land use. Tables 4.3 and 4.4 show the results from thevertebrate pest risk assessment.
Table 4.1 Weed risk assessment results table for grazing land use
GrazingInvasiveness Impacts Potential
DistributionComparativeWeed Risk
CWR ControlCosts
CurrentDistribution
Persistence Feasibilityof
Containment
FOC
African boxthorn 6.7 3.2 2.0 42 Medium 5.3 1.3 4.5 30 HighAfricanfeathergrass 6.0 2.1 4.0 51 Medium 3.3 0.1 3.6 1 Very HighAfrican lovegrass 6.7 2.1 4.0 56 Medium 2.7 0.9 4.5 11 Very HighAfrican rue 5.3 2.6 2.0 28 Low 3.3 0.0 2.7 0 Very HighApple of sodom 6.7 4.2 4.0 112 High 4.7 1.7 5.5 42 MediumBathurst burr 6.0 3.7 2.0 44 Medium 2.7 0.1 6.4 1 Very HighBlackberry 7.3 5.3 2.0 77 Medium 4.7 0.4 5.5 11 Very HighBladder campion 7.3 2.1 1.0 15 Low 4.0 0.1 3.6 1 Very HighBracken fern 3.3 2.6 4.0 35 Low 4.7 3.3 5.5 85 LowBroadkernelespartillo 7.3 4.2 6.0 185 High 3.3 0.0 4.5 0 Very HighBroomrape 7.3 3.2 6.0 139 High 7.3 0.0 6.4 0 Very HighBuchan weed 4.0 2.1 4.0 34 Low 4.7 5.0 3.6 85 LowCalomba daisy 4.7 2.1 4.0 39 Medium 1.3 0.1 5.5 1 Very HighCaltrop 6.0 2.6 4.0 63 Medium 4.0 0.4 6.4 11 Very High
Cane needlegrass 7.3 4.2 8.0 247VeryHigh 3.3 0.0 4.5 0 Very High
Cape tulip - 1 leaf 6.7 4.2 2.0 56 Medium 4.0 0.1 6.4 2 Very HighCape tulip - 2 leaf 5.3 4.2 2.0 45 Medium 4.0 0.1 7.3 2 Very HighCapeweed 6.7 3.2 8.0 168 High 4.0 6.7 5.5 145 NegligibleChileanneedlegrass 7.3 6.8 8.0 401
VeryHigh 3.3 0.0 3.6 0 Very High
Coolatai grass 5.3 3.7 8.0 157 High 3.3 0.0 3.6 0 Very High

SOUTH EAST PEST MANAGEMENT PLAN – PART 2PEST RISK ASSESSMENT
29
Creeping knapweed 4.0 2.6 4.0 42 Medium 5.3 0.0 4.5 0 Very HighCutleaf mignonette 5.3 2.1 4.0 45 Medium 3.3 2.5 3.6 30 HighDock 4.0 1.6 2.0 13 Negligible 2.7 5.0 5.5 73 LowDodder (Chilean &red) 8.7 2.1 1.0 18 Low 5.3 0.4 7.3 16 HighDog rose 4.0 2.1 4.0 34 Low 4.0 3.3 1.8 24 HighFalse caper 6.0 2.6 4.0 63 Medium 4.0 1.3 6.4 32 MediumGorse/ Furze 6.0 4.7 2.0 57 Medium 4.0 0.1 4.5 2 Very HighHorehound 6.7 4.7 6.0 189 High 2.7 2.5 5.5 36 MediumInnocent weed 5.3 3.2 4.0 67 Medium 4.7 0.1 3.6 1 Very HighKhaki weed 6.0 4.7 4.0 114 High 4.7 0.1 4.5 2 Very HighLincoln weed 6.7 1.6 4.0 42 Medium 4.0 0.9 6.4 23 HighMexican feathergrass 8.7 4.7 8.0 328 Very High 5.3 0.1 6.4 3 Very HighNoogoora burrcomplex 5.3 2.6 2.0 28 Low 2.7 0.1 6.4 1 Very HighOnion grass 6.0 1.6 6.0 57 Medium 4.7 3.3 7.3 113 NegligibleOnion weed 6.0 1.6 6.0 57 Medium 4.7 3.3 7.3 113 NegligibleParramatta grass 7.3 2.1 4.0 62 Medium 4.0 2.5 5.5 55 MediumPerennial thistle 7.3 2.1 4.0 62 Medium 4.0 2.5 5.5 55 MediumPlumerillo 7.3 2.1 4.0 62 Medium 4.0 2.5 5.5 55 MediumPrickly acacia 7.3 2.1 4.0 62 Medium 4.0 2.5 5.5 55 MediumRagwort 7.3 2.1 4.0 62 Medium 4.0 2.5 5.5 55 MediumSalvation Jane 5.3 4.7 8.0 202 Very High 3.3 2.5 5.5 45 MediumSerrated tussock 8.0 5.3 10.0 421 Very High 5.3 0.0 4.5 0 Very HighSilver grass 6.7 1.6 8.0 84 Medium 4.7 5.0 4.5 106 LowSkeleton weed 7.3 1.6 4.0 46 Medium 5.3 1.7 7.3 65 LowSlender thistle 4.7 3.2 8.0 118 High 3.3 5.0 4.5 76 LowSilverleaf nightshade 6.7 3.2 6.0 126 High 5.3 0.1 6.4 3 Very HighSoldier thistle 5.3 3.7 6.0 118 High 3.3 5.0 4.5 76 LowSorrell 3.3 2.1 4.0 28 Low 3.3 6.7 4.5 101 Low

SOUTH EAST PEST MANAGEMENT PLAN – PART 2PEST RISK ASSESSMENT
30
Soursob 4.0 1.1 4.0 17 Low 2.7 3.3 7.3 65 LowSpear thistle 4.0 3.2 8.0 101 High 3.3 5.0 4.5 76 LowSpiny rush 6.7 4.7 4.0 126 High 6.0 1.7 4.5 45 MediumTexas needlegrass 6.7 3.7 4.0 98 Medium 2.7 0.0 5.5 0 Very HighThree cornered jack 6.7 3.7 4.0 98 Medium 2.7 0.1 5.5 1 Very HighVariegated thistle 5.3 3.7 6.0 118 High 2.0 2.5 4.5 23 HighWater dropwort 5.3 4.7 6.0 152 High 3.3 1.3 5.5 23 HighWild artichoke 3.3 3.2 2.0 21 Low 5.3 0.9 5.5 27 HighYellow burrweed 5.3 4.7 6.0 152 High 3.3 2.1 5.5 38 Medium
SOUTH EAST PEST MANAGEMENT PLAN – PART 2PEST RISK ASSESSMENT
31
Table 4.2 Weed risk assessment matrix for grazing land use
FEASIBILITY OF CONTAINMENT
WEED RISK
Negligible>113
Low>56
Medium>31
High>14
Very High<14
Negligible<13 Dock
Low<39
Bracken fern, Buchanweed, Sorrell,
Soursob
Dodder (Chilean &red), Dog rose, Wild
artichoke
Bladder campion,Noogoora burr,
Medium<101
Onion grass, Onionweed
Skeleton weed, Silvergrass
False caper,Parramatta grass,Perennial thistle,
African boxthorn,Cutleaf mignonette,
Lincoln weed
African feathergrass,African lovegrass,
Bathurst burr,Blackberry, Caltrop,
Cape tulips, Creepingknapweed, Gorse,
Innocent weed, ThreeCorner jack
High<192 Cape weed Slender thistle, Soldier
thistle, Spear thistle,
Apple of sodom,Horehound, Salvation
Jane, Spiny rush,Yellow burr weed
Variegated thistle Silverleaf nightshade,Khaki weed
Very High>192

SOUTH EAST PEST MANAGEMENT PLAN – PART 2PEST RISK ASSESSMENT
32
Table 4.3 Vertebrate pest risk assessment results for grazing land use
GRAZINGInvasiveness Impacts Potential
DistributionComparative
Pest RiskCWR Control
CostsCurrent
DistributionPersistence Feasibility
ofContainment
FOC
European rabbit 9.1 4.8 10.0 436 Very High 5.9 6.7 5.0 196 NegligibleRed fox 7.3 6.0 10.0 436 Very High 6.7 10.0 7.3 485 NegligibleGoat 7.3 4.0 10.0 291 Very High 5.3 1.7 2.7 24 HighEuropean hare 4.5 2.0 6.0 55 Medium 8.0 5.0 8.2 327 NegligibleDingo, Wild dog 5.5 6.0 10.0 327 Very High 4.7 0.9 2.7 11 Very HighHog deer 6.4 3.2 8.0 163 Very High 7.3 0.8 2.7 17 HighRed & Wapiti deer 6.4 3.6 10.0 229 Very High 6.0 3.3 3.6 73 LowRusa, Chital &Sambar deer 6.4 3.6 10.0 229 Very High 6.0 1.3 2.7 20 HighFallow deer 6.4 3.6 10.0 229 Very High 6.0 3.3 3.6 73 Low

SOUTH EAST PEST MANAGEMENT PLAN – PART 2PEST RISK ASSESSMENT
33
Table 4.4 Vertebrate pest risk assessment matrix for grazing land use
FEASIBILITY OF CONTAINMENTCOMPARATIVE PESTRISK Negligible
>111Low
111-55Medium
31-54High13-30
Very High<13
Negligible<11
Low11-34
Medium35-88 HARE
High89-168
Very High>168 RABBIT, FOX FALLOW, RED &
WAPITI DEER
GOAT, HOG DEER,RUSA, SAMBAR &
CHITAL DEERWILD DOG / DINGO
4.1.4 Summary - GrazingPest PlantsFrom this assessment it is seen in table 4.2 that Silverleaf nightshade and Khaki weed are ranked in the Destroy Infestations category. As aresult the regional management actions will aim to significantly reduce the extent of these weeds.
It was found that a large number of weeds were feasible to contain the spread at the regional scale. Some of these weeds included Africanfeathergrass, Bathurst burr, Blackberry, Caltrop, Cape tulip, Creeping knapweed, Gorse, Innocent weed and Three corner jack.
Pest AnimalsAccording to table 4.3 populations of Wild dog/Dingo have been identified as being able to be eradicated from the region, while Goat, Hogdeer, Sambar, Rusa and Chital deer have management actions targeted at reducing their populations and limiting their spread throughoutthe region.

SOUTH EAST PEST MANAGEMENT PLAN – PART 2PEST RISK ASSESSMENT
34
4.2 NATIVE VEGETATION
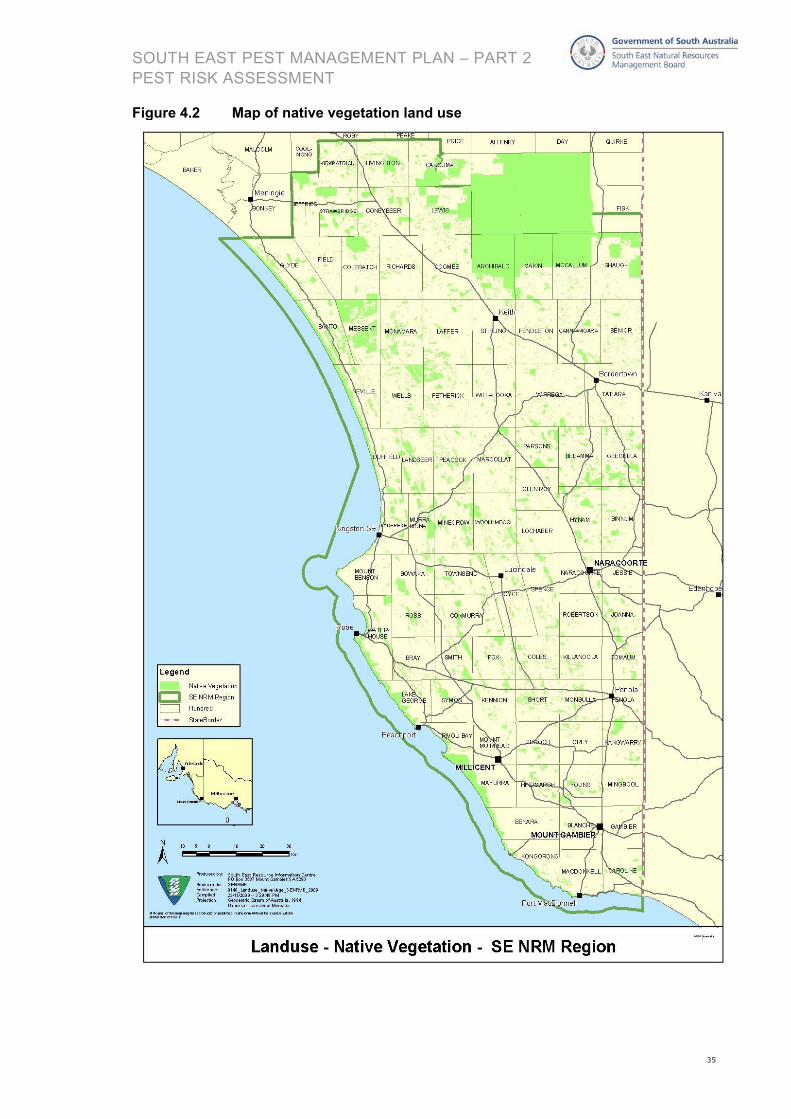
4.2.1 DescriptionWhile almost 20% or 554,762 hectares of the South East region is comprised of nativevegetation, this represents only 13% of the original vegetation in the area prior toEuropean settlement. Large parcels of this land use are publicly owned, including crownlands, national parks or local government owned. There are a range of differentecosystems across the region dependant on soil type, topography, rainfall and nutrientavailability. These include coastal heath, mallee scrub, grassy woodlands and wetlandenvironments. There is some overlap between the native vegetation land use and aquaticland use, especially in coastal conservation zones such as Canunda National Park.
Pest plants invading bushland are difficult to control due to poor accessibility toinfestations and limited resources for control. Many of the pest plants in native vegetationare garden escapees such as Dolichos pea and Bridal creeper. These plants impact onthe native vegetation by smothering plants and competing for water, nutrients andsunlight, thus reducing the ability of the native plants to survive and reproduce.
There is a significant risk associated with pest plants in native vegetation, particularly thesevere impact that can be seen as a result of competition. Management of nativevegetation in the South East is limited by availability of public and private expertise andthe lack of return on investment in pure dollar terms. As yet, a suitable method ofcalculating the financial returns of environmental works has not been adopted.
4.2.2 AssumptionsPest plantsIt is presumed that there is no continual routine pest plant control being conducted innative vegetation across the South East. Some species may be targeted for control dueto funding being available, such as the Western Cape bridal creeper. Alternatively pestplants may be controlled in areas of very high conservation value, i.e. to protectthreatened species.
The products and services obtained from the land use are conservation and recreationalvalues. Biological control is considered routine control for pest plants where it is available,such as Bridal creeper rust fungus.
Whilst Coastal wattle is indigenous to the coastal area of the South East region, itsincreasing range and dominance inland is of concern to native vegetation managers,hence it was included in the weed list. As a native plant, Coastal wattle is protected by theNative Vegetation Act 1991 in some situations and advice should be sought from theNative Vegetation Council before any clearance or control is undertaken.
Native plants from other states have also demonstrated their weed potential in the SouthEast. Of particular concern are Sallow wattle, Golden wreath wattle, Bluebell creeper andCoastal tea tree. Because these species are not indigenous to the region control may becarried out without legislative exemption.
Vertebrate PestsPest management is conducted through occasional use of 1080 poisoned baits for foxand rabbit control. Shooting is very rarely used as a control in National Parks. Biologicalcontrol for rabbits is present in the region but not an adequate control measure on its own.
SOUTH EAST PEST MANAGEMENT PLAN – PART 2PEST RISK ASSESSMENT
35
Figure 4.2 Map of native vegetation land use

SOUTH EAST PEST MANAGEMENT PLAN – PART 2PEST RISK ASSESSMENT
36
4.2.3 ResultsIn tables 4.5 and 4.6 the results are shown from the weed risk assessment for the native vegetation land use. Tables 4.7 and 4.8 show thevertebrate pest risk assessment results.
Table 4.5 Weed risk assessment results table for native vegetation land use
NativeVegetation
Invasiveness Impacts PotentialDistribution
ComparativeWeed Risk
CWR ControlCosts
CurrentDistribution
Persistence Feasibilityof
Containment
FOC
Acacia cyclops 7.3 3.2 8.0 185 High 6.0 2.1 4.5 57 LowAfrican boxthorn 5.3 5.3 4.0 112 High 5.3 1.3 5.5 36 MediumAfricanfeathergrass 6.0 2.1 4.0 51 Medium 3.3 0.1 3.6 1 Very HighAfricanlovegrass 6.7 2.1 4.0 56 Medium 2.7 0.9 4.5 11 Very HighAgave 3.3 2.1 0.5 4 Negligible 7.3 0.0 7.3 0 Very HighAleppo pine 6.0 5.3 6.0 189 High 5.3 0.9 4.5 22 HighApple of sodom 5.3 4.2 4.0 90 Medium 4.7 1.7 5.5 42 MediumArum lily 4.7 2.6 0.5 6 Negligible 5.3 0.1 6.4 3 Very HighAsparagus fern 7.3 3.7 6.0 162 High 5.3 0.1 7.3 3 Very HighAthel pine 4.7 1.6 1.0 7 Negligible 7.3 0.1 7.3 4 Very HighAzzarola 7.3 4.2 2.0 62 Medium 7.3 0.1 7.3 4 Very HighBamboo 3.3 3.2 2.0 21 Low 6.0 0.9 7.3 40 MediumBlackberry 7.3 4.2 4.0 124 High 6.0 0.9 5.5 30 HighBlackberrynightshade 4.0 2.1 1.0 8 Negligible 5.3 1.8 6.4 59 LowBlue periwinkle 5.3 3.7 4.0 79 Medium 6.0 0.9 7.3 40 MediumBlue psoralea 4.7 2.6 1.0 12 Negligible 5.3 0.1 6.4 3 Very HighBluebell creeper 8.0 5.3 2.0 84 Medium 8.7 0.1 9.1 7 Very HighBoneseed 8.7 3.2 4.0 109 High 6.0 0.9 5.5 30 HighBridal creeper 7.3 5.3 10.0 386 Very High 5.3 6.7 6.4 226 NegligibleBridal creeper(Western Cape) 7.3 5.3 6.0 232 Very High 6.0 0.4 7.3 18 High

SOUTH EAST PEST MANAGEMENT PLAN – PART 2PEST RISK ASSESSMENT
37
Bridal veil 7.3 5.3 6.0 232 Very High 6.0 0.1 7.3 4 Very HighBuckthorn 8.0 3.2 6.0 152 High 6.7 2.1 3.6 51 MediumBulbil watsonia 4.7 2.1 2.0 20 Low 6.7 1.7 3.6 40 MediumButterfly bush 4.7 2.1 1.0 10 Negligible 4.7 0.1 5.5 2 Very HighCane needlegrass 6.7 4.2 2.0 56 Medium 4.0 0.1 6.4 2 Very HighCape broom 4.7 2.6 2.0 25 Low 3.3 0.1 4.5 1 Very HighCape tulip - 1 leaf 6.7 4.2 2.0 56 Medium 6.0 2.1 5.5 68 LowCape tulip - 2 leaf 6.7 4.2 2.0 56 Medium 6.0 2.1 5.5 68 LowCarrot 7.3 2.6 2.0 39 Low 6.0 0.1 5.5 3 Very HighChilean needlegrass 5.3 1.6 2.0 17 Low 3.3 0.1 3.6 1 Very HighCoastal tea tree 7.3 3.7 4.0 108 High 6.0 2.1 2.7 34 MediumCoastal wattle 8.0 5.3 10.0 421 Very High 6.0 3.3 8.2 164 NegligibleCommon lantana 8.0 5.3 10.0 421 Very High 6.0 3.3 8.2 164 NegligibleCoolatai grass 5.3 1.6 4.0 34 Low 3.3 0.1 3.6 1 Very HighCootamundra wattle 4.0 3.2 2.0 25 Low 4.7 0.1 6.4 2 Very HighCotoneaster 8.0 3.2 6.0 152 High 6.7 0.9 6.4 39 MediumDesert ash 7.3 3.7 6.0 162 High 6.0 2.1 5.5 68 LowDodder (Chilean &red) 6.0 1.6 4.0 38 Low 4.7 0.9 5.5 23 HighDog rose 6.0 2.6 4.0 63 Medium 4.0 1.3 6.4 32 MediumDolichos pea 7.3 5.8 2.0 85 Medium 6.0 0.1 7.3 4 Very HighEnglish broom 5.3 5.8 1.0 31 Low 5.3 0.1 6.4 3 Very HighEnglish oak 4.0 2.6 1.0 11 Negligible 5.3 0.1 6.4 3 Very HighErica* 6.0 3.7 4.0 88 Medium 6.7 0.1 6.4 4 Very HighFalse caper 5.3 1.6 6.0 51 Medium 6.0 3.3 4.5 91 LowFountain grass 8.0 2.6 6.0 126 High 6.0 0.1 4.5 2 Very HighFreesia 5.3 2.1 4.0 45 Medium 8.7 2.1 6.4 115 NegligibleGazania sp. 6.7 2.6 4.0 70 Medium 3.3 1.8 4.5 27 HighGolden wreathwattle 6.7 3.2 6.0 126 High 6.7 2.5 7.3 121 NegligibleGorse/ Furze 4.7 5.8 2.0 54 Medium 6.7 0.1 6.4 4 Very High

SOUTH EAST PEST MANAGEMENT PLAN – PART 2PEST RISK ASSESSMENT
38
Horehound 4.7 1.6 4.0 29 Low 6.0 2.5 6.4 95 LowIvy (Cape & English) 3.3 4.2 1.0 14 Low 5.3 0.1 6.4 3 Very HighMarguerite daisy 2.0 1.6 4.0 13 Negligible 6.7 0.1 8.2 5 Very HighMarram grass 8.0 2.6 2.0 42 Medium 8.0 3.3 8.2 218 NegligibleMay/ Hawthorn 3.3 4.7 2.0 32 Low 5.3 0.9 5.5 27 HighMexicanfeathergrass 8.7 4.7 8.0 328 Very High 5.3 0.1 6.4 3 Very HighOlive 6.0 3.7 8.0 177 High 7.3 0.9 6.4 43 MediumPampas grass 6.7 4.7 6.0 189 High 4.7 0.1 8.2 3 Very HighPepper tree 2.7 2.6 2.0 14 Low 4.7 1.8 6.4 52 MediumPhalaris 6.0 4.2 4.0 101 High 6.7 5.0 6.4 212 NegligiblePin cushion daisy 6.0 4.2 4.0 101 High 6.7 5.0 6.4 212 NegligiblePolygala 6.7 4.2 4.0 112 High 6.7 0.9 5.5 33 MediumPoplars spp. 4.7 4.2 4.0 79 Medium 6.7 2.1 6.4 88 LowPrickly pear 5.3 4.7 1.0 25 Low 6.0 0.9 3.6 20 HighPyp grass 6.7 4.7 6.0 189 High 6.0 5.0 3.6 109 LowRadiata pine 6.7 4.7 4.0 126 High 6.0 0.9 3.6 20 HighRhus tree 4.0 5.8 4.0 93 Medium 6.0 0.1 3.6 2 Very HighSallow wattle 8.0 5.3 10.0 421 Very High 5.3 2.5 4.5 61 LowSea spurge 4.0 2.6 2.0 21 Low 6.7 0.4 5.5 15 HighSea wheatgrass 4.7 4.2 2.0 39 Medium 6.7 0.4 5.5 15 HighSerrated tussock 8.0 2.6 6.0 126 High 5.3 0.0 4.5 0 Very HighShiny leaf coprosma 6.0 3.2 2.0 38 Low 6.7 0.1 5.5 3 Very HighSkeleton weed 7.3 1.6 6.0 69 Medium 6.7 1.7 7.3 81 LowSlender thistle 7.3 1.6 4.0 46 Medium 5.3 1.7 7.3 65 LowSouth African weedorchid 6.7 1.1 8.0 56 Medium 8.0 3.3 4.5 121 NegligibleSpiny rush 6.0 3.2 4.0 76 Medium 5.3 1.3 5.5 36 MediumSweet briar 6.0 2.6 4.0 63 Medium 4.7 2.1 4.5 44 MediumSweet pittosporum 4.7 3.2 4.0 59 Medium 4.7 2.1 5.5 53 MediumTagasaste 5.3 3.7 4.0 79 Medium 4.7 2.5 6.4 74 LowTall wheatgrass 6.0 5.8 4.0 139 High 6.7 5.0 6.4 212 Negligible

SOUTH EAST PEST MANAGEMENT PLAN – PART 2PEST RISK ASSESSMENT
39
Texas needlegrass 5.3 3.7 4.0 79 Medium 5.3 0.0 8.2 0 Very HighVeldt grass 7.3 4.2 4.0 124 High 6.7 5.0 6.4 212 NegligibleWandering jew 4.0 2.6 0.5 5 Negligible 5.3 0.1 6.4 3 Very HighWeeping whitebroom 8.0 3.7 6.0 177 High 4.7 0.1 7.3 3 Very HighWhite arctotis 5.3 2.1 2.0 22 Low 6.0 2.1 5.5 68 LowWild artichoke 3.3 3.2 2.0 21 Low 5.3 0.9 5.5 27 HighWild oats 4.7 2.6 8.0 98 Medium 8.0 8.3 3.6 242 NegligibleWilliams grass 4.7 2.6 8.0 98 Medium 8.0 8.3 3.6 242 NegligibleYellow burrweed 5.3 4.2 1.0 22 Low 3.3 0.9 5.5 17 High

SOUTH EAST PEST MANAGEMENT PLAN – PART 2PEST RISK ASSESSMENT
40
Table 4.6 Weed risk assessment matrix for native vegetation land use
FEASIBILITY OF CONTAINMENTWEED RISK
Negligible>113
Low>56
Medium>31
High>14
Very High<14
Negligible<13
Blackberrynightshade
Agave, Athel pine,Marguerite daisy,Wandering jew,
Arum lily, Englishoak, Butterfly bush
Low<39
Horehound, Whitearctotis
Bamboo, Bulbilwatsonia, Pepper
tree
Dodder (Chilean &red), Hawthorn,
Prickly pear, Wildartichoke, Yellowburr weed, Sea
spurge
Cape broom, Wildcarrot, Cootamundra
wattle, Englishbroom, Erica, Shinyleaf coprosma, Ivy,
Blue psoralea
Medium<101
Freesia, Marramgrass, South Africanweed orchid, Wildoats, William grass
Cape tulip 1 & 2 leaf,False caper,
Poplars, Skeletonweed, Slender
thistle, Tagasaste
Apple of Sodom,Blue periwinkle, Dog
rose, Spiny rush,Sweet briar, Sweet
pittosporum
Gazania, SeaWheatgrass
African lovegrass,African feathergrass,
Bluebell creeper,Dolichos pea, Erica,
Gorse, Rhus tree
High<192
Golden wreathwattle, Phalaris, Pincushion daisy, Tallwheatgrass, Veldt
grass
Acacia cyclops,Desert ash, Pyp
grass
African boxthorn,Buckthorn, Coastal
tea tree,Cotoneaster, Olive,
Polygala
Aleppo pine,Blackberry,
Boneseed, Radiatapine
Asparagus fern,Fountain grass,Pampas grass,White weeping
broom
Very High>192
Bridal creeper,Coastal wattle,
Marguerite daisySallow wattle Western cape bridal
creeper Bridal veil

SOUTH EAST PEST MANAGEMENT PLAN – PART 2PEST RISK ASSESSMENT
41
Table 4.7 Vertebrate pest risk assessment results table for native vegetation land useNATIVE
VEGETATION
Invasiveness Impacts PotentialDistribution
ComparativePest Risk
CWR ControlCosts
CurrentDistribution
Persistence Feasibilityof
Containment
FOC
European rabbit 10.0 5.2 8.0 416 Very High 7.1 5.0 6.3 221 NegligibleRed fox 7.3 6.0 10.0 436 Very High 6.7 10.0 7.3 485 NegligibleGoat 8.2 4.8 8.0 314 Very High 6.7 1.3 3.6 30 HighCat 8.2 5.6 10.0 458 Very High 9.3 10.0 7.3 679 NegligibleEuropean hare 4.5 2.0 6.0 55 Medium 8.7 8.3 6.4 460 NegligibleHouse mouse 7.3 2.8 10.0 204 Very High 9.3 10.0 9.1 848 NegligibleBlack rat 7.3 4.0 10.0 291 Very High 8.7 8.3 8.2 591 NegligibleWild Dog/ Dingo 6.4 6.0 4.0 153 High 6.7 0.0 3.6 0 Very HighHog deer 7.3 4.0 1.0 29 Low 8.0 0.9 5.5 40 MediumRed & Wapitideer 7.3 4.8 8.0 279 Very High 8.0 4.2 7.3 242 NegligibleSambar, Chital &Rusa Deer 7.3 4.8 8.0 279 Very High 8.0 2.5 7.3 145 NegligibleFallow deer 7.3 4.8 10.0 349 Very High 8.0 6.7 7.3 388 NegligibleCommon starling 6.4 3.2 8.0 163 Very High 8.7 8.3 9.1 657 NegligibleEurasianblackbird 6.4 1.2 6.0 46 Medium 7.3 8.3 9.1 556 NegligibleMallard 9.1 1.2 0.5 5 Negligible 6.7 0.9 9.1 56 Low

SOUTH EAST PEST MANAGEMENT PLAN – PART 2PEST RISK ASSESSMENT
42
Table 4.8 Vertebrate pest risk assessment matrix for native vegetation land use
FEASIBILITY OF CONTAINMENTCOMPARATIVE PEST
RISK Negligible>111
Low111-55
Medium31-54
High13-30
Very High<13
Negligible<11 MALLARD
Low11-34 HOG DEER
Medium35-88
HAREBLACKBIRD
High89-168 WILD DOG/ DINGO
Very High>168
STARLINGRUSA, CHITAL,SAMBAR RED &
WAPITI DEER, CATFOX, BLACK RAT,FALLOW DEER,RABBIT, MOUSE
GOAT

SOUTH EAST PEST MANAGEMENT PLAN – PART 2PEST RISK ASSESSMENT
43
4.2.4 Summary – Native VegetationPest plantsBridal veil assessed in native vegetation land use resulted as a very high weed risk andhigh feasibility of containment, thus the management action is to eradicate this speciesfrom the region.
Western Cape bridal creeper resulted in a very high weed risk and a high feasibility tocontrol, in comparison, the common form of Bridal creeper had a very high riskassessment but the feasibility to control the weed was negligible. Therefore themanagement actions for both differ greatly. For common Bridal creeper efforts are to bedirected in reducing the overall environmental impact it has through targeted managementwhich includes the use of biological control.
Vertebrate PestsDue to the inaccessibility of potential wild populations of pest animals the feasibility ofcontrol is reduced, thus the management actions of some pest animals are different toother land uses. In table 4.7 the management action for Goats in native vegetation isassessed as Destroy Populations, which requires dramatically reducing the populationsand limiting their spread to their areas.
Dingoes are widely accepted as having been on the Australian mainland for some 4000-5000 years. During this time, they assumed the role of the top-order mammalian predator,with both the Thylacine and Tasmanian devil becoming extinct after arrival of the Dingo.While some people consider the Dingo to be an alien species, there is greater scientificevidence emerging as to its likely benefit in helping maintain ecosystem balance in thepresence of other threats - namely other more recently introduced predators such asfoxes and cats. The evidence suggests that Dingoes actively maintain large home ranges,within which foxes and cats are either suppressed in density or even excluded. As theDingo does not hunt as efficiently as the predators that it suppresses, a wide range ofnative small terrestrial vertebrates are actually found to be better represented in theirpresence, than from areas where the Dingo is absent. In this way, the decline of some ofAustralia's small mammals may be connected with the decline of the Dingo across a largepart of the continent. While the Dingo (or wild dogs) are still considered by many people tobe a pest, particularly from an agricultural point of view, the evidence does not supportthem being considered one in the environmental land use.
The efforts in controlling Dingoes according to the risk assessment should be aimed atpreventing the ongoing spread of these species in the region, although in a regionalcontext these species will be aimed at eradication due to their low populations.

SOUTH EAST PEST MANAGEMENT PLAN – PART 2PEST RISK ASSESSMENT
44
4.3 CROPPING
4.3.1 DescriptionPredominant in the Upper South East, surrounding Bordertown and Coonalpyn, drylandcropping is a lucrative industry that produces an annual income of approximately $122million per year. Occupying around 11% or 305,867 hectares, there is clear delineationbetween the rainfall and temperature bands of the upper and lower areas of the region. Inthe north, wheat, barley, canola and oats are featured, while the southern area is thecentre for the production of beans, peas and lupins. The range and distribution of pestspecies in cropping country is also severely affected by temperature and rainfall as well asthe variety of crop species in production.
Crop species with higher water needs, such as lucerne are generally found under irrigatedcrops and pasture.
4.3.2 AssumptionsPest plantsThe majority of the pest plants of concern within a cropping situation are those that cannotbe controlled through everyday weed management practices. Assumed management forcereals include pre-sowing cultivation or knockdown herbicides, pre-emergent sprayed atsowing for grasses and broadleaf weeds and one post-emergent broadleaf spray.Assumed management for pulse crops are same as above, but the post-emergent sprayis for grasses rather than for broadleaf weeds.
Vertebrate PestsThe majority of pests of concern within a cropping situation are herbivores. There is verylittle pest management undertaken within this land use. Some 1080 poisoned oats baitingmay occur for rabbits in the late summer to lower numbers before the next crop is planted.

SOUTH EAST PEST MANAGEMENT PLAN – PART 2PEST RISK ASSESSMENT
45
Figure 4.3 Map of cropping land use

SOUTH EAST PEST MANAGEMENT PLAN – PART 2PEST RISK ASSESSMENT
46
4.3.3 ResultsIn tables 4.9 and 4.10 the weed risk assessment results are shown for the cropping land use. In tables 4.11 and 4.12 the results from thevertebrate pest risk assessment are shown.
Table 4.9 Weed risk assessment results table for cropping land useCrop-Pasture
Rotation
Invasiveness Impacts PotentialDistribution
ComparativeWeed Risk
CWR ControlCosts
CurrentDistribution
Persistence Feasibilityof
Containment
FOC
Alkali sida 6.0 3.2 1.0 19 Low 2.7 0.0 6.4 0 Very HighAnnual ryegrass 6.7 2.1 8.0 112 High 4.7 8.3 5.5 212 NegligibleApple of sodom 4.0 3.7 4.0 59 Medium 4.0 2.1 4.5 38 MediumBathurst burr 6.0 3.2 4.0 76 Medium 2.7 0.9 6.4 16 HighBedstraw 5.3 2.6 1.0 14 Low 4.0 0.1 3.6 1 Very HighBifora 5.3 2.6 1.0 14 Low 4.0 0.1 3.6 1 Very HighBladder campion 5.3 2.6 1.0 14 Low 4.0 0.1 3.6 1 Very HighBlue mustard 5.3 2.6 1.0 14 Low 4.0 0.1 3.6 1 Very HighBroomrape 7.3 2.6 4.0 77 Medium 4.0 0.0 6.4 0 Very HighBuchan weed 6.0 2.6 1.0 16 Low 4.7 2.5 5.5 64 LowCalomba daisy 6.0 2.6 4.0 63 Medium 4.0 0.4 6.4 11 Very HighCaltrop 6.0 2.6 6.0 95 Medium 4.0 0.4 6.4 11 Very HighCapeweed 6.7 1.6 2.0 21 Low 3.3 3.3 3.6 40 MediumCouch 8.0 2.6 6.0 126 High 4.0 3.3 6.4 85 LowCreepingknapweed 3.3 3.7 6.0 74 Medium 5.3 0.1 4.5 2 Very HighCutleafmignonette 5.3 2.1 4.0 45 Medium 3.3 2.1 3.6 25 HighDock 8.0 2.6 4.0 84 Medium 4.0 3.3 5.5 73 LowField bindweed 6.7 1.6 4.0 42 Medium 0.0 3.3 3.3 30 HighField garlic 4.7 1.6 2.0 15 Low 0.0 3.3 0.1 0 Very HighFleabane 6.0 2.1 6.0 76 Medium 4.7 5.0 7.3 170 NegligibleHoary cress 5.3 2.1 6.0 67 Medium 2.7 0.8 5.5 12 Very HighHorehound 6.0 3.2 10.0 189 High 2.0 5.0 4.5 45 Medium

SOUTH EAST PEST MANAGEMENT PLAN – PART 2PEST RISK ASSESSMENT
47
Innocent weed 6.7 2.1 8.0 112 High 3.3 0.4 5.5 8 Very HighLesserloosestrife 4.0 3.2 4.0 51 Medium 4.7 0.0 3.6 0 Very HighLincoln weed 6.7 1.6 4.0 42 Medium 4.0 0.9 6.4 23 HighMuskweed 6.0 2.6 1.0 16 Low 1.3 0.4 2.7 2 Very HighNightstock 4.7 1.1 1.0 5 Negligible 2.7 0.1 2.7 1 Very HighPheasant's eye 3.3 2.6 2.0 18 Low 4.0 0.1 4.5 2 Very HighSalvation Jane 4.7 2.6 10.0 123 High 2.7 6.7 3.6 65 LowSkeleton weed 8.0 1.6 6.0 76 Medium 5.3 1.7 7.3 65 LowSilverleafnightshade 8.7 2.1 6.0 109 High 6.0 0.4 7.3 18 HighSoursob 5.3 1.1 8.0 45 Medium 2.7 3.3 7.3 65 LowTall wheatgrass 6.0 5.8 4.0 139 High 6.7 5.0 6.4 212 NegligibleThree-hornedbedstraw 4.7 2.6 4.0 49 Medium 2.7 0.1 4.5 1 Very HighVariegatedthistle 4.0 3.2 2.0 25 Low 2.7 0.9 4.5 11 Very HighWild oats 7.3 3.2 8.0 185 High 2.0 8.3 3.6 61 LowWild radish 5.3 2.6 8.0 112 High 2.7 8.3 5.5 121 NegligibleYellow burrweed 5.3 4.7 6.0 152 High 3.3 5.0 5.5 91 Low

SOUTH EAST PEST MANAGEMENT PLAN – PART 2PEST RISK ASSESSMENT
48
Table 4.10 Weed risk assessment matrix for cropping land use
FEASIBILITY OF CONTAINMENT
WEED RISK
Negligible>113
Low>56
Medium>31
High>14
Very High<14
Negligible<13
Low<39 Buchan weed Capeweed
Bedstraw, Bladdercampion, Field
garlic, Variegatedthistle
Medium<101 Fleabane Dock, Skeleton
weed, Soursob Apple of sodom
Bathurst burr,Cutleaf mignonette,
Field bindweed,Lincoln weed
Caltrop, Creepingknapweed, Hoary
cress, Three hornedbedstraw
High<192
Annual ryegrass,Tall wheatgrass,
Wild radish
Couch, SalvationJane, Wild oats,
Yellow burr weedHorehound Silverleaf nightshade Innocent weed
Very High>192

SOUTH EAST PEST MANAGEMENT PLAN – PART 2PEST RISK ASSESSMENT
49
Table 4.11 Vertebrate pest risk assessment results table for cropping land use
CROPPINGInvasiveness Impacts Potential
DistributionComparative
Pest RiskCWR Control
CostsCurrent
DistributionPersistence Feasibility of
ContainmentFOC
European rabbit 10.0 3.2 10.0 320VeryHigh 3.5 2.5 5.0 44 Medium
Goat 7.3 3.2 7.3 186VeryHigh 2.0 0.9 2.7 5
VeryHigh
European hare 4.5 0.8 4.5 36 Medium 5.3 2.5 6.4 85 Low
House mouse 6.4 6.0 6.4 382VeryHigh 6.0 2.1 8.2 102 Low
Black rat 6.4 4.0 6.4 204VeryHigh 6.7 1.8 7.3 85 Low
Hog deer 6.4 2.0 6.4 51 Medium 2.7 0.9 3.6 8VeryHigh
Wapiti & Reddeer 6.4 2.8 6.4 143 High 2.7 0.9 3.6 9
VeryHigh
Rusa, Chital &Sambar deer 6.4 2.8 6.4 143 High 2.7 0.9 3.6 9
VeryHigh
Fallow deer 6.4 2.8 6.4 143 High 2.7 2.1 3.6 20 High

SOUTH EAST PEST MANAGEMENT PLAN – PART 2PEST RISK ASSESSMENT
50
Table 4.12 Vertebrate pest risk assessment matrix for cropping land use
FEASIBILITY OF CONTAINMENTCOMPARATIVEPEST RISK Negligible
>111Low
111-55Medium
31-54High13-30
Very High<13
Negligible<11
Low11-34
Medium35-88 HARE HOG DEER
High89-168 FALLOW DEER
RED, WAPITI, RUSA,SAMBAR & CHITAL
DEER
Very High>168 MOUSE BLACK RAT RABBIT GOAT
4.3.4 Summary - CroppingPest plantsFor the cropping land use the management action for Innocent weed populations is targeted destruction and local eradication where feasibleas the assessment recognised the very high risk and high feasibility for containment of this species.Caltrop, Hoary cress, Three horned bedstraw, Silverleaf nightshade and Yellow burr weed are all categorised as Contain Spread, which aimsto prevent the ongoing spread of the weed species in the management area through surveillance and mapping to locate all infestedproperties, control of all infestations and aiming for a significant reduction in weed density.
Vertebrate pestsFor the cropping land use Red, Wapiti, Chital, Rusa and Sambar deer populations are to be targeted for destruction and local eradicationwhere feasible, as the assessment has recognised that they pose a very high risk and still have a high feasibility for containment. However,Fallow and Hog deer are targeted for the control of all populations, aiming for a significant reduction in pest animal density through high-levelinitial control and sustained management. This is the same management action for Rabbits.

SOUTH EAST PEST MANAGEMENT PLAN – PART 2PEST RISK ASSESSMENT
51
4.4 FORESTRY
4.4.1 DescriptionForestry is an industry that supports extensive employment in the region, and is currentlyundergoing significant changes in species and management. Softwood plantations(Radiata pine) have dominated the landscape in the Lower South East for many decades;however there has been recent and rapid expansion of hardwood plantations(predominantly Tasmanian Blue Gums). In 2008, forestry comprised 5% or 144,108hectares in the higher rainfall areas south of Kingston and Lucindale.
4.4.2 AssumptionsPest plantsThe main pest plant control effort (herbicides) is at pre-planting when the weeds competewith young seedlings for space and nutrients. Pest plant control is generally only carriedout within the first two years after establishment. Greater canopy cover of mature treesusually reduces weed infestations within plantations. Plantations are sometimes grazed.
Vertebrate pestsThe main control effort is at pre-planting when the young seedlings are susceptible tograzing by herbivores. Access to sites for pest control is only possible within the first twoyears. Some 1080 fox baiting occurs in plantations where livestock are grazed once treeshave established.

SOUTH EAST PEST MANAGEMENT PLAN – PART 2PEST RISK ASSESSMENT
52
Figure 4.4 Map of forestry land use

SOUTH EAST PEST MANAGEMENT PLAN – PART 2PEST RISK ASSESSMENT
53
4.4.3 ResultsIn tables 4.13 and 4.14 the results of the weed risk assessment are shown for the forestry land use. Tables 4.15 and 4.16 show the results ofthe vertebrate pest risk assessment.Table 4.13 Weed risk assessment results table for forestry land use
ForestryInvasiveness Impacts Potential
DistributionComparativeWeed Risk
CWR ControlCosts
CurrentDistribution
Persistence Feasibilityof
Containment
FOC
African boxthorn 4.0 3.2 2.0 25 Low 5.3 1.3 4.5 30 HighAfricanfeathergrass 3.3 2.1 1.0 7 Negligible 3.3 0.1 5.5 2 Very HighBathurst burr 6.0 3.7 2.0 44 Medium 2.7 0.1 6.4 1 Very HighBlackberry 7.3 2.6 6.0 116 High 4.7 0.4 6.4 12 Very HighBlue mustard 5.3 1.1 1.0 6 Negligible 4.0 0.1 3.6 1 Very HighBluebell creeper 6.0 2.1 8.0 101 High 3.3 1.3 8.2 34 MediumBoneseed 7.3 1.1 6.0 46 Medium 2.7 0.4 4.5 5 Very HighBracken fern 6.7 3.2 6.0 126 High 2.7 5.0 6.4 85 LowBridal creeper 7.3 5.3 10.0 386 Very High 5.3 6.7 6.4 226 NegligibleBridal veil 7.3 5.3 6.0 232 Very High 6.0 0.1 7.3 4 Very HighCape broom 4.7 2.6 2.0 25 Low 3.3 0.1 4.5 1 Very HighCouch 6.7 2.6 6.0 105 High 4.0 2.1 6.4 53 MediumDock 4.0 0.5 6.0 13 Negligible 2.7 2.1 5.5 30 HighFleabane 3.3 1.6 6.0 32 Low 3.3 6.7 5.5 121 NegligibleGorse/ Furze 5.3 2.6 4.0 56 Medium 4.0 0.1 6.4 2 Very HighInnocent weed 6.7 2.1 4.0 56 Medium 3.3 0.4 5.5 8 Very HighKikuyu 6.0 2.6 6.0 95 Medium 3.3 1.8 7.3 42 MediumPampas grass 4.0 2.6 6.0 63 Medium 3.3 0.1 5.5 2 Very HighPhalaris 5.3 4.2 6.0 135 High 3.3 6.7 7.3 162 NegligibleSallow wattle 8.0 5.3 10.0 421 Very High 5.3 2.5 4.5 61 LowSouth Africanweed orchid 6.0 1.1 4.0 25 Low 7.3 0.9 7.3 49 MediumWireweed 4.0 2.1 6.0 51 Medium 3.3 5.0 4.5 76 Low

SOUTH EAST PEST MANAGEMENT PLAN – PART 2PEST RISK ASSESSMENT
54
Table 4.14 Weed risk assessment matrix for forestry land use
FEASIBILITY OF CONTAINMENT
WEED RISK
Negligible>113
Low>56
Medium>31
High>14
Very High<14
Negligible<13 Dock African feathergrass
Low<39 Fleabane South African weed
orchid African boxthorn Cape broom
Medium<101 Wireweed Kikuyu
Bathurst burr,Boneseed, Gorse,
Innocent weed,Pampas grass
High<192 Phalaris Bracken fern Bluebell creeper,
Couch Blackberry
Very High>192 Bridal creeper Sallow wattle Bridal veil

SOUTH EAST PEST MANAGEMENT PLAN – PART 2PEST RISK ASSESSMENT
55
Table 4.15 Vertebrate pest risk assessment results table for forestry land use
FORESTRYInvasivenes
sImpact
sPotential
Distribution
Comparative Pest Risk
CWR ControlCosts
CurrentDistribution
Persistence Feasibility ofContainment
FOC
European rabbit 10.0 2.8 10.0 224 Very High 5.9 3.3 6.3 123 NegligibleRed fox 7.3 1.6 7.3 116 High 6.0 8.3 5.5 273 NegligibleGoat 8.2 2.8 8.2 229 Very High 5.3 2.1 1.8 20 HighEuropean hare 4.5 1.6 4.5 58 Medium 7.3 3.3 6.4 156 NegligibleHog deer 7.3 2.4 7.3 70 Medium 6.0 0.8 2.7 14 HighWapiti & Red deer 7.3 2.4 7.3 70 Medium 6.0 3.3 3.6 73 LowRusa, Chital &Sambar deer 7.3 2.4 7.3 70 Medium 6.0 1.7 2.7 27 HighFallow deer 7.3 2.4 7.3 70 Medium 6.0 3.3 3.6 73 Low

SOUTH EAST PEST MANAGEMENT PLAN – PART 2PEST RISK ASSESSMENT
56
Table 4.16 Vertebrate pest risk assessment matrix for forestry land use
FEASIBILITY OF CONTAINMENTCOMPARATIVEPEST RISK Negligible
>111Low
111-55Medium
31-54High13-30
Very High<13
Negligible<11
Low11-34
Medium35-88 HARE
RED,WAPITI &FALLOW
DEER
RUSA & HOGDEER,
SAMBAR &CHITALDEER
High89-168 FOX
Very High>168 RABBIT GOAT
4.4.4 Summary - ForestryPest plantsAs shown in the forestry management matrix in table 4.14, Bridal veil has a very highweed risk and is very high in feasibility of containment. Thus it is recommended that allinfestations are eradicated from the region. Bridal veil was also classified in this categoryin the native vegetation land use and as a result eradication efforts should be coordinatedacross these two land uses. Other pest plants which are very high in the feasibility ofcontainment category are Bathurst burr, Boneseed, Gorse, Innocent weed, Pampas grassand Sallow wattle. These pest plants are classed as Contain Spread, thus aiming toprevent the ongoing spread of the weed species in the region.
Pest plants classed in the Limited Action category are Dock, Bridal creeper, Fleabane andSouth African weed orchid. These species have a low weed risk and/or low feasibility ofcontainment thus any action would not be of significant benefit to the whole land use. Insome cases control may be warranted, such as in the establishment of tree seedlings.This is the same for Phalaris and Bracken fern, which have high weed risk but feasibility ofcontainment is minimal.
Bracken fern is a native plant in the South East but has a significant impact on theestablishment of tree seedlings; therefore it has been considered as a weed within thisland use. As a native plant, Bracken fern is protected by the Native Vegetation Act 1991and advice should be sought from the Native Vegetation Council before any clearance orcontrol is undertaken.
Vertebrate PestsAccording to table 4.16 Goats pose the highest risk to the forestry land use. Whenmanagement actions are undertaken in the native vegetation and grazing land uses theyshould also occur at similar levels in the forestry land use, as it could potentially provideharbour or refuge sites for many transient pest animals.

SOUTH EAST PEST MANAGEMENT PLAN – PART 2PEST RISK ASSESSMENT
57
4.5 AQUATIC
4.5.1 DescriptionHistorically, the majority of the South East region was seasonally or permanentlyinundated with water due to low lying topography, soils prone to waterlogging and a lackof natural drainage. Since 1860’s, the development of an extensive drainage network andchanging climatic factors has resulted in very few intact wetlands remaining. For thepurposes of this risk assessment, the aquatic land use category comprises approximately2% of the region and includes wetlands, lakes, creeks and streams, drains and any areawith permanent surface water.
4.5.2 AssumptionsPest plantsThere is no routine pest plant management in the land use due to the inaccessibility tomost sites. Both environmental impacts and water quality issues were considered whenundertaking the assessment. Species which occur in areas subject to flooding are alsoincluded in this landuse, for example Willows and Blackberry. In some cases livestockmay have access to waterways.
Vertebrate pestsThere is no routine pest animal management in the land use due to the inaccessibility tomost sites and no viable option for poisons in wet areas. Shooting may occur in areas onprivate property.

SOUTH EAST PEST MANAGEMENT PLAN – PART 2PEST RISK ASSESSMENT
58
Figure 4.5 Map of aquatic land use

SOUTH EAST PEST MANAGEMENT PLAN – PART 2PEST RISK ASSESSMENT
59
4.5.3 ResultsIn tables 4.17 and 4.18 the results of the weed risk assessment of the aquatic land use are shown. Tables 4.19 and 4.20 show the resultsfor the vertebrate pest risk assessment.
Table 4.17 Weed risk assessment results table for aquatic land use
AquaticInvasiveness Impacts Potential
DistributionComparativeWeed Risk
CWR ControlCosts
CurrentDistribution
Persistence Feasibilityof
Containment
FOC
Athel pine 4.7 1.6 4.0 29 Low 7.3 0.0 7.3 0 Very HighBlackberry 8.0 4.7 6.0 227 Very High 0.9 7.3 0.0 49 MediumDodder (Chilean &red) 6.0 0.5 1.0 3 Negligible 0.1 7.3 0.0 4 Very HighPepper tree 2.7 2.6 2.0 14 Low 1.8 6.4 0.0 52 MediumSpiny rush 6.0 3.2 8.0 152 High 0.0 36.4 0.0 36 MediumSwamp oak 6.0 7.4 6.0 265 Very High 6.7 1.7 5.5 61 LowWillows - seeding 6.0 5.3 1.0 32 Low 0.0 6.0 0.1 0 Very High

SOUTH EAST PEST MANAGEMENT PLAN – PART 2PEST RISK ASSESSMENT
60
Table 4.18 Weed risk assessment matrix for aquatic land use
FEASIBILITY OF CONTAINMENT
WEED RISK
Negligible>113
Low>56
Medium>31
High>14
Very High<14
Negligible<13
Dodder (Chilean &red)
Low<39 Pepper tree
Athel pine, Noogooraburr, Willows
(seeding)
Medium<101
High<192 Spiny rush
Very High>192 Swamp oak Blackberry

SOUTH EAST PEST MANAGEMENT PLAN – PART 2PEST RISK ASSESSMENT
61
Table 4.19 Vertebrate pest risk assessment results table for aquatic land use
AQUATICInvasiveness Impacts Potential
DistributionComparative
Pest RiskCWR Control
CostsCurrent
DistributionPersistence Feasibility of
ContainmentFOC
Black rat 7.3 5.2 8.0 303 Very High 7.3 3.3 6.4 156 NegligibleBrown rat 7.3 5.2 4.0 151 High 6.0 0.9 3.6 20 HighMallard 8.2 4.8 10.0 393 Very High 5.3 0.8 3.6 16 HighCarp 10.0 6.0 8.0 480 Very High 8.0 0.9 7.3 53 MediumCarp gudgeon 10.0 2.8 8.0 224 Very High 10.7 3.3 7.3 259 NegligibleGambusia 11.8 4.4 8.0 416 Very High 10.7 3.3 8.2 291 NegligibleGoldfish 10.0 4.0 8.0 320 Very High 8.7 1.3 7.3 79 LowMarron 8.2 5.2 4.0 170 Very High 10.0 0.8 8.2 69 LowRedfin 10.9 5.2 6.0 340 Very High 10.0 5.0 8.2 409 NegligibleTrout (Rainbow) 7.3 5.2 4.0 151 High 8.7 1.3 7.3 79 LowTench 8.2 3.2 2.0 52 Medium 9.3 0.9 5.5 47 Medium

SOUTH EAST PEST MANAGEMENT PLAN – PART 2PEST RISK ASSESSMENT
62
Table 4.20 Vertebrate pest risk assessment matrix for aquatic land use
FEASIBILITY OF CONTAINMENTCOMPARATIVE PESTRISK Negligible
>111Low
111-55Medium
31-54High13-30
Very High<13
Negligible<11
Low11-34
Medium35-88 TENCH
High89-168 TROUT BROWN RAT
Very High>168
BLACK RAT,CARP GUDGEON,
GUMBUSIA,REDFIN,
GOLDFISH,MARRON CARP MALLARD
4.5.4 Summary - AquaticPest plantsWillow species have been classified into the Protect Sites category, which is defined as the prevention of spread to key sites of environmentalimportance. In this case Willows have a limited current distribution, so therefore it is feasible to protect sites from Willow invasion, even thoughthey have a low weed risk. The Willow species assessed for this project were the seed producing species in the Weeds of NationalSignificance (WoNS) list. Blackberry is also a WoNS and has been allocated to Contain Spread classification to prevent ongoing spread of thisspecies in the region.
Vertebrate PestsMallard is located in the Destroy Infestations category, which aims to destroy all infestations in the region. Brown rat and Carp have beenclassified as Contain Spread which aims to contain the spread of pests in the region.Although not declared under the Natural Resources Management Act 2004 fresh water fish have been assessed to identify the risk they poseto the aquatic land use in the South East. Assessments were completed on the advice of professionals in the field of fresh water fish ecologyand biology.
SOUTH EAST PEST MANAGEMENT PLAN – PART 2PEST RISK ASSESSMENT
63
4.6 URBAN
4.6.1 DescriptionIn total, the South East region consists of approximately 2.8 million hectares and supportsa population of approximately 62,000 people. Of this regional population, half are locatedwithin the City of Mount Gambier and surrounding areas. This distribution limits the abilityfor individuals across the large, less populated rural areas to control and manage pestspecies. In urban areas, the focus for pest control and eradication is on maintaining publicamenity and safety. Common areas for concern include sports fields and parks, as well asfootpaths. Control methods may be limited in urban areas due to inability to use poisonsor baits, combined with differing public perceptions.
4.6.2 AssumptionsPest plantsCouncils and landholders undertake regular mowing and irregular spot-spraying using lowvolatility herbicides such as Glyphosate. In the South East most lawns and gardens arewatered all year round.
Garden weeds or plants that are simply disliked because they are a nuisance are notconsidered in this assessment. Effects on quality of the land use are focused on damageto physical infrastructure (e.g. roads, paths, buildings) and the impact they may have on aperson.
Vertebrate PestsPest animal management is through trapping and habitat modification, and minimal use ofpoisoned baits where possible.
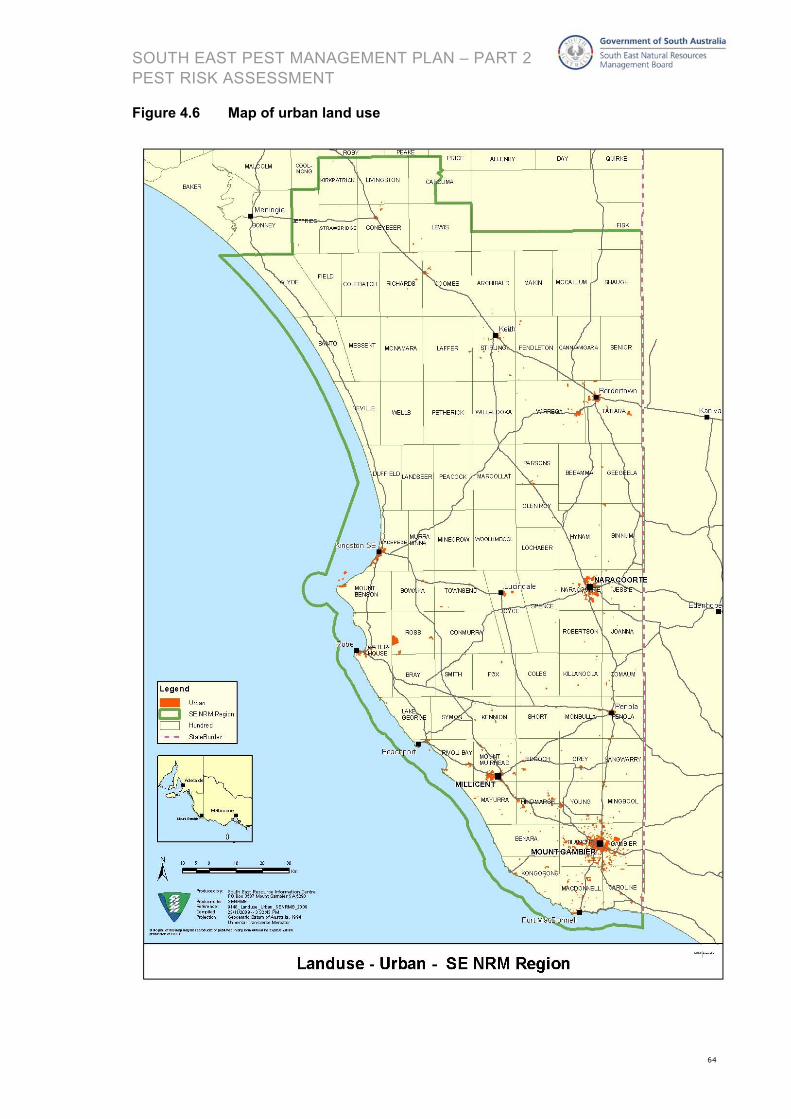
SOUTH EAST PEST MANAGEMENT PLAN – PART 2PEST RISK ASSESSMENT
64
Figure 4.6 Map of urban land use

SOUTH EAST PEST MANAGEMENT PLAN – PART 2PEST RISK ASSESSMENT
65
4.6.3 ResultsTables 4.21 and 4.22 show the results of the weed risk assessment for the urban land use. Tables 4.23 and 4.24 show the results for thevertebrate pest risk assessment.
Table 4.21 Weed risk assessment results table for urban land use
UrbanInvasiveness Impacts Potential
DistributionComparativeWeed Risk
CWR ControlCosts
CurrentDistribution
Persistence Feasibilityof
Containment
FOC
African boxthorn 4.0 4.7 1.0 19 Low 2.7 0.9 4.5 11 Very HighAleppo pine 6.0 5.3 6.0 189 High 5.3 0.9 4.5 22 HighApple of sodom 6.7 4.2 4.0 112 High 4.7 1.7 5.5 42 MediumAthel pine 4.7 1.6 1.0 7 Negligible 0.0 7.3 0.1 0 Very HighBlackberry 6.0 4.7 1.0 28 Low 3.3 0.1 5.5 2 Very HighBridal creeper 7.3 5.3 10.0 386 Very High 5.3 6.7 6.4 226 NegligibleCaltrop 6.0 4.7 4.0 114 High 4.7 0.9 3.6 16 HighCoolatai grass 5.3 1.6 2.0 17 Low 3.3 0.1 3.6 1 Very HighCouch 8.0 2.6 6.0 126 High 4.0 2.1 6.4 53 MediumFalse caper 5.3 4.7 1.0 25 Low 5.3 0.1 8.2 4 Very HighGazania sp. 6.0 1.6 2.0 19 Low 6.0 0.1 6.4 3 Very HighInnocent weed 6.7 4.7 1.0 32 Low 4.7 0.1 4.5 2 Very HighKhaki weed 6.0 4.7 4.0 114 High 4.7 0.1 4.5 2 Very HighKikuyu 8.0 2.6 6.0 126 High 4.0 2.1 6.4 53 MediumPin cushion daisy 6.0 4.2 4.0 101 High 6.7 5.0 6.4 212 NegligiblePoa grass 6.0 2.1 8.0 101 High 6.7 5.0 6.4 212 NegligiblePrickly pear 5.3 4.7 4.0 101 High 6.0 0.9 3.6 20 HighSoursob 5.3 1.1 8.0 45 Medium 2.7 3.3 7.3 65 LowTree of heaven 6.0 5.8 4.0 139 High 6.0 0.0 3.6 0 Very HighWillows - seeding 6.0 5.3 1.0 32 Low 0.0 0.0 6.0 5 Very High

SOUTH EAST PEST MANAGEMENT PLAN – PART 2PEST RISK ASSESSMENT
66
Table 4.22 Weed risk assessment matrix for urban land use
FEASIBILITY OF CONTAINMENT
WEED RISK
Negligible>113
Low>56
Medium>31
High>14
Very High<14
Negligible<13 Athel pine
Low<39
African boxthorn,Blackberry, Falsecaper, Gazania,Innocent weed,Willow (seeding)
Medium<101 Soursob
High<192
Pin cushion daisy,Poa grass
Apple of sodom,Couch, Kikuyu
Aleppo pine,Caltrop, Prickly pear
Khaki weed, Tree ofheaven
Very High>192 Bridal creeper

SOUTH EAST PEST MANAGEMENT PLAN – PART 2PEST RISK ASSESSMENT
67
Table 4.23 Vertebrate pest risk assessment results table for urban land use
URBANInvasiveness Impact
sPotential
Distribution
Comparative Pest
Risk
CWR ControlCosts
CurrentDistributio
n
Persistence
Feasibility ofContainment
FOC
European rabbit 10.0 3.2 4.0 128 High 5.9 2.5 6.3 92 LowRed fox 7.3 4.8 8.0 279 Very High 10.0 5.0 7.3 364 NegligibleCat 10.0 4.4 10.0 440 Very High 9.3 10.0 7.3 679 NegligibleEuropean hare 4.5 1.2 2.0 11 Low 6.7 2.5 6.4 106 LowHouse mouse 7.3 4.4 10.0 320 Very High 8.0 10.0 4.5 364 NegligibleBlack rat 7.3 5.6 10.0 407 Very High 8.0 8.3 4.5 303 NegligibleBrown rat 6.4 4.0 2.0 51 Medium 8.0 0.8 4.5 31 HighWild dog/ Dingo 6.4 4.8 2.0 61 Medium 7.3 0.9 1.8 12 Very HighCommon starling 6.4 2.8 10.0 178 Very High 8.7 8.3 7.3 525 NegligibleEurasian blackbird 6.4 3.2 10.0 204 Very High 8.7 10.0 7.3 630 NegligibleDomestic pigeon 10.0 4.4 10.0 440 Very High 8.7 6.7 7.3 420 NegligibleMallard 9.1 1.2 0.5 5 Negligible 6.7 0.8 4.5 26 High

SOUTH EAST PEST MANAGEMENT PLAN – PART 2PEST RISK ASSESSMENT
68
Table 4.24 Vertebrate pest risk assessment matrix for urban land use
FEASIBILITY OF CONTAINMENTCOMPARATIVE PESTRISK Negligible
>111Low
111-55Medium
31-54High13-30
Very High<13
Negligible.<11 MALLARD
Low11-34 HARE
Medium35-88 BROWN RAT WILD DOG / DINGO
High89-168 RABBIT
Very High>168
BLACK RAT,MOUSE, CAT
STARLING, FOXBLACKBIRD,
PIGEON
4.6.4 Summary - UrbanPest plantsThe majority of the pest plants in the urban land use are feasible to control; this is due to the accessibility to infestations and the small size ofcurrent distributions. Khaki weed was classed in the Destroy Infestations category which aims to significantly reduce the extent of the weedin the region. Caltrop is another burry weed of the urban land use, whose management action aims to contain the spread of the weed in theregion. Areas where Caltrop is known to be found in the region include ovals, footpaths and other public amenity areas. Other managementactions for Caltrop include control of new outbreaks to reduce spread.
Vertebrate PestsWild dog and Brown rat should have enforced control of all populations, aiming for a significant reduction in pest animal density through highlevel initial control and sustained management.

SOUTH EAST PEST MANAGEMENT PLAN – PART 2PEST RISK ASSESSMENT
69
4.7 IRRIGATED CROPS AND PASTURE
4.7.1 DescriptionOne of the unique features of the South East region is the availability of good qualityunderground water that is suitable for stock, domestic and agricultural use. This supportsirrigated cropping and grazing across the region, with dairying, fat lambs and annualhorticulture such as potatoes in the Lower South East. In the Upper South East, mostirrigation is focused on lucerne and small seed production (e.g. clover). There are twomain types of irrigation used for crops and pasture, spray (centre pivot) and floodirrigation, dependant largely on the quality of water available, appropriate delivery systemsand external factors such as presence of large red gums (Eucalyptus camaldulensis). Dripirrigation is limited mainly to perennial horticulture (e.g. fruit trees and grape vines).
4.7.2 AssumptionsPest plantsThe main pest plant control occurs during pasture establishment, with knockdown spraysand cultivation used before seeding. Pre-emergence herbicides are used and somefollow up sprays with selective herbicides such as 2,4D, Bromoxynil (depending on thecrop). Mowing/grazing and selective and/or knockdown herbicides (e.g., paraquat) areused when needed. For flood irrigation some drain bank weed control is needed at thestart of the season e.g., Glyphosate.
Vertebrate PestsThe assumption of this land use is that there is very little pest animal control conducted bylandowners. The main method of control is conducting 1080 baiting programs duringlambing seasons.

SOUTH EAST PEST MANAGEMENT PLAN – PART 2PEST RISK ASSESSMENT
70
Figure 4.7 Map of irrigated crops and pastures land use

SOUTH EAST PEST MANAGEMENT PLAN – PART 2PEST RISK ASSESSMENT
71
4.7.3 ResultsIn tables 4.25 and 4.26 the results are presented from the weed risk assessment for the irrigated crops and pasture land use. Tables 4.27and 4.28 show the results for the vertebrate pest risk assessment.
Table 4.25 Weed risk assessment results table for irrigated crops and pastures land useIrrigated Pastures
and Crops
Invasiveness Impacts
PotentialDistribution
ComparativeWeed Risk
CWR ControlCosts
CurrentDistributio
n
Persistence
Feasibility ofContainment
FOC
Alkali sida 6.0 3.2 1.0 19 Low 2.7 0.0 6.4 0 Very HighBathurst burr 6.0 2.6 4.0 63 Medium 4.0 0.1 6.4 2 Very HighBlackberry 7.3 2.6 6.0 116 High 4.7 0.4 6.4 12 Very HighBlackberrynightshade 4.0 2.1 1.0 8 Negligible 5.3 1.8 6.4 59 LowBladder campion 5.3 2.6 1.0 14 Low 4.0 0.1 3.6 1 Very HighBroomrape 7.3 2.6 4.0 77 Medium 4.0 0.0 6.4 0 Very HighBuchan weed 6.7 4.2 2.0 56 Medium 5.3 2.5 6.4 85 LowCaltrop 6.7 3.2 6.0 126 High 4.0 0.9 6.4 23 HighCapeweed 6.7 1.6 2.0 21 Low 3.3 3.3 3.6 40 MediumCarrot 7.3 2.6 2.0 39 Low 6.0 0.1 5.5 3 Very HighCouch 6.7 2.6 10.0 175 High 6.7 3.3 6.4 141 NegligibleCreeping knapweed 3.3 3.7 6.0 74 Medium 5.3 0.1 4.5 2 Very HighDock 4.7 2.1 8.0 79 Medium 5.3 5.0 5.5 145 NegligibleDodder (Chilean &red) 6.0 0.5 1.0 3 Negligible 6.0 0.1 7.3 4 Very HighFalse caper 6.0 2.6 4.0 63 Medium 4.0 1.3 6.4 32 MediumFat hen 7.3 3.2 8.0 185 High 5.3 5.0 5.5 145 NegligibleField bindweed 6.7 1.6 4.0 42 Medium 0.0 3.3 3.3 30 HighFleabane 3.3 1.6 6.0 32 Low 3.3 6.7 5.5 121 NegligibleGolden dodder 8.7 3.7 8.0 255 Very High 4.0 0.1 5.5 2 Very HighInnocent weed 5.3 2.6 4.0 56 Medium 3.3 0.1 5.5 2 Very HighKhaki weed 5.3 2.6 8.0 112 High 3.3 0.0 5.5 0 Very HighKikuyu 8.0 2.6 6.0 126 High 4.0 2.1 6.4 53 Medium

SOUTH EAST PEST MANAGEMENT PLAN – PART 2PEST RISK ASSESSMENT
72
Lincoln weed 6.7 1.6 4.0 42 Medium 4.0 0.9 6.4 23 HighNoogoora burrcomplex 5.3 2.6 4.0 56 Medium 2.7 0.1 6.4 1 Very HighOx tongue 5.3 1.1 6.0 34 Low 4.7 5.0 6.4 148 NegligibleParramatta grass 6.7 2.6 4.0 70 Medium 4.0 2.5 5.5 55 MediumPoa grass 6.0 4.2 4.0 101 High 6.7 5.0 6.4 212 NegligibleSalvation Jane 5.3 4.7 8.0 202 Very High 3.3 2.5 5.5 45 MediumSkeleton weed 8.0 1.6 6.0 76 Medium 5.3 1.7 7.3 65 LowSlender thistle 4.7 3.2 8.0 118 High 3.3 2.5 4.5 38 MediumSilverleaf nightshade 8.0 2.6 6.0 126 High 6.0 0.4 7.3 18 HighSoldier thistle 5.3 3.7 6.0 118 High 3.3 2.5 4.5 38 MediumSorrell 3.3 2.1 4.0 28 Low 3.3 6.7 4.5 101 LowSpear thistle 5.3 3.7 6.0 118 High 3.3 2.5 4.5 38 MediumThree cornered jack 6.7 3.7 4.0 98 Medium 3.3 0.1 5.5 2 Very HighVariegated thistle 3.3 3.7 4.0 49 Medium 3.3 0.1 4.5 1 Very HighWillow herb 5.3 3.2 6.0 101 High 2.7 8.3 5.5 121 NegligibleWireweed 4.0 2.1 6.0 51 Medium 3.3 5.0 4.5 76 LowYellow burrweed 5.3 4.7 6.0 152 High 3.3 1.3 5.5 23 High

SOUTH EAST PEST MANAGEMENT PLAN – PART 2PEST RISK ASSESSMENT
73
Table 4.26 Weed risk assessment matrix for irrigated crops and pastures land use
FEASIBILITY OF CONTAINMENT
WEED RISK
Negligible>113
Low>56
Medium>31
High>14
Very High<14
Negligible<13
Blackberrynightshade
Dodder (Chilean &red)
Low<39 Fleabane, Ox tongue Sorrel Capeweed Bladder campion,
Carrot,
Medium<101 Dock
Buchan weed,Skeleton weed,
Wireweed
False caper,Parramatta grass
Field bindweed,Lincoln weed
Bathurst burr,Creeping knapweed,
Innocent weed,Noogoora burr,
Three corner jack,Variegated thistle
High<192
Couch, Fat hen, Poagrass
Kikuyu, Slenderthistle, Soldier thistle,
Spear thistle
Caltrop, Silverleafnightshade, Yellow
burr weed
Blackberry, Khakiweed
Very High>192 Salvation Jane Golden dodder

SOUTH EAST PEST MANAGEMENT PLAN – PART 2PEST RISK ASSESSMENT
74
Table 4.27 Vertebrate pest risk assessment results table for irrigated crops and pastures land useIRRIGATED CROPS
AND PASTURES
Invasiveness Impacts PotentialDistribution
ComparativePest Risk
CWR ControlCosts
CurrentDistribution
Persistence Feasibilityof
Containment
FOC
European rabbit 10.0 5.2 8.0 416 Very High 7.1 5.0 6.3 221 NegligibleRed fox 7.3 6.0 10.0 436 Very High 6.7 10.0 7.3 485 NegligibleGoat 8.2 4.8 8.0 314 Very High 6.7 1.3 3.6 30 HighEuropean hare 4.5 2.0 6.0 55 Medium 8.0 5.0 8.2 327 NegligibleHouse mouse 6.4 3.2 4.0 81 Medium 6.0 2.1 8.2 102 LowBlack rat 6.4 4.0 8.0 204 Very High 6.7 1.8 7.3 85 LowBrown rat 7.3 5.2 4.0 151 High 6.0 0.8 3.6 18 HighDingo, Wild dog 6.4 6.0 10.0 382 Very High 7.3 0.0 3.6 0 Very HighHog deer 6.4 3.2 8.0 163 Very High 6.7 0.8 2.7 15 HighRed & Wapiti deer 7.3 3.6 10.0 262 Very High 6.0 3.3 3.6 73 LowRusa, Chital &Sambar deer 7.3 3.6 10.0 262 Very High 6.0 1.3 2.7 20 HighFallow deer 7.3 3.6 10.0 262 Very High 6.0 3.3 3.6 73 Low

SOUTH EAST PEST MANAGEMENT PLAN – PART 2PEST RISK ASSESSMENT
75
Table 4.28 Vertebrate pest risk assessment matrix for irrigated crops and pastures land use
FEASIBILITY OF CONTAINMENTCOMPARATIVE PESTRISK Negligible
>111Low
111-55Medium
31-54High13-30
Very High<13
Negligible<11Low
11-34Medium
35-88 HARE MOUSE
High89-168 BROWN RAT
Very High>168 RABBIT, FOX
BLACK RAT, RED,WAPITI & FALLOW
DEER
HOG DEER, CHITAL,RUSA & SAMBAR
DEER
GOAT, WILD DOG/DINGO
4.7.4 Summary – Irrigation Crops and PasturePest plantsGolden dodder has been identified as the highest priority for control in irrigated crops and pastures. It has come under the Eradicationcategory which also reflects current policies for this weed. This plant is a parasitic plant that utilises a host plant to survive. The recordedinfestations within the South East have been on irrigated lucerne crops.
Vertebrate PestsIn table 4.28 Goat and Wild dog/ dingo are to be eradicated from the region, while Brown rat, Hog, Sambar and Chital deer should havemanagement actions targeted toward reducing their populations and limiting their spread.

SOUTH EAST PEST MANAGEMENT PLAN – PART 2PEST RISK ASSESSMENT
76
4.8 PERENNIAL HORTICULTURE
4.8.1 DescriptionPerennial horticulture in the South East region is dominated by the viticulture industry inseveral parcels located across the region. The main winegrowing areas are Coonawarraand Padthaway, with Wrattonbully, Cape Jaffa, Mt Benson and the Kingston area growingin popularity. This land use also includes stone fruits, pome fruit (e.g. apples) and citruswhich are grown in small pockets. The total area of this land use is approximately 20,939hectares or less than 1% of the region.
4.8.2 AssumptionsPest plantsIn some cases an annual or perennial cover crop is grown between rows of vines toprevent weed growth. A pre-emergent and knock down herbicide is also used aroundtrees/vines. In addition a knockdown herbicide is generally used every 4-6 weeks and apre-emergent herbicide is used twice a year. There may be some overhead sprinkler orunder tree/ vine drip/micro-jet irrigation.
Vertebrate PestsPest animal management is through the use deterrent devices such as bird scarers andpest proof fencing, 1080 poisoned baits and shooting. An annual or perennial cover cropis grown between rows and grazing by livestock may occur.

SOUTH EAST PEST MANAGEMENT PLAN – PART 2PEST RISK ASSESSMENT
77
Figure 4.8 Map of perennial horticulture land use

SOUTH EAST PEST MANAGEMENT PLAN – PART 2PEST RISK ASSESSMENT
78
4.8.3 ResultsIn tables 4.29 and 4.30 the weed risk assessment results for the perennial horticulture land use are shown. Tables 4.31 and 4.32 show theresults for the vertebrate pest risk assessment.
Table 4.29 Weed risk assessment results table for perennial horticulture land usePerennial
Horticulture
Invasiveness Impacts PotentialDistribution
ComparativeWeed Risk
CWR ControlCosts
CurrentDistribution
Persistence Feasibilityof
Containment
FOC
Bathurst burr 6.7 1.1 6.0 42 Medium 0.0 3.3 0.9 0 Very HighBridal creeper 7.3 5.3 10.0 386 Very High 5.3 6.7 6.4 226 NegligibleCaltrop 5.3 2.1 6.0 67 Medium 0.0 4.0 0.9 0 Very HighCouch 8.0 2.6 6.0 126 High 4.0 5.0 6.4 127 NegligibleCutleafmignonette 5.3 2.1 4.0 45 Medium 3.3 2.5 3.6 30 HighFat hen 7.3 3.2 8.0 185 High 5.3 5.0 5.5 145 NegligibleField bindweed 6.7 1.6 4.0 42 Medium 3.3 3.3 2.7 30 HighFleabane 3.3 1.6 6.0 32 Low 6.7 5.5 0.0 121 NegligibleGolden dodder 8.7 3.7 8.0 255 Very High 0.1 5.5 0.0 2 Very HighInnocent weed 6.7 3.2 4.0 84 Medium 0.0 4.7 0.1 2 Very HighKhaki weed 5.3 2.6 8.0 112 High 0.1 5.5 0.0 2 Very HighOlive 6.0 3.7 4.0 88 Medium 0.9 6.4 0.0 43 MediumSkeleton weed 8.0 1.6 6.0 76 Medium 1.7 7.3 0.0 65 LowSilverleafnightshade 8.0 1.6 6.0 76 Medium 0.4 7.3 0.0 18 HighSoursob 5.3 1.1 8.0 45 Medium 3.3 7.3 0.0 65 LowWireweed 4.7 0.5 4.0 10 Negligible 0.0 4.0 1.8 32 Medium

SOUTH EAST PEST MANAGEMENT PLAN – PART 2PEST RISK ASSESSMENT
79
Table 4.30 Weed risk assessment matrix for perennial horticulture land use
FEASIBILITY OF CONTAINMENT
WEED RISK
Negligible>113
Low>56
Medium>31
High>14
Very High<14
Negligible<13 Wireweed
Low<39 Fleabane
Medium<101
Skeleton weed,Soursob Olive
Cutleaf mignonette,Field bindweed
Silverleaf nightshade
Bathurst burr Caltrop,Innocent weed
High<192 Couch, Fat hen Khaki weed
Very High>192 Bridal creeper Golden dodder

SOUTH EAST PEST MANAGEMENT PLAN – PART 2PEST RISK ASSESSMENT
80
Table 4.31 Vertebrate pest risk assessment results table for perennial horticulture land usePerennial
Horticulture
Invasiveness Impacts PotentialDistribution
ComparativePest Risk
CWR ControlCosts
CurrentDistribution
Persistence Feasibilityof
Containment
FOC
European rabbit 9.1 2.4 2.0 44 Medium 5.9 2.1 7.5 92 LowRed fox 7.3 2.8 10.0 204 Very High 6.7 8.3 7.3 404 NegligibleGoat 7.3 3.6 0.5 13 Low 4.0 0.9 1.8 6 Very HighEuropean hare 4.5 2.4 8.0 87 High 6.0 8.3 8.2 409 NegligibleHouse mouse 6.4 2.8 8.0 143 High 8.7 6.7 8.2 473 NegligibleBlack rat 6.4 2.4 6.0 92 High 8.0 5.0 7.3 291 NegligibleHog deer 6.4 2.0 0.5 6 Negligible 4.7 0.9 1.8 7 Very HighRusa, Chital &Sambar deer 6.4 2.4 0.5 8 Negligible 4.7 0.9 1.8 7 Very HighRed & Wapiti deer 6.4 2.4 0.5 8 Negligible 4.7 1.8 1.8 15 HighFallow deer 6.4 2.4 0.5 8 Negligible 4.7 1.8 1.8 15 HighCommon starling 6.4 3.6 10.0 229 Very High 5.3 8.3 9.1 404 NegligibleEurasian blackbird 6.4 1.6 10.0 102 High 6.7 8.3 9.1 505 Negligible

SOUTH EAST PEST MANAGEMENT PLAN – PART 2PEST RISK ASSESSMENT
81
Table 4.32 Vertebrate pest risk assessment matrix for perennial horticultureland use
FEASIBILITY OF CONTAINMENTCOMPARATIVEPEST RISK Negligible
>111Low
111-55Medium
31-54High13-30
Very High<13
Negligible<11
RED,WAPITI &FALLOW
DEER
HOG,CHITAL,
SAMBAR &RUSA DEER
Low11-34 GOAT
Medium35-88 RABBIT
High89-168
HARE,BLACK RAT,BLACKBIRD
, MOUSE
Very High>168
STARLINGFOX
4.8.4 Summary – Perennial HorticulturePest plantsConsistent with irrigated crops and pastures Golden dodder has been classified into thehighest management category of Eradicate from region within the perennial horticultureland use. Therefore when implementing control activities a whole of region approachshould be taken to ensure it does not enter into the region and ensure existing infestationsare eradicated.
Burry weeds of Bathurst burr, Caltrop and Innocent weed are very prevalent in perennialhorticulture and are easily spread due to the high human and vehicle traffic in plantations.Management of these weeds should be aimed at containing the spread within this landuse, and controlling current infestations.
Vertebrate PestsIn table 4.32 Goat was categorised in the Protect Sites management action which aims toprevent spread of the pest animal species to key sites/assets of high economic,environmental and/or social value. Black rat, Mouse, Blackbird, Starling and Fox speciesare classified in the Manage Pest Populations action.

SOUTH EAST PEST MANAGEMENT PLAN – PART 2PEST RISK ASSESSMENT
82
4.9 COMBINED RISK ASSESSMENT RESULTS
The attribute scores for the pest plant and pest animal threats assessed in this projecthave been averaged across the whole of the region and each land use outlines keyassumptions that have been applied to the assessment.
The assessment of the pest plant and animals has shown species have varying controlactions between each land use, i.e. one species can be categorised into multiplemanagement actions e.g. goat is Eradicate from the region in cropping land use, DestroyInfestations in grazing land use and Protect Sites in perennial horticulture land use (referto table 4.33 below).
Table 4.33 Weed species versus management actions
Landuse
Gra
zing
Na
tive
Ve
ge
tatio
n
Cro
pp
ing
Fore
stry
Aq
uatic
Urb
an
Irrig
ate
d C
rop
&Pa
stur
es
Ho
rtic
ultu
re
Ma
nag
em
ent
Cla
ss
1Eradicate from Region(Red)
2Destroy Infestations(Orange)
3 Contain Spread (Yellow)
4 Protect Sites (Green)
5 Manage Weed (Light Blue)
6 Manage Sites (Dark Blue)
7 Monitor (Purple)
8 Limited Action (Grey)
Not Present/ Alert Species
WEEDS: Acacia cyclops Acacia cyclops 5 5African boxthorn Lycium ferocissimum 4 4 7 4 4African feathergrass Pennisetum macrourum 3 3 7 3African lovegrass Eragrostis curvula 3 3 4African rue Peganum harmala Agave Agave americana 7 7Aleppo pine Pinus halepensis 3 3 3Alisma Alisma lanceolatum Alkali sida Malvella leprosa
Alligator weedAlternantheraphiloxeroides
Annual ryegrass Lolium rigidum 5 5Apple of sodom Solanum hermannii 4 6 6 4 4Arrowhead Sagittaria montevidensis Arum lily Zantedeschia aethiopica 7 7Asparagus fern Asparagus scandans 2 2Athel pine Tamarix aphylla 7 4 7 7Azzarola Crataegus sinaica Bamboo Arundo donax 8 8

SOUTH EAST PEST MANAGEMENT PLAN – PART 2PEST RISK ASSESSMENT
83
Landuse
Gra
zing
Na
tive
Ve
ge
tatio
n
Cro
pp
ing
Fore
stry
Aq
uatic
Urb
an
Irrig
ate
d C
rop
&Pa
stur
es
Ho
rtic
ultu
re
Ma
nag
em
ent
Cla
ss
1Eradicate from Region(Red)
2Destroy Infestations(Orange)
3 Contain Spread (Yellow)
4 Protect Sites (Green)
5 Manage Weed (Light Blue)
6 Manage Sites (Dark Blue)
7 Monitor (Purple)
8 Limited Action (Grey)
Not Present/ Alert Species
Bathurst burr Xanthium spinosum 3 4 3 3 3 3Bedstraw Galium sp. 4 4Bifora Bifora testiculata Blackberry Rubus fruticosus 3 3 2 3 4 2 2Blackberrynightshade Solanum nigrum 8 8 8Bladder campion Silene vulgaris 4 4 4 4Blue mustard Chorispora tenella Blue periwinkle Vinca major 6 6Blue psoralea Psoralea pinnata 4 4Bluebell creeper Sollya heterophylla 3 4 3
BoneseedChrysanthemoidesmonilifera 3 3 3
Bracken fern Pteridium esculentum 8 5 5Bridal creeper Asparagus asparagoides 5 5 5 5 5Bridal creeper(Western Cape) Asparagus asparagoides 2 2Bridal veil Asparagus declinatus 1 1 1Broadkernelespartillo Achnatherum caudatum Broomrape Orobanche ramosa 3 3 3Buchan weed Hirschfeldia incana 8 8 6 6Buckthorn Rhamnus alaternus 4 4
Bulbil watsoniaWatsonia meriana var.bulbillifera 8 8
Butterfly bush Buddleja davidii 7 7Cabomba Cabomba caroliniana Calomba daisy Oncosiphon suffruticosum 3 3 3Caltrop Tribulus terrestris 3 3 3 3 3 3Cane needlegrass Nassella hyaline Cape broom Genista monspessulana 4 4 4Cape tulip - one leaf Moraea flaccida 3 6 3Cape tulip - two leaf Moraea miniata 3 6 3

SOUTH EAST PEST MANAGEMENT PLAN – PART 2PEST RISK ASSESSMENT
84
Landuse
Gra
zing
Na
tive
Ve
ge
tatio
n
Cro
pp
ing
Fore
stry
Aq
uatic
Urb
an
Irrig
ate
d C
rop
&Pa
stur
es
Ho
rtic
ultu
re
Ma
nag
em
ent
Cla
ss
1Eradicate from Region(Red)
2Destroy Infestations(Orange)
3 Contain Spread (Yellow)
4 Protect Sites (Green)
5 Manage Weed (Light Blue)
6 Manage Sites (Dark Blue)
7 Monitor (Purple)
8 Limited Action (Grey)
Not Present/ Alert Species
Capeweed Arctotheca calendula 5 8 8 5Carrot Daucus carota 4 4Chilean needlegrass Nassella neesiana
Coastal tea treeLeptospermumlaevigatum 4 4
Coastal wattle Acacia sophorae 5 5Common lantana Lantana camara Coolatai grass Hyparrhenia hirta 2 4 4 2Cootamundra wattle Acacia baileyana 4 4Cotoneaster Cotoneaster spp. 4 6Couch Cynodon dactylon 5 4 4 5 5 4Creeping knapweed Acroptilon repens 3 3 3 3Cutleaf mignonette Reseda lutea 4 4 4 4
Desert ashFraxinus angustifolia sup.angustifolia 5 5
Dock Rumex crispus 6 8 6 6Dodder (Chilean &red) Cuscuta spp 7 7 7 7 7Dog rose Rosa canina 7 6 6Dolichos pea Dipogon lignosus 3 3Elodea Elodea canadensis English broom Cytisus scoparius 4 4English oak Quercus robur 7 7Erica Erica baccans & lusitanica 3 3Eurasian watermilfoil Myriophyllum spicatum False caper Euphorbia terracina 6 6 4 6 4Fat hen Chenopodium album 5 5 5Field bindweed Convolvulus arvensis 4 4 7 4Field garlic Allium vineale Fleabane Conyza spp. 6 8 8 8 4Fountain grass Pennisetum setaceum 2 2Freesia Freesia hybrids 6 6

SOUTH EAST PEST MANAGEMENT PLAN – PART 2PEST RISK ASSESSMENT
85
Landuse
Gra
zing
Na
tive
Ve
ge
tatio
n
Cro
pp
ing
Fore
stry
Aq
uatic
Urb
an
Irrig
ate
d C
rop
&Pa
stur
es
Ho
rtic
ultu
re
Ma
nag
em
ent
Cla
ss
1Eradicate from Region(Red)
2Destroy Infestations(Orange)
3 Contain Spread (Yellow)
4 Protect Sites (Green)
5 Manage Weed (Light Blue)
6 Manage Sites (Dark Blue)
7 Monitor (Purple)
8 Limited Action (Grey)
Not Present/ Alert Species
Gazania spp. Gazania spp. 4 4 4Giant reed Arundo donax Golden dodder Cuscuta campestris 1 1 1Golden wreath wattle Acacia saligna 5 5Gorse/ Furze Ulex europaeus 3 3 3 3Hoary cress Cardaria draba 3 3Horehound Marrubium vulgare 4 8 4 4Horsetail Equisetum hyemale
HydrocotyleHydrocotyleranunculoides
Innocent weedCenchrusincertus/longispinus 3 2 3 4 3 3 2
Ivy (Cape & English) Hendera helix 4 4Khaki weed Alternanthera pungens 2 2 2 2 2Kikuyu Pennisetum clandestinum 6 4 4 4Lagarosiphon Lagarosiphon major Leafy elodea Egeria densa Lesser loosestrife Lythrum hyssopifolia Lincoln weed Diplotaxis tenuifolia 4 4 4 4Lippia Phyla canescens
Marguerite daisyArgyranthemumfrutescens 7 7
Marram grass Ammophila arenaria 6 6May/ Hawthorn Crataegus monogyna 7 7Mexican feathergrass Nassella tenuissima Muskweed Myagrum perfoliatum Nightstock Matthiola longipetala Noogoora burrcomplex
Xanthium strumarium sp.agg. 4 4 4 4
Olive Olea europaea 4 6 6
Onion grassRomulea rosea var.australis 6 6
Onion weed Asphodelus fistulosus 6 6

SOUTH EAST PEST MANAGEMENT PLAN – PART 2PEST RISK ASSESSMENT
86
Landuse
Gra
zing
Na
tive
Ve
ge
tatio
n
Cro
pp
ing
Fore
stry
Aq
uatic
Urb
an
Irrig
ate
d C
rop
&Pa
stur
es
Ho
rtic
ultu
re
Ma
nag
em
ent
Cla
ss
1Eradicate from Region(Red)
2Destroy Infestations(Orange)
3 Contain Spread (Yellow)
4 Protect Sites (Green)
5 Manage Weed (Light Blue)
6 Manage Sites (Dark Blue)
7 Monitor (Purple)
8 Limited Action (Grey)
Not Present/ Alert Species
Ox tongue Picris echioides 8 7Pampas grass Cortaderia spp. 2 3 2Parramatta grass Sporobolus africanus 6 6 6Parrots feather Myriophyllum aquaticum Pepper tree Schinus molle var. areira 8 8 4Perennial thistle Cirsium arvense 6 6Phalaris Phalaris aquatica 5 5 5Pheasant's eye Adonis microcarpa Pin cushion daisy Scabiosa atropurpurea 5 5 5Plumerillo Jarava plumose Poa grass Poa annua 5 5 5Poison buttercup Ranunculus sceleratus Polygala Polygala myrtifolia 4 6Poplars Populus spp. 6 6
Prickly acaciaAcacia nilotica subsp.Indica
Prickly pear Opuntia spp 7 3 3Primrose willow Ludwigia peruviana
Pyp grassEhrharta villosa varmaxima 5 5
Radiata pine Pinus radiata 3 3Ragwort Senecio jacobaea
Rhus treeToxicodendronsuccedaneum
Sagittaria Sagittaria graminea Sallow wattle Acacia longifolia 4 4 3Salvation Jane Echium plantagineum 4 5 3 3Salvinia Salvinia molesta Sea spurge Euphorbia paralias 7 7Sea wheatgrass Thinopyrum junceiforme 4 4
Senegal tea plantGymnocoronisspilanthoides

SOUTH EAST PEST MANAGEMENT PLAN – PART 2PEST RISK ASSESSMENT
87
Landuse
Gra
zing
Na
tive
Ve
ge
tatio
n
Cro
pp
ing
Fore
stry
Aq
uatic
Urb
an
Irrig
ate
d C
rop
&Pa
stur
es
Ho
rtic
ultu
re
Ma
nag
em
ent
Cla
ss
1Eradicate from Region(Red)
2Destroy Infestations(Orange)
3 Contain Spread (Yellow)
4 Protect Sites (Green)
5 Manage Weed (Light Blue)
6 Manage Sites (Dark Blue)
7 Monitor (Purple)
8 Limited Action (Grey)
Not Present/ Alert Species Serrated tussock Nassella trichotoma Shiny leaf coprosma Coprosma repens 4 4Silver grass Vulpia bromoides 6 6Skeleton weed Chondrilla juncea 6 6 6 6 6 6Slender thistle Carduus tenuiflorus 6 4 4Silverleaf nightshade Solanum elaeagnifolium 2 3 3 4 2Soldier thistle Picnomon acarna 5 4 4Sorrell Rumex acetosella 8 8 8Soursob Oxalis pes-caprae 8 6 6 6 6South African weedorchid Disa bracteata 6 8 6Spear thistle Cirsium vulgare 5 4 4Spiny rush Juncus acutus 4 6 4 4Swamp oak Casuarina glauca 4 4Sweet briar Rosa rubiginosa 6 6Sweet pittosporum Pittosporum undulatum 6 6Tagasaste Chamaecytisus palmensis 6 6Tall wheatgrass Thinopyrum ponticum 5 5 5Texas needlegrass Nassella leucotricha Three corner jack Emex spp. 3 3 3Three hornedbedstraw Galium tricornutum 3 3Tree of heaven Ailanthus altissima 2 2Variegated thistle Silybum marianum 4 4 3 3Veldt grass Ehrharta calycina 5 5Wandering jew Tradescantia albiflora 7 7Water caltrop Trapa natans Water dropwort Oenanthe pimpinelloides Water hyacinth Eichhornia crassipes
Water primroseLudwigia peploides sppmontividensis
Water soldier Stratiotes aloides

SOUTH EAST PEST MANAGEMENT PLAN – PART 2PEST RISK ASSESSMENT
88
Landuse
Gra
zing
Na
tive
Ve
ge
tatio
n
Cro
pp
ing
Fore
stry
Aq
uatic
Urb
an
Irrig
ate
d C
rop
&Pa
stur
es
Ho
rtic
ultu
re
Ma
nag
em
ent
Cla
ss
1Eradicate from Region(Red)
2Destroy Infestations(Orange)
3 Contain Spread (Yellow)
4 Protect Sites (Green)
5 Manage Weed (Light Blue)
6 Manage Sites (Dark Blue)
7 Monitor (Purple)
8 Limited Action (Grey)
Not Present/ Alert Species White arctotis(African daisy) Arctotis stoechadifolia 8 8White weepingbroom Retama raetam 2 2Wild artichoke Cynara cardunculus 7 7 7Wild oats Avena fatua 5 5Wild radish Raphanus raphanistrum 5 5Williams grass Festuca arundinacea 6 6Willow herb Epilobium billardieranum Willow spp. Salix spp. 4 4 4Wireweed Polygonum aviculare 6 6 8 6Yellow burrweed Amsinckia spp. 4 7 5 3 3

SOUTH EAST PEST MANAGEMENT PLAN – PART 2PEST RISK ASSESSMENT
89
Table 4.34 Vertebrate pests versus management actions
Land ManagementAction
Land use
Gra
zing
Nat
ive
Vege
tatio
n
Cro
ppin
g
Fore
stry
Aqu
atic
Urb
an
Irrig
ated
Cro
p &
Past
ures
Pere
nnia
lH
ortic
ultu
reH
ighe
stM
anag
emen
tC
lass
1 Eradication from Region (Red)
2 Destroy Infestations (Orange)
3 Contain Spread (Yellow)
4 Protect Sites (Green)
5 Manage Weed (Light Blue)
6 Manage Sites (Dark Blue)
7 Monitor (Purple)
8 No Action (Grey)
Black rat Rattus rattus 5 4 5 5 4 5 4Brown rat Rattus norvegicus 3 5 3 3Cat Felis catus 5 5 5Carp Cyprinus carpio 3 3Carp gudgeon Hypseleotris compressa 5 5Chital (axis) deer,Rusa, Sambar
Axis axis, Cervus timorensis,Cervus unicolor 2 5 2 4 2 7 2
Common starling Sturnus vulgaris 5 5 5 5
Dingo/ Wild DogCanis lupus dingo/ Canis lupusfamiliaris 1 3 3 2 1
Domestic pigeon Columba livia 5 5European rabbit Oryctolagus cuniculus 5 5 3 5 5 5 6 3European hare Lepus europaeus 6 6 6 6 8 6 6 6Eurasian blackbird Turdus merula 6 5 5 5Fallow deer Dama dama 4 5 3 6 4 8 3Goat Capra hircus 2 2 1 2 2 4 1Goldfish Carassius auratus 4 4Gambusia Gambusia holbrooki 5 5House mouse Mus musculus 5 5 5 6 5 5Hog deer Axis porcinus 3 8 3 4 3 7 2Marron Cherax cainii 4 4Mallard Anas platyrhynchos 8 2 1Red fox Vulpes vulpes 5 5 5 5 5 5 5Redfin Perca fluviatilis 5 5Trout 5 5Tench Tinca tinca 6 6Wapiti & Red deer Cervus canadensis & elaphus 4 5 2 6 4 8 2

SOUTH EAST PEST MANAGEMENT PLAN – PART 2PEST RISK ASSESSMENT
90
5 ALERT LIST
Table 5.1 lists alert species which are pest plants and pest animals that may pose a threatto primary industries and biodiversity in the South East region. These species are notpresent in the region but from investigations into their biology and ecology they may besuited to the South East region, thus they are automatically categorised into the highestmanagement action of the risk assessment process. The following points are guidingprinciples for alert species:
• Prevention of entry to region• The removal of any pest species that may enter the region• Investigations into reported sightings of the pest and detailed surveillance and
mapping to locate all populations• Destruction of all populations including juveniles
Table 5.1 Alert speciesDeclared SpeciesManagement Action Pest plants Pest animals
Non declaredspecies
Alert ListSpecies that are notknown to be presentin the region andwhich represent asignificant threat.Aims to prevent thespecies arriving andestablishing in themanagement area
AlismaAlligator weedArrowheadAzzarolaBroadkernel espartilloBroomrapeCabombaCalomba daisyCane needlegrassChilean needlegrassCoolatai grassElodeaEurasian watermilfoilHorsetailHydrocotyleLagarosiphonLeafy elodeaMexican feathergrassNightstockPheasant's eyePlumerilloPoison buttercupPrimrose willowRagwortRhus treeSagittariaSalviniaSenegal tea plantSerrated tussockTexas needlegrassWater caltropWater dropwortWater hyacinthWater soldier
Cane toadCommon mynaFeral pigHouse crowIndian ringneckLaughing doveRed-eared sliderRed-whiskeredbulbulSong thrushTree sparrowWater buffalo
Blue mustardParrot’s featherWater primrose

SOUTH EAST PEST MANAGEMENT PLAN – PART 2PEST RISK ASSESSMENT
91
6 PRIORITY PEST PLANT AND PEST ANIMAL SPECIES
In a regional context the highest management action is applied to the pest plant and pestanimal species to achieve the best possible outcome of control for all land uses. In table6.1 a list of the priority agricultural and environmental pest plants and pest animals isshown.
Table 6.1 Priority pest plant and pest animal list
Environmental AgriculturalClass
Priority pest plants Priority pestanimals
Priority pest plants Priority pestanimalsEradicate
from region Bridal veil Dingo/ Wild dog Golden dodder Dingo/ Wild dogGoat
DestroyInfestations
Asparagus fernWestern CapeBridal CreeperPampas grass
GoatMallard
BlackberryInnocent weedKhaki weedSilverleafnightshade
ContainSpread
Aleppo pineBlackberryBluebell creeperBoneseedDolichos peaEricaGorseRadiata pine
African feathergrassBathurst burrCaltropCape tulipCreeping knapweedGorseHoary CressSalvation JaneThree corner jackThree hornedbedstraw
Deer (all species)Rabbit
6.1.1 Regional prioritiesIt is important to remember that the resulting list of high priority pest plants and pestanimals described through this assessment have been determined at the regional scale.This context may result in the exclusion of some pest plants and animals that are a highpriority at the local level. Local priorities can still be addressed as policies can recogniselocal issues among regional priorities.
The assessment procedure compares the threat of the pest plants and pest animals to thefeasibility of controlling them. This process has resulted in some species that manypeople consider to be a high priority or have serious impact, to not make it to the prioritylist. Bridal creeper is a good example of this. Whilst Bridal creeper poses a very high riskto the environment and some primary industries it is simply not feasible to undertakecontrol at a regional scale. This can be due to a number of reasons such as the cost ofcontrol techniques, the accessibility to populations and the current high distribution acrossthe region. Control techniques as outlined in the management actions should be aimed atprotecting key assets and using integrated control techniques such as biological controlagents.
Foxes are an example of a pest animal that presents a very high risk to primary industryand native vegetation, but it is simply not feasible to undertake eradication actions at theregional scale. This can be due to a number of reasons such as the cost of controltechniques, the accessibility to populations, the current high distribution across the regionand a foxes’ ability to avoid detection.

SOUTH EAST PEST MANAGEMENT PLAN – PART 2PEST RISK ASSESSMENT
92
7 DISCUSSION
7.1 CONFLICT OF INTERESTThere are a number of conflicts of interests for pest plant and pest animal species acrossland uses. What is grown as a production/ agricultural species in one land use may be asignificant pest plant or pest animal in another land use. For example, Radiata pine is themajor forestry species in the South East but is a high priority weed in native vegetation.The same applies to Veldt grass, Tall wheat grass and Phalaris. All were planted aspasture grasses but now threaten native vegetation. The feasibility to control thesegrasses is very low due to their extensive distribution across the region, hence resulting ina lower priority for control despite the high level of risk they present.
Bracken fern and Coastal wattle have been listed in several land uses as pest plants. Theconflict here is that both species are locally-indigenous native plants, and as such areprotected by the Native Vegetation Act 1991 which prevents clearance without a permit,except in certain circumstances. This report does not condone the unlimited control ofBracken fern or Coastal wattle across all land uses. Each situation must be assessed andit is recommended that land managers seek the advice of the Native Vegetation Councilbefore undertaking any control measures.
There are a number of conflicts of interests for pest animal species across land uses.What is farmed as a livestock species, or kept as a pet may become a pest if uncontrolled.For example deer are farmed for their meat, velvet and sometimes kept as pets but if notcontrolled appropriately i.e. behind adequate fencing they can escape into the wild andbecome a pest across multiple land uses in the region.
7.2 LIMITATIONS AND INTERPRETATION OF RISK ASSESSMENT RESULTS
The outcomes of the procedure should be regarded as the minimum level ofmanagement that should be applied at the regional level. If a higher accuracy of prioritiesis required, the risk assessment process may be undertaken at a smaller scale (e.g. sub-regional NRM group level), if data permits. In this case, local level plans and policies mayidentify the need for higher levels of management due to specific local circumstances.
The pest plant and pest animal risk assessment distribution results reported in this planare based on data obtained from regional Authorised Officers. From the local datacollected, averages were calculated allowing each pest plant and pest animal to beassessed in a regional context.
The prioritisation of pest plant and animal species utilising the risk assessment model islimited by the lack of readily available information on distribution, species characteristicsand best practice management actions. These are common knowledge gaps (not limitedto the SE NRM region) and highlight the need for improvements in ongoing mapping andmonitoring of pest plant and animal species, research into biological and ecologicalcharacteristics and the communication and refinement of current best practicemanagement options.
Fresh water fish were assessed in this project, although the vertebrate pest riskassessment was not designed for their assessment. The results obtained from theassessment were seen to be creditable from various professionals, therefore have beenreported in this plan.
Invertebrates are not currently included within the scope of this project. At the time of thisproject, risk assessments were being developed for invertebrate species.

SOUTH EAST PEST MANAGEMENT PLAN – PART 2PEST RISK ASSESSMENT
93
8 RECOMMENDATIONS
The results of this project are a thoroughly assessed regional summary of pest plant andpest animal recommended management actions. All stakeholders considering targetedpest plant and animal control activities and determining priorities for on-ground works canuse these results. It is anticipated that this report will provide the background informationfor determining the regional pest plant and animal policies of the South East NaturalResources Management Board.
Interpreting this pest plant and pest animal management information for policydevelopment will require consideration of a much broader range of issues. For this reasonit is recommended that users of this report consult an Authorised Officer for specific localcontext information.
The management actions recommended within the matrices should not be taken literallyfor every situation, however they provide solid guiding principles for the effectivemanagement of pest plant and animal species within the region. Other information to beconsidered when deciding on management actions should include, although not limited to,the current distribution of the pest plant and animal, local issues such as climaticconditions e.g. drought, the proximity to other land uses which may be affected and theresources available to undertake control activities.
In a native vegetation context the species based approach (that the weed risk assessment(WRA) process uses) while useful in some instances (e.g. Bridal Veil), is not commonlyused by agencies to prioritise regional environmental works programs. The asset basedapproach (eg. E-Weed MAT) that protects biodiversity at the site or patch scale is moreoften used for prioritising limited resources for the protection of biodiversity assets in ahighly fragmented landscape. Each method has its place - particularly as the asset basedapproach often means working on species to protect high priority patches against invasiveweeds (e.g. Bridal creeper) that the WRA gives the impression of being a low priority foraction in the region.
The pest plant and pest animals on the alert list have not been individually assessed fortheir risk level. As part of Chapter 4 of this strategy a regional incursion management planwill be drafted in consultation with SE NRM Board staff to determine the risk level of pestplants and animals that are currently not present in the region and develop a responsestrategy for potential introduction of new pest plant and animal species.
Current pest plant and animal control programs are briefly mentioned in this report. Athorough summary of such activities should be compared against the results of this pestplant and animal assessment to determine gaps in control programs for the highestpriority species. The key action areas to consider during this review include:
• Education and awareness campaigns• Investment in on-ground works• Research into control methods• Enforcement of pest plant and pest animal control legislation
As further knowledge concerning an individual species’ attributes such as the biology,ecology, control methods, current/potential distribution and climate change influencesbecome known, they can be easily fed into the risk assessment model and assist instrengthening and refining the management actions. It is therefore suggested that theassessment is reviewed on a minimum 3-5 yearly basis.

SOUTH EAST PEST MANAGEMENT PLAN – PART 2PEST RISK ASSESSMENT
94
9 REFERENCES
Anderson, N., Drew, J., and Virtue, J. (2005). South East Weed Risk Assessment: A riskassessment of agricultural and environmental weeds species in the South East of SouthAustralia, Primary Industries and Resources South Australia.
Caughley, J., Bomford, M., Parker, B., Sinclair, R., Griffiths, J. and Kelly, D. (1998).Managing Vertebrate Pests: Rodents. Bureau of Rural Sciences, Canberra.
Choquenot, D., McIlroy, J. and Korn, T. (1996). Managing Vertebrate Pests: Feral Pigs.Bureau of Rural Sciences, Canberra.
Department of Water Land and Biodiversity Conservation, (2008). South Australian PestRisk Assessment Guide.
Distribution Maps of Exotic Animals in South Australia DWLBC (2007), available onlinehttp://www.dwlbc.sa.gov.au/biodiversity/pests/distribution.html
Feral.org .au - http://www.feral.org.au/
Gong, W., Sinden, J., Braysher, M. and Jones, R. (2009). The economic impacts ofvertebrate pests in Australia. Invasive animals Cooperative Research Centre, Canberra.
Key threatening processes are listed at:http://www.deh.gov.au/biodiversity/threatened/ktp/index.html
Laut, P., Heyligers, P.C., Keig, G., Loffler, E., Margules, C.,Scott, R.M., and Sullivan, M.,E. (1977). Environments of South Australia, Province 4: Eyre and Yorke Peninsulas.CSIRO, Division of Land Use Research, Canberra.
McLeod, R. (2004). Counting the Cost: Impact of Invasive Animals in Australia 2004.Cooperative Research Centre for Pest Animal Control. Canberra.
Parkes, J., Henzell, R. and Pickles, G. (1996). Managing Vertebrate Pests: Feral Goats.Bureau of Rural Sciences, Canberra.
Pizzey, G. and Knight, F. (1997). Field Guide to the Birds of Australia. Angus andRobertson, Sydney.
Saunders, G., Coman, B., Kinnear, J. and Braysher, M. (1995). Managing VertebratePests: Foxes. Bureau of Rural Sciences, Canberra.
Sinden, J., Jones, R., Hester, S., Odom, D., Kalisch, C., James, R. and Cacho, O. (2004).The economic impact of weeds in Australia. Weeds Cooperative Research Centre,Adelaide.
Threat abatement plans are listed at:http://www.deh.gov.au/biodiversity/threatened/tap/index.html
Williams, K., Parer, I. Coman, B., Burley, J. and Braysher, M. (1995). ManagingVertebrate Pests: Rabbits. Bureau of Rural Sciences, Canberra.

95
APPENDIX 1
SA WEED RISK MANAGEMENT GUIDEFebruary 2008
Copyright © 2008, Department of Water Land & Biodiversity Conservation
INTRODUCTION
The SA Weed Risk Management System was developed by the Animal and Plant ControlCommission, in cooperation with Animal and Plant Control Boards, to help in prioritising weeds forcontrol programs. A series of questions are answered to compare the relative risk and feasibility ofcontrol of different weeds. Weeds are assessed separately for various land uses, so that the mostimportant weeds of different land uses can be identified.
The System was originally devised for Animal & Plant Control Boards in South Australia (nowintegrated into Natural Resource Management Boards). However, it can be broadly applied tomany geographic scales (replace the term ‘Board’ with a more relevant one) and for any land use.
Use this guide when filling out the accompanying scoresheet. The questions can apply to any typeof weed in any land use. There may be questions where you don't know the answer for a certainweed, especially if it is not present in your area. In such cases choose the "don't know" option, andseek opinions from others (e.g. landholders, advisers, other Boards, researchers). "Don't know" istreated as a "0" for the Comparative Weed Risk scoring and gets a maximum score for theFeasibility of Containment scoring. This avoids bias against weeds which have a score for allquestions. However, weeds which have one or more questions answered as "don't know" areindicated as such at their final score. Sharing information and scores is the key to building upknowledge and getting the most out of the SA Weed Risk Management System. Answeringquestions as a group is better than individually. It’s particularly important to get consensus onassumptions about typical weed control in the land use.
This scoring system is a tool to help in making standard, informed decisions on weed controlpriorities. Comments on the system are welcome for future improvements in its accuracy and easeof use.
Dr John Virtue Weed Ecologist Animal and Plant Control GroupDepartment of Water, Land & Biodiversity ConservationGPO Box 2834 Adelaide SA 5001
Phone: 08 8303 9502Email: [email protected]
See the following references for example uses of the SA Weed Risk Management System:
Virtue, J. G. and Melland, R. L. (2003). The Environmental Weed Risk of Revegetation andForestry Plants. DWLBC Report 2003/02. The Department of Water, Land and BiodiversityConservation. (Available at www.dwlbc.sa.gov.au)
Anderson, N., Drew, J. and Virtue, J. (2005). South East Weed Risk Assessment. LacepedeTatiara Robe Animal & Plant Control Board. For the South East Natural ResourceConsultative Committee. (Available as a pdf file from John Virtue)

96
LAND USESDifferent types of weeds are important in different land uses. For example, annual weeds areproblems in grain crops, and woody weeds are problems in native vegetation. If you were tocompare the risk of weeds of different land uses, then you would also need to compare theimportance of the land uses themselves. This is too difficult to do (i.e. you need $/ha values foreach land use). An easier approach is to compare weeds within land uses only. Animal and PlantControl/Natural Resource Management Boards can then decide for themselves the amount of timeand resources devoted to protecting each land use from weeds.
The following land uses are suggested:
1. Aquatic (Permanent water bodies. e.g. rivers, swamps, canals, lakes, estuaries)
2. Crop/Pasture rotation (e.g. dryland cereals, pulses, oilseeds, legume pastures, hay)
3. Forestry (e.g. pines, blue gums)
4. Irrigated crops and pastures (e.g. vegetables, lucerne. Prone to summer weeds.)
5. Native vegetation (For nature conservation purposes. Public and private reserves.)
6. Non-arable grazing (Includes permanent pastures and rangelands.)
7. Perennial horticulture (e.g. vineyards, citrus, stonefruits)
8. Urban (e.g. sports fields, parks, footpaths)
Within each Board, land uses will vary in terms of what is grown and howcrops/pastures/vegetation are managed. However, to keep the scoring system relatively simple andto answer at a Board or regional level, it is necessary to think in averages. There are two mainaspects to keep in mind:
(i) Where a weed is only prevalent at certain phases in a land use. For example, thetypical crop/pasture rotation land use in a Board may have cereals, canola, pulses andpasture phases. In answering questions, average the invasiveness and impacts of a weedamongst these four vegetation types. Thus a weed which is only a problem in cereals willscore less than a similar weed which is a problem in all crops and pasture. In the potentialdistribution section these two weeds will get the same score, as they will occupy the samearea.
(ii) Where a weed only occurs in certain parts of a land use. For example, the perennialhorticulture land use in a Board may contain citrus, stonefruit, olives and vines. For a weedwhich only occurs in citrus and vines, average the invasiveness and impacts of a weedamongst these two vegetation types only. Then in the potential distribution section, theweed's score may be reduced because it is not a problem in all perennial horticulture cropsin the Board area.
Decide which land uses apply to your Board. Then decide which weeds cause problems inwhich land uses. There is no need (and it makes little sense) to assess every weed in everyland use. The idea is simply to determine the important weeds of each land use.
Assumptions about a land use can be recorded on the scoresheets.

97
1) COMPARATIVE WEED RISKThe weed risk questions are divided into three main criteria; invasiveness, impacts and potentialdistribution. Invasiveness looks at the weed's rate of spread, faster spreading weeds being ahigher priority for control. Impacts are the economic, environmental and social effects the weedhas. Potential distribution indicates what total area the weed could spread to. Scores for each ofthese criteria are multiplied (each ranging between 0 and 10), to give a weed risk score out of1000.
INVASIVENESS
This section indicates how fast the weed can spread within a particular land use. It takes account ofhow well the weed can establish, reproduce and disperse. Answer all questions with the land use inmind, except for question 5(a).
1. What is the weed’s ability to establish amongst existing plants?SCORE
very high "Seedlings" readily establish within dense vegetation, or amongstthick infestations of other weeds. 3
high "Seedlings" readily establish within more open vegetation, oramongst average infestations of other weeds. 2
medium "Seedlings" mainly establish when there has been moderatedisturbance to existing vegetation, which substantially reducescompetition. This could include intensive grazing, mowing, raking,clearing of trees, temporary floods or summer droughts.
1
low "Seedlings" mainly need bare ground to establish, including removalof stubble/leaf litter. This will occur after major disturbances such ascultivation, overgrazing, hot fires, grading, long-term floods or longdroughts.
0
don't know ?
Ignore any weed control practices for this question. Depending on the land use, "vegetation" maybe crops, pastures, lawns and/or native vegetation. Weeds that invade well-managed land uses(where a dense vegetative cover over soil is maintained) are assumed to be more important. Highscoring weeds would include wild radish, bridal creeper and dodder.
Assume the plant has just arrived. "Seedlings" includes growth from dispersed vegetativepropagules (e.g. broken fragments of couchgrass stems or silverleaf nightshade roots) and spores,in addition to seeds. "Seedlings" does not include new vegetative growth whilst still attached to theparent plant (e.g. by stolons, rhizomes or lateral roots). This feature is accounted for in question3(c).
Features which can help a weed establish amongst existing plants include:• the ability to germinate under the canopy of other plants (e.g. weeds that have staggered
germination in crops)• large seeds or vegetative propagules (e.g. bulbs, root fragments, tubers) provide more reserves
to help the weed establish in competition with other plants• the ability to tolerate or avoid competitive stresses (e.g. by rapid root growth, fixing own
nitrogen, or rapid vertical shoot growth)

98
2. What is the weed's tolerance to average weed management practices in theland use? SCORE
very high Over 95% of weeds survive commonly used weed managementpractices. 3
high More than 50% of weeds survive. 2 medium Less than 50% of weeds survive. 1 low Less than 5% of weeds survive. 0 don't know ?
Assume the weed is new to an area. This question looks at whether the new weed is killed by theweed management practices which are commonly used across the land use. If most are killed thenthere will be few plants to reproduce and spread. If few are killed then changes to weedmanagement practices will eventually be needed. Weed management practices include herbicides,cultivation, cutting/slashing, grazing, and fire. The types and timing of these practices may varywithin land uses (e.g. for cereals and broadleaf crops, or vineyards and citrus), but average these.If a weed grows and seeds when there is normally no weed management (e.g. summer) then it ishighly tolerant of the common weed management practices. Weeds with high tolerance to routineweed management would include silverleaf nightshade (difficult to kill), caltrop (quick to seed), andbroomrape. In native vegetation there may be no commonly used weed management practices at aregional level - if so then include this in your assumptions about the land use.
3. What is the reproductive ability of the weed in the land use? Total(a+b+c) SCORE
(a) Time toseeding (b) Seed set (c) Vegetative
reproduction high 5 or 6 3 1 year 2 high 2 fast 2 medium-high 3 or 4 2 2-3 yrs 1 low 1 slow 1 medium-low 1 or 2 1 >3 yrs/never 0 none 0 none 0 low 0 0 don't know ? don't know ? don't know ? don't know ?
This question looks at how well the weed can reproduce, to rapidly build up its numbers at a site,and to spread quickly to other sites. If a weed never gets to reproduce in a land use then it willscore 0. Three factors are considered in scoring the weed:(a) Time to seeding is the time from establishment (from seed or vegetative propagule) to seed
production.(b) Consider seed set as the average number of viable seed produced per square metre of ground
per year, in a patch of the weed. This may be from one large weed (e.g. a tree) or many smallweeds (e.g. grasses). High would be >1000 seeds per m2. Your answer to question 2 mayinfluence seed set.
(c) Consider vegetative reproduction as the average number of new plants produced each year bysuch means as bulbs, bulbils, corms, tubers, rhizomes, stolons, root suckers, root fragmentsand shoot fragments. High would be >10 new plants per year from a mature parent plant. Incertain land uses cultivation may increase vegetative reproduction (e.g. Lincoln weed). "Newplants" are defined as shoots with their own root system. There may still be some connection tothe parent plant (e.g. couchgrass).

99
4. How likely is long-distance dispersal (>100m) by natural means? Total(a+b+c+d) SCORE
(a) Flying birds (b) Other wild animals 6, 7 or 8 3 common 2 common 2 3, 4 or 5 2 occasional 1 occasional 1 1 or 2 1 unlikely 0 unlikely 0 0 0 don't know ? don't know ? ?
(c) Water (d) Wind
common 2 common 2 occasional 1 occasional 1 unlikely 0 unlikely 0 don't know ? don't know ?
This question looks at how well the weed can spread its propagules (seed or vegetative) by naturalmeans, to start new weed outbreaks a long distance from the original outbreak. Weeds which havemore means of dispersal tend to spread faster. Consider if a weed is adapted for long-distancedispersal by any of the above means, and how regularly these means of dispersal occur. How oftendo you see new outbreaks starting at least 100 metres away from an original infestation?
Features favouring long-distance dispersal by flying birds and other wild animals (e.g. foxes,kangaroos, rabbits, emus) are:• whole fruits are eaten, and viable seeds are then defecated or regurgitated (e.g. olives, sweet
briar)• propagules have hooks, barbs or sticky substances that attach to feathers, hairs or skin (e.g.
horehound, brome grass)• very small seeds which can lodge within feathers, hairs or feet (e.g. nutgrass)
Features favouring long-distance water dispersal are:• propagules which float (consider wind-assisted movement as water dispersal)• weeds located in or near to moving water• frequent floodsMainly aquatic weeds such as salvinia and seeding willows would be commonly dispersed over100m by water movement.
Research has shown that seeds of most wind dispersed weeds actually land close to the parentplants. Long-distance dispersal is more likely to be common for tall trees with light seeds (withwings, plumes or hairs) which are subject to frequent strong winds, and for weeds which snap offafter fruiting and roll across sparsely-vegetated ground (e.g. wild turnip, serrated tussock).
5. How likely is long-distance dispersal (>100m) by human means? Total(a+b+c+d) SCORE
(a) Deliberate spread by people (b) Accidentally by people andvehicles 6, 7 or 8 3
common 2 common 2 3, 4 or 5 2 occasional 1 occasional 1 1 or 2 1 unlikely 0 unlikely 0 0 0 don't know ? don't know ? ?
(c) Contaminated produce (d) Domestic/farm animals
common 2 common 2 occasional 1 occasional 1 unlikely 0 unlikely 0 don't know ? don't know ?
This question looks at how well the weed can spread its propagules (seed or vegetative) byhuman-influenced means, to start new weed outbreaks a long distance from the original outbreak.Weeds which have more means of dispersal tend to spread faster. Consider if a weed is adapted

100
for long-distance dispersal by any of the above means, and how regularly these means of dispersaloccur. How often do you see new outbreaks starting at least 100 metres away from an originalinfestation?
Deliberate human spread includes weeds which have been planted for use in agriculture, forestry,horticulture, amenity, windbreaks and/or soil protection. Those which are or have been widelyplanted have greater potential for dispersal due to many introduction points. Ignore the land usefor this question. Examples include olives, African lovegrass and Aleppo pine. Deliberate humanspread also includes weeds with attractive flowers which are picked and then discarded (e.g.Calomba daisy, cape tulip). A weed may be legally restricted from sale, but is it still planted?
Features favouring accidental people and vehicle dispersal are:• weeds which grow in heavily trafficked areas, such that transport by footwear, clothing or
vehicles (including farm machinery and boats) may occur• weeds which are dragged by farm machinery (e.g. silverleaf nightshade)• propagules have hooks, barbs, or sticky substances to attach to objects (e.g. caltrop)• very small propagules which can lodge in cracks in footwear, clothing or vehicles (e.g. Lincoln
weed)
For contaminated produce consider crop seed, pasture seed, hay, soil, gravel, fertilisers, manures,and/or mulch. Examples of weeds which may be commonly spread by such means include bifora,salvation Jane, and soursob. Do not consider wool as this relates to the sale of farm animalsbetween properties, which is covered in (d).
Features favouring dispersal by domestic/farm animals (e.g. sheep, cattle, horses, dogs) are:• whole fruits are eaten, and viable seeds are then defecated or regurgitated (e.g. cutleaf
mignonette, charlock)• propagules have hooks, barbs or sticky substances that attach to feathers, hairs or skin (e.g.
horehound, brome grass)• very small seeds which can lodge within feathers, hairs or feet (e.g. nutgrass)

101
IMPACTSThis section indicates the potential impacts the weed has. Each question is answered with a landuse in mind. Assume that the weed has spread across a whole paddock, orchard, plantation,nature reserve or water body, and that commonly-used weed management practices have notbeen changed to specifically target the weed. If the weed is well-controlled by these commonpractices then it will occur at a low density and will have minimal impacts. Alternatively, if the weedis poorly controlled by these common practices then it may get to a high density and havesubstantial impacts. If the weed has an effective biocontrol agent established which substantiallyreduces its growth then the weed's impacts will be reduced. Decide if the weed is likely to reacha low, medium or high density in the land use.
1. Does the weed reduce the establishment of desired plants?SCORE
>50% reduction The weed stops the establishment of more than 50% of desired plants(e.g. regenerating pasture, sown crops, planted trees, regeneratingnative vegetation), by preventing germination and/or killing seedlings.
3
10-50% reduction The weed stops the establishment of between 10% and 50% ofdesired plants. 2
<10% reduction The weed stops the establishment of less than 10% of desired plants. 1 none The weed does not affect the germination and seedling survival of
desired plants. 0
don't know ?
This question looks at whether the weed prevents the establishment of desired plants, so thedensity of these plants is reduced. The weed may prevent germination by dense shading, or byforming physical barriers to water movement into the soil. The weed may kill seedlings by denyingthem access to soil moisture, sunlight and nutrients.
Note that the desired plants may mainly establish after a major disturbance (e.g. cultivation prior toplanting, bushfire), so the weed itself may also be establishing. In these cases does the weedactually have a major effect?
Weeds which are likely to cause over 50% reductions in establishment are gorse and early-germinating (and unsprayed) salvation Jane in pastures, and phlaris and watsonia in nativevegetation.
2. Does the weed reduce the yield or amount of desired vegetation?
SCORE >50% reduction The weed reduces crop, pasture or forestry yield, or the amount of
mature native vegetation by over 50%. 4
25-50% reduction The weed reduces yield or amount of desired vegetation bybetween 25% and 50%. 3
10-25% reduction The weed reduces yield or amount of desired vegetation bybetween 10% and 25%. 2
<10% reduction The weed reduces yield or amount of desired vegetation by up to 10%. 1 none The weed has no effect on growth of the desired vegetation. Or the
weed may become desirable vegetation at certain times of year(e.g. providing useful summer feed), which balances out itsreduction in the growth of other desirable plants.
0
don't know ?
This question looks at the degree of yield loss (in crops, pastures, forestry) or suppression (inmature native vegetation) caused by the weed. It follows on from question 1, and looks at thegrowth achieved by plants which did establish despite the weed. The question is answered on aper hectare basis, in comparison to similar vegetation which is free of the weed. For nativevegetation it may be useful to think in terms of percentage cover.
Weeds will reduce growth of other plants by competing for sunlight, water and nutrients.Competition is greater where a weed is larger (e.g. tall with a dense leaf canopy and an extensive

102
root system) and grows at the same time as the desirable plants. Some weeds also compete byforming physical barriers which stop plants growing to reach light, water and/or nutrients (e.g. tubermat of bridal creeper). A special case are parasitic weeds which directly attack other plants. Weedswhich could cause >50% reductions in the yield/amount of desired vegetation would include Allepopines, serrated tussock and branched broomrape.
Some weeds may increase the amount of useful vegetation in a land use. For example, does aperennial weed of grazing land provide nutritious summer feed, thus increasing total pastureavailable throughout the year?
3. Does the weed reduce the quality of products or services obtained from the landuse?
SCORE high The weed severely reduces product quality such that it cannot be sold.
This may be due to severe contamination, toxicity, tainting and/orabnormalities (chemical and/or physical). For native vegetation, theweed severely reduces biodiversity (plants and animals) such that it isnot suitable for nature conservation and/or nature-based tourism. Forurban areas, the weed causes severe structural damage to physicalinfrastructure such as buildings, roads and footpaths.
3
medium The weed substantially reduces product quality such that it is sold at amuch lower price for a low grade use. For native vegetation, the weedsubstantially reduces biodiversity such that it is given lower priority fornature conservation and/or nature-based tourism. For urban areas, theweed causes some structural damage to physical infrastructure such asbuildings, roads and footpaths.
2
low The weed slightly reduces product quality, lowering its price but stillpassing as first grade product. For native vegetation, the weed has onlymarginal effects on biodiversity but is visually obvious and degrades thenatural appearance of the landscape. For urban areas, the weed causesnegligible structural damage, but reduces the aesthetics of an areathrough untidy visual appearance and/or unpleasant odour.
1
none The weed does not effect the quality of products or services. 0 don't know ?
This question looks at whether the weed effects the quality of products or services obtained
from a land use. Products affected by the weed may include meat, grain/seed, milk, wool,
timber, fruit, hay, and/or water. For native vegetation, consider services such as nature
conservation and tourism. An example of a high effect on quality is dodder preventing the sale
of seed crops. Reduction in stock condition/liveweight should not be considered here - this is
due to either a reduction in available feed (question 2) or animal health effects caused by
eating the weed (question 5).
For this question, ignore a weed’s proclamation status with regard to moving contaminated producein South Australia, but do consider noxious weed lists and seed quality standards of other states orcountries. This prevents bias against non-proclaimed weeds when comparing them to existingproclaimed plants.

103
4. Does the weed restrict the physical movement of people, animals, vehicles,machinery and/or water?
SCORE high Weed infestations are impenetrable throughout the year, preventing the
physical movement of people, animals, vehicles, machinery and/orwater.
3
medium Weed infestations are rarely impenetrable, but do significantly slow thephysical movement of people, animals, vehicles, machinery and/or waterthroughout the year.
2
low Weed infestations are never impenetrable, but do significantly slow thephysical movement of people, animals, vehicles, machinery and/or waterat certain times of the year or provide a minor obstruction throughout theyear.
1
none The weed has no effect on physical movement. 0 don't know ?
This question looks at the degree to which a dense infestation of the weed physically restrictsmovement. Weeds may restrict movement by being tall, thorny, tangled and/or dense. For thisquestion, ignore any deliberate restrictions on movement aimed solely at limiting the spread ofweed propagules.
Examples of weed limits on movement include:• slowing of stock mustering• blockages of farm machinery at crop sowing and/or harvesting• tyre punctures• slowing of water flow in irrigation systems• interference with boat access• interference with thinning operations in forestry• preventing stock access to pasture and/or water• preventing animal access to nesting sites
Weeds which would score highly include blackberry and gorse at high densities, formingimpenetrable thickets.
5. Does the weed affect the health of animals and/or people?SCORE
high The weed is highly toxic and frequently causes death and/or severeillness in people, stock, and/or native animals. 3
medium The weed occasionally causes significant physical injuries (due to spinesor barbs) and/or significant illness (chronic poisoning, strong allergies) inpeople, stock, and/or native animals, occasionally resulting in death.
2
low The weed can cause slight physical injuries or mild illness in people,stock, and/or native animals, with no lasting effects. 1
none The weed does not affect the health of animals or people. 0 don't know ?
This question looks at how the weed affects the health of animals (domestic stock and native) andpeople. Note that if a weed is toxic but is not palatable then it may not actually be grazed. Ignoreany starvation effects from reduced growth of pasture or reduced access to pasture, as these havebeen covered in questions 2 and 4. A weed with high effects on health would be poison ivy.

104
6. Does the weed have major, positive or negative effects on environmental health? major positive
effect major negative
effect minor orno effect
don'tknow
scoring for (a) - (f): −1 1 0 ?
(a) food/shelter ? Examples of negative effects are blackberry harbouring rabbits andgrass weeds hosting wheat root diseases. An example positiveeffect is boxthorn providing stock shelter. Ignore pasture forlivestock as this was covered in question 2.
(b) fire regime? This includes changes to the normal frequency, intensity, and/ortiming of fires. Examples of weeds having major effects includeexotic grasses invading shrubby native vegetation.
(c) increase nutrient levels? For example, legumes can increase soil nitrogen. This may makenative vegetation more prone to invasion by other weeds, but wouldbe beneficial in agriculture. Ignore competition for nutrients(decreased nutrient levels) as this was covered indirectly inquestion 2.
(d) soil salinity? Are the leaves of the weed high in salt? Leaf decomposition mayincrease salinity at the soil surface. Example plants are iceplantand tamarix.
(e) soil stability? Does the weed increase soil erosion, or silting of waterways?(f) soil water table? Does the weed substantially raise or lower the soil water table
compared to other plants present? Is this positive or negative?Ignore competition for water as this was covered in question 2.
Total (a + b + c + d + e + f) >3 2 or 3 1 0 or less
SCORE FOR 6. 3 2 1 0
This question looks at whether the weed has major, long-term effects on a land use's environment.These effects may be beneficial or detrimental. Effects are more likely where the weedsubstantially changes the vegetation structure, such as woody weed invasion of grassland.Decisions on major effects should be well-known (e.g. backed up by scientific studies or expertopinion).
POTENTIAL DISTRIBUTIONThis section looks at what proportion of a land use is at risk from the weed in question. This willdepend on the climate and soil preferences of the weed. For example, some weeds may only besuited to higher rainfall areas of a Board, or only be a problem on alkaline soils. Differences withinthe land use also need to be considered. For example in the perennial horticulture land use, aweed may be a problem in citrus but not occur in vineyards. This score should also be based onwhere the weed will grow at the density you assumed in scoring Impacts. That is, if you assumed ahigh density in scoring impacts then ignore areas where the weed would only persist at a lowdensity when determining potential distribution
This question is best answered with topographic, land use and soil maps for the Board area. Thesecan be analysed electronically using a GIS system such as ArcView, or done on paper maps. Dataand maps can be obtained from PIRSA. If using maps the following steps will help in estimating thepercentage area of a land use that is suitable for the weed:
1. Map the land use in your Board. If you do not have a land use map, you could shade areas onclear plastic laid over topographic maps.
2. Consider the climatic and soil preferences of the weed, and the vegetation/crop/pasture typeswithin the land use to which the weed is suited. Lay a sheet of plastic over the land use map,and shade the areas of the land use which are suitable for the weed.

105
3. Compare the weed's map to the land use map to estimate the percentage of the land usewhich is suitable for the weed. Answer as follows:
In the Board, what percentage area of the land use is suitable for the weed?SCORE
> 80% ofland use
The weed has a potential to spread to more than 80% of the land use inthe Board. 10
60-80% ofland use
The weed has a potential to spread to between 60% and 80% of the landuse in the Board. 8
40-60% ofland use
The weed has a potential to spread to between 40% and 60% of the landuse in the Board. 6
20-40% ofland use
The weed has a potential to spread to between 20% and 40% of the landuse in the Board. 4
10-20% ofland use
The weed has a potential to spread to between 10% and 20% of the landuse in the Board. 2
5-10% ofland use
The weed has a potential to spread to between 5% and 10% of the landuse in the Board. 1
1-5% ofland use
The weed has a potential to spread to between 1% and 5% of the landuse in the Board. 0.5
unsuited toland use
The weed is not suited to growing in any part of the land use in theBoard. 0
don't know ?

106
COMPARATIVE WEED RISK SCOREThe score for weed risk is calculated by adjusting the invasiveness, impacts and potentialdistribution scores to range from 0 to 10, and then multiplying these. Weed risk will have amaximum of 1000, and a minimum of 0. The spreadsheet does this for you.
Splitting up these possible scores into bands of 20% gives cutoffs for classes of weed risk:
Frequency BandWeed Risk Score Weed Risk
Do not compare scores between land uses. Land uses differ in their value and this is hard tomeasure. Also, average weed risk scores may be lower in agricultural land uses compared to otherland uses. This is simply because of the greater level of weed management in agriculture. It doesnot mean that agricultural weeds are less important.
80 - 100% (top 20% of possible scores) 192+ Very high
60 - 80% < 192 High
40 - 60% < 101 Medium
20 - 40% < 39 Low
0 - 20% (bottom 20% of possible scores) < 13 Negligible
To calculate manually, adjust the raw scores as follows:
Invasiveness: Divide by 15 and multiply by 10. Round off to one decimal place.
Impacts: Divide by 19, and multiply by 10. Round off to one decimal place.
Potential distribution: Leave unchanged.
Comparative Weed Risk = Invasiveness × Impacts × Potential distribution
Why multiply the invasiveness, impacts and potential distribution scores?
• Multiplying gives a greater spread in the scores than adding (i.e. range from 0-1000 compared to 0-30).
• Multiplying is logical, as it recognises the interactions between the criteria. Say the impacts of a weed can be measured indollars per hectare per year, the potential distribution is known in hectares, and the invasiveness (i.e. rate of spread) ismeasured in terms of the increase in hectares compared to the previous year:
Impact × Potential Distribution × Invasiveness
$ / hectares / year hectares hectares(current year) / hectares (previous year)
When multiplying, all of the hectares units cancel so that weed importance is measured in total dollars per year. In multiplying theinvasiveness, impacts and potential distribution criteria scores, we are mimicking the above calculation, without having the actualdollar and hectare figures.

107
2) FEASIBILITY OF CONTAINMENTThe feasibility of containment questions are divided into three main criteria; control costs, currentdistribution and persistence. Control costs considers the weed management costs of detection,on-ground control and enforcement/education needs. Current distribution considers howwidespread the weed is. Persistence refers to the expected duration of control works. Scores foreach of these criteria are multiplied (each ranging between 0 and 10), to give a feasibility score outof 1000.
Assess feasibility for the land use at risk, so that its score can be directly compared to the weedrisk score from the same land use to set control priorities.
In the following questions higher scores indicate lower feasibility of containment.
CONTROL COSTSThis section indicates the control cost per hectare in the first year of targeted control, for aninfestation of the weed that has reached its maximum density in the land use at risk. The four maincost factors associated with coordinated control programs are searching for the weed, accessingand treating infestations, and achieving landholder commitment.
1. How detectable is the weed?Total
(a+b+c+d) SCORE
(a) Height at maturity (b) Shoot growth present 7 or 8 3 <0.5 m 2 <4 months 2 5 or 6 2 0.5-2 m 1 4-8 months 1 3 or 4 1 >2 m 0 >8 months 0 0, 1 or 2 0 don't know ? don't know ? ?
(c) Distinguishing features (d) Pre-reproductive height inrelation to other vegetation
non-descript 2 below canopy 2 sometimes distinct 1 similar height 1 always distinct 0 above canopy 0 don't know ? don't know ?
This question indicates the cost of finding infestations of the weed. Parts (a), (b) and (c) relate tofinding new infestations. Part (d) relates to finding and treating plants prior to reproduction.
(a) Taller plants can be spotted from greater distances.
(b) Shoot growth considers when shoots are visible (live or dead). Annuals and some perennials(e.g., bridal creeper, bulbil watsonia) have shoots present for a limited period of the year.
(c) Distinguishing features include appearance and smell of foliage, flowers and fruits. Thisindicates how conspicuous the weed is amongst other vegetation. For example, the shape andfoliage of a pine tree is quite obvious amongst native vegetation.
(d) Pre-reproductive height refers to locating the weed for control prior to seed set or bulbformation. Control must occur before reproduction if local eradication is to occur. The pre-reproductive height will mostly be less than at maturity and the weed will also probably be growingamongst other vegetation. Hence the weed’s height is described relative to the canopy height ofthis other vegetation. For example, if considering a weed of the Crop/Pasture Rotation land usethen the canopy will be the height of the crop.

108
What is general accessibility of known infestations?SCORE
low Most infestation sites difficult to access 2 medium Most infestation sites readily accessible 1 high All infestation sites readily accessible 0 not present Not known to be present in Board 0 don't know ?
Sites may be difficult to traverse due to slope, rockiness, dense vegetation and/or surface water.This will slow down searching and control activities. There may be seasonal differences inaccessibility (e.g. winter waterlogging), but answer in terms of the optimal search and control timesfor the weed.
2. How expensive is control of the weed, using techniques which both maximiseefficacy and minimise off-target damage? SCORE
(a) Chemicals, fuel and equipmentoperating costs
(b) Labour costs
Total (a+b)
Rangebetween0 and 8
very high 4 very high 4 high 3 high 3 don't know ? medium 2 medium 2 low 1 low 1 not applicable 0 not applicable 0 don't know ? don't know ?
Select a cost category (A, B or C) for the land use being considered. This allows for morerealistic control cost estimates.
Cost Categories
A B C SCORE
Very high >$1000/ha >$500/ha >$100/ha 4High $500-1000/ha $250-500/ha $50-100/ha 3Medium $250-500/ha $100-250/ha $25-50/ha 2Low <$250/ha <$100/ha <$25/ha 1
Herbicides are the main means by which weeds are controlled. Physical control methods may becultivation, cutting/slashing stems or extraction (e.g., boxthorn plucker). Do not consider capitalcosts for purchasing application equipment in this question.
What is the likely level of cooperation from landholders within the land use at risk?SCORE
low Weed control is rarely undertaken in the land use. Cost of control isbeyond the financial and technical capacity of landholders. 2
medium Control of the weed will require a significant change in existingweed management practices, but this will be within the financialand technical capacity of landholders.
1
high Control of the weed will require minimal change in existing weedmanagement practices. 0
don't know ?
Aside from the “on-ground” costs of searching and control, a coordinated control program will haveoverarching costs of extension/education, enforcement, project management and administration.The ease of motivating and coordinating landholders in an ongoing program will vary between landuses, particularly in relation to their financial capacity to support a control program.

109
CURRENT DISTRIBUTIONThis section indicates how widespread the weed currently is within the land use. It considers theproportion of the land use infested, and the overall pattern of infestations.
What percentage area of the land use is currently infested by the weed?SCORE
>80% of land use The weed infests more than 80% of the land use in the Board. 10
60-80% of land use The weed infests between 60% and 80% of the land use. 8
40-60% of land use The weed infests between 40% and 60% of the land use. 6
20-40% of land use The weed infests between 20% and 40% of the land use. 4
10-20% of land use The weed infests between 10% and 20% of the land use. 2
5-10% of land use The weed infests between 5% and 10% of the land use. 1
1-5% of land use The weed infests between 1% and 5% of the land use. 0.5
<1% of land use The weed is present in the land use but infests less than 1%. 0.1
0% of land use butin 20-40% of Board
The weed is not known to be present in the land use but doesinfest between 20% and 40% of the Board area. 2
0% of land use butin 10-20% of Board
The weed is not known to be present in the land use but doesinfest between 10% and 20% of the Board area. 1
0% of land use butin 5-10% Board
The weed is not known to be present in the land use, but doesinfest between 5% and 10% of the Board. 0.5
0% of land use butin 1-5% Board
The weed is not known to be present in the land use, but doesinfest 1-5% of Board. 0.1
0% of land use but<1% of Board
The weed is not known to be present in the land use, but doesinfest <1% of Board. Or the species is not naturalised in theBoard but is cultivated (e.g. olives).
0.05
0% of Board The species is not known to be present in the Board. 0
don't know ?
The aim of containment is to prevent weed spread to a susceptible land use. The greater the areaof land use that is already occupied, then the less feasible is containment. In the above table it isassumed to be highly unlikely that a weed could infest >40% of the Board area and not also bepresent in the land use.
What is the pattern of the weed’s distribution across the Board area?SCORE
widespread The weed occurs in large and small infestations across most ofthe Board area. 2
evenly scattered The weed occurs as discrete, mainly small infestations acrossmuch of the Board area. 1
restricted The weed is localised to 1-2 hundreds of the Board area. Or theweed is not known to be naturalised in the Board area. 0
not present The species is not known to be present in the Board. 0 don't know ?
A weed which is widespread will be more difficult to contain than one which is restricted to a smallsection of the Board. The former will have more landholders potentially exposed to spread of theweed.

110
PERSISTENCEThis section indicates how long it takes to eradicate the weed. It considers the efficacy of targetedcontrol treatments, reproductive age, seedbank longevity and the likelihood of ongoing dispersal.
How effective are targeted control treatments applied to infestations of the weed?
SCORE low More than 25% of weeds survive annual targeted treatment/s. 3 medium Up to 25% of weeds survive annual targeted treatment/s. 2 high Up to 5% of weeds survive annual targeted treatment/s. 1 very high Up to 1% of weeds survive annual targeted treatment/s. 0 don't know ?
Do the herbicide and physical control treatments costed above kill all plants in an infestation?Efficacy can be reduced due to:
• tolerance to or recovery from treatment• incomplete application of a treatment (e.g., some plants receive a sub-lethal dose of herbicide,
missed plants)• vegetative regeneration (e.g. silverleaf nightshade)• “out of season” growth (e.g. early or late germination of annuals)
What is the minimum time period for reproduction of sexual or vegetative propagules?
SCORE <1 month Minimum generation time <1 month. 3 <1 year Minimum generation time 1-12 months. 2 <2 years Minimum generation time 12-24 months. 1 >2 years Minimum generation time >24 months. 0 don't know ?
The shorter the time period to reproduction, the greater the frequency of control treatmentsrequired and the greater the chance of plants being missed prior to reproduction. Aquatic plantssuch as salvinia can have rapid vegetative reproduction.
What is the maximum longevity of sexual or vegetative propagules?SCORE
>5 years Sexual or vegetative propagules can remain dormant for at least 5years. 2
2-5 years Sexual or vegetative propagules can remain dormant for 2-5 years. 1 <2 years Sexual or vegetative propagules remain dormant for less than 2 years. 0 don't know ?
Soil seedbank longevity is the primary determinant of how long an infestation must be treated toachieve eradication.
How likely are new propagules to continue to arrive at control sites, orstart new infestations?
Total (a+b)SCORE
(a) Long-distance dispersal bynatural means
(b) Grown4 3
frequent 2 commonly planted 2 2-3 2 occasional 1 occasionally planted 1 1 1 rare 0 not planted 0 0 0 don't know ? don't know ? don't know ?

111
FEASIBILITY OF CONTAINMENT SCOREThe score for feasibility of containment is calculated by adjusting the control costs, currentdistribution and persistence scores to range from 0 to 10, and then multiplying these. Feasibility ofcontainment will have a maximum of 1000, and a minimum of 0. The spreadsheet does this for you.
Splitting up these possible scores into bands of 20% gives cutoffs for classes of feasibility ofcontainment:Frequency Band Feasibility Score Feasibility of
Containment80 - 100% (top 20% of possible scores) 113+ Negligible
60 - 80% < 113 Low
40 - 60% < 56 Medium
20 - 40% < 31 High
0 - 20% (bottom 20% of possible scores) < 14 Very High
Why multiply the Control Costs, Current Distribution and Duration of Control scores?
• Multiplying gives a greater spread in the scores than adding (i.e. range from 0-1000 compared to 0-30).
• Multiplying is logical, as it recognises the interactions between the criteria. Say the control costs of a weed can be measured indollars per hectare per year, the current distribution is known in hectares, and the duration of control is known in years:
Control Costs × Current Distribution × Duration of Control
$ / hectares / year hectares years
When multiplying, all of the hectares units cancel so that feasibility of control is measured in total dollars. In multiplying the controlcosts, current distribution and duration of control criteria scores, we are mimicking the above calculation, without having the actualdollar and hectare figures.
To calculate manually, adjust the raw scores as follows:
Control costs: Divide by 15 and multiply by 10. Round off to one decimal place.
Current distribution: Divide by 12, and multiply by 10. Round off to one decimal place.
Persistence: Divide by 11, and multiply by 10. Round off to one decimal place.
Feasibility of Containment = Control Costs × Current Distribution × Persistence

112
3) DETERMINING PRIORITIESThe following matrix gives guidance on appropriate strategic, weed management actions. Different weed species will appear in different positions on the matrix,based on their risk and feasibility of containment scoring. Each land use will have a separate matrix.
FEASIBILITY OF CONTAINMENT
WEED RISKNegligible
>113Low>56
Medium>31
High>14
Very High<14
Negligible<13
LIMITED ACTION LIMITED ACTION LIMITED ACTION LIMITED ACTION MONITOR
Low<39
LIMITED ACTION LIMITED ACTION LIMITED ACTION MONITOR MONITOR
Medium<101
MANAGE SITES MANAGE SITES MANAGE SITES PROTECT SITES CONTAIN SPREAD
High<192
MANAGE WEED MANAGE WEED PROTECT SITES CONTAIN SPREADDESTROY
INFESTATIONS
Very High>192
MANAGE WEEDPROTECT SITES
& MANAGE WEEDCONTAIN SPREAD
DESTROYINFESTATIONS
ERADICATE

113
Following are guiding principles for each of the management categories in the matrix. At alandscape scale these principles need to be interpreted in terms of different outcomes per land usefor different weeds. For example, a weed may rank as “destroy infestations” in one land use and“limited action” in others. In this case coordinated control may still be required in the latter landuses to enable protection of the former land use.
The term “management area” can be used below to apply to a range of spatial scales (e.g. NRMBoard, sub-regional, land use)
ALERTSpecies that are not known to be present in the management area and which represent asignificant threat. Such species would score “0” in Feasibility of Containment due to their absence.Aims to prevent the species arriving and establishing in the management area
• Prevention of entry to management area• Ongoing surveillance for incursions of the species (e.g. nursery inspections)• Training and awareness activities for the community to enable early detection
ERADICATEAims to remove the weed species from the management area
• Detailed surveillance and mapping to locate all infestations• Destruction of all infestations including seedbanks• Prevention of entry to management area and movement and sale within• Must not grow and all cultivated plants to be removed• Monitor progress towards eradication
DESTROY INFESTATIONSAims to significantly reduce the extent of the weed species in the management area
• Detailed surveillance and mapping to locate all infestations• Destruction of all infestations, aiming for local eradication at feasible sites• Prevention of entry to management area and movement and sale within• Must not grow• Monitor progress towards reduction
CONTAIN SPREADAims to prevent the ongoing spread of the weed species in the management area
• Surveillance and mapping to locate all infested properties• Control of all infestations, aiming for a significant reduction in weed density• Prevention of entry to management area and movement and sale within• Must not allow to spread from cultivated plants (if grown)• Monitor change in current distribution
PROTECT SITESAims to prevent spread of the weed species to key sites/assets of high economic, environmentaland/or social value
• Weed may be of limited current distribution but only threatens limited industries/habitats(lower weed risk). Or the weed may be more widespread but is yet to invade/impact uponmany key industries/habitats (higher weed risk).
• Surveillance and mapping to locate all infested areas• Identification of key sites/assets in the management area• Control of infestations in close proximity to key sites/assets, aiming for a significant
reduction in weed density• Limits on movement and sale of species within management area• Must not allow to spread from cultivated plants (if grown) in close proximity to key
sites/assets• Monitor change in current distribution within and in close proximity to key sites/assets
MANAGE WEEDAims to reduce the overall economic, environmental and/or social impacts of the weed speciesthrough targeted management
• Research and develop integrated weed management (IWM) packages for the species,including herbicides and biological control where feasible
• Promote IWM packages to landholders• Monitor decrease in weed impacts with improved management

114
• Identify key sites/assets in the management area and ensure adequate resourcing tomanage the weed species
MANAGE SITESAims to maintain the overall economic, environmental and/or social value of key sites/assetsthrough improved general weed management
• Promote general IWM principles to landholders, including the range of control techniques,maintaining competitive vegetation/crops/pastures, hygiene and property managementplans.
• Identify key sites/assets in the management area and ensure adequate resourcing tomanage these to maintain their values
• Broaden focus beyond weeds to all threatening processes
MONITORAims to detect any significant changes in the species’ weed risk
• Monitor the spread of the species and review any perceived changes in weediness
LIMITED ACTIONThe weed species would only be targeted for coordinated control in the management area if itslocal presence makes it likely to spread to land uses where it ranks as a higher priority.
• Undertake control measures if required for the benefit of other land uses at risk• Otherwise limited advice to land managers if required

South EastPestManagementStrategyA regional biosecurity plan forthe control of invasive species
Part 2: Pest Management Plan
Containment Zones

SOUTH EAST PEST MANAGEMENT PLAN – PART 2
CONTENTS
1. CONTAINMENT ZONES 3
1.1 How will they be managed? 3
2. CONTAINMENT ZONES OF THE SOUTH EAST 4
2.1 African Boxthorn (Lycium ferocissimum) 4
2.2 African lovegrass (Eragrostis curvula) 5
2.3 False caper (Euphorbia terracina) 6
2.4 Salvation Jane (Echium plantagineum) 7
2.5 Yellow burrweed (Amsinckia spp.) 8

SOUTH EAST PEST MANAGEMENT PLAN – PART 2
3
1. CONTAINMENT ZONES
If it is not feasible to eradicate a particular weed, the best option is to contain it and preventexpansion or new infestations. This can be done by minimising dispersal outside existinginfestations, and by treating new infestations as early as possible.
Containment involves defining the boundary of the existing weed infestation and preventingany spread beyond that line. Within the infested area the weed may not be treated; it mayeven become more dominant. This goal is most suitable when there are severe difficulties inattempting to treat the main part of the infestation. It may simply be too large for the resourcesavailable, the weed may be very difficult to kill or some obstacle such as steep banks mayprevent access.
However, there is also a role for containment at finer scales. This would involve actions atNRM group, property and paddock levels that depend on the fact that weeds are unevenlydistributed at these scales. The value of attempting to contain weeds at these finer scalesdepends upon modes and rates of spread and rates of population increase.
Large areas of land can easily be protected by taking care in moving animals, machinery, andproduce (fodder, seed etc) from infested areas to clean areas. Machinery such as slashersshould always be cleaned before being moved into weed-free areas. Feeding produce to stockin a confined area ensures that any weeds present are restricted to that area and not spreadthroughout the property. Stock brought onto a property for the first time should be placed in aconfined area for a week or so; this ensures any viable weed seeds in their digestive tracts areexpelled, minimising the spread of weed seeds. (See weed spread pathways section for moreinformation)
A critical factor in any containment program is the location of containment lines or boundaries.Land managers must consider where the weed species is present or absent, abundant oruncommon, and exploit features of the landscape that form natural barriers.
1.1 HOW WILL THEY BE MANAGED?The containment lines identified in this report will be used as part of the South East NaturalResources Management Board program to limit the spread of weed species. This programwill be implemented as part of the inspection and control program of the board and as part ofthe implementation of the Pest Management Strategy, this document is part of. This programis dependent on the cooperation of land managers in the control of declared pest plants ontheir properties and the enforcement of the SE NRM board weed policies.

SOUTH EAST PEST MANAGEMENT PLAN – PART 2
4
CONTAINMENT ZONES OF THE SOUTH EAST
This section shows containment lines for a number of weed species found in the south east.These weeds are
• African boxthorn,• African lovegrass,• False caper,• Salvation Jane and• Yellow burrweed.
1.2 AFRICAN BOXTHORN (LYCIUM FEROCISSIMUM)Containment of African boxthorn is to the east of the blue line.

SOUTH EAST PEST MANAGEMENT PLAN – PART 2
5
1.3 AFRICAN LOVEGRASS (ERAGROSTIS CURVULA)
African lovegrass is to be contained in the hundreds of Messent, Field, McNamara, Laffer,Stirling, Archibald, Coombe, Colebactch, Jefries, Strawbridge, Coneybeer, Lewis, Carcuma,Livingston, Kirkpatrick. All outbreaks outside of this containment zones are to be controlled.

SOUTH EAST PEST MANAGEMENT PLAN – PART 2
6
1.4 FALSE CAPER (EUPHORBIA TERRACINA)
False caper containment line is to be limited to the coastal highway in the hundreds of Glyde,Santo, Nevillem Duffield, Lacepede, Mount Benson, Waterhouse, Lake George and RivoliBay. All other infestations of False caper are to be controlled outside of this containmentzone. Areas of high assets are to be protected from the adverse impacts of False Caper

SOUTH EAST PEST MANAGEMENT PLAN – PART 2
7
1.5 SALVATION JANE (ECHIUM PLANTAGINEUM)
Salvation Jane is to be contained in the northern area of the region (north of the blue line).Within the containment zone buffer zones are to be implemented to protect clean neighbours.

SOUTH EAST PEST MANAGEMENT PLAN – PART 2
8
1.6 YELLOW BURRWEED (AMSINCKIA SPP.)
Yellow burrweed is to be contained to the northern part of the region. All infestations south ofthe blue line are to be controlled.

Part 2: Pest Management Plan
Pathways Of Weed Spread
South EastPestManagementStrategyA regional biosecurity plan forthe control of invasive species

SOUTH EAST PEST MANAGEMENT PLAN – PART 2
1
CONTENTS
1. IDENTIFIED ENTRY PATHWAYS FORPEST PLANTS AND ANIMALS INTO THE SE 3
2. PATHWAY VS. VECTORS 3
2.1 Vehicular traffic As Vectors for movement 4
2.2 Transport Orientated Pathways 5
2.3 Environmental Pathways 5
2.4 Tourism Aided Pathways 5
2.5 Industry and Trade Pathways 5
2.6 Consumer orientated Pathways 5
3. SPATIAL REPRESENTATION OF BIOSECURITY PATHWAYS 5
4. PATHWAYS 8
5. PATHWAYS MANAGEMENT ACTIONS 32
5.1 Inspections/ Surveillance 32
5.2 Pest reporting procedure 32
5.3 Decontamination procedure and protocol 32
5.4 Disposal 33
5.5 Logs/ Records 33
5.6 Vendor declaration 33
5.7 Education 33
APPENDIX 1 34

SOUTH EAST PEST MANAGEMENT PLAN – PART 2
2
TABLES AND FIGURES
Figure 1: Map of pest incursion analysis of the South East region 7
Table 1: Indicative average daily traffic flows for the SE region,figures derived from DTEI 2008 4
Table 2 - Description of sites with significantly clustered pest incursionvalues of 4 (four intersecting pathways) in the mid-lower South East. 6
Table 3: Pathways identified in the South East region 8

SOUTH EAST PEST MANAGEMENT PLAN – PART 2
3
1. IDENTIFIED ENTRY PATHWAYS FOR PEST PLANTS ANDANIMALS INTO THE SE
There exist a number of plants and animals which are found in neighbouring regions andhave the potential to cause significant environmental, economic and social impact if theybecame established in the South East NRM Region. The SE NRM Board is identifying thesepests and conducting a risk assessment of their potential impact. When this risk assessmentis combined with the identification of the most likely vectors and pathways of spread, theentry and establishment of these pests will be minimised.
Management of new and existing incursions can only be achieved through the collaborationand cooperation of all people at all levels, be they individuals, industry (both public andprivate) or government agencies, “Biosecurity is everyone’s’ business”.
Incursions can be reduced and managed through the implementation of a combination ofmeasures which include;
• Surveillance,• Education and awareness and• Legislation/ policies/ protocols/ reporting.
All actions which are undertaken to manage incursions must be applied fairly and equitably.
The establishment success of a new incursion will be dependent of factors such asfrequency of event, likelihood of establishment, individual species adaptability, and thevector for movement.
Incursions via environmental factors such as wind and water are likely to be short distanceand localised e.g. along a creek or river, or across a paddock. Whereas incursions viahuman aided movement have the potential to be much greater, with movement occurring atintrastate, interstate and also international scales.
Limitations to incursion management include;• Knowledge of location and distribution of pest plant and animals both within and
outside the region,• Resources (including financial and operational) required to undertake surveillance
and extension,• Achieving support and implementation at all levels.
2. PATHWAY VS. VECTORSVectors are considered the transport mechanism for the pest plant or animal, while thepathway can be considered the actual route along which the vector enters the region.Assessing the pathways and the potential vectors will give us an indication for a potentialentry sites for new incursions.For example, a vehicle passing through the SE NRM region along defined roads orhighways without stopping has less potential for introduction of a new pest, than a vehiclewhich makes regular stops unloading/ loading cargo eg sheep or cattle at depots, farmsyards throughout the Southeast.
The primary (anthropogenic) vectors for movement are identified by King 2007.• Deliberate introduction via community,• Deliberate introduction via business,• Human movement,• Controlled livestock movement,• Contaminated vehicles,• Contaminated equipment,

SOUTH EAST PEST MANAGEMENT PLAN – PART 2
4
• Contaminated aquatic equipment,• Contaminated goods and produce,• Waste disposal,• Animal movement other than livestock.
The potential points of entry into the SE NRM Board region are numerous.To identify general priority pathways we examined where convergent pathways occurredwithin the region.
2.1 VEHICULAR TRAFFIC AS VECTORS FOR MOVEMENTOn average 11,630 vehicles enter and exit the SE region every day along the majorthoroughfares outlined in Table 1. This does not include secondary routes like farm andindustry tracks or traffic and cargo via air and sea.
Table 1: Indicative average daily traffic flows for the SE region, figures derived fromDTEI 2008
Indicative traffic flows: sourced from Transport Information Management section DTEIAnnual Average Daily Traffic Estimates, Aug 2008Routes All traffic
(two wayflow)
CommercialVehicles (two wayflow)
Princes Hwy toMeningie 1400 170Dukes Hwy toKeith 3600 1300Victoria toBordertown viaDukes Hwy 2400 900Pinnaroo toBordertown 220 70Wimmera Hwyfrom Vic 490 49Comaun ForestRd from Vic 270 39Penola -Castertonrd 300 50Vic border toGlenburnie 800 100Princes hwy fromVic 1200 370Punt Rd from Vic 950 260
Total traffic 11630 3308
Total traffic entering & leaving SEfrom the major roads on dailyaverage basis
While the movement of traffic may pose only a minimal threat to new incursions, it is whenand where these vehicles stop, decontaminate, unload etc, that poses the greater threat forthe introduction of a propagules or animal being introduced.

SOUTH EAST PEST MANAGEMENT PLAN – PART 2
5
2.2 TRANSPORT ORIENTATED PATHWAYSRoad, Rail, Yards ,Parking Bays, Weighbridges, Marinas, Ports, Airfields and associatedactivities eg road construction, slashing etc all pose a potential entry point for an incursionfrom contaminated vehicles. Restricting movement along these pathways is extremelydifficult. Actions for these pathways are centred around strategic inspection and awarenessraising.
2.3 ENVIRONMENTAL PATHWAYSLong distance movement by wind and water along creeks / drains or across paddocks islimited, while the prevention of natural dispersal of animals eg pest birds if difficult. Newincursion will only be identified through strategic inspections and by raising the awareness ofkey industry personnel, community groups and public members.
2.4 TOURISM AIDED PATHWAYSPotential incursions particularly grassy and burr pest plants can be picked up on clothingand vehicles, in tyres and shoes and then be deposited around the region as we movebetween places like caravan parks, tourist sites, and camping areas in national and stateparks and conservation areas. Vigilant site managers will identify and manage new incursionquickly, but traveller should also be aware of what they could be potentially carrying.Educational materials like pamphlets and signage can aid in prompting their awareness.
2.5 INDUSTRY AND TRADE PATHWAYSThe movement of equipment and produce into, out of and around the region, is extremelydifficult to manage and control. This pathways is centred around the movement of produce,materials and equipment by the transport industry eg livestock carriers, bulk materialsuppliers, quarries, seed and hay suppliers, contractors for haymaking, harvesting, spraying,crop inspectors.Simple steps like decontaminating and maintenance of travel records can aid in preventingand managing incursions should they occur.
2.6 CONSUMER ORIENTATED PATHWAYSPublic can aid in transport and establishment of new incursion through the consumptionfrom outlets like town markets, nurseries and plant sellers, landscape suppliers, pet shopsetc. Actions which can limit the establishment of new incursions via this pathway are centredon awareness raising of both the supplier and the consumer.
3. SPATIAL REPRESENTATION OF BIOSECURITY PATHWAYSIn order to understand and map where weeds are most likely to enter the South East fromhuman-aided pathways, a number of potential high risk vectors (i.e. roads, railways, andhigh traffic areas) and land uses (for example, those that may import stock, plants, feed, orsoil) were represented in a geographic information system (GIS) by readily available spatiallayers. Where higher numbers of these potential pathways coincided in the landscape, itwas assumed that there may be an increased likelihood of weeds being introduced at thatlocation.The highest number of coinciding pathways was four, and all of these locations wereclustered in the mid-lower region of the South East. The following table describes thegeneral location of likely weed incursion areas, and these areas are represented by red dotson Map #. Please refer to Appendix # for a detailed description of the GIS analysis.

SOUTH EAST PEST MANAGEMENT PLAN – PART 2
6
Table 2 - Description of sites with significantly clustered pest incursion values of 4(four intersecting pathways) in the mid-lower South East.
SITE DESCRIPTION INTERSECTING PATHWAYS
Populated place:
Naracoorte Intersection of rail, roads and built-up areas
Kybybolite Intersection of rail, roads and built-up areas
South End Intersection of drains, roads and built-up areas
Millicent Intersection of landuse/built-up areas, railway, roads and drains
Mount Gambier Intersection of landuse/built-up areas, railway, and roads
Other:
8km W of Penola Intersection of powerlines and roads
6km N of Furner on the Robe-Penola Road Intersection of powerlines, roads, and drains
1km NW and 4km SW of Tantanoola Intersection of powerlines, roads, rail, and drains

SOUTH EAST PEST MANAGEMENT PLAN – PART 2
7
Figure 1: Map of pest incursion analysis of the South East region
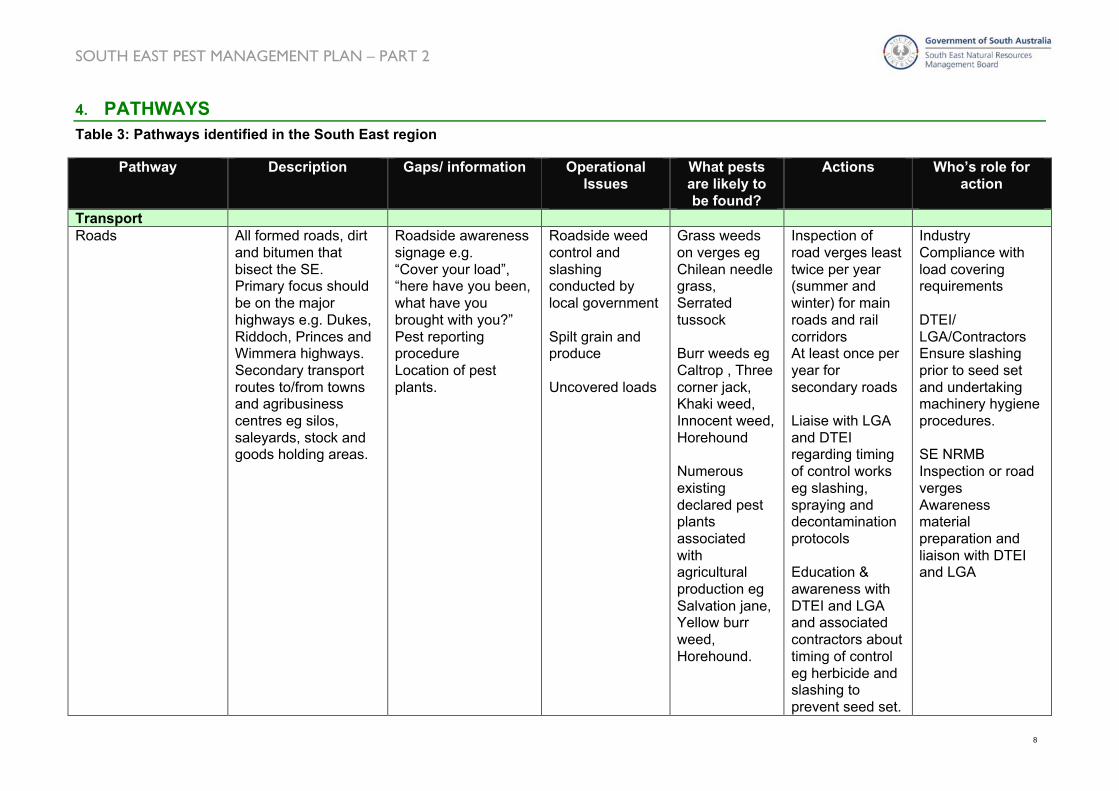
SOUTH EAST PEST MANAGEMENT PLAN – PART 2
8
4. PATHWAYSTable 3: Pathways identified in the South East region
Pathway Description Gaps/ information OperationalIssues
What pestsare likely tobe found?
Actions Who’s role foraction
TransportRoads All formed roads, dirt
and bitumen thatbisect the SE.Primary focus shouldbe on the majorhighways e.g. Dukes,Riddoch, Princes andWimmera highways.Secondary transportroutes to/from townsand agribusinesscentres eg silos,saleyards, stock andgoods holding areas.
Roadside awarenesssignage e.g.“Cover your load”,“here have you been,what have youbrought with you?”Pest reportingprocedureLocation of pestplants.
Roadside weedcontrol andslashingconducted bylocal government
Spilt grain andproduce
Uncovered loads
Grass weedson verges egChilean needlegrass,Serratedtussock
Burr weeds egCaltrop , Threecorner jack,Khaki weed,Innocent weed,Horehound
Numerousexistingdeclared pestplantsassociatedwithagriculturalproduction egSalvation jane,Yellow burrweed,Horehound.
Inspection ofroad verges leasttwice per year(summer andwinter) for mainroads and railcorridorsAt least once peryear forsecondary roads
Liaise with LGAand DTEIregarding timingof control workseg slashing,spraying anddecontaminationprotocols
Education &awareness withDTEI and LGAand associatedcontractors abouttiming of controleg herbicide andslashing toprevent seed set.
IndustryCompliance withload coveringrequirements
DTEI/LGA/ContractorsEnsure slashingprior to seed setand undertakingmachinery hygieneprocedures.
SE NRMBInspection or roadvergesAwarenessmaterialpreparation andliaison with DTEIand LGA

SOUTH EAST PEST MANAGEMENT PLAN – PART 2
9
Pathway Description Gaps/ information OperationalIssues
What pestsare likely tobe found?
Actions Who’s role foraction
Ensure loads arecovered – DTEIand transportcompaniesliaison.
Establishment ofwash-down, blowdown protocolsand points atdepots
Road construction Many roadconstructioncompanies operatenationally and maybring in new pestplants while localgovernment mayspread existing weedproblem to a newareaKey operators includelocal government,DTEI and associatedcontractors.
Pre constructionsurvey for weeds,preferably in summerand winterLocation of existingpests
Decontaminationpoints andprocedures
Defined tracksand turn points
Record origin ofmaterials.
Maintain pestplant freestockpile heaps
Permanent andtemporarystockpile sites
Pest localityinformation
All pest plants SENRM assistwithrecommendationand identificationof existing pestareas.
Pre inspectionand liaison withwork crews relocation of pestplant andremediation topreventmovement egdefined turnpoints, locationof stockpiles.
Inspection ofstockpiles toensure theyremain pest plantfree.
Industry / LGABest practice roadconstruction andsite rehabilitations.Ensuredecontaminationprotocols areimplemented.
SE NRMBLiaise with LGAand contractorsregarding declaredplant locationsPest reportingproceduredeveloped andcommunicated torelevant parties.

SOUTH EAST PEST MANAGEMENT PLAN – PART 2
10
Pathway Description Gaps/ information OperationalIssues
What pestsare likely tobe found?
Actions Who’s role foraction
free.
Material, sourcedfrom near site ormaintain log ofwhere comefrom, link to localgovernmentquarries (pre-inspection,removal oftopsoil etc).
Constructionequipmentshould bedecontaminatedprior to arrival onsite and uponleaving.
Awarenessmaterial ofprimary pestplants of concernand how tominimise spreadshould bedeveloped.
Pest reportingprocedure shouldbe developed.

SOUTH EAST PEST MANAGEMENT PLAN – PART 2
11
Pathway Description Gaps/ information OperationalIssues
What pestsare likely tobe found?
Actions Who’s role foraction
Rail and othercorridors
The major interstaterail corridor bisectsthe SE NRM Boardarea. These corridorsprovide habitat forpest animals andplants Early detectionof new pests withinthe defined corridorcan be quicklydetected anderadicated.Included are theMelbourne toAdelaide line corridorand the disused SErail corridor.Numerous companiesand service providersARTC, GSR,Transfield.
Other corridorsinclude pipelines,drains, and powerlines
Location of existingpest populationsFactsheets or uteguide of primary pestplants.Pest reportingprocedure
Access to railyards and othercorridorspossible trainingfor SENRM staff
Wash down/decontaminationpointsContainerloading/unloading/holding areas
Awarenessmaterial, keyspecies to watchout for
Education –container trafficfrom interstate,cane toads, whoto report finds to.
Pest reportingprocedure
Grass weedseg Chileanneedle grass,Serratedtussock.
Existingdeclared plantseg Caltrop,Horehound,Salvation jane
Potential pestanimalsinclude canetoads.
Inspection of railcorridors forsummer andwinter weeds,inspection shouldinclude sidings,station yards etc.
Liaise withcorridormanagementauthorities egARTC, SAWater, ETSA andcontractors onthe most suitabletime to conductcontrol worksand the locationof existing pestplants.
Awarenessmaterial ofprimary pestplants and pestanimalsdeveloped.
Pest reportingprocedure shouldbe developed.
IndustryInspectionReporting of pestsightings.Undertake control.Ensuredecontaminationprotocols andimplemented.
SE NRMBInspection.Awarenessmaterialpreparation.Pest reportingproceduredeveloped andcommunicated torelevant parties.

SOUTH EAST PEST MANAGEMENT PLAN – PART 2
12
Pathway Description Gaps/ information OperationalIssues
What pestsare likely tobe found?
Actions Who’s role foraction
Loading andUnloading points.
This category includetrucking yards, paringbays, Weigh stations
Movement oflivestock, machinery,containers and othergoods from intra andinterstate yards couldcontain new pestplants and animals.
Examples of Truckingdepots include Scotts,Kalari, We Us & Co,Bordertown Haulage,Webb Haulage, TransAustralian, Toll as wellas numerous otherstock and cargocarriers.
Parking bays andWeigh stationsMost are locatedalong major roadsand highways, includetourist stops andpoints of interest, adhoc and permanentparking areas, theseare should beinspected inconjunction with roadinspections.
Availability of washdown/decontaminationpointsAccess to containerloading/ unloading/holding areas
Pest reportingprocedure to bedeveloped
Awareness andeducations materialwhere have youbeen, what are youcarrying, disposal
Awareness materialsand signageEducation wherehave you been?DTEI awareness
Supply ofDisposal bins
Closingopportunisticparking areas
Ensure parkingareas and depotsare free of pestplants
Flagging ofmachinery fromsuspect areas.
Pest reportingprocedure to bedeveloped.
Burr weeds egNoogoora burr,Bathurst burr,Caltrop , Threecorner jack,Khaki weed
Grass weedson sites egChilean needlegrass,Serratedtussock
Pest eg canetoads, Indianmyna
SE NRMinspection ofparking sitesalong mainthoroughfarestwice (Summer/Winter) per year.
SE NRMBinspection ofweigh stationsand surroundsonce per yearcombine withroad vergeinspections.
Other depot asand yards areasshould beinspected onannual basis bythe landholder orcontractors as apart of sitemanagement.
Liaison betweenNRM authorityand landholder /managers shouldoccur on aregular basis,minimum of onceevery threeyears.
IndustryReport of anypests eg canetoadsUndertake controlMaintain records.reduceopportunisticparking areasDecontaminationprotocolsimplementedMaintain pest plantfree depots andyards.
SE NRMBInspectionFollow-up onmachinery fromsuspect areas ifrequired.Awarenessmaterialpreparation andidentification anddecontaminationworkshopsdelivered.Pest reportingproceduredeveloped andcommunicated torelevant parties.

SOUTH EAST PEST MANAGEMENT PLAN – PART 2
13
Pathway Description Gaps/ information OperationalIssues
What pestsare likely tobe found?
Actions Who’s role foraction
inspections. every threeyears.
Awarenessmaterial ofprimary pestplants and pestanimals shouldbe produced.
Pest reportingprocedure shouldbe developed.
Decontaminationprotocol shouldbe developed ifapplicable.
Decontaminationworkshops
Plantidentificationworkshops
Marinas Introduction of newplants from boattrailers Marinas bothcommercial andprivate are located atRobe, Beachport, andKingston.
Awareness materialsand signageEducation what couldthey be moving
Wash down/decontamination
Pest reportingprocedure to bedevelopedDisposal binsDisposal of bilgewater
Aquatic weedseg CabombaSalvinia.
Aquatic pestseg carp,orientalweather loach
SE NRMInspection ofwash down/decontaminationcatchment cages/ bins as required
Awarenessmaterial ofprimary pestplants and pestanimals beproduced.
Industry & PublicReportingComply withdisposal anddecontaminationprotocols.
SE NRMB

SOUTH EAST PEST MANAGEMENT PLAN – PART 2
14
Pathway Description Gaps/ information OperationalIssues
What pestsare likely tobe found?
Actions Who’s role foraction
Pest reportingprocedure
material ofprimary pestplants and pestanimals beproduced.Pest reportingproceduredeveloped andimplemented..
Decontamination/ waste disposalprotocol andfacilitiesdeveloped andimplemented ifapplicable.
InspectionAwarenessmaterialpreparationPest reportingproceduredeveloped andcommunicated torelevant parties.
Ports Portland Wash down/decontaminationpointsContainer loading/unloading/ holdingareasAwareness materialEducation what couldthey be moving
AQIS/ SENRMliaison
Pest reportingprocedure
Access tocontainerloading/unloading/holding areas,may requiretraining
Disposal of bilgewater and waste
Burr weeds egNoogoora burr,Bathurst burr,Caltrop , Threecorner jack,Khaki weed
Grass weedson sites egChilean needlegrass,Serratedtussock
Pest eg Canetoads, Indianmyna
As above
Liaise with AQIS,industryregardingpotential pestincursion andreporting.
IndustryReporting of pestsightingUndertake control
SE NRMBAwarenessmaterialpreparationPest reportingproceduredeveloped andcommunicated torelevant parties.

SOUTH EAST PEST MANAGEMENT PLAN – PART 2
15
Pathway Description Gaps/ information OperationalIssues
What pestsare likely tobe found?
Actions Who’s role foraction
mynaRecreational boatingindustry
Numerous boat rampsare accessible to thepublic
Awareness materialsand signage
Adequate washdown/decontaminationsites and information
Pest reportingprocedure
Pest reportingprocedure
Disposal bins
Large number ofdefined andundefined (private) boatramps
Disposal ofwaste, live baits,mussels,cockles, live baitetc
Aquatic weedseg CabombaSalvinia.
Aquatic pestseg carp,orientalweather loach,Tilapia
Inspection ofwash down/decontaminationcatchment cages/ bins as required
Awarenessmaterial ofprimary pestplants and pestanimals isproduced.
Pest reportingproceduredeveloped andimplemented.
Decontamination/ waste disposalprotocol andfacilitiesdeveloped andimplemented ifapplicable.
Industry & PublicReportingComply withdecontaminationand waste disposalprotocol.
SE NRMBInspectionAwarenessmaterialpreparationPest reportingproceduredeveloped andcommunicated torelevant parties.
Airports & airfields Commercial, privateand public airfieldscan be found atMount Gambier,Bordertown,Naracoorte andTintinara.
Awareness materialsand signageAQIS liaison
Restrictedaccess toairfields, trainingrequired
Pest reportingprocedure
All vertebrateand plant pests
Awarenessmaterial ofprimary pestplants and pestanimals bedeveloped anddistributed.
IndustryReportingUndertake control
SE NRMBLiaison withappropriateauthorities

SOUTH EAST PEST MANAGEMENT PLAN – PART 2
16
Pathway Description Gaps/ information OperationalIssues
What pestsare likely tobe found?
Actions Who’s role foraction
Disposal binsLiaise with othergovernmentagencies egAQIS,Biosecurity SA.
Pest reportingproceduredeveloped andimplemented.
Decontamination/ waste disposalprotocoldeveloped andimplemented ifapplicable.
authoritiesAwarenessmaterialpreparationPest reportingproceduredeveloped andcommunicated torelevant parties
EnvironmentalpathwaysNatural plant andanimal dispersal
The movement ofdeer, feral pigs, wilddog/ dingo, Indianmyna etc is difficult toprevent. Pest plantpropagules aretransported via rivers,creeks , drains usuallythrough flood andheavy rainfall events.
Awareness materialsand signageEducation – whichweeds, fish Tilapia ?,Pest reportingprocedure
Access to allareas, limitedresources largeareas
Known pestlocations
Aquatic weeds:Cabomba,Glush weed,Salvinia, Waterhyacinth.
Inspection onceper year or afterheavy rainfallevents, waterwatch volunteersmay aid ininspection.
IndustryReportingUndertake control
PublicReporting

SOUTH EAST PEST MANAGEMENT PLAN – PART 2
17
Pathway Description Gaps/ information OperationalIssues
What pestsare likely tobe found?
Actions Who’s role foraction
transported via rivers,creeks , drains usuallythrough flood andheavy rainfall events.
Cooperation betweenpublic and privateland mangers isrequired to implementan effectivemanagement plan tominimise the spreadof these animals andplants.
Pest locationsNatural dispersal
locations
Spottersnetworks
Aquaticvertebratepests eg Canetoad, Orientalweather loach,Gambusia,Red earedslider, Tilapia.
inspection.
Pestmanagementalong corridors,baiting, traps etc.
Liaise withlandholdersmanagers andpublic aboutwhat they shouldbe alert for.
Awarenessmaterial ofprimary pestplants and pestanimals bedeveloped anddistributed.
Pest reportingproceduredeveloped andimplemented.
Weed id trainingforvolunteers egwater watch,“Friends” groups
SENRMBInspectionAwarenessmaterialpreparationPest reportingproceduredeveloped andcommunicated torelevant partiesIdentification andinformationsessions aboutbiosecurity issues.
Tourism pathwaysTourist sites Locations include
National parks egCoorong, Ngarkat,Conservation parksMt Monster, Little Dip,Canunda, Blue lakereserve , Picanineeponds, public access
Awareness materialand signage
Decontaminationsite establishedat main entry andexit points.
Pest plants,grass weeds,environmentalweeds, burrweeds
Inspection ofcamping groundon regular basis
Industry

SOUTH EAST PEST MANAGEMENT PLAN – PART 2
18
Pathway Description Gaps/ information OperationalIssues
What pestsare likely tobe found?
Actions Who’s role foraction
National parks egCoorong, Ngarkat,Conservation parksMt Monster, Little Dip,Canunda, Blue lakereserve , Picanineeponds, public accessforestry areas andother heritage/culturalsites.
and signage
Decontaminationsites and procedures
Pest reportingprocedure
site establishedat main entry andexit points.
Weed id trainingfor DEH, Friendsgroups, Bushcare
Adequatedisposal anddecontaminationfacilities
Unrestrictedcamping areas
grass weeds,environmentalweeds, burrweeds
Pest animalseg deer, wilddogs, rabbits
Viruses egphytophera
camping groundon regular basis
Liaise withlandholders andmanagers todevelopawarenessmaterial ofprimary pestplants and pestanimals.
Decontamination/ waste disposalprotocoldeveloped andfacilitiesimplemented ifapplicable.
Pest reportingproceduredeveloped andimplemented.
Reporting,inspection,undertake control.Ensure facilities fordisposal anddecontaminationare available.
PublicFollow procedures,reporting.
SENRMBInspectionAwarenessmaterialpreparationPest reportingproceduredeveloped andcommunicated torelevant parties
Open access campingsites
Caravan parks, touristparksNumerous sites arelocated throughoutthe region.
Awareness materialand signage
Decontamination andwash downprocedures
Pest reportingprocedure
Disposal bins
Decontamination/ wash down siteestablished
Burr weeds egNoogoora burr,Bathurst burr,Caltrop, Threecorner jack,Khaki weed,Innocent weed
Inspection andcontrol should beundertaken bythe site manager
Liaise withlandholders andmanagers aboutwhat they shouldbe alert for.
IndustryReporting ,undertake control
PublicFollow procedures,reporting

SOUTH EAST PEST MANAGEMENT PLAN – PART 2
19
Pathway Description Gaps/ information OperationalIssues
What pestsare likely tobe found?
Actions Who’s role foraction
procedure Grass weedson sites egChilean needlegrass,Serratedtussock,
what they shouldbe alert for.Awarenessmaterial ofprimary pestplants and pestanimals bedeveloped anddistributed.
Decontamination/ waste disposalprotocoldeveloped andfacilitiesimplemented ifapplicable.
Pest reportingproceduredeveloped andimplemented.
SENRMBInspectionAwarenessmaterialpreparation Pestreportingproceduredeveloped andcommunicated torelevant parties
Industry & TradepathwaysProduce processors,wholesalers
Awareness materialDisposal proceduresDisposal of material,waste water
Decontamination andwash downprocedures Washdown of equipmentbins etc
Availability ofdisposal anddecontaminationequipment andprocedures
Pest animals,Cane toads,other nonendemicspecies
Invertebrates
Inspection bySENRM uponrequest, randomspot
Inspection ofdisposalbins/sites..Records/log keptof goodsreceived anddispatched,areas travelled,etc this aids intracing should anew incursion
IndustryReporting ,Undertake controlwhen requiredMaintain records toenable tracing ofproducts
SE NRMBInspection

SOUTH EAST PEST MANAGEMENT PLAN – PART 2
20
Pathway Description Gaps/ information OperationalIssues
What pestsare likely tobe found?
Actions Who’s role foraction
of goodsreceived anddispatched,areas travelled,etc this aids intracing should anew incursionoccur.
Decontamination/ waste disposalprotocoldeveloped andfacilitiesimplemented ifapplicable.
Pest reportingproceduredeveloped andimplemented.
Development avendordeclarationsystem.
AwarenessmaterialpreparationPest reportingproceduredeveloped andcommunicated torelevant parties
Saleyards Saleyards are locatedat Naracoorte, Keithand Mount Gambier,suggested actions aredescribed above.
Awareness andsignageWhere have theycome from, whereare they going toWhat should we belooking forDecontamination andwash downprocedures
Availability ofdisposal anddecontaminationequipment andprocedures
Weedidentificationtraining for stockagents andvendors
Burr weeds egNoogoora burr,Bathurst burr,Caltrop , Threecorner jack,Khaki weed
SENRM annualsite inspection.Follow-up onstock containingpest plants
Maintenanceweed free area
IndustryReporting,Undertake sitecontrol to ensurepest plant free.Comply withdecontaminationand disposalprotocols

SOUTH EAST PEST MANAGEMENT PLAN – PART 2
21
Pathway Description Gaps/ information OperationalIssues
What pestsare likely tobe found?
Actions Who’s role foraction
Decontamination andwash downproceduresVendor declarationprocessIndustry standard forprocess for purchaseand selling of stockPest reportingprocedure
identificationtraining for stockagents andvendors
Grass weedson sites egChilean needlegrass,Serratedtussock
weed free area
Pest reportingproceduredeveloped andcommunicated torelevant parties
Identification andinformationsessions aboutbiosecurityissues
and disposalprotocols
VendorsDeclaration ofstock , emptyingout prior totransport, holdingpaddocks afterpurchase,reporting
SE NRMBAwarenessmaterialpreparationPest reportingproceduredeveloped andcommunicated torelevant partiesIdentification andinformationsessions aboutbiosecurity issuesTraining courseprovider
Wash down sites Numerouscommercial andprivate facilities existacross the region.
Awareness andsignage
Decontamination andwash downprocedures Wheredoes the materialgo? How disposedof.?
If public utilisedfacility thendifficult to trackusers.
All pest plants Decontamination/ waste disposalprotocoldeveloped andfacilitiesimplemented ifapplicable.
IndustryCorrect disposal ofcatchment cagematerial
SE NRMB

SOUTH EAST PEST MANAGEMENT PLAN – PART 2
22
Pathway Description Gaps/ information OperationalIssues
What pestsare likely tobe found?
Actions Who’s role foraction
does the materialgo? How disposedof.?
applicable.
Pest reportingproceduredeveloped andimplemented.
AwarenessmaterialpreparationPest reportingproceduredeveloped andcommunicated torelevant parties
Quarries and wastedepots and transferstations
Includes localgovernment andprivate quarries aswell as bulk materialsuppliers eglandscape supplies,compost.
Awareness material
Decontamination andwash downprocedures
Pest reportingprocedure
Existing pest plantlocations
Quick referencematerial in lunchrooms
Decontaminationpolicy enforcedby company
Wash down sitesestablished atmainentrance/exitpoints
Buffers toprevent entryand escape ofwind borne seed
All pest plants SENRM assistwith pre & postinspections andannual siteinspection ifrequired
Should maintainlogs/records ofwhere goodscame from andgoing to.
Pre quarry openinspection,When opening anew quarry, thetop 100 mm ofsoil should beremoved andplaced aside forsite rehabilitationand minimisepest plant seedsin quarriedmaterial
IndustryAdhere todecontaminationprotocolUndertake control,maintain buffersReportingSite maintenanceDefined trafficareasDecontaminatebefore enteringsiteSite restorationWash down pointsmonitoredRemoval andstorage of topsoil
SE NRMBInspection andtracingAwarenessmaterialpreparation

SOUTH EAST PEST MANAGEMENT PLAN – PART 2
23
Pathway Description Gaps/ information OperationalIssues
What pestsare likely tobe found?
Actions Who’s role foraction
material
Sitemanagementshould ensure nopest plants areseeding on site
Awarenessmaterial shouldbe provided on ayearly basis.
Pest reportingprocedure shouldbe developedandimplemented.
Decontamination/ waste disposalprotocoldeveloped andfacilitiesimplemented ifapplicable.
Pest reportingproceduredeveloped andcommunicated torelevant parties
Earthmovingcontractors
Number of operatorsin SE
Awareness material
Decontamination andwash downprocedures
Wash down sitesestablished atmainentrance/exitpoints GPSmarked for futurereference
All pest plants As requiredSuggestedActionsAwarenessmaterial shouldbe provided on ayearly basis.
IndustryAdhere todecontaminationprotocolMaintain records ofareas travelled

SOUTH EAST PEST MANAGEMENT PLAN – PART 2
24
Pathway Description Gaps/ information OperationalIssues
What pestsare likely tobe found?
Actions Who’s role foraction
wash downprocedures
Pest reportingprocedure
referenceDecontaminationprocedures,decontaminationlog
yearly basis.Pest reportingprocedure shouldbe developedandimplemented.Decontamination/ waste disposalprotocoldeveloped andfacilitiesimplemented ifapplicable.
Covering loads
SE NRMBAwarenessmaterialpreparationPest reportingproceduredeveloped andcommunicated torelevant partiesIdentification andinformationsessions aboutbiosecurity issues.
Agronomists/ cropinspectors / Livestockagents
Companies includeElders, Landmark,S.A.L, Cunninghams,PPHS
Large number ofoperators in the SEAwareness material
Decontamination andwash downprocedures forperson and vehicle
Pest reportingprocedure
Vendor declaration
Wash down sitesestablished atmainentrance/exitpoints GPSmarked for futurereference
Travel on definedroadways andtracks
All pest plants Awarenessmaterial shouldbe provided on ayearly basis.
Pest reportingprocedure shouldbe developedandimplemented.
Decontamination/ waste disposalprotocoldeveloped andfacilitiesimplemented ifapplicable.
IndustryEnsure vendoradhere to industrybest practice forsale of machinery /stock eg washdown / empty outprior to movementof property andinto holding are aDecontaminatebefore enterproperties.
SE NRMBAwarenessmaterialpreparationPest reportingproceduredeveloped andcommunicated torelevant parties

SOUTH EAST PEST MANAGEMENT PLAN – PART 2
25
Pathway Description Gaps/ information OperationalIssues
What pestsare likely tobe found?
Actions Who’s role foraction
Liaise withindustry toestablish avendordeclarationsystem.
proceduredeveloped andcommunicated torelevant partiesIdentification andinformationsessions aboutbiosecurity issues.
Contractors hay making,harvesting spraying
Large number ofcontractors in SE
Decontamination andwash downprocedures beforeentry and beforeleave
Location of existingpest plantpopulations
Pest reportingprocedure
Disposal of wastematerial
Maintain log ofmovement
Utilise wash/blow down sitesestablished atmainentrance/exitpoints GPSmarked for futurereference
Disposal ofwaste material
Travel on definedroadways andtracks
All pest plants Awarenessmaterial shouldbe provided on ayearly basis.
Maintain recordsof areas travelledfor tracingpurposes
Pest reportingprocedure shouldbe developedandimplemented.
Decontamination/ waste disposalprotocoldeveloped andfacilitiesimplemented ifapplicable.
IndustryReportingAdhere todecontaminationprotocolMaintain records
SE NRMBPreparation ofawarenessmaterial
Pest reportingproceduredeveloped andcommunicated torelevant parties
Shearers Large number ofcontractors in SE
Quick referenceguide to pestplant seeds/burrs
Burr weeds egNoogoora burr,Bathurst burr,Caltrop , Threecorner jack,Khaki weed,Horehound
Awarenessmaterial shouldbe provided on ayearly basis.
IndustryReporting

SOUTH EAST PEST MANAGEMENT PLAN – PART 2
26
Pathway Description Gaps/ information OperationalIssues
What pestsare likely tobe found?
Actions Who’s role foraction
Awareness materialto be developed
plant seeds/burrs
Decontaminationand wash downprocedurespersonal,vehicle, dog,equipment
Pest reportingprocedure
Disposal ofwaste material
Bathurst burr,Caltrop , Threecorner jack,Khaki weed,Horehound
Grass weedson sites egChilean needlegrass,Serratedtussock
be provided on ayearly basis.
Pest reportingprocedure shouldbe developedandimplemented.
Decontamination/ waste disposalprotocoldeveloped andfacilitiesimplemented ifapplicable.
Decontaminationbetween properties
SE NRMBFollow up ofreportsPreparation ofextension materialPest reportingproceduredeveloped andcommunicated torelevant parties
Apiarists SA ApiaristsAssociation (SAAA) –SE Branch
Awareness materialDecontamination andwash downproceduresPest reportingprocedureDisposal of material Maintain logs ofmovements
Intra andinterstatemovements oftenconducted atnight.
Utilise wash/blow down sitesestablished atmainentrance/exitpoints GPSmarked for futurereference
Utilise definedtracks androadways
All pest plants
Soil bornediseases
Apiarydiseases egSmall hivebeetle from VicCertificatesrequired
Liaison with theSouth AustralianApiaristAssociation(SAAA) re weedand diseasemovement.
Travel to/fromcommercial andnon commercialpropertiesincluding nativevegetation areas.
Clean off dirt onbottom of pallets/bee boxes/ waterdrums, brush offbefore leave site.
IndustryAdhere todecontaminationprotocolReport any newincursionsMaintain log ofmovement
SE NRMBLiaise with industryregardingbiosecurity issues.Preparation ofawarenessmaterialPest reportingproceduredeveloped andcommunicated torelevant parties

SOUTH EAST PEST MANAGEMENT PLAN – PART 2
27
Pathway Description Gaps/ information OperationalIssues
What pestsare likely tobe found?
Actions Who’s role foraction
roadwaysDecontaminationbefore leave orenter a new sitedirt/ burrs etc onunderside ofpallets, on tyres
bee boxes/ waterdrums, brush offbefore leave site.
Disinfectingwater drums,pallets and beeboxes to stopspread ofdiseases egphytophera, useof plastic palletsto aid incleaning.
Decontamination/ waste disposalprotocoldeveloped andfacilitiesimplemented ifapplicable.
Pest reportingproceduredeveloped andcommunicated torelevant parties
proceduredeveloped andcommunicated torelevant parties
Vic DPI andPIRSAHive & equipmentinspections andcertificates
Distributors of seedhay and fodderproducts
Processors includeKeith Seeds, TatiaraSeeds, Grosser PtyLtd
Responsibledisposal ofwaste/ offal.
Numeroussource ofmaterial includinginternational.
All pest plants Liaise withrelevantcompanyregardingrecords,decontaminationand disposal ofwaste material.
IndustryReportingResponsibledisposal of offal/wasteVendordeclarations

SOUTH EAST PEST MANAGEMENT PLAN – PART 2
28
Pathway Description Gaps/ information OperationalIssues
What pestsare likely tobe found?
Actions Who’s role foraction
material includinginternational.
and disposal ofwaste material.
Awarenessmaterial shouldbe provided on ayearly basis.
Pest reportingprocedure shouldbe developedandimplemented.
Decontamination/ waste disposalprotocoldeveloped andfacilitiesimplemented ifapplicable.
declarationsMaintain recordsfor tracingpurposes
SE NRMBFollow up onreportsTrace forward andback if requiredPest reportingproceduredeveloped andcommunicated torelevant parties
Consumer pathwaysTown markets, fielddays, shows
Lucindale field dayHorsham field dayLocal shows andmarketsGarage sales,Clearance sales
Awareness materialWhat does yourgarden growPlant this insteadEducation are youselling somethingyou shouldn’t,reporting who toPest reportingprocedure
Disposal bins
Markets oftenoutside ofnormal workinghours makinginspectiondifficult.
All pest plantsincludingaquatics pests
Pest animalsincluding,gambusia,orientalweather loach,rabbits,Barbary doves,red earedsliders,mallards
Randominspection ofmarkets
EducationaldisplaysDisplay’s at keylocal events egLucindale fielddays, Horshamfield days
PublicAwareness &reporting
SE NRMBInspectionPreparation ofawarenessmaterial

SOUTH EAST PEST MANAGEMENT PLAN – PART 2
29
Pathway Description Gaps/ information OperationalIssues
What pestsare likely tobe found?
Actions Who’s role foraction
red earedsliders,mallards
Awarenessmaterial shouldbe provided eachyear
Pest reportingprocedure shouldbe developedandimplemented.
Plant sellers Nurseries Awareness materialEducation – plant meinstead, reporting ofsightingsPest reportingprocedureDisposal procedureMaintain logs ofsuppliers andcustomers
Training forindustry in plantid
Promotion ofgrow me insteadbrochures
Disposal ofwaste
All pest plantsincludingaquatics
Pest animals–reptiles,invertebrates
Randominspection onannual basis
Pest reportingprocedure shouldbe developedandimplemented.
Liaise withnurseries andplant sellers onregular basis
Nursery& plantseller/ distributorgrower/ importerReportingAwareness of whatthey are selling.Maintain record ofsuppliers
SE NRMBInspectionLiaise with nurseryindustry on regularbasis.Preparation ofawarenessmaterial Pestreportingproceduredeveloped andcommunicated torelevant parties

SOUTH EAST PEST MANAGEMENT PLAN – PART 2
30
Pathway Description Gaps/ information OperationalIssues
What pestsare likely tobe found?
Actions Who’s role foraction
relevant parties
Landscape supplies Awareness materialPest reportingprocedureMaintain logs ofsupplierWhere are yougetting material from,
Supplier declarationsfor hay/soil/ mulchetc
Supplierdeclarations
All pest plantsincludingaquaticsPest animals–reptiles,invertebrates
Random siteinspection onannual basis
Maintain logs ofsuppliers
Pest reportingprocedure shouldbe developedandimplemented.
IndustryMaintain logs,covering loads,wash downprotocol, reporting
SE NRMBInspectionPreparation ofawarenessmaterialPest reportingproceduredeveloped andcommunicated torelevant parties
Pet shops Awareness material
Pest reportingprocedure
Disposal procedure
Training forindustry in plantid and pest id
High turn over ofproduct
Aquatic pestplants egSalvinia,Cabomba,Arrowhead
Aquatic pestseg red earedslider, canetoads
Other declaredvertebratepests eg wildrabbits, Indianmyna,mallards.
Random siteinspection onannual basis
Maintain logs ofsuppliers
Pest reportingprocedure shouldbe developedandimplemented.
IndustryMaintain logs,reporting.Accreditedsuppliers
SE NRMBInspectionPreparation ofawarenessmaterial Pestreportingproceduredeveloped andcommunicated torelevant parties

SOUTH EAST PEST MANAGEMENT PLAN – PART 2
31
Pathway Description Gaps/ information OperationalIssues
What pestsare likely tobe found?
Actions Who’s role foraction
rabbits, Indianmyna,mallards.
communicated torelevant parties

SOUTH EAST PEST MANAGEMENT PLAN – PART 2
32
5. PATHWAYS MANAGEMENT ACTIONSActions described for each the pathways fall into 7 common categories;
• Inspection/surveillance• Pest reporting• Decontamination protocol and procedures• Disposal protocol and procedures• Maintaining accurate logs/records• Vendor declaration• Education.
Each action may be utilised in the formation of regional work plans targeting specific pests e.g.rabbits, foxes, Mexican feather grass, groups of pests e.g. burry weeds, grass weeds, terrestrialvertebrates, aquatic vertebrates, or a specific issue e.g. decontamination, inspection.
5.1 INSPECTIONS/ SURVEILLANCEInspections wether conducted by NRM authorised officer, industry workers eg agronomists,contractors, landholder and members of the public will aid in the early detection of new pest plantsand pests.Biannual inspections (summer and winter) enable most pest plants and animal incursions to bedetected in their early stages.
5.2 PEST REPORTING PROCEDUREAny reporting procedure which is developed should be accessible via a variety of avenues eg faceto face, phone, web, and mail. Initial reporting of an incursion may be experienced by numerousagencies or industries eg local veterinary practice, local agronomist, local stock agents, RegionalNatural Resource Management Boards, Groups and staff, PIRSA, DWLBC, Local government oreven by the new farm biosecurity initiative http://www.farmbiosecurity.com.au/ developed by thefederal government.
The principal contacts for biosecurity concerns or reporting of incursions, should be made known atmultiple levels, a series of actions should be undertaken at each level dependent on the incursion.The SE NRMB is the appropriate body to receive the initial reporting of pest plant and animalsincursions. However their networks allow collaboration with other government agencies andindustry bodies which could see them take on a wider incursion response role.
National Biosecurity plan and response, Plant Health Plan, Animal Health Plan (AUSVET Plan),State incursion response plans all need to be considered if a new incursion is reported.
5.3 DECONTAMINATION PROCEDURE AND PROTOCOLDecontamination equipment can be mobile or permanent sites, cost recovery (coin operated) orsupported/sponsored by industry or organisation.The frequency of required decontamination is dependent on numerous variable including locationstravelled, type of cargo, type of equipment or product eg slasher, earthmoving or vehicles.Each piece of equipment or product has its own specific decontamination requirements including;
• type of decontamination required (water, air, steam, heat).• accumulation points generally there is a focus upon radiators, grills, ledges, wheels and
wheel arches, behind guards eg sump guards, pto guards, dirt accumulation ontynes/rippers/buckets, Interior of vehicles including floor mats, carpets etc.
• in some instance the use of chemicals, disinfectants is required to destroy seed anddiseases eg Niproquat®, bleach, methylated spirits, methyl bromide, phospine gas etc
• Confinement of livestock to one paddock upon receivingAll decontamination points should be recorded and monitored for the presence of pest plants

SOUTH EAST PEST MANAGEMENT PLAN – PART 2
33
5.4 DISPOSALDisposal of waste material can be achieved by many means;
• Deep burial - Sighting, lining, depth and holding quantity of disposal pit will be dependenton the biosecurity incursion. May need to liaise with EPA
• Burning – Type of burning method (simple heap, specific temp, fast/ slow burn, pyres) willbe dependent on the biosecurity incursion. Liaison with agencies like CFS, EPA andBureau of Meteorology will aid in addressing issues like size, sighting, burn type.
• Heat treatment.- may be utilised where a viable product can be retained eg heat treatmentof grain for turning into fodder products may destroy the incursion will still being able torecoup some financial output,
• Irradiation/solarisation.
5.5 LOGS/ RECORDSThe maintenance of logs and records aids in tracing movement of machinery and materials, insome instances it maybe a legislative requirement.There is a wide variety of forms are available, examples can be viewed athttp://www.farmbiosecurity.com.au/
5.6 VENDOR DECLARATIONThe development of a voluntary vendor declaration system has been discussed for many yearsand achieving consensus on a way forward is difficult. Ultimately it will need to be consumer drivenand will have advantages and disadvantages for every industry but it must have industry widesupport and uptake to be viable. NRM Act and regulations do allow, vendor declaration process tobe established, but as yet no viable process has been developed.Examples of vendor declaration forms be sourced from http://www.farmbiosecurity.com.au/The system can be applied to almost any product or service including hay/ fodder, livestock, seed,soil, mulch, and machinery.
5.7 EDUCATIONThe development and distribution of educational and awareness material is crucial to help allaspects of society understanding why biosecurity should and does concern them. There is avariety of media and delivery mechanism for material including printed material, displays, face toface communication, radio, television internet. The material should aid in answering question like;What should we be looking for?What have we already got and where is it?I’ve found something, who do I report it to?

SOUTH EAST PEST MANAGEMENT PLAN – PART 2
34
APPENDIX 1
1. Spatial Representation of Biosecurity PathwaysIn order to spatially describe and analyse biosecurity pathways in the South East, a number ofpotential high risk vectors and land uses were represented in a geographic information system(GIS) by readily available spatial layers. Seven spatial layers were derived, and their details andintermediate analysis are described in Table 1.
Table 1 – Spatial layers representing biosecurity pathways used in GIS analysis.
LAYER DESCRIPTION SOURCE ANALYSIS
Point Features (Transport / Recreation)
1. se_point_features_merge Point featuresrepresenting boatramps and anintermodal transport sitein Bordertown (rail/roadtransfer)
Boat ramps extractedfrom 1:50,000topographic data(TOPIS 50K, 2006,DEH)
Intermodal sites (2009)from DTEI
Point feature bufferedby 20 metres
Line Features (Transport / Utilities)
2. se_rd_centrelines Road centrelines data Extracted from 1:50,000data (current, DEH)
Buffered by 20 metres
3. se_rd_gazetted Gazetted routes forrestricted accessvehicles; BDouble,Higher Mass Limits(Single Semi Trailer),and Road Trains
Extracted from DTEIdata (2009)
Buffered by 20 metres
There is spatial overlapbetween road centrelinefeatures and gazettedroad train features
4. se_railways_50k Extracted from 1:50,000topographic data(TOPIS 50K, 2006,DEH)
Buffered by 20 metres

SOUTH EAST PEST MANAGEMENT PLAN – PART 2
35
5. se_powerlines_250k Major powerlines Extracted from1:250,000 topographicdata (TOPO 250K,2003, GeoScienceAustralia)
Buffered by 10 metres
6. se_drains_enrims Drains in the South East e-NRIMS (DWLBC) Buffered by 20 metres
Polygon Features (Landuse)
7. se_poly_features_merge Polygon featuresrepresenting high risklanduses (see Table 3),marinas, and built-upareas
Landuse parcelsextracted from DCDB(2008, DEH)
Built-up areas andmarinas extracted from1:50,000 topographicdata (TOPIS 50K, 2006,DEH)
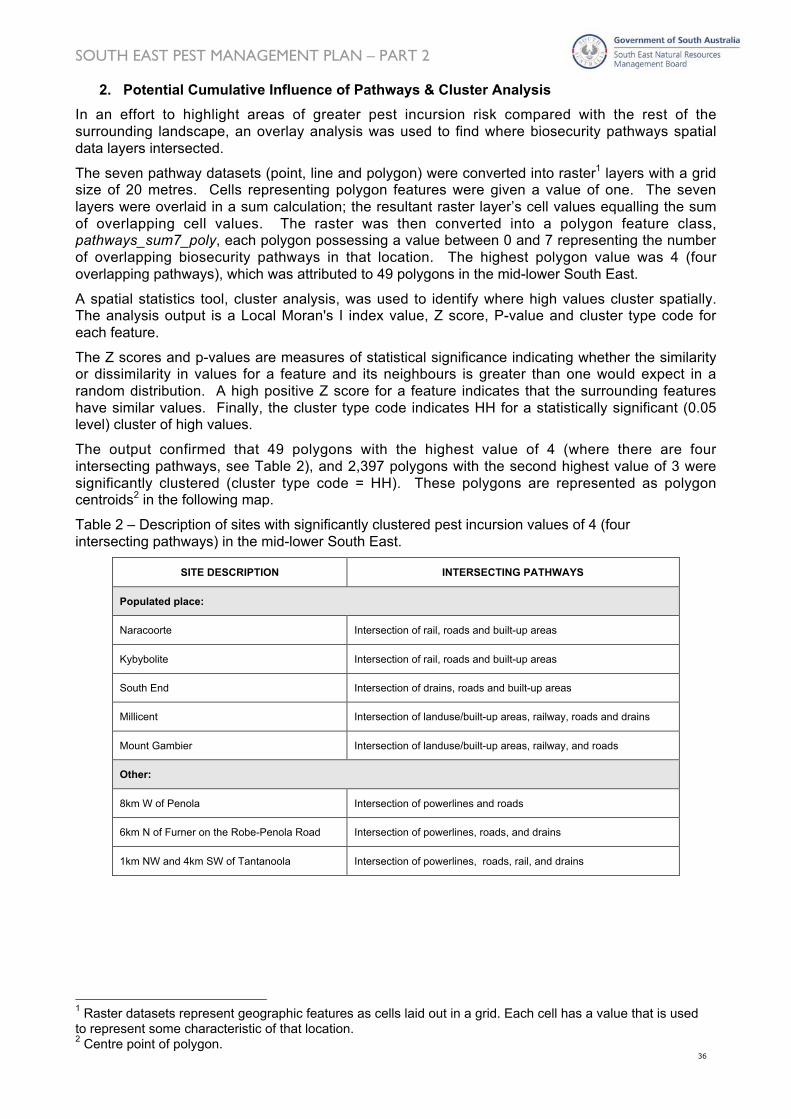
SOUTH EAST PEST MANAGEMENT PLAN – PART 2
36
2. Potential Cumulative Influence of Pathways & Cluster AnalysisIn an effort to highlight areas of greater pest incursion risk compared with the rest of thesurrounding landscape, an overlay analysis was used to find where biosecurity pathways spatialdata layers intersected.
The seven pathway datasets (point, line and polygon) were converted into raster1 layers with a gridsize of 20 metres. Cells representing polygon features were given a value of one. The sevenlayers were overlaid in a sum calculation; the resultant raster layer’s cell values equalling the sumof overlapping cell values. The raster was then converted into a polygon feature class,pathways_sum7_poly, each polygon possessing a value between 0 and 7 representing the numberof overlapping biosecurity pathways in that location. The highest polygon value was 4 (fouroverlapping pathways), which was attributed to 49 polygons in the mid-lower South East.
A spatial statistics tool, cluster analysis, was used to identify where high values cluster spatially.The analysis output is a Local Moran's I index value, Z score, P-value and cluster type code foreach feature.
The Z scores and p-values are measures of statistical significance indicating whether the similarityor dissimilarity in values for a feature and its neighbours is greater than one would expect in arandom distribution. A high positive Z score for a feature indicates that the surrounding featureshave similar values. Finally, the cluster type code indicates HH for a statistically significant (0.05level) cluster of high values.
The output confirmed that 49 polygons with the highest value of 4 (where there are fourintersecting pathways, see Table 2), and 2,397 polygons with the second highest value of 3 weresignificantly clustered (cluster type code = HH). These polygons are represented as polygoncentroids2 in the following map.
Table 2 – Description of sites with significantly clustered pest incursion values of 4 (fourintersecting pathways) in the mid-lower South East.
SITE DESCRIPTION INTERSECTING PATHWAYS
Populated place:
Naracoorte Intersection of rail, roads and built-up areas
Kybybolite Intersection of rail, roads and built-up areas
South End Intersection of drains, roads and built-up areas
Millicent Intersection of landuse/built-up areas, railway, roads and drains
Mount Gambier Intersection of landuse/built-up areas, railway, and roads
Other:
8km W of Penola Intersection of powerlines and roads
6km N of Furner on the Robe-Penola Road Intersection of powerlines, roads, and drains
1km NW and 4km SW of Tantanoola Intersection of powerlines, roads, rail, and drains
1 Raster datasets represent geographic features as cells laid out in a grid. Each cell has a value that is usedto represent some characteristic of that location.2 Centre point of polygon.
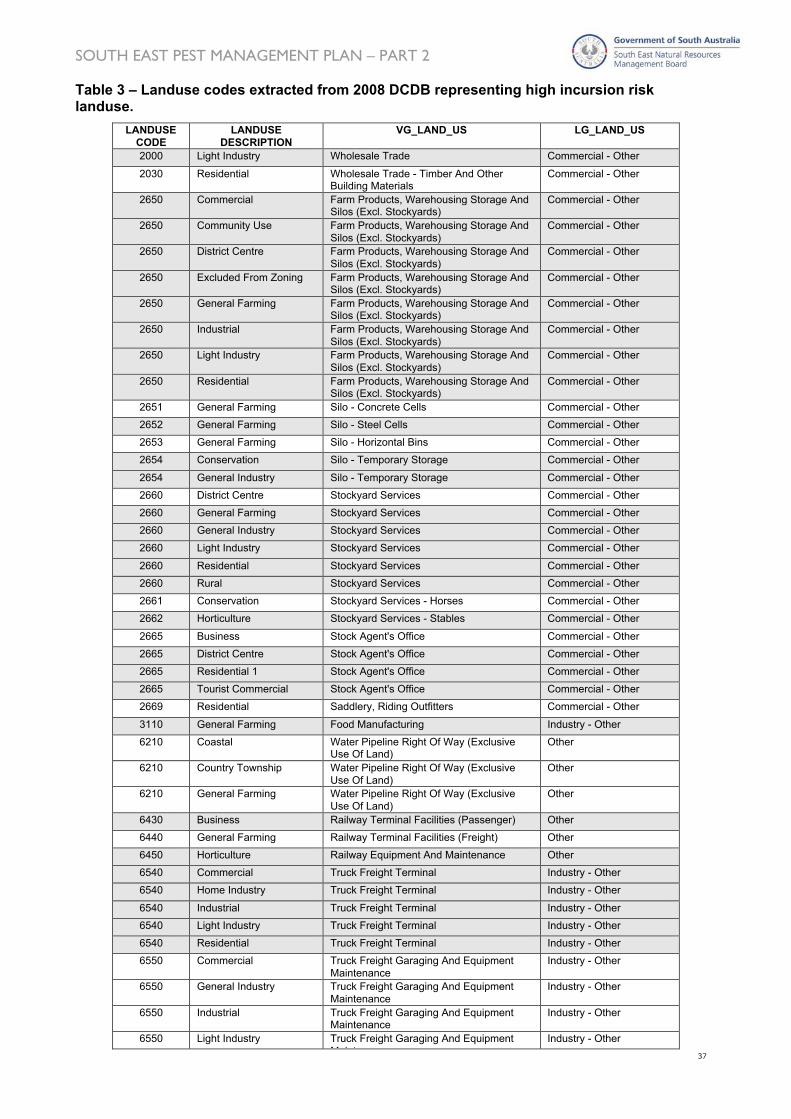
SOUTH EAST PEST MANAGEMENT PLAN – PART 2
37
Table 3 – Landuse codes extracted from 2008 DCDB representing high incursion risklanduse.
LANDUSECODE
LANDUSEDESCRIPTION
VG_LAND_US LG_LAND_US
2000 Light Industry Wholesale Trade Commercial - Other
2030 Residential Wholesale Trade - Timber And OtherBuilding Materials
Commercial - Other
2650 Commercial Farm Products, Warehousing Storage AndSilos (Excl. Stockyards)
Commercial - Other
2650 Community Use Farm Products, Warehousing Storage AndSilos (Excl. Stockyards)
Commercial - Other
2650 District Centre Farm Products, Warehousing Storage AndSilos (Excl. Stockyards)
Commercial - Other
2650 Excluded From Zoning Farm Products, Warehousing Storage AndSilos (Excl. Stockyards)
Commercial - Other
2650 General Farming Farm Products, Warehousing Storage AndSilos (Excl. Stockyards)
Commercial - Other
2650 Industrial Farm Products, Warehousing Storage AndSilos (Excl. Stockyards)
Commercial - Other
2650 Light Industry Farm Products, Warehousing Storage AndSilos (Excl. Stockyards)
Commercial - Other
2650 Residential Farm Products, Warehousing Storage AndSilos (Excl. Stockyards)
Commercial - Other
2651 General Farming Silo - Concrete Cells Commercial - Other
2652 General Farming Silo - Steel Cells Commercial - Other
2653 General Farming Silo - Horizontal Bins Commercial - Other
2654 Conservation Silo - Temporary Storage Commercial - Other
2654 General Industry Silo - Temporary Storage Commercial - Other
2660 District Centre Stockyard Services Commercial - Other
2660 General Farming Stockyard Services Commercial - Other
2660 General Industry Stockyard Services Commercial - Other
2660 Light Industry Stockyard Services Commercial - Other
2660 Residential Stockyard Services Commercial - Other
2660 Rural Stockyard Services Commercial - Other
2661 Conservation Stockyard Services - Horses Commercial - Other
2662 Horticulture Stockyard Services - Stables Commercial - Other
2665 Business Stock Agent's Office Commercial - Other
2665 District Centre Stock Agent's Office Commercial - Other
2665 Residential 1 Stock Agent's Office Commercial - Other
2665 Tourist Commercial Stock Agent's Office Commercial - Other
2669 Residential Saddlery, Riding Outfitters Commercial - Other
3110 General Farming Food Manufacturing Industry - Other
6210 Coastal Water Pipeline Right Of Way (ExclusiveUse Of Land)
Other
6210 Country Township Water Pipeline Right Of Way (ExclusiveUse Of Land)
Other
6210 General Farming Water Pipeline Right Of Way (ExclusiveUse Of Land)
Other
6430 Business Railway Terminal Facilities (Passenger) Other
6440 General Farming Railway Terminal Facilities (Freight) Other
6450 Horticulture Railway Equipment And Maintenance Other
6540 Commercial Truck Freight Terminal Industry - Other
6540 Home Industry Truck Freight Terminal Industry - Other
6540 Industrial Truck Freight Terminal Industry - Other
6540 Light Industry Truck Freight Terminal Industry - Other
6540 Residential Truck Freight Terminal Industry - Other
6550 Commercial Truck Freight Garaging And EquipmentMaintenance
Industry - Other
6550 General Industry Truck Freight Garaging And EquipmentMaintenance
Industry - Other
6550 Industrial Truck Freight Garaging And EquipmentMaintenance
Industry - Other
6550 Light Industry Truck Freight Garaging And EquipmentMaintenance
Industry - Other

SOUTH EAST PEST MANAGEMENT PLAN – PART 2
38
Maintenance
6550 Residential Truck Freight Garaging And EquipmentMaintenance
Industry - Other
6550 Tourist Commercial Truck Freight Garaging And EquipmentMaintenance
Industry - Other
6560 Commercial Removal, Haulage, Carting And Carrying Industry - Other
6560 Residential Removal, Haulage, Carting And Carrying Industry - Other
6610 Coastal Airport Industry - Other
6610 Community Use Airport Industry - Other
6610 Country Township Airport Industry - Other
6610 District Centre Airport Industry - Other
6610 General Farming Airport Industry - Other
6660 Residential Wharves (Including Storage) Industry - Other
6660 Rural Wharves (Including Storage) Industry - Other
6662 Residential Boat Ramp Industry - Other
7510 Coastal Camping And/Or Caravaning Commercial - Other
7510 Commercial Camping And/Or Caravaning Commercial - Other
7510 Community Use Camping And/Or Caravaning Commercial - Other
7510 Conservation Camping And/Or Caravaning Commercial - Other
7510 Country Living Camping And/Or Caravaning Commercial - Other
7510 Country Township Camping And/Or Caravaning Commercial - Other
7510 General Farming Camping And/Or Caravaning Commercial - Other
7510 Horticulture Camping And/Or Caravaning Commercial - Other
7510 Landscape Camping And/Or Caravaning Commercial - Other
7510 Residential Camping And/Or Caravaning Commercial - Other
7510 Tourist Commercial Camping And/Or Caravaning Commercial - Other
8100 Horticulture Metals Industry - Other
8114 General Farming Base Metals - Abandoned Workings Industry - Other
8230 General Farming Dimension Stone Industry - Other
8230 Horticulture Dimension Stone Industry - Other
8232 General Farming Dimension Stone - Open Workings Industry - Other
8232 Horticulture Dimension Stone - Open Workings Industry - Other
8240 General Farming Crushed Stone Industry - Other
8240 Residential Crushed Stone Industry - Other
8242 General Farming Crushed Stone - Open Workings Industry - Other
8242 Horticulture Crushed Stone - Open Workings Industry - Other
8242 Rural Crushed Stone - Open Workings Industry - Other
8250 Coastal Sand And Gravel Industry - Other
8250 Commercial Sand And Gravel Industry - Other
8250 General Farming Sand And Gravel Industry - Other
8250 Residential Sand And Gravel Industry - Other
8252 Country Township Sand And Gravel - Open Workings Industry - Other
8252 Residential Sand And Gravel - Open Workings Industry - Other
8252 Rural Sand And Gravel - Open Workings Industry - Other
8259 Industrial Sand And Gravel - Secondary Industry IsPrimary Production And Is Viable In ItselfOr With Other Landowned And Used ByThe Same Owner
Industry - Other
8292 Coastal Non-Metals N.E.C. - Open Workings Industry - Other
8320 Country Township Gas Industry - Other
9930 Coastal Nursery (Plants) Primary Production
9930 Commercial Nursery (Plants) Primary Production
9930 General Industry Nursery (Plants) Primary Production
9930 Residential Nursery (Plants) Primary Production